Debugging and Profiling PHP Applications Logan Lindquist @llbbl

Debugging and Profiling PHP Applications
May 18, 2015
Debugging and profiling with xdebug. Learn how to setup xdebug on Ubuntu and OSX. We will also be covering how to get it working with our favorite editor, PHPStorm. A couple different profiling tools will be demonstrated.
Welcome message from author
This document is posted to help you gain knowledge. Please leave a comment to let me know what you think about it! Share it to your friends and learn new things together.
Transcript
Debugging and Profiling PHP ApplicationsLogan Lindquist @llbbl

Debugging vs Profiling
Debugging
Bug fixing
Used during Development to minimize bugs
Profiling
Performance tuning
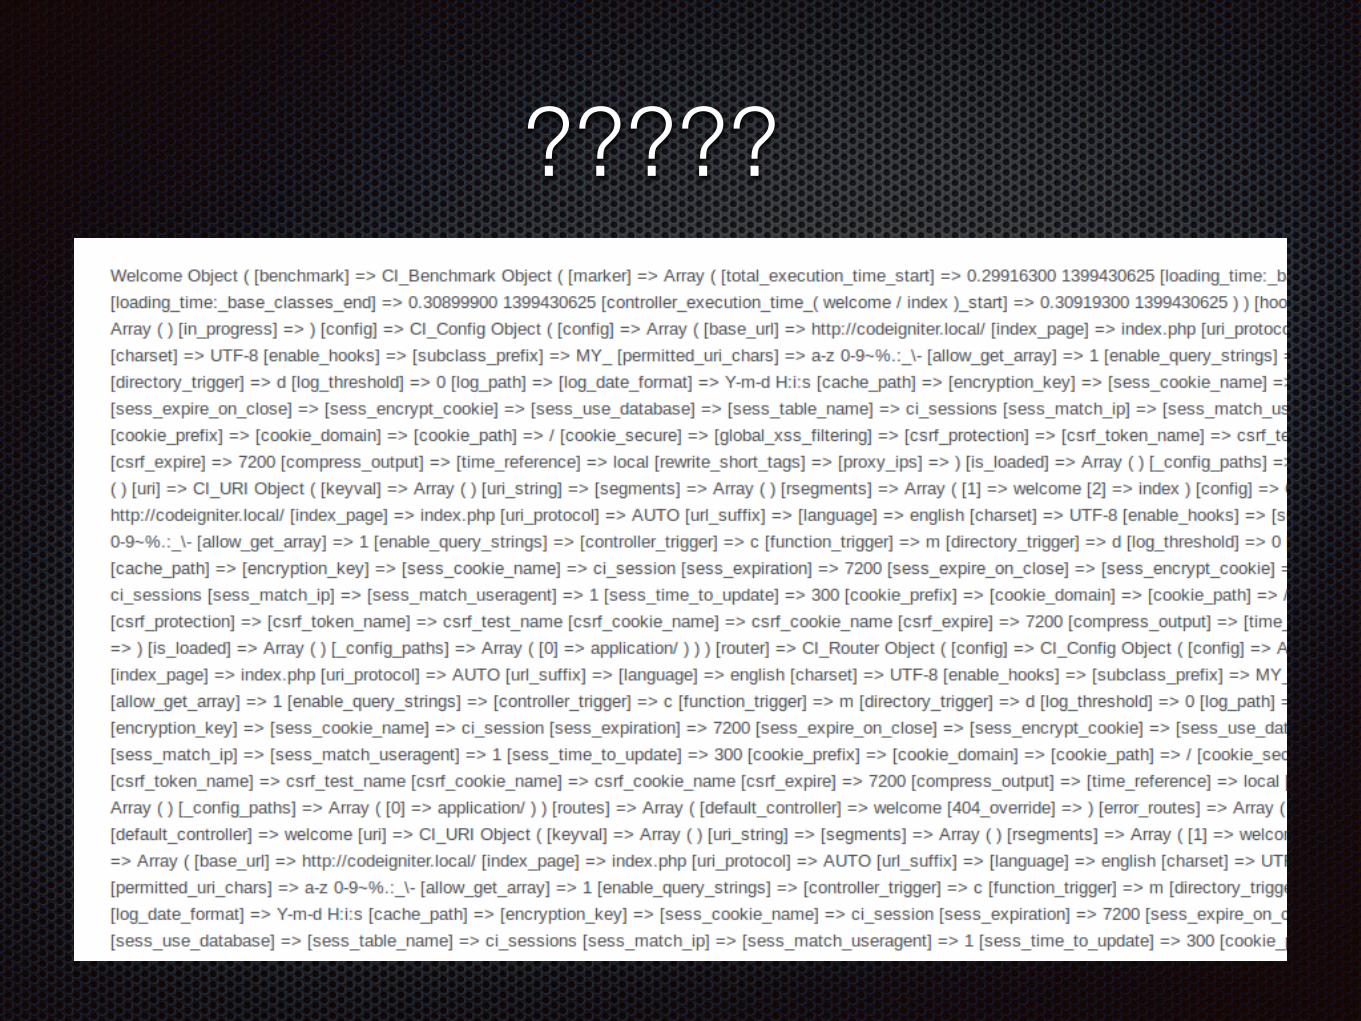
?????

What Is This Magic?!?

Xdebug is AWESOME
Pretty var_dumps
EnhancedStack Trace
Debugging
Profiling

OMGWTFBBQ Install it NOWOSX:
Install homebrew
Follow instructions: https://github.com/Homebrew/homebrew-php#installation
brew install php54-xdebug
Ubuntu:
sudo apt-get install php5 libapache2-mod-php5 php5-mcrypt php5-xdebug
ruby -e "$(curl -fsSL https://raw.github.com/Homebrew/homebrew/go/install)"
Windows: Install Vagrant then follow Ubuntu

Configure Xdebug for DebuggingTurn on remote debugging:
xdebug.remote_enable=1
Configure what port, host, log file ... and more
xdebug.remote_port= 9000
xdebug.remote_log="/var/www/xdebug.log"
xdebug.remote_host="localhost"

Xdebug Profiling
xdebug.profiler_enable = 1
xdebug.profiler_enable_trigger = 1
xdebug.profiler_output_dir = "/var/www/xdebug"
xdebug.profiler_output_name = xdebug.out.%t

Make sure you have the right PHPSettings > PHP > Intrepreters
....you should see xdebug

Here is how to check symlinked or not
Tools > Deployment > Configuration
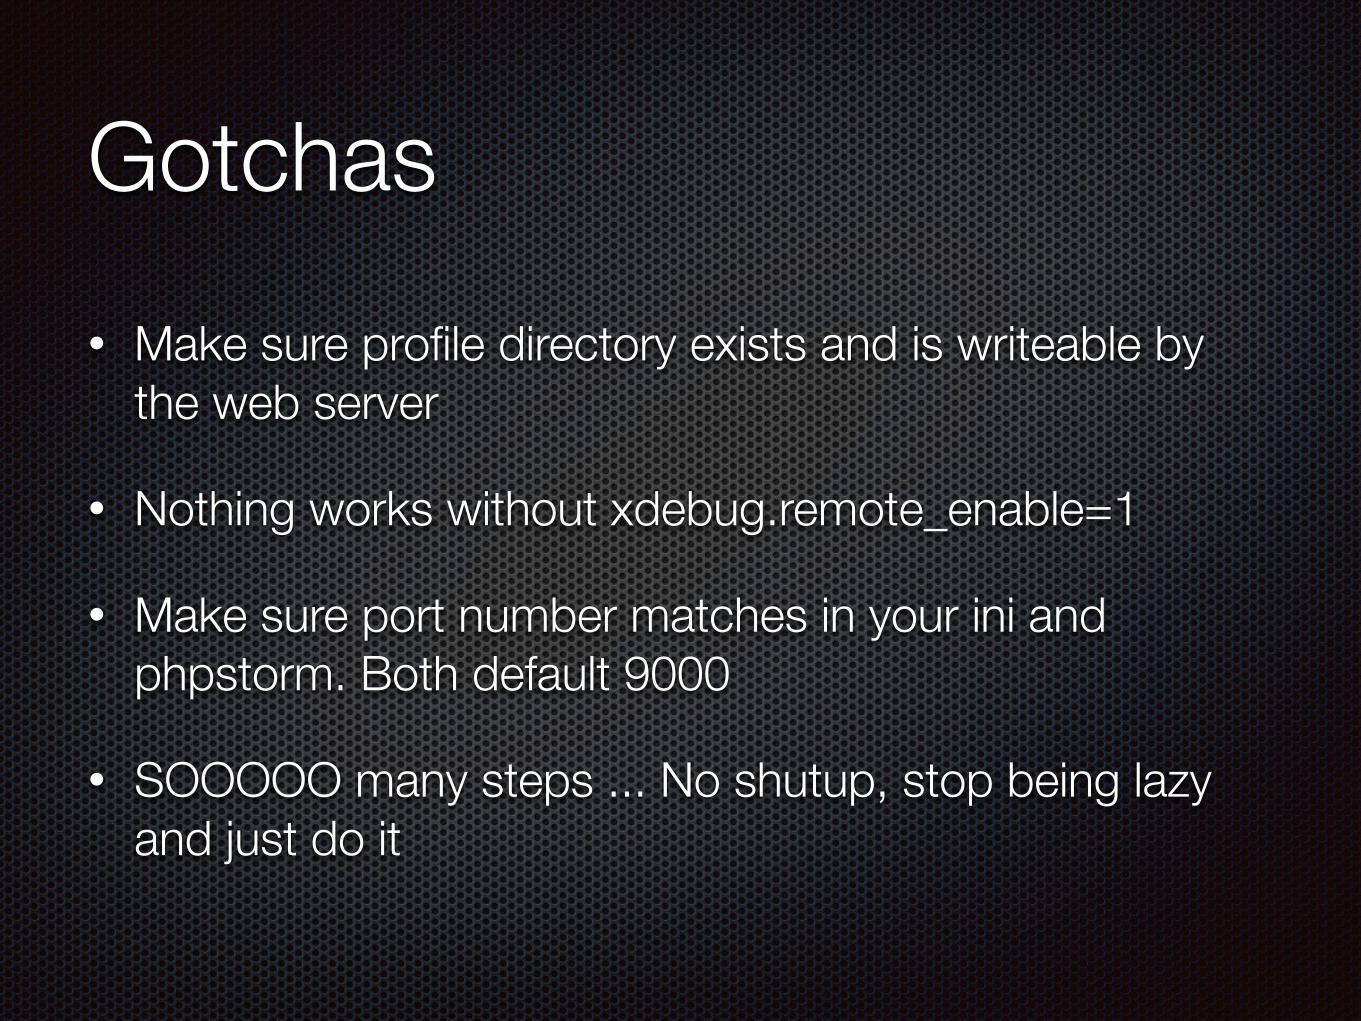
Gotchas• Make sure profile directory exists and is writeable by
the web server
• Nothing works without xdebug.remote_enable=1
• Make sure port number matches in your ini and phpstorm. Both default 9000
• SOOOOO many steps ... No shutup, stop being lazy and just do it
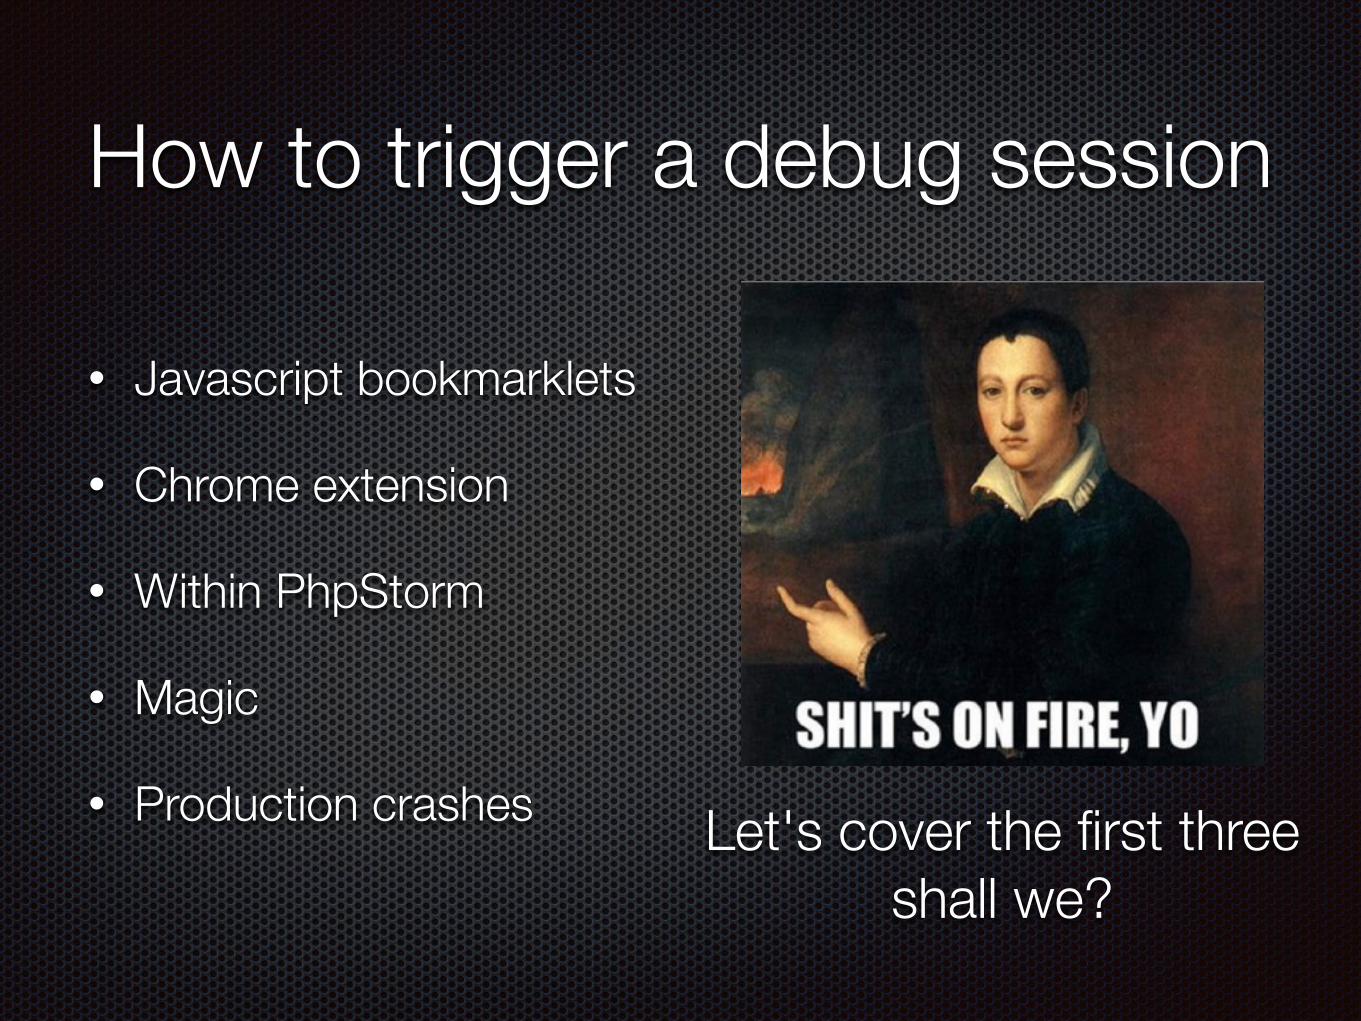
How to trigger a debug session
• Javascript bookmarklets
• Chrome extension
• Within PhpStorm
• Magic
• Production crashes Let's cover the first three shall we?

Jetbrains Has The Goodies
http://www.jetbrains.com/phpstorm/marklets/
• Start Debugger:
• Goto page
• Hit Start Debugger
• Hit Stop Debugger when done debugging
• Debug this page:
• Goto page
• Hit Debug this page

Chrome ExtensionName: Xdebug Helper
https://chrome.google.com/webstore/detail/xdebug-helper/eadndfjplgieldjbigjakmdgkmoaaaoc?hl=en
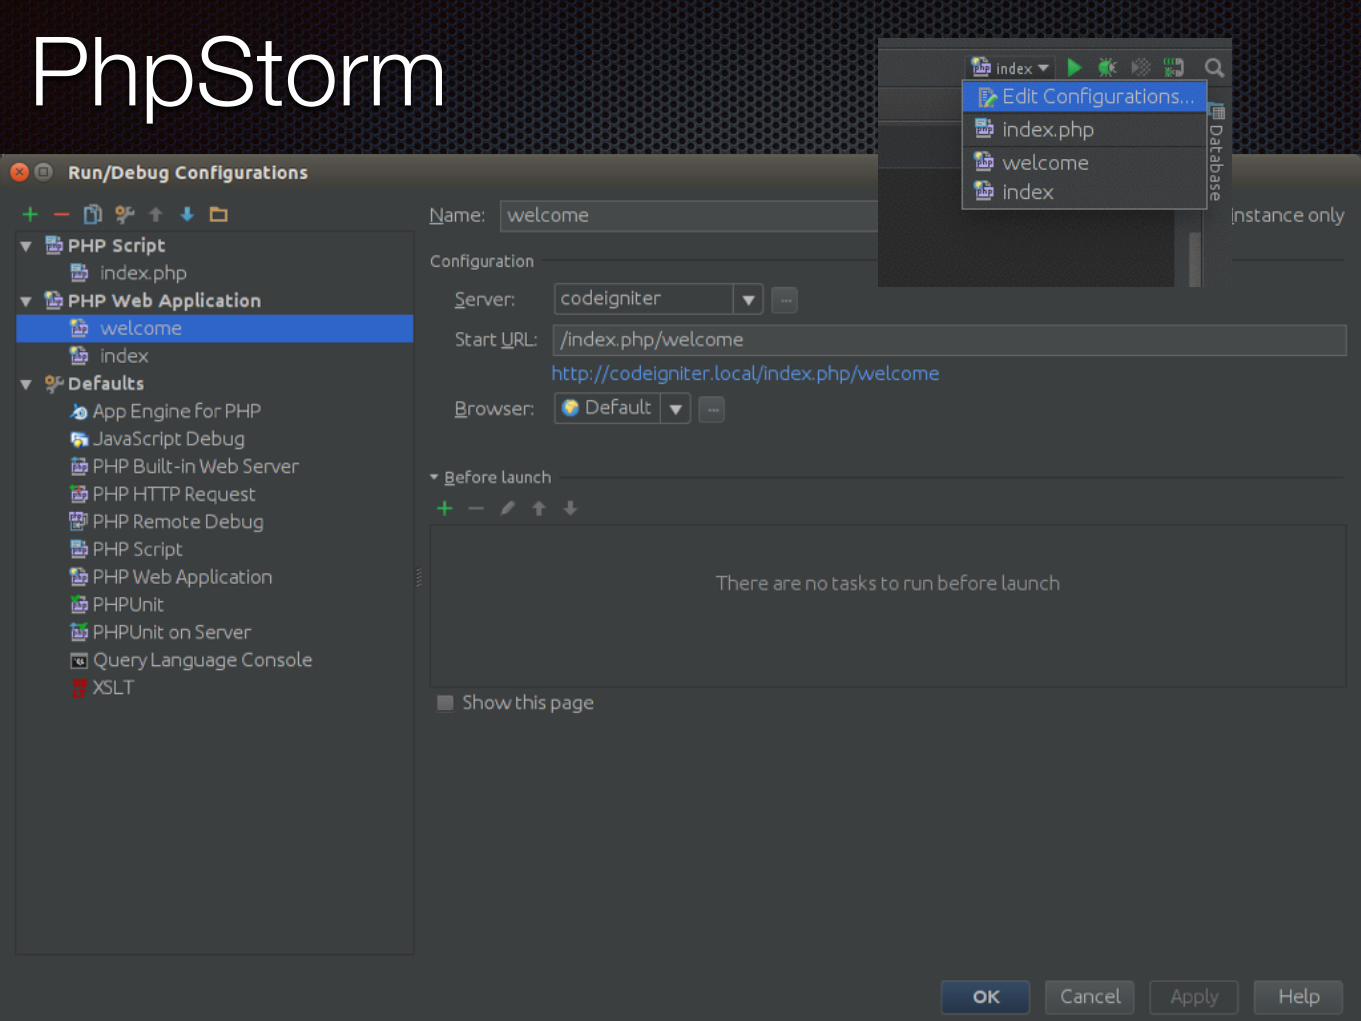
PhpStorm

PhpStorm + Xdebug
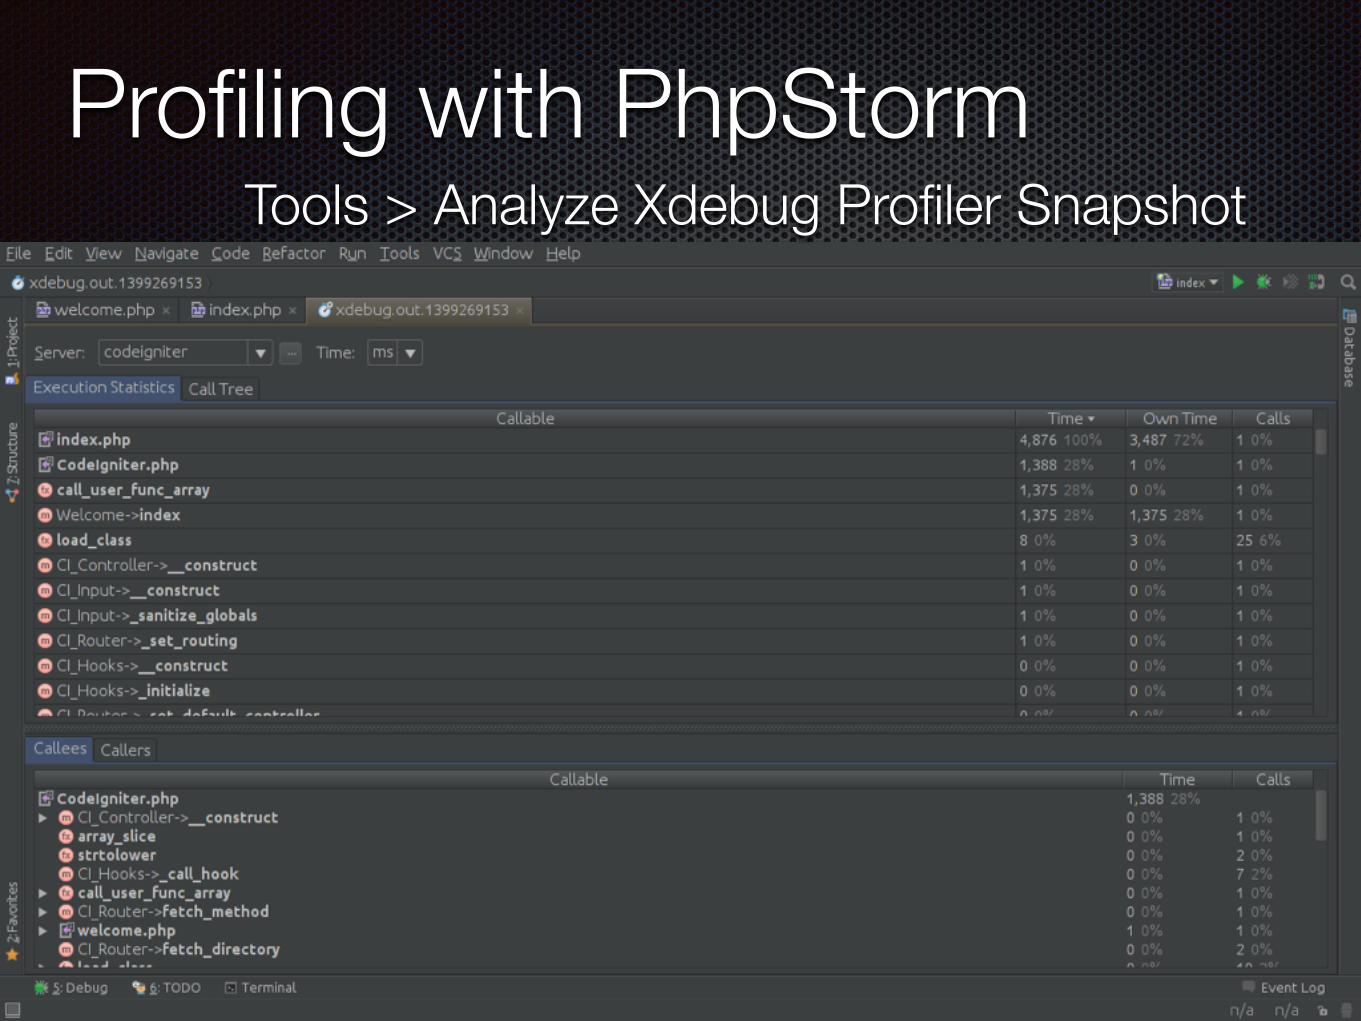
Profiling with PhpStormTools > Analyze Xdebug Profiler Snapshot
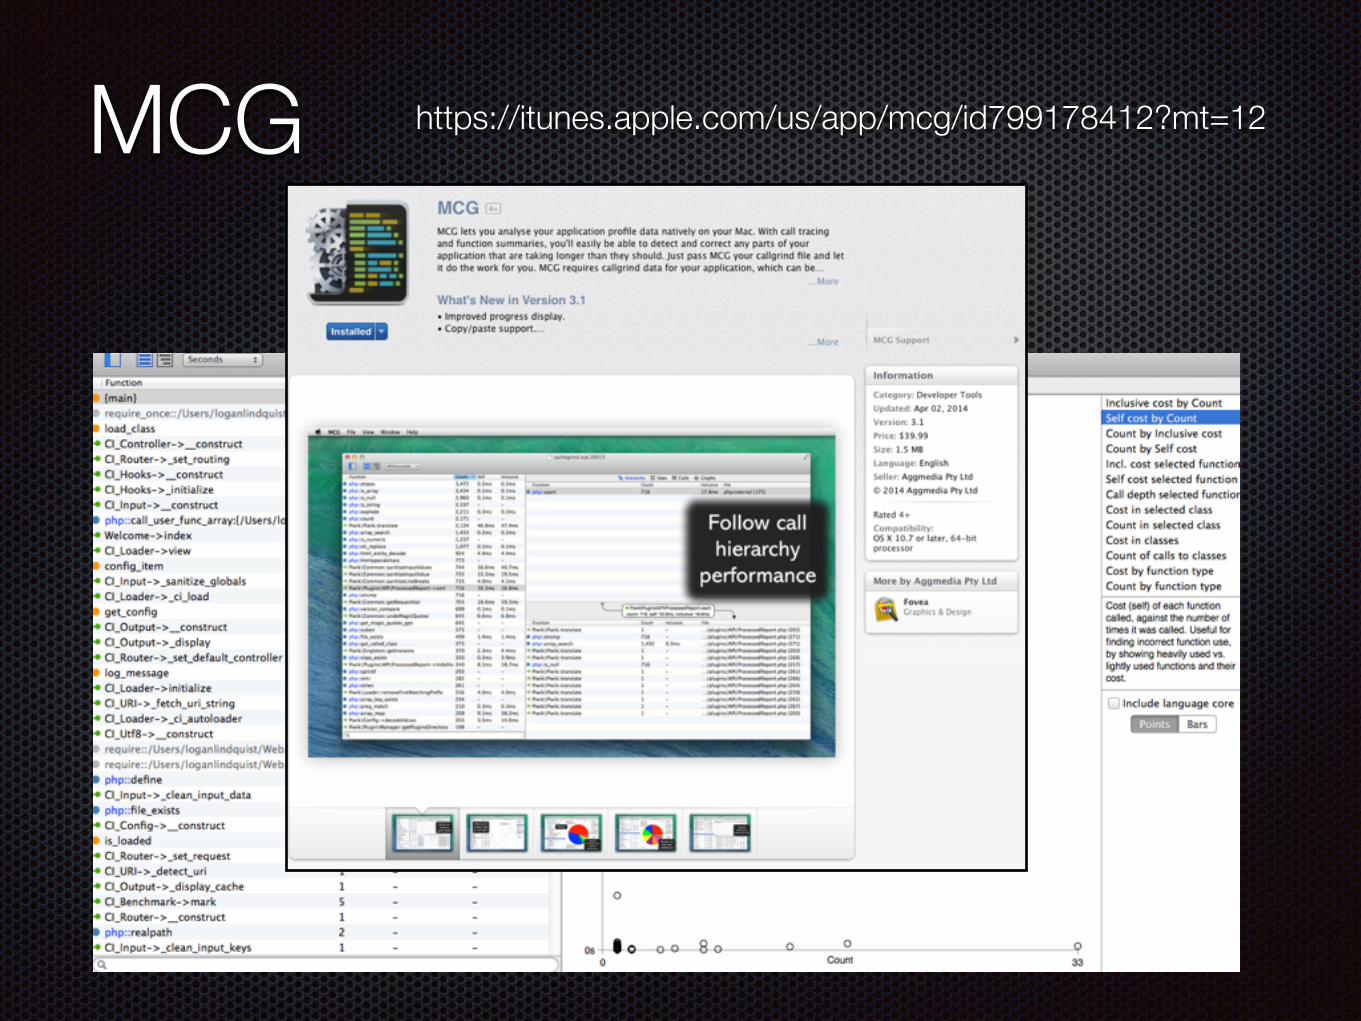
MCG https://itunes.apple.com/us/app/mcg/id799178412?mt=12

Profiling with MCG

XHProf

XHProf

XHProf• Built by Facebook opensourced in 2009
• Xdebug not required
• Way more complicated to setup
• Documentation isn't great
• Requires you to add xhprof methods to your code
• Requires you to configure apache vhost for reporting
• Has callgraph charts (directed graphs) and a couple other nice features
Install isn't too bad with homebrew or apt-get

In Review...
• Installed Xdebug
• Setup Xdebug with PhpStorm
• Configured Xdebug for profiling or debugging
Related Documents


