2 2 0 0 1 1 1 1 - - 1 1 2 2 F F i i s s c c a a l l P P o o l l i i c c y y S S t t a a t t e e m m e e n n t t D D e e b b t t P P o o l l i i c c y y C C o o o o r r d d i i n n a a t t i i o o n n O Of f f f i i c c e e M Mi i n n i i s s t t r r y y o o f f F F i i n n a a n n c c e e

Welcome message from author
This document is posted to help you gain knowledge. Please leave a comment to let me know what you think about it! Share it to your friends and learn new things together.
Transcript

2200
1111
-- 1122
FF iiss cc
aa ll
PPoo ll
ii ccyy
SS tt
aa ttee mm
ee nntt
DDeebbtt PPoolliiccyy CCoooorrddiinnaattiioonn OOffffiiccee MMiinniissttrryy ooff FFiinnaannccee

FFIISSCCAALL PPOOLLIICCYY SSTTAATTEEMMEENNTT
22001111--1122
DDeebbtt PPoolliiccyy CCoooorrddiinnaattiioonn OOffffiiccee MMiinniissttrryy ooff FFiinnaannccee

This page is left intentionally blank.

Page i
Table of Contents
Table of Contents ........................................................................................................................................... i
Acknowledgements ....................................................................................................................................... ii
List of Acronyms ........................................................................................................................................... iii
Lists of Tables and Figures ........................................................................................................................... iv
I. Introduction .................................................................................................................................. 1
II. Fiscal Policy Statement ................................................................................................................. 3
III. Historical Perspective on Fiscal Developments ............................................................................ 4
IV. Recent Fiscal Policy Developments ............................................................................................... 7
V. Fiscal Performance 2010‐11 ........................................................................................................ 10
V.i. Revenue .................................................................................................................................. 10
V.ii. Expenditure ............................................................................................................................. 16
V.iii. Fiscal Deficit ............................................................................................................................ 21
V.iv. Financing of Fiscal Deficit ........................................................................................................ 21
V.v. Revenue Deficit ....................................................................................................................... 22
V.vi. Primary Deficit ........................................................................................................................ 23
VI. Fiscal Performance July‐September 2011‐12 ............................................................................. 23
VI.i. Tax Revenue ............................................................................................................................ 25
VI.ii. Non Tax Revenue .................................................................................................................... 25
VI.iii. Expenditure ......................................................................................................................... 26
VI.iv. Fiscal, Revenue and Primary Deficit .................................................................................... 26
VI.v. Financing of Fiscal Deficit ........................................................................................................ 27
VII. Review of Public Debt ................................................................................................................. 27
VIII. Servicing of Public Debt .............................................................................................................. 30
IX. Economic Reforms ...................................................................................................................... 31
X. Report on Compliance with FRDL Act 2005 ................................................................................ 32
XI. Concluding Remarks .................................................................................................................... 34

Page ii
Acknowledgements
This Policy Statement has been prepared to fulfill the requirement laid out under Section 6 of the Fiscal
Responsibility and Debt Limitation Act 2005. I would like to acknowledge the input of various Ministries,
Departments, Divisions and Agencies, particularly, timely data provision by Budget Wing (MoF),
Corporate Finance Wing (MoF), Economic Reform Unit (MoF), MTBF Secretariat (MoF) and the Federal
Board of Revenue. I would like to recognize the effort put in by Sajjad Ahmad Sheikh, Joint Secretary
(DPCO), Muhammad Ikram, Deputy Economic Adviser (DPCO) and Farwa Basit Hafiza, Research
Associate (DPCO) in the realization of this comprehensive document.
Masroor Ahmed Qureshi Director General Debt Policy Coordination Office Ministry of Finance

Page iii
List of Acronyms
AJ&K Azad Jammu & Kashmir
BODs Board of Directors
BoP Balance of Payments
BSP Budget Strategy Paper
CCOR Cabinet Committee on Restructuring
CDNS Central Directorate of National Savings
CFAO Chief Finance & Accounting Officer
CSF Coalition Support Fund
CVT Capital Value Tax
DISCOs Distribution Companies
DPCO Debt Policy Coordination Office
ENDA Emergency Natural Disaster Assistance
FATA Federally Administered Tribal Areas
FBR Federal Board of Revenue
FED Federal Excise Duties
FELs Foreign Exchange Liabilities
FPS Fiscal Policy Statement
FRDL Act Fiscal Responsibility and Debt Limitation Act
FY Fiscal Year
GDP Gross Domestic Product
GoP Government of Pakistan
GST General Sales Tax
IDPs Internally Displaced Persons
IMF International Monetary Fund
IRS Inland Revenue Service
KESC Karachi Electric Supply Company
MTBF Medium‐Term Budget Framework
NEPRA National Electric Power Regulatory Authority
NFC Nation Finance Commission
NTDC National Transmission & Despatch Company
OGDCL Oil & Gas Development Company Ltd.
PEPCO Pakistan Electric Power Company
PSDP Public Sector Development Programme
PSEs Public Sector Enterprises
PSO Pakistan State Oil
PTA Pakistan Telecommunication Authority
PTCL Pakistan Telecommunication Company Ltd.
RGST Reformed General Sales Tax
SBA Stand by Agreement
SBP State Bank of Pakistan
SDR Special Drawing Rights
SED Special Excise Duty
TPD Total Public Debt
VAT Value‐Added Tax
WAPDA Water and Power Development Authority
WHT Withholding Taxes

Page iv
Lists of Tables and Figures
Table 1: Fiscal Performance, 1991‐2011 (in percent of GDP) Table 2: Consolidated Revenue & Expenditure of the Government (Rs. Billion) Table 3: Real Growth of Tax Revenue Table 4: Selected Fiscal Indicators (in percent) Table 5: Fiscal Indicators as Percent of GDP Table 6: FBR Tax Collection (Rs. Billion) Table 7: Head‐wise Performance of Direct Taxes (Rs. Billion) Table 8: Withholding Tax Collection (Rs. Billion) Table 9: Collection and Growth of Sales Tax: Fiscal Year 2010‐11 (Rs. Billion) Table 10: Comparison of Sales Tax Domestic (Net) Collection by Major Commodity (Rs. Billion) Table 11: Collection of Sales Tax (Import) ‐ Major Items (Rs. Billion) Table 12: Collection of Customs Duties during 2010‐11 (Rs. Billion) Table 13: FED Collection from Major Commodities (Rs. Billion) Table 14: Consolidated Budgetary Position of the Government (Rs. Billion) Table 15: Consolidated Expenditure, 2010‐11 (Rs. Billion) Table 16: Subsidies, 2010‐11 (Rs. Billion) Table 17: Social Spending, 2010‐11 (Rs. Billion) Table 18: Consolidated Government Budget, July‐Sept 2011 (Rs. Billion) Table 19: FBR Tax Collection, July‐September 2011 (Rs. Billion) Table 20: Non‐Tax Revenue, July‐Sept 2011 (Rs. Billion) Table 21: Public Debt, FY07‐FY12 Table 22: Public Debt Servicing, 2010‐11
Figure 1: Fiscal Deficit (as percentage of GDP), 1992‐2011 Figure 2: Fuel Prices and Power Sector Subsidies Figure 3: Expenditures and Revenues as % of GDP Figure 4: Trends in Fiscal Indicators Figure 5: Trend in Real Revenue Collection vs. Real GDP Growth Figure 6: Trends in Direct Taxes Figure 7: Trends in Revenue and Primary Balances Figure 8: Trends in Debt Servicing

Page 1
I. Introduction
A confluence of unfavorable factors including anemic GDP growth, devastating floods, severe energy
shortages, hemorrhaging PSEs, high inflation, weak security situation and global economic recession
kept the environment very difficult for fiscal policy in 2010‐11. Being structural in nature, most of these
factors have not yielded any traction and hence the task of fiscal policy remains challenging in 2011‐12
and beyond unless structural reforms are implemented quickly and effectively.
Fiscal policy is interrelated with other macroeconomic variables including growth, investment, inflation,
monetary policy and external account. Although achieving higher fiscal consolidation remains a key
element of government’s strategy for maintaining macroeconomic stability, a prerequisite for
sustainable growth, the actual fiscal performance of past two years has shown deviation from original
targets. While one may question the wisdom of targeting higher fiscal consolidation given the country’s
low growth envelope, one needs to examine the nature of fiscal deficit to determine whether it is
helping higher sustainable growth or working counter to this objective.
After laudable performance in FY2009 wherein fiscal deficit was reduced dramatically to 5.3% from 7.6%
in the preceding year, the gains were quickly reversed as fiscal deficit increased sequentially in FY2010
and FY2011. Actual consolidated fiscal deficit for FY2011 came in at 6.6% of GDP, far higher than the
original budgeted target of 4.0% for the year. Although the reported deficit figure included payments
amounting 0.7% of GDP representing cost of energy subsidies relating to previous years, even excluding
it the adjusted fiscal deficit of 5.9% was substantially higher than the original target.
Slippages in both revenues and expenditures led to FY2011 budget deficit missing the target. Gross
revenue collection (tax and non‐tax) was 12.1% lower than the budgeted target while total expenditures
(current and development), adjusted for one off payment of energy subsidies pertaining to previous
years, were 2.4% higher than budgetary estimates. FBR tax collection fell 6.4% short of target while non‐
tax revenues were 23.6% less than target due to non‐realization of expected 3G license receipts and
lower logistical support receipts from the US. On the other hand, expenditure exceeded the target due
to higher subsidies and flood related spending despite PSDP spending being 24% lower than the
budgeted target.
A significant positive masked by overall weak fiscal numbers is the distinct uptrend in FBR tax collection
since 4QFY2011. Helped by withdrawal of GST exemption on several sectors and levy of one‐off flood

Page 2
surcharge, FBR tax collection grew by 28.7% in 4QFY2011. However, the trend has continued into
FY2012 with FBR tax collection increasing by 21% during Jul‐Dec’2011 despite shifting of GST collection
on certain service to the provinces.
Persisting energy crisis is the common denominator adversely impacting key macroeconomic variables
entailing huge social and economic costs in shape of lower GDP growth while being a major drain on
fiscal resources. The chronic inter‐corporate debt engulfing the entire energy chain and growing energy
shortages are dissuading investment not only in the energy sector where it is most needed but in other
industrial sectors as well. Moreover, continuing energy subsidies and ensuing high fiscal deficit are
inhibiting external inflows especially those from multilateral financial institutions. Slippages in
implementing fiscal reforms, particularly implementation of RGST, elimination of electricity subsidies
and resolution of circular debt, was a key reason behind IMF’s standby agreement staying suspended
since June 2010 until it finally lapsed in November 2011.
Power sector subsidies amounted to 1.9% of GDP in FY2011 and it shall be even higher in FY2012 as in
addition to tariff differential subsidies, issuance of T‐bills/PIBs to repay government guaranteed power
sector TFCs shall contribute another 1.5% of GDP to the fiscal deficit. A combination of internal
inefficiencies and pricing anomalies is responsible for the circular debt problem confronting the energy
sector. Some specific factors include: i) tariff anomalies in power and natural gas sectors, ii)
misallocation of natural gas, iii) unfavorable power generation mix, and iv) inefficient operations of
public generation and utility companies. Eliminating these problems is imperative for attracting
investment in energy and other industrial sectors.
Fiscal policy faces a critical trade‐off between short‐term inflation and long‐term economic growth.
Eliminating energy subsidies through tariff rationalization shall spike inflation in the short‐term but that
is an unavoidable cost to attract the investment needed for higher sustainable economic growth.
The present Fiscal Policy Statement is prepared to fulfill the legal requirement of Section 6 of the FRDL
Act 2005. The Act requires that the Fiscal Policy Statement (FPS) shall analyze the performance of key
macroeconomic indicators like total revenue collection, total expenditure, fiscal deficit and total public
debt along with rationales for any major deviation from fiscal policy targets.
Page 3
II. Fiscal Policy Statement
The Fiscal Policy Statement is presented to fulfill the requirement in Section 6 of the Fiscal Responsibility
and Debt Limitation (FRDL) Act 2005. The statement provides an overview of government revenues and
expenditures during the course of the fiscal year and explains the changes in key macroeconomic
indicators during 2009‐10. Section 6 of the FRDL Act 2005 requires that:
1) The Federal Government shall cause to be laid before the National Assembly the Fiscal Policy
Statement by the end of January each year.
2) The Fiscal Policy Statement shall, inter alia, analyze the following key macroeconomic indicators,
namely:‐
a) Total expenditures;
b) Total revenues;
c) Total fiscal deficit;
d) Revenue deficit; and
e) Total public debt
3) The Federal Government shall explain how fiscal indicators accord with the principles of sound
fiscal and debt management.
4) The Fiscal Policy Statement shall also contain:‐
a) The key measures and rationale for any major deviation in fiscal measures pertaining to
taxation, subsidy, expenditure, administrated pricing and borrowing;
b) An update on key information regarding macroeconomic indicators;
c) The strategic priorities of the Federal Government for the financial year in the fiscal
area;
d) The analysis to the fullest extent possible of all policy decisions made by the Federal
Government and all other circumstances that may have a material effect on meeting the
targets for economic indicators for that fiscal year as specified in the Medium‐Term
Budgetary Statement; and
e) An evaluation as to how the current policies of the Federal Government are in
conformity with the principle of sound fiscal and debt management and the targets set
forth in the Medium‐Term Budgetary Statement.

Page 4
III. Historical Perspective on Fiscal Developments
Pakistan has had its share of good and bad periods over the last two decades with regards to its fiscal
discipline. In order to have a more meaningful comparison between different periods over the last two
decades, we represent fiscal numbers as percentage of GDP.
Table‐1: Fiscal Performance, 1991‐2011 (in percent of GDP) Period 1 Period 2 Period 3 Period 4 Period 5 Improve Stability V. improve Poor Consolidation 5 years 3 years 6 years 4 years 3 years 1991‐1995 1996‐1998 1999 ‐ 2004 2005 ‐ 2008 2010‐2011 TOTAL REVENUES 15.6% 14.0% 13.9% 14.6% 13.7% Tax Revenues 11.8% 11.6% 10.9% 10.6% 9.7% Non‐Tax Revenues 3.4% 2.3% 3.0% 3.8% 4.0% TOTAL EXPENDITURE 21.6% 19.9% 18.1% 20.5% 19.7% Current Expenditure 16.7% 16.5% 15.5% 16.0% 16.3% Defense 5.3% 4.5% 3.4% 3.0% 2.5% Debt Servicing 4.8% 5.8% 5.5% 4.1% 4.4% Current Subsidies 0.5% 0.4% 0.8% 2.0% 1.8% General Administration 1.4% 1.8% 2.2% 2.7% 3.0% Development Expenditure 4.8% 3.3% 2.6% 4.5% 3.5% FISCAL DEFICIT ‐6.0% ‐5.8% ‐4.2% ‐5.1% ‐6.1%
Fiscal deficits have been on a roller coaster ride, with periods of improvement quickly slipping into high
deficits and then reverting back to consolidation phase. During the early 1990’s fiscal imbalance
remained high; however, it started to recover at the end of FY1993. This improvement was again
followed by a period of high fiscal constraints (1996‐1998). Post FY1999, fiscal performance of the
country saw considerable improvement as its fiscal deficit reached to a low of 2.3% of GDP during
FY2004. It was after FY2004 that fiscal slippages once again started to widen. During FY2008, fiscal
deficit saw a mammoth increase as it reached to 7.6% of GDP.
Breaking up the last two decades into five unequal periods will provide a better picture of fiscal
performance. It is safe to say that high subsidies remain a major burden on fiscal account, but it would
be unfair not to point out falling percentage of tax to GDP ratio. As seen in Table‐1, tax revenue as a
percentage of GDP stood at 11.8% during period 1 (1991‐1995), which has now decreased to 9.7%
during period 5 (2009‐2011). Low tax to GDP ratio has also translated into falling total revenues to GDP
ratio, as it decreased from 15.6% in period 1 to 13.7% in period 5. Interestingly even during the period of
fiscal improvement (1999‐2004), tax to GDP ratio continued to slide, it was controlled expenditure that
caused the decline in fiscal deficits.

Page 5
Defense and Debt servicing expenditure has shown a favorable trend over the last two decades, as
spending on defense decreased from 5.3% in period 1 to 2.5% in period 5 while debt servicing which had
reached to 5.8% during period 2, declined to 4.3% in period 5. Debt servicing as a percentage to GDP is
now once again on an upward trend as seen in the latest period.
Different factors have contributed towards deteriorating fiscal position during FY2005 to FY2011;
however one reason that ignited
the fiscal imbalance was higher oil
prices in international markets
followed by delayed policy
response to transfer its impact to
consumers. Post FY2005, oil prices
in global markets shot up from
USD 59/bbl in Jun‐2005 to USD
176/bbl in July‐2008. Instead of
passing this price hike to
consumers, government opted to

Page 6
absorb the price differential by heavily subsidizing energy sector thus burdening its own fiscal account.
Subsidies in energy sector alone increased from PKR 49.68 billion in FY2005 to PKR 133.25 billion in
FY2008.
The government has started the process of gradually passing on these subsidies to consumers as it
increased base electricity tariffs by 90% since March FY2008. However, tariff anomalies still exists that
need to be eliminated at the earliest. In FY2011 alone, an amount of PKR 335bn was paid in energy
subsidies, equivalent to 1.9% of GDP.

Page 7
Structural deficiencies in tax system coupled with increasing expenditure on the back of high cost of
subsidies have kept fiscal balance under pressure for last few years. It is now imperative to bring
untaxed sectors into tax bracket along with improving tax collection mechanism to increase tax to GDP
ratio. Restructuring of ailing PSE along with gradually getting rid of subsidies burden is the need of the
hour in order to curtail government spending.
IV. Recent Fiscal Policy Developments
Pakistan’s fiscal deficit over the last two years saw significant variation from its original targets; however
government feels confident to meet its projected target of 4.7% during FY2012.
Table‐2: Consolidated Revenue & Expenditure of the Government (Rs. Billion)
Prov. Actual
BudgetProv. Actual
Budget
July‐June Estimate July‐June Estimate
2009‐10 2010‐11 2010‐11 2011‐12A. Total Revenue 2,078 2,574 2,261 2,871 a) Tax Revenue 1,473 1,859 1,707 2,151 b) Non‐Tax Revenue 605 716 554 719 B. Total Expenditure 3007 3259 3455 3721 a) Current Expenditure 2386 2519 2901 2976 b) Development Expenditure 613 734 506 737 c) Net Lending 39 7 8 8 d) Unidentified Expenditure ‐32 0 40 0 C. Overall Fiscal Balance ‐929 ‐685 ‐1194 ‐851 ‐ As % of GDP ‐6.3 ‐4.0 ‐6.6 ‐4.0
Source: Budget Wing, Ministry of Finance
Structural weaknesses like low tax to GDP ratio and high subsidies leave little elbow space for the
government to focus on
developmental expenditure. With
rigid government spending, the onus
of fiscal burden falls on
developmental expenditure which in
return hampers economic growth.
After the lackluster growth of 1.7% in
FY2009, economy saw encouraging
signs of recovery in FY2010 as GDP
Table‐3: Real Growth of Tax Revenue
Tax Revenue
(Rs. Billion)
Real Growth of Tax
Revenue (%)
Real GDP Growth (%)
Tax‐GDP(%)
2006‐07 890 2.8 6.8 10.3
2007‐08 1,051 1.6 3.7 10.3
2008‐09 1,205 ‐4.5 1.7 9.5
2009‐10 1,473 9.2 3.8 9.9
2010‐11 1,707 ‐4.1 2.4 9.5
2011‐12* 2,158 12.9 3.6 10.3
*Projections Source: DPCO Staff Calculations

Page 8
growth of 3.8% was recorded. However, floods in FY2011 quickly reversed the gains of previous year and
GDP plumped to 2.4%. As a consequence, tax revenue and non tax revenues declined during FY2011
while expenditures remained high.
Generating revenues from taxation remains an uphill task as it was seen in recent trend where tax to
GDP ratio fell from 10.1% in FY2010 to 9.5% in FY2011. During FY2010, real growth in tax revenue saw a
healthy increase of 11.1%; however, in FY2011 real growth in tax revenue dramatically fell by 4.5%.
Double digit inflation coupled with anemic growth contributed towards dismal real tax revenue growth.
Total real revenue collection also suffered from the same hurdles as it posted a negative growth of 8.4%
during FY2011.
Table‐4: Selected Fiscal Indicators (in percent) FY06 FY07 FY08 FY09 FY10 FY11 Real Growth of Public Debt ‐5.7 2.3 8.3 5.2 4.3 1.1
Real Growth of Revenues 8.3 11.9 ‐0.6 2.9 0.3 ‐8.4
Real Growth of Tax Revenue 10.3 2.8 1.6 ‐4.5 11.1 ‐4.1
Real Growth in Non‐interest Exp. 16.3 14.1 7.5 ‐11.7 11.6 ‐1.9
Real Growth of GDP 5.8 6.8 3.7 1.7 3.8 2.4
Saving Investment Gap ‐4.4 ‐5.1 ‐8.7 ‐5.6 ‐2.2 0.4
Primary Balance ‐0.7 ‐1.3 ‐2.5 ‐0.1 ‐1.6 ‐2.5
Revenue Balance 1.0 ‐0.6 ‐3.2 ‐1.2 ‐2.4 ‐3.3
Public Debt/GDP 57.2 55.4 59.0 60.0 60.1 59.3
Public Debt/Revenue 405 370 403 412 429 474
Debt Service/Revenue 29.6 33.8 37.2 46.6 40.4 37.7
Source: Budget Wing, MoF and DPCO Staff Calculations
On non tax revenue front, SBP remains one of the biggest contributors towards national kitty. As SBP’s
contribution in national exchequer decreased by 20.6% Y/Y in FY2011, non‐tax revenue saw a decrease
of 9.4% Y/Y during the same period. Increasing Primary Balance (budget deficit in which interest
payments on government liabilities are excluded from expenditure) has been an underlying concern that
needs to be addressed by increasing tax‐GDP ratio.
On Expenditure front, high subsidies to power sector have become a drag on resources. The government
has to eliminate the price differential in electricity tariffs that generates circular debt in order create
fiscal space for developmental expenditure. In FY2011 alone, 15% of total revenues were consumed in
power sector subsidies while back in FY2006, 6% of total revenues were spent on power subsidies.

Page 9
Table‐5: Fiscal Indicators as Percent of GDP
Real GDP Growth
Overall Fiscal Deficit
Expenditure Revenue
Total Current Development Total Tax Non‐Tax
FY92 7.6 7.5 26.7 19.1 7.6 19.2 13.7 5.5 FY93 2.1 8.1 26.2 20.5 5.7 18.1 13.4 4.7 FY94 4.4 5.9 23.4 18.8 4.6 17.5 13.4 4.1 FY95 5.1 5.6 22.9 18.5 4.4 17.3 13.8 3.5 FY96 6.6 6.5 24.4 20.0 4.4 17.9 14.4 3.5 FY97 1.7 6.4 22.3 18.8 3.5 15.8 13.4 2.4 FY98 3.5 7.7 23.7 19.8 3.9 16.0 13.2 2.8 FY99 4.2 6.1 21.9 18.6 3.3 16.0 13.3 2.7 FY00 3.9 5.4 18.9 16.4 2.5 13.4 10.6 2.8 FY01 2.0 4.3 17.4 15.3 2.1 13.1 10.5 2.6 FY02 3.1 4.3 19.6 16.2 3.4 14.2 10.7 3.5 FY03 4.7 3.7 18.5 16.2 2.2 14.8 11.4 3.4 FY04 7.5 2.4 16.9 13.7 3.2 14.1 10.8 3.2 FY05 9.0 3.3 17.2 13.3 3.9 13.8 10.1 3.7 FY06 5.8 4.3 18.4 13.6 4.8 14.1 10.5 3.6 FY07 6.8 4.4 20.8 15.9 4.9 15.0 10.3 4.7 FY08 3.7 7.6 22.5 18.1 4.4 14.6 10.3 4.4 FY09 1.7 5.3 19.9 16.1 3.8 14.5 9.5 5.1 FY10 3.8 6.3 20.3 16.7 3.5 14.0 10.1 3.9 FY11 2.4 6.6 19.2 16.1 3.1 12.5 9.5 3.1
FY12(T) 3.6 4.7 18.0 14.8 3.2 13.2 10.3 2.9
Note 1: The base of Pakistan’s GDP has been changed from 1980‐81 to 1999‐2000, therefore, wherever GDP appears in denominator the numbers prior to 1999‐2000 are not comparable.
These expenditures are apart from the disguised fiscal deficit that arises from banks funding to public
sector enterprises. As privatization looks an unlikely option for now, restructuring of PSE are of utmost
importance or else fiscal drainage will continue to increase. The burden of fiscal constraints has been
falling on developmental expenditure for some years now. Spending on developmental expenditure in
FY2006 stood at 4.8% of GDP while that figure has narrowed down to 3.1% during FY2011.
Government has set an optimistic fiscal deficit target of 4.7% for FY2012. The budgeted target looks
achievable as 1HFY12 FBR tax collection of PKR 842bn (up 21% Y/Y) is laudable. FBR should now push for
increasing the tax pie by bringing undocumented sectors into tax bracket along with devising policies
that close loopholes for tax evasion.

Page 10
V. Fiscal Performance 201011
V.i. Revenue
V.i.a. FBR Tax Collection and Refunds 201011
FBR tax revenue target for the fiscal year 2010‐11 was fixed at Rs. 1667 billion at the time of
announcement of Federal Budget. The target was higher by 25.6% over actual collection of Rs 1327.4
billion during fiscal year 2009‐10. However, floods during August, 2011 and energy shortage have vastly
affected the economy and taxation. Thus, the revenue target was revised to Rs.1604 billion and later on
further revised to Rs 1587.7 billion.
Despite unfavorable circumstance, FBR has collected Rs 1,558 billion during 2010‐11 as against
Rs.1327.4 billion in 2009‐10 reflecting a growth of 17.4%. The performance is commendable when
viewed in the context of higher refunds payments of around Rs.17 billion during 2010‐11.
So it may confidently be said that the net collection of Rs 1,588 billion is a significant achievement of
FBR despite adverse conditions in the country depicted below:

Page 11
• Unprecedented floods have vastly affected the economy and resource mobilization efforts in the country.
• Acute shortage of energy has badly affected the tax efforts.
• A huge growth of around 20% in the payment of refunds/rebates has also affected net collection of federal taxes.
The public sector program was
slashed down substantially during
2010‐11 which has also affected
collection of federal taxes
collected by FBR.
The transfer of CVT from federal
to the provincial governments has
also affected the collection of
federal taxes.
Direct Taxes
The net collection has been Rs. 602.5 billion during 2010‐11 against the target of Rs. 626.9 billion. An
amount of Rs. 46.7 billion refunds has been paid back to the claimants as against Rs.54.2 billion during
FY2009‐10.
Improved tax effort and relatively effective implementation of tax policy and administrative reforms has
geared up the collection over the years. The share of direct taxes in total federal tax receipts has
increased from around 15 percent in early 1989‐90 to around 32 percent in FY2000‐01. Currently, it is
around 39 percent in FY2010‐11.
It may be recalled that the collection of direct taxes includes income tax and other direct taxes like
worker welfare fund, worker profit participatory fund etc. The contribution of income tax in total direct
taxes has been around 97 percent. The structure of income tax is based on withholding taxes (WHT),
voluntary payments (VP) and collection on demand (COD). The collection during FY2010‐11 shows that
the shares of WHT, VP and COD in gross collection have been 56.9 percent, 31.2 percent and 11.5
percent respectively.
Table‐6: FBR Tax Collection (Rs. Billion)
Revenue Heads Collection Difference
FY11 FY10 Absolute Percent Direct Taxes 602.5 526.0 76.5 14.5 Indirect Taxes 955.6 801.4 154.2 19.2 ‐ Sales Tax (GST) 633.4 516.3 117.1 22.7 ‐ Federal Excise 137.4 124.8 12.6 10.1 ‐ Customs Duties 184.8 160.3 24.6 15.3 Total Taxes 1,558.0 1,327.4 230.6 17.4
‐ As %age of GDP 8.6 8.9 Source: Federal Board of Revenue
Page 12
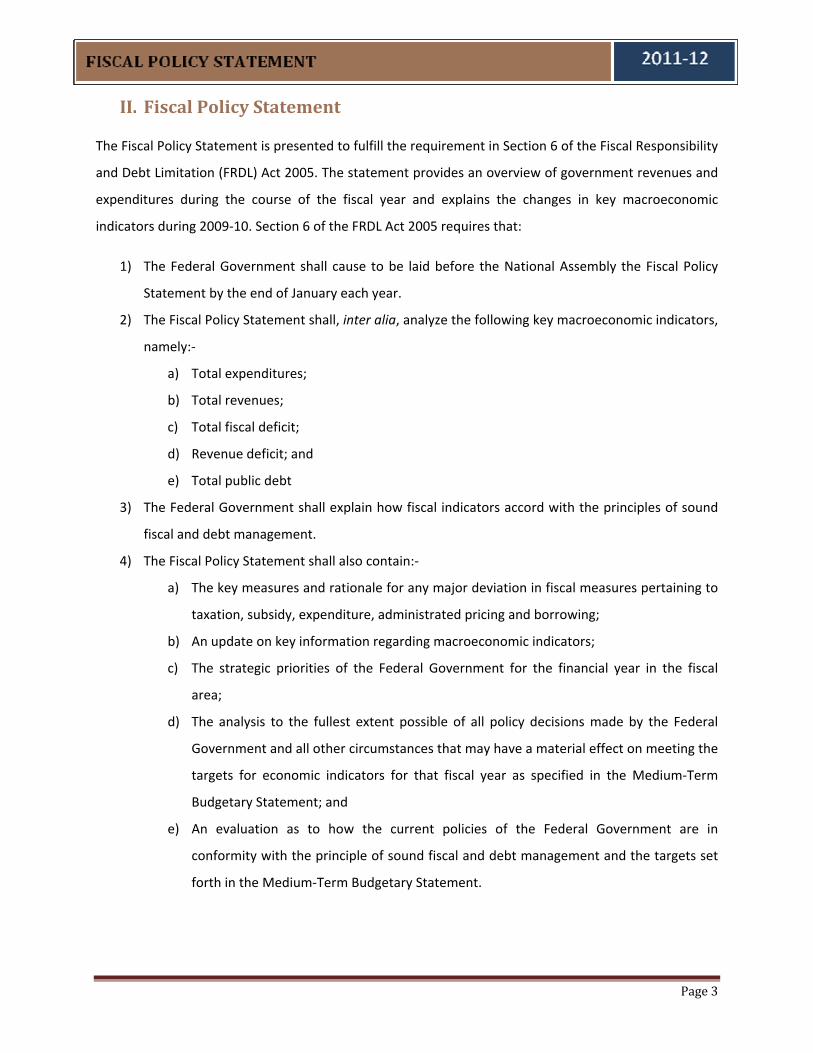
a. Voluntary Payments
This component includes payments with return and advances. Rs. 196.1 billion have been generated
during FY2010‐11 as compared
to Rs.165.8 billion in the
corresponding period last year
reflecting 18.3 percent growth
has been witnessed in
collection. Advance tax is the
major component of voluntary
compliance. Rs. 184.2 billion
has been collected as advance tax as compared to 156.3 billion during 2009‐10. The second component
of VP is payment with returns which has increased significantly during the period under review. During
FY2010‐11, Rs. 11.9 billion was collected against Rs. 9.5 billion in FY 2009‐10.
b. Withholding Tax
Withholding taxes are the leading source of direct tax receipts. The WHT collection during FY2010‐11
has been Rs. 357.8 billion against Rs. 295.2 billion during FY2009‐10 indicating a healthy growth of
around 21 percent. The nine major withholding taxes contributed around 90 percent of total WHT
Table‐7: Head‐wise Performance of Direct Taxes (Rs. Billion) 2009‐10 2010‐11 Change (%)
Voluntary Payments 166 196 18.3 Collection on Demand 99 72 ‐26.7 Deductions at Source (WHT) 295 358 21.2 Miscellaneous 0.119 3 2436.1 Gross Income Tax Receipts 560 629 12.4 Refunds 54 47 ‐13.9 Other DT 20 20 ‐2.2 Net Direct Taxes 526 602 14.5
Source: FBR Data Bank

Page 13
collection. These are: contracts,
imports, salary, telephone, export,
bank interest, electricity, cash
withdrawal and dividends.
The growth pattern of various
component of WHT collection has
been different i.e. exports (42
percent), dividends (29.3 percent),
salary (33.8 percent), imports (32.1%),
bank interest (18.3 percent),
telephone (19.3 percent), cash withdrawal (‐17.5 percent) and contracts (8.3 percent). The highest
growth registered in collection from export is due to higher growth in export during FY2010‐11. The
substantial growth in imports has also improved the collection from imports. A growth of 33.7 percent
from salary is mainly on account of increase in the salary of employees.
1. Indirect Taxes
a. Sales Tax
Sales tax has been leading revenue generation source of the country during 2010‐11. It has contributed
around 41 percent of the collection of federal taxes 2010‐11. A growth of around 22.7 percent has been
recorded in the net collection of sales tax. The collection is realized from two components i.e. sales tax
on imports and sales tax on domestic sector.
Table‐9: Collection and Growth of Sales Tax: Fiscal Year 2010‐11 (Rs. Billion)
Sources of GST Collection/ Refunds Growth (%)
Gross Refund Net Gross Refund Net Import Stage 308.7 0 309 24.8 0 24.8 Domestic Stage 375.5 50.8 325 26.1 77.0 20.7 Total 684 51 633 25.5 77.0 22.7
Source: FBR Data Bank
Sales Tax Domestic Collection: The collection of sales tax has been highly concentrated in some
commodities. This is confirmed by the fact that only petroleum products and telecom sector contribute
more than three‐fifth of the total sales tax domestic. Major ten commodities contributed 89.3 percent
of the total net sales tax from domestic. The major revenue spinners of sales tax domestic include

Page 14
petroleum products, telecom
services, natural gas, other
services, cigarettes, sugar,
electrical energy, beverages, tea
and cement.
Sales Tax at Import Stage: Sales
tax on imports is also a
component of federal tax
receipts. The collection of sales
tax has increased by 24.8
percent during 2010‐11 mainly
due to higher collection from
edible oils, machinery, paper &
paper board, plastic, vehicles
etc. Like sales tax domestic, the
receipts of sales tax on imports
have also been concentrated
mainly in few sectors. Petroleum
products alone contributed
around 36 percent of overall
collection of sales tax on imports
during 2010‐11. Similarly, ten
major spinners including
petroleum shared 80.2 percent
of the sales tax import.
b. Custom Duty
The customs duty is one of the
important components of
federal tax receipts. It
contributed around 12 percent
Table‐10: Comparison of Sales Tax Domestic (Net) Collection by Major Commodity (Rs. Billion)
Major Commodities
2010
‐11
2009
‐10 Growth
Realized (%)
Share (%) 2010‐11
Share (%) 2009‐10
POL Products 153 116 31.9 47.2 43.2 Telecom Sector 53 45 17.8 16.2 16.6 Natural Gas 18 17 2.1 5.4 6.4 Other Services 21 17 23.0 6.4 6.2 Electrical Energy 8 6 38.8 2.5 2.2 Cigarette 12 11 5.4 3.5 4.1 Beverages 8 7 19.4 2.6 2.6 Sugar 7 9 -22.4 2.2 3.5 Tea 6 5 19.0 1.7 1.8 Cement 5 4 22.6 1.5 1.5
Sub-Total 290 237 22.5 89.3 88.0 Others 35 32 7.4 10.7 12.0 Net Collection 325 269 20.7 100 100
Source: FBR Data Bank
Table‐11: Collection of Sales Tax (Import) ‐ Major Items (Rs. Billion)
Description
2010
‐11
2009
‐10 Realized
Growth (%)
Share (%) 2010‐11
Share (%) 2009‐10
POL Products (27) 111 100 11.1 34.0 37.0 Edible Oil (15) 29 19 52.9 8.8 7.0 Plastic (39) 25 19 29.2 7.6 7.1 Vehicles and Parts (87) 20 16 23.0 6.1 6.0 Iron and Steel (72) 19 18 8.1 5.9 6.5 Mechanical Machinery (84) 13 8 54.8 3.9 3.0
Electrical Machinery (85) 10 7 47.9 3.0 2.4
Organic Chemicals (29) 8 7 23.5 2.6 2.5 Paper & P. Board (48) 8 5 62.2 2.5 1.8 Oil seeds etc (12) 6 6 0.3 2.0 2.4 Sub Total 247.6 203.7 21.5 76.3 75.7 Other 61 44 40.3 18.8 16.2 Gross 309 247 24.8 100.0 100.0 Refund/Rebate 0.05 0.03 70.4 Net 309 247 24.8
Source: FBR Data Bank

Page 15
in total federal tax receipts during 2010‐11. The gross and net collection of customs duty has been
Rs.193.4 billion and Rs. 184.8 billion respectively during 2010‐11. The gross and net collection grew by
16.5 percent and 15.3 percent respectively during 2010‐11. Major revenue spinners of customs include
automobile, petroleum, edible oils, machinery, plastic, iron & steel etc. Around 70% of gross collection
of customs duty is contributed by major fifteen items.
Table‐12: Collection of Customs Duties during 2010‐11 (Rs. Billion)
Description Collection 2010‐11
Collection 2009‐10
Realized Growth (%)
Share (%) 2010‐11
Share (%) 2009‐10
1.Vehicles and Parts (87) 28.10 25.23 11.3 14.5 15.2 2. POL Products (27) 21.40 19.02 12.5 11.1 11.5 3.Edible Oil (15) 17.26 15.51 11.3 8.9 9.3 4.Mechanical Machinery (84) 10.93 10.47 4.4 5.7 6.3
5.Electrical Machinery (85) 9.53 9.44 0.9 4.9 5.7 6.Plastic (39) 8.83 7.22 22.3 4.6 4.3 7.Iron and steel (72) 7.57 8.37 ‐9.5 3.9 5.0 8..Paper & P. Board (48) 7.28 4.86 49.7 3.8 2.9 9.Textile (54) 4.45 2.33 91.0 2.3 1.4 10.Organic Chemical (29) 3.92 3.79 3.4 2.0 2.3 11.Tea and Coffee (9) 3.54 2.74 29.5 1.8 1.6 12.Staple Fibers (55) 3.21 1.74 84.4 1.7 1.0 13. Dairy produce (4) 2.77 1.37 102.0 1.4 0.8 14. Cosmetic and Perfumery(33) 2.75 2.28 20.7 1.4 1.4
15.Dyes and paints (32) 2.68 2.42 10.9 1.4 1.5 Sub Total 134 117 14.9 69.4 70.3 Other 59 49 20.1 29.7 Gross 193 166 16.5 100 100 Refund/Rebate 9 6 47.4 Net 185 160 15.3
Source: FBR Data Bank
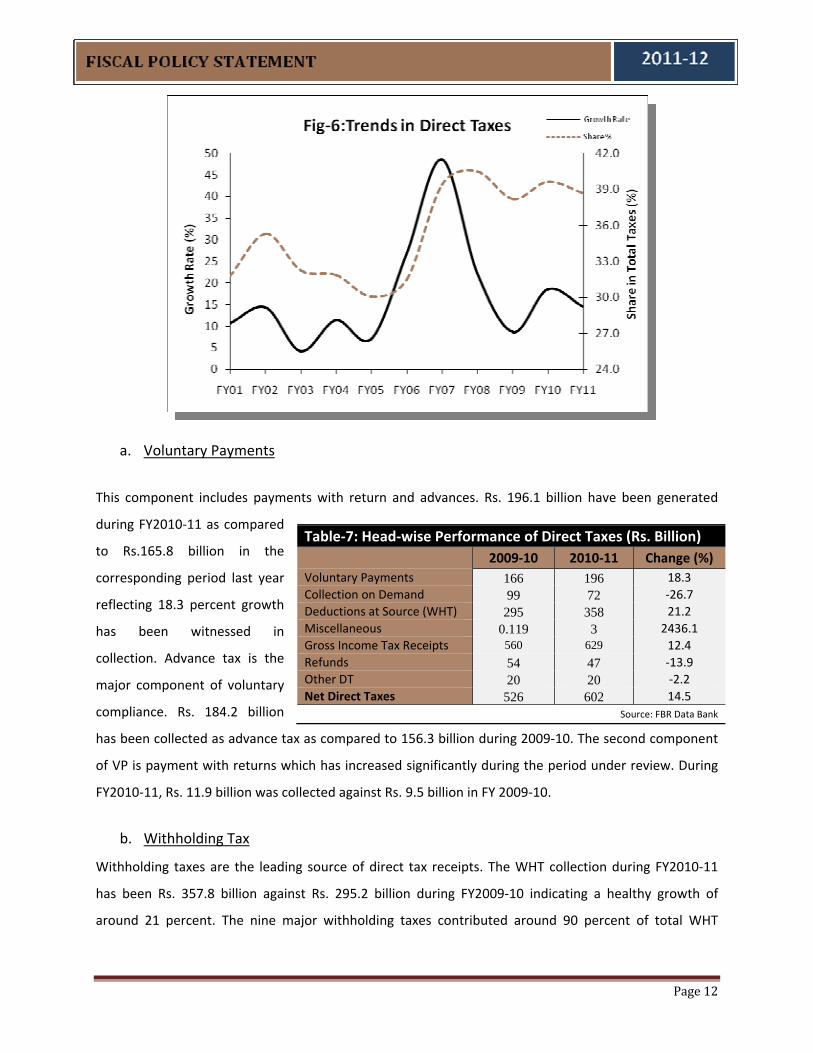
c. Federal Excise Duties
Federal excise duty is levied on imports and domestic stages. The major portion of the receipts
emanates from domestic sector. The base of the federal excise duty is quite narrow and is limited to few
commodities. Despite narrow base, federal excise duty has been an important revenue generation
source of federal taxes. Federal excise duty has contributed 8.8 percent of total tax collection during
2010‐11. The tax collection has been Rs. 137.4 billion in 2010‐11 against Rs. 124.8 billion in 2009‐10
Page 16
reflecting a growth of 10.1 percent. The major revenue spinners of federal excise duty are cigarettes,
cements, beverages, natural gas, services and POL products.
Table‐13: FED Collection from Major Commodities (Rs. Billion)
Commodities 2010‐11
2009‐10
Difference Share(%) 2010‐11
Share(%)2009‐10 Absolute Percent
Cigarettes 47 45 2 5.2 34.3 35.9 Cement 15 16 0 ‐1.9 11.3 12.6 Services 11 16 ‐5 ‐31.4 8.0 12.9 Beverages & Concentrates 9 11 ‐2 ‐19.6 6.7 9.1
Natural Gas 12 6 5 87.5 8.5 5.0 POL Products 5 5 0 6.5 3.7 3.8 1% SED 25 16 9 53.0 17.9 12.9 Sub Total 124 115 9 7.9 90.3 92.2 Other 13 10 4 36.0 9.7 7.8 Total 137 125 13 10.1 100 100
Source: FBR Data Bank
V.i.b. Non Tax Revenue Federal non tax revenue in FY2011 reached Rs 491 billion lower than the budget target by Rs 125 billion.
Receipts under the head of defense were budgeted at Rs 133.5 billion during FY2011 originating mainly
from logistic support services provided to the coalition forces. However, Rs. 70.7 billion could be realized
under this head leaving the receipts under the head of defense below the target by Rs. 62.8 billion. The
dividends receipts from financial and non financial institutions remained below the budget target by Rs
13.6 billion. Interest receipt from on‐lending to Public Sector Enterprises was lower by Rs.28.2 billion
against the budgeted estimates. Non materialization of Rs. 60 billion earmarked against issuance of 3 G
licenses was primarily compensated by unbudgeted foreign grants of Rs. 41 billion and higher collection
of levies on petroleum and gas sectors.
V.ii. Expenditure As originally envisaged in budgetary targets for FY 2010‐11, enhanced revenue generation would be
used to fuel additional outlays on socio‐economic development and social protection. Containment of
current expenditure was targeted in order to keep the fiscal deficit at sustainable level. However, the
government witnessed massive slippages against the budgeted current expenditure targets, making an
adjustment to development spending goals.
Details of government expenditure are given below:

Page 17
Table‐14: Consolidated Budgetary Position of the Government (Rs. Billion)
Prov. Actual
BudgetProv. Actual
Budget
July‐June Estimate July‐June Estimate
2009‐10 2010‐11 2010‐11 2011‐12A. Total Revenue 2,078 2,574 2,261 2,871 a) Tax Revenue 1,473 1,859 1,707 2,151 ‐ Federal 1,418 1,779 1,643 2,074 of which FBR Revenue 1,327 1,667 1,558 1,952 ‐ Provincial 55 80 65 77 b) Non‐Tax Revenue 605 716 554 719 ‐ Federal 537 616 491 642 ‐ Provincial 68 100 62 77 B. Total Expenditure 3,007 3,259 3,455 3,721 a) Current Expenditure 2,386 2,519 2,901 2,976 ‐ Federal 1,759 1,769 2,088 2,016 of which: Interest Payments 642 699 698 791 ‐ Domestic 578 622 630 715 ‐ Foreign 64 77 68 76 Defense Expenditure 375 442 451 495 ‐ Provincial 627 750 813 960 b) Development Expenditure 613 734 506 737 ‐ PSDP 518 610 462 640 Federal 259 290 216 300
of which ERRA 10 9 10 Provincial 258 340 246 340 Less Operational Shortfall ‐20 ‐ Other Development Expenditure 96 124 45 97 c) Net Lending 39 7 8 8 d) Unidentified Expenditure ‐32 0 40 0 C. Overall Fiscal Balance ‐929 ‐685 ‐1,194 ‐851 ‐ As % of GDP ‐6.3 ‐4.0 ‐6.6 ‐4.0 D. Financing of Fiscal Balance 929 685 1,194 851 a) External Sources 189 186 108 135 b) Domestic 740 499 1,087 716 ‐ Non‐Bank 436 333 472 413 ‐ Bank 305 167 615 304 c) Privatization Proceeds E. GDP at Market Prices 14,837 16,975 18,063 21,041 Memo Items
Revenue Balance ‐308 55 ‐594* ‐106 ‐ As % of GDP ‐2.1 0.3 ‐3.3 ‐0.5 Primary Balance ‐286.8 13.6 ‐450.7* ‐59.7 ‐ As % of GDP ‐1.9 0.1 ‐2.5 ‐0.3 * Adjusted for grants Source: Budget Wing, Ministry of Finance
Total expenditure for 2010‐11 approximated to Rs. 3,455 billion; Rs. 198 billion above the spending
targets while the growth over the previous fiscal year remained 15 percent. A 10 percent slippage on

Page 18
account of current expenditure, excluding flood relief, has been the main culprit. The outgoing fiscal
year underwent a significant downward adjustment in respect of development expenditure, that was
24.3 percent lower than the budgeted estimates and 10.8 percent lower than FY2010.
V.ii.a. Current Expenditure
For the fiscal year 2010‐11, current expenditure, adjusted for one‐off previous years power subsidy,
over‐run reached an alarming magnitude of Rs. 260 billion or 10 percent. About Rs. 2,901 billion were
consumed on current spending, almost 17 percent more than the previous year. Major heads are
explained as follows:
Table‐15: Consolidated Expenditure, 2010‐11 (Rs. Billion)
Prov.Actual Budget
Estimate RevisedEstimate July‐June
Federal 2,088.1 1,769.1 2,114.4 General Public Service 1,434.0 1,158.9 1,474.1 Serving of Domestic Debt 629.7 621.8 653.6 Serving of Foreign Debt 68.4 76.8 74.4 Superannuation Allowances & Pension 106.6 90.7 92.7 Grants to Others 232.1 172.8 245.9 Others General Public Services 397.1 196.9 407.4
Defense Affairs and Services 450.6 442.2 444.6 Public Order and Safety Affairs 64.2 51.3 58.7 Economic Affairs 77.7 66.9 80.0 Others 61.6 49.9 57.0
Provincial 812.7 750.0 810.0 Current Expenditure 2,900.8 2,519.1 2,924.4 PSDP 461.5 610.0 420.9 Federal 215.9 270.0 196.0 Provincial 245.6 340.0 224.9
Other Development Expenditure (inclusive of floods) 44.6 123.5 45.5 Development Expenditure 506.1 733.5 466.5 Net Lending 7.9 6.6 ‐4.9 Total Expenditure 3,455.1 3,259.3 3,386.0
Source: Budget Wing, Ministry of Finance
1. General Public Service
Originally, expenses with regards to general public service were budgeted at Rs. 1,159 billion for FY
2010‐11. However, this category ended up with an escalation to the tune of Rs. 275 billion mainly on
account of poorly targeted subsidies and growing security expenditures. This also includes Rs. 120 billion
unpaid power tariff differential subsidy of previous years that was paid in FY2011.

Page 19
a. Interest Payments:
A major chunk of Pakistan’s scarce resources are dedicated to making hefty payments in respect of debt
obligations. For FY 2010‐11, nearly 31 percent of total revenues have been consumed in servicing of
domestic and foreign debt against a ratio of 31 percent and 33 percent in 2009‐10 and 2008‐09
respectively. Even though this indicator has improved in the fiscal year 2010‐11, an increasing
concentration of financing mix towards internal sources and higher domestic interest rates on account
of tight monetary policy indicate a persistent burden of servicing expense on the government’s
budgetary position.
b. Grants:
During the fiscal year 2010‐11, transfer by the federal government to provinces in the form of grants
aggregated to Rs. 53.4 billion. When analyzing the break‐up of grants provided to other institutions, it
becomes clear that security related expenses in the wake of deteriorating security situation contributed
a huge portion to the expenditure bottom line.
c. Subsidies:
During 2010‐11, government subsidized the power sector by a large amount. Out of a total subsidy of
Rs. 381 billion, Rs. 335 billion or 88 percent were granted to WAPDA/PEPCO and KESC against a
budgeted target of Rs. 87 billion for the fiscal year 2010‐11.
A whopping slippage of 146 percent, adjusted for one‐off payment of Rs.120 billion related to previous
years, in this respect underlines the absence of prominent reforms in the power sector during the
previous fiscal year.
Table‐16: Subsidies, 2010‐11 (Rs. Billion)
Organization Prov.Actual Budget
Estimate Revised Estimate July‐June
Power Sector 334.8 87.3 343.1 Food & Agriculture 25.7 26.1 32.1 Oil Refineries 10.8 10.8 10.8 Others 9.3 2.5 9.8 Total 380.6 126.7 395.8
Source: Budget Wing, Ministry of Finance

Page 20
Restoring fiscal sustainability will require addressing with greater vigor existing challenges in the
resource‐stricken power sector to reduce unnecessary and unproductive burden on government
budgets. Table 16 shows a break‐up of subsidies for 2009‐10.
2. Other Current Expenditures
Defense affairs accounted for 15.5 percent of current expenditure for the fiscal year 2010‐11. Rs. 64.2
billion were spent on public order
and safety affairs against a
budgeted estimate of Rs. 51.3
billion. Economic affairs registered
Rs. 77.7 billion, an increase of 16
percent in comparison to budget.
On the contrary, government
spending on social safety nets had been abysmally low and access to social services by the vulnerable
remains a challenge. A combined total of only Rs.53 billion was incurred on education, health and
environment sector. This spending translated into only 0.3 percent of GDP for FY2010‐11, indicating the
government’s lack of attention towards targeted social transfers. Government
must ensure intergenerational equity and an adequate social safety net, and provision of public services
that allow a level playing field, regardless of conditions at birth.
V.ii.b. Development Expenditure
Development spending was contained for the fiscal year 2010‐11 in relation to budgetary targets to
mitigate the damage done to the fiscal account in the form of higher than projected non‐development
outlays.
Rs. 506 billion was spent for development purposes in FY 2010‐11 in comparison to Rs. 613 billion during
2009‐10. Out of it, Public Sector Development Programme (PSDP) was slashed to Rs. 462 billion as
against a budgeted estimate of Rs. 610 billion, while other development expenditures summed to Rs. 45
billion and witnessed a cut of 64 percent (in comparison to budget estimates) in the fiscal year 2010‐11.
Among PSDP, provincial share decreased by 28 percent in comparison to budgeted outlay whereas
federal portion was curtailed by a massive 20 percent in the period under review.
It is worth noting here that such a fiscal adjustment largely compromises on the development prospects
Table‐17: Social Spending, 2010‐11(Rs. Billion)
Prov.Actual Budget
Estimate RevisedEstimateJuly‐June
Environment Protection 0.5 0.4 0.4 Health 8.4 7.3 7.5 Education Affairs and Services 43.9 34.5 40.3 Total 52.8 42.2 48.2
‐ As % of GDP 0.3 0.2 0.3 Source: Budget Wing, Ministry of Finance

Page 21
for future generation in a country like Pakistan that needs to build upon its existing social sector.
V.iii. Fiscal Deficit
Adverse developments in the fiscal sector during the fiscal year 2010‐11 finally culminated to a budget
deficit of Rs. 1,194 billion or 6.6 percent of GDP. The weakening fiscal performance can be gauged by the
fact that the fiscal balance deteriorated by a huge 100 bps against a revised target of 5.4 percent of
GDP. A slippage of 1.2 percent in terms of GDP was observed in comparison to budget projections. The
fiscal deficit was higher by Rs. 265 billion over the deficit recorded in 2009‐10 or Rs.145 billion adjusted
for one‐off payment against unpaid power sector subsidies of previous years. This under‐performance
chiefly stemmed from a narrow tax base and the inability to tap this base fully on the revenue side, with
rigid and non‐priority current spending patterns taking a toll on these scarce resources.
Notwithstanding, the fiscal consolidation witnessed in 2008‐09 appeared to be vanishing in last two
fiscal years. Unless serious corrective measures to induce flexibility in government expenditure
especially subsidies are taken, the fiscal outlook is bound to remain fragile in the near term. Similarly,
enhanced revenue generation efforts need to be the top‐most priority going forward.
The current trajectory of fiscal deficit is a recipe to future external account crisis and will fuel
inflationary expectations in the economy as it creates demand in the system. Simultaneously, meeting
the financing requirement placed by the higher deficit will limit the prospects of private sector growth
and the economic benefits it brings.
V.iv. Financing of Fiscal Deficit
Drying‐up of external inflows exacerbated the already lackluster fiscal performance during the fiscal year
2010‐11. A widening fiscal balance, was, therefore, mainly financed through domestic sources in the
absence of any proceeds accruing from privatization. This avenue is costly as this borrowing is conducive
to inflationary pressures and at the same time, translates into higher debt servicing in view of higher
domestic interest rates. Moreover, such practice crowds out the private sector credit demands.
In the course of the fiscal year 2010‐11, Rs. 1,086 billion was generated from internal avenues against a
budgeted target of Rs. 499 billion. Bulk of the domestic financing came from Banking sources (56.6
percent of the domestic borrowing), whereas government was able to borrow the rest from non‐bank
sources. It is encouraging to note that government was able to retire SBP credit by Rs. 32 billion during
FY2011 in line with its policy of net zero quarterly borrowing from SBP. Government was able to adhere

Page 22
to this policy at the end of quarters ending in March, June and September 2011. This trend has helped
reduce the inflationary pressures and allowed SBP to reduce the policy rate by 2 percent during the first
half of FY2012.
The non‐bank inflows amounted to Rs. 471 billion, 41.4 percent higher than the estimated magnitude.
This segment of deficit financing underwent an amplification of nearly Rs. 35 billion as compared to FY
2009‐10. Huge accruals in retail instruments offered by the Central Directorate of National Savings
(CDNS), large issuance of Islamic Instruments (Government Ijara Sukuk) coupled with a resurgence of
non‐banking financial institutions’ interest in government papers were the prime reasons behind this
strong growth.
V.v. Revenue Deficit
Revenue balance is the total revenue adjusted for current expenditure. Governments require fiscal
space to spur development activities in the economy. For development spending, however,
governments need to generate a revenue surplus or at least maintain revenue balance. In Pakistan, the
government has not been able to achieve a zero revenue balance by June 30, 2008, a critical provision of
FRDL Act 2005. In fact, the revenue deficit mushroomed to Rs. 358.2 billion or 3.5 percent of GDP during
2007‐08.
Page 23
While the same indicator improved sharply by 200 bps in 2008‐09 over 2007‐08, the fiscal year 2010‐11
saw a reversal of this declining tendency and recorded a revenue deficit of 595 billion approximating to
3.3 percent of GDP. Government has not been able to achieve a surplus of 0.2 percent of GDP as
envisioned in the Federal Budget 2010‐11. This is an alarming situation and by no means, a sustainable
scenario.
The existence of a high and persistent revenue deficit points out the government’s inability in
maintaining fiscal discipline and instilling austerity measures in order to curtail increasing current
expenditures. Moral hazards in the form of subsidies have meant that “government is creating debt
obligations for financing inefficiency in the economy”1. So far, government has been helpless in bringing
current expenditures in line with the revenues. On the contrary, persistent revenue deficit implies that
the borrowed money is mostly being spent on current outlays that otherwise should be available solely
for development purposes. This practice needs to be put to halt by undertaking an aggressive
expenditure reform action plan. At the same time, it calls for greater emphasis on exploiting other
avenues in terms of resource mobilization.
V.vi. Primary Deficit
Primary balance is the total revenue adjusted for non‐interest expenditure. In line with the revenue
deficit, the primary deficit aggregated to Rs. 450 billion or 2.5 percent of GDP in FY 2010‐11 against a
budgeted target of primary surplus of Rs. 110 billion or 0.6 percent of GDP. This indicator has eroded by
a large margin when compared to the FY 2009‐10 position of 1.6 percent of GDP.
A negative primary balance essentially means that the government is borrowing monies to pay interest
payment on the debt stock, debt trap. Action to arrest such a trend is politically difficult, but the effects
of the needed measures could be phased in over time. Indeed, to the extent that long term spending
trends are ameliorated by structural reforms, a smaller improvement in the primary balance could then
be targeted.
VI. Fiscal Performance JulySeptember 201112
First quarter fiscal year 2011‐12 performance is laudable as FBR managed to collect PKR 381bn (up 30%
Y/Y) revenues against PKR 293bn during the same period in the corresponding year.
1 “Public Finance and Fiscal Policy”, State Bank of Pakistan Annual Report FY10

Page 24
Table‐18: Consolidated Government Budget, July‐Sept 2011 (Rs. Billion)
Prov. Actual Prov. ActualJuly‐Sept July‐Sept2010‐11 2011‐12
A. Total Revenue 406 542 a) Tax Revenue 323 417 ‐ Federal 309 398 of which FBR Revenue 293 381 ‐ Provincial 14 19 b) Non‐Tax Revenue 83 125 ‐ Federal 74 106 ‐ Provincial 9 19 B. Total Expenditure 683 800 a) Current Expenditure 567 657 ‐ Federal 419 436 of which: Interest Payments 162 177 ‐ Domestic 147 165 ‐ Foreign 15 12 Defense Expenditure 93 107 ‐ Provincial 148 220 b) Development Expenditure 59 90 ‐ PSDP 48 80 Federal 27 47 ERRA 5 1 Provincial 16 32 ‐ Other Development Expenditure 16 10 c) Net Lending 3 (1) d) Unidentified Expenditure 53 55 C. Overall Fiscal Balance (276) (259) ‐ As % of GDP (1.5) (1.2) D. Financing of Fiscal Balance 276 257 a) External Sources 57 (4) b) Domestic 219 262 ‐ Bank 98 142 ‐ Non‐Bank 121 120 c) Privatization Proceeds ‐ ‐ E. GDP at Market Prices 18,063 20,905 Memo Items
Revenue Balance ‐160 ‐115 ‐ As % of GDP ‐0.9 ‐0.5 Primary Balance ‐115 ‐73 ‐ As % of GDP ‐0.6 ‐0.3
Source: FBR, Budget Wing, Ministry of Finance
The first quarter of the current fiscal year observed a budget deficit of 1.2 percent of GDP. Expenditures
increased by 16.5% Y/Y during 1QFY2012, mainly driven by higher current expenditure (up 15% Y/Y). The

Page 25
total amount of tax collection has now reached to PKR 417bn in the first quarter of fiscal year 2011‐12
as against PKR 313bn in the corresponding period last year.
VI.i. Tax Revenue
Recent collection of taxes by
government is admirable as
FBR managed to gather PKR
374bn during first quarter
2011‐12 against PKR 287bn
collected during the
corresponding period last
year. Direct taxes grew by
35.2%, customs by 16.3%, FED by 18.5% and most notable increase was seen in sales tax which grew by
32.5% during first quarter fiscal year 2011‐12. Despite shifting of GST collection on certain service to the
provinces, total collection grew by 30% during first quarter fiscal year 2011‐12.
VI.ii. Non Tax Revenue
Non tax revenue also posted a
healthy growth of 42% Y/Y during
first quarter fiscal year 2011‐12.
Major contributions came from
SBP profits and dividends. SBP
continues to remain a major
contributor in non tax revenues.
SBP profits reached PKR 54bn
during first quarter 2011‐12
against PKR 40bn in the
corresponding period last year.
Dividends increased by PKR 12.5bn
in first quarter fiscal year 2011‐12 against last year small dividends of PKR 500mn during 1QFY2011
owing to higher corporate profitability. Government is now taking important measures for the issuance
Table‐19: FBR Tax Collection, July‐September 2011 (Rs. Billion)
Revenue Head Target 2011‐12
July‐Sept % Change
2010‐11 2011‐12 Direct Tax 743.6 96 125 30.1 Sales Tax 836.7 134 185 38.6 Federal Excise 165.6 27 28 5.7 Customs Duty 206.4 37 43 14.4 Total Collection 1,952 293 381 29.7
Source: FBR
Table‐20: Non‐Tax Revenue, July‐Sept 2011 (Rs. Billion)
Prov. Actual
Prov. Actual
July‐Sept July‐Sept
2010‐11 2011‐12Non‐Tax Revenue 78 110 Interest (PSEs & Others) 4.4 5.0 Dividend 0.5 13.0 SBP Profit 40.0 54.0 Defence 1.4 1.8 Citizenship, Naturalization & Passport Fee 2.1 1.9 Development Surcharge on Gas 5.0 5.7 Discount Retained on Crude Oil 3.0 4.3 Royalty on Oil/Gas 19.6 15.0 Others 2.4 9.1
Source: Budget Wing, Ministry of Finance
Page 26
of 3G license to Pakistani telecom sector which is likely to generate revenue of around USD 800mn
during this fiscal year.
VI.iii. Expenditure
Current expenditure slippages continue to burden limited resources of the country. Current expenditure
soared by 15% during first quarter fiscal year 2011‐12. Current spending was PKR 657bn in July‐
September 2011 with interest payments of PKR 177bn. Continued subsidies remain a major drain on
financial resources, during first quarter fiscal year 2012, PKR 32bn were spent on subsidies with PKR
26bn amount coming from power sector subsidies. Major heads of expenditure have increased during
first three month of fiscal year 2012. Meanwhile on the positive front, spending in PSDP increased by
167% to reach at PKR 80bn during first quarter fiscal year 2011‐12 against PKR 48bn during the
corresponding period last year.
Government has initiated reforms for tightening of expenditures along with effective management of
financial resources. It remains an uphill task in the presences of tariff anomalies, inefficient operations
of public utilities and misallocation of natural resources. With limited options available to the
government, painful policy options of structural changes need to be adopted in order to create fiscal
space for social and developmental expenditures.
VI.iv. Fiscal, Revenue and Primary Deficit
A budgeted deficit of PKR 257bn was recorded in first quarter fiscal year 2011‐12 against a deficit of PKR
276bn in the corresponding period last year. Fiscal deficit for first quarter of current fiscal year stood at
1.2% of GDP. This improvement in fiscal balance should be interpreted with caution as conversion of
power holding TFC are yet to show their effect on fiscal balance.
Revenue deficit improved to PKR 115bn or 0.6% of GDP during first three months of current fiscal year
against revenue deficit of PKR 161bn or 0.9% of GDP in the same period last year. Similarly primary
deficit also showed improvement as it reached to PKR 82bn in 1QFY2012 against PKR 114bn in
1QFY2011. Improvements in these fiscal indicators are commendable, showing governments desire to
improve spending patterns along with increased revenue collection. On the back of improved tax
collection, the government now needs to push for greater tax and structural reforms.

Page 27
VI.v. Financing of Fiscal Deficit
With external inflows drying out, government reliance on domestic avenues for budgetary support has
greatly increased. During the first three months of fiscal year 2012, no external sources were used for
budgetary support and the onus felt on domestic borrowings. More importantly, banks remained the
major source for financing. Total domestic borrowing for first quarter fiscal year 2011‐12 stood at PKR
261bn, 45% of this borrowing was met from banks while the rest of 55% was met from non‐bank
sources. This financing mix has dramatically changed as during first quarter of fiscal year of 2010‐11,
borrowing from banks stood at 55%, while non banks sources contributed 45% of domestic sources.
Increasing reliance on banks is not an applaud able policy, because it results in crowding‐out of private
sector credit. The impact of crowding‐out of private sector credit will be more severe once private
sector credit demand restores.
VII. Review of Public Debt
Pakistan entered the 21 Century with serious financial constraints; public debt was as high as 83 percent
of its GDP at the end of FY2001. Pakistan’s economy has experienced a turnaround since 2000, growth
has accelerated, and most macroeconomic indicators have improved. Public debt indicators have also
shown significant improvement. Modest growth in public debt, coupled with the strong growth in
nominal GDP, led to a significant reduction in public debt to GDP ratio, from 79% in fiscal year 2001‐02
to 55.4 percent by the end of FY2007. However since FY07, fiscal policy became subservient to political
exigencies as government extended whole‐sale subsidies on oil, electricity, food and fertilizer to protect
the more vulnerable sections of the society from the effects of global commodity shock. Higher security
related expenditures supplemented by policy inaction on key expenditures plus increased expenditures
due to natural disasters led to rapid escalation of Total Public Debt as a percentage of GDP, reaching 60
percent by the end of FY2010. However, the same was 59.3 percent at the end of fiscal year 2011; this
would have been 58.2 percent had the government not maintained credit balance with SBP on June 30,
2011.
The total public debt stood at Rs.10.709 billion as at June 30, 2011, an increase of Rs.1.788 billion or 20
percent higher than the debt stock at the end of last fiscal year. Government borrowed Rs.1.086 billion
from domestic sources and Rs.62 billion from external sources to finance the fiscal operations.
Approximately, US$ 3.3 billion were added to the external debt stock owing to depreciation of US Dollar
against other major international currencies and around Rs.27 billion were added by depreciation of Pak

Page 28
Rupee against US Dollar by meagre 0.6 percent. In May 2011, government paid Rs. 120 billion against
the un‐paid tariff differential subsidy of past years to PEPCO.
Developments in TPD during 2010‐11 have been driven mainly by a combination of five distinct factors.
Increased demands on the government budget during 2010‐11 for purposes of security meant that
expenditure was fairly rigid even in the face of a committed effort to rationalize expenditure and curtail
the fiscal deficit. Secondly, lower than expected GDP growth, acute energy shortages, and a high cost of
doing business led to a revenue shortfall, situation was further complicated by the devastating floods
that put additional burden on fiscal operations. Higher international prices for textile products had a
positive impact on Pakistan’s trade balance. In addition to these external developments, import
compression measures restricted the import bill significantly despite higher oil prices and shift of power
generation mix towards furnace oil.
Slippages in both revenues and expenditures led to FY2011 budget deficit missing the target. Gross
revenue collection (tax and non‐tax) was 12.1% lower than the budgeted target while total expenditures
(current and development), adjusted for one off payment of energy subsidies pertaining to previous
years, were 2.4% higher than budgetary estimates. FBR tax collection fell 6.4% short of target while non‐
tax revenues were 23.6% less than target due to non‐realization of expected 3G license receipts and
lower logistical support receipts from the US. On the other hand, expenditure exceeded the target due

Page 29
to higher subsidies and flood related spending despite PSDP spending being 24% lower than the
budgeted target.
The primary source of increase in public debt during 2010‐11 has been a rapid increase in local currency
component that accounted for almost 76 percent of the total increase in TPD. The main reasons for this
shift in borrowing were the non‐materialization of privatization proceeds, slow disbursement from
multilateral and bilateral donors, and higher than budgeted fiscal deficit.
The external debt component grew by Rs. 424 billion or 24 percent due to increased foreign public debt
inflows on the one hand, and depreciation of US dollar against other major currencies on the other
hand. Rupee lost approximately 0.6 percent of its value against the US dollar during 2010‐11.
Depreciation of the US Dollar against other major currencies caused the foreign currency component of
public debt to increase by approximately US $3,300 million. This capital loss on foreign currency debt,
however, is mitigated by the strong concessionality element associated with Pakistan’s external loans.
The impact of any currency shock should not be looked at in isolation, but rather be analyzed in the
context of interest rate differential.
Table‐21: Public Debt, FY07‐FY12* FY07 FY08 FY09 FY10 FY11(P) FY12* (In billions of Rs.) Domestic Currency Debt 2,601 3,266 3,852 4,651 6,014 6,223Foreign Currency Debt 2,201 2,778 3,776 4,270 4,694 4,773Total Public Debt 4,802 6,044 7,629 8,921 10,708 10,996 (In percent of GDP) Domestic Currency Debt 30.0 31.9 30.3 31.3 33.3 29.8Foreign Currency Debt 25.4 27.1 29.7 28.8 26.0 22.8Total Public Debt 55.4 59.0 60.0 60.1 59.3 52.6 (In percent of Revenue) Domestic Currency Debt 200 218 208 224 266 250Foreign Currency Debt 170 185 204 205 208 192Total Public Debt 370 403 412 429 474 442 (In percent of Total Debt) Domestic Currency Debt 54.2 54.0 50.5 52.1 56.2 56.6Foreign Currency Debt 45.8 46.0 49.5 47.9 43.8 43.4Memo: Foreign Currency Debt (in US$ Billion) 36.4 40.7 46.4 50.0 54.6 54.6Exchange Rate (Rs./US$, E.O.P) 60.4 68.3 81.4 85.5 86.0 87.5GDP (in Rs. Billion) 8,673 10,243 12,724 14,837 18,063 20,905Total Revenue (in Rs. Billion) 1,298 1,499 1,851 2,078 2,261 2,485
P : Provincial*end‐September 2011
Source: EAD, SBP, Budget Wing, MoF and DPCO staff calculations
Page 30
TPD stood at Rs. 10,996 billion at the end of first quarter FY2012, registering an increase of Rs. 287
billion or 2.7 percent in first three months of the current fiscal year. During the first quarter FY2012, US
$ appreciated against other major currencies and registered a meagre capital gain of approximately US $
50 million, however Pak Rupee lost its value against US Dollar by 1.7%. Government was able to contain
the fiscal deficit for the first quarter at 1.2 percent of GDP against 1.6 percent in same period last fiscal
year that helped restricted the growth in public debt.
A significant positive masked by overall weak fiscal numbers is the distinct uptrend in FBR tax collection
since 4QFY2011. Helped by withdrawal of GST exemption on several sectors and levy of one‐off flood
surcharge, FBR tax collection grew by 28.4% in 4QFY2011. However, the trend has continued into
FY2012 with FBR tax collection increasing by 21% during Jul‐Dec’2011 despite shifting of GST collection
on certain service to the provinces.
VIII. Servicing of Public Debt
Increases in the outstanding stock of
Total Public Debt have implications
for the economy in the shape of a
greater amount of resource allocation
towards debt servicing in the future.
In order to meet debt servicing
obligations, an extra burden is placed
on limited government resources and
might have costs in the shape of
foregone public investment or
expenditure in other sectors of the economy.
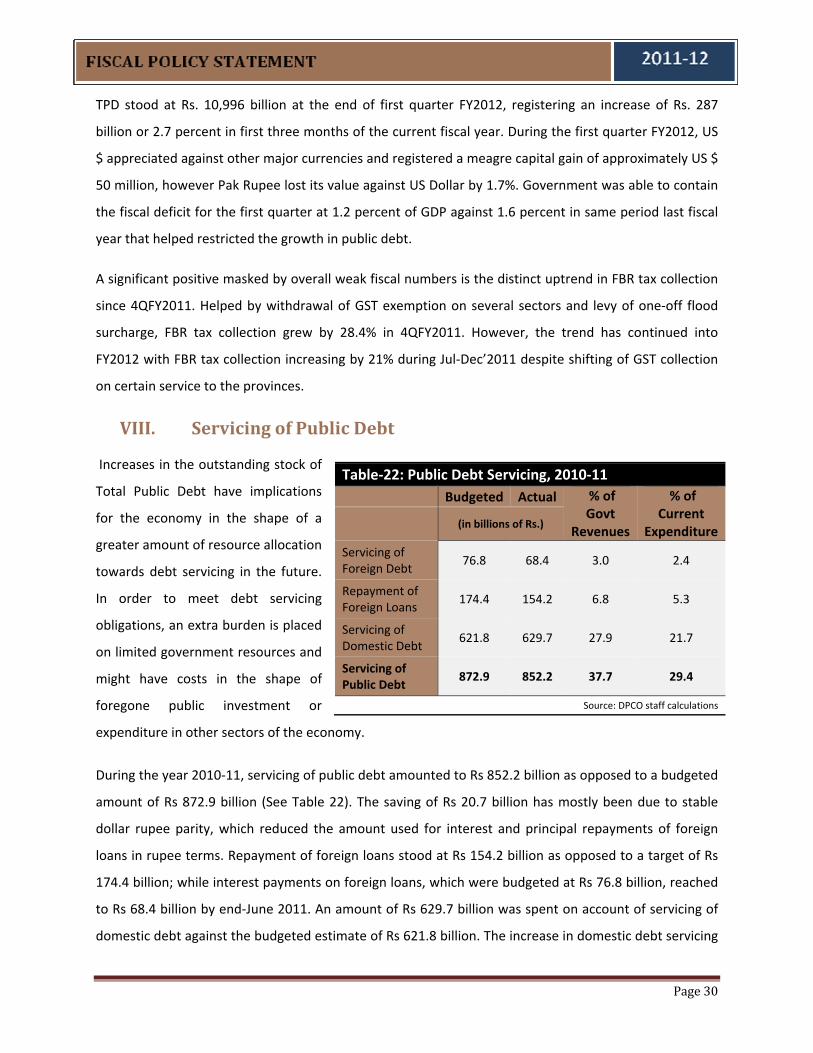
During the year 2010‐11, servicing of public debt amounted to Rs 852.2 billion as opposed to a budgeted
amount of Rs 872.9 billion (See Table 22). The saving of Rs 20.7 billion has mostly been due to stable
dollar rupee parity, which reduced the amount used for interest and principal repayments of foreign
loans in rupee terms. Repayment of foreign loans stood at Rs 154.2 billion as opposed to a target of Rs
174.4 billion; while interest payments on foreign loans, which were budgeted at Rs 76.8 billion, reached
to Rs 68.4 billion by end‐June 2011. An amount of Rs 629.7 billion was spent on account of servicing of
domestic debt against the budgeted estimate of Rs 621.8 billion. The increase in domestic debt servicing
Table‐22: Public Debt Servicing, 2010‐11 Budgeted Actual % of
Govt Revenues
% of Current
Expenditure (in billions of Rs.)
Servicing of Foreign Debt
76.8 68.4 3.0 2.4
Repayment of Foreign Loans
174.4 154.2 6.8 5.3
Servicing of Domestic Debt
621.8 629.7 27.9 21.7
Servicing of Public Debt
872.9 852.2 37.7 29.4
Source: DPCO staff calculations
Page 31
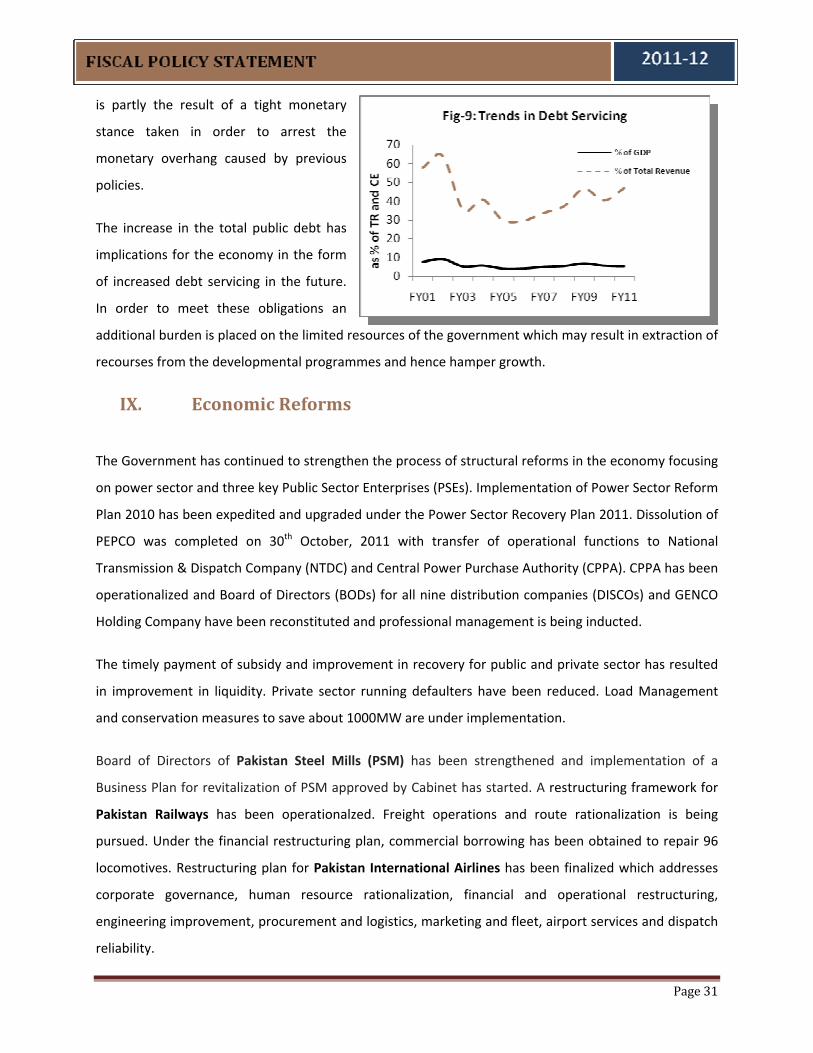
is partly the result of a tight monetary
stance taken in order to arrest the
monetary overhang caused by previous
policies.
The increase in the total public debt has
implications for the economy in the form
of increased debt servicing in the future.
In order to meet these obligations an
additional burden is placed on the limited resources of the government which may result in extraction of
recourses from the developmental programmes and hence hamper growth.
IX. Economic Reforms
The Government has continued to strengthen the process of structural reforms in the economy focusing
on power sector and three key Public Sector Enterprises (PSEs). Implementation of Power Sector Reform
Plan 2010 has been expedited and upgraded under the Power Sector Recovery Plan 2011. Dissolution of
PEPCO was completed on 30th October, 2011 with transfer of operational functions to National
Transmission & Dispatch Company (NTDC) and Central Power Purchase Authority (CPPA). CPPA has been
operationalized and Board of Directors (BODs) for all nine distribution companies (DISCOs) and GENCO
Holding Company have been reconstituted and professional management is being inducted.
The timely payment of subsidy and improvement in recovery for public and private sector has resulted
in improvement in liquidity. Private sector running defaulters have been reduced. Load Management
and conservation measures to save about 1000MW are under implementation.
Board of Directors of Pakistan Steel Mills (PSM) has been strengthened and implementation of a
Business Plan for revitalization of PSM approved by Cabinet has started. A restructuring framework for
Pakistan Railways has been operationalzed. Freight operations and route rationalization is being
pursued. Under the financial restructuring plan, commercial borrowing has been obtained to repair 96
locomotives. Restructuring plan for Pakistan International Airlines has been finalized which addresses
corporate governance, human resource rationalization, financial and operational restructuring,
engineering improvement, procurement and logistics, marketing and fleet, airport services and dispatch
reliability.

Page 32
Government’s efforts have resulted in relative stability in these key sectors and fiscal discipline is being
maintained. The focus remains on improving overall corporate governance, curtailing haemorrhaging,
improving service delivery and reducing fiscal burden and moving to a structural surplus and increased
public sector savings.
X. Report on Compliance with FRDL Act 2005
The Fiscal Responsibility and Debt Limitation (FRDL) Act, 2005 was approved on 13 June 2005. The FRDL
Act, 2005 requires that the federal government take measures to reduce total public debt and maintain
it within prudent limits thereof. The following sections identifies the various limits prescribed by the
FRDL Act 2005 and reports on progress thereof.
The FRDL Act 2005 requires the following:
(1) Reducing the revenue deficit to nil not later than the thirtieth June, 2008 and thereafter
maintaining a revenue surplus
As of June 30, 2011, the revenue deficit approximated to Rs. 595 billion or 3.3 percent of GDP.
FY03 FY04 FY05 FY06 FY07 FY08 FY09 FY10 FY11 Revenue Balance ‐1.5% 0.3% 0.5% 1.0% ‐0.6% ‐3.2% ‐1.2% ‐2.4% ‐3.3%
(2) Ensure “that within a period of ten financial year, beginning from the first July, 2003 and
ending on thirtieth June, 2013, the total public debt at the end of the tenth financial year does
not exceed sixty percent of the estimated gross domestic product for that year and thereafter
maintaining the total public debt below sixty percent of gross domestic product for any given
year.”
As of 30th June 2011, the total public debt stood at 59.3 percent of GDP. It must be noted here that the
limit of 60 percent of total public debt‐to‐GDP is applicable from the fiscal year 2012‐13 onwards.
FY03 FY04 FY05 FY06 FY07 FY08 FY09 FY10 FY11 (Rs. Billion) Domestic Currency Debt 1,852 1,995 2152 2322 2601 3266 3852 4651 6015 Foreign Currency Debt 1,771 1,816 1,913 2,038 2201 2778 3776 4270 4694

Page 33
Total Public Debt 3,623 3,810 4,065 4,359 4,802 6,044 7,629 8,921 10,709 GDP 4,876 5,641 6,500 7,623 8673 10243 12724 14837 18063 Total Public Debt (as % of GDP) 74.3 67.6 62.5 57.2 55.4 59.0 60.0 60.1 59.3
(3) Ensure “that in every financial year, beginning from the first July, 2003, and ending on the
thirtieth June 2013, the total public debt is reduced by no less than two and a half percent of
the estimated gross domestic product for any given year, provided that social and poverty
alleviation related expenditures are not reduced below 4.5 percent of the estimated gross
domestic product for any given year and budgetary allocation to education and health, will be
doubled from the existing level in terms of percentage of gross domestic product during the
next ten years.”
During the fiscal year 2010‐11, the Debt to GDP ratio was reduced by 0.8 percent. Social and poverty
alleviation related expenditure (as given by pro‐poor budgetary expenditure excluding non‐development
outlays on law and order) remained at 6.9 percent of GDP in 2010‐11. Additionally, expenditure on
health and education in 2010‐11 amounted to 0.6 percent and 1.8 percent of GDP respectively.
FY03 FY04 FY05 FY06 FY07 FY08 FY09 FY10 FY11 Social sector and poverty related expenditure (as % of GDP)
3.6 3.9 4.2 4.9 4.9 9.3 6.9 6.7 6.9
Expenditure on education (as % of GDP)
1.6 1.7 1.8 1.9 1.9 1.8 1.9 1.8 1.8
Expenditure on health (as % of GDP)
0.5 0.5 0.5 0.5 0.6 0.6 0.7 0.8 0.6
(4) Not issue “new guarantees, including those for rupee lending, bonds, rates of return, output
purchase agreements and all other claims and commitments that may be prescribed, from
time to time, for any amount exceeding two percent of the estimated gross domestic product
in any financial year: Provided that the renewal of existing guarantees shall be considered as
issuing a new guarantee.”
New guarantees issued by the government in 2010‐11 amounted to Rs. 62.4 billion or 0.35 percent of
GDP. The government also issued letter of comfort equivalent to 0.5 percent of GDP against commodity
finance.

Page 34
Since last few years Pakistan is faced with serious challenges both at domestic and international fronts.
Serious internal security situation, energy shortages, severe floods and rising inflation combined with
global economic & credit crises and higher commodity prices have all put enormous pressure on
government’s limited fiscal resources. Given the severity of these constraints the government has been
able to manage the fiscal deficits at reasonable levels though was unable to fully comply with some
provisions of FRDLA 2005. However, the government remains fully committed to adhere to all the
provisions of FRDLA 2005 in future.
XI. Concluding Remarks
Pakistan’s fiscal deficit increased to 6.6 percent of GDP in FY2010‐11 against the budgeted target of 4.0
percent whereas fiscal deficit for FY2009‐10 was 6.3 percent. Lower revenue collection and higher than
budgeted expenditure on security and subsidies were the main reasons for this undesirable increase in
fiscal deficit. Reported deficit figure for FY2011 include payment amounting 0.7 percent of GDP
representing cost of energy subsidies relating to previous years, the adjusted fiscal deficit is 0.4 percent
lower compare to last fiscal year. This fiscal adjustment is commendable in light of loss of revenue,
lower GDP growth and cost incurred owing to floods in Sindh.
Generating revenues from taxation remains an uphill task as it was seen in recent trend where tax to
GDP ratio fell from 10% in FY2010 to 9.5% in FY2011. During FY2010, real growth in tax revenue saw a
healthy increase of 11.1%; however, in FY2011 real growth in tax revenue dramatically fell by 4.5%.
Double digit inflation coupled with anemic growth contributed towards dismal real tax revenue growth.
Total real revenue collection also suffered from the same hurdles as it posted a negative growth of 8.4%
during FY2011. Furthermore, real growth of ‐3.2 percent in expenditure has been higher than the real
growth of revenues which has had significant consequences for the fiscal deficit. Persistent divergence
between growth of revenues and expenditure has led to escalating revenue deficit to the tune of 3.3
percent of GDP. The primary balance also remains in deficit by 2.5 percent of GDP. Going forward,
significant growth in real revenues is essential to maintain fiscal sustainability, and to finance the
government’s economic plans.
The implementation of the government’s recovery efforts and gradual resurgence of economic stability
has been remarkable. However, in the course of the recent economic performance, a few key issues
have emerged. Firstly, the importance of addressing key structural issues during times of relative fiscal
soundness has been highlighted. While giving due credit to the government’s crisis management efforts,

Page 35
it must be noted that had there been an implementation of resource management and revenue
generation efforts in periods of relative stability. By shifting from a reactionary stance to reform and
efficiency oriented resource management policies, the government will be able to rid the system of the
inefficiencies that are painfully brought to the surface in times of crisis.
Secondly, emphasis must be placed on revenue generation, instead of adjustments made through cuts
in expenditure. Inability to translate relative economic prosperity into a structural advancement of
revenue generation has meant that fiscal adjustments have been made by reduction in outlays, which
hampers future prospects and might have dire consequences for socio‐economic development. Changes
in the tax structure to include major sectors of the economy that have so far not matched their
contribution to economic growth by a proportionate increase in tax revenue will be a significant step in
this regard.
A considerable drain on government resources has been an increasing burden of contingent liabilities in
order to cover the losses incurred by public sector enterprises (PSEs). Accordingly, the contingent
responsibility of the government has, most of the times, transformed to a reality as these bodies lacked
the capacity to service their obligations. In order to allow efficient fiscal adjustments, the root cause of
these public sector entities’ losses must be tackled by comprehensive restructuring and introduction of
corporate management structures, rather than absorbing their liabilities into the government budget.
It was for the first time after fiscal year 2003‐04 that Pakistan managed to post a current account
surplus. External account is a vital part of any economy; however the factors affecting it are mainly
exogenous, apart from structural discrepancies. There is a need to strengthen the external account by
promoting positive trade balance especially in the coming years as ceasing of IMF inflows coupled with
increasing oil and other commodity prices will continue to put pressure on the current account.
Government needs to take proactive measures to combat this. On top of it, there’s a strong need to
promote non debt creating foreign inflows to decrease the dependence on external loans.

ffiinnaannccee..ggoovv..ppkk
Related Documents