Debt Placement Note Sales Investment Sales Equity Placement and Joint Ventures Structured Finance Loan Servicing Capital Markets Presentation Real Estate Capital Markets Outlook for 2005: Themes and Key Ideas

Debt Placement Note Sales Investment Sales Equity Placement and Joint Ventures Structured Finance Loan Servicing Capital Markets Presentation Real Estate.
Dec 16, 2015
Welcome message from author
This document is posted to help you gain knowledge. Please leave a comment to let me know what you think about it! Share it to your friends and learn new things together.
Transcript

Debt Placement
Note Sales
Investment Sales
Equity Placementand Joint Ventures
Structured Finance
Loan Servicing
Capital Markets PresentationReal Estate Capital Markets Outlook for 2005: Themes and Key Ideas

Dynamics - Flow Forces• G-I-Normous capital flow into commercial
real estate continues to propel pricing amidst scarcity of supply of investment-grade product.– Rate and Spread Compression
– Unprecedented IRR Compression
– Historic High $PSF
– IO, Open Prepay, Pre-Sales at Stabilized Value: Get the Flow Out!
REAL ESTATE CAPITAL MARKETS OUTLOOK
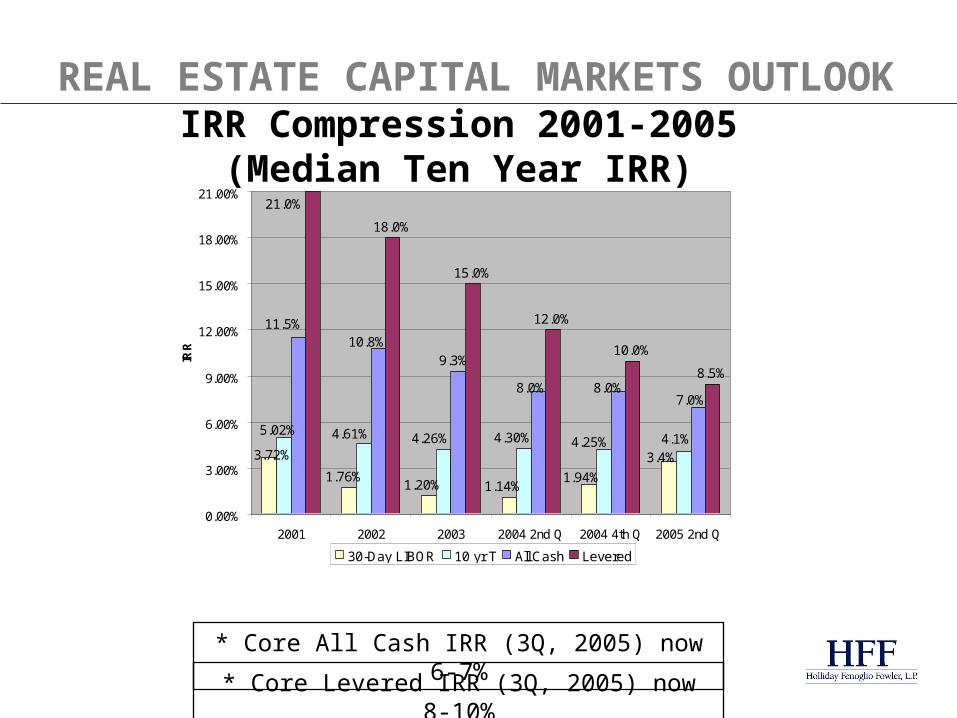
IRR Compression 2001-2005(Median Ten Year IRR)
18.0%
15.0%
12.0%
10.0%
8.5%
3.4%
1.94%1.14%1.20%
1.76%
3.72%4.1%4.25%4.30%4.26%4.61%5.02%
10.8%11.5%
9.3%
7.0%8.0% 8.0%
21.0%
0.00%
3.00%
6.00%
9.00%
12.00%
15.00%
18.00%
21.00%
2001 2002 2003 2004 2nd Q 2004 4th Q 2005 2nd Q
IRR
30-Day LIBOR 10 yr T All Cash Levered
* Core All Cash IRR (3Q, 2005) now 6-7%
* Core Levered IRR (3Q, 2005) now 8-10%
REAL ESTATE CAPITAL MARKETS OUTLOOK
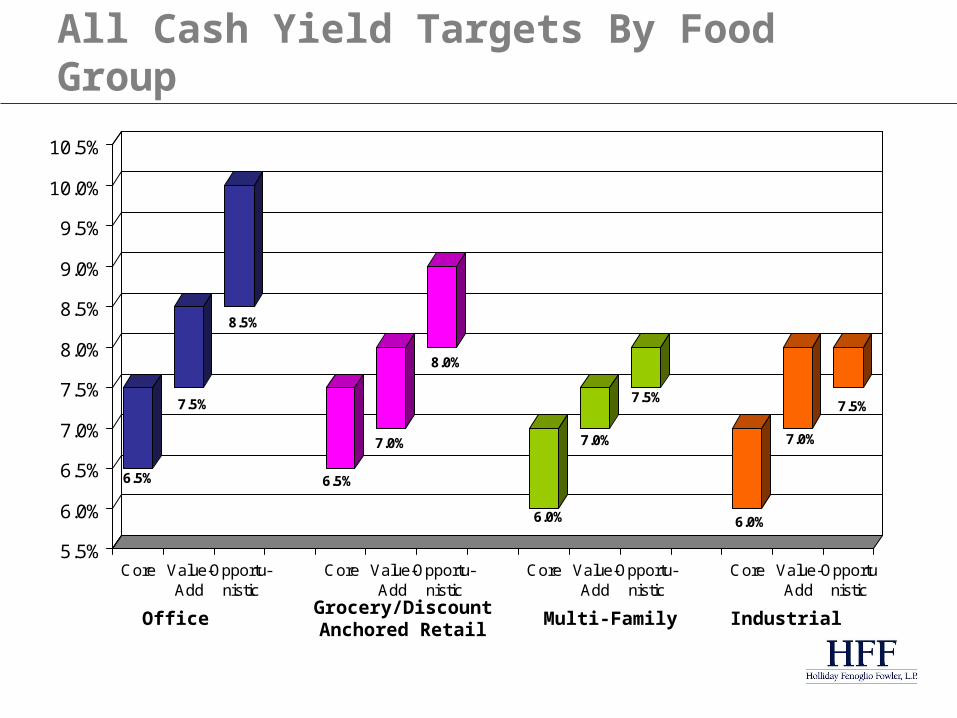
All Cash Yield Targets By Food Group
6.5%
7.5%
8.5%
6.5%
7.0%
8.0%
6.0%
7.0%
7.5%
6.0%
7.0%
7.5%
5.5%
6.0%
6.5%
7.0%
7.5%
8.0%
8.5%
9.0%
9.5%
10.0%
10.5%
Core Value-Add
Opportu-nistic
Core Value-Add
Opportu-nistic
Core Value-Add
Opportu-nistic
Core Value-Add
Opportunistic
7.5%
8.5%
10%
7.5%
8%
9%
7%
7.5%
8%
7%
8% 8%
OfficeGrocery/Discount Anchored Retail
Multi-Family Industrial
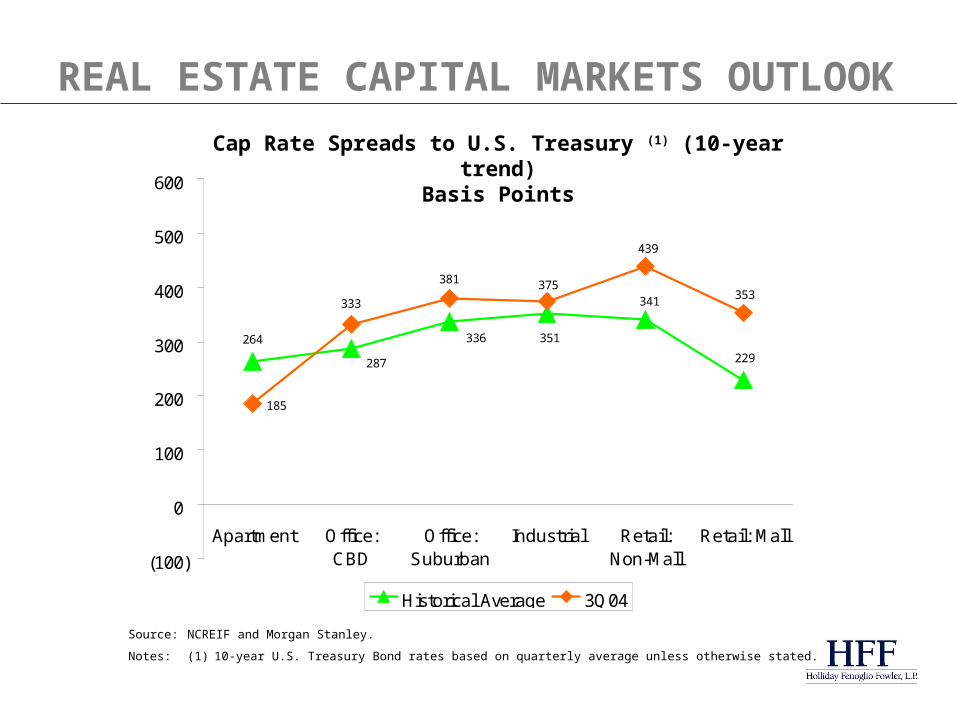
Cap Rate Spreads to U.S. Treasury (1) (10-year trend)Basis Points
185
229
341
351336
287
264
353
439
375381
333
(100)
0
100
200
300
400
500
600
Apartment Office:CBD
Office:Suburban
Industrial Retail:Non-Mall
Retail: Mall
Historical Average 3Q04
Source:NCREIF and Morgan Stanley.
Notes: (1)10-year U.S. Treasury Bond rates based on quarterly average unless otherwise stated.
REAL ESTATE CAPITAL MARKETS OUTLOOK

Exhib it 1 : Cap Rates Didn't Follow Treasuries Down, Why Would They Follow Them Up?
0%
2%
4%
6%
8%
10%
12%
Mar-93 Mar-94 Mar-95 Mar-96 Mar-97 Mar-98 Mar-99 Mar-00 Mar-01 Mar-02 Mar-03 Mar-04
Cap Rates and Interest Rates
0%
2%
4%
6%
8%
10%
12%
14%
16%
18%
20%
Vacancy RateImplied Office Cap Rate Ten-Year Treasury Rate Vacancy Rate
388 bps
135 bps247 bps
Sources: NCREIF; PPR
Office Cap Rates

Food Group Ranking
1.Retail
2.Trophy Office
2.Industrial
2.Multifamily
5.Office
6.Hotel
Food Group Ranking
1.Retail
2.Trophy Office
2.Industrial
2.Multifamily
5.Office
6.Hotel
Trophy Market Ranking
Washington, DC
NYC Metro
San Diego
“Edge” L.A.
Southern Florida
Trophy Market Ranking
Washington, DC
NYC Metro
San Diego
“Edge” L.A.
Southern Florida
Food Groups
Market Recovery
Seattle
Atlanta
St. Louis
Market Recovery
Seattle
Atlanta
St. Louis
REAL ESTATE CAPITAL MARKETS OUTLOOK
Dynamics - Flow Forces (Cont’d)• Mainstream Money Management- No
Longer Fringe Asset Class– Income-producing commercial real estate has
become favored risk-adjusted, fixed-income investment alternative.
– Lenders view real estate debt as attractive alternative to single-credit corporate paper.
– With better Corporate Junk Bonds yielding 6.5%, how is RE overpriced at 7%
REAL ESTATE CAPITAL MARKETS OUTLOOK
Dynamics - Flow Forces (Cont’d)• Allocation Trends Align with
Demographic Drivers– Retiree redemptions LOOM!! Most Important
Factor in All Investing for next Decade!
– Public and private joint venturing with tax-exempt institutions and foreign open-end funds to lever more purchasing power
– Surging syndicated equity drives pricing on the margin- Private REITs (INLAND as icon)
REAL ESTATE CAPITAL MARKETS OUTLOOK

Dynamics - Flow Forces (Cont’d)• Allocation Trends Align with Demographic
Drivers (Cont’d)Surging syndicated equity drives pricing on the margin
(Cont’d)
– Broker-dealer distribution and fee frenzy
– Hedge funds (Farollon – land spec in Mission Bay)
– Individual and Retirement Planning – RE as Standard Diversification Product (TIAA model)
REAL ESTATE CAPITAL MARKETS OUTLOOK
Dynamics - Flow Forces (Cont’d)• Commingled institutional equity rather
than separate account funding propels the tax-exempt fundraising.– More Co-Invest; More Discretion
– Many pension funds have raised RE allocations significantly
– Migration toward European model
REAL ESTATE CAPITAL MARKETS OUTLOOK
• Short-term capital (LIBOR-based) has been very stable.
− Low volatility beta over last 4 years.
− Sophisticated borrowers arbing LIBOR vs. Treasury, “Spread Investing”.
− 50% of securitized debt is unhedged and floating according to HFF data.
REAL ESTATE CAPITAL MARKETS OUTLOOK

• Mezz, Mezz, Mezz!!! Structured finance, especially mezzanine debt and preferred equity, booming. New niches like larger loans, longer-term mezz and aggressive, clubbed A-B packages. “Loan to Own” raiders on the loose.
– Who ISN’T Doing Mezz
– Compressed yields
REAL ESTATE CAPITAL MARKETS OUTLOOK
• Foreign investment capital, with weakening dollar, expanding in 2005
– German funds under scrutiny for yield performance
– Israeli and Middle East investors are very active and aggressive
– Japanese capital returning
REAL ESTATE CAPITAL MARKETS OUTLOOK
• M&A driving REIT market which continues to “cartelize”. REITs outperform S&P and indexed funds (private REITs follow suit)
– Average REIT dividend yield of 4.7% vs. S&P 500 of 1.7%
– REITs up 70% since end of 2002.
– Real estate mutual fund flow of $7.55 B in 2004 vs. $4.5 B in 2003 (75% increase).
REAL ESTATE CAPITAL MARKETS OUTLOOK
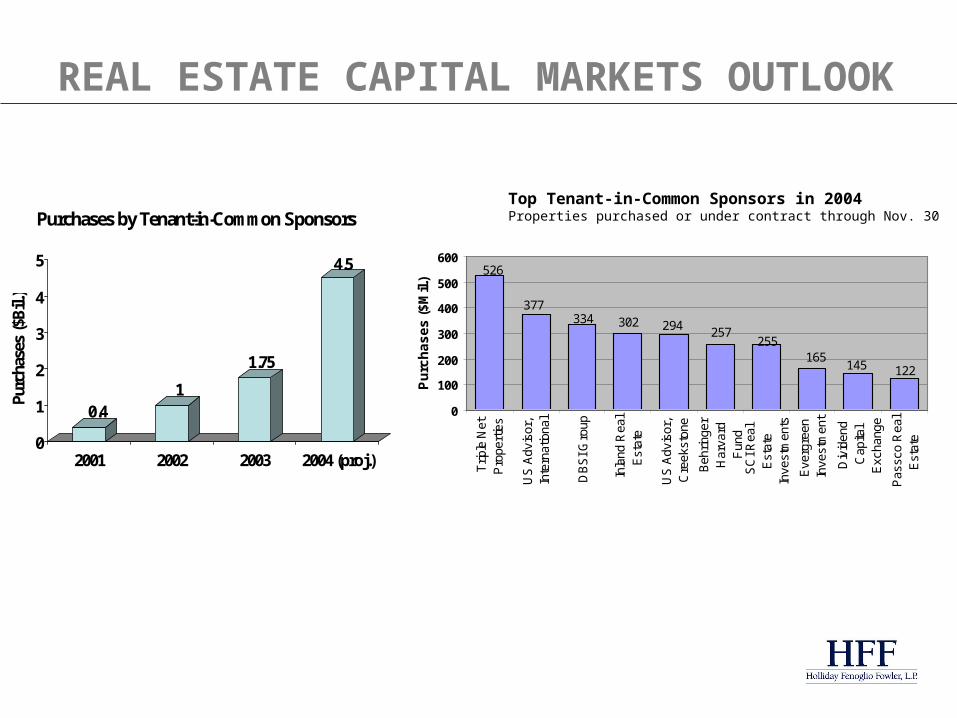
0.41
1.75
4.5
0
1
2
3
4
5
Purc
hase
s ($
Bil.
)
2001 2002 2003 2004 (proj.)
Purchases by Tenant-in-Common Sponsors
526
377334 302 294 257
255165
145 122
0
100
200
300
400
500
600
Trip
le N
etP
rope
rtie
s
US
Adv
isor
,In
tern
atio
nal
DB
SI G
roup
Inla
nd R
eal
Est
ate
US
Adv
isor
,C
reek
ston
e
Beh
ringe
rH
arva
rdF
und
SC
I Rea
lE
stat
eIn
vest
men
ts
Eve
rgre
enIn
vest
men
t
Div
iden
dC
apita
lE
xcha
nge
Pas
sco
Rea
lE
stat
e
Pu
rch
as
es
($
Mil.
)
Top Tenant-in-Common Sponsors in 2004Properties purchased or under contract through Nov. 30
REAL ESTATE CAPITAL MARKETS OUTLOOK

• TIC TAC DOUGH and Fund of Funds = New Drivers
• Improving Fundamentals Too
REAL ESTATE CAPITAL MARKETS OUTLOOK

Pricing• “Stagress” – Stagnant real job
growth (part-time vs. core) yet real economic progress holds down rates. – Oil price increase lags 12-15 months.
REAL ESTATE CAPITAL MARKETS OUTLOOK
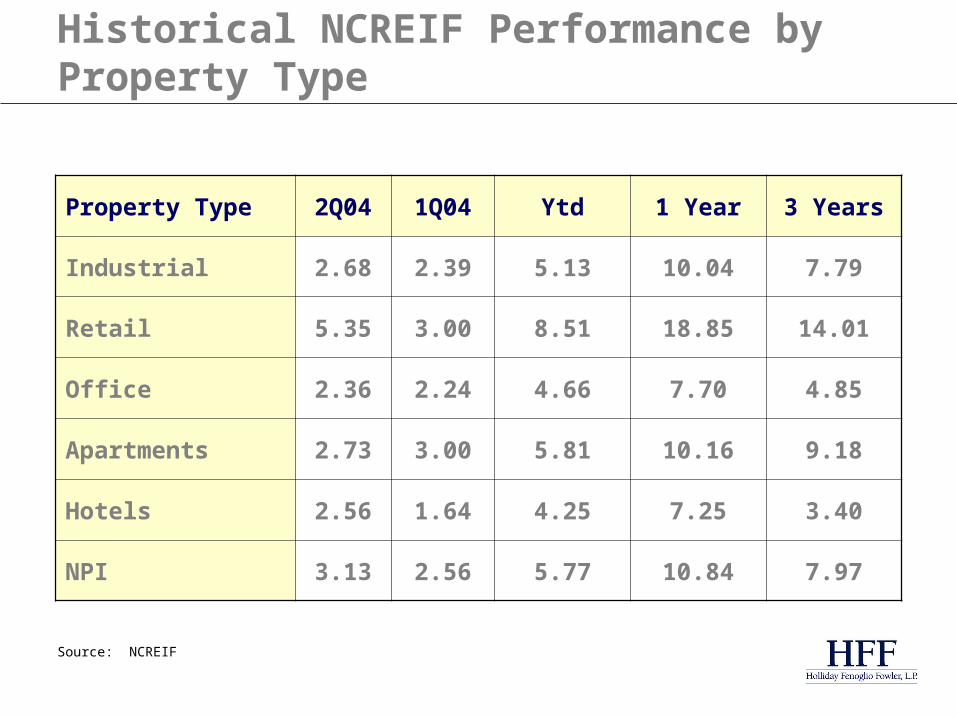
Property Type 2Q04 1Q04 Ytd 1 Year 3 Years
Industrial 2.68 2.39 5.13 10.04 7.79
Retail 5.35 3.00 8.51 18.85 14.01
Office 2.36 2.24 4.66 7.70 4.85
Apartments 2.73 3.00 5.81 10.16 9.18
Hotels 2.56 1.64 4.25 7.25 3.40
NPI 3.13 2.56 5.77 10.84 7.97
Historical NCREIF Performance by Property Type
Source: NCREIF
• Heyday for “infill” and “edge city” locations.
• Fortress mall cap rates fall to lows near 5%. (back to mid 1980s)
• Power centers command premium (all cash IRR of 7.0-7.5, flat returns) for income stability and lease term.
Food GroupsREAL ESTATE CAPITAL MARKETS OUTLOOK

Retail TrendsMajor Retail Segments
Cap Rate* Compression 2001-2005(Median Capitalization Rates)
8.8%
11.0%
10.0%10.5%
10.0%
9.0%
6.50%
5.5%6.0%
8.5%8.0%
7.25%
0.0%
2.0%
4.0%
6.0%
8.0%
10.0%
12.0%
FortressMall
SecondaryMall
PowerCenter
LifestyleCenter
CommunityCenter
NeighborhoodCenter
2001
2005

• Secondary office market sales activity bringing new liquidity to this large segment.
• Large industrial properties are oversubscribed and trade at trophy premium.
• Multifamily, despite economic vacancy, still command pricing power.
Food GroupsREAL ESTATE CAPITAL MARKETS OUTLOOK

• Development sites with entitlements “red hot” as entrepreneurs often with institutional capital, seek higher returns.– Condo conversion mania
• Net lease purchasing at historic highs driven by RELPs, syndicated equity and 1031 exchange capital.
Food GroupsREAL ESTATE CAPITAL MARKETS OUTLOOK
• Land Spec: Fast Growing and Institutionally Driven (JPMF in Inland Empire)
• Note Sales, “Loan To Own”, Partner Recaps: Any Opportunity, Stupid!
Food GroupsREAL ESTATE CAPITAL MARKETS OUTLOOK
• Recognition of True Reproduction Costs and Valuation
• Global acquisitions/M&A
– Mills/Scotland malls
– GEPT Canada
– Blackstone model/precedent
– Galileo/New Plan
– Simon/China JVs
Next
REAL ESTATE CAPITAL MARKETS OUTLOOK
• Foreign capital surge (esp. Debt)
• New Megabank Equity
– Direct /Co-Invest
*Citicorp
• Fractionalization
• Mutual Fund R.E. (evolution from private syndicates; 401K)
Next
REAL ESTATE CAPITAL MARKETS OUTLOOK
• Blowoffs: – Rates above 5.5% and LIBOR spike
*Business Week Survey of Corporate/Wall Street Experts = 5.1% T-10 Consensus
–Condo conversion, presales at Stabilized Value
–Master leases
Next
REAL ESTATE CAPITAL MARKETS OUTLOOK
Related Documents


