Connecting the world’s financial markets Debt Investor Update February 2014

Welcome message from author
This document is posted to help you gain knowledge. Please leave a comment to let me know what you think about it! Share it to your friends and learn new things together.
Transcript

Connecting the world’s financial markets
Debt Investor UpdateFebruary 2014
Connecting the world’s financial markets
Disclaimer
Disclaimer

Connecting the world’s financial markets 3
By reading the presentation slides, you agree to be bound by the following limitations.
This presentation has been prepared for information and background purposes only and the information contained herein (unless otherwise indicated) has been provided by ICAP Group Holdings plc (the “Company”). It is confidential and does not constitute or form part of, and should not be construed as, an offer or invitation to subscribe for, underwrite or otherwise acquire, any securities of the Company or any member of its group nor should it or any part of it form the basis of, or be relied on in connection with, any contract to purchase or subscribe for any securities of the Company or any member of its group (each and "Affiliate") or with any other contract or commitment whatsoever. This document does not constitute an offering document in whole or part and any decision to invest in the offering of any of the Company’s or any Affiliate's securities should be made solely on the basis of information to be contained in in any offering document, or prospectus expressly provided to you in connection with any such offering, and on an independent analysis of the information contained therein. Neither this presentation nor any part of it may be reproduced or redistributed, passed on, or the contents otherwise divulged, directly or indirectly, to any other person (excluding the recipient's professional advisers) or published in whole or in part for any purpose without the prior written consent of the Company.
This presentation does not purport to be all-inclusive or to contain all of the information that a person may require to make a full analysis of the matters referred to herein. None of the Company, and its Affiliates, advisers, connected persons or any other person accepts any liability for any loss howsoever arising, directly or indirectly, from this presentation or its contents.
Any assumptions, views or opinions (including statements, projections, forecasts or other forward-looking statements) contained in this presentation represent the assumptions, views or opinions of the Company as at the date indicated and are subject to change without notice. All information not separately sourced is from Company data.
This presentation includes forward looking statements within the meaning of the securities laws of certain applicable jurisdictions. These forward looking statements include, but are not limited to, all statements other than statements of historical facts contained in this presentation, including, without limitation, those regarding our future financial position and results of operations, our strategy, plans, objectives, goals and targets, future developments in the markets in which we participate or are seeking to participate or anticipated regulatory changes in the markets in which we operate or intend to operate. In some cases, you can identify forward looking statements by terminology such as “aim,” “anticipate,” “believe,” “continue,” “could,” “estimate,” “expect,” “forecast,” “guidance,” “intend,” “may,” “plan,” “potential,” “predict,” “projected,” “should,” or “will” or the negative of such terms or other comparable terminology. By their nature, forward looking statements involve known and unknown risks, uncertainties and other factors because they relate to events and depend on circumstances that may or may not occur in the future. We caution you that forward looking statements are not guarantees of future performance and are based on numerous assumptions and that our actual results of operations, including our financial condition and liquidity and the development of the industry in which we operate, may differ materially from (and may be more negative than) those made in, or suggested by, the forward looking statements contained in

Connecting the world’s financial markets 4
this presentation. In addition, even if our results of operations, including our financial condition and liquidity and the development of the industry in which we operate, are consistent with the forward looking statements contained in this presentation, those results or developments may not be indicative of results or developments in subsequent periods. We undertake no obligation to update or revise any forward looking statement or risk factors, whether as a result of new information, future events or developments or otherwise. The forward looking statements speak only as at the date of this presentation. Each of the Company, other relevant group entities and their respective agents, employees and advisers, expressly disclaims any obligation or undertaking to update any forward looking statements contained herein.
This presentation is distributed only to and directed only at persons who are not, or are not capable of classification as, Retail Clients (as defined in the Markets in Financial Instruments Directive 2004/39/EC) or equivalent applicable local regulatory classification and should not be distributed to any Retail Clients; in the UK, is not being distributed to and must not be passed on to the general public, and may only be distributed to persons who are investment professionals within the meaning of Article 19 of the Financial Services and Markets Act 2000 (Financial Promotion) order 2005 (the “Order”), persons falling within Article 49(2)(a) to (d) of the Order, or persons to whom it may otherwise lawfully be communicated (all such persons being “Relevant Persons”), is directed only at Relevant Persons and must not be acted on or relied on by persons who are not Relevant Persons; in member states of the European Economic Area which have implemented the Prospectus Directive (Directive 2003/71/EC) as amended (the “Prospectus Directive”), is distributed only to, and directed only at, persons who are “qualified investors” within the meaning of the Prospectus Directive and pursuant to the relevant implementing rules and regulations adopted by each relevant member state (“Qualified Investors”).
This presentation is not directed to, or intended for distribution to or use by, any person or entity that is a citizen or resident or located in any locality, state, country or other jurisdiction where such distribution, publication, availability or use would be contrary to law or regulation of such jurisdiction or which would require any registration or licensing within such jurisdiction. This presentation is not for publication, release or distribution in the United States, Australia, Canada or Japan. In particular these materials are not intended for distribution in the United States or to U.S. persons (as defined in Regulation S) under the United States Securities Act of 1933, as amended.

Connecting the world’s financial markets
Introduction

Connecting the world’s financial markets
Executive Summary
• Leading wholesale markets operator and provider of post-trade risk mitigation and information services
• Diversified business model
• Strong portfolio of technology assets acquired and developed over time
• Well positioned to seize opportunities from regulatory changes
• Consistent conversion of profits into free cash flow
• Robust balance sheet and modest gearing
• Investment grade rating
6

Connecting the world’s financial markets
An introduction to ICAP
ICAP is a leading global financial markets operator, providing broking, electronic execution, information and automated services simplifying operational workflow and reducing risk to market participants along the trade life cycle
A strong balance sheet, enabling flexibility to invest in organic growth through new product innovation and pioneering services into new markets
5,000employees in all major financial centres
Local presence in
32 countries,
with over 70locations worldwide
13% of revenue re-invested in technology and innovation
USD1.3 trillion ADV transacted through our platforms
4

Connecting the world’s financial markets
A diverse product offering
Broadest asset class coverage• Rates: Interest rate derivatives, government bonds, repos, cash products and financial futures• FX: Spot and forward exchange, options• Credit: Corporate bonds and credit derivatives• Commodities: Oil, natural gas, power, coal, iron ore, precious metals, shipping• Emerging markets: Latin America, Asia and Russia / Eastern Europe, especially BRIC countries• Equities: principally equity derivatives
Post Trade Risk and InformationServices• Help users of financial
products reduce operationaland system-wide risks
• Empower customers to make trading decisions with market information across key asset classes
• Simplify client workflow via automated advanced tools and Straight Through Processing
Global Broking• Provide access to global pools
of buyers/ sellers to create liquid markets and greater transparency
• Breadth and depth of our operation gives us a significant global footprint
Electronic Markets• Operate a number of fully
electronic platforms in a range of different asset classes and instruments
• Automated platforms allow execution of large deal volumes quickly and easily, with greater transparency
5

Connecting the world’s financial markets
Financial Performance

Connecting the world’s financial markets
Group profit for the year
FY121
£mFY132
£m
Revenue 1,681 1,472
Net operating expenses (1,309) (1,164)
Operating profit 372 308
Net finance charge (24) (29)
Associates 6 5
Profit before tax 354 284
Acquisition & disposal costs (137) (158)
Exceptional items - (60)
Profit before tax (statutory) 217 66
Operating profit margin 22% 21%
Group revenues by product
133 107
154108
167142
204
190
374
339
649
586
FY12 FY13
Rates
FX & MM
Commodities
Emerging mkts
Credit
Equities
£1,472m
£1,681m
7
1 – year ended 31 March 20122 – year ended 31 March 2013

Connecting the world’s financial markets
ICAP’s business mix
£1,172m£997m
£301m
£268m
£208m
£207m
FY12 FY13
Global Broking Electronic Markets Post Trade
£1,472m
£1,681m
Revenue by business Operating profit by business*
Operating profit margin by business*
£153m £105m
£127m£113m
£92m£90m
FY12 FY13Global Broking Electronic Markets Post Trade
£203m66%
£219m59%
13%
11%
42%
42%
44%
44%
0% 10% 20% 30% 40% 50%
FY12
FY13
* Excludes acquisition & disposal costs and exceptional items 8

Connecting the world’s financial markets
Diversified business model
Operating profit & margin*Revenues
76% 75% 72% 70% 68%
16% 16% 17% 18% 18%
8% 9% 11% 12% 14%
FY09 FY10 FY11 FY12 FY13
59%52%
46% 41%34%
24%28%
33%34%
37%
17% 20% 21% 25% 29%
FY09 FY10 FY11 FY12 FY13
£1,585m £1,472m£1,741m £1,681m£1,605m £365m23%
£354m22%
£372m22%
£375m22%
£308m21%
Global Broking Electronic Markets Post Trade
* Excludes acquisition & disposal costs and exceptional items
66%
41%
9

Connecting the world’s financial markets 13
FY12£m
FY13£m
Global Broking
Above analysis excludes acquisition and disposal costs and exceptional items.
Revenues by region
Revenue 1,172 997
Operating profit 153 105
Margin 13% 11%
Number of brokers 2,347 2,195
562479
131
1,172
488397
112
997
-
£200m
£400m
£600m
£800m
£1,000m
£1,200m
EMEA Americas Asia Pacific Total
FY12 FY13
Cost savings by region
Staff costs as % of revenue
£21m
£27m
£16m
£20m
£5m
£5m
0 10 20 30 40 50 60
FY12
FY13
EMEA Americas Asia Pacific
£52m
£42m
57%
63%
55%
59%58%
61%
57%59%
57%
60%
51%
57%
45%
50%
55%
60%
65%
EMEA Americas Asia Pacific Global BrokingFY12 FY13 H1 FY14

Connecting the world’s financial markets
FY12£m
FY13£m
US Treasuries – Average Daily Volumes
14
Electronic Markets
Revenue mix
Spot FX – Average Daily Volumes
Above analysis excludes acquisition & disposal costs and exceptional items
Revenue 301 268Revenue - constant rate 305 266
Operating profit 127 113Operating profit – constant rate 128 111
Margin 42% 42%
Headcount 542 512
FY13FY12
137121
10
£301m 155131
15
50
100
150
200
250
Apr May Jun Jul Aug Sep Oct Nov Dec Jan Feb Mar$bn/day FY12 FY13 FY14
FY12: $130bn/day
FY13: $119bn/day
FY14 (10 mths): $156bn/day
50
100
150
200
Apr May Jun Jul Aug Sep Oct Nov Dec Jan Feb Mar$bn/day FY12 FY13 FY14
FY12: $152bn/day FY13:
$116bn/day
FY14 (10 mths): $95bn/day
£268m
EBS
BrokerTec
Other

Connecting the world’s financial markets 15
FY12£m
FY13£m
Post Trade Risk & Information
Revenue mix
Traiana – FX volumes triResolve – number of customers
Revenue 208 207Revenue – constant rate 207 207
Operating profit 92 90Operating profit – constant rate 91 91
Margin 44% 44%
Headcount 459 521
31%
53
4337
75
£208m
47
44
43
73
Reset & ReMatch
TriOptima
Traiana
Information
£207m
Above analysis excludes acquisition & disposal costs and exceptional items
FY13
3647
-5
101520253035404550
H1 FY13 H1 FY14
FY12
200
300
400
500
600
700
800
900
Oct 12 Jan 13 Apr 13 Jul 13 Oct 13 Jan 14
207%
Avg monthly transactions(millions)

Connecting the world’s financial markets 16
Net operating expenses
Net operating expenses by type Net operating expenses reconciliation
Headcount Cost savings
Above analysis excludes acquisition & disposal costs and exceptional items
960 824
159136
190204
-
£250m
£500m
£750m
£1,000m
£1,250m
£1,500m
FY12 FY13
Other
IT
Employee
£1,164m£1,309m
5,1234,976 4,885
24712738
6236
4,600
4,800
5,000
5,200 5%
£20m
£60m
£5m
FY12
FY13
FY14
Achieved in year Annualised Total
£80m
£25m
11%
1,309
1,164
6074 11
£1,000m
£1,100m
£1,200m
£1,300m

Connecting the world’s financial markets
Efficient conversion to cash
17
£233m £228m£260m £259m
£211m
£296m£264m
£210m
£268m £274m
FY09 FY10 FY11 FY12 FY13
Profit after tax Ongoing free cash flow
CashConversion 127% 116% 81% 103% 130%
Acquisitions(net of cash acquired) £200m £149m £29m £27m £12m
Dividends paid £106m £92m £135m £135m £145m
Movement in net debt £(67)m £(22)m £68m £79m £107m
Above analysis excludes acquisition & disposal costs and exceptional items
Two year moving average of 101%
conversion

Connecting the world’s financial markets
Gross and net debt
18
Gross debt / EBITDA* 1.4 1.7 1.3 1.4 1.6
Net debt / EBITDA* 0.5 0.6 0.4 0.2 n/a
(750)
(600)
(450)
(300)
(150)
-
150
300
450
600
FY09 FY10 FY11 FY12 FY13
£m
Cash and cash equivalents Gross debt Net debt
* Excludes acquisition & disposal costs and exceptional items

Connecting the world’s financial markets
Current outlook
19
Interim management statement on 5 Feb 2014.....Management’s expectations for PBT (before acquisition and disposal costs andexceptional items) for the full year remain unchanged, on a constant currency basis…..
Michael Spencer, Group Chief Executive Officer, said: “Trading activity across many marketswas down in the third quarter, compared to the prior year, with a slower December than weanticipated. Although market conditions remain difficult, we saw a modest improvement inactivity in January as the on-going debate about the Federal Reserve quantitative easingprogramme continued.
“Innovation is vital for our success and our strong cash generation allows us to continue toinvest in our future growth. The launch of the ICAP SEF was a very important project. Wehave had tremendous feedback from customers to our SEF and I am pleased that it is themarket leader in interest rate swaps. We are also seeing the tangible benefits of ourinvestments in post trade, as the regulatory push for risk mitigation drives demand for oursolutions.”

Connecting the world’s financial markets
Current Environment

Connecting the world’s financial markets
Wholesale markets are evolving
21
Impacts
Regulation• Increased importance of e-trading capabilities• Blocks and less liquid instruments harder to trade• Increased compliance cost
Customers• Growing importance of buy-side• Bank deleveraging not fully complete• Expect increased intermediation of OTC activity
Competition• New players emerging e.g. exchanges• New technology-driven trading venues – will need
liquidity for success
Products
• Banks are scaling back from capital intensive products
• Mandate for pre/post-trade transparency and reporting
Structural changes
Increased electronic trading
A new competitive landscape and a wider customer base
Intermediation of trade volumes on to SEFs
Bank deleveraging and shift from structured to flow products
Mandatory centralised OTC clearing and potential futurisation
Increased demand for post-trade risk mitigation services
1
2
3
4
5
Key change drivers
6

Connecting the world’s financial markets
Swap Execution Facility (“SEF”)
• Launched Oct 2013 in response to Dodd Frank Act for transparent OTC derivatives market per G20 objectives from 2009
• Opportunities– expanded customer footprint– electronic trading of interest rate derivatives on iSwap– expansion of Traiana in pre-trade screening
• Mandatory execution and clearing started 17 Feb 2014– certain interest rate and credit default swaps– gradual expansion to include other derivatives– softer launch with EU agreement and ruling for ‘packaged’ trades
22

Connecting the world’s financial markets
TraianaMarket leader in post trade processing • Network of 500+ clients from banks,
brokers, platforms and buyside• Global presence – New York, Chicago,
London, Hong Kong, Tokyo, Singapore• Processes average $1.5trn daily and 3m
messages
Solutions for new regulatory world• CCP Connect
Matching FX derivative trades cleared through LCH
• TR ConnectReporting OTC trades to repositories in Europe (EMIR), US (Dodd Frank) and Asia Pacific
• CreditLinkPre/post-trade credit screening and limit management across multiple venues (SEFs)
23

Connecting the world’s financial markets
TriOptima
triReduce• major multilateral compression to
remove unnecessary OTC trades• 200+ regular clients and $350 trn+
value compressed since 2003• reduces client Basel III capital costs
and helps improve leverage ratio
triResolve• reconciling OTC derivatives – regular
volume of 7m trades• 800 clients and 265,000 reconciliations
weekly• real-time reporting and exception
resolution for clients to avoid disputes and margin calls
24
Confidence, product & support
Award winning, market leader in risk mitigation and termination solutions

Connecting the world’s financial markets
EBS Direct
• Development of EBS platform (acquired 2006) – largest liquidity source in spot FX market
• Allows custom pricing for spot FX to disclosed clients
• Provides alternative for banks without own platform
• Average daily volume of $2bn in Jan
• Opportunity to extend to other asset classes
25
Confidence, product & support
Distribution, liquidity & best execution
Relationships & trust
Ecosystem & liquidityoptimization
Confidence, product & support
0
20
40
60
80
100
120
140
Apr 13 May 13 Jun 13 Jul 13 Aug 13 Sep 13 Oct 13 Nov 13 Dec 13 Jan 14
No.
of u
niqu
e co
unte
rpar
ties
EBS Direct Beta Post-launch
Avg Daily Volume ($m) Unique counterparties
EBS Direct is bringing new customers to EBS.Approximately 50 new customers in 2013.

Connecting the world’s financial markets 26
Ongoing priorities
• Leverage our comparative advantage
• Seize opportunities from regulatory developments – transparency, risk reduction, resilience and auditability
• Continue to deliver innovative solutions in changing market environment
• Improve the efficiency and cost discipline of the organisation
• Reinforce cultural values and best practices

Connecting the world’s financial markets
Debt Considerations

Connecting the world’s financial markets
Debt profile at 30 Sep 2013
Gross debt by currency
Gross debt interest exposure
22%
34%
44%
Fixed
USD
GBP
EUR
Floating
Note: 5Y €300m notes shown under EUR although swapped into GBP.
28
Financing Maturities
-
£50m
£100m
£150m
£200m
£250m
£300m
£350m
£400m
£450m
FY15 FY16 FY17 FY18 FY19 …… FY24
GBP50m term loan EUR300m notes USD193m PP notes
GBP425m RCF GBP125m retail bond EUR15m note
57%
43%

Connecting the world’s financial markets
Corporate structure
ICAP plc
ICAP Group Holdings plc Intercapital Limited
ICAP America Investments
Limited
ICAP Holdings (Asia Pacific)
Limited
ICAP Holdings Limited
ICAP Europe Limited
ICAP ElectronicBroking LLC
Reset PrivateLimited
EBS Service Company Limited
ICAP Securities USA LLC
TriOptima AB ICAP Brokers Pty Limited
Principal subsidiary (>5% EBITDA)
Holding company
29

Connecting the world’s financial markets 30
Credit ratings
• Coverage initiated in 2009 with Moody’s and Fitch
• Current position:
– Moody’sLT rating of Baa2 with negative outlookOpinion last updated on 7 Jan 2014Lead analyst: Michael Eberhardt ([email protected])
– FitchLT rating of BBB with stable outlookResearch report issued on 7 Jan 2014Lead analyst: Erwin van Lumich ([email protected])

Connecting the world’s financial markets
Appendices

Connecting the world’s financial markets 32
Global Executive Management Group
Duncan WalesGroup General Counsel
Iain TorrensGroup Finance Director
John NixonGroup Executive Director
Americas
David CastertonCEO
Global Broking
Gil MandelzisCEO EBS
Executive Chairman Traiana
Seth Johnson Co-CEO BrokerTec
CEO ISDX
Ken PigagaGroup Chief Operating
Officer
= Board Member
Michael SpencerGroup CEO
Laurent Paulhac
Hugh GallagherCEO
Asia Pacific

Connecting the world’s financial markets
• Board of directors oversees risk, control and compliance functions
• Clear division of roles and responsibilities between Chairman and Group CEO
• Day-to-day business delegated to Global Executive Management Group – three Board and eight business leaders
Risk governance
Board
Group Chief Executive Officer
Global Executive Management Group
Group Chief Operating Officer
Group General Counsel
Global Operating Committee Internal Audit
Group Risk and Capital
Committee
Audit and Risk Committees
External Audit
33
Group Chief Risk Officer
Group Head of Compliance
Direct reporting authority
Delegated authority

Connecting the world’s financial markets
Three Lines of Defence
34
Connecting the world’s financial markets 35
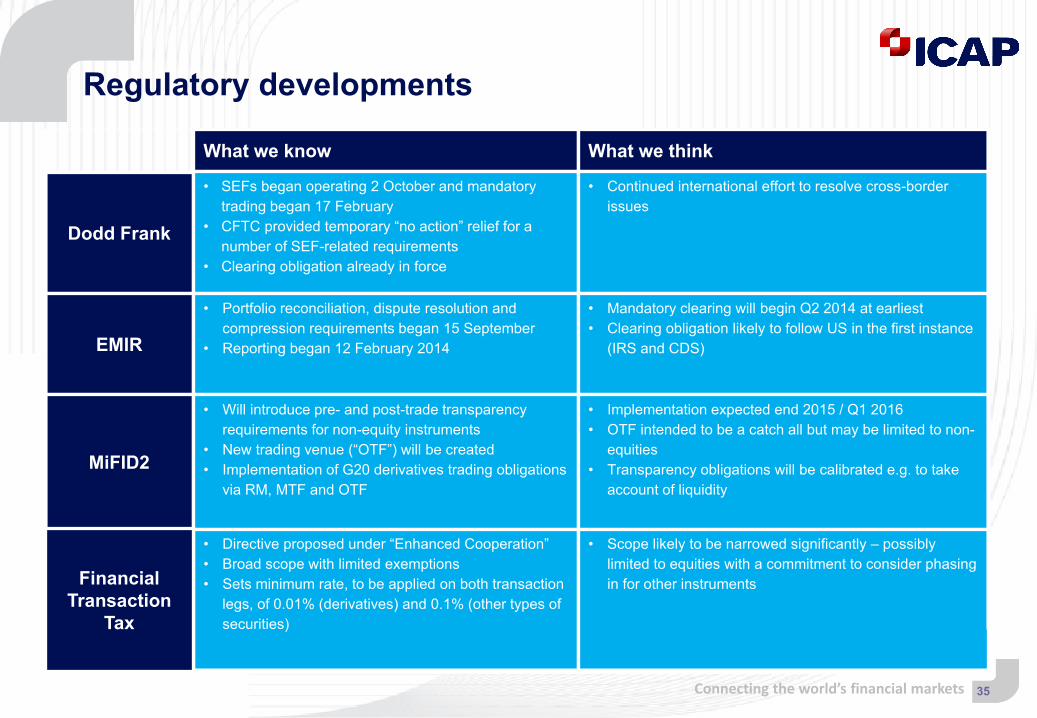
Regulatory developments
Dodd Frank
What we know What we think
• SEFs began operating 2 October and mandatory trading began 17 February
• CFTC provided temporary “no action” relief for a number of SEF-related requirements
• Clearing obligation already in force
• Continued international effort to resolve cross-border issues
EMIR
• Portfolio reconciliation, dispute resolution and compression requirements began 15 September
• Reporting began 12 February 2014
• Mandatory clearing will begin Q2 2014 at earliest• Clearing obligation likely to follow US in the first instance
(IRS and CDS)
MiFID2
• Will introduce pre- and post-trade transparency requirements for non-equity instruments
• New trading venue (“OTF”) will be created• Implementation of G20 derivatives trading obligations
via RM, MTF and OTF
• Implementation expected end 2015 / Q1 2016• OTF intended to be a catch all but may be limited to non-
equities• Transparency obligations will be calibrated e.g. to take
account of liquidity
• Directive proposed under “Enhanced Cooperation”• Broad scope with limited exemptions• Sets minimum rate, to be applied on both transaction
legs, of 0.01% (derivatives) and 0.1% (other types of securities)
• Scope likely to be narrowed significantly – possibly limited to equities with a commitment to consider phasing in for other instrumentsFinancial
TransactionTax

Connecting the world’s financial markets 36
Central committed financing
Facility Borrower Issue Date Amount Maturity Purpose
Term loan facility ICAP Group Holdings plc Sep 2013 GBP50m Sep 2014 General corporate purposes
Syndicated revolving credit facility including USD 200m swingline
ICAP Group Holdings plc Jun 2013 GBP425m Dec 2016 General corporate purposes
Programme Issuer Issue Date Amount Maturity Cusip / ISIN No
Global MTN ICAP Group Holdings plc Jul 2009 EUR300m Jul 2014 XS0441744645
US Private Placement Intercapital Limited [1] Jun 2005 USD193m Jun 2015 n/a
Global MTN ICAP plc [2] Jul 2012 GBP125m Jul 2018 XS0805454872
Global MTN ICAP plc [2] May 2013 EUR15m May 2023 XS0935766674
Bank Facilities
Issued Notes
1 – Guaranteed on subordinated basis by ICAP plc2 – Guaranteed by ICAP Group Holdings plc

ICAP plc2 Broadgate, London EC2M 7UR+44 (0) 20 7000 5000www.icap.com
Connecting the world’s financial markets
Related Documents