Debt Investor Discussion Pack For the full year ended 30 June 2018

Welcome message from author
This document is posted to help you gain knowledge. Please leave a comment to let me know what you think about it! Share it to your friends and learn new things together.
Transcript

Debt Investor Discussion Pack
For the full year ended 30 June 2018

FY18 Results UpdateCapital, Funding & LiquidityCredit QualityStrategyEconomics

Transformation underway
3
• Fixing mistakes and resolving complaints
• Continued progress on financial wellbeing
Customer and community
Culture and governance • New leadership team – 6 new appointments
• Renewed purpose and values
• Remuneration consequences for executives
Regulatory engagement • AUSTRAC and BBSW settled
• Significant investment in Financial Crimes
• APRA endorsed action plan
Stronger, simpler portfolio • Wealth and mortgage broking businesses demerger
• NZ life sale completed ($1,275m)
• BoComm Life sale signed ($668m)
• Tighter international portfolio
Solid underlying results in a challenging year
Underlying business fundamentals remain strong
4
Core banking businesses
• Retail and business banking
- Australia and New Zealand
• Institutional banking
- clients with links to Australia
Demerger and divestments
• Wealth management
• Mortgage broking
• Life insurance
• South Africa
Strategic review
• General Insurance
• VIB (Vietnam)
• PTCL (Indonesia)
90+%of FY18NPAT
Simplify our business

5
Cash NPAT1,2 ($m) NIM1 C:I ex one-offs1,2 Cash ROE1,2
+3.7%
9,6529,233
FY17 FY18
210215
FY17 FY18
41.2%41.1%
FY17 FY18
15.6%
14.1%
FY17 FY18
+5 bpts (10)bpts (30)bpts
Cash EPS1,2 (cents)
560.8528.6
FY17 FY18
+2.2%
FY 18 Result overview
15.3%
573.1ex one-offs
ex one-offsex one-offs
1. Presented on a continuing operations basis. 2. Excludes one-off items – see slide 17 for a full list of one-off items. 3. Internationally comparable capital - refer to glossary for definition.
DPS (cents)
429 431
FY17 FY18
+ 2 cents
CET1 (APRA) CET1 (International)3
flat
10.1% 10.1%
Jun 17 Jun 18
15.6% 15.5%
Jun 17 Jun 18
(10)bpts
778

5,193
1,888
1,121 1,143 681
133568 257
(33)102
Retail BankingServices
Business &Private Bank
InstitutionalBank &Markets
ASB (NZ) Bankwest IFS -China & PTBC
NewCo LifeInsurance IFS -
Other
GeneralInsurance
+65%
Good contributions across the portfolio
Cash NPAT
6
+5%
+4%
+18%
FY18 vs FY17
3
$mDemerger /
Strategic Reviews
2
+13%+6%
4
+25% +5%
CommInsure Life 160
Sovereign 96
BoComm 15
Other (14)
TymeDigital (78)
PTCL 28
VIB & Other 17
+12%(14%)
5
90+% of Group NPAT
1. Calculation based on the sum of the BU NPAT figures presented above and the FY18 cash NPAT (continuing operations) contribution from Other which was a loss of ($1,366m). 2. Includes
NPAT impact of AHL and eChoice. 3. Result in NZD. 4. Includes IFS corporate centre. 5. The pro-forma financial disclosures above provide an unaudited and indicative view of the businesses
that CBA intends to demerge (NewCo) as announced by CBA on 25 June 2018. The information provided above is for information purposes only and is not a representation or forecast of the
financial position or future performance of NewCo. Past performance and trends should not be relied upon as being indicative of future performance. Further information regarding the demerger
and NewCo will be provided to shareholders in due course. NewCo includes some elements currently disclosed in other divisions.
1

Net Interest Income1
7
17,543
18,341
371
341
(85) 171
+2 bpts
FY17 Volume AssetPricing
FundingCosts
Portfolio Mix FY18
$m
Margin: +5 bpts
+4 bpts (1)bpt
1. Presented on a continuing operations basis.
2. Average interest earning assets.
2
Repricing of interest only
and investor home loans to
manage to regulatory
requirements
Volume: +2.3%
Favourable change in funding
mix from strong growth in
transaction deposits
Home Loans +3.7%
Business Loans +1.7%
NII growth driven by margin gains from asset repricing and volume growth
+4.5%
Bank levy and increased
wholesale funding cost
offset by deposit repricing

199 58 30 (34)
10,22910,547
FY17(ex one-offs)
Elevated Risk &Compliance Costs
SoftwareImpairments
SoftwareAmortisation
Staff Other FY18(ex one-offs)
Operating expenses1
8
1. Presented on a continuing operations basis. 2. Combined total of $389 million additional provisions for the year ended 30 June 2018. This comprises new risk and compliance provisions of $234
million (a $199 million increase on FY17) and one-off regulatory costs of $155 million. These provisions relate to: Financial Crimes Compliance, ASIC investigation, shareholder class actions,
AUSTRAC proceedings, Royal Commission and APRA Prudential Inquiry.
Elevated risk and compliance costs the largest contributor to expense growth
$m
65
Includes wage inflation partly offset by
lower incentives
+3.1%
Lower IT rebates 59
BBSW 25
Lower advice & other provisions (73)
Lower non reg. professional fees (41)
Property & Other (4)
Includes $35m2
of FY17 risk and
compliance costs
Excludes $155m2
one-off regulatory
costs
2
Includes Financial Crime
Compliance Program of Action

Group margin1
9
bpts
1. Comparative information has been restated to conform to presentation in the current period. Presented on a continuing operations basis.
FY16 FY17 FY18
213210
215
Up 5 bpts over the year, but lower home loan margins and basis risk impacted 2H18
Largely the benefit of last year’s
asset repricing
12 Months 6 Months
216
214(1)
(2)1
1H18 AssetPricing
FundingCosts
Capital &Other
2H18
Higher basis risk (2)
Long term wholesale funding (2)
Deposit repricing +2
Higher New
Zealand NIM
HL discounting and switching (2)
Lower institutional lending +1

73
41
2521 20
16 16 1915 15
FY09Pro
Forma
FY10 FY11 FY12 FY13 FY14 FY15 FY16 FY17 FY18
10
Credit risk - Loan Impairment Expense
1. Cash LIE as a percentage of average GLAA (bpts). FY09 includes Bankwest on a pro-forma basis and is based on LIE for the year. Statutory LIE for FY10 48 bpts and FY13 21 bpts.
2. Includes Other.
Credit risk outcomes broadly stable this period – LIE at 15 basis points
Group
Basis Points of GLAA1
Bpts FY17 FY18
Retail Banking
Services 20 20
Business & Priv Bank 5 11
Inst Bank & Markets 6 8
Bankwest 14 7
ASB (NZ) 9 10
Group2 15 15
LIE/GLAA
Consumer 18
Corporate 10

Credit risk - consumer arrears
111. Consumer arrears includes retail portfolios of CBA (Retail Banking Services, Business and Private Banking), Bankwest and New Zealand.
2. Excludes Reverse Mortgage, Commonwealth Portfolio Loan (CBA) and Residential Mortgage Group (CBA) loans.
Higher home loan arrears and consumer collective provisions reflecting pockets of stress
1.34%
1.46%1.41% 1.44%
1.05%
0.99%1.03%
1.03%
0.54%0.60%
0.70%
Jun 15 Dec 15 Jun 16 Dec 16 Jun 17 Dec 17 Jun 18
Personal Loans
Home Loans2
Credit Cards
841 803 808
1,195 1,158 1,199
711 811 756
2,747 2,772 2,763
Jun 17 Dec 17 Jun 18
Corporate
Consumer
Overlay
Collective ProvisionsArrears1, 90+ Days $m
0.52%
%

841 803 808
1,195 1,158 1,199
711 811 756
2,747 2,772 2,763
Jun 17 Dec 17 Jun 18
723 724614
257 254
256
980 978
870
Jun 17 Dec 17 Jun 18
12
Provisioning
Individual$m
Corporate
Consumer
Overlay
Collective
Higher consumer collective provisions
$2.76bn
$3.82bn
AASB 139 AASB 9
+$1.06bn
Provision Coverage1
0.75%
30 Jun 18 1 Jul 18
1.03%
AASB9 Impact on Collective
Provision (from 1 July, 2018)
1. Represents collective provisions divided by credit risk weighted assets

52%38%
10%
12%
38%50%
FY17 FY18
591
612
592 724
FY17 FY18
13
Investment spend
1. Comparative information has been restated to conform to presentation in the current period. 2. The prioritisation of investment toward improving management of non-financial risk is
expected to continue, including addressing recommendations made by APRA’s Prudential Inquiry. Risk and Compliance spend, including that on Financial Crimes Compliance, is
expected to be more than 50% of total FY19 investment spend.
Investment spend1
% of total
Investment expense up 22% on higher financial crimes compliance costs
Expensed
Capitalised
$m
Investment spend1
+22%
+4%
1,183
1,336
Productivity & Growth
Risk & compliance
Branches & Other
Expected to
remain above
50%2
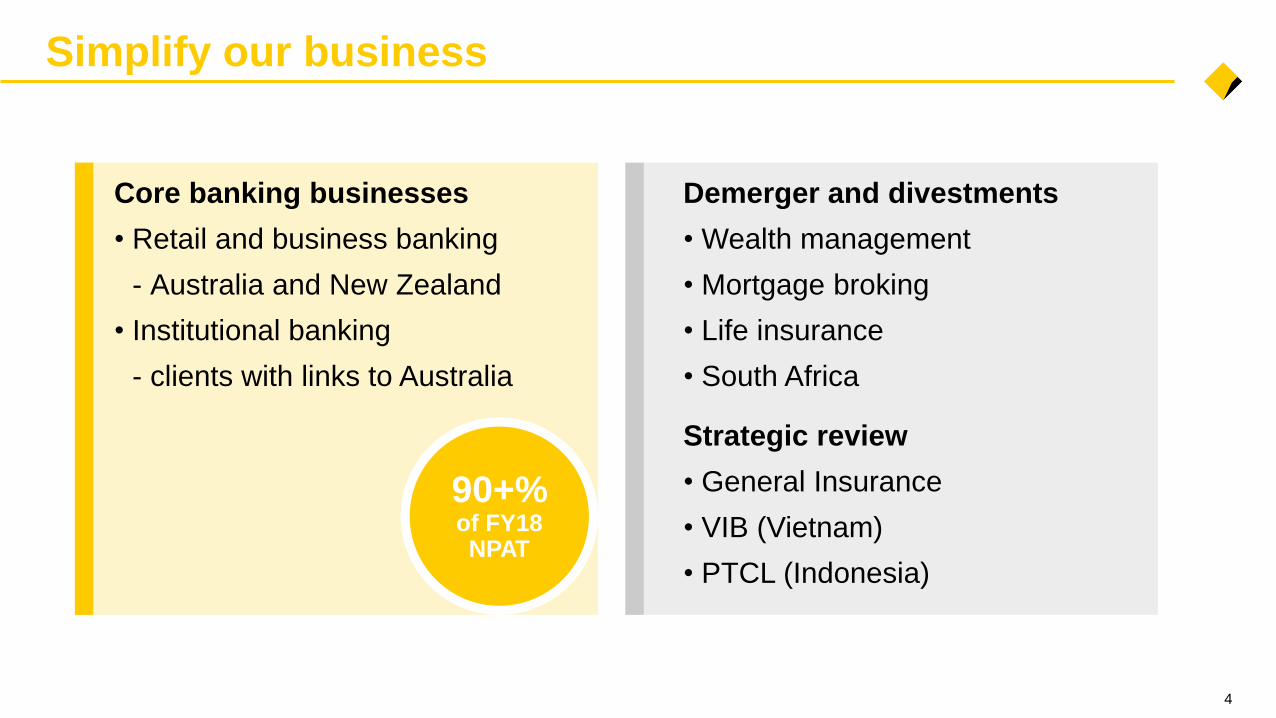
NSFR
Jun 17 Jun 18
67%68%
Jun 17 Jun 18
Deposit Funding
Balance sheet strength
14
107%
Jun 17 Jun 18
112%
Strong funding and liquidity, pro-forma CET1 capital at 10.7%
Transaction
Balances
+10.6%
Strengthening
of the balance
sheet
CET1
10.4%10.1%
10.7%
Organic +32
One-offs (52)
Other (10)
Dec 17 Jun 18 Jun 18
Pro-forma
Post divestments1
LCR = Liquidity Coverage Ratio. NSFR = Net Stable Funding Ratio. CET1 = Common Equity Tier 1 Capital.
1. Includes impact of AASB 9 & AASB 15, and divestments of Sovereign, CMLA and BoComm Life.
% of total funding
bpts
LCR
131%129%
Liquid
assets
$137bn
APRA

Group margin – key sensitivities
15
Basis Risk and Replicating Portfolio
%
Every 5 bpts of elevated BBSW/OIS
spread costs ~1 bpts of Group NIM
Basis Risk Replicating Portfolio
RBA Official
Cash Rate
Replicating Portfolio
Hedge Rate
Cash Rate Forecast
(Market Implied)
Replicating Portfolio
Jun 07 Jun 18
1.0%
0.5%
0.0%
Bottoming of rate cycle = lower
benefits (~2 bpts of NIM drag in FY19)
Jun 18Jun 07
7.0%
5.0%
3.0%
0.0%
Avg
30
bpts

1. Cash NPAT inclusive of discontinued operations. 2. Full year payout ratio excluding the impact of the $700m AUSTRAC penalty.
256 266228
290
320334
364
401420 420
429 431
75%2
ex AUSTRAC
74%
75%78%
74% 73%76% 76% 75% 75% 77% 75%
80%
FY07 FY08 FY09 FY10 FY11 FY12 FY13 FY14 FY15 FY16 FY17 FY18
Dividend
16
cents per share
Cash NPAT1 Payout Ratio
Final dividend of $2.31 - full year $4.31, payout ratio of 75% ex AUSTRAC

Deposits, Funding and Liquidity

4
33
9 10
(24)
(21)
(11)
Equity Long Term Issuances Long Term Maturities Short Term Funding Customer Deposits Lending HQLA Assets
Funding overview
12 months to June 18
Source of funds Use of funds$bn
1. Reported at historical FX rates. 18
Portfolio 5.1 yrs
112% NSFR68%
Deposit
Funded
131%
LCR
1
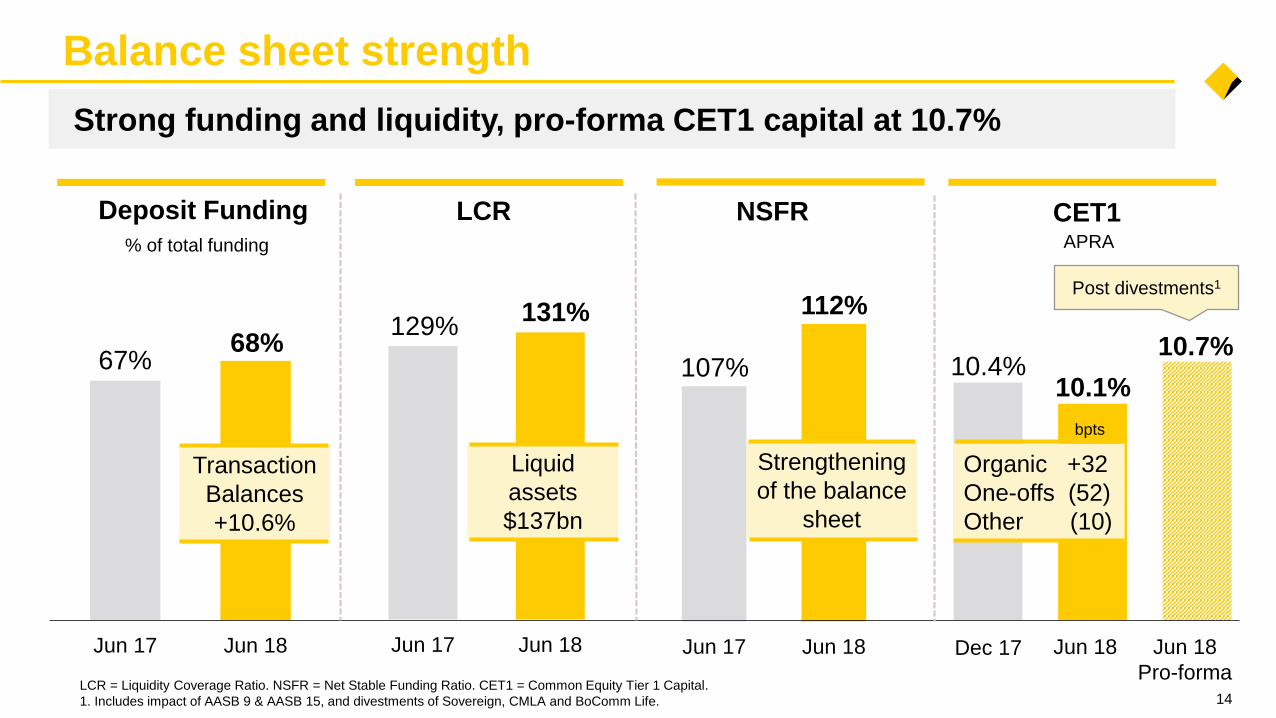
Over the last 12 months, the Group continued to strengthen its funding position
Core Funding Gap $2bn
1.5
3.3
0.7 1.6 (1.6) (0.5)
Jun 17 Capital Retail/SMEDeposits
WholesaleFunding & Other
Residential Mortgages ≤35%
risk weight
Other Loans Liquids & OtherAssets
Jun 18
Residential Mortgages ≤ 35%
risk weight
Other Loans
Liquids and Other Assets
Capital
Retail/SME Deposits
Wholesale Funding & Other
Required Stable Funding Available Stable Funding
Customer deposits
Wholesale Funding
Other
Internal RMBS
Repo-eligible
Cash, Gov, Semis
Liquid assets Net cash outflows
5.0
3.8
3.7
(9.8)
(0.7)
Jun 17 Liquid Assets CLF Customerdeposits
Wholesale funding Other Jun 18
NSFR
Funding and Liquidity Metrics1
19
112
107
NSFR (%) FY17 vs FY18
LCR LCR (%) FY17 vs FY18
104
137
635569
131129
Jun 18
Jun 18 %
%
1. All figures shown on a Level 2 basis. 2. ‘Other assets’ includes non-performing loans, off-balance sheet items, net derivatives and other assets. 3. This represents residential mortgages with
risk weighting ≤35% under APRA standard APS112 Capital Adequacy: Standardised Approach to Credit Risk. 4. includes all interbank deposits that are included as short term wholesale funding.
2
2
4
4
CLF
53.3
$bn
$bn
131%
112%
The Group continues to maintain strong funding and liquidity positions
3
3

0
20
40
60
80
100
120
140
160
Retail / SMEStable
Retail / SMELess stable
Retail / SMEHigh runoff
All Operationalaccounts
Corp/Gov NonOperational
FI NonOperational
CBA
Peer 1
Peer 2
Peer 3
253 210
126 118
234
214
205 148
CBA Peer 3 Peer 2 Peer 1
Deposit funding
1. System source: APRA Monthly Banking Statistics. Total deposits (excluding CD’s). CBA includes Bankwest. 2. Source: 31 March 2018 Pillar 3 Regulatory Disclosure; CBA reported as at 30
June 2018. 3. Peer comparisons are calculated from disclosures assuming there are not material balances in the “notice period deposits that have been called” and the “fully insured non-
operational deposits” categories. 20
Deposits in LCR calculation
5% 10% 25% 25% 40% 100%
30 day Net Cash Outflow assumptions
3 3 3 3
The Group maintains the highest share of stable, household deposits in Australia
Household
deposits
Other
deposits
As at 30 June 2018 ($bn)
Peers as at 31 March 20182
CBA overweight
more stable deposits
Deposits vs Peers1
Jun 18 ($bn)
266
331
424
487

13.9% 14.3%
6.8% 6.9%
12.8%
RBS BPB IB&M BW NZ
126,780 142,916 158,012
FY16 FY17 FY18
+24.6%
Group Transaction Balances1 Transaction Balance Growth1
$m FY18 vs FY17
Group
10.6%
+10.6%
957 1,071 1,121
FY16 FY17 FY18
Deposit funding – transactions
21
128.1 127.5
65.5 67.1
54.9 62.5
Jun 17 Jun 18
Retail Bank New Transaction Accounts4
# ‘000 $bn
Retail Deposit Mix
Savings7 & Investments
Online6
Transactions5257.1248.5
+13.9%
1. Includes non-interest bearing deposits. 2. Includes pooling facilities. 3. Denominated in NZD. 4. Number of new RBS personal transaction accounts, excluding offset accounts. 5. Includes
non-interest bearing deposits and transaction offsets. 6. Online includes NetBank Saver, Goal Saver and Business Online Saver. 7. Includes savings offset accounts.
Over one million new personal transaction accounts were opened in FY18
32

Wholesale funding
1. Long term wholesale funding (>12 months). 2. Indicative funding costs across major currencies. Represents the spread in BBSW equivalent terms on a swapped basis.
Wholesale Funding
Weighted Average Maturity1
22
Jun 17 Dec 17 Jun 18
Portfolio (yrs)
New Issuance (yrs)
5.15.2
9.08.9
4.167%
Long
Term
4.6
60%
Long
Term
Lengthened at favourable rates, reducing refinancing risk – cost pressures emerging
0.50%
1.00%
1.50%
2.00%
2.50%
3.00%
Jun 10 Jun 12 Jun 14 Jun 16 Jun 18
10yr market
funding cost
5yr market
funding cost
28 28
34
FY2012-18 FY2019-21
Average Annual Maturity
Average Annual Issuance
$bn
FY12 - FY18 FY19 – FY21
Indicative Funding Costs2
5
10
15
20
25
30
35
40
45
50
Jun 14 Jun 15 Jun 16 Jun 17 Jun 18 Jun 19 Jun 20 Jun 21 Jun 22 Jun 23 > Jun 23
Securitisation
Covered Bond
Long Term Wholesale Debt
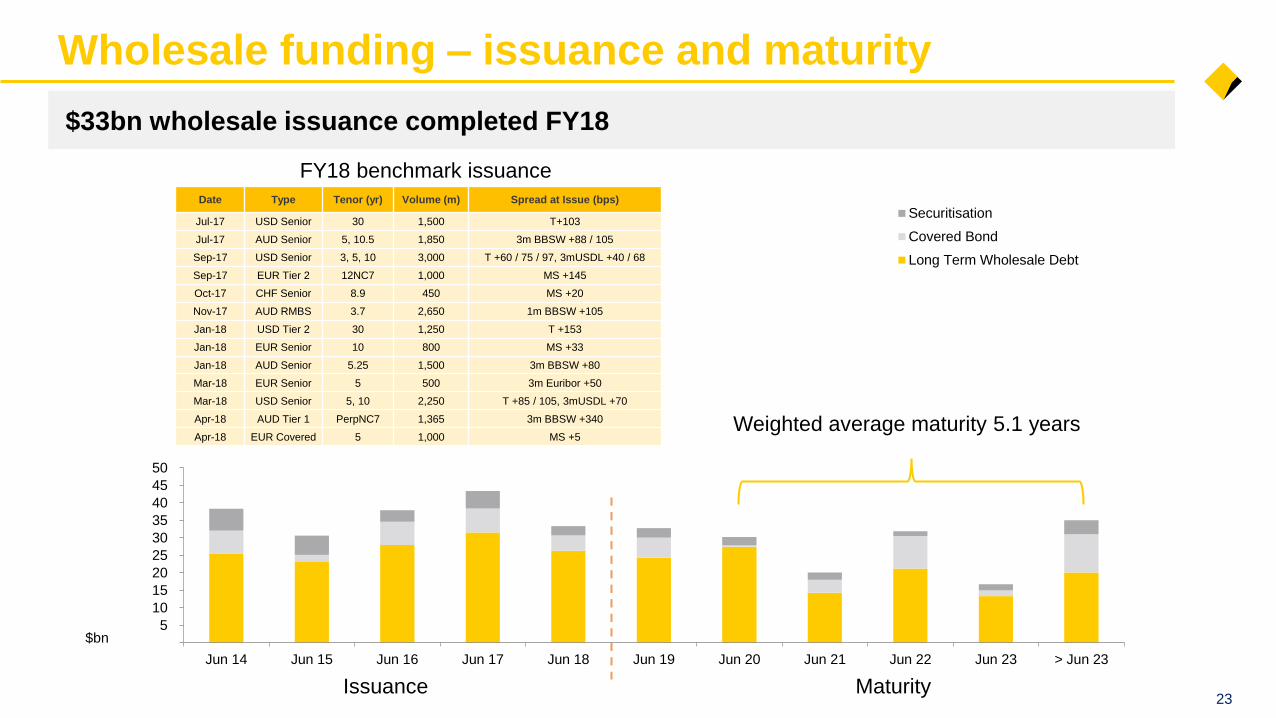
Weighted average maturity 5.1 years
Wholesale funding – issuance and maturity
$bn
Maturity23
$33bn wholesale issuance completed FY18
FY18 benchmark issuance
Date Type Tenor (yr) Volume (m) Spread at Issue (bps)
Jul-17 USD Senior 30 1,500 T+103
Jul-17 AUD Senior 5, 10.5 1,850 3m BBSW +88 / 105
Sep-17 USD Senior 3, 5, 10 3,000 T +60 / 75 / 97, 3mUSDL +40 / 68
Sep-17 EUR Tier 2 12NC7 1,000 MS +145
Oct-17 CHF Senior 8.9 450 MS +20
Nov-17 AUD RMBS 3.7 2,650 1m BBSW +105
Jan-18 USD Tier 2 30 1,250 T +153
Jan-18 EUR Senior 10 800 MS +33
Jan-18 AUD Senior 5.25 1,500 3m BBSW +80
Mar-18 EUR Senior 5 500 3m Euribor +50
Mar-18 USD Senior 5, 10 2,250 T +85 / 105, 3mUSDL +70
Apr-18 AUD Tier 1 PerpNC7 1,365 3m BBSW +340
Apr-18 EUR Covered 5 1,000 MS +5
Issuance
5% 7% 3% 0.4%
6% 1%3% 3% 1%
26% 32%30%
13%10%
24%8%
12%
16%
12%
34%
22% 32%43%
27%
6%
30%23% 21%
50%
FY14 FY15 FY16 FY17 FY18
>5 years
5 years
4 years
3 years
2 years
1 years
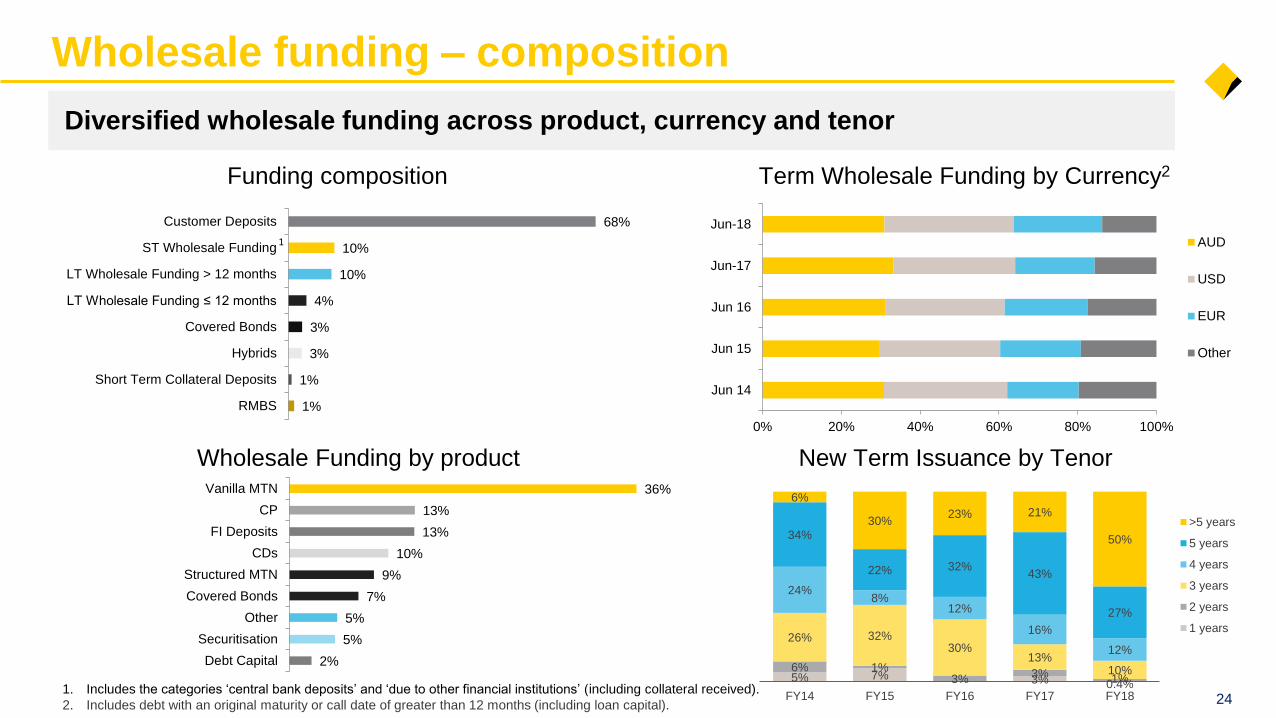
Wholesale funding – composition
Funding composition
1. Includes the categories ‘central bank deposits’ and ‘due to other financial institutions’ (including collateral received).
2. Includes debt with an original maturity or call date of greater than 12 months (including loan capital).
Wholesale Funding by product
24
1%
1%
3%
3%
4%
10%
10%
68%
RMBS
Short Term Collateral Deposits
Hybrids
Covered Bonds
LT Wholesale Funding ≤ 12 months
LT Wholesale Funding > 12 months
ST Wholesale Funding
Customer Deposits
1
Term Wholesale Funding by Currency2
0% 20% 40% 60% 80% 100%
Jun 14
Jun 15
Jun 16
Jun-17
Jun-18
AUD
USD
EUR
Other
New Term Issuance by Tenor
Diversified wholesale funding across product, currency and tenor
2%
5%
5%
7%
9%
10%
13%
13%
36%
Debt Capital
Securitisation
Other
Covered Bonds
Structured MTN
CDs
FI Deposits
CP
Vanilla MTN

106(67) (7) (52) (10)10.4% 10.1%
Dec 17APRA
Dec 17Interim Div.
(Net of DRP)
CashNPAT
UnderlyingRWA
One-offItems
Other Jun 18APRA
2738 18
(21)10.1%10.7%
Jun 18APRA
AASB 9 &AASB 15
SovereignDivestment
CMLADivestment
BoCommDivestment
Jun 18Pro-forma
Capital
25
1. $325m (-7bpts) for the AUSTRAC civil penalty shown separately in one-off items ($375m provided for in 1H18). 2. APRA’s requirement to increase operational risk regulatory capital (-28bpts) and
movement of Wealth Management Advice business to the regulatory consolidated group (-5bpts). 3. Maturity of final tranche ($315m) of Colonial debt that was subject to transitional relief. 4. Capital
injection of AUD $235m into the 37.5% interest in BoComm Life Insurance, which will be fully reimbursed on completion of sale to Mitsui Sumitomo Insurance Co. Ltd. 5. 1 July 2018 implementation.
6. Sale of Sovereign completed July 2018. Sale of CMLA and BoComm expected to be completed by December 2018.
1
CET1Pro-forma
CET1
5 6 6 6
Op. risk add-on absorbed – clear path to “unquestionably strong” (pro-forma 10.7%)
+32
Organic
One-off items
Operational RWA Adjustment2 (33)
AUSTRAC (7)
Colonial debt3 (7)
BoComm4 (5)
1
bpts

10.1% 10.4% 10.1%8.0%
14.2% 14.8% 15.0%
11.5%2.1% 2.4% 2.7%
2.0%2.0% 1.9% 1.9%
1.5%
Jun 17 Dec 17 Jun 18 Current RegulatoryMinimum
CET1 Tier 1 Tier 2
Total capital levels - APRA
Well positioned on regulatory requirements .. > 10.5% 1 Jan, 2020
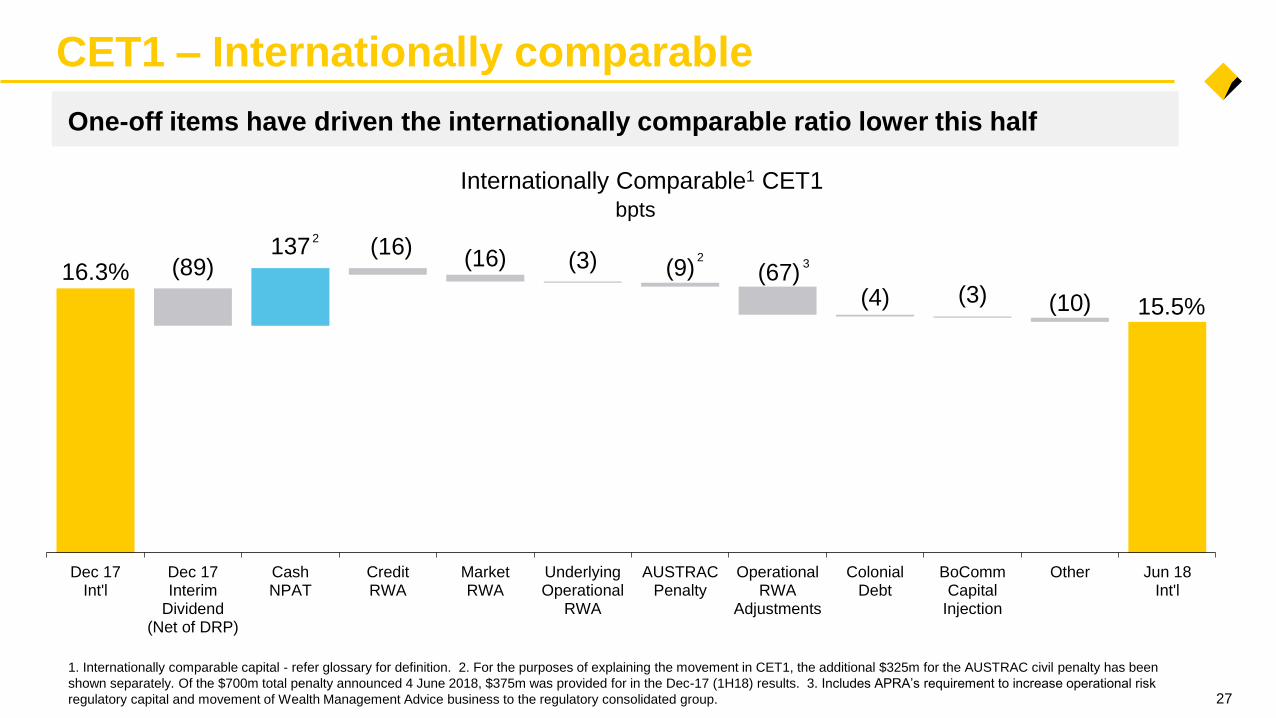
137(89)
(16)(16) (3) (9) (67)
(4) (3) (10)
16.3%
15.5%
Dec 17Int'l
Dec 17Interim
Dividend(Net of DRP)
CashNPAT
CreditRWA
MarketRWA
UnderlyingOperational
RWA
AUSTRACPenalty
OperationalRWA
Adjustments
ColonialDebt
BoCommCapital
Injection
Other Jun 18Int'l
Internationally Comparable1 CET1
27
CET1 – Internationally comparable
bpts
2
3
One-off items have driven the internationally comparable ratio lower this half
1. Internationally comparable capital - refer glossary for definition. 2. For the purposes of explaining the movement in CET1, the additional $325m for the AUSTRAC civil penalty has been
shown separately. Of the $700m total penalty announced 4 June 2018, $375m was provided for in the Dec-17 (1H18) results. 3. Includes APRA’s requirement to increase operational risk
regulatory capital and movement of Wealth Management Advice business to the regulatory consolidated group.
2

21.1
16.4 16.3 16.115.5
14.7 14.7 14.6 14.6 14.5 14.313.9 13.7 13.4 13.1 13.1 12.9 12.8 12.6 12.5 12.1 12.0 12.0 12.0 12.0 11.9 11.8 11.8 11.7 11.4 11.3 11.2 11.1 10.9 10.9 10.7 10.5
G-SIBs in dark grey
1. Domestic peer figures as at 31 March 2018.
2. Deduction for accrued expected future dividends added back for comparability.
Source: Morgan Stanley and CBA. Based on last reported CET1 ratios up to 2 August 2018 assuming Basel III capital reforms fully implemented.
Peer group comprises listed commercial banks with total assets in excess of A$780 billion and which have disclosed fully implemented Basel III ratios or provided sufficient disclosure for a
Morgan Stanley estimate.
No
rde
a2
CB
A
HS
BC
Llo
yd
s2
ING
2
AN
Z1
WB
C1
NA
B1
RB
S
De
uts
ch
e2
UB
S2
Chin
a C
onstr
uct. B
ank
Sta
ndard
Chart
ere
d2
ICB
C
Cre
dit A
grico
le S
A2
Cre
dit S
uis
se
2
Mitsu
bis
hi U
FJ
Citi
JP
Mo
rga
n
Su
mito
mo
Mitsu
i2
Inte
sa
Sa
np
ao
lo2
So
cG
en
2
BN
P P
arib
as
2
Ba
rcla
ys
2
Ba
nk o
f C
hin
a
Ba
nk o
f C
om
m.
Miz
uho
RB
C
Ba
nk o
f A
me
rica
We
lls F
arg
o
Sco
tia
ba
nk
To
ron
to D
om
inio
n
Ag
ri. B
an
k o
f C
hin
a
Un
iCre
dit
2
Ch
ina
Me
rch
an
ts B
an
k
International CET1 ratios
28
Sa
nta
nd
er2
BB
VA
2
The Group is one of the best capitalised banks in the world

APRA and International comparison
The following table provides details on the differences, as at 30 June 2018, between the APRA Basel III capital requirements and internationally comparable capital ratio1.
CET1 APRA 10.1%
Equity investments Balances below prescribed threshold are risk weighted, compared to a 100% CET1 deduction under APRA’s requirements. 1.0%
Capitalised expenses Balances are risk weighted, compared to a 100% CET1 deduction under APRA’s requirements. 0.1%
Deferred tax assets Balances below prescribed threshold are risk weighted, compared to a 100% CET1 deduction under APRA’s requirements. 0.3%
IRRBB RWA APRA requires capital to be held for Interest Rate Risk in the Banking Book (IRRBB). The BCBS does not. 0.6%
Residential mortgagesLoss Given Default (LGD) of 15%, compared to the 20% LGD floor under APRA’s requirements and adjustments for higher
correlation factor applied by APRA for Australian residential mortgages.1.8%
Other retail standardised exposures Risk-weighting of 75%, rather than 100% under APRA’s requirements. 0.1%
Unsecured non-retail exposures LGD of 45%, compared to the 60% or higher LGD under APRA’s requirements. 0.4%
Non-retail undrawn commitments Credit conversion factor of 75%, compared to 100% under APRA’s requirements. 0.3%
Specialised lending
Use of AIRB probabilities of default (PD) and LGDs for income producing real estate and project finance exposures,
reduced by application of a scaling factor of 1.06. APRA applies higher risk weights under a supervisory slotting approach,
but does not require the application of the scaling factor.
0.7%
Currency conversion Increase in A$ equivalent concessional threshold level for small business retail and small/medium corporate exposures. 0.1%
CET1 Internationally Comparable 15.5%
Tier 1 Internationally Comparable 18.1%
Total Capital Internationally Comparable 21.3%
1. Analysis aligns with the APRA study entitled “International capital comparison study” (13 July 2015). 29
The Group’s CET1 ratio of 10.1% translates to 15.5% on an international basis

Leverage ratio
5.1% 5.4% 5.5%5.8% 6.1% 6.3%
APRA Int'l
Leverage ratio = Tier 1 Capital
Total Exposures
Leverage ratio introduced to constrain the build-up of leverage in
the banking system.
Jun 18Jun 17
The Tier 1 capital included in the calculation of the internationally comparable leverage ratio aligns with the 13 July 2015 APRA study entitled “International capital comparison study”, and
includes Basel III non-compliant Tier 1 instruments that are currently subject to transitional rules.
3% Basel
Committee
minimum
(1 Jan 2018)
Dec 17
30
$m Jun 18
Tier 1 Capital 56,432
Total Exposures 1,018,622
Leverage Ratio (APRA) 5.5%
$m Jun 18
Group Total Assets 975,165
Less subsidiaries outside the scope of regulatory
consolidations (18,091)
Add net derivative adjustment 1,504
Add securities financing transactions 1,010
Less asset amounts deducted from Tier 1 Capital (20,530)
Add off balance sheet exposures 79,564
Total Exposures 1,018,622
Proposed
4% APRA
minimum
(1 July 2019)
CBA leverage ratio is well above prescribed Basel Committee minimum

31
Regulatory change timetable
Leverage ratio
APRA’s unquestionably
strong
2018 2019 2020 2021 2022
Counterparty Credit
Risk
ADIs to target unquestionably strong capital ratios,
which will also cover Basel Committee’s finalised Basel
III reforms
APRA commenced consultation in February 2018
Basel Committee - Regulatory minimum of 3% effective from 1 Jan 2018
(APRA commenced consultation in February 2018, proposed minimum 4% from 1 July 2019)
Basel Committee
implementation date
1 Jan 2022
(Leverage ratio - revised
measurement of certain
exposures)
Basel Committee finalised Dec 2017:
• Changes to Standardised & Advanced Credit RWAs
• Operational RWAs to Standardised approach
• Capital floor of 72.5% (phased approach 1 Jan 2022 – 1 Jan 2027)
Further consultation on the minimum capital requirements for Market Risk commenced in Mar 2018
APRA to consult on detailed prudential standards across 2018 and 2019 and finalise in 2019 or later. APRA plans to
implement from 1 January 2021, 12 months ahead of Basel Committee implementation timeframe.
Implementation 1 July 2019
Basel III Finalising
Post-Crisis Reforms
AASB 9 Provisioning Implementation 1 July 2018
Implementation
Capital to exceed
unquestionably strong
benchmark by 1 Jan 2020
AASB 16 Leasing Implementation 1 July 2019
Loss Absorbing
Capacity (“TLAC”)APRA to commence
consultation in late 2018
AASB 15 Revenue Implementation 1 July 2018

Credit Growth = 12 months to June
GDP, Unemployment & CPI = Financial year average
Cash Rate = As at June
= forecastWorld GDP = Calendar Year Average
2013 2014 2015 2016 2017 2018 2019
World GDP 3.5 3.6 3.5 3.2 3.8 3.9 3.9
Australia Credit Growth % – Total 3.1 5.0 5.9 6.2 5.4 4.5 3½-5½
Credit Growth % – Housing 4.6 6.4 7.3 6.7 6.6 5.6 3½-5½
Credit Growth % – Business 1.2 3.4 4.4 6.5 4.3 3.2 4-6
Credit Growth % – Other Personal 0.2 0.6 0.8 -0.6 -1.0 -1.3 -2 to 0
GDP % 2.6 2.6 2.4 2.8 2.1 2.7 3.1
CPI % 2.3 2.7 1.7 1.4 1.7 1.9 2.7
Unemployment rate % 5.4 5.8 6.2 5.9 5.7 5.5 5.4
Cash Rate % 2.75 2.50 2.00 1.75 1.50 1.50 1.75
New Zealand Credit Growth % – Total 4.3 4.4 5.8 7.7 6.5 4-6 4-6
Credit Growth % – Housing 5.2 5.3 5.4 8.8 7.7 4-6 4-6
Credit Growth % – Business 2.8 2.8 5.9 7.2 6.2 5-7 5-7
Credit Growth % – Agriculture 4.1 3.4 7.4 6.0 2.6 3-5 4-6
GDP % 2.3 2.5 3.3 2.7 3.3 2.7 3.5
CPI % 0.8 1.5 0.6 0.3 1.4 1.7 1.5
Unemployment rate % 6.2 5.5 5.4 5.2 5.0 4.8 4.6
Overnight Cash Rate % 2.50 3.25 3.25 2.25 1.75 1.75 2.00
32
Key economic indicators (June FY)

Home and Consumer Lending

34
Regulatory exposure mix1
PortfolioRegulatory Credit Exposure Mix
CBA Peer 1 Peer 2 Peer 3
Residential Mortgages 57% 41% 46% 57%
Corporate, SME, Specialised Lending 26% 31% 38% 29%
Bank 4% 5% 5% 2%
Sovereign 9% 16% 9% 8%
Qualifying Revolving 3% 2% 1% 2%
Other Retail 1% 5% 1% 2%
Total 100% 100% 100% 100%
1. Pillar 3 disclosures for CBA as at June 2018 and Peers as at March 2018. Excludes Standardised (including Other Assets, CVA) and Securitisation, which represents 5% of CBA, 4% of
Peer 1, 6% of Peer 2 and 5% of Peer 3 before exclusions.
CBA’s portfolio is heavily weighted to home lending

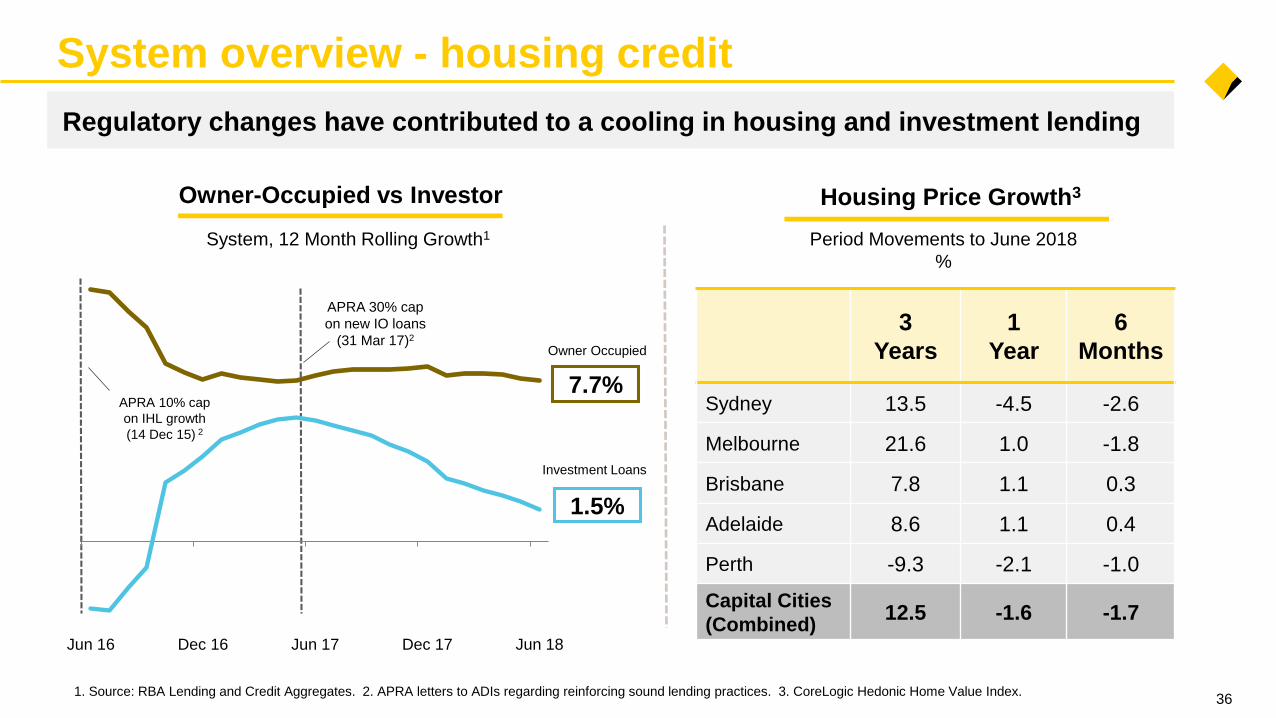
System overview – housing credit
35
Population growth continues to underpin overall system growth
Annual % change
Population1
0.0
0.8
1.6
2.4
1973/74 1981/82 1989/90 1997/98 2005/06 2013/14
Long run
average
Annual % change
System Housing Credit Growth2
6.4
7.3
6.7 6.6
3.5
2014 2015 2016 2017 2018 2019
5.6 5.5
1. ABS. 2. System source: RBA.
CBA
Economist
Forecast
Range
2016/17
System overview - housing credit
36
Regulatory changes have contributed to a cooling in housing and investment lending
System, 12 Month Rolling Growth1
Owner-Occupied vs Investor Housing Price Growth3
Period Movements to June 2018
%
1. Source: RBA Lending and Credit Aggregates. 2. APRA letters to ADIs regarding reinforcing sound lending practices. 3. CoreLogic Hedonic Home Value Index.
Owner Occupied
Investment Loans
APRA 10% cap
on IHL growth
(14 Dec 15) 2
APRA 30% cap
on new IO loans
(31 Mar 17)23
Years
1
Year
6
Months
Sydney 13.5 -4.5 -2.6
Melbourne 21.6 1.0 -1.8
Brisbane 7.8 1.1 0.3
Adelaide 8.6 1.1 0.4
Perth -9.3 -2.1 -1.0
Capital Cities
(Combined)12.5 -1.6 -1.7
Jun 16 Dec 16 Jun 17 Dec 17 Jun 18
1.5%
7.7%

11%
16%
21%
26%
CBA home lending1
371. System source RBA Lending and Credit Aggregates and APRA Monthly Banking Statistics. CBA includes BWA and subsidiaries. NBFIs: Non-bank financial institutions.
24.4%
Jun 18
Home Lending
Market share
Jun 07
3.7%
5.6%
12.5%
CBA System NBFIs
Home Lending Growth
Owner-Occupied +6.2%
Investor (1.2)%
CBA System NBFIs
12 months to Jun 18
CBA
23.1%
14.7%
14.6%
Jun 17
CBA took early measures to manage regulatory requirements, ceding some share
Market
Share24.4% 100% 5.2%
-16-5 -9 -8
Q1 Q2 Q3 Q4
FY18 Mvt by Qtr
(RBS, bpts)

7.7%
1.5%
Jun 16 Dec 16 Jun 17 Dec 17 Jun 18
CBA Owner Occupied CBA Investment Loans
System Investment Loans
62% 64% 63%
47%45% 45%
2H17 1H18 2H18
38
12 Month Rolling Growth1
Proprietary Home Loans3
Proprietary % of Total Home Loan Flows ($)
Owner-Occupied vs Investor
CBA remains focused on its core market – owner-occupied, proprietary lending
CBA home lending
1. System source RBA Lending and Credit Aggregates. Includes CBA and Bankwest. 2. APRA letter to ADIs regarding reinforcing sound lending practices. 3. CBA only. System as at
Mar 18 quarter. Source: MFAA.
(1.2)%
6.2%
APRA 30% cap
on new IO loans
(31 Mar 17)2
System Owner Occupied
CBA
System

39
Home loan portfolio – Australia
A balanced approach to portfolio quality, growth and returns
Portfolio1 Jun 17 Dec 17 Jun 18
Total Balances - Spot ($bn) 436 444 451
Total Balances - Average ($bn) 423 440 443
Total Accounts (m) 1.8 1.8 1.8
Variable Rate (%) 84 82 81
Owner Occupied (%) 63 64 65
Investment (%) 33 32 32
Line of Credit (%) 4 4 3
Proprietary (%) 54 55 55
Broker (%) 46 45 45
Interest Only (%)2 39 33 30
Lenders’ Mortgage Insurance (%)2 22 22 21
Mortgagee In Possession (bpts) 5 5 5
Annualised Loss Rate (bpts) 3 2 3
Portfolio Dynamic LVR (%)3 50 50 50
Customers in Advance (%)4 77 77 78
Payments in Advance incl. offset5 33 33 32
Offset Balances – Spot ($bn) 37 41 42
New Business1 Jun 17 Dec 17 Jun 18
Total Funding ($bn) 49 49 45
Average Funding Size ($’000)6 309 320 319
Serviceability Buffer (%)7 2.25 2.25 2.25
Variable Rate (%) 85 82 86
Owner Occupied (%) 67 71 70
Investment (%) 32 28 29
Line of Credit (%) 1 1 1
Proprietary (%) 57 60 59
Broker (%) 43 40 41
Interest Only (%) 41 22 23
Lenders’ Mortgage Insurance (%)2 16 17 16
Loan-to-Income8 (LTI) > 6 (%) 6.0 6.6 5.6
1. All portfolio and new business metrics are based on balances and fundings respectively, unless
stated otherwise. All new business metrics are based on 6 months to June and December.
Includes RBS (including those originated outside of RBS), Bankwest and Aussie Home Loans.
2. Excludes Line of Credit (Viridian LOC/Equity Line).
3. Dynamic LVR defined as current balance/current valuation.
4. Any amount ahead of monthly minimum repayment; includes offset facilities.
5. Average number of monthly payments ahead of scheduled repayments.
6. Average Funding Size defined as funded amount / number of funded accounts.
7. Serviceability test based on the higher of the customer rate plus a 2.25% interest rate buffer or a
minimum floor rate.
8. Loan Amount / Gross Income.

40
State Profile1
FY18 Balance Growth
34%
26%
18%
16%
6%
% of Portfolio
Portfolio growth remains strongest in NSW
Home lending
5.2%
4.5%
2.5%
0.1%
(0.6%)
NSW/ACT VIC/TAS QLD WA SA/NT
1. Includes CBA and Bankwest. State Profile exclude Line of Credit, Reverse Mortgage, Commonwealth Portfolio Loans (CBA) and Residential Mortgage Group (CBA) loans. State Profile
determined by location of the underlying security.
Balance Growth1
$bn
436 451
94
39 (100)
(18)
Jun 17 NewFundings
Redraw &Interest
Repayments/ Other
ExternalRefinance
Jun 18

41
The Group has continued to tighten its serviceability and underwriting standards
Home lending
Increased serviceability buffers
Reduced reliance on less stable
income sources
Income scaled living expense
estimate in serviceability test
Limits on lending in high risk areas
Reduced LVRs for non-residents
and removed some foreign income
types
Limited periods of interest-only (IO) to
5 years maximum
Further limits on use of rental income
and negative gearing
LVR restrictions on interest-only and
investment lending
Limits on lending to high risk apartment
areas
Increased buffers on existing debts
Further buffers on existing debts
Increased verification of OFI debts
Further limits on lending in high risk areas
Launched Credit Assessment Summary
acknowledging borrower information used in
assessment
Introduced minimum rental expense
requirement for non-home owners
Launched new Serviceability Calculator
Introduced Debt-to-Income referral
Launched data-driven liability capture
FY17FY16 FY18
Jun 15 Jun 18Jun 16 Jun 17

Home lending
42
Portfolio Insurance Profile2
Portfolio dynamic LVR at 50% and well insured
% of Australian Home Loan portfolio
1. Includes CBA and Bankwest. Dynamic LVR is current balance / current valuation. 2. Includes CBA and Bankwest. Excludes Line of Credit, Reverse Mortgage, Commonwealth Portfolio Loans
and Residential Mortgage Groups loans.
Low Deposit Premium Segment
LMI – Genworth / QBE
Insurance not required
Excess of Loss
Re-insurance
Insurance with
Genworth or QBE for
higher risk loans
above 80% LVR
Lower risk profile
e.g. low LVR
21%
5%
69%
5%
Home loan dynamic LVR1
0%
10%
20%
30%
40%
50%
60%
70%
0% to 60% 60% to 80% 80% to 90% 90% to 95% >95%
% o
f T
ota
l P
ort
folio
Ac
co
un
ts
Dynamic LVR Band
Average
Dynamic
LVR
Jun 17 50%
Dec 17 50%
Jun 18 50%

Repayment buffers
29%
7% 7% 7%
13%16%
5%
9%
6%
> 2 years 1-2 years 6-12 months 3-6 months 1-3 months < 1 month
43
Significant repayment buffers reduce portfolio risk
1. CBA only. Excludes Line of Credit, Reverse Mortgage, Commonwealth Portfolio Loans and Residential Mortgage Group loans; Includes offset facilities; Loans in arrears (1%) are excluded. 2. Consists of loans that are up-to-date (23%) and less than one month in advance (13%).
Home lending
New Accounts: loans that are
less than one year on book
Structural: loans that structurally
restrict payments in advance e.g.
fixed rate loans etc
Residual: have less than 1 month
repayment buffer
Investment loans: incentivised to
keep interest payments high for
negative gearing/tax purposes
(Payments in advance1, % of accounts)
2

Home lending
44
CBA home lending supported by strong income profile
1. CBA only. Excludes Line of Credit, Reverse Mortgage, Commonwealth Portfolio Loan and Residential Mortgage Group loans.
Applicant Gross Income Band1
Fundings $
6 months to Jun 18
Fundings #
6 months to Jun 18
Investor Home Loans
Owner Occupied
0%
10%
20%
30%
40%
50%
0-75k 75k-100k 100k-125k 125k-150k 150k-200k 200k-500k 500k+
0%
10%
20%
30%
40%
50%
0-75k 75k-100k 100k-125k 125k-150k 150k-200k 200k-500k 500k+

Balance Movement ($m)1
Interest only – switching
45
• Pricing and policy tightening measures have encouraged switching to P&I
• Interest only loans are assessed on P&I basis over residual term to ensure increased repayment levels can be met
• Additional serviceability buffers built into serviceability tests provide further support
• Approximately 27% expected to switch in FY2019 – majority are investors and those with large payment buffers
Interest Only (IO) to Principal and Interest (P&I)
Quarterly
Scheduled IO term expiry1
(% of total IO Loans)
Payments in advance > 6
months2: accounts with a financial
buffer to absorb any increased
repayments
1. CBA only. Excludes Line of Credit, Reverse Mortgage, Commonwealth Portfolio Loans and Residential Mortgage Group loans. 2. Payments in Advance defined as the number of monthly
payments ahead of scheduled repayments by 6 or more months.
Investment Loans: incentivised to
keep interest payments high for
negative gearing/tax purposes
Residual: Over 65% originated
after June 2015, with increased
serviceability buffers
Switching activity peaked in Sep 17, with significant buffers in place
33%23% 20% 19%
12%
39%
47%
46%44%
52%
29%
30%
34%37%
36%
FY 2019 FY 2020 FY 2021 FY 2022 FY 2023+
27%
24%
20%19%
10%
4,1134,121
4,570
4,480
5,078
2,928
5,555
2,6582,001
1,748
Jun 17 Sep 17 Dec 17 Mar 18 Jun 18
Customer initiated
Reached end of I/O
period

Home loan arrears
1. Includes CBA and Bankwest. Excludes Line of Credit, Reverse Mortgage, Commonwealth Portfolio Loan and Residential Mortgage Group.
0.00%
0.50%
1.00%
1.50%
2.00%
Jun 16 Dec 16 Jun 17 Dec 17 Jun 18
Arrears by State
Australia1 90+ days
WA
NT
QLD
SA
Australia
TAS
VIC
NSW
ACT
ACT, 2%
NSW, 33%
NT, 1%
SA, 5%TAS, 1%
QLD, 18%
VIC, 25%
WA, 16%
Portfolio Balance
%
Largest increases have been in WA and NT
46

0.0%
0.6%
1.2%
1.8%
Jul Aug Sep Oct Nov Dec Jan Feb Mar Apr May Jun
47
Arrears by Vintage
Australia1 90+ days
Arrears by Year
Group 90+ days
1. Includes CBA and Bankwest. Bankwest included from FY08.
20152014 201820172016
Home loan arrears
Current year arrears elevated but recent vintage performance remain strong
FY07-FY10
FY11
FY12FY13
FY15
FY14
FY16
FY17FY18
0.0%
0.5%
1.0%
1.5%
2.0%
0 6 12 18 24 30 36 42 48 54 60 66 72
Months on Book

2.0%
2.2%
2.4%
2.6%
2.8%
3.0%
Jul Aug Sep Oct Nov Dec Jan Feb Mar Apr May Jun2.0%
2.5%
3.0%
3.5%
4.0%
Jul Aug Sep Oct Nov Dec Jan Feb Mar Apr May Jun
0.0%
0.6%
1.2%
1.8%
Jun 15 Dec 15 Jun 16 Dec 16 Jun 17 Dec 17 Jun 180.0%
0.6%
1.2%
1.8%
Jun 15 Dec 15 Jun 16 Dec 16 Jun 17 Dec 17 Jun 18
48
Group 90+ days
Credit Cards Personal LoansGroup 90+ days
Credit Cards Personal LoansGroup 30+ days Group 30+ days
Consumer arrears1
2015
2014
2018
2017
2016
Bankwest
Group
CBA
ASB
1. Consumer arrears includes retail portfolios of CBA (RBS and BPB), Bankwest and ASB. ASB write-off Credit Card and Personal Loans typically around 90 days past due if no agreed
repayment plan.
Arrears rates remained broadly stable across unsecured retail portfolios

49
Home lending
1. CBA Home Loans represents Australian Home Loans and includes Bankwest from 2009. 2. Net losses (bpts) is calculated as total net losses divided by average exposure over the three years.
Net losses reflect stressed macroeconomic and LMI assumptions (50%). Scenario does not include any benefits of Excess of Loss Re-insurance. Results based on December 2017 data.
0.0%
0.5%
1.0%
1.5%
2.0%
2.5%
1983 1987 1991 1995 1999 2003 2007 2011 2015
CBA Home Loans
Group Total Loan Losses
Losses to average gross loans1
2018
Stress scenario
Stress test
Marginal decrease in scenario potential net loss outcomes compared to
prior period, reflective of relative stability in the portfolio.
3 year scenario of cumulative 31% house price decline, peak
11% unemployment and a reduction in the cash rate to 0.5%
Outcomes ($m) Total Year 1 Year 2 Year 3
Stressed Losses 4,061 783 1,232 2,046
Insured Losses 1,026 209 316 501
Net Losses 3,035 574 916 1,545
Net Losses (bpts)2 60 11 18 31
PD % n/a 0.95 1.65 2.39
Losses remain low and remain manageable under a stressed scenario

Business and Corporate Lending

51
System overview – business credit
Business credit growth remained relatively subdued through FY18
Business Credit Growth1
System, Year-to-June %
Market Shares2
APRA NFCRBA System
(includes Bills)
3.4
4.4
6.5
4.3
3.2
4-6
2014 2015 2016 2017 2018 2019
1. Source: RBA. 2. System source: APRA Monthly Banking Statistics (excluded Bills). CBA includes Bankwest
CBA
Economist
Forecast
Range
21.3%
18.1% 17.8%
14.4%15.9%
NAB WBC CBA ANZ CBA
June 2018

Group TCE TIA $m TIA % of TCE
Dec 17 Jun 18 Dec 17 Jun 18 Dec 17 Jun 18
Consumer1 56.6% 57.4% 1,511 1,659 0.25% 0.27%
Sovereign 9.7% 9.3% - - - -
Property 6.3% 6.2% 586 632 0.86% 0.94%
Banks 5.2% 5.5% 9 9 0.02% 0.01%
Finance – Other 5.1% 5.2% 35 31 0.06% 0.05%
Retail, Wholesale Trade 2.1% 2.0% 488 487 2.13% 2.21%
Agriculture 2.0% 2.0% 876 900 4.07% 4.12%
Manufacturing 1.4% 1.4% 290 350 1.90% 2.34%
Transport 1.5% 1.4% 399 659 2.49% 4.29%
Mining 1.3% 1.3% 409 364 2.97% 2.64%
Business Services 1.3% 1.2% 349 184 2.56% 1.44%
Energy 1.1% 1.0% 9 4 0.08% 0.04%
Construction 0.8% 0.7% 223 297 2.73% 3.68%
Health & Community 0.9% 0.9% 225 218 2.42% 2.38%
Culture & Recreation 0.7% 0.6% 47 41 0.66% 0.62%
Other1 4.0% 3.9% 579 706 1.35% 1.67%
Total 100.0% 100.0% 6,035 6,541 0.56% 0.60%
Credit exposure summary
521. Comparatives have been restated to conform to treatment in current period.

111.7
77.0
25.1
8.6
104.6
78.6
27.1
8.9
Institutional Bank &Mkts
Business & PrivateBank
NZ (NZD) Bankwest
Priority sectors:
Health +14%
Agri +5%
Property investor +2%
53
Business and Corporate Lending
226.5
222.4
FY17 FY18
For CBA, focus is on portfolio optimisation and targeted growth in priority segments
Business and Corporate Lending
$bn
(2%)
-6%
+2%
+8%
Group
Portfolio
optimisation
Growth reflects
long term strategic
focus on this
segment
+4%
Growth in
corporate
segment

12.2
1.1
31
2.2 49
0.4
12.2
1.1
31
2.8
340.3
11.7
1.1
27
3.1
37
0.3
70.2
6.5
33
1.0 1110.16
67.8
6.3
33
0.9 90 0.13
67.2
6.2
34
0.9 83 0.12
21.7
2.0
14
4.7389
1.8
21.5
2.0
14
4.1 5102.4
21.8
2.0
13
4.1 4632.1
14.7
1.4
70
3.2 252 1.7
13.8
1.3
71
3.0 378 2.8
13.8
1.3
72
2.6 304 2.2
54
Sectors of Interest
Commercial Property
% of Group
TCEPortfolio
impaired $m
% of portfolio
investment grade
TCE ($bn) % of portfolio
graded TIA% of portfolio
Impaired
Jun 18
Dec 17
Jun 17Mining, Oil and Gas
% of Group
TCEPortfolio
impaired $m
% of portfolio
investment grade
TCE ($bn) % of portfolio
graded TIA% of portfolio
Impaired
Agriculture
% of Group
TCEPortfolio
impaired $m
% of portfolio
investment grade
TCE ($bn) % of portfolio
graded TIA% of portfolio
Impaired
% of Group
TCEPortfolio
impaired $m
% of portfolio
investment gradeTCE ($bn) % of portfolio
graded TIA% of portfolio
Impaired
Retail Trade
Broadly stable outcomes across most sectors

1.2
1.6
0.7
0.2
2018 2019 2020 2021 55
Residential apartments – weighted to Sydney
Apartment Development1 exposure reduced
$0.3bn for the half.
Facilities being repaid on time from pre-sale
settlements.
Weighting to Sydney remained stable over the
last 6 months.
Qualifying pre-sales improved to 112.0%.2
Lower Portfolio LVR of 54.3%.
Sydney developments are diversified across the
metropolitan area.
Ongoing comprehensive market, exposure and
settlement monitoring on the portfolio.
1. Apartment Developments > $20m. Brisbane, Melbourne and Perth defined as all
postcodes within a 15km radius of the capital city and Sydney is all metropolitan
Sydney based on location of the development. Other is all other locations.
2. QPS refers to level of Qualifying Pre-Sales accepted as a pre-condition to loan
funding. QPS Cover is level of QPS held to cover the exposure.
Profile
Exposure Maturity Profile1
Melbourne
$0.6bn
Brisbane
$0.2bn
Perth$0.2bn
Other
$0.2bn
Apartment
development1
35%
($3.7bn)Other
development
28%
($3.0bn)
Investment
37%
($4.0bn)
Total Residential$10.7bn (16% of CP)
Apartment Development1
$3.7bn (0.3% of TCE)
($bn)
Sydney
68%
($2.5bn)
Improved qualifying pre-sales, lower LVR

Management & Strategy

Our strategy
To deliver balanced and
sustainable outcomes
57
Operational
risk and
compliance
Data and
analyticsInnovation
Become a simpler, better bank for our customers
Supported by stronger capabilities
Simplify our business
Lead in retail and commercial banking
Best in digital
People
Energised,
accountable
Community
Trusted and
reputable
Shareholders
Long-term
sustainable
returns
Cost
reduction
Customers
Better
outcomes
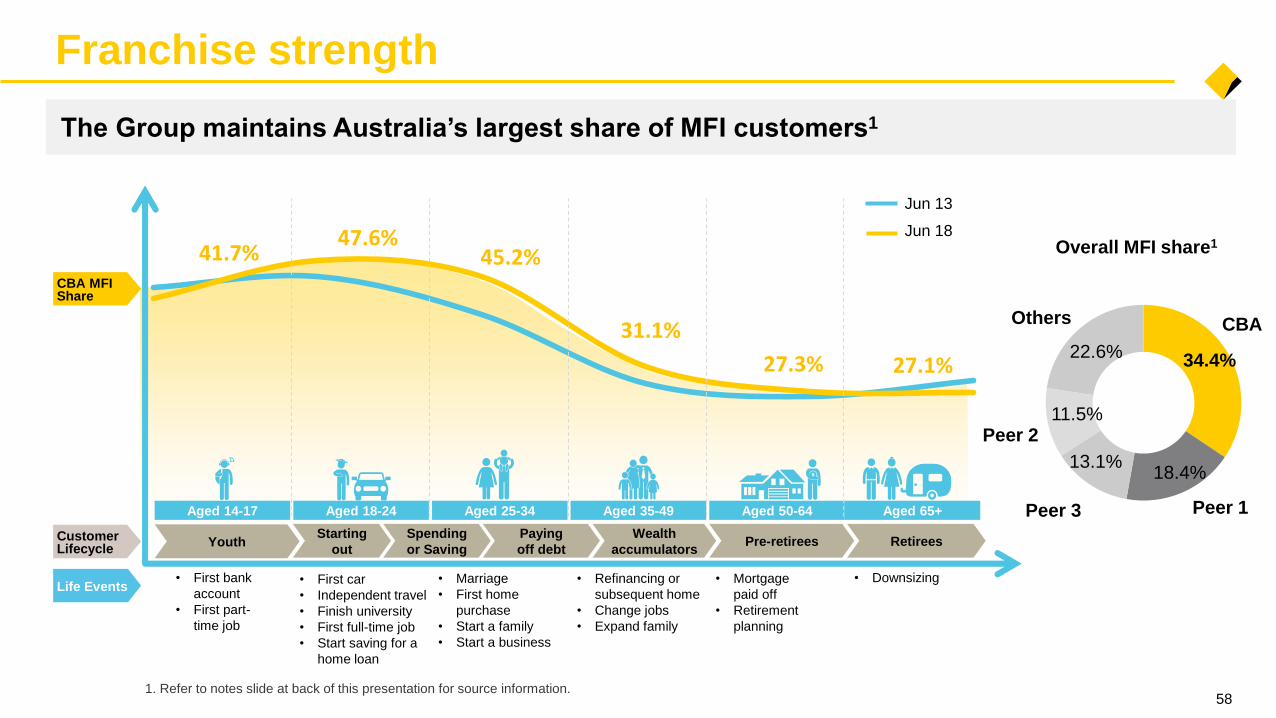
41.7%47.6%
45.2%
31.1%
27.3% 27.1%
Aged 14-17 Aged 25-34 Aged 35-49 Aged 50-64 Aged 65+Aged 18-24
CBA MFIShare
Starting
out
Spending
or Saving
Paying
off debt
Wealth
accumulatorsPre-retirees RetireesYouthCustomer
Lifecycle
• First car
• Independent travel
• Finish university
• First full-time job
• Start saving for a
home loan
• First bank
account
• First part-
time job
• Refinancing or
subsequent home
• Change jobs
• Expand family
• Mortgage
paid off
• Retirement
planning
• Marriage
• First home
purchase
• Start a family
• Start a business
• DownsizingLife Events
Jun 13
Jun 18
Franchise strength
The Group maintains Australia’s largest share of MFI customers1
34.4%
18.4%13.1%
11.5%
22.6%
CBA
Peer 2
Peer 1Peer 3
Others
Overall MFI share1
1. Refer to notes slide at back of this presentation for source information.58

+31.3
+5
+15
+25
+35
Jul-17 Oct 17 Jan-18 Apr-18
+37.8
+5
+15
+25
+35
Jul-17 Oct 17 Jan-18 Apr-18
Leading in digital
59
#1
#1
#1
#1
Online Banking – 9 years in a row (CANSTAR)1
Mobile Banking – 3 years in a row (CANSTAR)2
Mobile Banking Provider of the Year (Money Magazine)3
Most Innovative Channel Experience of
the Year – Ceba Virtual Assistant(Australian Retail Banking Awards)4
Ranked #1 Australian Mobile Banking
App (Forrester)5
Committed to remaining a leader in technology and innovation
#1
Mobile App Net Promoter Score6
Internet Banking Net Promoter Score6
Customer’s likelihood to recommend main financial institution based on use of
Internet Banking services via Website or Mobile App
CBA
Peers
CBA
Peers
Customer’s likelihood to recommend main financial institution based on use of
Internet Banking services via Mobile App
1, 2, 3, 4, 5, 6. Refer to notes slide at back of this presentation for source information.Oct 17Jul 17 Jun 18
Jun 18Jul 17

0.7 1.2 1.8 4.6
6.6 7.0
10.2
Dec 14 Jun 15 Dec 15 Jun 16 Dec 16 Jun 17 Dec 17 Jun 18
1.22.7 5.3
8.5
12.6
17.3
22.8
Dec 14 Jun 15 Dec 15 Jun 16 Dec 16 Jun 17 Dec 17 Jun 18
215
363 465
541 635
716
903
Dec 14 Jun 15 Dec 15 Jun 16 Dec 16 Jun 17 Dec 17 Jun 18
2.32.7
3.13.4
3.94.3
4.9
Dec 14 Jun 15 Dec 15 Jun 16 Dec 16 Jun 17 Dec 17 Jun 18
Cardless Cash Tap & Pay Lock, Block & Limit
Cumulative volume of unique
transactions (m)4
Cumulative number of accounts enrolled (k)6
Volume of transactions (m)5
60
1. Digital transactions include transfers and BPAY payments made in CommBank app and NetBank. 2. CommBank app users are those who have logged into the CommBank App at least once
for the month. 3. CommBank app logins per day for the month. 4. Cumulative volume of unique Cardless Cash transactions since April 2014 launch. 5. Volume of Tap & Pay transactions for
each 6 month period (includes HCE, Paytag and Tokenisation). 6. Cumulative number of unique accounts that have enrolled for Lock, Block and Limit (excl. temp. lock) since launch.
2.73.0
3.43.7
4.14.4
4.8
Dec 14 Jun 15 Dec 15 Jun 16 Dec 16 Jun 17 Dec 17 Jun 18
CommBank app usersMonthly unique customers (m)2
CommBank appLogons per day (m)3
Real time digital banking
5.0 5.1
28.616.8 1,147
Customer take-up of digital options
5051
52 5253
54
56
Dec 14 Jun 15 Dec 15 Jun 16 Dec 16 Jun 17 Dec 17 Jun 18
59%
Digital transactions% of total transactions - by value1

61
GlossaryFunding & Risk
Liquidity coverage ratio
(LCR)
The LCR is the first quantitative liquidity measure that is part of the Basel III
reforms. It was implemented by APRA in Australia on 1 Jan 2015. It requires
Australian ADI’s to hold sufficient liquid assets to meet 30 day net cash
outflows projected under an APRA-prescribed stress scenario.
High quality liquid
assets (HQLA)
As defined by APRA in Australian Prudential Standard APS210: Liquidity.
Qualifying HQLA includes cash, Govt and Semi Govt securities, and RBNZ
eligible securities.
Committed liquidity
facility (CLF)
Given the limited amount of Commonwealth government and Semi-
government debt in Australia, participating ADIs can access contingent
liquidity via the RBA’s CLF. The amount of the CLF for each ADI is set
annually by APRA. To access the CLF, ADIs need to meet certain conditions
and pledge qualifying securities to the RBA.
Net Stable Funding
Ratio
The NSFR is the second quantitative liquidity measure of the Basel III
reforms, in addition to the LCR. It was implemented by APRA in Australia on
1 Jan 2018. It requires Australian ADIs to fund their assets with sufficient
stable funding to reduce funding risk over a one year horizon. APRA
prescribed factors are used to determine the stable funding requirement of
assets and the stability of funding.
TIA Corporate Troublesome and Group Impaired assets.
Corporate
Troublesome
Corporate Troublesome includes exposures where customers are
experiencing financial difficulties which, if they persist, could result in losses
of principal or interest, and exposures where repayments are 90 days or
more past due and the value of security is sufficient to recover all amounts
due.
Total Committed
Exposure (TCE)
Total Committed Exposure is defined as the balance outstanding and
undrawn components of committed facility limits. It is calculated before
collateralisation and excludes settlement exposures.
Credit Risk Estimates
(CRE)
Refers to the Group’s regulatory estimates of long-run Probability of Default
(PD), downturn Loss Given Default (LGD) and Exposure at Default (EAD).
Capital & Other
Risk Weighted Assets or
RWA
The value of the Group’s On and Off Balance Sheet assets are
adjusted by risk weights calculated according to various APRA
prudential standards. For more information, refer to the APRA
website.
CET1 Expected Loss
(EL) Adjustment
CET1 adjustment that represents the shortfall between the
calculated regulatory expected loss and eligible provisions with
respect to credit portfolios which are subject to the Basel advanced
capital IRB approach. The adjustment is assessed separately for
both defaulted and non-defaulted exposures. Where there is an
excess of regulatory expected loss over eligible provisions in either
assessments, the difference must be deducted from CET1. For non-
defaulted exposures where the EL is lower than the eligible
provisions, this may be included in Tier 2 capital up to a maximum of
0.6% of total credit RWAs.
Leverage Ratio Tier 1 Capital divided by Total Exposures, with this ratio expressed
as a percentage. Total exposures is the sum of On Balance Sheet
items, derivatives, securities financing transactions (SFTs), and Off
Balance Sheet items, net of any Tier 1 regulatory deductions that are
already included in these items.
Internationally
comparable capital
The Internationally Comparable CET1 ratio is an estimate of the
Group’s CET1 ratio calculated using rules comparable with our
global peers. The analysis aligns with the APRA study entitled
“International capital comparison study” (13 July 2015).
Derivative Valuation
Adjustments
A number of different valuation adjustments are made to the value of
derivative contracts to reflect the additional costs in holding these
contracts. The material valuation adjustments included within the
CBA result are CVA and FVA.
Credit value adjustment
(CVA)
The market value of counterparty credit risk on uncollateralised
derivative assets, calculated as the difference between the risk-free
portfolio value and the true portfolio value that takes into account the
possibility of a counterparty’s default.
Funding valuation
adjustment (FVA)
The expected funding cost or benefit over the life of the
uncollateralised derivative portfolio.

Disclaimer
The material in this presentation is general background information about the Group and its activities current as at the date of the presentation, 8 August 2018. It is information given in
summary form and does not purport to be complete. Information in this presentation is not intended to be relied upon as advice to investors or potential investors and does not take into
account the investment objectives, financial situation or needs of any particular investor. Investors should consider these factors, and consult with their own legal, tax, business and/or
financial advisors in connection with any investment decision.
This presentation may contain certain forward-looking statements within the meaning of the United States Private Securities Litigation Reform Act of 1995 and the securities laws of other
jurisdictions. Forward-looking statements can generally be identified by the use of forward-looking words such as “may”, “will”, “would”, “could”, “expect”, “intend”, “plan”, “aim”, “estimate”,
“target”, “anticipate”, “believe”, “continue”, “objectives”, “outlook”, “guidance” or other similar words, and include statements regarding the Group’s intent, belief or current expectations with
respect to the Group’s business and operations, market conditions, results of operations and financial condition, capital adequacy and risk management. Any forward-looking statements
included in this presentation speak only as at the date of this presentation and undue reliance should not be placed upon such statements. Although the Group believes the forward-looking
statements to be reasonable, they are not certain and involve known and unknown risks and assumptions, many of which are beyond the control of the Group, which may cause actual
results, conditions or circumstances to differ materially from those expressed or implied in such statements. To the maximum extent permitted by law, responsibility for the accuracy or
completeness of any forward-looking statements, whether as a result of new information, future events or results or otherwise, is disclaimed.
Readers are cautioned not to place undue reliance on forward-looking statements and the Group is under no obligation to update any of the forward-looking statements contained within this
presentation, subject to disclosure requirements applicable to the Group.
Readers should also be aware that certain financial data in this presentation may be considered “non-GAAP financial measures” under Regulation G of the U.S. Securities and Exchange Act
of 1934, and non-IFRS financial measures. The disclosure of such non-GAAP/IFRS financial measures in the manner included in this presentation would not be permissible in a registration
statement under the U.S. Securities Act of 1933. Such non-GAAP/IFRS financial measures do not have a standardized meaning prescribed by Australian Accounting Standards or
International Financial Reporting Standards (IFRS) and therefore may not be comparable to similarly titled measures presented by other entities, nor should they be construed as an
alternative to other financial measures determined in accordance with Australian Accounting Standards or IFRS. Readers are cautioned not to place undue reliance on any such measures.
Cash Profit
The Profit Announcement discloses the net profit after tax on both a statutory and cash basis. The statutory basis is prepared in accordance with the Corporations Act and the Australian
Accounting Standards, which comply with International Financial Reporting Standards (IFRS). The cash basis is used by management to present a clear view of the Bank’s operating results.
It is not a measure based on cash accounting or cash flows. The items excluded from cash profit, such as hedging and IFRS volatility and losses or gains on acquisition, disposal, closure and
demerger of businesses are calculated consistently with the prior year and prior half disclosures and do not discriminate between positive and negative adjustments. A list of items excluded
from cash profit is provided on page 4 of the Profit Announcement (PA), which can be accessed at our website: www.commbank.com.au/results
Images
Mastercard is a registered trademark and the circles design is a trademark of Mastercard International Incorporated.
Apple, the Apple logo, iPhone and iPad are trademarks of Apple Inc., registered in the U.S. and other countries. App Store is a service mark of Apple Inc.
Notes
62
Related Documents