Lusardi, Annamaria; Mitchell, Olivia S.; Oggero, Noemi Working Paper Debt close to retirement and its implications for retirement well-being CFS Working Paper Series, No. 631 Provided in Cooperation with: Center for Financial Studies (CFS), Goethe University Frankfurt Suggested Citation: Lusardi, Annamaria; Mitchell, Olivia S.; Oggero, Noemi (2019) : Debt close to retirement and its implications for retirement well-being, CFS Working Paper Series, No. 631, Goethe University Frankfurt, Center for Financial Studies (CFS), Frankfurt a. M., https://nbn-resolving.de/urn:nbn:de:hebis:30:3-515232 This Version is available at: http://hdl.handle.net/10419/205235 Standard-Nutzungsbedingungen: Die Dokumente auf EconStor dürfen zu eigenen wissenschaftlichen Zwecken und zum Privatgebrauch gespeichert und kopiert werden. Sie dürfen die Dokumente nicht für öffentliche oder kommerzielle Zwecke vervielfältigen, öffentlich ausstellen, öffentlich zugänglich machen, vertreiben oder anderweitig nutzen. Sofern die Verfasser die Dokumente unter Open-Content-Lizenzen (insbesondere CC-Lizenzen) zur Verfügung gestellt haben sollten, gelten abweichend von diesen Nutzungsbedingungen die in der dort genannten Lizenz gewährten Nutzungsrechte. Terms of use: Documents in EconStor may be saved and copied for your personal and scholarly purposes. You are not to copy documents for public or commercial purposes, to exhibit the documents publicly, to make them publicly available on the internet, or to distribute or otherwise use the documents in public. If the documents have been made available under an Open Content Licence (especially Creative Commons Licences), you may exercise further usage rights as specified in the indicated licence.

Welcome message from author
This document is posted to help you gain knowledge. Please leave a comment to let me know what you think about it! Share it to your friends and learn new things together.
Transcript
Lusardi, Annamaria; Mitchell, Olivia S.; Oggero, Noemi
Working Paper
Debt close to retirement and its implications forretirement well-being
CFS Working Paper Series, No. 631
Provided in Cooperation with:Center for Financial Studies (CFS), Goethe University Frankfurt
Suggested Citation: Lusardi, Annamaria; Mitchell, Olivia S.; Oggero, Noemi (2019) : Debt closeto retirement and its implications for retirement well-being, CFS Working Paper Series, No. 631,Goethe University Frankfurt, Center for Financial Studies (CFS), Frankfurt a. M.,https://nbn-resolving.de/urn:nbn:de:hebis:30:3-515232
This Version is available at:http://hdl.handle.net/10419/205235
Standard-Nutzungsbedingungen:
Die Dokumente auf EconStor dürfen zu eigenen wissenschaftlichenZwecken und zum Privatgebrauch gespeichert und kopiert werden.
Sie dürfen die Dokumente nicht für öffentliche oder kommerzielleZwecke vervielfältigen, öffentlich ausstellen, öffentlich zugänglichmachen, vertreiben oder anderweitig nutzen.
Sofern die Verfasser die Dokumente unter Open-Content-Lizenzen(insbesondere CC-Lizenzen) zur Verfügung gestellt haben sollten,gelten abweichend von diesen Nutzungsbedingungen die in der dortgenannten Lizenz gewährten Nutzungsrechte.
Terms of use:
Documents in EconStor may be saved and copied for yourpersonal and scholarly purposes.
You are not to copy documents for public or commercialpurposes, to exhibit the documents publicly, to make thempublicly available on the internet, or to distribute or otherwiseuse the documents in public.
If the documents have been made available under an OpenContent Licence (especially Creative Commons Licences), youmay exercise further usage rights as specified in the indicatedlicence.
No. 631
Annamaria Lusardi, Olivia S. Mitchell, and Noemi Oggero
Debt Close to Retirement and Its Implications for Retirement Well-being
The CFS Working Paper Series presents ongoing research on selected topics in the fields of money, banking and finance. The papers are circulated to encourage discussion and comment. Any opinions expressed in CFS Working Papers are those of the author(s) and not of the CFS. The Center for Financial Studies, located in Goethe University Frankfurt’s House of Finance, conducts independent and internationally oriented research in important areas of Finance. It serves as a forum for dialogue between academia, policy-making institutions and the financial industry. It offers a platform for top-level fundamental research as well as applied research relevant for the financial sector in Europe. CFS is funded by the non-profit-organization Gesellschaft für Kapitalmarktforschung e.V. (GfK). Established in 1967 and closely affiliated with the University of Frankfurt, it provides a strong link between the financial community and academia. GfK members comprise major players in Germany’s financial industry. The funding institutions do not give prior review to CFS publications, nor do they necessarily share the views expressed therein.
0
Debt Close to Retirement and Its Implications for Retirement Well-being
Annamaria Lusardi, Olivia S. Mitchell, and Noemi Oggero
July 8, 2019
Abstract We analyze debt and debt management of Americans nearing retirement age. We show that older people have numerous financial obligations that can lead to financial distress. Using data from the 2015 National Financial Capability Study and an extensive literature review, we show that lack of financial literacy, lack of information, and behavioral biases help explain the prevalence of debt later in life. Our evidence indicates that debt at older ages can negatively influence retirement well-being. Annamaria Lusardi The George Washington University School of Business Duques Hall, Suite 450E 2201 G Street, NW Washington, DC 20052 Tel: (202) 994-8410 E-mail: [email protected] Olivia S. Mitchell The Wharton School of the University of Pennsylvania 3620 Locust Walk, Steinberg Hall-Dietrich Hall Philadelphia, PA 19104 Tel: (215) 898-0424 E-mail: [email protected] Noemi Oggero University of Turin Piazza Arbarello 8 10122 Torino (TO) Italy E-mail: [email protected] This project received funding from the TIAA Institute and the Wharton School’s Pension Research Council/Boettner Center. The content is solely the responsibility of the authors and does not necessarily represent official views of the TIAA Institute or Wharton School’s Pension Research Council/Boettner Center. We thank Paul Yakoboski for many helpful comments. We are responsible for any errors or omissions. ©2019 Lusardi, Mitchell, and Oggero. All rights reserved.
1
Debt Close to Retirement and Its Implications for Retirement Well-being
Annamaria Lusardi, Olivia S. Mitchell, and Noemi Oggero
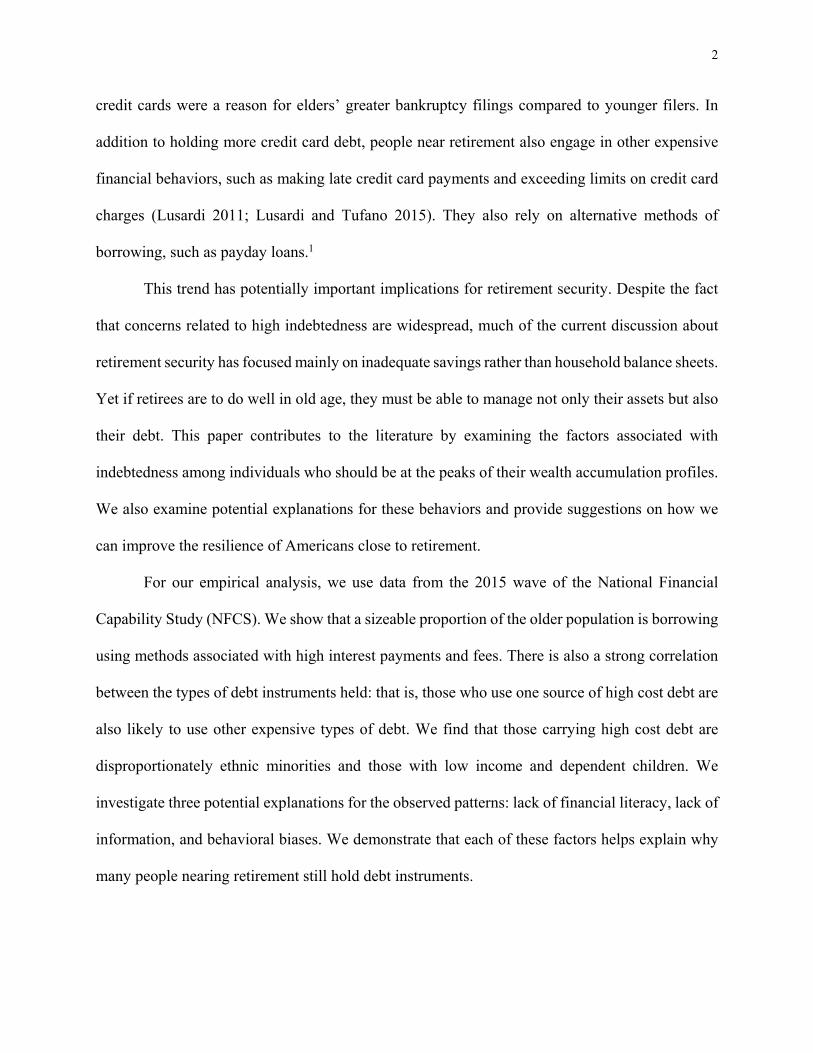
Older Americans (age 65+) appear increasingly vulnerable to financial distress in old age,
implying that they may not be resilient to sudden financial shocks, such as an unexpected loss of
income or an unforeseen increase in expenditures. One indicator of this condition is the substantial
increase in borrowing by older households: the Federal Reserve Board (2017) reported that median
debt for seniors grew by over 400 percent between 1989 and 2016, and the probability of older
households having borrowed rose substantially over time. In our own prior work, we have
documented that the percentage of people arriving close to retirement with debt grew from 64
percent in 1992 to 71 percent in 2010 (Lusardi et al. 2018). Moreover, the value of debt held by
people on the verge of retirement (age 56-61) also grew sharply: thus, median household debt for
this group in 1992 was under $6,800, but by 2004 it had more than quadrupled in real terms. In
2010, it was $32,700, nearly five times the 1992 level (in 2015 dollars). Similar findings are
reported by Brown et al. (this volume) who show that debt held by borrowers between the ages of
50 and 80 increased by roughly 60 percent from 2003 to 2015, while aggregate debt balances of
younger borrowers declined modestly over the same period. In 2015, older borrowers held
substantially more of nearly all types of debt than did borrowers in the same age group in 2003.
Much of the rise resulted from larger home mortgages, yet other debt including credit card and
medical debt also swelled over time (Lusardi et al., forthcoming).
One aspect of this change over time is that some components of debt, such as credit card
and other non-collateralized borrowing, charge high interest rates; these in turn can contribute to
financial distress in the older population. For example, Pottow (2012) found that elder debtors
carried 50 percent more credit card debt than did younger debtors, and that interest and fees on
2
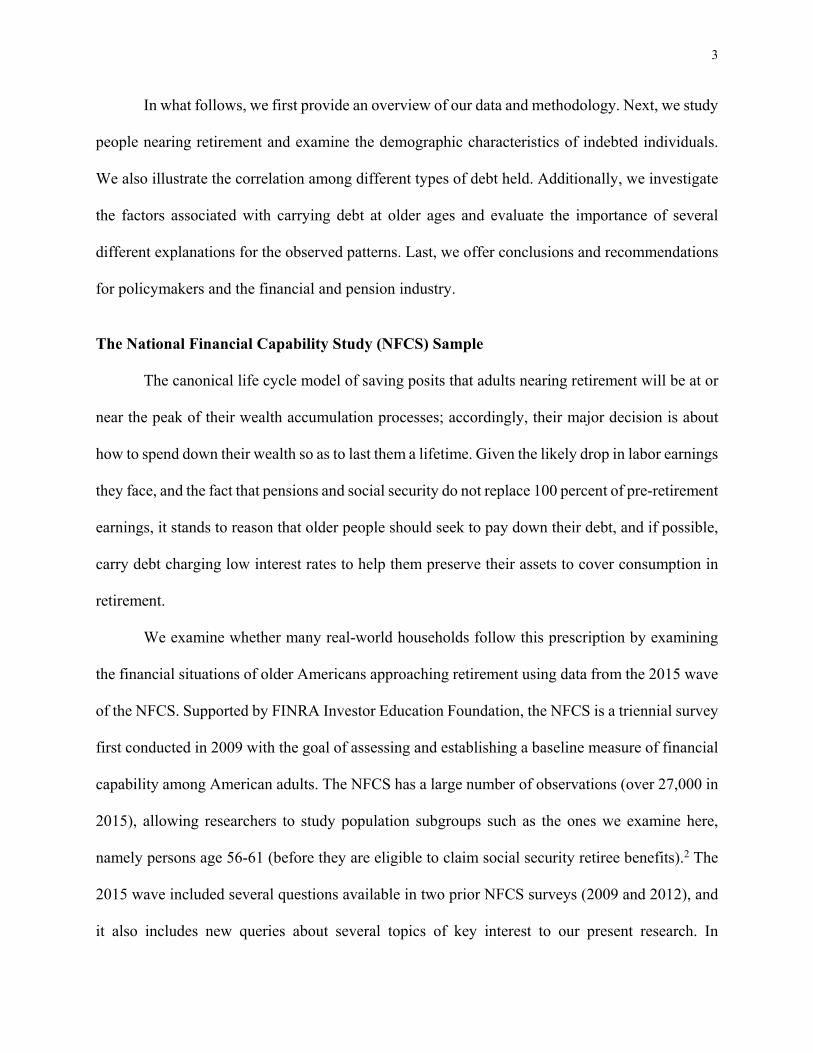
credit cards were a reason for elders’ greater bankruptcy filings compared to younger filers. In
addition to holding more credit card debt, people near retirement also engage in other expensive
financial behaviors, such as making late credit card payments and exceeding limits on credit card
charges (Lusardi 2011; Lusardi and Tufano 2015). They also rely on alternative methods of
borrowing, such as payday loans.1
This trend has potentially important implications for retirement security. Despite the fact
that concerns related to high indebtedness are widespread, much of the current discussion about
retirement security has focused mainly on inadequate savings rather than household balance sheets.
Yet if retirees are to do well in old age, they must be able to manage not only their assets but also
their debt. This paper contributes to the literature by examining the factors associated with
indebtedness among individuals who should be at the peaks of their wealth accumulation profiles.
We also examine potential explanations for these behaviors and provide suggestions on how we
can improve the resilience of Americans close to retirement.
For our empirical analysis, we use data from the 2015 wave of the National Financial
Capability Study (NFCS). We show that a sizeable proportion of the older population is borrowing
using methods associated with high interest payments and fees. There is also a strong correlation
between the types of debt instruments held: that is, those who use one source of high cost debt are
also likely to use other expensive types of debt. We find that those carrying high cost debt are
disproportionately ethnic minorities and those with low income and dependent children. We
investigate three potential explanations for the observed patterns: lack of financial literacy, lack of
information, and behavioral biases. We demonstrate that each of these factors helps explain why
many people nearing retirement still hold debt instruments.
3
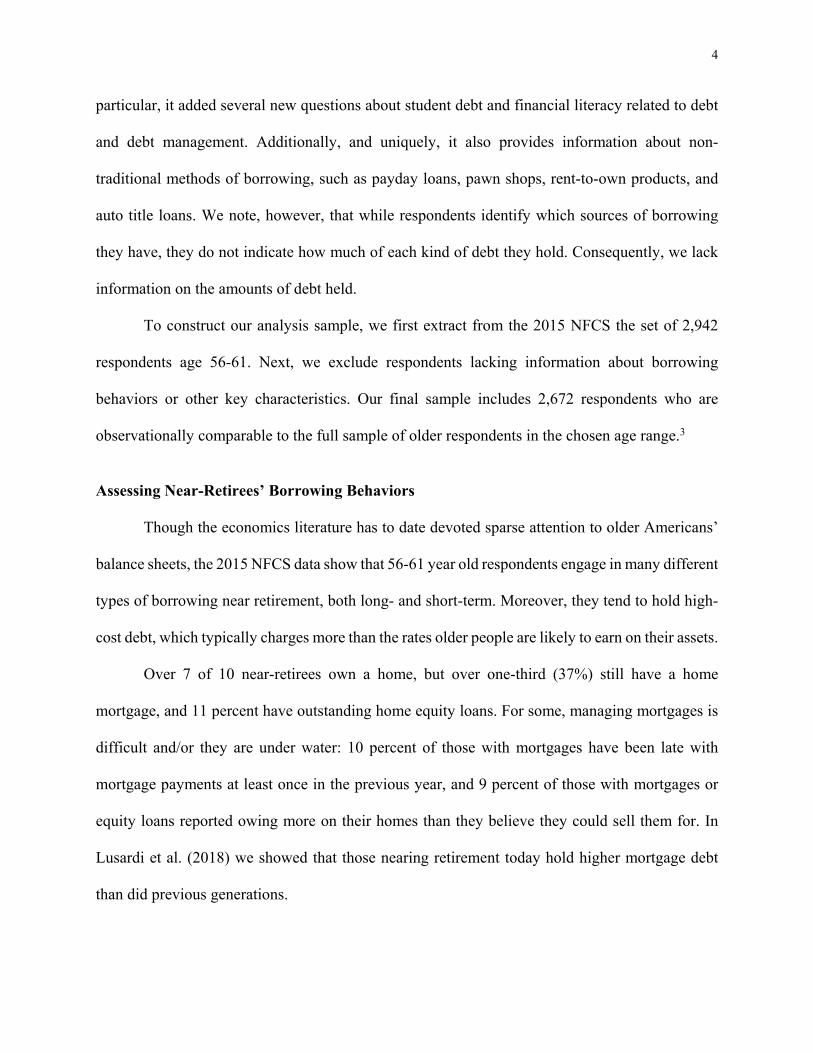
In what follows, we first provide an overview of our data and methodology. Next, we study
people nearing retirement and examine the demographic characteristics of indebted individuals.
We also illustrate the correlation among different types of debt held. Additionally, we investigate
the factors associated with carrying debt at older ages and evaluate the importance of several
different explanations for the observed patterns. Last, we offer conclusions and recommendations
for policymakers and the financial and pension industry.
The National Financial Capability Study (NFCS) Sample
The canonical life cycle model of saving posits that adults nearing retirement will be at or
near the peak of their wealth accumulation processes; accordingly, their major decision is about
how to spend down their wealth so as to last them a lifetime. Given the likely drop in labor earnings
they face, and the fact that pensions and social security do not replace 100 percent of pre-retirement
earnings, it stands to reason that older people should seek to pay down their debt, and if possible,
carry debt charging low interest rates to help them preserve their assets to cover consumption in
retirement.
We examine whether many real-world households follow this prescription by examining
the financial situations of older Americans approaching retirement using data from the 2015 wave
of the NFCS. Supported by FINRA Investor Education Foundation, the NFCS is a triennial survey
first conducted in 2009 with the goal of assessing and establishing a baseline measure of financial
capability among American adults. The NFCS has a large number of observations (over 27,000 in
2015), allowing researchers to study population subgroups such as the ones we examine here,
namely persons age 56-61 (before they are eligible to claim social security retiree benefits).2 The
2015 wave included several questions available in two prior NFCS surveys (2009 and 2012), and
it also includes new queries about several topics of key interest to our present research. In
4
particular, it added several new questions about student debt and financial literacy related to debt
and debt management. Additionally, and uniquely, it also provides information about non-
traditional methods of borrowing, such as payday loans, pawn shops, rent-to-own products, and
auto title loans. We note, however, that while respondents identify which sources of borrowing
they have, they do not indicate how much of each kind of debt they hold. Consequently, we lack
information on the amounts of debt held.
To construct our analysis sample, we first extract from the 2015 NFCS the set of 2,942
respondents age 56-61. Next, we exclude respondents lacking information about borrowing
behaviors or other key characteristics. Our final sample includes 2,672 respondents who are
observationally comparable to the full sample of older respondents in the chosen age range.3
Assessing Near-Retirees’ Borrowing Behaviors
Though the economics literature has to date devoted sparse attention to older Americans’
balance sheets, the 2015 NFCS data show that 56-61 year old respondents engage in many different
types of borrowing near retirement, both long- and short-term. Moreover, they tend to hold high-
cost debt, which typically charges more than the rates older people are likely to earn on their assets.
Over 7 of 10 near-retirees own a home, but over one-third (37%) still have a home
mortgage, and 11 percent have outstanding home equity loans. For some, managing mortgages is
difficult and/or they are under water: 10 percent of those with mortgages have been late with
mortgage payments at least once in the previous year, and 9 percent of those with mortgages or
equity loans reported owing more on their homes than they believe they could sell them for. In
Lusardi et al. (2018) we showed that those nearing retirement today hold higher mortgage debt
than did previous generations.
5
Even though they are close to retirement, many respondents in our sample still carry student
loans.4 Additionally, many have already tapped into their retirement accounts; about 8 percent of
those who have retirement accounts had taken a loan or a hardship withdrawal in the previous 12
months.5
This group of near-retirees also engages in shorter-term borrowing behaviors likely to
imply fees and steep interest payments. For instance, over one-third of our respondents (36%)
carry a balance on their credit cards and are charged interest, while 23 percent exhibit what we call
expensive credit card behaviors, such as paying the minimum only, paying late or over-the-limit
fees, or using credit cards for cash advances, as described in Lusardi and Tufano (2015). Moreover,
18 percent of our respondents have borrowed from alternative financial services in the past five
years, using for example payday loans, auto title loans, rent-to-own, and pawnshops. These non-
bank financial services are high-cost borrowing methods, as they tend to charge much higher
interest than people can earn on their assets, sometimes higher than 300 percent per year.
Debt by Socio-Demographic Characteristics
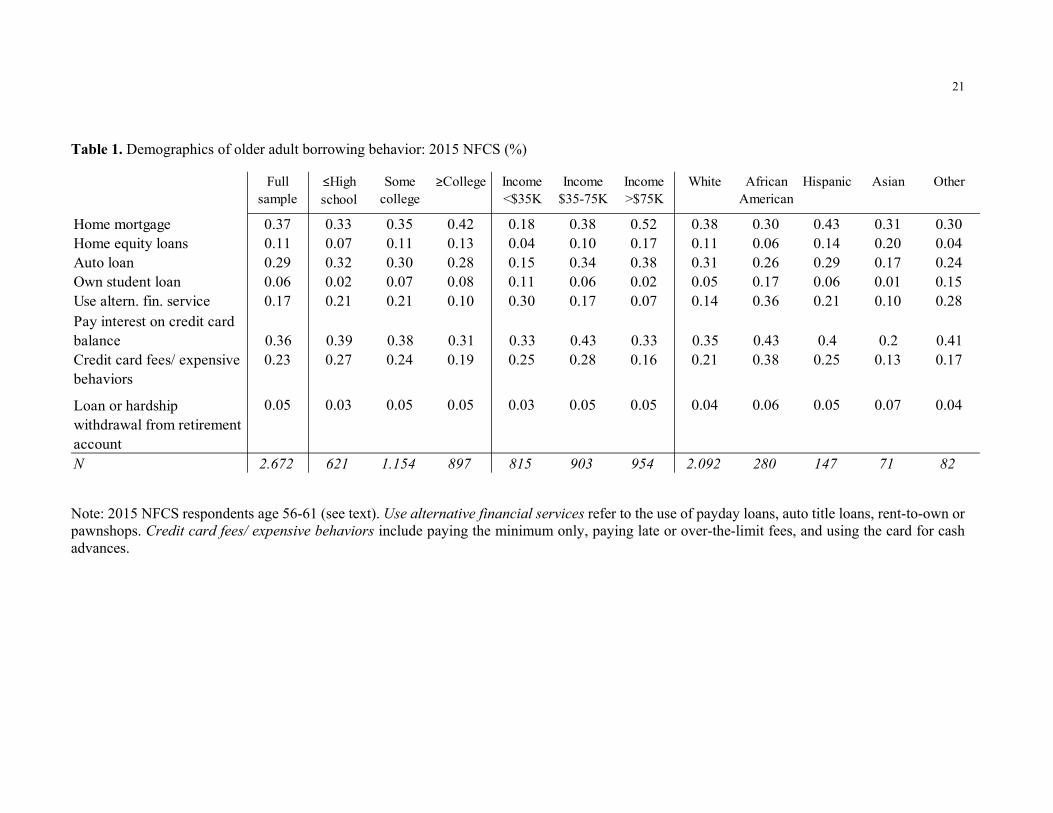
Table 1 reports debt experience by education, income, and ethnicity. Almost all debt
behaviors show a monotonic relationship with educational levels, which we group into three
categories: High school degree or less (≤High School), some college, and a Bachelor’s degree or
higher education (College+). Those with the highest education are much less likely to use high
cost borrowing, such that one-tenth of the College+ engage in alternative financial services,
compared to twice that many (21%) of those without a Bachelor’s degree. The opposite is observed
for home mortgages and to a lesser extent, home equity loans; 42 percent of the College+ have a
home mortgage, compared to one-third (35%, 33%) of respondents with some or no college.
Table 1 here
6
In addition to the educational divide reported above, our data also reveal a clear difference
in types of debt by income. Respondents with household income below $35,000 are 13 percentage
points (30% versus 17%) more likely to use alternative financial services compared to those with
income $35,000-$75,000, while just 7 percent of those with income over $75,000 did so. While
the highest and lowest income groups are equally likely to carry credit card debt, the lowest income
group is more likely to report expensive credit card behaviors.6
Turning to long-term debt, we see that the highest income group is, not surprisingly, more
likely to have mortgages, home equity loans, and auto loans. By contrast, people in the lowest
income group are more likely to have an outstanding student loan for their own education.
Interestingly, 74 percent of the lowest-income respondents with student loans had not earned a
Bachelor’s degree, making it more difficult to earn income needed to repay their student debt.
Finally, Table 1 reports a breakdown of debt by type for different ethnic groups, and we
see that some population subgroups are relatively more likely than others to use expensive forms
of credit. In particular, older African Americans are far more likely to use alternative financial
services, and exhibit expensive credit card behaviors. They are also much more likely to still carry
student loans for their own education: 17 percent of our older African American sample still has
student debt, compared to 5 percent of Whites, 6 percent of Hispanics, and just 1 percent of Asians.
In summary, older Americans drawing near to retirement hold distinct types of debt. Older
higher-income and better-educated people tend to have long-term debt, in particular, mortgages.
Lower-income and less-educated older persons are more likely to have borrowed from alternative
financial services. As for credit card debt, those with more education are less likely to carry card
balances, but there is no pattern with regards to income. Those with a college degree and higher
7
income are less likely to engage in other expensive credit card practices. In the next section, we
explore correlations across debt types.
Are Types of Debt Held at Older Ages Correlated?
Since people can hold several types of debt simultaneously, we next look to identify
whether older Americans engage in multiple forms of borrowing, and if so, what types of debt do
they carry. To this end, we analyze correlations among different types of debt behaviors on the
verge of retirement.
We find there is positive and significant correlation across types of long-term
(collateralized) debt such as having a mortgage, having a home equity loan, and having an auto
loan. We also find that having a home mortgage is negatively correlated with using alternative
financial services and having student loans at older ages, a finding in line with the analysis across
demographic characteristics discussed earlier. Interestingly, those still holding student loans for
their own education are most likely to use non-traditional methods of borrowing. Moreover, those
who pay interest on credit cards carry other types of debt (mortgages, auto loans, and student loans)
and those who use credit cards in expensive ways also use alternative financial services, such as
payday loans.7 In sum, these correlations again point to a clear differentiation between peoples’
use of debt.
Multivariate Analysis of Debt Close to Retirement
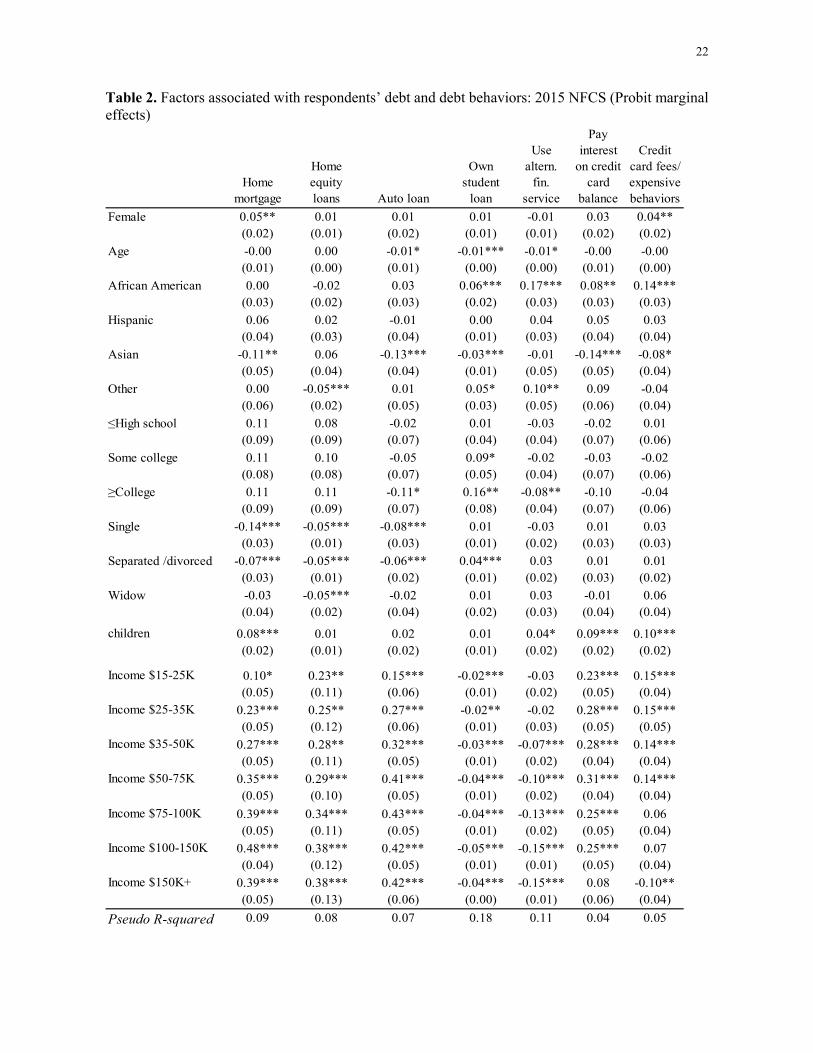
To shed more light on what explain debt close to retirement, in Table 2 we report marginal
effects from Probit regressions of our many debt variables on a set of demographic characteristics.
African-Americans are more likely to carry student loans close to retirement as well as to carry
debt that charge high interest, such as credit cards or payday loans. Those with dependent children
8
are also significantly more likely to carry high cost debt. There is an income divide when it comes
to debt. While higher income people carry loans such as mortgages, home equity lines of credit or
auto loans, they are much less likely to carry high-cost debt, such as credit cards, or use alternative
financial services. Those with low income pay interests on their credit card balances and use credit
cards in expensive ways.
Table 2 here
In sum, these results underscore some of the descriptive results mentioned earlier.
Nevertheless, more remains to be learned about why people approach retirement with so much
debt. Accordingly, in the next section, we turn to some additional explanations for the observed
patterns.
Inside the Black Box of Debt at Older Ages
To delve more deeply into the explanations driving debt at older ages, we next investigate
three potential factors: low financial literacy, lack of information, and behavioral biases. Our
analysis relies both on insights from related research, and on the 2015 NFCS along with other
information available from previous waves detailed below.
Low financial literacy. Prior research has found compelling evidence linking financial literacy to
debt management. For instance, less financially savvy persons tend to incur higher fees and borrow
at higher rates (Lusardi 2011; Lusardi and Tufano 2009, 2015). Moreover, those less financially
literate tend to report that their debt loads are excessive and they tend to use alternative financial
services (Lusardi and de Bassa Scheresberg 2013).
To this end, we turn to the so-called ‘Big Five’ questions devised to evaluate people’s
capacity to do simple interest rate calculations, to understand inflation and risk diversification, to
evaluate how mortgages work, and to understand asset pricing. In addition, to hone in on the
9
problem of debt at older ages, we also considered a sixth question about interest compounding in
the context of debt in the 2015 wave of the NFCS. The precise wording of the questions is given
below, with the correct answers indicated in bold.
Interest question Suppose you had $100 in a savings account and the interest rate was 2% per year. After 5 years, how much do you think you would have in the account if you left the money to grow?
More than $102 Exactly $102 Less than $102 Don’t know Prefer not to say
Inflation question Imagine that the interest rate on your savings account was 1% per year and inflation was 2% per year. After 1 year, how much would you be able to buy with the money in this account?
More than today Exactly the same Less than today Don’t know Prefer not to say
Risk diversification question Buying a single company’s stock usually provides a safer return than a stock mutual fund.
True False Don’t know Prefer not to say
Mortgage question Please tell me whether this statement is true or false. ‘A 15-year mortgage typically requires higher monthly payments than a 30-year mortgage, but the total interest paid over the life of the loan will be less.’
True False Do not know Prefer not to say
Bond pricing question If interest rates rise, what will typically happen to bond prices?
They will rise They will fall They will stay the same There is no relationship between bond prices and the interest rates Do not know Prefer not to say
Compounding interest question in the context of debt
10
Suppose you owe $1,000 on a loan and the interest rate you are charged is 20% per year compounded annually. If you didn’t pay anything off, at this interest rate, how many years would it take for the amount you owe to double?
Less than 2 years At least 2 years but less than 5 years At least 5 years but less than 10 years At least 10 years Do not know Prefer not to say
Some might anticipate that people nearing retirement would have acquired the financial
knowhow required to manage financial decisions, and borrowing in particular, but older
Americans only answered 3.69 questions of the six financial literacy questions correctly, on
average, performing only moderately better than the entire NFCS sample (scoring 3.15 correct on
average).
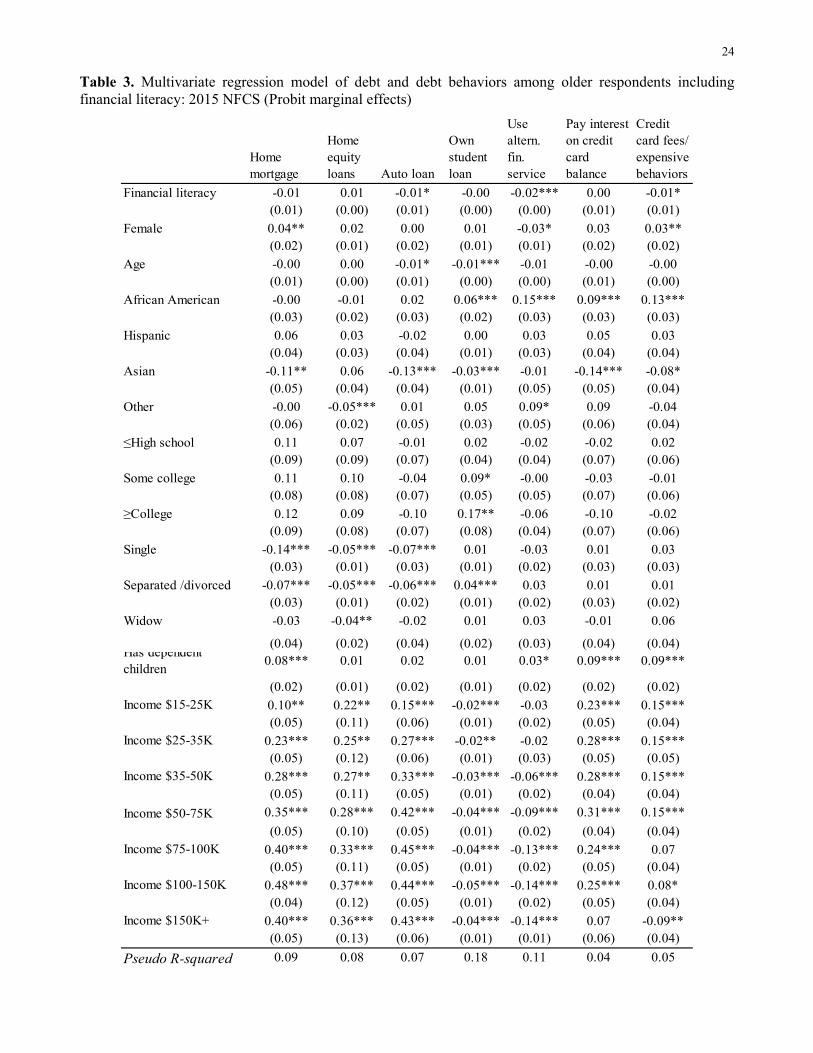
A deeper analysis of the determinants of debt appears in Table 3, where we now include
financial literacy as an additional control. Financial literacy matters, in particular for the high cost
debt; those who have higher financial literacy are less likely to use alternative financial services
or to use credit cards in expensive ways. They are also less likely to have auto loans close to
retirement. Other coefficient estimates are similar to those reported in Table 2. The estimates in
Table 3 demonstrate that financial literacy is also a predictor of debt close to retirement. That is,
even after controlling for all the other factors discussed above, financial knowledge helps people
manage their resources and stay out of high cost debt as they approach retirement.
Table 3 here
While we are aware that financial literacy could be an endogenous variable, we note that
Probit estimates such as those reported in the Table 3 could even underestimate the importance of
financial literacy given research indicating that instrumental variables analysis tends to generate
even larger effects (Lusardi and Mitchell 2011).
11
Lack of information. Another problem facing those nearing retirement is that making financial
decisions requires knowing what information to obtain if one is to successfully manage one’s
resources in old age. To explore debt decisions, the 2009 NFCS dataset does provide additional
insight about the information people gathered during their decision process. Because age was not
recorded as a continuous variable in that survey, we focus on individuals age 55-64 in what
follows.8
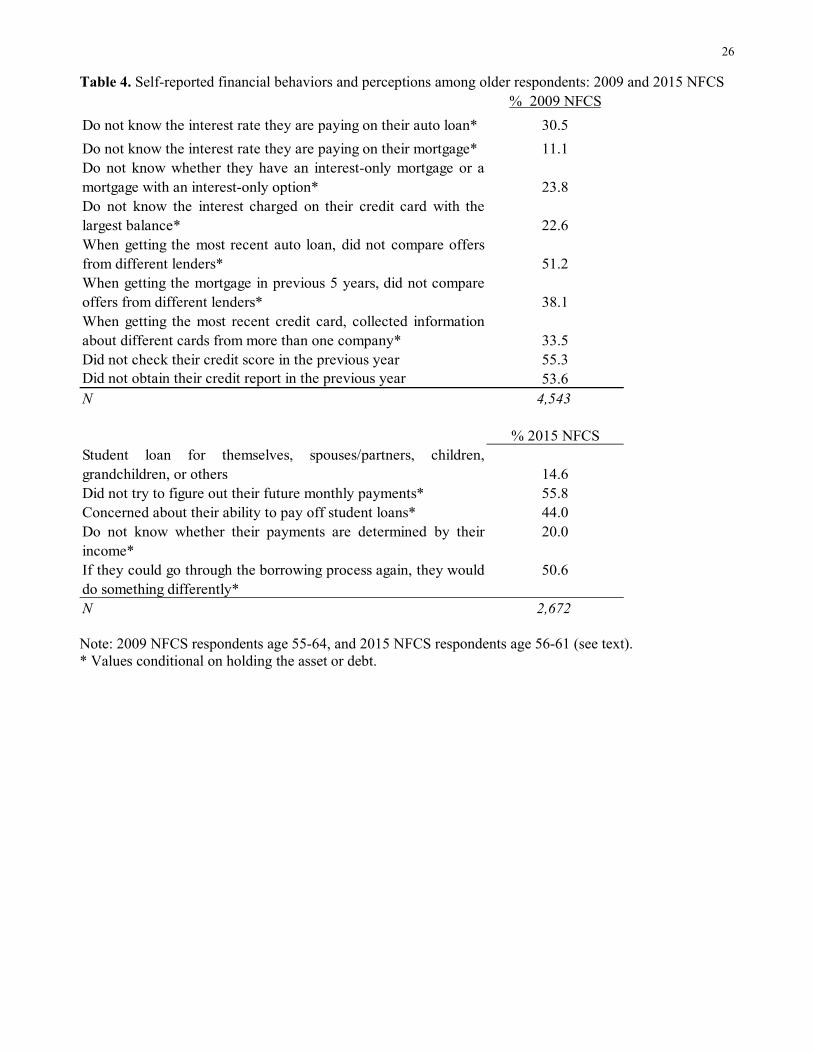
In this older sample, we learn that people had little or no information on critical variables.
For instance, Table 4 shows that 31 percent of those with auto loans did not know the interest rate
they were paying, and 11 percent of individuals with a mortgage did not know their mortgage
interest rates. Almost one in four (24%) of those with mortgages did not know whether they had
an interest-only mortgage or a mortgage with an interest-only option. While individuals may
understandably forget their mortgage interest rates, this information is nonetheless crucial when
deciding whether to refinance or, alternatively, to lock in low interest rates before interest rates
rise. Our results also show that many people are unaware of the interest charged on their current
loans. Among near-retirees having at least one credit card, almost one-fifth (23%) of those who
did not always pay their credit card in full stated that they did not know the interest charged on the
card where they had the largest balance. Clearly, many near-retirees make borrowing decisions
without knowing much about the debt they are assuming.
Table 4 here
Another way to examine how individuals borrow is provided by answers to questions about
whether they compared similar types of credit offered by different providers. Over half (51%) of
near-retirees with an auto loan, and 38 percent of those with a mortgage, did not compare offers,
and only one-third of credit card holders collected information from more than one card company.
12
In other words, people with years of borrowing experience apparently do little to learn about
pricing options, nor do they shop around to get good terms.
The 2009 NFCS also shows that many near-retirees were unaware of their credit scores, a
key factors driving the interest rates charged on mortgages, loans, and other instruments (Lusardi
2011). In fact, 55 percent of people age 55-64 in the 2009 NFCS had not checked their credit scores
in the previous year, and almost the same percentage (54%) did not obtain their credit reports.
We previously noted that 6 percent of near-retirees still hold student loans taken out for
their own education. Additional information in the 2015 NFCS also shows that many older people
have taken on student loans for others, including spouses, partners, children, and grandchildren.
Considering all educational debt, 15 percent of respondents age 56-61 held student debt in the
2015 NFCS. It is concerning that many borrowers did not fully comprehend what they were getting
into when they took out these loans (FINRA Investor Education Foundation 2016). Specifically,
over half (56%) of borrowers in this age group did not try to figure out how much their future
monthly payments would be, before taking out the loans. Not surprisingly, 44 percent of those
with student loans at older ages expressed concern about their ability to pay off this debt, and the
percentages were far higher for the lower income subgroup.
Many, but not all, student debt repayment plans are income-driven to make student debt
more manageable, yet one in five of older student loan borrowers indicated that they did not know
whether their payments were determined by their income. This suggests that many of those who
borrow collect insufficient information about the consequences of this debt (Lusardi et al. 2016).
Interestingly and alarmingly, over half (51%) of these older student loan borrowers indicated that,
if they could go through the borrowing process again, they would do something differently.
13
We also correlate 2015 NFCS respondents’ lack of information and negative perceptions
of their student loans with their levels of financial literacy. Borrowers that do not know whether
their payments are determined by their income or concerned about their ability to pay off the debt
have lower financial literacy scores (older Americans scored 3.69 on average).
Behavioral biases. The evidence on heavy debt burdens held by many Americans may suggest
that behavioral biases could also be responsible for observed borrowing patterns. In what follows,
we review some of the literature regarding biases influencing decision-making around debt, and
we offer an assessment of the extent to which these can explain the evidence provided in the
previous sections.
The emergent field of behavioral economics extends the standard understanding of
financial decision-making with insights from psychological research, which could be relevant to
understand debt and debt management. One of its central contributions is to recognize
psychological factors driving behavior, such as, for example, lack of self-control (Benton et el.
2007). Gathergood (2012a) showed that consumers having self-control problems were more likely
to report over-indebtedness and make greater use of high cost credit products, such as store cards
and payday loans. Similarly, individuals favoring immediate gratification had higher levels of
unsecured debts on revolving accounts like credit cards (Benton et al. 2007). Additional research
by Achtziger et al. (2015) suggested that compulsive buying serves as a link between self-control
skills and debt: that is, people lacking self-control buy compulsively, in turn affecting debt.
Impulsivity driving debt decisions has also been confirmed by Ottaviani and Vandone (2011), who
showed that impulsivity predicted unsecured debt like consumer credit, but it was not significantly
associated with secured debt such as mortgages. This finding may explain the relatively high
percentage of older individuals with short-term high-cost debt we found above.
14
Lack of self-control and impulsive spending behavior can also help explain the ‘co-holding
puzzle’ that is the co-existence of high cost revolving consumer credit together with low-yield
liquid savings (Gathergood and Weber 2014; Bertaut et al. 2009). The notion is that consumers
can minimize their vulnerability to impulsive spending by maintaining revolving consumer debt
while simultaneously holding money in bank accounts. Laibson et al. (2003) identified hyperbolic
time preferences as a possible resolution of this debt puzzle: that is, some consumers act
inconsistently, acting patiently when accumulating illiquid wealth, but impatiently when using
credit cards. In such a scenario, simulated consumers with hyperbolic time preferences would tend
to borrow on credit cards and accumulate relatively large stocks of illiquid wealth by retirement.
Telyukova (2013) also suggested that households that accumulate credit card debt may not be able
to pay it off using their bank accounts because they anticipate needing that money in situations
where credit cards cannot be used.
Another source of suboptimal decision-making related to credit cards is termed
‘anchoring’. This arises since credit card companies indicate on their bills the ‘minimum amount
due’, an amount generally less than the full bill. Keys and Wang (2019) showed that this minimum
payment acts as a lower psychological repayment bound for a majority of consumers, so anchoring
can generate suboptimally high debt levels. This may explain why so many older individuals in
our sample continue to carry credit debt and pay only the minimum.
Still another behavioral bias linked to household decision-making around debt refers to
‘exponential growth bias’, or peoples’ tendency to linearize exponential growth and hence to
underestimate the future value of a variable growing at a constant rate. For example, Stango and
Zinman (2009) showed that this could explain peoples’ propensity to underestimate the effect of
high interest rates leading them to borrow more and save less. Although this bias is conceptually
15
distinct from peoples’ lack of financial literacy, Almenberg and Gerdes (2012) discovered that
exponential growth bias was negatively correlated with financial literacy. Accordingly, studies of
the relationship between the bias and household financial decisions should include controls for
financial literacy to isolate the effect of this bias.
Stango and Zinman (2006) also documented a pervasive bias among US consumers who
systematically underestimated the interest rate associated with a loan principal amount and stream
of repayments. They found that biased consumers held loans with higher interest rates but mainly
when they borrowed from non-bank lenders. This result is consistent with the fact that non-bank
lenders emphasize monthly payments rather than interest rates levied. It is not clear whether this
is a true bias, or simply an indicator of lack of financial literacy. A more complete study by
Gathergood and Weber (2017) investigated behavioral biases in the presence of low financial
literacy, and they showed that poor financial literacy and impatience boosted the likelihood of
choosing mortgages with lower up-front costs but larger eventual payments. Indeed, the key
feature of many alternative mortgage products is that payments often cover only the interest due,
or in some cases, are less than the value of the interest due for an initial period. As suggested by
Cocco (2013), more complex mortgages paired with low levels of financial literacy may result in
people not realizing that low initial mortgage payments imply larger future loan balances. Others
have found that people with present-biased preferences are also more likely to have credit card
debt and higher credit card balances (Meier and Sprenger 2010), and fail to stick to their self-set
debt paydown plans (Kuchler and Pagel 2018). Campbell et al. (2011) argued that many present-
biased consumers would display greater patience if they could commit to a plan of savings and
future consumption.
16
Besides the behavioral biases discussed so far, individual debt choices may also be affected
by social norms including shared ideals that drive behavioral expectations around finances. For
instance, Almenberg et al. (2018) argued that higher debt levels could be due to a cultural shift in
attitudes toward debt, and their study concluded that individuals who reported being uncomfortable
with debt had considerably lower debt-to-income ratios than others. Moreover, there may be an
intergenerational transmission of attitudes toward debt which can change over time (Baum and
O’Malley 2003). This point was underscored by Gathergood (2012b), who reported that people
who faced difficulties repaying their unsecured debt in high-bankruptcy areas experienced less
psychological stress. This could be due to reduced social stigma associated with debt problems in
areas where such problem is more prevalent. Moreover, Lea et al. (1993) found that serious debtors
had slightly more permissive attitudes towards debt, as they knew more people who were in debt
and were less likely to think that their friends or relatives would disapprove if they knew. We
cannot directly test these hypotheses in our data, yet exploring these explanations is surely an
important area for future research.
Conclusion
This paper has reported that a sizeable proportion of older Americans carry debt on the
verge of retirement. There is also some important heterogeneity with regard to the types of debt
people hold. Using the 2015 NFCS, we show that low-income people, those with financially
dependent children, and African Americans tend to be more likely to hold high cost debt at older
ages. Those with higher-income tend to be better protected against these stresses.
Several explanations can help explain why individuals carry debt late in their life cycles.
In addition to explanations related to demographic factors and income, we also investigated the
role of financial illiteracy, lack of information, and behavioral biases. More research is necessary
17
to pin down the precise quantitative importance of each explanation, yet our analysis indicates they
are all promising explanations for why so many individuals carry debt close to retirement, with
potentially erosive implications for retirement well-being.
Our analysis has several implications for academics, policymakers, practitioners, and the
financial and pension industry. While much attention in the life cycle literature has been devoted
to savings, our work demonstrates that it is also crucial for researchers to pay attention to debt and
the problems people have with carrying debt in later life. To help people cope with such real-world
problems, programs could be targeted at workers to discuss debt and debt management; for
example, workplace financial wellness programs could cover topics beyond investing and saving.
In view of the fact that so many people carry student loans late in their lifetimes, it may also be
important to add financial education in high school, to college, and beyond, with lessons explicitly
devoted to debt and debt management. Moreover, with the growth of FinTech, new products are
being developed to help people manage their spending and credit card debt (Agnew and Mitchell,
forthcoming; NCOA 2017). Insights from behavioral economics can also offer new ways to help
people manage debt; for instance the AARP has been working to establish ‘rainy day savings
accounts’ to help workers avoid taking funds from their retirement accounts (Dixon 2018). As the
responsibility to save for retirement continues to shift to individuals over time, it is important to
ensure that individuals have the skills not only to manage their assets, but also their debts. Without
this, retirees will face the need to allocate ever-larger fractions of their incomes to cover their
borrowing.
18
References
Achtziger, A., M. Hubert, P. Kenning, G. Raab, and L. Reisch (2015). ‘Debt Out of Control: The Links between Self-control, Compulsive Buying, and Real Debts.’ Journal of Economic Psychology, 49: 141–149.
Agnew, J. and O. S. Mitchell, eds. (forthcoming). The Disruptive Impact of FinTech on Retirement Systems. Oxford, UK: Oxford University Press.
Almenberg, J., and C. Gerdes (2012). ‘Exponential Growth Bias and Financial Literacy.’ Applied Economics Letters, 19(17): 1693–1696.
Almenberg, J., A. Lusardi, J. Säve-Söderbergh, and J. R. Vestman (2018). ‘Attitudes toward Debt and Debt Behavior.’ NBER Working Paper No. 24935. Cambridge, MA: National Bureau of Economic Research.
Baum, S. and M. O'Malley (2003). ‘College on Credit: How Borrowers Perceive Their Education Debt.’ Journal of Student Financial Aid, 33(3): 7–19.
Benton, M., S. Meier, and C. Sprenger (2007). ‘Overborrowing and Undersaving: Lessons and Policy Implications from Research in Behavioral Economics.’ Public and Community Affairs Discussion Paper No. 2007-4, Federal Reserve Bank of Boston Discussion Paper.
Bertaut, C. C., M. Haliassos, and M. Reiter (2009). ‘Credit Card Debt Puzzles and Debt Revolvers for Self-Control.’ Review of Finance, 13(4): 657–692.
Brown, M., D. Lee, J. Scally, K. Strair, and W. van der Klaauw (2020). ‘The Graying of American Debt.’ This volume.
Campbell, J., H. E. Jackson, B. C. Madrian, and P. Tufano (2011). ‘Consumer Financial Protection.’ Journal of Economic Perspectives, 25(1): 91–114.
Cocco, J. F. (2013). ‘Evidence on the Benefits of Alternative Mortgage Products.’ Journal of Finance, 68(4): 1663–1690.
Dixon, A. (2018). ‘Sidecar Accounts Could Help Solve the Savings Crisis.’ Bankrate.Com. March 20. https://www.bankrate.com/banking/savings/sidecar-savings-account-could-help-resolve-savings-crisis/
Federal Reserve Board (2017). 2016 Survey of Consumer Finances. http://www.federalreserve.gov/econres/scfindex.htm
FINRA Investor Education Foundation (2016). Financial Capability in the United States 2016. http://gflec.org/wp-content/uploads/2016/07/NFCS_2015_Report_Natl_Findings.pdf
Gathergood, J. (2012a). ‘Self-control, Financial Literacy and Consumer Over-indebtedness.’ Journal of Economic Psychology, 33(3): 590–602.
Gathergood, J. (2012b). ‘Debt and Depression: Causal Links and Social Norm Effects.’ The Economic Journal, 122(563): 1094–1114.
Gathergood, J. and J. Weber (2014). ‘Self-control, Financial Literacy and the Co-holding Puzzle.’ Journal of Economic Behavior & Organization, 107(PB): 455–469.
Gathergood, J. and J. Weber (2017). ‘Financial Literacy, Present Bias and Alternative Mortgage Products.’ Journal of Banking and Finance, 78(C): 58–83.
19
Keys, B. J. and J. Wang (2019). ‘Minimum Payments and Debt Paydown in Consumer Credit Cards.’ Journal of Financial Economics, 131(3): 528–548.
Kuchler, T. and M. Pagel (2018). ‘Sticking to Your Plan: The Role of Present Bias for Credit Card Paydown.’ NBER Working Paper No. 24881. Cambridge, MA: National Bureau of Economic Research.
Laibson, D., A. Repetto, and J. Tobacman (2003). ‘A Debt Puzzle.’ In Aghion P, R. Frydman, J. Stiglitz, and M. Woodford, eds., Knowledge, Information, and Expectations in Modern Economics: In Honor of Edmund S. Phelps. Princeton: Princeton University Press; pp. 228–266.
Lea, S. E. A., P. Webley, and R. M. Levine (1993). ‘The Economic Psychology of Consumer Debt.’ Journal of Economic Psychology, 14(1): 85–119.
Lusardi, A. (2011). ‘Americans’ Financial Capability.’ NBER Working Paper No. 17103. Cambridge, MA: National Bureau of Economic Research.
Lusardi, A. and C. de Bassa Scheresberg (2013). ‘Financial Literacy and High-Cost Borrowing in the United States.’ NBER Working Paper No. 18969. Cambridge, MA: National Bureau of Economic Research.
Lusardi, A., C. de Bassa Scheresberg, and N. Oggero (2016). ‘Student Loan Debt in the US: An Analysis of the 2015 NFCS Data.’ GFLEC Policy Brief. Washington, DC: Global Financial Literacy Excellence Center.
Lusardi, A. and O. S. Mitchell (2011). ‘Financial Literacy and Retirement Planning in the United States.’ Journal of Pension Economics and Finance, 10(4): 509–525.
Lusardi, A. and O. S. Mitchell (2013). ‘Debt and Debt Management among Older Adults.’ GFLEC Working Paper No. 2013-2. Washington, DC: Global Financial Literacy Excellence Center.
Lusardi, A., O. S. Mitchell, and N. Oggero (2018). ‘The Changing Face of Debt and Financial Fragility at Older Ages.’ AEA Papers and Proceedings, 108: 407–411.
Lusardi, A., O. S. Mitchell, and N. Oggero (forthcoming). ‘Debt and Financial Vulnerability on the Verge of Retirement.’ Journal of Money, Credit, and Banking.
Lusardi, A. and P. Tufano (2009). ‘Teach Workers about the Peril of Debt.’ Harvard Business Review, 87(11): 22–24.
Lusardi, A. and P. Tufano (2015). ‘Debt Literacy, Financial Experiences, and Overindebtedness.’ Journal of Pension Economics and Finance, 14(4): 332–368.
Malito, A. (2019). ‘Lax Payday Loan Regulations Could Hit Older Americans Especially Hard.’ MarketWatch, February 9. https://www.marketwatch.com/story/lax-payday-loan-regulations-could-hit-older-americans-especially-hard-2019-02-08
Meier, S. and C. Sprenger (2010). ‘Present-Biased Preferences and Credit Card Borrowing.’ American Economic Journal: Applied Economics, 2(1): 193–210.
NCOA (2017). ‘Older Adults and Debt: Trends, Tradeoffs, and Tools to Help.’ https://www.ncoa.org/wp-content/uploads/NCOA-Older-Adult-Issue-Debt-Brief.pdf
Ottaviani, C. and D. Vandone (2011). ‘Impulsivity and Household Indebtedness: Evidence from Real Life.’ Journal of Economic Psychology, 32(5): 754–761.
20
Pottow, J. A. E. (2012). ‘The Rise in Elder Bankruptcy Filings and Failure of U.S. Bankruptcy Law.’ The Elder Law Journal, 19(1), 119–157.
Stango, V. and J. Zinman (2006). ‘How a Cognitive Bias Shapes Competition? Evidence from Consumer Credit Markets.’ Dartmouth College Working Paper.
Stango, V. and J. Zinman (2009). ‘Exponential Growth Bias and Household Finance.’ Journal of Finance, 64(6): 2807–2849.
Telyukova, I. (2013). ‘Household Need for Liquidity and the Credit Card Debt Puzzle.’ Review of Economic Studies, 80(3): 1148–1177.
21
Table 1. Demographics of older adult borrowing behavior: 2015 NFCS (%)
Home mortgage 0.37 0.33 0.35 0.42 0.18 0.38 0.52 0.38 0.30 0.43 0.31 0.30Home equity loans 0.11 0.07 0.11 0.13 0.04 0.10 0.17 0.11 0.06 0.14 0.20 0.04Auto loan 0.29 0.32 0.30 0.28 0.15 0.34 0.38 0.31 0.26 0.29 0.17 0.24Own student loan 0.06 0.02 0.07 0.08 0.11 0.06 0.02 0.05 0.17 0.06 0.01 0.15Use altern. fin. service 0.17 0.21 0.21 0.10 0.30 0.17 0.07 0.14 0.36 0.21 0.10 0.28Pay interest on credit card balance 0.36 0.39 0.38 0.31 0.33 0.43 0.33 0.35 0.43 0.4 0.2 0.41Credit card fees/ expensive behaviors
0.23 0.27 0.24 0.19 0.25 0.28 0.16 0.21 0.38 0.25 0.13 0.17
Loan or hardship withdrawal from retirement account
0.05 0.03 0.05 0.05 0.03 0.05 0.05 0.04 0.06 0.05 0.07 0.04
N 2.672 621 1.154 897 815 903 954 2.092 280 147 71 82
OtherIncome >$75K
Full sample
≤High school
Some college
≥College Income <$35K
Income $35-75K
White African American
Hispanic Asian
Note: 2015 NFCS respondents age 56-61 (see text). Use alternative financial services refer to the use of payday loans, auto title loans, rent-to-own or pawnshops. Credit card fees/ expensive behaviors include paying the minimum only, paying late or over-the-limit fees, and using the card for cash advances.
22
Table 2. Factors associated with respondents’ debt and debt behaviors: 2015 NFCS (Probit marginal effects)
Home mortgage
Home equity loans Auto loan
Own student
loan
Use altern.
fin. service
Pay interest
on credit card
balance
Credit card fees/ expensive behaviors
Female 0.05** 0.01 0.01 0.01 -0.01 0.03 0.04**(0.02) (0.01) (0.02) (0.01) (0.01) (0.02) (0.02)
Age -0.00 0.00 -0.01* -0.01*** -0.01* -0.00 -0.00(0.01) (0.00) (0.01) (0.00) (0.00) (0.01) (0.00)
African American 0.00 -0.02 0.03 0.06*** 0.17*** 0.08** 0.14***(0.03) (0.02) (0.03) (0.02) (0.03) (0.03) (0.03)
Hispanic 0.06 0.02 -0.01 0.00 0.04 0.05 0.03(0.04) (0.03) (0.04) (0.01) (0.03) (0.04) (0.04)
Asian -0.11** 0.06 -0.13*** -0.03*** -0.01 -0.14*** -0.08*(0.05) (0.04) (0.04) (0.01) (0.05) (0.05) (0.04)
Other 0.00 -0.05*** 0.01 0.05* 0.10** 0.09 -0.04(0.06) (0.02) (0.05) (0.03) (0.05) (0.06) (0.04)
≤High school 0.11 0.08 -0.02 0.01 -0.03 -0.02 0.01(0.09) (0.09) (0.07) (0.04) (0.04) (0.07) (0.06)
Some college 0.11 0.10 -0.05 0.09* -0.02 -0.03 -0.02(0.08) (0.08) (0.07) (0.05) (0.04) (0.07) (0.06)
≥College 0.11 0.11 -0.11* 0.16** -0.08** -0.10 -0.04(0.09) (0.09) (0.07) (0.08) (0.04) (0.07) (0.06)
Single -0.14*** -0.05*** -0.08*** 0.01 -0.03 0.01 0.03(0.03) (0.01) (0.03) (0.01) (0.02) (0.03) (0.03)
Separated /divorced -0.07*** -0.05*** -0.06*** 0.04*** 0.03 0.01 0.01(0.03) (0.01) (0.02) (0.01) (0.02) (0.03) (0.02)
Widow -0.03 -0.05*** -0.02 0.01 0.03 -0.01 0.06(0.04) (0.02) (0.04) (0.02) (0.03) (0.04) (0.04)
children 0.08*** 0.01 0.02 0.01 0.04* 0.09*** 0.10***(0.02) (0.01) (0.02) (0.01) (0.02) (0.02) (0.02)
Income $15-25K 0.10* 0.23** 0.15*** -0.02*** -0.03 0.23*** 0.15***(0.05) (0.11) (0.06) (0.01) (0.02) (0.05) (0.04)
Income $25-35K 0.23*** 0.25** 0.27*** -0.02** -0.02 0.28*** 0.15***(0.05) (0.12) (0.06) (0.01) (0.03) (0.05) (0.05)
Income $35-50K 0.27*** 0.28** 0.32*** -0.03*** -0.07*** 0.28*** 0.14***(0.05) (0.11) (0.05) (0.01) (0.02) (0.04) (0.04)
Income $50-75K 0.35*** 0.29*** 0.41*** -0.04*** -0.10*** 0.31*** 0.14***(0.05) (0.10) (0.05) (0.01) (0.02) (0.04) (0.04)
Income $75-100K 0.39*** 0.34*** 0.43*** -0.04*** -0.13*** 0.25*** 0.06(0.05) (0.11) (0.05) (0.01) (0.02) (0.05) (0.04)
Income $100-150K 0.48*** 0.38*** 0.42*** -0.05*** -0.15*** 0.25*** 0.07(0.04) (0.12) (0.05) (0.01) (0.01) (0.05) (0.04)
Income $150K+ 0.39*** 0.38*** 0.42*** -0.04*** -0.15*** 0.08 -0.10**(0.05) (0.13) (0.06) (0.00) (0.01) (0.06) (0.04)
Pseudo R-squared 0.09 0.08 0.07 0.18 0.11 0.04 0.05

23
Note: 2015 NFCS respondents age 56-61 (see text; N=2,672). Use alternative financial services refer to the use of payday loans, auto title loans, rent-to-own or pawnshops. Credit card fees and expensive behaviors include paying the minimum only, paying late or over-the-limit fees, and using the card for cash advances. Standard errors in parentheses. *** p<0.01, ** p<0.05, * p<0.1
24
Table 3. Multivariate regression model of debt and debt behaviors among older respondents including financial literacy: 2015 NFCS (Probit marginal effects)
Home mortgage
Home equity loans Auto loan
Own student loan
Use altern. fin. service
Pay interest on credit card balance
Credit card fees/ expensive behaviors
Financial literacy -0.01 0.01 -0.01* -0.00 -0.02*** 0.00 -0.01*(0.01) (0.00) (0.01) (0.00) (0.00) (0.01) (0.01)
Female 0.04** 0.02 0.00 0.01 -0.03* 0.03 0.03**(0.02) (0.01) (0.02) (0.01) (0.01) (0.02) (0.02)
Age -0.00 0.00 -0.01* -0.01*** -0.01 -0.00 -0.00(0.01) (0.00) (0.01) (0.00) (0.00) (0.01) (0.00)
African American -0.00 -0.01 0.02 0.06*** 0.15*** 0.09*** 0.13***(0.03) (0.02) (0.03) (0.02) (0.03) (0.03) (0.03)
Hispanic 0.06 0.03 -0.02 0.00 0.03 0.05 0.03(0.04) (0.03) (0.04) (0.01) (0.03) (0.04) (0.04)
Asian -0.11** 0.06 -0.13*** -0.03*** -0.01 -0.14*** -0.08*(0.05) (0.04) (0.04) (0.01) (0.05) (0.05) (0.04)
Other -0.00 -0.05*** 0.01 0.05 0.09* 0.09 -0.04(0.06) (0.02) (0.05) (0.03) (0.05) (0.06) (0.04)
≤High school 0.11 0.07 -0.01 0.02 -0.02 -0.02 0.02(0.09) (0.09) (0.07) (0.04) (0.04) (0.07) (0.06)
Some college 0.11 0.10 -0.04 0.09* -0.00 -0.03 -0.01(0.08) (0.08) (0.07) (0.05) (0.05) (0.07) (0.06)
≥College 0.12 0.09 -0.10 0.17** -0.06 -0.10 -0.02(0.09) (0.08) (0.07) (0.08) (0.04) (0.07) (0.06)
Single -0.14*** -0.05*** -0.07*** 0.01 -0.03 0.01 0.03(0.03) (0.01) (0.03) (0.01) (0.02) (0.03) (0.03)
Separated /divorced -0.07*** -0.05*** -0.06*** 0.04*** 0.03 0.01 0.01(0.03) (0.01) (0.02) (0.01) (0.02) (0.03) (0.02)
Widow -0.03 -0.04** -0.02 0.01 0.03 -0.01 0.06
(0.04) (0.02) (0.04) (0.02) (0.03) (0.04) (0.04)Has dependent children
0.08*** 0.01 0.02 0.01 0.03* 0.09*** 0.09***
(0.02) (0.01) (0.02) (0.01) (0.02) (0.02) (0.02)Income $15-25K 0.10** 0.22** 0.15*** -0.02*** -0.03 0.23*** 0.15***
(0.05) (0.11) (0.06) (0.01) (0.02) (0.05) (0.04)Income $25-35K 0.23*** 0.25** 0.27*** -0.02** -0.02 0.28*** 0.15***
(0.05) (0.12) (0.06) (0.01) (0.03) (0.05) (0.05)Income $35-50K 0.28*** 0.27** 0.33*** -0.03*** -0.06*** 0.28*** 0.15***
(0.05) (0.11) (0.05) (0.01) (0.02) (0.04) (0.04)
Income $50-75K 0.35*** 0.28*** 0.42*** -0.04*** -0.09*** 0.31*** 0.15***
(0.05) (0.10) (0.05) (0.01) (0.02) (0.04) (0.04)Income $75-100K 0.40*** 0.33*** 0.45*** -0.04*** -0.13*** 0.24*** 0.07
(0.05) (0.11) (0.05) (0.01) (0.02) (0.05) (0.04)Income $100-150K 0.48*** 0.37*** 0.44*** -0.05*** -0.14*** 0.25*** 0.08*
(0.04) (0.12) (0.05) (0.01) (0.02) (0.05) (0.04)Income $150K+ 0.40*** 0.36*** 0.43*** -0.04*** -0.14*** 0.07 -0.09**
(0.05) (0.13) (0.06) (0.01) (0.01) (0.06) (0.04)
Pseudo R-squared 0.09 0.08 0.07 0.18 0.11 0.04 0.05

25
Note: 2015 NFCS respondents age 56-61 (see text; N=2,672). The variable Financial literacy index is the number of correct answers to the six financial literacy questions. Use alternative financial services refer to the use of payday loans, auto title loans, rent-to-own or pawnshops. Credit card fees and expensive behaviors include paying the minimum only, paying late or over-the-limit fees, and using the card for cash advances. Standard errors in parentheses. *** p<0.01, ** p<0.05, * p<0.1
26
Table 4. Self-reported financial behaviors and perceptions among older respondents: 2009 and 2015 NFCS % 2009 NFCS
Do not know the interest rate they are paying on their auto loan* 30.5
Do not know the interest rate they are paying on their mortgage* 11.1Do not know whether they have an interest-only mortgage or amortgage with an interest-only option* 23.8Do not know the interest charged on their credit card with thelargest balance* 22.6When getting the most recent auto loan, did not compare offersfrom different lenders* 51.2When getting the mortgage in previous 5 years, did not compareoffers from different lenders* 38.1When getting the most recent credit card, collected informationabout different cards from more than one company* 33.5Did not check their credit score in the previous year 55.3Did not obtain their credit report in the previous year 53.6N 4,543
% 2015 NFCSStudent loan for themselves, spouses/partners, children,grandchildren, or others 14.6Did not try to figure out their future monthly payments* 55.8Concerned about their ability to pay off student loans* 44.0Do not know whether their payments are determined by theirincome*
20.0
If they could go through the borrowing process again, they woulddo something differently*
50.6
N 2,672 Note: 2009 NFCS respondents age 55-64, and 2015 NFCS respondents age 56-61 (see text). * Values conditional on holding the asset or debt.
27
Endnotes
1 Numerous media reports have also taken note of the increase in borrowing among the elderly and the reliance
on high cost methods of borrowing, such as payday loans (see for instance, Malito 2019).
2 This age range of respondents coincides with what we examined in our previous work, but using older data
(Lusardi and Mitchell 2013; Lusardi et al. 2018, forthcoming).
3 For brevity, descriptive statistics are not reported but are available upon request.
4 Here we focus on student loans people took out for their own education, because this type of debt could be
of concern to individuals approaching the end of their working careers.
5 We exclude borrowing from retirement accounts in our analysis, because just 58 percent of people age 56-
61 have retirement plans where they get to choose how the money is invested, or other retirement accounts
they have set up themselves.
6 In our previous research, expensive credit card behaviors have been defined as paying the minimum amount
due, running late fees, incurring over-the-limit fees, and using the credit card to get cash advances (Lusardi
and Tufano 2015).
7 For brevity, statistics are not reported but are available upon request.
8 In the 2009 wave of the NFCS, 4,543 of the 28,146 respondents were age 55-64.
Recent Issues All CFS Working Papers are available at www.ifk-cfs.de.
No. Authors Title
630 Joelle H. Fong, Benedict SK. Koh, Olivia S. Mitchell, and Susann Rohwedder
Financial Literacy and Suboptimal Financial Decisions at Older Ages
629 Raimond Maurer, Olivia S. Mitchell, Ralph Rogalla, and Tatjana Schimetschek
Optimal Social Security Claiming Behavior under Lump Sum Incentives: Theory and Evidence
628 Refet S. Gürkaynak, Hatice Gökçe Karasoy-Can, and Sang Seok Lee
Stock Market's Assessment of Monetary Policy Transmission: The Cash Flow Effect
627 Volker Brühl Financial Literacy Among German Students at Secondary Schools: Some Empirical Evidence From the State of Hesse
626 Zaruhi Hakobyana and Christos Koulovatianos
Populism and Polarization in Social Media Without Fake News: the Vicious Circle of Biases, Beliefs and Network Homophily
625 Gökhan Cebiroglu, Nikolaus Hautsch, Christopher Walsh
Revisiting the Stealth Trading Hypothesis: Does Time-Varying Liquidity Explain The Size-Effect?
624 Carlo Altavilla, Luca Brugnolini, Refet S. Gürkaynak, Roberto Motto, Giuseppe Ragusa
Measuring Euro Area Monetary Policy
Related Documents


