LIVING DIGITAL DATA Deborah Lupton News & Media Research Centre Faculty of Arts & Design University of Canberra Twitter@DALupton Blog: This Sociological Life

Welcome message from author
This document is posted to help you gain knowledge. Please leave a comment to let me know what you think about it! Share it to your friends and learn new things together.
Transcript

LIVING DIGITAL DATA
Deborah Lupton News & Media Research Centre
Faculty of Arts & Design University of Canberra
Twitter@DALupton
Blog: This Sociological Life
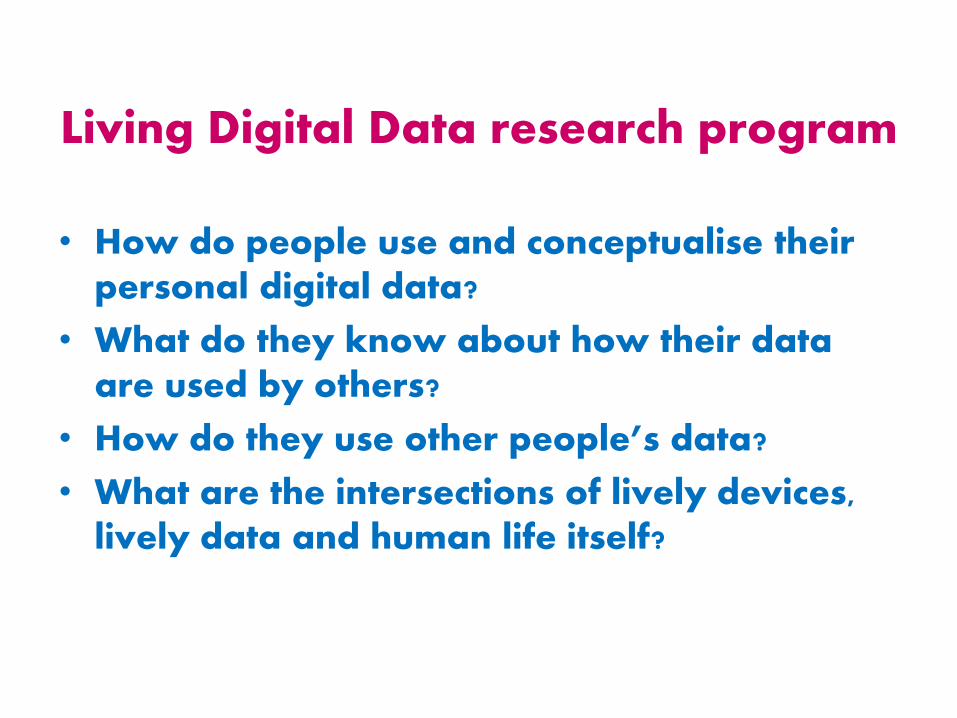
Living Digital Data research program
• How do people use and conceptualise their personal digital data?
• What do they know about how their data are used by others?
• How do they use other people’s data?
• What are the intersections of lively devices, lively data and human life itself?

The 3 Vs of big data
• Volume
• Variety
• Velocity

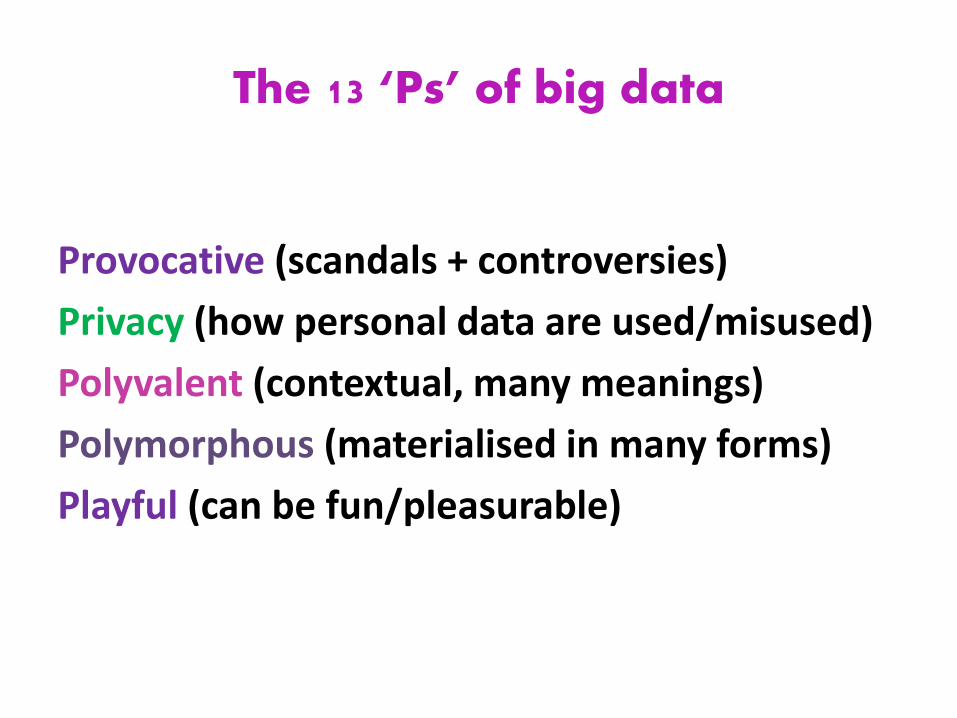
The 13 ‘Ps’ of big data
Portentous (momentous discourse)
Perverse (ambivalence)
Personal (about our everyday lives)
Productive (generate new knowledges + practices)
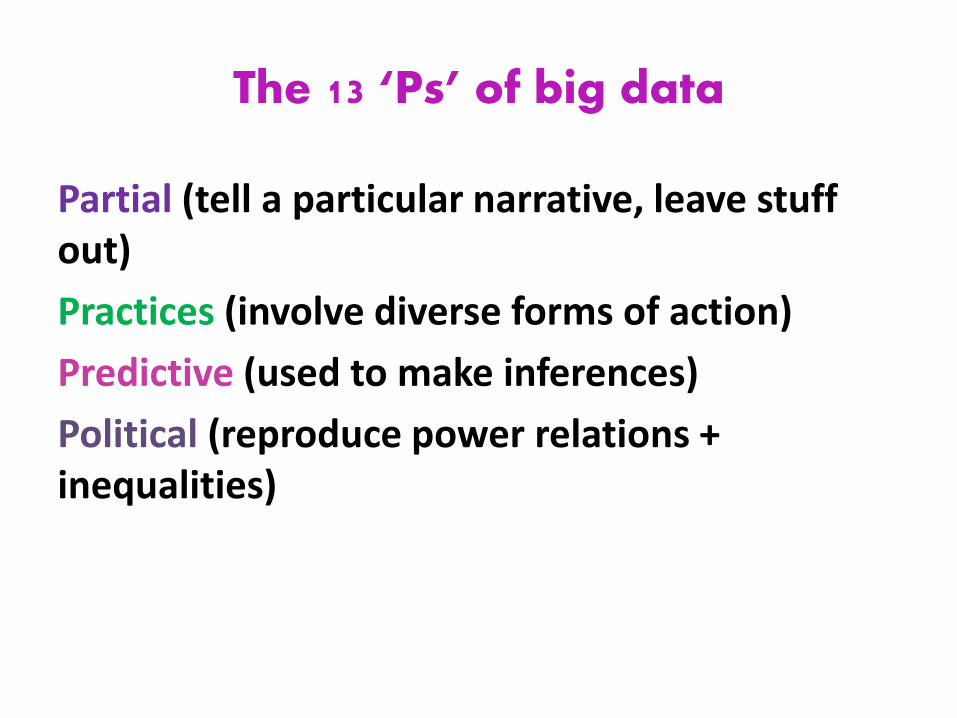
The 13 ‘Ps’ of big data
Partial (tell a particular narrative, leave stuff out)
Practices (involve diverse forms of action)
Predictive (used to make inferences)
Political (reproduce power relations + inequalities)
The 13 ‘Ps’ of big data
Provocative (scandals + controversies)
Privacy (how personal data are used/misused)
Polyvalent (contextual, many meanings)
Polymorphous (materialised in many forms)
Playful (can be fun/pleasurable)

The vitality of digital devices
lively devices
mobile
ubiquitous co-
habitants
embodied

The vitality of digital data
lively data
data about life
social lives of data
data impact on
life
data livelihoods
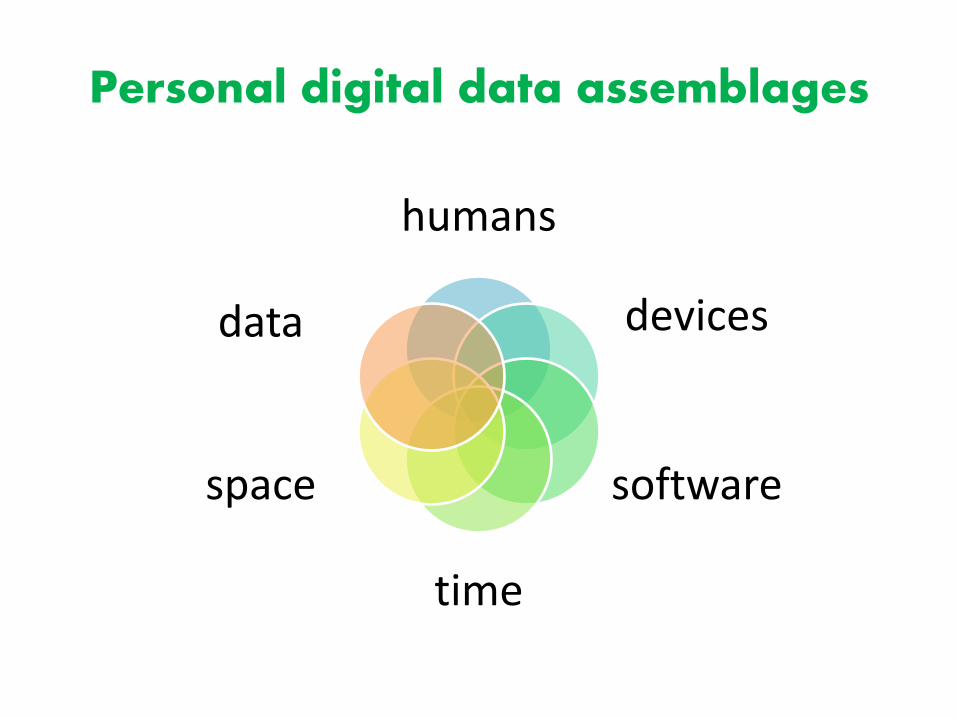
Personal digital data assemblages
humans
devices
software
time
space
data

Data sense
data sense
digital sensors
human senses
sense-making
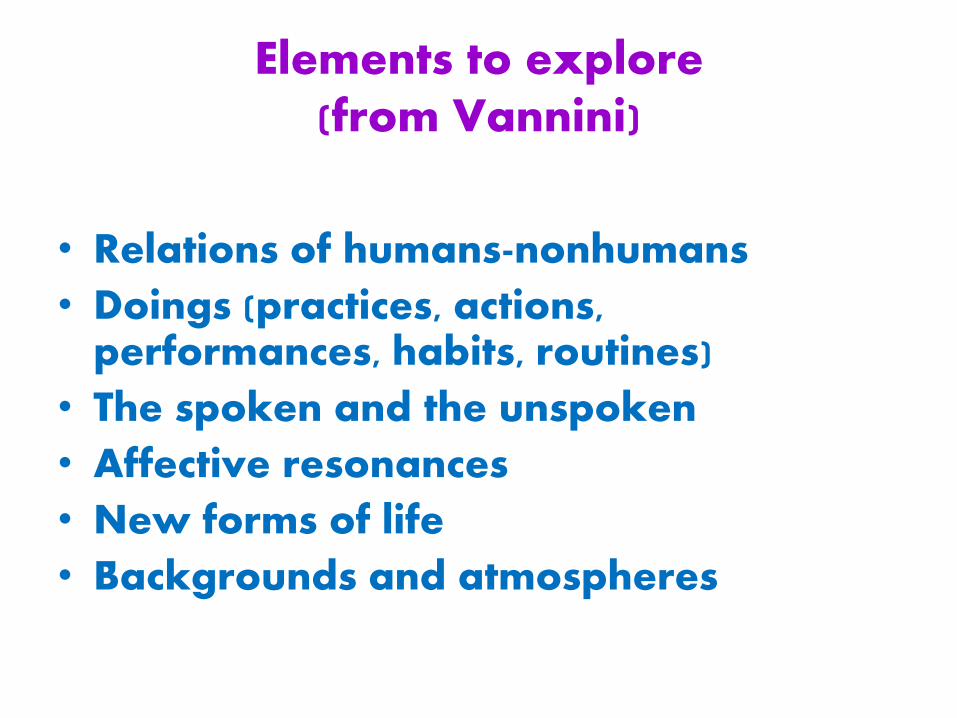
Elements to explore (from Vannini)
• Relations of humans-nonhumans
• Doings (practices, actions, performances, habits, routines)
• The spoken and the unspoken
• Affective resonances
• New forms of life
• Backgrounds and atmospheres

Cycling Data Assemblages project
human
bicycle
digital device
digital data human senses
emotion
space/place
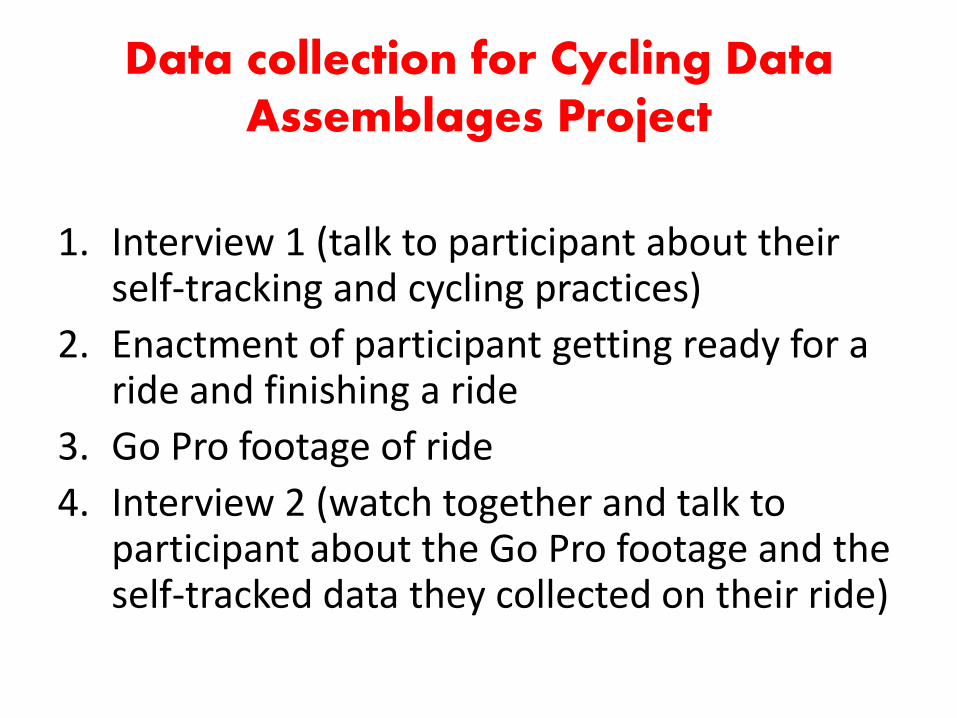
Data collection for Cycling Data Assemblages Project
1. Interview 1 (talk to participant about their self-tracking and cycling practices)
2. Enactment of participant getting ready for a ride and finishing a ride
3. Go Pro footage of ride
4. Interview 2 (watch together and talk to participant about the Go Pro footage and the self-tracked data they collected on their ride)
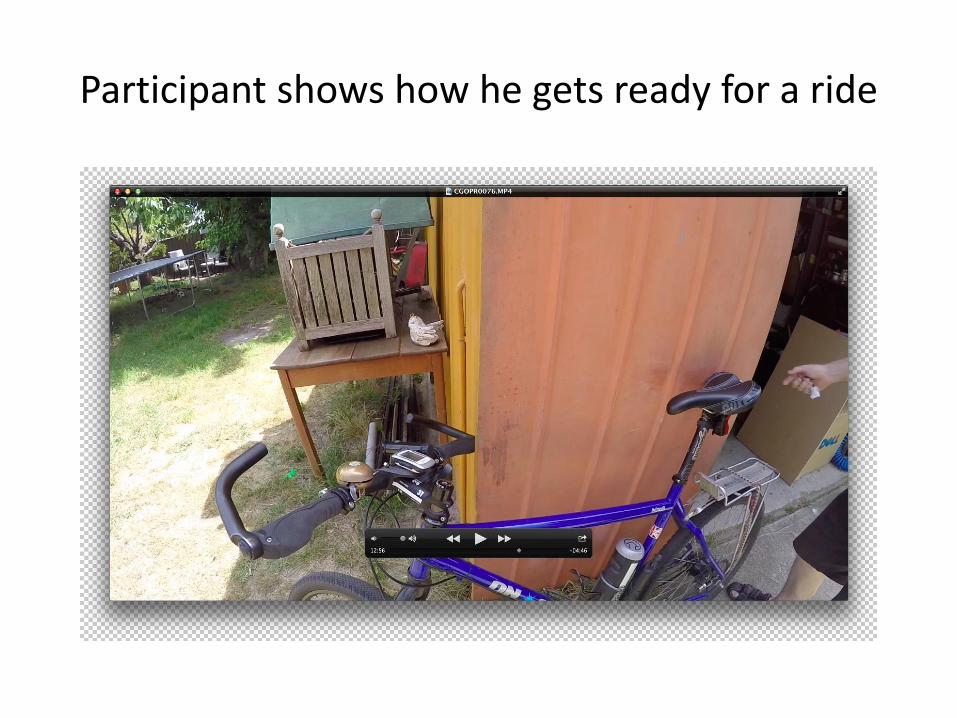
Participant shows how he gets ready for a ride

Participant about to start ride

During the ride
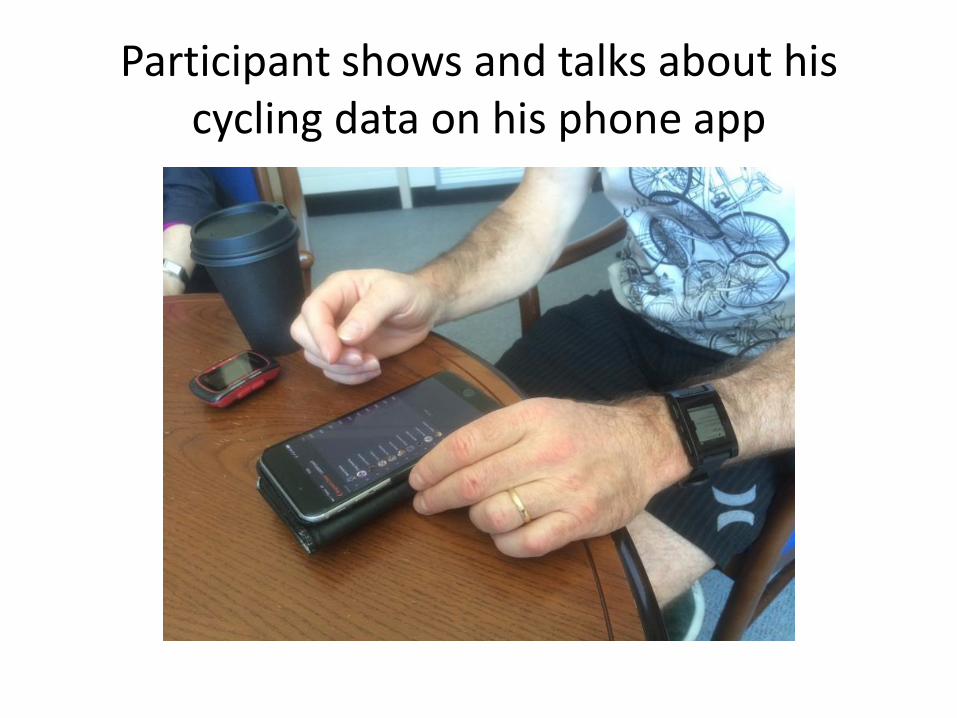
Participant shows and talks about his cycling data on his phone app

Participant shows and talks about his cycling data on his computer screen
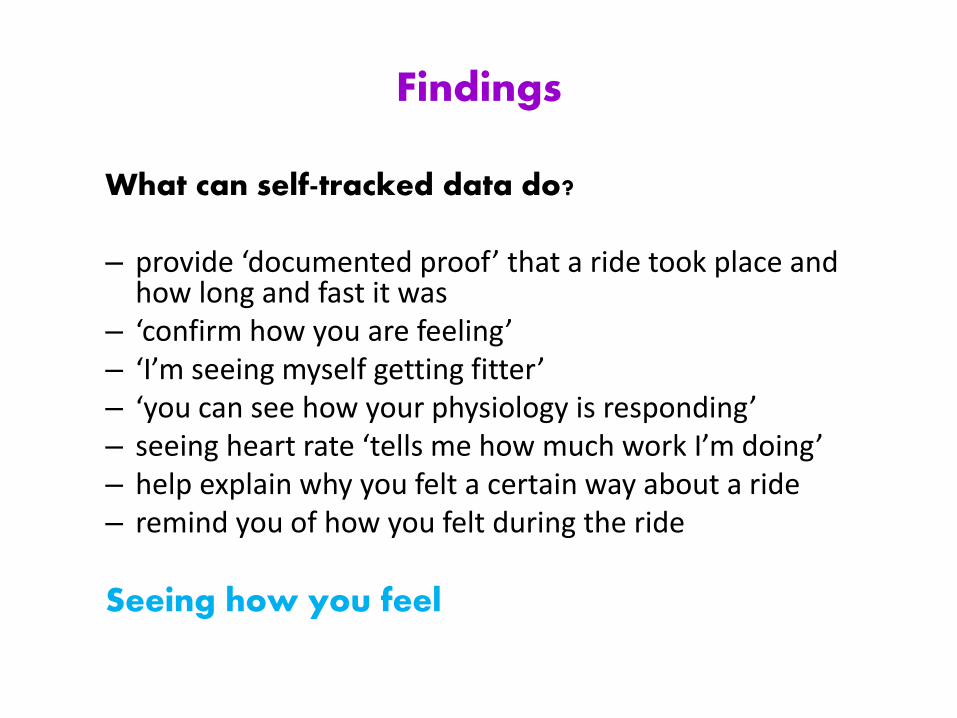
Findings
What can self-tracked data do? – provide ‘documented proof’ that a ride took place and
how long and fast it was – ‘confirm how you are feeling’ – ‘I’m seeing myself getting fitter’ – ‘you can see how your physiology is responding’ – seeing heart rate ‘tells me how much work I’m doing’ – help explain why you felt a certain way about a ride – remind you of how you felt during the ride
Seeing how you feel
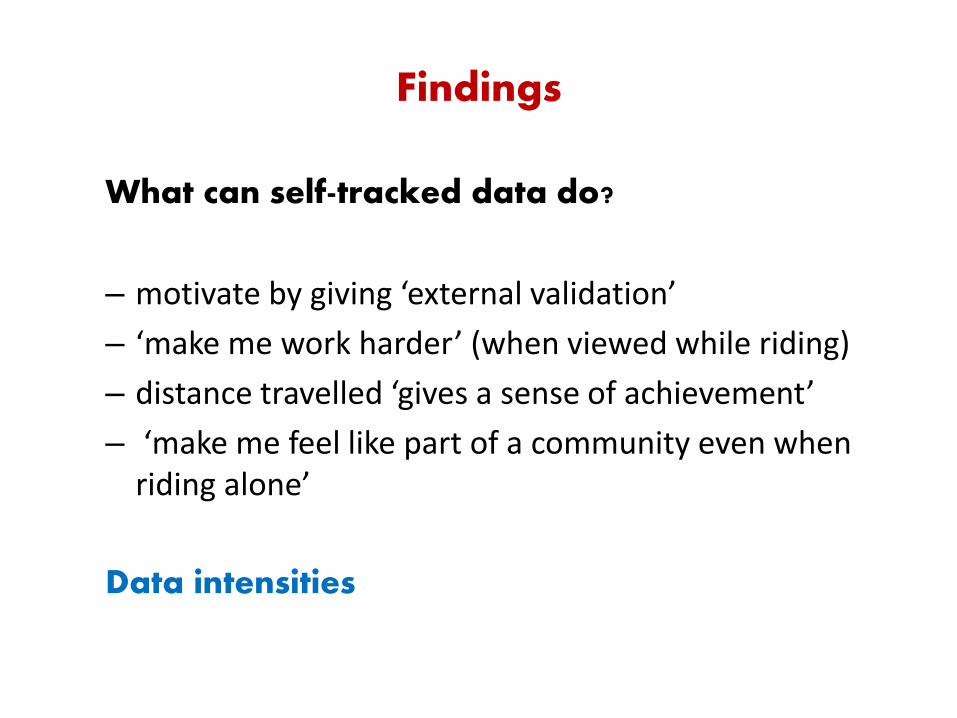
Findings
What can self-tracked data do?
– motivate by giving ‘external validation’
– ‘make me work harder’ (when viewed while riding)
– distance travelled ‘gives a sense of achievement’
– ‘make me feel like part of a community even when riding alone’
Data intensities

Findings
What can self-tracked data do?
– make you more aware of parts of the ride (e.g. Strava ‘segments’)
– make you more aware of other cyclists (on the same app/platform)
– assist riding technique (noticing speed, anticipating gear changes)
Data sensitise

Findings
How to make sense of the data …
– assess against previous experiences and previous data
– assess against weather conditions, bike affordances and how body is feeling
Related Documents