National Vital Statistics Reports Volume 70, Number 8 July 26, 2021 U.S. DEPARTMENT OF HEALTH AND HUMAN SERVICES Centers for Disease Control and Prevention National Center for Health Statistics National Vital Statistics System Abstract Objectives—This report presents final 2019 data on U.S. deaths, death rates, life expectancy, infant and maternal mortality, and trends by selected characteristics such as age, sex, Hispanic origin and race, state of residence, and cause of death. The race categories are consistent with 1997 Office of Management and Budget (OMB) standards, different from reports prior to 2018, which followed 1977 OMB standards. Methods—Information reported on death certificates is presented in descriptive tabulations. The original records are filed in state registration offices. Statistical information is compiled in a national database through the Vital Statistics Cooperative Program of the National Center for Health Statistics. Causes of death are processed according to the International Classification of Diseases, 10th Revision. Beginning in 2018, all states and the District of Columbia were using the 2003 revised certificate of death for the entire year, which includes the 1997 OMB revised standards for race. The 2019 and 2018 data based on the revised standards are not completely comparable to previous years. Selected estimates are presented in this report for both the revised and previous race standards to provide some reference for interpretation of trends. Results—In 2019, a total of 2,854,838 deaths were reported in the United States. The age-adjusted death rate was 715.2 deaths per 100,000 U.S. standard population, a decrease of 1.2% from the 2018 rate. Life expectancy at birth was 78.8 years, an increase of 0.1 year from 2018. Age-specific death rates decreased in 2019 from 2018 for age groups 45–54, 65–74, 75–84, and 85 and over and increased for age group 35–44. The 15 leading causes of death in 2019 remained the same as in 2018, although two causes exchanged ranks. Influenza and pneumonia, the eighth leading cause of death in 2018, became the ninth leading cause of death in 2019, while kidney disease, the ninth leading cause of death in 2018, became the eighth leading cause of death in 2019. The infant mortality rate, 5.58 infant deaths per 1,000 live births in 2019, remained a historic low but was not statistically different from the rate in 2018. Conclusions—In 2019, the age-adjusted death rate decreased and life expectancy at birth increased for the total, male, and female populations for the second consecutive year. Keywords: mortality • cause of death • life expectancy • National Vital Statistics System Highlights Mortality experience in 2019 • In 2019, a total of 2,854,838 resident deaths were registered in the United States, yielding a crude death rate of 869.7 per 100,000 population. • The age-adjusted death rate, which accounts for the aging of the population, was 715.2 deaths per 100,000 U.S. standard population. • Life expectancy at birth was 78.8 years. • The 15 leading causes of death in 2019 were: 1. Diseases of heart (heart disease) 2. Malignant neoplasms (cancer) 3. Accidents (unintentional injuries) 4. Chronic lower respiratory diseases 5. Cerebrovascular diseases (stroke) 6. Alzheimer disease 7. Diabetes mellitus (diabetes) 8. Nephritis, nephrotic syndrome and nephrosis (kidney disease) 9. Influenza and pneumonia 10. Intentional self-harm (suicide) 11. Chronic liver disease and cirrhosis 12. Septicemia 13. Essential hypertension and hypertensive renal disease (hypertension) 14. Parkinson disease 15. Pneumonitis due to solids and liquids NCHS reports can be downloaded from: https://www.cdc.gov/nchs/products/index.htm. Deaths: Final Data for 2019 by Jiaquan Xu, M.D., Sherry L. Murphy, B.S., Kenneth D. Kochanek, M.A., and Elizabeth Arias, Ph.D., Division of Vital Statistics

Welcome message from author
This document is posted to help you gain knowledge. Please leave a comment to let me know what you think about it! Share it to your friends and learn new things together.
Transcript

National Vital Statistics Reports Volume 70, Number 8 July 26, 2021
U.S. DEPARTMENT OF HEALTH AND HUMAN SERVICES Centers for Disease Control and Prevention
National Center for Health Statistics National Vital Statistics System
Abstract Objectives—This report presents final 2019 data on U.S.
deaths, death rates, life expectancy, infant and maternal mortality, and trends by selected characteristics such as age, sex, Hispanic origin and race, state of residence, and cause of death. The race categories are consistent with 1997 Office of Management and Budget (OMB) standards, different from reports prior to 2018, which followed 1977 OMB standards.
Methods—Information reported on death certificates is presented in descriptive tabulations. The original records are filed in state registration offices. Statistical information is compiled in a national database through the Vital Statistics Cooperative Program of the National Center for Health Statistics. Causes of death are processed according to the International Classification of Diseases, 10th Revision. Beginning in 2018, all states and the District of Columbia were using the 2003 revised certificate of death for the entire year, which includes the 1997 OMB revised standards for race. The 2019 and 2018 data based on the revised standards are not completely comparable to previous years. Selected estimates are presented in this report for both the revised and previous race standards to provide some reference for interpretation of trends.
Results—In 2019, a total of 2,854,838 deaths were reported in the United States. The age-adjusted death rate was 715.2 deaths per 100,000 U.S. standard population, a decrease of 1.2% from the 2018 rate. Life expectancy at birth was 78.8 years, an increase of 0.1 year from 2018. Age-specific death rates decreased in 2019 from 2018 for age groups 45–54, 65–74, 75–84, and 85 and over and increased for age group 35–44. The 15 leading causes of death in 2019 remained the same as in 2018, although two causes exchanged ranks. Influenza and pneumonia, the eighth leading cause of death in 2018, became the ninth leading cause of death in 2019, while kidney disease, the ninth leading cause of death in 2018, became the eighth leading cause of death in 2019. The infant mortality rate, 5.58 infant deaths per 1,000 live births in 2019, remained a historic low but was not statistically different from the rate in 2018.
Conclusions—In 2019, the age-adjusted death rate decreased and life expectancy at birth increased for the total, male, and female populations for the second consecutive year.
Keywords: mortality • cause of death • life expectancy • National Vital Statistics System
Highlights
Mortality experience in 2019 • In 2019, a total of 2,854,838 resident deaths were registered
in the United States, yielding a crude death rate of 869.7 per 100,000 population.
• The age-adjusted death rate, which accounts for the aging of the population, was 715.2 deaths per 100,000 U.S. standard population.
• Life expectancy at birth was 78.8 years. • The 15 leading causes of death in 2019 were:
1. Diseases of heart (heart disease) 2. Malignant neoplasms (cancer) 3. Accidents (unintentional injuries) 4. Chronic lower respiratory diseases 5. Cerebrovascular diseases (stroke) 6. Alzheimer disease 7. Diabetes mellitus (diabetes) 8. Nephritis, nephrotic syndrome and nephrosis
(kidney disease) 9. Influenza and pneumonia
10. Intentional self-harm (suicide) 11. Chronic liver disease and cirrhosis 12. Septicemia 13. Essential hypertension and hypertensive renal
disease (hypertension) 14. Parkinson disease 15. Pneumonitis due to solids and liquids
NCHS reports can be downloaded from: https://www.cdc.gov/nchs/products/index.htm.
Deaths: Final Data for 2019 by Jiaquan Xu, M.D., Sherry L. Murphy, B.S., Kenneth D. Kochanek, M.A., and Elizabeth Arias, Ph.D., Division of Vital Statistics
2 National Vital Statistics Reports, Vol. 70, No. 8, July 26, 2021
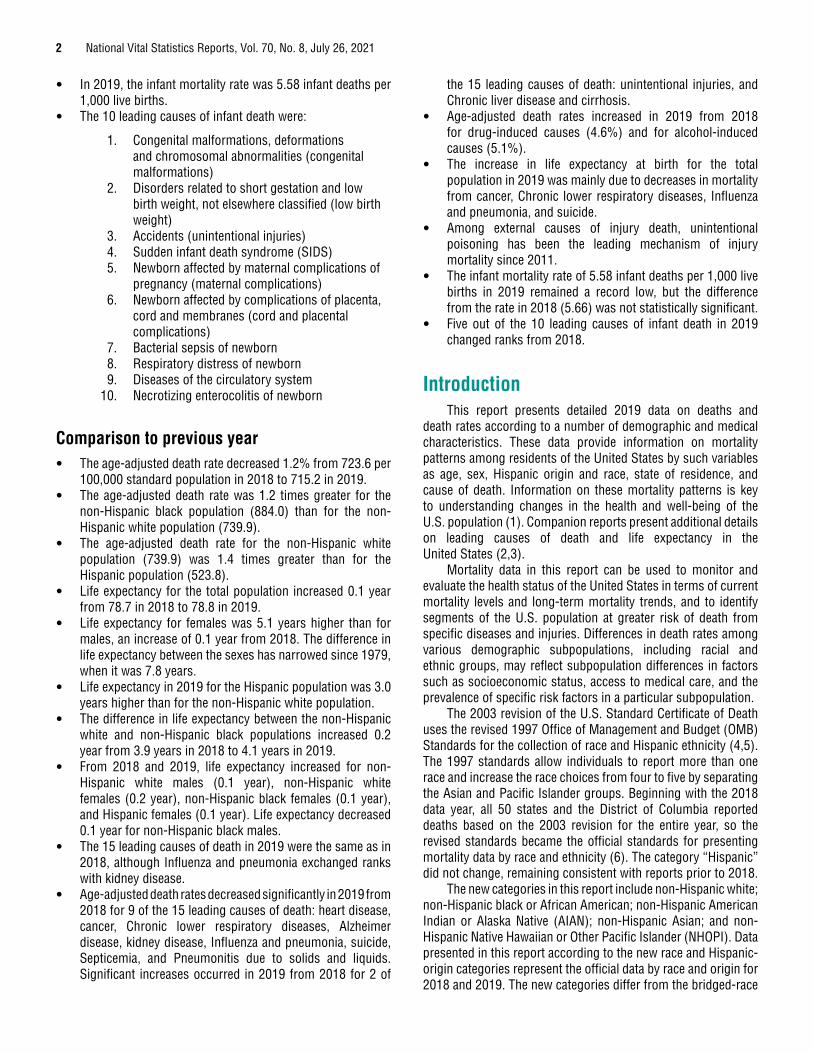
• In 2019, the infant mortality rate was 5.58 infant deaths per 1,000 live births.
• The 10 leading causes of infant death were:
1. Congenital malformations, deformations and chromosomal abnormalities (congenital malformations)
2. Disorders related to short gestation and low birth weight, not elsewhere classified (low birth weight)
3. Accidents (unintentional injuries) 4. Sudden infant death syndrome (SIDS) 5. Newborn affected by maternal complications of
pregnancy (maternal complications) 6. Newborn affected by complications of placenta,
cord and membranes (cord and placental complications)
7. Bacterial sepsis of newborn 8. Respiratory distress of newborn 9. Diseases of the circulatory system
10. Necrotizing enterocolitis of newborn
Comparison to previous year • The age-adjusted death rate decreased 1.2% from 723.6 per
100,000 standard population in 2018 to 715.2 in 2019. • The age-adjusted death rate was 1.2 times greater for the
non-Hispanic black population (884.0) than for the non- Hispanic white population (739.9).
• The age-adjusted death rate for the non-Hispanic white population (739.9) was 1.4 times greater than for the Hispanic population (523.8).
• Life expectancy for the total population increased 0.1 year from 78.7 in 2018 to 78.8 in 2019.
• Life expectancy for females was 5.1 years higher than for males, an increase of 0.1 year from 2018. The difference in life expectancy between the sexes has narrowed since 1979, when it was 7.8 years.
• Life expectancy in 2019 for the Hispanic population was 3.0 years higher than for the non-Hispanic white population.
• The difference in life expectancy between the non-Hispanic white and non-Hispanic black populations increased 0.2 year from 3.9 years in 2018 to 4.1 years in 2019.
• From 2018 and 2019, life expectancy increased for non- Hispanic white males (0.1 year), non-Hispanic white females (0.2 year), non-Hispanic black females (0.1 year), and Hispanic females (0.1 year). Life expectancy decreased 0.1 year for non-Hispanic black males.
• The 15 leading causes of death in 2019 were the same as in 2018, although Influenza and pneumonia exchanged ranks with kidney disease.
• Age-adjusted death rates decreased significantly in 2019 from 2018 for 9 of the 15 leading causes of death: heart disease, cancer, Chronic lower respiratory diseases, Alzheimer disease, kidney disease, Influenza and pneumonia, suicide, Septicemia, and Pneumonitis due to solids and liquids. Significant increases occurred in 2019 from 2018 for 2 of
the 15 leading causes of death: unintentional injuries, and Chronic liver disease and cirrhosis.
• Age-adjusted death rates increased in 2019 from 2018 for drug-induced causes (4.6%) and for alcohol-induced causes (5.1%).
• The increase in life expectancy at birth for the total population in 2019 was mainly due to decreases in mortality from cancer, Chronic lower respiratory diseases, Influenza and pneumonia, and suicide.
• Among external causes of injury death, unintentional poisoning has been the leading mechanism of injury mortality since 2011.
• The infant mortality rate of 5.58 infant deaths per 1,000 live births in 2019 remained a record low, but the difference from the rate in 2018 (5.66) was not statistically significant.
• Five out of the 10 leading causes of infant death in 2019 changed ranks from 2018.
Introduction This report presents detailed 2019 data on deaths and
death rates according to a number of demographic and medical characteristics. These data provide information on mortality patterns among residents of the United States by such variables as age, sex, Hispanic origin and race, state of residence, and cause of death. Information on these mortality patterns is key to understanding changes in the health and well-being of the U.S. population (1). Companion reports present additional details on leading causes of death and life expectancy in the United States (2,3).
Mortality data in this report can be used to monitor and evaluate the health status of the United States in terms of current mortality levels and long-term mortality trends, and to identify segments of the U.S. population at greater risk of death from specific diseases and injuries. Differences in death rates among various demographic subpopulations, including racial and ethnic groups, may reflect subpopulation differences in factors such as socioeconomic status, access to medical care, and the prevalence of specific risk factors in a particular subpopulation.
The 2003 revision of the U.S. Standard Certificate of Death uses the revised 1997 Office of Management and Budget (OMB) Standards for the collection of race and Hispanic ethnicity (4,5). The 1997 standards allow individuals to report more than one race and increase the race choices from four to five by separating the Asian and Pacific Islander groups. Beginning with the 2018 data year, all 50 states and the District of Columbia reported deaths based on the 2003 revision for the entire year, so the revised standards became the official standards for presenting mortality data by race and ethnicity (6). The category “Hispanic” did not change, remaining consistent with reports prior to 2018.
The new categories in this report include non-Hispanic white; non-Hispanic black or African American; non-Hispanic American Indian or Alaska Native (AIAN); non-Hispanic Asian; and non- Hispanic Native Hawaiian or Other Pacific Islander (NHOPI). Data presented in this report according to the new race and Hispanic- origin categories represent the official data by race and origin for 2018 and 2019. The new categories differ from the bridged-race
National Vital Statistics Reports, Vol. 70, No. 8, July 26, 2021 3
categories shown in previous reports. For comparison purposes and to show the impact of the change, select data for 2018 and 2019 are presented for both single- and bridged-race categories. See Methods and Technical Notes in this report for additional information on how race and Hispanic-origin categories were redefined and, an accompanying report, “Comparability of Race-specific Mortality Data Based on 1977 Versus 1997 Reporting Standards,” (7) for more information on differences between single- and bridged-race groups.
In addition to the tabulations included in this report, more detailed analysis is possible by using the annual mortality public-use file. The data file may be downloaded from: https://www. cdc.gov/nchs/data_access/Vitalstatsonline.htm (8). The public-use file does not include geographic detail, but a file with thisinformation may be available upon request (9). Death dataalso may be accessed via the Centers for Disease Control andPrevention’s (CDC) Wide-ranging Online Data for EpidemiologicResearch (WONDER), a web-based system that makes CDC’sinformation resources available to public health professionalsand the general public (10).
Methods Data in this report are based on information from all resident
death certificates filed in the 50 states and the District of Columbia. More than 99% of deaths occurring in this country are believed to be registered (11). This report provides detailed death data in Tables 1–16 and supplemental Internet Tables I–1 through I–27.
Tables showing data by state also provide information for Puerto Rico, Guam, and the Commonwealth of the Northern Mariana Islands (Northern Marianas). Cause-of-death statistics presented in this report are classified according to the International Classification of Diseases, 10th Revision (ICD–10) (12–14). Selected causes are presented primarily based on their impact on public health and future planning. A discussion of the cause-of-death classification is provided in Technical Notes at the end of this report.
Mortality data on specific demographic and medical characteristics cover all 50 states and the District of Columbia. Measures of mortality in this report include the number of deaths; crude, age-specific, and age-adjusted death rates; infant, neonatal, postneonatal, and maternal mortality rates; life expectancy; and rate ratios. Changes in death rates in 2019 compared with 2018 and differences in death rates across demographic groups in 2019 were tested for statistical significance. Unless otherwise specified, reported differences are statistically significant. Additional information on these statistical methods, random variation and relative standard error, the computation of derived statistics and rates, population denominators, and the definition of terms are presented in Technical Notes.
According to the revised standards issued by OMB in 1997, the 2003 revision of the U.S. Standard Certificate of Death provides for the reporting of more than one race (multiple races) and increased the race choices from four to five by separating the Asian and Pacific Islander groups (4,5). Starting in 2018, all 50 states and the District of Columbia reported deaths using the 2003 revision for the entire year.
The race and Hispanic-origin groups in this report follow the 1997 standards and differ from the race categories used in previous reports (15,16). The new categories include non-Hispanic, single-race white; non-Hispanic, single-race black or African American; non-Hispanic, single-race AIAN; non-Hispanic, single-race Asian; non-Hispanic, single-race NHOPI; and Hispanic. For brevity, text references to race refer to “single race” in this report. Because the number of deaths reported with more than one race in 2019 is relatively small (0.5%), these deaths are included in totals but are shown separately in only one report table (Table 2). Comparisons between race and ethnicity groups in this report are limited to the major groups, based on population size: non-Hispanic, single-race white; non-Hispanic, single-race black; and Hispanic.
Jurisdictions adopted the 2003 standard certificate at different times throughout the period 2003–2017. To provide consistent mortality statistics by race and Hispanic origin during the period 2003–2017, multiple-race data for states that had adopted the 2003 standard certificate were bridged back to the 1977 OMB standard single-race categories; see Technical Notes. Beginning in 2018, all states collected data on race according to the 1997 OMB guidelines, so the use of the bridged-race process was no longer necessary. Data presented in this report by the revised race and Hispanic-origin categories represent the official statistics by race and origin for 2018 and 2019. Because single-race data are not available for the entire United States before 2018, data by race for 2018 and 2019 are not completely comparable with data for previous years, and comparisons should be made with this consideration. However, data for select estimates for 2018 and 2019 were also tabulated for bridged-race categories to evaluate the impact of the change in categorization. The Hispanic-origin category is a separate item on the death certificate and was not affected by the revised standards; therefore, data by Hispanic origin for 2019 and earlier years are comparable.
The changes in rates and life expectancies in 2019 from 2018 are discussed by Hispanic origin, single-race categories, and sex. However, for comparison purposes, Tables A, 1, 4, and 13 present data for 2018 and 2019 by both bridged- and single-race categories. Tables I–20 through I–27 show trend data by bridged-race categories for 2019 and previous years and single-race data for 2018 and 2019. A more detailed analysis of bridged-race data compared with single-race data is available in “Comparability of Race-specific Mortality Data Based on 1977 Versus 1997 Reporting Standards” (7).
The population data used to calculate death rates for 2019 shown in this report are postcensal population estimates based on the 2010 decennial census and are available from the U.S. Census Bureau website: https://www2.census.gov/programs-surveys/popest/tables/2010-2019/state/asrh/sc-est2019-alldata6.csv (17). Reflecting the 1997 OMB guidelines on race and ethnicity reporting, the 2010 census included an option for individuals to report more than one race and provided for the reporting of Asian persons separately from NHOPI persons (5).
4 National Vital Statistics Reports, Vol. 70, No. 8, July 26, 2021
The populations used to calculate death rates for 2000–2017 and for 2018 and 2019 for selected tables were produced under a collaborative arrangement with the U.S. Census Bureau whereby population data for multiple-race persons were bridged back to single-race categories. Populations for 2010–2019 and the intercensal period 2001–2009 are consistent with the 2010 census (17–19). In addition, the 2010 census counts were modified to be consistent with the 1977 OMB race categories, that is, to report the data for Asian persons and NHOPI persons as a combined category (Asian or Pacific Islander) and to reflect age as of the census reference date (16). The procedures used to produce the bridged populations are described elsewhere (20,21).
Data presented in this report and other mortality tabulations are available from the National Center for Health Statistics (NCHS), National Vital Statistics System website: https://www.cdc.gov/nchs/deaths.htm. The availability of mortality microdata is described in Technical Notes.
Results and Discussion
Deaths and death ratesIn 2019, a total of 2,854,838 resident deaths were registered
in the United States—15,633 more deaths than in 2018. The crude death rate for 2019 (869.7 deaths per 100,000 population) was 0.2% higher than the 2018 rate (867.8) (Tables B, 1, 2, 5, 7, and 9).
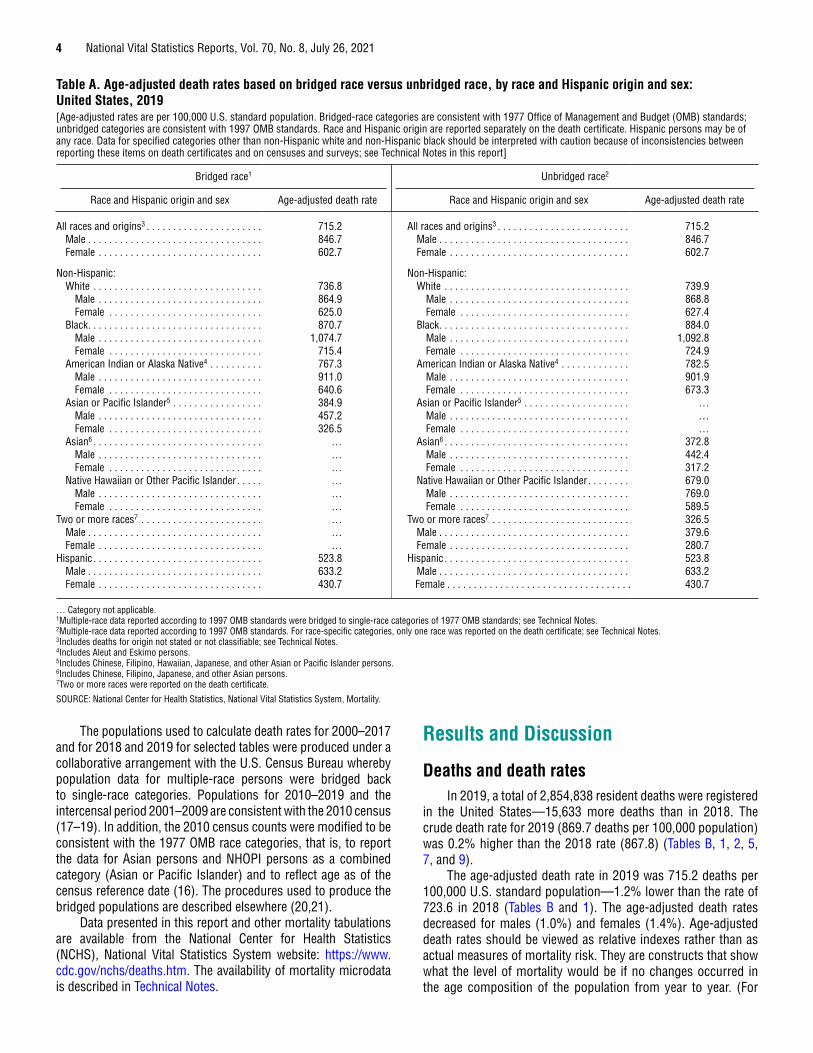
The age-adjusted death rate in 2019 was 715.2 deaths per 100,000 U.S. standard population—1.2% lower than the rate of 723.6 in 2018 (Tables B and 1). The age-adjusted death rates decreased for males (1.0%) and females (1.4%). Age-adjusted death rates should be viewed as relative indexes rather than as actual measures of mortality risk. They are constructs that show what the level of mortality would be if no changes occurred in the age composition of the population from year to year. (For
Table A. Age-adjusted death rates based on bridged race versus unbridged race, by race and Hispanic origin and sex: United States, 2019[Age-adjusted rates are per 100,000 U.S. standard population. Bridged-race categories are consistent with 1977 Office of Management and Budget (OMB) standards; unbridged categories are consistent with 1997 OMB standards. Race and Hispanic origin are reported separately on the death certificate. Hispanic persons may be of any race. Data for specified categories other than non-Hispanic white and non-Hispanic black should be interpreted with caution because of inconsistencies between reporting these items on death certificates and on censuses and surveys; see Technical Notes in this report]
Bridged race1 Unbridged race2
Race and Hispanic origin and sex Age-adjusted death rate Race and Hispanic origin and sex Age-adjusted death rate
All races and origins3 . . . . . . . . . . . . . . . . . . . . . . 715.2 All races and origins3 . . . . . . . . . . . . . . . . . . . . . . . . . 715.2Male . . . . . . . . . . . . . . . . . . . . . . . . . . . . . . . . . 846.7 Male . . . . . . . . . . . . . . . . . . . . . . . . . . . . . . . . . . . . 846.7Female . . . . . . . . . . . . . . . . . . . . . . . . . . . . . . . 602.7 Female . . . . . . . . . . . . . . . . . . . . . . . . . . . . . . . . . . 602.7
Non-Hispanic: Non-Hispanic:White . . . . . . . . . . . . . . . . . . . . . . . . . . . . . . . . 736.8 White . . . . . . . . . . . . . . . . . . . . . . . . . . . . . . . . . . . 739.9
Male . . . . . . . . . . . . . . . . . . . . . . . . . . . . . . . 864.9 Male . . . . . . . . . . . . . . . . . . . . . . . . . . . . . . . . . . 868.8Female . . . . . . . . . . . . . . . . . . . . . . . . . . . . . 625.0 Female . . . . . . . . . . . . . . . . . . . . . . . . . . . . . . . . 627.4
Black . . . . . . . . . . . . . . . . . . . . . . . . . . . . . . . . . 870.7 Black . . . . . . . . . . . . . . . . . . . . . . . . . . . . . . . . . . . . 884.0Male . . . . . . . . . . . . . . . . . . . . . . . . . . . . . . . 1,074.7 Male . . . . . . . . . . . . . . . . . . . . . . . . . . . . . . . . . . 1,092.8Female . . . . . . . . . . . . . . . . . . . . . . . . . . . . . 715.4 Female . . . . . . . . . . . . . . . . . . . . . . . . . . . . . . . . 724.9
American Indian or Alaska Native4 . . . . . . . . . . 767.3 American Indian or Alaska Native4 . . . . . . . . . . . . . 782.5Male . . . . . . . . . . . . . . . . . . . . . . . . . . . . . . . 911.0 Male . . . . . . . . . . . . . . . . . . . . . . . . . . . . . . . . . . 901.9Female . . . . . . . . . . . . . . . . . . . . . . . . . . . . . 640.6 Female . . . . . . . . . . . . . . . . . . . . . . . . . . . . . . . . 673.3
Asian or Pacific Islander5 . . . . . . . . . . . . . . . . . 384.9 Asian or Pacific Islander5 . . . . . . . . . . . . . . . . . . . . …Male . . . . . . . . . . . . . . . . . . . . . . . . . . . . . . . 457.2 Male . . . . . . . . . . . . . . . . . . . . . . . . . . . . . . . . . . …Female . . . . . . . . . . . . . . . . . . . . . . . . . . . . . 326.5 Female . . . . . . . . . . . . . . . . . . . . . . . . . . . . . . . . …
Asian6 . . . . . . . . . . . . . . . . . . . . . . . . . . . . . . . . … Asian6 . . . . . . . . . . . . . . . . . . . . . . . . . . . . . . . . . . . 372.8Male . . . . . . . . . . . . . . . . . . . . . . . . . . . . . . . … Male . . . . . . . . . . . . . . . . . . . . . . . . . . . . . . . . . . 442.4Female . . . . . . . . . . . . . . . . . . . . . . . . . . . . . … Female . . . . . . . . . . . . . . . . . . . . . . . . . . . . . . . . 317.2
Native Hawaiian or Other Pacific Islander . . . . . … Native Hawaiian or Other Pacific Islander . . . . . . . . 679.0Male . . . . . . . . . . . . . . . . . . . . . . . . . . . . . . . … Male . . . . . . . . . . . . . . . . . . . . . . . . . . . . . . . . . . 769.0Female . . . . . . . . . . . . . . . . . . . . . . . . . . . . . … Female . . . . . . . . . . . . . . . . . . . . . . . . . . . . . . . . 589.5
Two or more races7 . . . . . . . . . . . . . . . . . . . . . . . … Two or more races7 . . . . . . . . . . . . . . . . . . . . . . . . . . 326.5Male . . . . . . . . . . . . . . . . . . . . . . . . . . . . . . . . . … Male . . . . . . . . . . . . . . . . . . . . . . . . . . . . . . . . . . . . 379.6Female . . . . . . . . . . . . . . . . . . . . . . . . . . . . . . . … Female . . . . . . . . . . . . . . . . . . . . . . . . . . . . . . . . . . 280.7
Hispanic . . . . . . . . . . . . . . . . . . . . . . . . . . . . . . . . 523.8 Hispanic . . . . . . . . . . . . . . . . . . . . . . . . . . . . . . . . . . . 523.8Male . . . . . . . . . . . . . . . . . . . . . . . . . . . . . . . . . 633.2 Male . . . . . . . . . . . . . . . . . . . . . . . . . . . . . . . . . . . . 633.2Female . . . . . . . . . . . . . . . . . . . . . . . . . . . . . . . 430.7 Female . . . . . . . . . . . . . . . . . . . . . . . . . . . . . . . . . . . 430.7
… Category not applicable. 1Multiple-race data reported according to 1997 OMB standards were bridged to single-race categories of 1977 OMB standards; see Technical Notes. 2Multiple-race data reported according to 1997 OMB standards. For race-specific categories, only one race was reported on the death certificate; see Technical Notes. 3Includes deaths for origin not stated or not classifiable; see Technical Notes. 4Includes Aleut and Eskimo persons. 5Includes Chinese, Filipino, Hawaiian, Japanese, and other Asian or Pacific Islander persons. 6Includes Chinese, Filipino, Japanese, and other Asian persons. 7Two or more races were reported on the death certificate.
SOURCE: National Center for Health Statistics, National Vital Statistics System, Mortality.
National Vital Statistics Reports, Vol. 70, No. 8, July 26, 2021 5
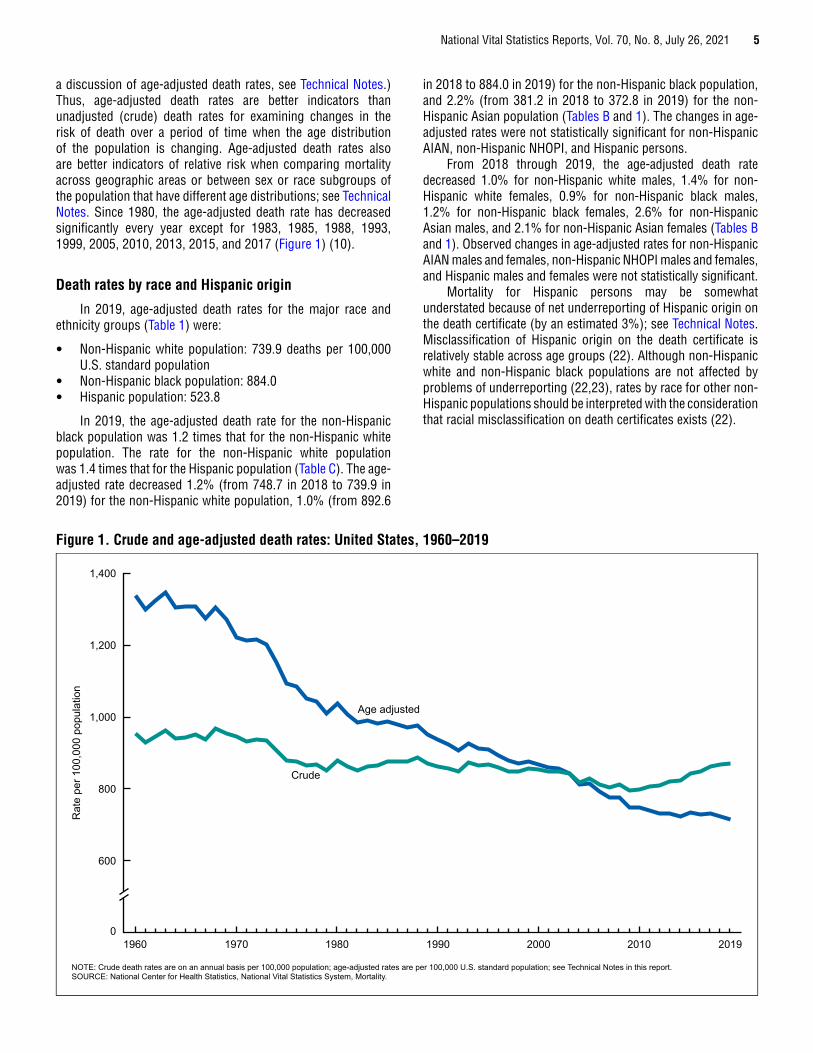
a discussion of age-adjusted death rates, see Technical Notes.) Thus, age-adjusted death rates are better indicators than unadjusted (crude) death rates for examining changes in the risk of death over a period of time when the age distribution of the population is changing. Age-adjusted death rates also are better indicators of relative risk when comparing mortality across geographic areas or between sex or race subgroups of the population that have different age distributions; see Technical Notes. Since 1980, the age-adjusted death rate has decreased significantly every year except for 1983, 1985, 1988, 1993, 1999, 2005, 2010, 2013, 2015, and 2017 (Figure 1) (10).
Death rates by race and Hispanic origin
In 2019, age-adjusted death rates for the major race and ethnicity groups (Table 1) were:
• Non-Hispanic white population: 739.9 deaths per 100,000 U.S. standard population
• Non-Hispanic black population: 884.0 • Hispanic population: 523.8
In 2019, the age-adjusted death rate for the non-Hispanic black population was 1.2 times that for the non-Hispanic white population. The rate for the non-Hispanic white population was 1.4 times that for the Hispanic population (Table C). The age-adjusted rate decreased 1.2% (from 748.7 in 2018 to 739.9 in 2019) for the non-Hispanic white population, 1.0% (from 892.6
in 2018 to 884.0 in 2019) for the non-Hispanic black population, and 2.2% (from 381.2 in 2018 to 372.8 in 2019) for the non-Hispanic Asian population (Tables B and 1). The changes in age-adjusted rates were not statistically significant for non-Hispanic AIAN, non-Hispanic NHOPI, and Hispanic persons.
From 2018 through 2019, the age-adjusted death rate decreased 1.0% for non-Hispanic white males, 1.4% for non-Hispanic white females, 0.9% for non-Hispanic black males, 1.2% for non-Hispanic black females, 2.6% for non-Hispanic Asian males, and 2.1% for non-Hispanic Asian females (Tables B and 1). Observed changes in age-adjusted rates for non-Hispanic AIAN males and females, non-Hispanic NHOPI males and females, and Hispanic males and females were not statistically significant.
Mortality for Hispanic persons may be somewhat understated because of net underreporting of Hispanic origin on the death certificate (by an estimated 3%); see Technical Notes. Misclassification of Hispanic origin on the death certificate is relatively stable across age groups (22). Although non-Hispanic white and non-Hispanic black populations are not affected by problems of underreporting (22,23), rates by race for other non-Hispanic populations should be interpreted with the consideration that racial misclassification on death certificates exists (22).
Rat
e pe
r 100
,000
pop
ulat
ion
NOTE: Crude death rates are on an annual basis per 100,000 population; age-adjusted rates are per 100,000 U.S. standard population; see Technical Notes in this report. SOURCE: National Center for Health Statistics, National Vital Statistics System, Mortality.
0
600
800
1,000
1,200
1,400
20192000 2010199019801960 1970
Age adjusted
Crude
Figure 1. Crude and age-adjusted death rates: United States, 1960–2019

6
National Vital Statistics Reports, Vol. 70, No. 8, July 26, 2021Table B. Percent change in death rates and age-adjusted death rates in 2019 from 2018, by age, race and Hispanic origin, and sex: United States[Based on death rates on an annual basis per 100,000 population and age-adjusted rates per 100,000 U.S. standard population; see Technical Notes in this report. Race and Hispanic-origin categories are consistent with 1997 OMB standards; see Technical Notes. Data for specified categories other than non-Hispanic, single-race white and non-Hispanic, single-race black should be interpreted with caution because of inconsistencies in reporting these items on death certificates and surveys; see Technical Notes]
Age group (years)
Total1
Non-Hispanic, single race
Hispanic5White2 Black2American Indian or
Alaska Native2,3 Asian2,4Native Hawaiian or
Other Pacific Islander2
Both sexes Male Female
Both sexes Male Female
Both sexes Male Female
Both sexes Male Female
Both sexes Male Female
Both sexes Male Female
Both sexes Male Female
All agesCrude rate . . . . . . . . . . 0.2 0.7 -0.3 0.2 0.7 -0.4 0.9 1.3 0.5 0.8 -0.2 1.9 1.6 1.3 1.9 4.8 6.8 2.5 2.6 2.9 2.1Age-adjusted rate . . . . . -1.2 -1.0 -1.4 -1.2 -1.0 -1.4 -1.0 -0.9 -1.2 -1.0 -1.8 0.0 -2.2 -2.6 -2.1 0.5 1.4 -1.3 -0.1 0.0 -0.2
Under 16 . . . . . . . . . . . . -0.9 -1.6 0.1 -4.9 -4.5 -5.6 1.3 -1.5 4.9 0.1 0.8 -0.7 -6.7 -2.1 -12.1 -7.4 -1.6 -15.0 5.2 5.3 5.11–4. . . . . . . . . . . . . . . . -2.9 -8.0 3.9 -7.1 -8.6 -4.2 -2.6 -11.4 9.9 29.5 -2.7 86.6 -7.1 -21.8 14.3 11.1 -13.4 68.8 -1.6 -4.2 2.45–14. . . . . . . . . . . . . . . 0.8 3.4 -2.5 2.4 2.1 2.8 -1.3 3.2 -7.0 -10.4 27.6 -40.8 -13.1 -13.0 -14.3 12.3 70.8 -32.9 5.7 11.5 -2.015–24. . . . . . . . . . . . . . -0.7 -0.4 -1.0 -5.7 -5.5 -6.0 6.3 6.0 7.6 8.1 -3.2 39.8 -0.3 6.3 -13.8 16.8 3.8 58.5 4.6 4.9 4.425–34. . . . . . . . . . . . . . 0.0 0.5 -1.4 -2.5 -2.5 -2.4 1.5 2.4 -1.3 -1.7 -5.7 6.0 8.8 8.7 7.9 25.3 43.4 -7.0 6.6 8.5 1.235–44. . . . . . . . . . . . . . 2.3 3.0 1.0 1.1 2.1 -0.7 3.4 4.3 1.8 5.2 -0.4 14.6 -1.1 1.1 -4.7 25.6 21.3 34.0 6.3 5.6 7.745–54. . . . . . . . . . . . . . -0.9 -0.4 -1.7 -1.0 -0.3 -2.1 -0.2 0.4 -0.9 2.0 0.4 4.4 1.3 0.2 2.9 -0.7 1.6 -4.4 0.7 0.7 0.855–64. . . . . . . . . . . . . . -0.4 -0.6 0.0 0.0 -0.4 0.5 -0.6 -0.3 -1.2 -1.8 -3.7 0.8 -1.1 -0.1 -2.7 -4.0 -5.4 -2.2 -0.4 -0.9 0.465–74. . . . . . . . . . . . . . -1.0 -0.8 -1.3 -0.9 -0.7 -1.2 -1.5 -1.0 -2.2 -3.1 -1.1 -5.2 -1.9 -2.5 -0.9 7.4 13.8 0.4 0.2 0.1 0.175–84. . . . . . . . . . . . . . -1.8 -1.6 -2.0 -1.4 -1.0 -1.8 -2.4 -3.2 -1.8 -3.8 -1.8 -5.7 -2.8 -1.7 -4.0 -10.9 -8.3 -13.3 -3.2 -3.9 -2.785 and over . . . . . . . . . -1.7 -1.9 -1.6 -1.5 -1.8 -1.5 -1.5 -1.6 -1.4 -1.7 -3.1 -0.9 -2.9 -5.7 -1.1 1.7 -10.4 10.3 1.0 2.0 0.3
0.0 Quantity more than zero but less than 0.05.1Includes deaths with origin not stated, origin not classifiable, and two or more races reported; see Technical Notes. 2Only one race was reported on the death certificate; see Technical Notes. 3Includes Aleut and Eskimo persons. 4Includes Chinese, Filipino, Japanese, and Other Asian persons. 5Includes persons of Hispanic origin of any race; see Technical Notes. 6Death rates for “Under 1” (based on population estimates) differ from infant mortality rates (based on live births); see Technical Notes.
SOURCE: National Center for Health Statistics, National Vital Statistics System, Mortality.
National Vital Statistics Reports, Vol. 70, No. 8, July 26, 2021 7
Death rates by age and sex
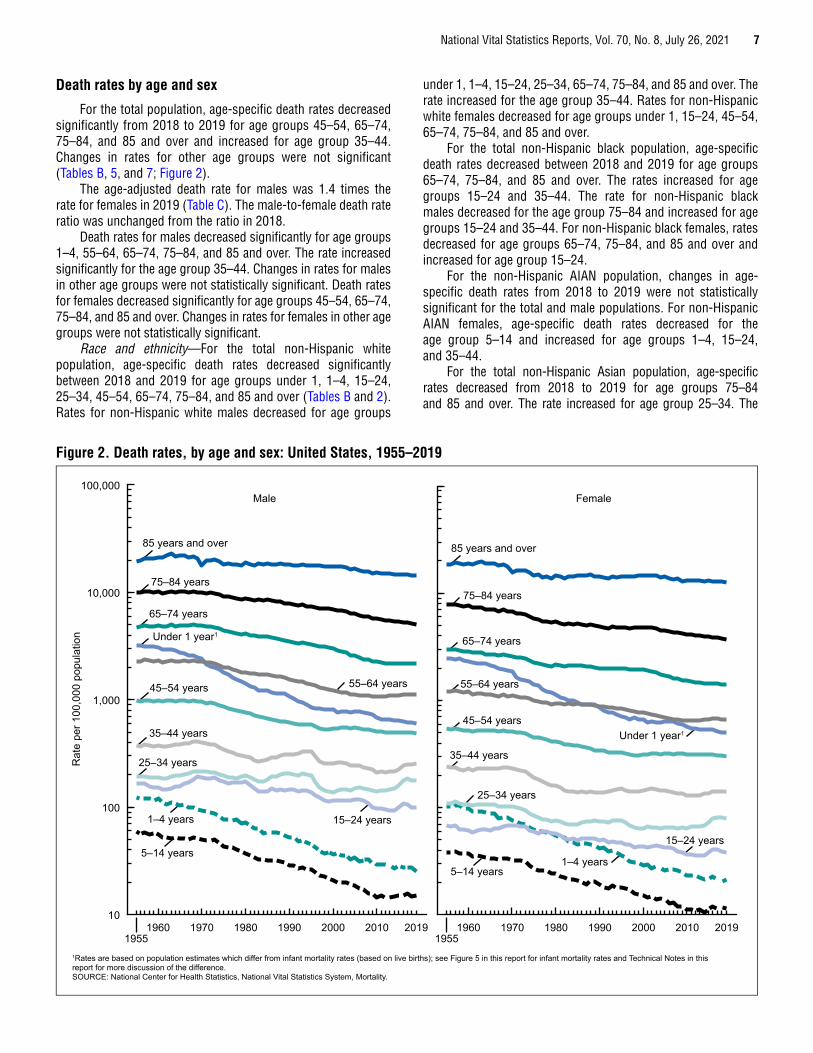
For the total population, age-specific death rates decreased significantly from 2018 to 2019 for age groups 45–54, 65–74, 75–84, and 85 and over and increased for age group 35–44. Changes in rates for other age groups were not significant (Tables B, 5, and 7; Figure 2).
The age-adjusted death rate for males was 1.4 times the rate for females in 2019 (Table C). The male-to-female death rate ratio was unchanged from the ratio in 2018.
Death rates for males decreased significantly for age groups 1–4, 55–64, 65–74, 75–84, and 85 and over. The rate increased significantly for the age group 35–44. Changes in rates for males in other age groups were not statistically significant. Death rates for females decreased significantly for age groups 45–54, 65–74, 75–84, and 85 and over. Changes in rates for females in other age groups were not statistically significant.
Race and ethnicity—For the total non-Hispanic white population, age-specific death rates decreased significantly between 2018 and 2019 for age groups under 1, 1–4, 15–24, 25–34, 45–54, 65–74, 75–84, and 85 and over (Tables B and 2). Rates for non-Hispanic white males decreased for age groups
under 1, 1–4, 15–24, 25–34, 65–74, 75–84, and 85 and over. The rate increased for the age group 35–44. Rates for non-Hispanic white females decreased for age groups under 1, 15–24, 45–54, 65–74, 75–84, and 85 and over.
For the total non-Hispanic black population, age-specific death rates decreased between 2018 and 2019 for age groups 65–74, 75–84, and 85 and over. The rates increased for age groups 15–24 and 35–44. The rate for non-Hispanic black males decreased for the age group 75–84 and increased for age groups 15–24 and 35–44. For non-Hispanic black females, rates decreased for age groups 65–74, 75–84, and 85 and over and increased for age group 15–24.
For the non-Hispanic AIAN population, changes in age-specific death rates from 2018 to 2019 were not statistically significant for the total and male populations. For non-Hispanic AIAN females, age-specific death rates decreased for the age group 5–14 and increased for age groups 1–4, 15–24, and 35–44.
For the total non-Hispanic Asian population, age-specific rates decreased from 2018 to 2019 for age groups 75–84 and 85 and over. The rate increased for age group 25–34. The
Rat
e pe
r 100
,000
pop
ulat
ion
1Rates are based on population estimates which differ from infant mortality rates (based on live births); see Figure 5 in this report for infant mortality rates and Technical Notes in this report for more discussion of the difference.SOURCE: National Center for Health Statistics, National Vital Statistics System, Mortality.
10
100
1,000
10,000
100,000
19551960 1970 1980 1990 2000 2010 2019
19551960 1970 1980 1990 2000 2010 2019
85 years and over 85 years and over
75–84 years75–84 years
65–74 years
65–74 yearsUnder 1 year1
Under 1 year1
45–54 years
45–54 years35–44 years
35–44 years25–34 years
25–34 years
1–4 years
1–4 years5–14 years
5–14 years
55–64 years 55–64 years
15–24 years
15–24 years
FemaleMale
Figure 2. Death rates, by age and sex: United States, 1955–2019
8 National Vital Statistics Reports, Vol. 70, No. 8, July 26, 2021
age-specific death rate decreased for non-Hispanic Asian males aged 85 and over and for non-Hispanic Asian females aged 75–84.
For the total non-Hispanic NHOPI population, age-specific death rates decreased for the age group 75–84 and increased for age groups 25–35 and 35–44. For non-Hispanic NHOPI males, the age-specific rate increased for age group 25–34.
For the total Hispanic population, age-specific death rates decreased for the age group 75–84 and increased between 2018 and 2019 for age groups under 1, 15–24, 25–34, and 35–44. Rates for Hispanic males decreased for the age group 75–84 and increased for age groups 15–24, 25–34, and 35–44. For Hispanic females, age-specific death rates decreased for age group 75–84 and increased for age group 35–44.
Other observed changes from 2018 to 2019 in age-specific rates by race and ethnicity and sex were not statistically significant.
Death rates for the non-Hispanic AIAN, Asian, and NHOPI populations are not adjusted for misclassification of race and ethnicity on death certificates. The rates for the non-Hispanic AIAN population are underestimated by about 33% due to misclassification (22). This should be considered when making rate comparisons across racial and ethnic groups.
Death rates for the Hispanic population are not adjusted for misclassification (Technical Notes). Therefore, these rates are underestimated by about 3.0% (22), and this also should be considered when interpreting rate disparities between Hispanic and non-Hispanic populations.
Expectation of life at birth and at specified ages
Life expectancy at birth represents the average number of years that a group of infants would live if the group was to experience throughout life the age-specific death rates present in the year of birth.
Life table data shown in this report for 2010–2019 are based on a revised methodology first presented with final data reported for 2008. The life table methodology was revised by changing the smoothing technique used to estimate the life table functions at the oldest ages. This revision improves on the methodologies used previously; see Technical Notes.
The methods used to produce life expectancies by Hispanic origin are based on death rates adjusted for misclassification (Technical Notes). In contrast, the age-specific and age-adjusted death rates shown in this report for the Hispanic population are not adjusted for misclassification of Hispanic origin. Thus, this report shows Hispanic deaths and death rates as collected by the registration areas, and these match the deaths and death rates produced using the mortality data file.
Life tables were generated for both sexes and by each sex for the following populations:
• Total U.S. population • Non-Hispanic white population • Non-Hispanic black population • Hispanic population
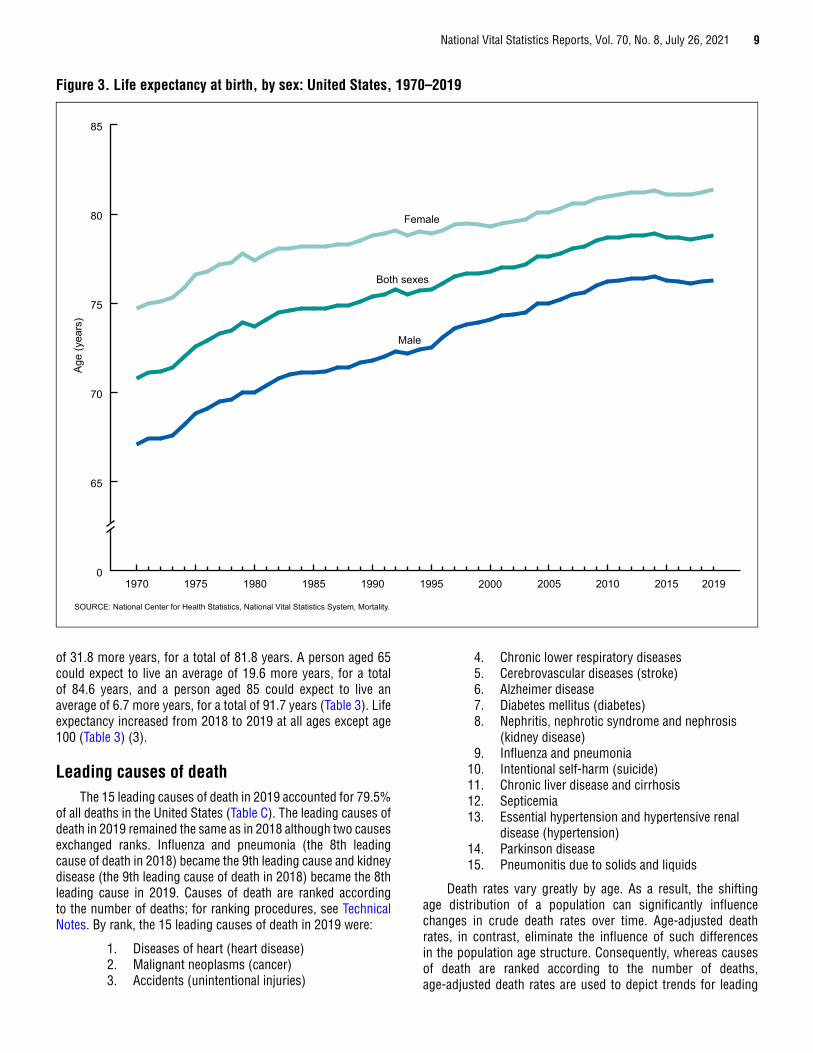
In 2019, life expectancy at birth for the U.S. population was 78.8 years, 0.1 year higher than 2018 (Tables 3 and 4). The general trend in U.S. life expectancy between 1900 and 2019 has been one of improvement. The only decreases in life expectancy in the last 20 years occurred in 2015 and 2017. In 2019, life expectancy for males (76.3 years) was 0.1 year higher than in 2018. Life expectancy for females (81.4 years) was 0.2 year higher than in 2018. From 1900 through the late 1970s, the gap in life expectancy between the sexes widened (3) from 2.0 to 7.8 years. The gap between sexes has narrowed since its peak in the 1970s (Figure 3; Table 4). In 2019, the difference in life expectancy between the sexes was 5.1 years, an increase of 0.1 year from 2018.
Life expectancy figures by Hispanic origin have been available starting with data for 2006 (24). Life expectancy increased by 0.2 year for the non-Hispanic white population (from 78.6 years in 2018 to 78.8 in 2019). Life expectancy for the non-Hispanic black population in 2019 (74.7) was the same as in 2018.
The difference in life expectancy between the non-Hispanic white and non-Hispanic black populations increased 0.2 year from 3.9 years in 2018 to 4.1 years in 2019 (Table 4).
Life expectancy for the Hispanic population was 81.8 years in 2019, unchanged since 2016 (Tables 3 and 4). Life expectancy was 1.5 years higher in 2019 compared with 2006 (Table I–21). The difference in life expectancy between the Hispanic and non-Hispanic white population decreased 0.2 year from 3.2 years in 2018 to 3.0 years in 2019 (Table 4).
Among the six major Hispanic-origin–race–sex groups in 2019, Hispanic females had the highest life expectancy at birth (84.4 years), followed by non-Hispanic white females (81.3), Hispanic males (79.0), non-Hispanic black females (78.1), non-Hispanic white males (76.3), and non-Hispanic black males (71.3) (Tables 3 and 4).
In 2019, life expectancy for Hispanic males decreased for the first time since 2016 (a 0.1–year decrease from 2018) and increased for Hispanic females for the first time since 2015 (a 0.1–year increase from 2018). In 2019, life expectancy was 2.7 years higher for the Hispanic male population than for the non-Hispanic white male population. The difference in life expectancy between these populations decreased 0.2 year from 2018. Life expectancy was 3.1 years higher for the Hispanic female population than for the non-Hispanic white female population. The difference in life expectancy decreased 0.1 year from 2018. Various hypotheses have been proposed to explain favorable mortality outcomes among Hispanic persons. The most prevalent hypotheses are the healthy migrant effect, which argues that Hispanic immigrants are selected for their good health and robustness; the “salmon bias” effect, which posits that U.S. residents of Hispanic origin may return to their country of origin to die or when ill; and the “cultural effect,” which argues that culturally influenced family structure, lifestyle behaviors, and social networks may confer a protective barrier against the negative effects of low socioeconomic and minority status (25,26).
Life tables shown in this report may be used to compare life expectancies at selected ages from birth to 100 years. For example, based on mortality experienced in 2019 for the total population, a person aged 50 could expect to live an average
National Vital Statistics Reports, Vol. 70, No. 8, July 26, 2021 9
of 31.8 more years, for a total of 81.8 years. A person aged 65 could expect to live an average of 19.6 more years, for a total of 84.6 years, and a person aged 85 could expect to live an average of 6.7 more years, for a total of 91.7 years (Table 3). Life expectancy increased from 2018 to 2019 at all ages except age 100 (Table 3) (3).
Leading causes of deathThe 15 leading causes of death in 2019 accounted for 79.5%
of all deaths in the United States (Table C). The leading causes of death in 2019 remained the same as in 2018 although two causes exchanged ranks. Influenza and pneumonia (the 8th leading cause of death in 2018) became the 9th leading cause and kidney disease (the 9th leading cause of death in 2018) became the 8th leading cause in 2019. Causes of death are ranked according to the number of deaths; for ranking procedures, see Technical Notes. By rank, the 15 leading causes of death in 2019 were:
1. Diseases of heart (heart disease)2. Malignant neoplasms (cancer)3. Accidents (unintentional injuries)
4. Chronic lower respiratory diseases5. Cerebrovascular diseases (stroke)6. Alzheimer disease7. Diabetes mellitus (diabetes)8. Nephritis, nephrotic syndrome and nephrosis
(kidney disease)9. Influenza and pneumonia
10. Intentional self-harm (suicide)11. Chronic liver disease and cirrhosis12. Septicemia13. Essential hypertension and hypertensive renal
disease (hypertension)14. Parkinson disease15. Pneumonitis due to solids and liquids
Death rates vary greatly by age. As a result, the shifting age distribution of a population can significantly influence changes in crude death rates over time. Age-adjusted death rates, in contrast, eliminate the influence of such differences in the population age structure. Consequently, whereas causes of death are ranked according to the number of deaths, age-adjusted death rates are used to depict trends for leading
SOURCE: National Center for Health Statistics, National Vital Statistics System, Mortality.
Age
(yea
rs)
0
65
70
75
80
85
Female
Male
Both sexes
20192015201020052000199519901985198019751970
Figure 3. Life expectancy at birth, by sex: United States, 1970–2019

10
National Vital Statistics Reports, Vol. 70, No. 8, July 26, 2021Table C. Number of deaths, percent of total deaths, death rates, and age-adjusted death rates for 2019, percent change in age-adjusted death rates in 2019 from 2018, and ratio of age-adjusted death rates by sex and by race and Hispanic origin for the 15 leading causes of death for the total population in 2019: United States[Crude death rates on an annual basis per 100,000 population; age-adjusted rates per 100,000 U.S. standard population; see Technical Notes in this report. Asterisks (*) preceding cause-of-death codes indicate they are not part of the International Classification of Diseases, 10th Revision (ICD–10); see Technical Notes. Race and Hispanic-origin categories are consistent with 1997 Office of Management and Budget (OMB) standards]
Rank1Cause of death (based on International
Classification of Diseases, 10th Revision) Number
Percent of total deaths,
2019
Crude death rate,
2019
Age-adjusted death rate
2019
Percent change Ratio
2018 to 2019 Male to female
Non-Hispanic black2 to
Non-Hispanic white2
Non-Hispanic white2 to Hispanic3
… All causes . . . . . . . . . . . . . . . . . . . . . . . . . . . . . . . . . . . . . . . . . . . . 2,854,838 100.0 869.7 715.2 -1.2 1.4 1.2 1.4
1 Diseases of heart . . . . . . . . . . . . . . . . . .(I00–I09,I11,I13,I20–I51) 659,041 23.1 200.8 161.5 -1.3 1.6 1.3 1.52 Malignant neoplasms . . . . . . . . . . . . . . . . . . . . . . . . . . (C00–C97) 599,601 21.0 182.7 146.2 -1.9 1.4 1.1 1.43 Accidents (unintentional
injuries) . . . . . . . . . . . . . . . . . . . . . . . . . . . .(V01–X59,Y85–Y86) 173,040 6.1 52.7 49.3 2.7 2.2 0.9 1.64 Chronic lower respiratory diseases . . . . . . . . . . . . . . . .(J40–J47) 156,979 5.5 47.8 38.2 -3.8 1.2 0.7 2.75 Cerebrovascular diseases . . . . . . . . . . . . . . . . . . . . . . . (I60–I69) 150,005 5.3 45.7 37.0 -0.3 1.1 1.5 1.16 Alzheimer disease . . . . . . . . . . . . . . . . . . . . . . . . . . . . . . . . (G30) 121,499 4.3 37.0 29.8 -2.3 0.7 0.9 1.27 Diabetes mellitus . . . . . . . . . . . . . . . . . . . . . . . . . . . . . (E10–E14) 87,647 3.1 26.7 21.6 0.9 1.6 2.0 0.78 Nephritis, nephrotic syndrome and
nephrosis . . . . . . . . . . . . . . . . . . (N00–N07,N17–N19,N25–N27) 51,565 1.8 15.7 12.7 -1.6 1.4 2.2 1.09 Influenza and pneumonia . . . . . . . . . . . . . . . . . . . . . . . .(J09–J18) 49,783 1.7 15.2 12.3 -17.4 1.3 1.1 1.310 Intentional self–harm (suicide) . . . . . . . . (*U03,X60–X84,Y87.0) 47,511 1.7 14.5 13.9 -2.1 3.7 0.4 2.411 Chronic liver disease and cirrhosis . . . . . . . . . . . .(K70,K73–K74) 44,358 1.6 13.5 11.3 1.8 1.9 0.6 0.812 Septicemia . . . . . . . . . . . . . . . . . . . . . . . . . . . . . . . . . . (A40–A41) 38,431 1.3 11.7 9.5 -6.9 1.2 1.7 1.413 Essential hypertension and
hypertensive renal disease . . . . . . . . . . . . . . . . . . . . (I10,I12,I15) 36,524 1.3 11.1 8.9 0.0 1.1 2.2 1.014 Parkinson disease . . . . . . . . . . . . . . . . . . . . . . . . . . . . (G20–G21) 35,311 1.2 10.8 8.8 1.1 2.3 0.5 1.515 Pneumonitis due to solids and liquids . . . . . . . . . . . . . . . . . .(J69) 19,184 0.7 5.8 4.7 -2.1 1.9 1.1 1.5… All other causes . . . . . . . . . . . . . . . . . . . . . . . . . . . . . . . (residual) 584,359 20.5 178.0 … … … … …
… Category not applicable. 1Rank based on number of deaths; see Technical Notes in this report. 2Includes only one race reported on the death certificate. 3Includes persons of Hispanic origin of any race; see Technical Notes.
SOURCE: National Center for Health Statistics, National Vital Statistics System, Mortality.
National Vital Statistics Reports, Vol. 70, No. 8, July 26, 2021 11
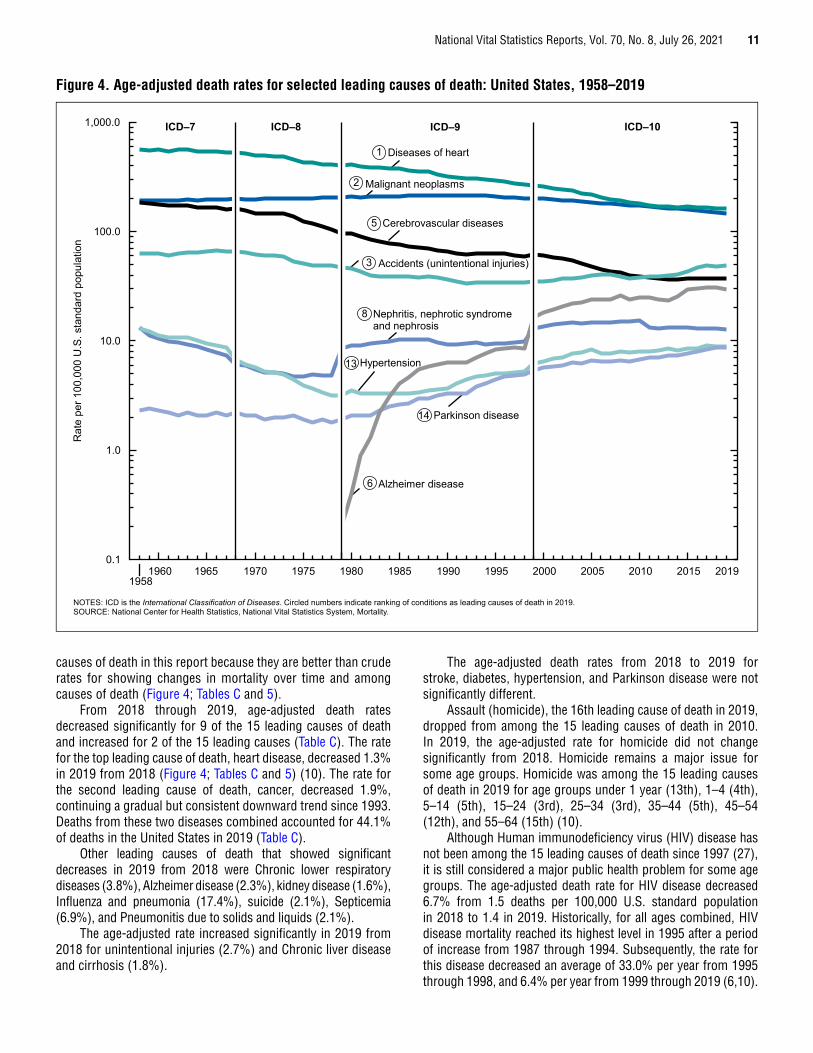
causes of death in this report because they are better than crude rates for showing changes in mortality over time and among causes of death (Figure 4; Tables C and 5).
From 2018 through 2019, age-adjusted death rates decreased significantly for 9 of the 15 leading causes of death and increased for 2 of the 15 leading causes (Table C). The rate for the top leading cause of death, heart disease, decreased 1.3% in 2019 from 2018 (Figure 4; Tables C and 5) (10). The rate for the second leading cause of death, cancer, decreased 1.9%, continuing a gradual but consistent downward trend since 1993. Deaths from these two diseases combined accounted for 44.1% of deaths in the United States in 2019 (Table C).
Other leading causes of death that showed significant decreases in 2019 from 2018 were Chronic lower respiratory diseases (3.8%), Alzheimer disease (2.3%), kidney disease (1.6%), Influenza and pneumonia (17.4%), suicide (2.1%), Septicemia (6.9%), and Pneumonitis due to solids and liquids (2.1%).
The age-adjusted rate increased significantly in 2019 from 2018 for unintentional injuries (2.7%) and Chronic liver disease and cirrhosis (1.8%).
The age-adjusted death rates from 2018 to 2019 for stroke, diabetes, hypertension, and Parkinson disease were not significantly different.
Assault (homicide), the 16th leading cause of death in 2019, dropped from among the 15 leading causes of death in 2010. In 2019, the age-adjusted rate for homicide did not change significantly from 2018. Homicide remains a major issue for some age groups. Homicide was among the 15 leading causes of death in 2019 for age groups under 1 year (13th), 1–4 (4th), 5–14 (5th), 15–24 (3rd), 25–34 (3rd), 35–44 (5th), 45–54 (12th), and 55–64 (15th) (10).
Although Human immunodeficiency virus (HIV) disease has not been among the 15 leading causes of death since 1997 (27), it is still considered a major public health problem for some age groups. The age-adjusted death rate for HIV disease decreased 6.7% from 1.5 deaths per 100,000 U.S. standard population in 2018 to 1.4 in 2019. Historically, for all ages combined, HIV disease mortality reached its highest level in 1995 after a period of increase from 1987 through 1994. Subsequently, the rate for this disease decreased an average of 33.0% per year from 1995 through 1998, and 6.4% per year from 1999 through 2019 (6,10).
0.1
1.0
10.0
100.0
1,000.0
NOTES: ICD is the International Classification of Diseases. Circled numbers indicate ranking of conditions as leading causes of death in 2019. SOURCE: National Center for Health Statistics, National Vital Statistics System, Mortality.
Rat
e pe
r 100
,000
U.S
. sta
ndar
d po
pula
tion
Alzheimer disease6
Diseases of heart 1
Malignant neoplasms 2
Cerebrovascular diseases 5
Accidents (unintentional injuries) 3
Nephritis, nephrotic syndrome and nephrosis
8
Hypertension
Parkinson disease14
19581960 1965 1970 1975 1980 1985 1990 1995 2000 2005 2010 2015 2019
13
ICD–7 ICD–8 ICD–9 ICD–10
Figure 4. Age-adjusted death rates for selected leading causes of death: United States, 1958–2019

12 National Vital Statistics Reports, Vol. 70, No. 8, July 26, 2021
In 2019, HIV disease was among the 15 leading causes of death for age groups 25–34 (10th), 35–44 (12th), and 45–54 (14th).
Enterocolitis due to Clostridium difficile (C. difficile)—A predominantly antibiotic-associated inflammation of the intestines caused by C. difficile, a gram-positive, anaerobic, spore-forming bacillus—is often acquired in hospitals or other health care facilities with long-term patients or residents (28,29). The number of deaths from C. difficile climbed from 793 deaths in 1999 to a high of 8,085 deaths in 2011 (10). Since 2011, the number of deaths from this cause has decreased nearly every year. In 2019, the number of deaths from C. difficile fell to 4,533. The age-adjusted death rate decreased 15.4%, from 1.6 deaths per 100,000 U.S. standard population in 2018 to 1.1 in 2019. Since 2015, the rate for C. difficile has decreased an average of 11.6% per year. In 2019. C. difficile, the 21st leading cause of death, dropped from among the top 20 leading causes of death for the population aged 65 and over. Approximately 85.7% of deaths from C. difficile occurred among people aged 65 and over (Table 6).
The relative risk of death in one population group compared with another can be expressed as a ratio. Ratios based on age-adjusted death rates show that males have higher rates than females for 14 of the 15 leading causes of death (Table C), with rates for males being at least twice as great as those for females for 3 of these leading causes. The largest ratio was for suicide (3.7). Other high ratios were evident for Parkinson disease (2.3), unintentional injuries (2.2), Chronic liver disease and cirrhosis and Pneumonitis due to solids and liquids (1.9 each), heart disease and diabetes (1.6 each), kidney disease and cancer (1.4 each), Influenza and pneumonia (1.3), Chronic lower respiratory diseases and Septicemia (1.2 each), and stroke and hypertension (1.1 each). Age-adjusted rates were lower for males than for females for one leading cause, Alzheimer disease (0.7).
Age-adjusted death rates for the non-Hispanic black population were higher than for the non-Hispanic white population for 9 of the 15 leading causes of death (Table C). The largest ratios were for kidney disease and hypertension (2.2 each). Other causes for which the ratio was high include diabetes (2.0). Septicemia (1.7), stroke (1.5), heart disease (1.3), and cancer, Influenza and pneumonia, and Pneumonitis due to solids and liquids (1.1 each). For six of the leading causes, age-adjusted rates were lower for the non-Hispanic black population than for the non-Hispanic white population. The smallest non-Hispanic black-to-non-Hispanic white ratio was for suicide (0.4); that is, the risk of dying from suicide was more than two times greater for the non-Hispanic white population than for the non-Hispanic black population. Other conditions with a low non-Hispanic black-to-non-Hispanic white ratio were Parkinson disease (0.5), Chronic liver disease and cirrhosis (0.6), Chronic lower respiratory diseases (0.7), and unintentional injuries and Alzheimer disease (0.9 each).
Leading causes of death in 2019 for the total population and for specific subpopulations are detailed further in a companion National Vital Statistics Report on leading causes by age, race and Hispanic origin, and sex (2).
Age-adjusted death rates for the non-Hispanic white population were higher than for the Hispanic population for 11 of
the 15 leading causes of death (Table C). The largest ratio was for Chronic lower respiratory diseases (2.7). Other causes for which the ratio was high include suicide (2.4), unintentional injuries (1.6), heart disease, Parkinson disease, and Pneumonitis due to solids and liquids (1.5 each), cancer and Septicemia (1.4 each), Influenza and pneumonia (1.3), Alzheimer disease (1.2), and stroke (1.1). Age-adjusted rates were lower for the non-Hispanic white population than for the Hispanic population for diabetes (0.7) and Chronic liver disease and cirrhosis (0.8).
Other select causesDementia-related mortality
In 2019, 271,872 persons died of dementia-related causes in the United States (Tables 6, 8, and I–1). Deaths from dementia-related causes were presented for the first time in this report series in 2018 to provide a more comprehensive estimate of the burden of mortality from Alzheimer disease and other dementias in the United States.
Dementia-related causes include conditions with similar physical signs and symptoms that, collectively, are considered to be a good indicator of dementia mortality (30). Dementia is characterized by memory impairment and cognitive decline (30–32). Causes of death attributable to dementia-related mortality include ICD–10 codes F01, Vascular dementia; F03, Unspecified dementia; G30, Alzheimer disease; and G31, Other degenerative diseases of nervous system, not elsewhere classified. Alzheimer disease, the sixth leading cause of death, is the most common cause of dementia, but other dementias, including Lewy body dementia, frontotemporal degeneration, vascular dementia, and mixed dementias, are often indistinguishable from Alzheimer disease in their symptoms and outcomes and may coexist with Alzheimer disease (30–32).
Certification and coding rule changes can impact data analysis of component causes of dementia. In 2019, Alzheimer disease accounted for 44.7% of all dementia deaths; Unspecified dementia for 35.9%; Other degenerative diseases of nervous system, not elsewhere classified for 13.0%; and Vascular dementia for 6.5%. For detailed information, see CDC WONDER (10). Changes in the percentage of deaths assigned to individual causes comprising dementia may be the result of many factors (33). Combining the types of dementia provides a more comprehensive and stable measure of dementia mortality.
The age-adjusted death rate for dementia-related causes was unchanged in 2019 from 2018 for the total population and did not change significantly for the male and female populations (Tables 5, 10, and I–1).
Drug-induced mortality
In 2019, a total of 74,511 persons died of drug-induced causes in the United States (Tables 6, 8, and I– 2). The category of drug-induced causes includes deaths from drug overdose as well as deaths from other medical conditions caused by use of legal or illegal drugs. In 2019, drug-overdose deaths accounted for 94.8% of all drug-induced deaths (Tables 6 and 8). The drug-induced category excludes deaths indirectly related to drug use,

National Vital Statistics Reports, Vol. 70, No. 8, July 26, 2021 13
as well as newborn deaths due to the mother’s drug use. (For a list of all drug-induced causes including those specifically classified as drug-overdose causes, see Technical Notes.)
The age-adjusted death rate for drug-induced causes increased 4.6% for the total population from 21.8 in 2018 to 22.8 in 2019 (Table 10). For males in 2019, the age-adjusted death rate for drug-induced causes was 2.1 times the rate for females. The rate for males increased by 6.1% in 2019 from 2018.
Among the major race-ethnicity groups—Age-adjusted rates increased in 2019 from 2018 by 15.0% for the non-Hispanic black population and by 15.5% for the Hispanic population. The age-adjusted death rate for non-Hispanic white males was 9.5% lower than for non-Hispanic black males and 76.1% higher than for Hispanic males. The rate for non-Hispanic white females was 31.7% higher than for non-Hispanic black females and 211.7% higher than for Hispanic females. Rates increased between 2018 and 2019 for non-Hispanic white males (2.3%), non-Hispanic black males (15.3%), non-Hispanic black females (15.4%), Hispanic males (17.1%), and Hispanic females (7.1%) (Tables 5, 10, and I–2). The age-adjusted death rate for drug-induced causes did not change significantly in 2019 from 2018 for the total female population, total non-Hispanic white population, and non-Hispanic white females.
Alcohol-induced mortality
In 2019, a total of 39,043 persons died of alcohol-induced causes in the United States (Tables 6, 8, and I–3). This category includes deaths from dependent and nondependent use of alcohol, and deaths from accidental poisoning by alcohol. It excludes unintentional injuries, homicides, and other causes indirectly related to alcohol use, and deaths due to fetal alcohol syndrome. For a list of alcohol-induced causes, see Technical Notes.
The age-adjusted death rate for alcohol-induced causes increased 5.1%, from 9.9 in 2018 to 10.4 in 2019 (Tables 5, 10, and I–3). For males in 2019, the age-adjusted death rate for alcohol-induced causes was 2.6 times the rate for females. The rate increased 3.4% for males and 5.4% for females from 2018 to 2019 (Tables 5, 10, and I–3).
Among the major race-ethnicity groups—Age-adjusted rates increased 4.7% for the non-Hispanic white population, 7.0% for the non-Hispanic black population, and 7.1% for the Hispanic population from 2018 to 2019. In 2019, the age-adjusted death rate for non-Hispanic white males was 32.8% higher than for non-Hispanic black males and 11.2% lower than for Hispanic males. The rate for non-Hispanic white females was 61.9% higher than for non-Hispanic black females and 78.9% higher than for Hispanic females. Rates increased 3.3% for non-Hispanic white males, 4.6% for non-Hispanic white females, 6.3% for non-Hispanic black males, and 15.2% for Hispanic females.
The age-adjusted rate for alcohol-induced death did not change significantly in 2019 from 2018 for non-Hispanic black females and Hispanic males.
Firearm-related mortality
In 2019, 39,707 persons died from firearm-related injuries in the United States (Tables 6, 8, and I–4). The age-adjusted death rate for firearm-related injuries for the total, male, and female populations did not change significantly from 2018 to 2019 (Tables 5, 10, and I–4). For males in 2019, the age-adjusted death rate for firearm-related injuries was 6.1 times the rate for females.
The age-adjusted death rate decreased 2.6% for the total non-Hispanic white population and increased 5.6% for the total non-Hispanic black population in 2019 from 2018. In 2019, the age-adjusted death rate from firearm-related injuries for non-Hispanic white males was 57.6% lower than for non-Hispanic black males and 69.6% higher than for Hispanic males. The rate for non-Hispanic white females was 29.4% lower than for non-Hispanic black females and 89.5% higher than for Hispanic females. The rate for firearm-related injuries increased 6.7% for non-Hispanic black males in 2019 from 2018.
The age-adjusted death rates for firearm-related injuries did not change significantly in 2019 from 2018 for non-Hispanic white females, non-Hispanic black females, Hispanic total, Hispanic males, and Hispanic females.
Effect on life expectancy of changes in mortality by age and cause of death
Changes in mortality by age and cause of death can have a major effect on life expectancy. In other words, year-to-year changes in life expectancy may be influenced by changes in age-specific rates for certain causes, particularly for younger age groups. Life expectancy at birth for the total population increased by 0.1 year in 2019 (78.8) from 2018 primarily because of decreases in mortality from cancer, Chronic lower respiratory diseases, Influenza and pneumonia, suicide, and stroke. The increase in life expectancy for the total population was slightly offset by increases in mortality from HIV disease, Nutritional deficiencies, Complications of medical and surgical care, and Parkinson disease. Life expectancy at birth for males increased 0.1 year due to decreases in mortality from cancer, heart disease, Influenza and pneumonia, Chronic lower respiratory diseases, and suicide. These decreases were offset somewhat by increases in mortality from unintentional injuries, homicide, diabetes, Chronic liver disease and cirrhosis, and Nutritional deficiencies. For the female population, life expectancy increased 0.2 year due to decreases in mortality from cancer, Influenza and pneumonia, heart disease, Chronic lower respiratory diseases, and Septicemia, which were offset by increases in mortality from Nutritional deficiencies, Chronic liver disease and cirrhosis, unintentional injuries, and Complications of medical and surgical care. (For a discussion of the major causes contributing to the change in life expectancy, see Technical Notes.)
Life expectancy for the non-Hispanic white population in 2019 increased 0.2 year to 78.8 years (Table 4). This increase was due to decreases in mortality from cancer, Influenza and pneumonia, heart disease, Chronic lower respiratory diseases, and suicide. These decreases in mortality were offset to some extent by increases for Chronic liver disease and cirrhosis,
14 National Vital Statistics Reports, Vol. 70, No. 8, July 26, 2021
diabetes, Nutritional deficiencies, unintentional injuries, and Parkinson disease. Life expectancy for the non-Hispanic white male population increased 0.1 year in 2019 (76.3 years) from 2018 due to decreases in mortality from cancer, heart disease, Influenza and pneumonia, Chronic lower respiratory diseases, and suicide, which were offset somewhat by increases in mortality for unintentional injuries, Chronic liver disease and cirrhosis, diabetes, Parkinson disease, and Nutritional deficiencies. Life expectancy for non-Hispanic white females increased 0.2 year in 2019 (81.3 years) from 2018 due to decreases in mortality from cancer, Influenza and pneumonia, heart disease, Chronic lower respiratory diseases, and suicide, which were offset somewhat by increases in mortality for Chronic liver disease and cirrhosis and Nutritional deficiencies.
Life expectancy for the non-Hispanic black population remained unchanged at 74.7 years in 2019 due to increases in mortality from unintentional injuries, homicide, Certain conditions originating in the perinatal period, suicide, and Complications of medical and surgical care, which were offset by decreases for cancer, heart disease, Influenza and pneumonia, Chronic lower respiratory diseases, and Septicemia. Life expectancy for the non-Hispanic black male population in 2019 remained the same as in 2018 (71.3 years) due to decreases in mortality from cancer, heart disease, Influenza and pneumonia, HIV disease, and kidney disease, which were offset by increases in mortality for unintentional injuries, homicide, suicide, Atherosclerosis, and Complications of medical and surgical care. Life expectancy for the non-Hispanic black female population increased 0.1 year in 2019 (78.1 years) from 2018 due to decreases in mortality from heart disease, cancer, Influenza and pneumonia, Chronic lower respiratory diseases, and Septicemia, which were offset somewhat by increases in mortality for unintentional injuries, Certain conditions originating in the perinatal period, stroke, Pregnancy, childbirth and the puerperium, and hypertension.
Life expectancy for the Hispanic population in 2019 remained unchanged at 81.8 years due to increases in mortality from unintentional injuries, diabetes, congenital malformations, Certain conditions originating in the perinatal period, and stroke, which were offset by decreases in mortality for heart disease, cancer, Influenza and pneumonia, Septicemia, and Chronic lower respiratory diseases. Life expectancy for the Hispanic male population decreased 0.1 year in 2019 (79.0) from 2018 due to increases in mortality from unintentional injuries, diabetes, Certain conditions originating in the perinatal period, stroke, and congenital malformations, which were offset somewhat by decreases in mortality for cancer, heart disease, Influenza and pneumonia, Alzheimer disease, and Septicemia. Life expectancy for the Hispanic female population in 2019 (84.4) increased 0.1 year from 2018 due to decreases in mortality from heart disease, Influenza and pneumonia, Septicemia, Chronic lower respiratory diseases, and cancer, which were offset somewhat by increases in mortality for unintentional injuries, diabetes, congenital malformations, Complications of medical and surgical care, and Nutritional deficiencies.
The difference in life expectancy between the male and female populations increased 0.1 year in 2019 to 5.1 years (Table 4). The widening in the male–female life expectancy gap
was due primarily to greater increases in mortality for the male population for unintentional injuries, homicide, and diabetes (data not shown).
Life table partitioning analysis indicates that the difference in 2019 of 3.0 years in life expectancy between the Hispanic and non-Hispanic white populations is mostly explained by lower mortality for the Hispanic population from heart disease, cancer, Chronic lower respiratory diseases, unintentional injuries, and suicide. (For a discussion of the major causes contributing to the difference in life expectancy, see Technical Notes.)
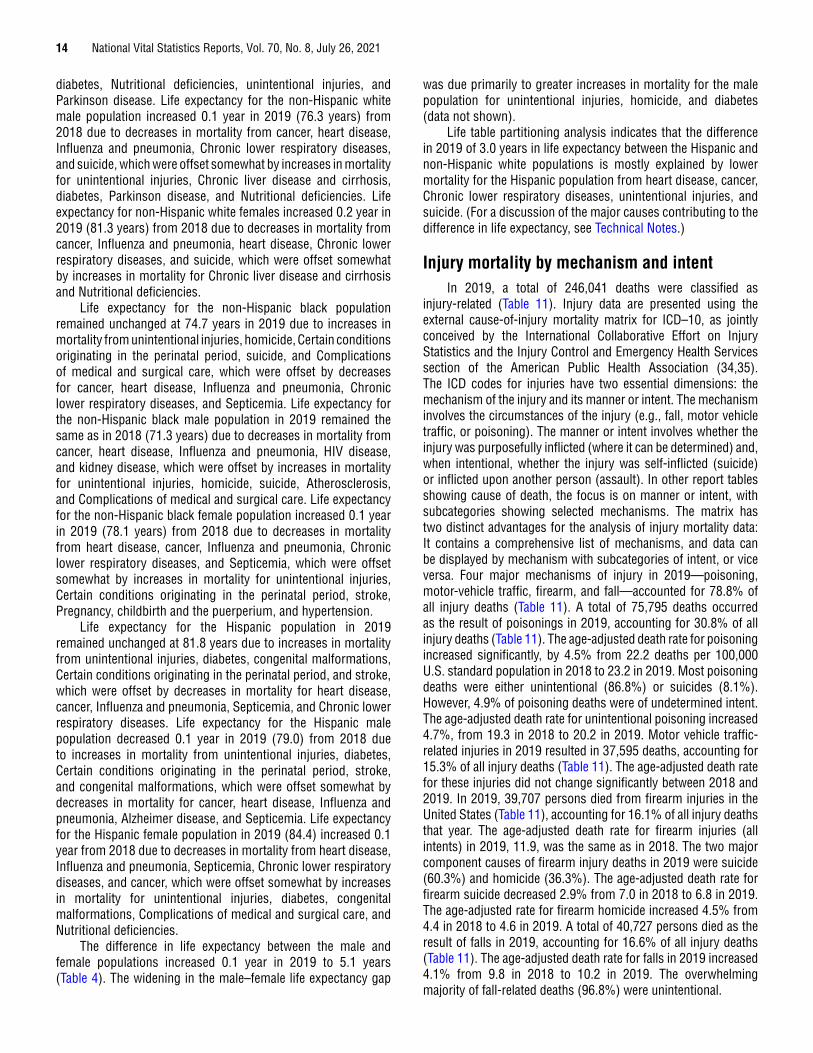
Injury mortality by mechanism and intentIn 2019, a total of 246,041 deaths were classified as
injury-related (Table 11). Injury data are presented using the external cause-of-injury mortality matrix for ICD–10, as jointly conceived by the International Collaborative Effort on Injury Statistics and the Injury Control and Emergency Health Services section of the American Public Health Association (34,35). The ICD codes for injuries have two essential dimensions: the mechanism of the injury and its manner or intent. The mechanism involves the circumstances of the injury (e.g., fall, motor vehicle traffic, or poisoning). The manner or intent involves whether the injury was purposefully inflicted (where it can be determined) and, when intentional, whether the injury was self-inflicted (suicide) or inflicted upon another person (assault). In other report tables showing cause of death, the focus is on manner or intent, with subcategories showing selected mechanisms. The matrix has two distinct advantages for the analysis of injury mortality data: It contains a comprehensive list of mechanisms, and data can be displayed by mechanism with subcategories of intent, or vice versa. Four major mechanisms of injury in 2019—poisoning, motor-vehicle traffic, firearm, and fall—accounted for 78.8% of all injury deaths (Table 11). A total of 75,795 deaths occurred as the result of poisonings in 2019, accounting for 30.8% of all injury deaths (Table 11). The age-adjusted death rate for poisoning increased significantly, by 4.5% from 22.2 deaths per 100,000 U.S. standard population in 2018 to 23.2 in 2019. Most poisoning deaths were either unintentional (86.8%) or suicides (8.1%). However, 4.9% of poisoning deaths were of undetermined intent. The age-adjusted death rate for unintentional poisoning increased 4.7%, from 19.3 in 2018 to 20.2 in 2019. Motor vehicle traffic-related injuries in 2019 resulted in 37,595 deaths, accounting for 15.3% of all injury deaths (Table 11). The age-adjusted death rate for these injuries did not change significantly between 2018 and 2019. In 2019, 39,707 persons died from firearm injuries in the United States (Table 11), accounting for 16.1% of all injury deaths that year. The age-adjusted death rate for firearm injuries (all intents) in 2019, 11.9, was the same as in 2018. The two major component causes of firearm injury deaths in 2019 were suicide (60.3%) and homicide (36.3%). The age-adjusted death rate for firearm suicide decreased 2.9% from 7.0 in 2018 to 6.8 in 2019. The age-adjusted rate for firearm homicide increased 4.5% from 4.4 in 2018 to 4.6 in 2019. A total of 40,727 persons died as the result of falls in 2019, accounting for 16.6% of all injury deaths (Table 11). The age-adjusted death rate for falls in 2019 increased 4.1% from 9.8 in 2018 to 10.2 in 2019. The overwhelming majority of fall-related deaths (96.8%) were unintentional.
National Vital Statistics Reports, Vol. 70, No. 8, July 26, 2021 15
State of residenceMortality patterns varied considerably by state (Tables 12
and 15). The state with the highest age-adjusted death rate in 2019 was West Virginia (945.4 per 100,000 U.S. standard population), with a rate 32.2% above the national rate (715.2). The state with the lowest age-adjusted death rate was Hawaii (573.3), with a rate 19.8% below the national rate. The age-adjusted death rate for West Virginia was 64.9% higher than the rate for Hawaii.
Variations in mortality by state were associated with differences in socioeconomic status, racial and ethnic composition, as well as with differences in risk of specific causes of death (36).
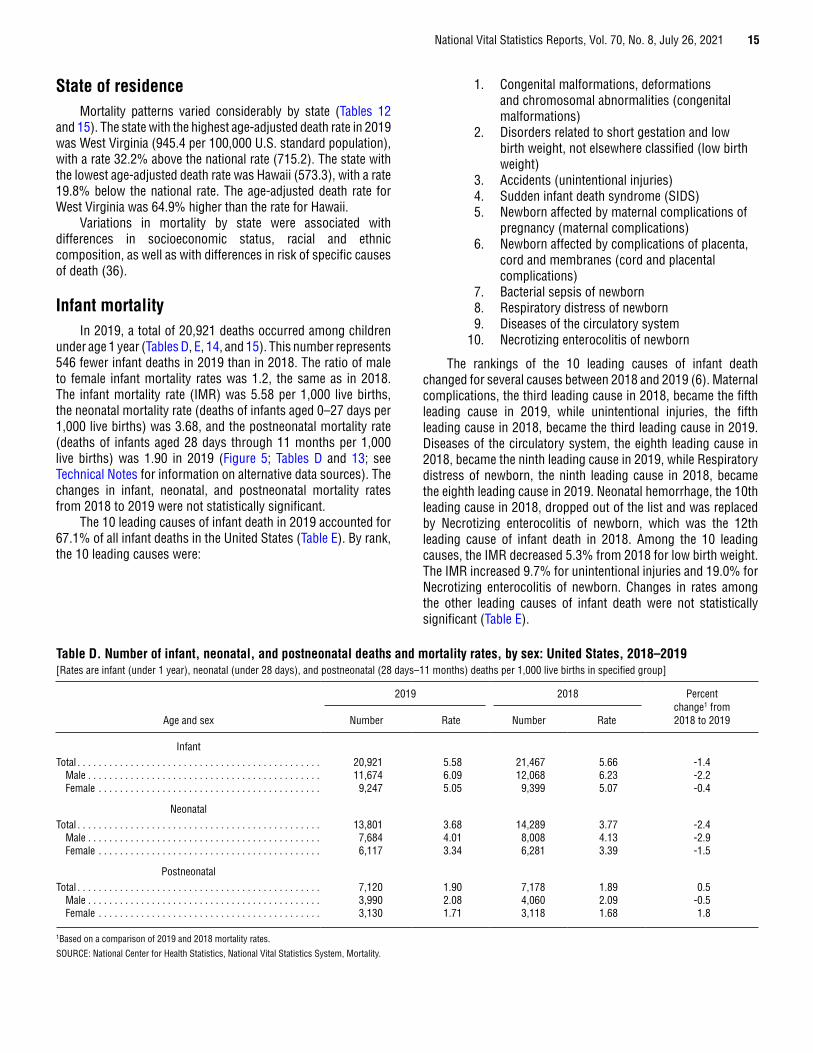
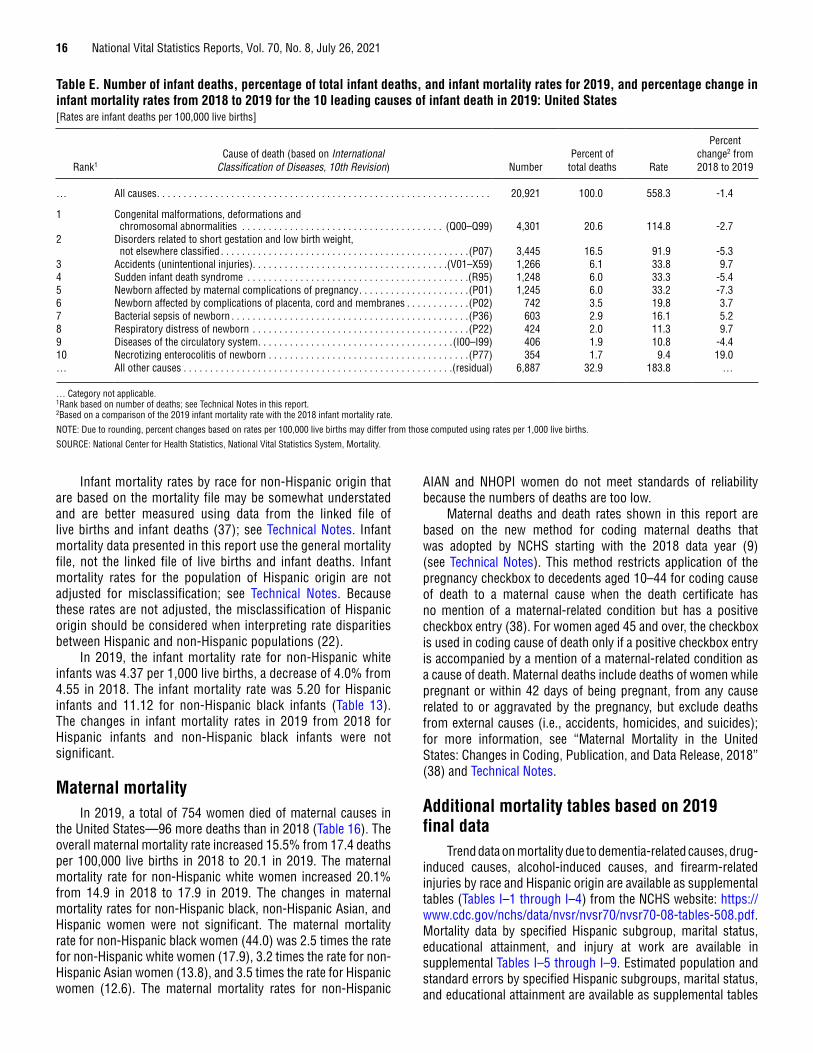
Infant mortalityIn 2019, a total of 20,921 deaths occurred among children
under age 1 year (Tables D, E, 14, and 15). This number represents 546 fewer infant deaths in 2019 than in 2018. The ratio of male to female infant mortality rates was 1.2, the same as in 2018. The infant mortality rate (IMR) was 5.58 per 1,000 live births, the neonatal mortality rate (deaths of infants aged 0–27 days per 1,000 live births) was 3.68, and the postneonatal mortality rate (deaths of infants aged 28 days through 11 months per 1,000 live births) was 1.90 in 2019 (Figure 5; Tables D and 13; see Technical Notes for information on alternative data sources). The changes in infant, neonatal, and postneonatal mortality rates from 2018 to 2019 were not statistically significant.
The 10 leading causes of infant death in 2019 accounted for 67.1% of all infant deaths in the United States (Table E). By rank, the 10 leading causes were:
1. Congenital malformations, deformations and chromosomal abnormalities (congenital malformations)
2. Disorders related to short gestation and low birth weight, not elsewhere classified (low birth weight)
3. Accidents (unintentional injuries)4. Sudden infant death syndrome (SIDS)5. Newborn affected by maternal complications of
pregnancy (maternal complications)6. Newborn affected by complications of placenta,
cord and membranes (cord and placental complications)
7. Bacterial sepsis of newborn8. Respiratory distress of newborn9. Diseases of the circulatory system
10. Necrotizing enterocolitis of newborn
The rankings of the 10 leading causes of infant death changed for several causes between 2018 and 2019 (6). Maternal complications, the third leading cause in 2018, became the fifth leading cause in 2019, while unintentional injuries, the fifth leading cause in 2018, became the third leading cause in 2019. Diseases of the circulatory system, the eighth leading cause in 2018, became the ninth leading cause in 2019, while Respiratory distress of newborn, the ninth leading cause in 2018, became the eighth leading cause in 2019. Neonatal hemorrhage, the 10th leading cause in 2018, dropped out of the list and was replaced by Necrotizing enterocolitis of newborn, which was the 12th leading cause of infant death in 2018. Among the 10 leading causes, the IMR decreased 5.3% from 2018 for low birth weight. The IMR increased 9.7% for unintentional injuries and 19.0% for Necrotizing enterocolitis of newborn. Changes in rates among the other leading causes of infant death were not statistically significant (Table E).
Table D. Number of infant, neonatal, and postneonatal deaths and mortality rates, by sex: United States, 2018–2019[Rates are infant (under 1 year), neonatal (under 28 days), and postneonatal (28 days–11 months) deaths per 1,000 live births in specified group]
Age and sex
2019 2018 Percent change1 from 2018 to 2019Number Rate Number Rate
InfantTotal . . . . . . . . . . . . . . . . . . . . . . . . . . . . . . . . . . . . . . . . . . . . . . 20,921 5.58 21,467 5.66 -1.4
Male . . . . . . . . . . . . . . . . . . . . . . . . . . . . . . . . . . . . . . . . . . . . 11,674 6.09 12,068 6.23 -2.2Female . . . . . . . . . . . . . . . . . . . . . . . . . . . . . . . . . . . . . . . . . . 9,247 5.05 9,399 5.07 -0.4
NeonatalTotal . . . . . . . . . . . . . . . . . . . . . . . . . . . . . . . . . . . . . . . . . . . . . . 13,801 3.68 14,289 3.77 -2.4
Male . . . . . . . . . . . . . . . . . . . . . . . . . . . . . . . . . . . . . . . . . . . . 7,684 4.01 8,008 4.13 -2.9Female . . . . . . . . . . . . . . . . . . . . . . . . . . . . . . . . . . . . . . . . . . 6,117 3.34 6,281 3.39 -1.5
PostneonatalTotal . . . . . . . . . . . . . . . . . . . . . . . . . . . . . . . . . . . . . . . . . . . . . . 7,120 1.90 7,178 1.89 0.5
Male . . . . . . . . . . . . . . . . . . . . . . . . . . . . . . . . . . . . . . . . . . . . 3,990 2.08 4,060 2.09 -0.5Female . . . . . . . . . . . . . . . . . . . . . . . . . . . . . . . . . . . . . . . . . . 3,130 1.71 3,118 1.68 1.8
1Based on a comparison of 2019 and 2018 mortality rates.
SOURCE: National Center for Health Statistics, National Vital Statistics System, Mortality.
16 National Vital Statistics Reports, Vol. 70, No. 8, July 26, 2021
Infant mortality rates by race for non-Hispanic origin that are based on the mortality file may be somewhat understated and are better measured using data from the linked file of live births and infant deaths (37); see Technical Notes. Infant mortality data presented in this report use the general mortality file, not the linked file of live births and infant deaths. Infant mortality rates for the population of Hispanic origin are not adjusted for misclassification; see Technical Notes. Because these rates are not adjusted, the misclassification of Hispanic origin should be considered when interpreting rate disparities between Hispanic and non-Hispanic populations (22).
In 2019, the infant mortality rate for non-Hispanic white infants was 4.37 per 1,000 live births, a decrease of 4.0% from 4.55 in 2018. The infant mortality rate was 5.20 for Hispanic infants and 11.12 for non-Hispanic black infants (Table 13). The changes in infant mortality rates in 2019 from 2018 for Hispanic infants and non-Hispanic black infants were not significant.
Maternal mortalityIn 2019, a total of 754 women died of maternal causes in
the United States—96 more deaths than in 2018 (Table 16). The overall maternal mortality rate increased 15.5% from 17.4 deaths per 100,000 live births in 2018 to 20.1 in 2019. The maternal mortality rate for non-Hispanic white women increased 20.1% from 14.9 in 2018 to 17.9 in 2019. The changes in maternal mortality rates for non-Hispanic black, non-Hispanic Asian, and Hispanic women were not significant. The maternal mortality rate for non-Hispanic black women (44.0) was 2.5 times the rate for non-Hispanic white women (17.9), 3.2 times the rate for non-Hispanic Asian women (13.8), and 3.5 times the rate for Hispanic women (12.6). The maternal mortality rates for non-Hispanic
AIAN and NHOPI women do not meet standards of reliability because the numbers of deaths are too low.
Maternal deaths and death rates shown in this report are based on the new method for coding maternal deaths that was adopted by NCHS starting with the 2018 data year (9) (see Technical Notes). This method restricts application of the pregnancy checkbox to decedents aged 10–44 for coding cause of death to a maternal cause when the death certificate has no mention of a maternal-related condition but has a positive checkbox entry (38). For women aged 45 and over, the checkbox is used in coding cause of death only if a positive checkbox entry is accompanied by a mention of a maternal-related condition as a cause of death. Maternal deaths include deaths of women while pregnant or within 42 days of being pregnant, from any cause related to or aggravated by the pregnancy, but exclude deaths from external causes (i.e., accidents, homicides, and suicides); for more information, see “Maternal Mortality in the United States: Changes in Coding, Publication, and Data Release, 2018” (38) and Technical Notes.
Additional mortality tables based on 2019 final data
Trend data on mortality due to dementia-related causes, drug-induced causes, alcohol-induced causes, and firearm-related injuries by race and Hispanic origin are available as supplemental tables (Tables I–1 through I–4) from the NCHS website: https://www.cdc.gov/nchs/data/nvsr/nvsr70/nvsr70-08-tables-508.pdf. Mortality data by specified Hispanic subgroup, marital status, educational attainment, and injury at work are available in supplemental Tables I–5 through I–9. Estimated population and standard errors by specified Hispanic subgroups, marital status, and educational attainment are available as supplemental tables
Table E. Number of infant deaths, percentage of total infant deaths, and infant mortality rates for 2019, and percentage change in infant mortality rates from 2018 to 2019 for the 10 leading causes of infant death in 2019: United States[Rates are infant deaths per 100,000 live births]
Rank1Cause of death (based on International
Classification of Diseases, 10th Revision) NumberPercent of
total deaths Rate
Percent change2 from 2018 to 2019
… All causes . . . . . . . . . . . . . . . . . . . . . . . . . . . . . . . . . . . . . . . . . . . . . . . . . . . . . . . . . . . . . . . 20,921 100.0 558.3 -1.4
1 Congenital malformations, deformations and chromosomal abnormalities . . . . . . . . . . . . . . . . . . . . . . . . . . . . . . . . . . . . . . (Q00–Q99) 4,301 20.6 114.8 -2.7
2 Disorders related to short gestation and low birth weight, not elsewhere classified . . . . . . . . . . . . . . . . . . . . . . . . . . . . . . . . . . . . . . . . . . . . . . .(P07) 3,445 16.5 91.9 -5.3
3 Accidents (unintentional injuries) . . . . . . . . . . . . . . . . . . . . . . . . . . . . . . . . . . . . .(V01–X59) 1,266 6.1 33.8 9.74 Sudden infant death syndrome . . . . . . . . . . . . . . . . . . . . . . . . . . . . . . . . . . . . . . . . . .(R95) 1,248 6.0 33.3 -5.45 Newborn affected by maternal complications of pregnancy . . . . . . . . . . . . . . . . . . . . .(P01) 1,245 6.0 33.2 -7.36 Newborn affected by complications of placenta, cord and membranes . . . . . . . . . . . .(P02) 742 3.5 19.8 3.77 Bacterial sepsis of newborn . . . . . . . . . . . . . . . . . . . . . . . . . . . . . . . . . . . . . . . . . . . . .(P36) 603 2.9 16.1 5.28 Respiratory distress of newborn . . . . . . . . . . . . . . . . . . . . . . . . . . . . . . . . . . . . . . . . .(P22) 424 2.0 11.3 9.79 Diseases of the circulatory system . . . . . . . . . . . . . . . . . . . . . . . . . . . . . . . . . . . . .(I00–I99) 406 1.9 10.8 -4.410 Necrotizing enterocolitis of newborn . . . . . . . . . . . . . . . . . . . . . . . . . . . . . . . . . . . . . .(P77) 354 1.7 9.4 19.0… All other causes . . . . . . . . . . . . . . . . . . . . . . . . . . . . . . . . . . . . . . . . . . . . . . . . . . .(residual) 6,887 32.9 183.8 …
… Category not applicable. 1Rank based on number of deaths; see Technical Notes in this report. 2Based on a comparison of the 2019 infant mortality rate with the 2018 infant mortality rate.
NOTE: Due to rounding, percent changes based on rates per 100,000 live births may differ from those computed using rates per 1,000 live births.
SOURCE: National Center for Health Statistics, National Vital Statistics System, Mortality.
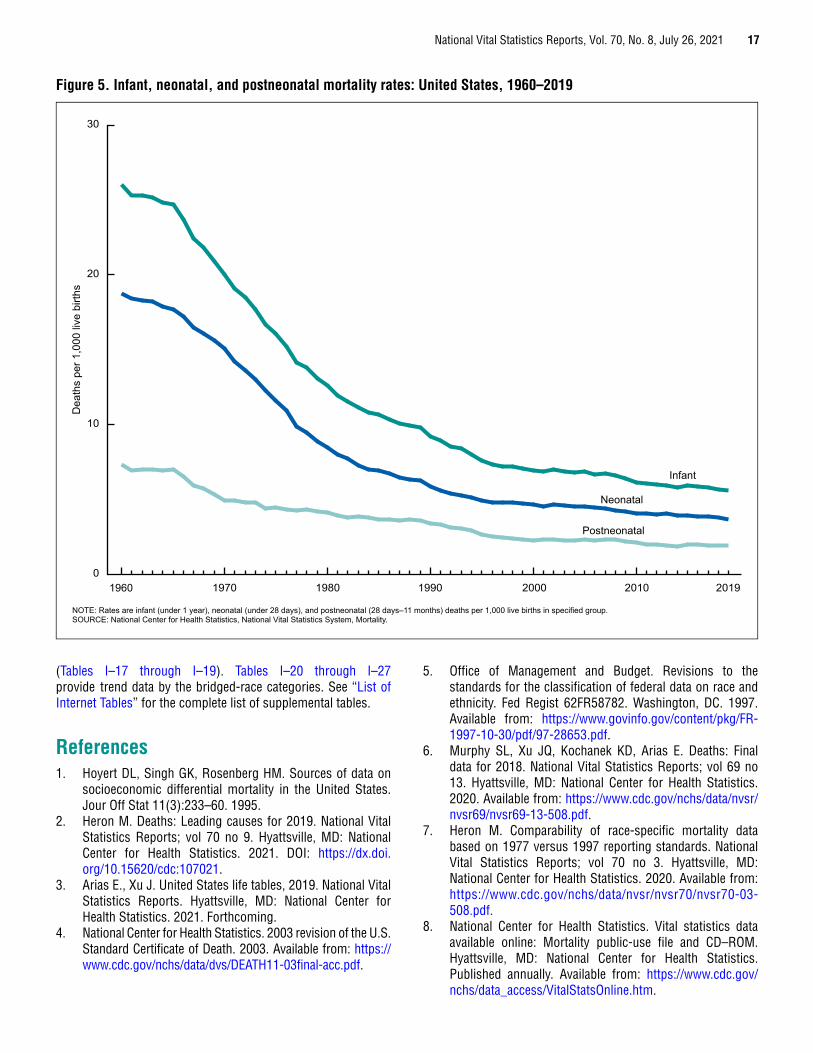
National Vital Statistics Reports, Vol. 70, No. 8, July 26, 2021 17
(Tables I–17 through I–19). Tables I–20 through I–27 provide trend data by the bridged-race categories. See “List of Internet Tables” for the complete list of supplemental tables.
References1. Hoyert DL, Singh GK, Rosenberg HM. Sources of data on
socioeconomic differential mortality in the United States.Jour Off Stat 11(3):233–60. 1995.
2. Heron M. Deaths: Leading causes for 2019. National VitalStatistics Reports; vol 70 no 9. Hyattsville, MD: NationalCenter for Health Statistics. 2021. DOI: https://dx.doi.org/10.15620/cdc:107021.
3. Arias E., Xu J. United States life tables, 2019. National VitalStatistics Reports. Hyattsville, MD: National Center forHealth Statistics. 2021. Forthcoming.
4. National Center for Health Statistics. 2003 revision of the U.S.Standard Certificate of Death. 2003. Available from: https://www.cdc.gov/nchs/data/dvs/DEATH11-03final-acc.pdf.
5. Office of Management and Budget. Revisions to thestandards for the classification of federal data on race andethnicity. Fed Regist 62FR58782. Washington, DC. 1997.Available from: https://www.govinfo.gov/content/pkg/FR-1997-10-30/pdf/97-28653.pdf.
6. Murphy SL, Xu JQ, Kochanek KD, Arias E. Deaths: Finaldata for 2018. National Vital Statistics Reports; vol 69 no13. Hyattsville, MD: National Center for Health Statistics.2020. Available from: https://www.cdc.gov/nchs/data/nvsr/nvsr69/nvsr69-13-508.pdf.
7. Heron M. Comparability of race-specific mortality databased on 1977 versus 1997 reporting standards. NationalVital Statistics Reports; vol 70 no 3. Hyattsville, MD:National Center for Health Statistics. 2020. Available from:https://www.cdc.gov/nchs/data/nvsr/nvsr70/nvsr70-03-508.pdf.
8. National Center for Health Statistics. Vital statistics dataavailable online: Mortality public-use file and CD–ROM.Hyattsville, MD: National Center for Health Statistics.Published annually. Available from: https://www.cdc.gov/nchs/data_access/VitalStatsOnline.htm.
Infant
Neonatal
Postneonatal
0
10
20
30
NOTE: Rates are infant (under 1 year), neonatal (under 28 days), and postneonatal (28 days–11 months) deaths per 1,000 live births in specified group.SOURCE: National Center for Health Statistics, National Vital Statistics System, Mortality.
Dea
ths
per 1
,000
live
birt
hs
1960 201920102000199019801970
Figure 5. Infant, neonatal, and postneonatal mortality rates: United States, 1960–2019
18 National Vital Statistics Reports, Vol. 70, No. 8, July 26, 2021
9. National Center for Health Statistics. National Vital Statistics System: NCHS data release and access policy for micro-data and compressed vital statistics files. Available from: https://www.cdc.gov/nchs/nvss/dvs_data_release.htm.
10. CDC. Wide-ranging online data for epidemiologic research (WONDER). Underlying cause of death output based on the Detailed Mortality File. Available from: https://wonder.cdc.gov/.
11. National Center for Health Statistics. Vital statistics of the United States: Mortality, 1999. Technical appendix. Hyattsville, MD. 2004. Available from: https://www.cdc.gov/nchs/data/statab/techap99.pdf.
12. World Health Organization. International statistical classification of diseases and related health problems, 10th revision. 2008 ed. Geneva, Switzerland. 2009.
13. National Center for Health Statistics, National Vital Statistics System. Volume 1. ICD–10, International statistical classification of diseases and related health problems. Tabular list. (Modified by NCHS for use in the classification and analysis of medical mortality data in the U.S.) NCHS Instruction Manual; part 2e, vol 1. Hyattsville, MD. Published annually. Available from: https://www.cdc.gov/nchs/nvss/instruction_manuals.htm.
14. National Center for Health Statistics, National Vital Statistics System. Volume 1. ICD–10, International statistical classification of diseases and related health problems. Alphabetical index. (Modified by NCHS for use in the classification and analysis of medical mortality data in the U.S.) NCHS Instruction Manual; part 2e, vol 3. Hyattsville, MD. Published annually. Available from: https://www.cdc.gov/nchs/nvss/instruction_manuals.htm.
15. Tolson GC, Barnes JM, Gay GA, Kowaleski JL. The 1989 revision of the U.S. standard certificates and reports. National Center for Health Statistics. Vital Health Stat 4(28). 1991. Available from: https://www.cdc.gov/nchs/data/series/sr_04/sr04_028.pdf.
16. Office of Management and Budget. Race and ethnic standards for federal statistics and administrative reporting. Statistical Policy Directive 15. Washington, DC. 1977. Available from: https://wonder.cdc.gov/wonder/help/populations/bridged-race/directive15.html.
17. U.S. Census Bureau. 2019 population estimates. Annual state resident population estimates for 6 race groups (5 race alone groups and two or more races) by age, sex, and Hispanic origin: April 1, 2010 to July 1, 2019. 2020. Available from: https://www2.census.gov/programs-surveys/popest/tables/2010-2019/state/asrh/sc-est2019-alldata6.csv.
18. U.S. Census Bureau. 2018 population estimates. Annual state resident population estimates for 6 race groups (5 race alone groups and two or more races) by age, sex, and Hispanic origin: April 1, 2010 to July 1, 2018. 2019. Available from: https://www2.census.gov/programs-surveys/popest/tables/2010-2018/state/asrh/sc-est2018-alldata6.csv.
19. National Center for Health Statistics. Downloadable data files and documentation. Prepared under a collaborative agreement with the U.S. Census Bureau. Available from: https://www.cdc.gov/nchs/nvss/bridged_race.htm.
20. Ingram DD, Parker JD, Schenker N, Weed JA, Hamilton B, Arias E, Madans JH. United States Census 2000 population with bridged race categories. National Center for Health Statistics. Vital Health Stat 2(135). 2003. Available from: https://www.cdc.gov/nchs/data/series/sr_02/sr02_135.pdf.
21. Schenker N, Parker JD. From single-race reporting to multiple-race reporting: Using imputation methods to bridge the transition. Stat Med 22(9):1571–87. 2003.
22. Arias E, Heron M, Hakes JK. The validity of race and Hispanic-origin reporting on death certificates in the United States: An update. National Center for Health Statistics. Vital Health Stat 2(172). 2016. Available from: https://www.cdc.gov/nchs/data/series/sr_02/sr02_172.pdf.
23. Arias E, Eschbach K, Schauman WS, Backlund EL, Sorlie PD. The Hispanic mortality advantage and ethnic misclassification on US death certificates. Am J Public Health 100 Suppl 1:S171–7. 2010. Available from: https://ajph.aphapublications.org/doi/pdf/10.2105/AJPH.2008.135863.
24. Arias E. United States life tables by Hispanic origin. National Center for Health Statistics. Vital Health Stat 2(152). 2010. Available from: https://www.cdc.gov/nchs/data/series/sr_02/sr02_152.pdf.
25. Abraido-Lanza AF, Dohrenwend BP, Ng-Mak DS, Turner JB. The Latino mortality paradox: A test of the “salmon bias” and healthy migrant hypotheses. Am J Public Health 89(10):1543–8. 1999. Available from: https://www.ncbi.nlm.nih.gov/pmc/articles/PMC1508801/pdf/amjph00010-0085.pdf.
26. Palloni A, Arias E. Paradox lost: Explaining the Hispanic adult mortality advantage. Demography 41(3):385–415. 2004.
27. Hoyert DL, Kochanek KD, Murphy SL. Deaths: Final data for 1997. National Vital Statistics Reports; vol 47 no 19. Hyattsville, MD: National Center for Health Statistics. 1999. Available from: https://www.cdc.gov/nchs/data/nvsr/nvsr47/nvs47_19.pdf.
28. Sunenshine RH, McDonald LC. Clostridium difficile-associated disease: New challenges from an established pathogen. Cleve Clin J Med 73(2):187–97. 2006.
29. Redelings MD, Sorvillo F, Mascola L. Increase in Clostridium difficile-related mortality rates, United States, 1999–2004. Emerg Infect Dis 13(9). 2007. Available from: https://wwwnc.cdc.gov/eid/article/13/9/06-1116_article.
30. World Health Organization. Dementia. Available from: https://www.who.int/news-room/fact-sheets/detail/dementia.
31. National Institute on Aging. Alzheimer's disease fact sheet. 2019. Available from: https://www.nia.nih.gov/alzheimers/publication/alzheimers-disease-fact-sheet.
32. U.S. Department of Health and Human Services. National plan to address Alzheimer's disease: 2019 update. 2019. Available from https://aspe.hhs.gov/system/files/pdf/262601/NatlPlan2019.pdf.

National Vital Statistics Reports, Vol. 70, No. 8, July 26, 2021 19
33. Kramarow EA, Tejada-Vera B. Dementia mortality in the United States, 2000–2017. National Vital Statistics Reports; vol 68 no 2. Hyattsville, MD: National Center for Health Statistics. 2019. Available from: https://www.cdc.gov/nchs/data/nvsr/nvsr68/nvsr68_02-508.pdf.
34. National Center for Health Statistics. Proceedings of the international collaborative effort on injury statistics; vol 1. Hyattsville, MD. 1995. Available from: https://www.cdc.gov/nchs/data/ice/ice95v1/ice_i.pdf.
35. Fingerhut LA, Cox CS, Warner M. International comparative analysis of injury mortality: Findings from the ICE on Injury Statistics. Advance Data from Vital and Health Statistics; no 303. Hyattsville, MD: National Center for Health Statistics. 1998. Available from: https://www.cdc.gov/nchs/data/ad/ad303.pdf.
36. Pamuk ER, Makuc DM, Heck KE, Reuben C, Lochner K. Socioeconomic status and health chartbook. Health, United States, 1998. Hyattsville, MD: National Center for Health Statistics. 1998. Available from: https://www.cdc.gov/nchs/data/hus/hus98cht.pdf.
37. User guide to the 2018 period/2017 cohort period linked birth/infant death public use file. Available from: ftp://ftp.cdc.gov/pub/Health_Statistics/NCHS/Dataset_Documentation/DVS/period-cohort-linked/18PE17CO_linkedUG.pdf.
38. Hoyert DL, Miniño AM. Maternal mortality in the United States: Changes in coding, publication, and data release, 2018. National Vital Statistics Reports; vol 69 no 2. Hyattsville, MD: National Center for Health Statistics. 2020.
39. World Health Organization. International statistical classification of diseases and related health problems, 10th revision. Geneva, Switzerland. 1992.
40. National Center for Health Statistics, Data Warehouse. Comparability of cause-of-death between ICD revisions. 2008. Available from: https://www.cdc.gov/nchs/nvss/mortality/comparability_icd.htm.
41. National Center for Health Statistics, Data Warehouse. Updated comparability ratios (ICD–10 and ICD–9). 2004. Available from: ftp://ftp.cdc.gov/pub/Health_Statistics/NCHS/Datasets/Comparability/icd9_icd10/Comparability_Ratio_tables.xls.
42. Anderson RN, Miniño AM, Hoyert DL, Rosenberg HM. Comparability of cause of death between ICD–9 and ICD–10: Preliminary estimates. National Vital Statistics Reports; vol 49 no 2. Hyattsville, MD: National Center for Health Statistics. 2001. Available from: https://www.cdc.gov/nchs/data/nvsr/nvsr49/nvsr49_02.pdf.
43. Faust MM, Dolman AB. Comparability of mortality statistics for the sixth and seventh revisions, United States, 1958. Vital Statistics—Special Reports 51(4). Washington, DC: National Center for Health Statistics. 1965. Available from: https://www.cdc.gov/nchs/data/spec_rpt51_04.pdf.
44. Klebba AJ, Dolman AB. Comparability of mortality statistics for the seventh and eighth revisions of theInternational Classification of Diseases, United States. National Center for Health Statistics. Vital Health Stat 2(66). 1975. Available from: https://www.cdc.gov/nchs/data/series/sr_02/sr02_066.pdf.
45. Klebba AJ, Scott JH. Estimates of selected comparability ratios based on dual coding of 1976 death certificates by the eighth and ninth revisions of the International Classification of Diseases. National Center for Health Statistics. 1980. Available from: https://www.cdc.gov/nchs/data/mvsr/supp/mv28_11s.pdf.
46. National Center for Health Statistics, National Vital Statistics System. Instructions for classifying the underlying cause of death. NCHS Instruction Manual; part 2a. Hyattsville, MD. Published annually. Available from: https://www.cdc.gov/nchs/nvss/instruction_manuals.htm.
47. National Center for Health Statistics, National Vital Statistics System. Instructions for classifying the multiple causes of death. NCHS Instruction Manual; part 2b. Hyattsville, MD. Published annually. Available from: https://www.cdc.gov/nchs/nvss/instruction_manuals.htm.
48. National Center for Health Statistics, National Vital Statistics System. ICD–10 ACME decision tables for classifying underlying causes of death. NCHS Instruction Manual; part 2c. Hyattsville, MD. Published annually. Available from: https://www.cdc.gov/nchs/nvss/instruction_manuals.htm.
49. National Center for Health Statistics, National Vital Statistics System. Data entry instructions for the mortality medical indexing, classification, and retrieval system (MICAR), 1996–1997. NCHS Instruction Manual; part 2g. Hyattsville, MD. Available from: https://www.cdc.gov/nchs/nvss/mmds.htm.
50. National Center for Health Statistics, National Vital Statistics System. Dictionary of valid terms for the mortality medical indexing, classification, and retrieval system (MICAR). NCHS Instruction Manual; part 2h. Hyattsville, MD. Available from: https://www.cdc.gov/nchs/nvss/mmds.htm.
51. National Center for Health Statistics, National Vital Statistics System. SuperMICAR data entry instructions. NCHS Instruction Manual; part 2s. Hyattsville, MD. Available from: https://www.cdc.gov/nchs/nvss/instruction_manuals.htm.
52. National Center for Health Statistics. Public-use data set documentation; control total Table 1: Mortality data set for ICD–10, 2018. Hyattsville, MD. 2020. Available from: https://www.cdc.gov/nchs/data/dvs/Multiple_Cause_Record_Layout_2018-508.pdf.
53. Chamblee RF, Evans MC. TRANSAX: The NCHS system for producing multiple cause-of-death statistics, 1968–78. National Center for Health Statistics. Vital Health Stat 1(20). 1986. Available from: https://www.cdc.gov/nchs/data/series/sr_01/sr01_020acc.pdf.
54. Israel RA, Rosenberg HM, Curtin LR. Analytical potential for multiple cause-of-death data. Am J Epidemiol 124(2):161–79. 1986. Available from: https://aje.oxfordjournals.org/content/124/2/161.full.pdf.
55. National Center for Health Statistics. ICD–10 cause-of-death lists for tabulating mortality statistics (Updated September 2020 to include WHO updates to ICD-10 for data year 2019). NCHS Instruction Manual, part 9. Hyattsville, MD. 2020. Available from: https://www.cdc.gov/nchs/data/dvs/Part9InstructionManual2019-508.pdf.
20 National Vital Statistics Reports, Vol. 70, No. 8, July 26, 2021
56. Hoyert DL, Arias E, Smith BL, Murphy SL, Kochanek KD. Deaths: Final data for 1999. National Vital Statistics Reports; vol 49 no 8. Hyattsville, MD: National Center for Health Statistics. 2001. Available from: https://www.cdc.gov/nchs/data/nvsr/nvsr49/nvsr49_08.pdf.
57. National Center for Health Statistics, National Vital Statistics System. Computer edits for mortality data, including separate section for fetal deaths effective 2014. NCHS Instruction Manual; part 11. Hyattsville, MD. 2014. Available from: https://www.cdc.gov/nchs/data/dvs/2014_PT11_NOV2014.pdf.
58. National Center for Health Statistics. ICD–10 cause-of-death querying, 2013. NCHS Instruction Manual; part 20. Hyattsville, MD. 2013. Available from: https://www.cdc.gov/nchs/data/dvs/Instruction_Manual_revise20_2013.pdf.
59. National Center for Health Statistics. User Guide to the 2014 Natality Public Use File. Hyattsville, MD: National Center for Health Statistics. Annual product 2015. Available at: https://www.cdc.gov/nchs/data_access/VitalStatsOnline.htm.
60. Rosenberg HM, Maurer JD, Sorlie PD, Johnson NJ, MacDorman MF, Hoyert DL, et al. Quality of death rates by race and Hispanic origin: A summary of current research, 1999. National Center for Health Statistics. Vital Health Stat 2(128). 1999. Available from: https://www.cdc.gov/nchs/data/series/sr_02/sr02_128.pdf.
61. Sorlie PD, Rogot E, Johnson NJ. Validity of demographic characteristics on the death certificate. Epidemiology 3(2):181–4. 1992.
62. Mulry M. Summary of accuracy and coverage evaluation for Census 2000. Research Report Series Statistics #2006–3. Washington, DC: U.S. Census Bureau. 2006. Available from: https://www.census.gov/srd/papers/pdf/rrs2006-03.pdf.
63. Poe GS, Powell-Griner E, McLaughlin JK, Placek PJ, Thompson GB, Robinson K. Comparability of the death certificate and the 1986 National Mortality Followback Survey. National Center for Health Statistics. Vital Health Stat 2(118). 1993. Available from: https://www.cdc.gov/nchs/data/series/sr_02/sr02_118.pdf.
64. U.S. Census Bureau. DSSD 2010 census coverage measurement memorandum series 2010–G–01. 2012. Available from: https://www2.census.gov/programs-surveys/decennial/2010/technical-documentation/methodology/g-series/g01.pdf.
65. Martin JA, Hamilton BE, Osterman MJK, Driscoll AK. Births: Final data for 2019. National Vital Statistics Report; vol 70 no 2. Hyattsville, MD: National Center for Health Statistics. 2021. Available from: https://www.cdc.gov/nchs/data/nvsr/nvsr70/nvsr70-02-508.pdf.
66. Sirken MG. Comparison of two methods of constructing abridged life tables by reference to a “standard” table. National Center for Health Statistics. Vital Health Stat 2(4). 1966. Available from: https://www.cdc.gov/nchs/data/series/ sr_02/sr02_004.pdf.
67. Anderson RN. Method for constructing complete annual U.S. life tables. National Center for Health Statistics. Vital Health Stat 2(129). 1999. Available from: https://www.cdc.gov/nchs/data/series/sr_02/sr02_129.pdf.
68. National Center for Health Statistics. U.S. decennial life tables for 1989–91. Methodology of the National and State Life Tables; vol 1 no 2. Hyattsville, MD. 1998. Available from: https://www.cdc.gov/nchs/data/lifetables/life89_1_2.pdf.
69. Wei R, Curtin LR, Arias E, Anderson RN. U.S. decennial life tables for 1999–2001, methodology of the United States life tables. National Vital Statistics Reports; vol 57 no 4. Hyattsville, MD: National Center for Health Statistics. 2008. Available from: https://www.cdc.gov/nchs/data/nvsr/nvsr57/nvsr57_04.pdf.
70. Miniño AM, Murphy SL, Xu JQ, Kochanek KD. Deaths: Final data for 2008. National Vital Statistics Reports; vol 59 no 10. Hyattsville, MD: National Center for Health Statistics. 2011. Available from: https://www.cdc.gov/nchs/data/nvsr/nvsr59/nvsr59_10.pdf.
71. Arias, E. United States life tables, 2008. National Vital Statistics Reports; vol 61 no 3. Hyattsville, MD: National Center for Health Statistics. 2012. Available from: https://www.cdc.gov/nchs/data/nvsr/nvsr61/nvsr61_03.pdf.
72. Kochanek KD, Maurer JD, Rosenberg HM. Causes of death contributing to changes in life expectancy: United States, 1984–89. National Center for Health Statistics. Vital Health Stat 20(23). 1994. Available from: https://www.cdc.gov/nchs/data/series/sr_20/sr20_023.pdf.
73. Arriaga EE. Changing trends in mortality decline during the last decades. In: Ruzicka L, Wunsch G, Kane P, editors. Differential mortality: Methodological issues and biosocial factors. Oxford, England: Clarendon Press. 1989.
74. Arriaga EE. Measuring and explaining the change in life expectancies. Demography 21(1):83–96. 1984.
75. Miniño AM, Anderson RN, Fingerhut LA, Boudreault MA, Warner M. Deaths: Injuries, 2002. National Vital Statistics Reports; vol 54 no10. Hyattsville, MD: National Center for Health Statistics. 2006. Available from: https://www.cdc.gov/nchs/data/nvsr/nvsr54/nvsr54_10.pdf.
76. U.S. Census Bureau. 2019 population estimates. Table 1. Annual estimates of the resident population for the United States, regions, states, and Puerto Rico: April 1, 2010 to July 1, 2019 (NST- EST2019-01). Available from: https://www2.census.gov/programs-surveys/popest/tables/2010-2019/state/totals/nst-est2019-01.xlsx.
77. U.S. Census Bureau. International programs. International data base. 2019. Available from: https://www.census.gov/data-tools/demo/idb.
78. National Center for Health Statistics. Bridged-race population estimates for April 1, 2000, by county, single-year of age, bridged-race, Hispanic origin, and sex (br040100.txt). Prepared under a collaborative arrangement with the U.S. Census Bureau. 2003. Available from: https://www.cdc.gov/nchs/nvss/bridged_race.htm.
79. National Center for Health Statistics. Bridged-race intercensal population estimates for July 1, 1990– July 1, 1999, by year, county, 5-year age group, bridged-race, Hispanic origin, and sex (one ASCII file each per separate year). Prepared under a collaborative agreement with the U.S. Census Bureau. 2003. Available from: https://www.cdc.gov/nchs/nvss/bridged_race.htm.
National Vital Statistics Reports, Vol. 70, No. 8, July 26, 2021 21
80. U.S. Census Bureau. Age, sex, race, and Hispanic origin information from the 1990 census: A comparison of census results with results where age and race have been modified, 1990. CPH–L–74. Washington, DC: U.S. Department of Commerce. 1991.
81. Anderson RN, Rosenberg HM. Age standardization of death rates: Implementation of the year 2000 standard. National Vital Statistics Reports; vol 47 no 3. Hyattsville, MD: National Center for Health Statistics. 1998. Available from: https://www.cdc.gov/nchs/data/nvsr/nvsr47/nvs47_03.pdf.
82. Brillinger DR. The natural variability of vital rates and associated statistics. Biometrics 42(4):693–734. 1986.
83. Fay MP, Feuer EJ. Confidence intervals for directly standardized rates: A method based on the gamma distribution. Stat Med 16(7):791–801. 1997.
84. Schenker N, Gentleman JF. On judging the significance of differences by examining the overlap between confidence intervals. Am Stat 55(3):182–6. 2001. Available from: https://www.jstor.org/stable/2685796?seq=1#page_scan_tab_contents.
85. Arnold SF. Mathematical statistics. Englewood Cliffs, NJ: Prentice Hall. 1990.
List of Detailed Tables1. Number of deaths, death rates, and age-adjusted death
rates, by race and Hispanic origin and sex: United States, 2010–2019 . . . . . . . . . . . . . . . . . . . . . . . . . . . . . . . . . . . . . . 23
2. Number of deaths and death rates by age, and age-adjusted death rates, by race and Hispanic origin and sex: United States, 2019 . . . . . . . . . . . . . . . . . . . . . . . . . . . . . . . 25
3. Life expectancy at selected ages, by race and Hispanic origin and sex: United States, 2019 . . . . . . . . . . . . . . . . . . . . . . . . 29
4. Life expectancy at birth, by race and Hispanic origin and sex: United States, 2010–2019 . . . . . . . . . . . . . . . . . . . . . . . . . . 30
5. Death rates by age, and age-adjusted death rates, for the 10 leading causes of death in 2019, dementia-related causes, drug-induced causes, alcohol-induced causes, and injury by firearms: United States, 1999–2019 . . . . . . . . . . . . . . . . . . . 31
6. Number of deaths from selected causes, by age: United States, 2019 . . . . . . . . . . . . . . . . . . . . . . . . . . . . . . . 39
7. Death rates for selected causes, by age: United States, 2019 . . . . . . . . . . . . . . . . . . . . . . . . . . . . . . . 42
8. Number of deaths from selected causes, by race and Hispanic origin and sex: United States, 2019 . . . . . . . . . . . . 45
9. Death rates for selected causes, by race and Hispanic origin and sex: United States, 2019 . . . . . . . . . . . . . . . . . . . . . . . . 50
10. Age-adjusted death rates for selected causes, by race and Hispanic origin and sex: United States, 2019 . . . . . . . . . . . . 55
11. Number of deaths, death rates, and age-adjusted death rates for injury deaths, by mechanism and intent of death for all injury death and the leading causes of injury death: United States, 2019 . . . . . . . . . . . . . . . . . . . . . . . . . . . . . . . 60
12. Number of deaths, death rates, and age-adjusted death rates for major causes of death: United States, each state, Puerto Rico, U.S. Virgin Islands, Guam, American Samoa, and Northern Marianas, 2019 . . . . . . . . . . . . . . . . . . . . . . . . . . . 61
13. Infant, neonatal, and postneonatal mortality rates, by race and Hispanic origin and sex: United States, 2010–2019 . . . . 64
14. Number of infant deaths and infant mortality rates for selected causes, by race and Hispanic origin: United States, 2019 . . . . . . . . . . . . . . . . . . . . . . . . . . . . . . . 66
15. Number of infant deaths and mortality rates, by race and Hispanic origin for the United States, each state, Puerto Rico, U.S. Virgin Islands, Guam, American Samoa, and Northern Marianas, and by sex for the United States, 2019 . . . . . . . . . . . . . . . . . . . . . . . . . . . . . . . 68
16. Number of maternal deaths and maternal mortality rates for selected causes, by race and Hispanic origin: United States, 2019 . . . . . . . . . . . . . . . . . . . . . . . . . . . . . . . 70
List of Internet Tables(Available from https://www.cdc.gov/nchs/data/nvsr/nvsr70/nvsr70-08-tables-508.pdf)
I–1. Number of deaths, death rates, and age-adjusted death rates for dementia-related causes, by race and Hispanic origin and sex: United States, 2010–2019
I–2. Number of deaths, death rates, and age-adjusted death rates for drug-induced causes, by race and Hispanic origin and sex: United States, 2010–2019
I–3. Number of deaths, death rates, and age-adjusted death rates for alcohol-induced causes, by race and Hispanic origin and sex: United States, 2010–2019
I–4. Number of deaths, death rates, and age-adjusted death rates for injury by firearms, by race and Hispanic origin and sex: United States, 2010–2019
I–5. Number of deaths and death rates by age, and age-adjusted death rates, by specified Hispanic origin and sex: United States, 2019
I–6. Number of deaths, death rates, and age-adjusted death rates for ages 15 and over, by marital status and sex: United States, 2019
I–7. Number of deaths, death rates, and age-adjusted death rates for ages 25–64, by educational attainment and sex: United States, 2019
I–8. Number of deaths, death rates, and age-adjusted death rates for injury at work for ages 15 and over, by race and Hispanic origin and sex: United States, 2019
I–9. Number of deaths, death rates, and age-adjusted death rates for injury at work, by race and Hispanic origin and sex: United States, 2010–2019
I–10. Number of deaths and death rates, by age, race and Hispanic origin, and sex: United States, 2019
I–11. Number of deaths from 113 selected causes, Enterocolitis due to Clostridium difficile, drug-induced causes, alcohol-induced causes, and firearm-related injuries, by race and Hispanic origin and sex: United States, 2019
I–12. Death rates for 113 selected causes, Enterocolitis due to Clostridium difficile, drug-induced causes, alcohol-induced causes, and firearm-related injuries, by race and Hispanic origin and sex: United States, 2019
I–13. Age-adjusted death rates for 113 selected causes, Enterocolitis due to Clostridium difficile, drug-induced causes, alcohol-induced causes, and firearm-related injuries, by race and Hispanic origin and sex: United States, 2019
I–14. Number of deaths, death rates, and age-adjusted death rates for injury deaths, by mechanism and intent of death: United States, 2019
22 National Vital Statistics Reports, Vol. 70, No. 8, July 26, 2021
I–15. Number of deaths, death rates, and age-adjusted death rates for major causes of death: United States, each state, Puerto Rico, U.S. Virgin Islands, Guam, American Samoa, and Northern Marianas, 2019
I–16. Number of infant deaths and infant mortality rates for 130 selected causes, by race and Hispanic origin: United States, 2019
I–17. Estimated population and standard errors for specified Hispanic-origin populations, by 10-year age group and sex: United States, 2019
I–18. Estimated population and standard errors for ages 15 and over by marital status, 10-year age group, and sex: United States, 2019
I–19. Estimated population and standard errors for ages 25–64, by educational attainment and sex: United States, 2019
I–20 Number of deaths, death rates, and age-adjusted death rates, by race and Hispanic origin and sex: United States, 1940, 1950, 1960, 1970, 1980, 1990, 2000, and 2010–2019
I–21. Life expectancy at birth, by race and Hispanic origin and sex: United States, 1940, 1950, 1960, 1970, 1980, 1990, and 2000–2019
I–22. Infant, neonatal, and postneonatal mortality rates, by race and Hispanic origin and sex: United States, 1940, 1950, 1960, 1970, 1980, 1990, 2000–2019
I–23. Number of deaths, death rates, and age-adjusted death rates for dementia-related causes, by race and Hispanic origin and sex: United States, 1999–2019
I–24. Number of deaths, death rates, and age-adjusted death rates for drug-induced causes, by race and Hispanic origin and sex: United States, 1999–2019
I–25. Number of deaths, death rates, and age-adjusted death rates for alcohol-induced causes, by race and Hispanic origin and sex: United States, 1999–2019
I–26. Number of deaths, death rates, and age-adjusted death rates for injury by firearms, by race and Hispanic origin and sex: United States, 1999–2019
I–27. Number of deaths, death rates, and age-adjusted death rates for injury at work, by race and Hispanic origin and sex: United States, 1997–2019
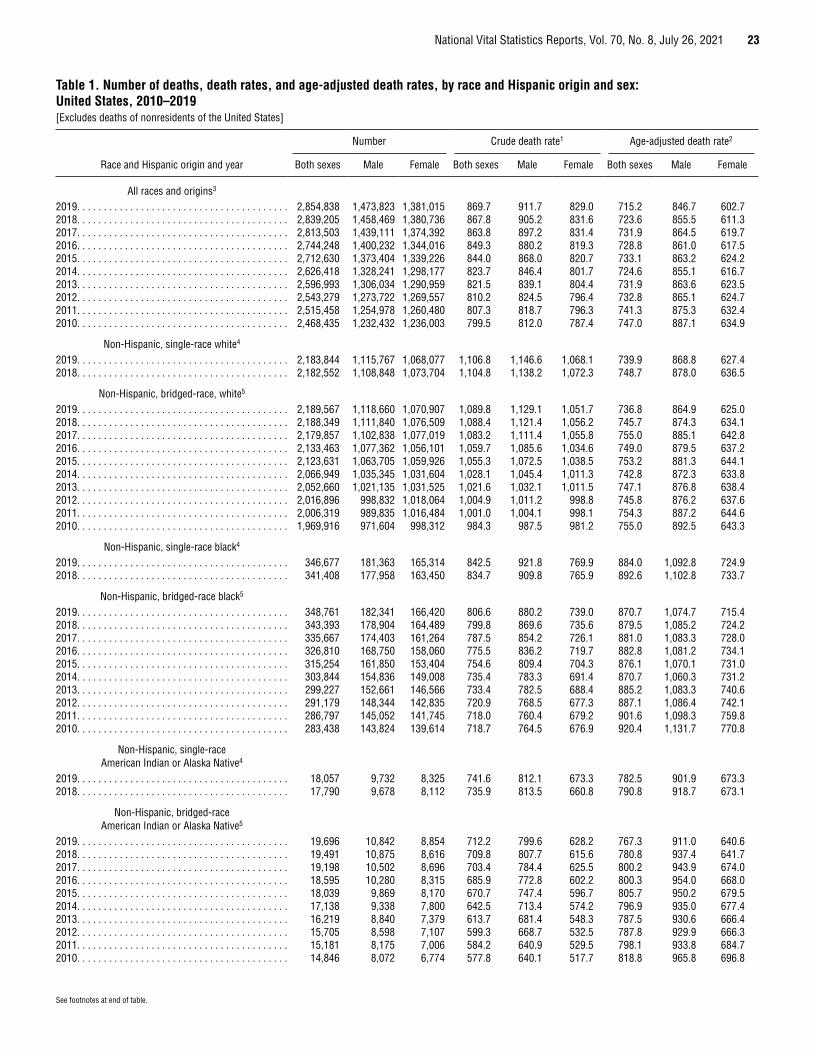
National Vital Statistics Reports, Vol. 70, No. 8, July 26, 2021 23
See footnotes at end of table.
Table 1. Number of deaths, death rates, and age-adjusted death rates, by race and Hispanic origin and sex: United States, 2010–2019[Excludes deaths of nonresidents of the United States]
Race and Hispanic origin and year
Number Crude death rate1 Age-adjusted death rate2
Both sexes Male Female Both sexes Male Female Both sexes Male Female
All races and origins3
2019. . . . . . . . . . . . . . . . . . . . . . . . . . . . . . . . . . . . . . . . 2,854,838 1,473,823 1,381,015 869.7 911.7 829.0 715.2 846.7 602.72018. . . . . . . . . . . . . . . . . . . . . . . . . . . . . . . . . . . . . . . . 2,839,205 1,458,469 1,380,736 867.8 905.2 831.6 723.6 855.5 611.32017. . . . . . . . . . . . . . . . . . . . . . . . . . . . . . . . . . . . . . . . 2,813,503 1,439,111 1,374,392 863.8 897.2 831.4 731.9 864.5 619.72016. . . . . . . . . . . . . . . . . . . . . . . . . . . . . . . . . . . . . . . . 2,744,248 1,400,232 1,344,016 849.3 880.2 819.3 728.8 861.0 617.52015. . . . . . . . . . . . . . . . . . . . . . . . . . . . . . . . . . . . . . . . 2,712,630 1,373,404 1,339,226 844.0 868.0 820.7 733.1 863.2 624.22014. . . . . . . . . . . . . . . . . . . . . . . . . . . . . . . . . . . . . . . . 2,626,418 1,328,241 1,298,177 823.7 846.4 801.7 724.6 855.1 616.72013. . . . . . . . . . . . . . . . . . . . . . . . . . . . . . . . . . . . . . . . 2,596,993 1,306,034 1,290,959 821.5 839.1 804.4 731.9 863.6 623.52012. . . . . . . . . . . . . . . . . . . . . . . . . . . . . . . . . . . . . . . . 2,543,279 1,273,722 1,269,557 810.2 824.5 796.4 732.8 865.1 624.72011. . . . . . . . . . . . . . . . . . . . . . . . . . . . . . . . . . . . . . . . 2,515,458 1,254,978 1,260,480 807.3 818.7 796.3 741.3 875.3 632.42010. . . . . . . . . . . . . . . . . . . . . . . . . . . . . . . . . . . . . . . . 2,468,435 1,232,432 1,236,003 799.5 812.0 787.4 747.0 887.1 634.9
Non-Hispanic, single-race white4
2019. . . . . . . . . . . . . . . . . . . . . . . . . . . . . . . . . . . . . . . . 2,183,844 1,115,767 1,068,077 1,106.8 1,146.6 1,068.1 739.9 868.8 627.42018. . . . . . . . . . . . . . . . . . . . . . . . . . . . . . . . . . . . . . . . 2,182,552 1,108,848 1,073,704 1,104.8 1,138.2 1,072.3 748.7 878.0 636.5
Non-Hispanic, bridged-race, white5
2019. . . . . . . . . . . . . . . . . . . . . . . . . . . . . . . . . . . . . . . . 2,189,567 1,118,660 1,070,907 1,089.8 1,129.1 1,051.7 736.8 864.9 625.02018. . . . . . . . . . . . . . . . . . . . . . . . . . . . . . . . . . . . . . . . 2,188,349 1,111,840 1,076,509 1,088.4 1,121.4 1,056.2 745.7 874.3 634.12017. . . . . . . . . . . . . . . . . . . . . . . . . . . . . . . . . . . . . . . . 2,179,857 1,102,838 1,077,019 1,083.2 1,111.4 1,055.8 755.0 885.1 642.82016. . . . . . . . . . . . . . . . . . . . . . . . . . . . . . . . . . . . . . . . 2,133,463 1,077,362 1,056,101 1,059.7 1,085.6 1,034.6 749.0 879.5 637.22015. . . . . . . . . . . . . . . . . . . . . . . . . . . . . . . . . . . . . . . . 2,123,631 1,063,705 1,059,926 1,055.3 1,072.5 1,038.5 753.2 881.3 644.12014. . . . . . . . . . . . . . . . . . . . . . . . . . . . . . . . . . . . . . . . 2,066,949 1,035,345 1,031,604 1,028.1 1,045.4 1,011.3 742.8 872.3 633.82013. . . . . . . . . . . . . . . . . . . . . . . . . . . . . . . . . . . . . . . . 2,052,660 1,021,135 1,031,525 1,021.6 1,032.1 1,011.5 747.1 876.8 638.42012. . . . . . . . . . . . . . . . . . . . . . . . . . . . . . . . . . . . . . . . 2,016,896 998,832 1,018,064 1,004.9 1,011.2 998.8 745.8 876.2 637.62011. . . . . . . . . . . . . . . . . . . . . . . . . . . . . . . . . . . . . . . . 2,006,319 989,835 1,016,484 1,001.0 1,004.1 998.1 754.3 887.2 644.62010. . . . . . . . . . . . . . . . . . . . . . . . . . . . . . . . . . . . . . . . 1,969,916 971,604 998,312 984.3 987.5 981.2 755.0 892.5 643.3
Non-Hispanic, single-race black4
2019. . . . . . . . . . . . . . . . . . . . . . . . . . . . . . . . . . . . . . . . 346,677 181,363 165,314 842.5 921.8 769.9 884.0 1,092.8 724.92018. . . . . . . . . . . . . . . . . . . . . . . . . . . . . . . . . . . . . . . . 341,408 177,958 163,450 834.7 909.8 765.9 892.6 1,102.8 733.7
Non-Hispanic, bridged-race black5
2019. . . . . . . . . . . . . . . . . . . . . . . . . . . . . . . . . . . . . . . . 348,761 182,341 166,420 806.6 880.2 739.0 870.7 1,074.7 715.42018. . . . . . . . . . . . . . . . . . . . . . . . . . . . . . . . . . . . . . . . 343,393 178,904 164,489 799.8 869.6 735.6 879.5 1,085.2 724.22017. . . . . . . . . . . . . . . . . . . . . . . . . . . . . . . . . . . . . . . . 335,667 174,403 161,264 787.5 854.2 726.1 881.0 1,083.3 728.02016. . . . . . . . . . . . . . . . . . . . . . . . . . . . . . . . . . . . . . . . 326,810 168,750 158,060 775.5 836.2 719.7 882.8 1,081.2 734.12015. . . . . . . . . . . . . . . . . . . . . . . . . . . . . . . . . . . . . . . . 315,254 161,850 153,404 754.6 809.4 704.3 876.1 1,070.1 731.02014. . . . . . . . . . . . . . . . . . . . . . . . . . . . . . . . . . . . . . . . 303,844 154,836 149,008 735.4 783.3 691.4 870.7 1,060.3 731.22013. . . . . . . . . . . . . . . . . . . . . . . . . . . . . . . . . . . . . . . . 299,227 152,661 146,566 733.4 782.5 688.4 885.2 1,083.3 740.62012. . . . . . . . . . . . . . . . . . . . . . . . . . . . . . . . . . . . . . . . 291,179 148,344 142,835 720.9 768.5 677.3 887.1 1,086.4 742.12011. . . . . . . . . . . . . . . . . . . . . . . . . . . . . . . . . . . . . . . . 286,797 145,052 141,745 718.0 760.4 679.2 901.6 1,098.3 759.82010. . . . . . . . . . . . . . . . . . . . . . . . . . . . . . . . . . . . . . . . 283,438 143,824 139,614 718.7 764.5 676.9 920.4 1,131.7 770.8
Non-Hispanic, single-race American Indian or Alaska Native4
2019. . . . . . . . . . . . . . . . . . . . . . . . . . . . . . . . . . . . . . . . 18,057 9,732 8,325 741.6 812.1 673.3 782.5 901.9 673.32018. . . . . . . . . . . . . . . . . . . . . . . . . . . . . . . . . . . . . . . . 17,790 9,678 8,112 735.9 813.5 660.8 790.8 918.7 673.1
Non-Hispanic, bridged-race American Indian or Alaska Native5
2019. . . . . . . . . . . . . . . . . . . . . . . . . . . . . . . . . . . . . . . . 19,696 10,842 8,854 712.2 799.6 628.2 767.3 911.0 640.62018. . . . . . . . . . . . . . . . . . . . . . . . . . . . . . . . . . . . . . . . 19,491 10,875 8,616 709.8 807.7 615.6 780.8 937.4 641.72017. . . . . . . . . . . . . . . . . . . . . . . . . . . . . . . . . . . . . . . . 19,198 10,502 8,696 703.4 784.4 625.5 800.2 943.9 674.02016. . . . . . . . . . . . . . . . . . . . . . . . . . . . . . . . . . . . . . . . 18,595 10,280 8,315 685.9 772.8 602.2 800.3 954.0 668.02015. . . . . . . . . . . . . . . . . . . . . . . . . . . . . . . . . . . . . . . . 18,039 9,869 8,170 670.7 747.4 596.7 805.7 950.2 679.52014. . . . . . . . . . . . . . . . . . . . . . . . . . . . . . . . . . . . . . . . 17,138 9,338 7,800 642.5 713.4 574.2 796.9 935.0 677.42013. . . . . . . . . . . . . . . . . . . . . . . . . . . . . . . . . . . . . . . . 16,219 8,840 7,379 613.7 681.4 548.3 787.5 930.6 666.42012. . . . . . . . . . . . . . . . . . . . . . . . . . . . . . . . . . . . . . . . 15,705 8,598 7,107 599.3 668.7 532.5 787.8 929.9 666.32011. . . . . . . . . . . . . . . . . . . . . . . . . . . . . . . . . . . . . . . . 15,181 8,175 7,006 584.2 640.9 529.5 798.1 933.8 684.72010. . . . . . . . . . . . . . . . . . . . . . . . . . . . . . . . . . . . . . . . 14,846 8,072 6,774 577.8 640.1 517.7 818.8 965.8 696.8
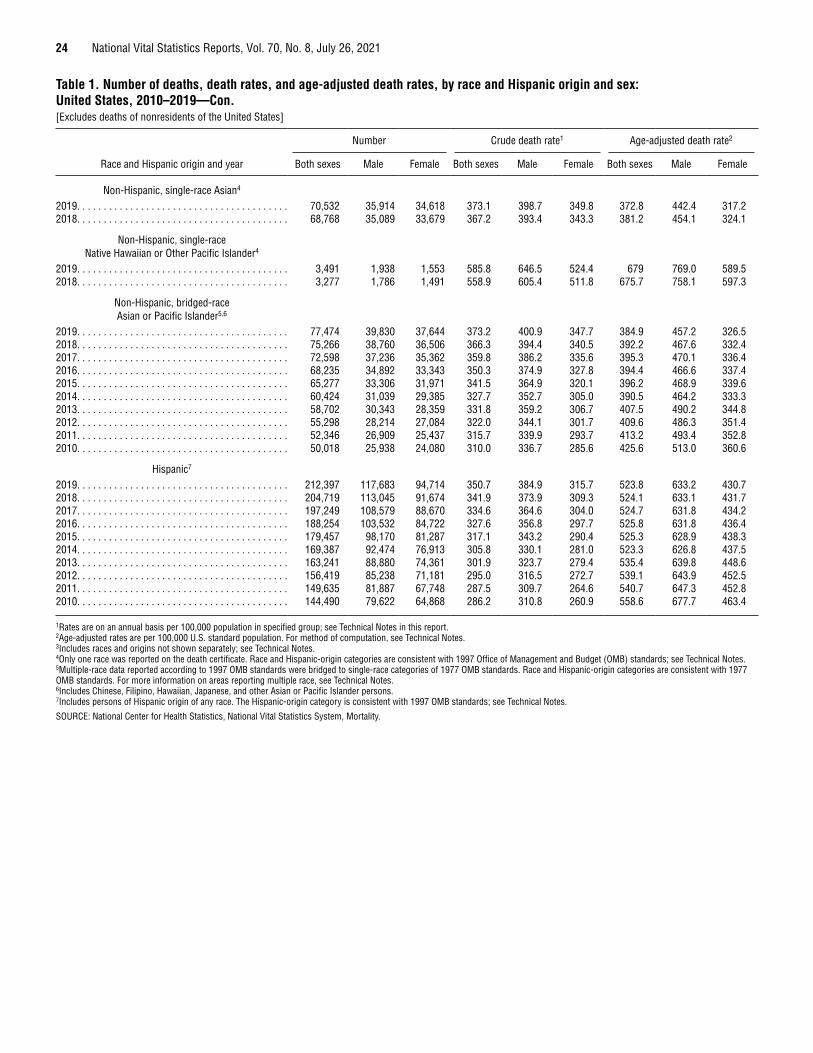
24 National Vital Statistics Reports, Vol. 70, No. 8, July 26, 2021
Table 1. Number of deaths, death rates, and age-adjusted death rates, by race and Hispanic origin and sex: United States, 2010–2019—Con.[Excludes deaths of nonresidents of the United States]
Race and Hispanic origin and year
Number Crude death rate1 Age-adjusted death rate2
Both sexes Male Female Both sexes Male Female Both sexes Male Female
Non-Hispanic, single-race Asian4
2019. . . . . . . . . . . . . . . . . . . . . . . . . . . . . . . . . . . . . . . . 70,532 35,914 34,618 373.1 398.7 349.8 372.8 442.4 317.22018. . . . . . . . . . . . . . . . . . . . . . . . . . . . . . . . . . . . . . . . 68,768 35,089 33,679 367.2 393.4 343.3 381.2 454.1 324.1
Non-Hispanic, single-race Native Hawaiian or Other Pacific Islander4
2019. . . . . . . . . . . . . . . . . . . . . . . . . . . . . . . . . . . . . . . . 3,491 1,938 1,553 585.8 646.5 524.4 679 769.0 589.52018. . . . . . . . . . . . . . . . . . . . . . . . . . . . . . . . . . . . . . . . 3,277 1,786 1,491 558.9 605.4 511.8 675.7 758.1 597.3
Non-Hispanic, bridged-race Asian or Pacific Islander5,6
2019. . . . . . . . . . . . . . . . . . . . . . . . . . . . . . . . . . . . . . . . 77,474 39,830 37,644 373.2 400.9 347.7 384.9 457.2 326.52018. . . . . . . . . . . . . . . . . . . . . . . . . . . . . . . . . . . . . . . . 75,266 38,760 36,506 366.3 394.4 340.5 392.2 467.6 332.42017. . . . . . . . . . . . . . . . . . . . . . . . . . . . . . . . . . . . . . . . 72,598 37,236 35,362 359.8 386.2 335.6 395.3 470.1 336.42016. . . . . . . . . . . . . . . . . . . . . . . . . . . . . . . . . . . . . . . . 68,235 34,892 33,343 350.3 374.9 327.8 394.4 466.6 337.42015. . . . . . . . . . . . . . . . . . . . . . . . . . . . . . . . . . . . . . . . 65,277 33,306 31,971 341.5 364.9 320.1 396.2 468.9 339.62014. . . . . . . . . . . . . . . . . . . . . . . . . . . . . . . . . . . . . . . . 60,424 31,039 29,385 327.7 352.7 305.0 390.5 464.2 333.32013. . . . . . . . . . . . . . . . . . . . . . . . . . . . . . . . . . . . . . . . 58,702 30,343 28,359 331.8 359.2 306.7 407.5 490.2 344.82012. . . . . . . . . . . . . . . . . . . . . . . . . . . . . . . . . . . . . . . . 55,298 28,214 27,084 322.0 344.1 301.7 409.6 486.3 351.42011. . . . . . . . . . . . . . . . . . . . . . . . . . . . . . . . . . . . . . . . 52,346 26,909 25,437 315.7 339.9 293.7 413.2 493.4 352.82010. . . . . . . . . . . . . . . . . . . . . . . . . . . . . . . . . . . . . . . . 50,018 25,938 24,080 310.0 336.7 285.6 425.6 513.0 360.6
Hispanic7
2019. . . . . . . . . . . . . . . . . . . . . . . . . . . . . . . . . . . . . . . . 212,397 117,683 94,714 350.7 384.9 315.7 523.8 633.2 430.72018. . . . . . . . . . . . . . . . . . . . . . . . . . . . . . . . . . . . . . . . 204,719 113,045 91,674 341.9 373.9 309.3 524.1 633.1 431.72017. . . . . . . . . . . . . . . . . . . . . . . . . . . . . . . . . . . . . . . . 197,249 108,579 88,670 334.6 364.6 304.0 524.7 631.8 434.22016. . . . . . . . . . . . . . . . . . . . . . . . . . . . . . . . . . . . . . . . 188,254 103,532 84,722 327.6 356.8 297.7 525.8 631.8 436.42015. . . . . . . . . . . . . . . . . . . . . . . . . . . . . . . . . . . . . . . . 179,457 98,170 81,287 317.1 343.2 290.4 525.3 628.9 438.32014. . . . . . . . . . . . . . . . . . . . . . . . . . . . . . . . . . . . . . . . 169,387 92,474 76,913 305.8 330.1 281.0 523.3 626.8 437.52013. . . . . . . . . . . . . . . . . . . . . . . . . . . . . . . . . . . . . . . . 163,241 88,880 74,361 301.9 323.7 279.4 535.4 639.8 448.62012. . . . . . . . . . . . . . . . . . . . . . . . . . . . . . . . . . . . . . . . 156,419 85,238 71,181 295.0 316.5 272.7 539.1 643.9 452.52011. . . . . . . . . . . . . . . . . . . . . . . . . . . . . . . . . . . . . . . . 149,635 81,887 67,748 287.5 309.7 264.6 540.7 647.3 452.82010. . . . . . . . . . . . . . . . . . . . . . . . . . . . . . . . . . . . . . . . 144,490 79,622 64,868 286.2 310.8 260.9 558.6 677.7 463.4
1Rates are on an annual basis per 100,000 population in specified group; see Technical Notes in this report. 2Age-adjusted rates are per 100,000 U.S. standard population. For method of computation, see Technical Notes. 3Includes races and origins not shown separately; see Technical Notes. 4Only one race was reported on the death certificate. Race and Hispanic-origin categories are consistent with 1997 Office of Management and Budget (OMB) standards; see Technical Notes. 5Multiple-race data reported according to 1997 OMB standards were bridged to single-race categories of 1977 OMB standards. Race and Hispanic-origin categories are consistent with 1977 OMB standards. For more information on areas reporting multiple race, see Technical Notes.6Includes Chinese, Filipino, Hawaiian, Japanese, and other Asian or Pacific Islander persons. 7Includes persons of Hispanic origin of any race. The Hispanic-origin category is consistent with 1997 OMB standards; see Technical Notes.
SOURCE: National Center for Health Statistics, National Vital Statistics System, Mortality.
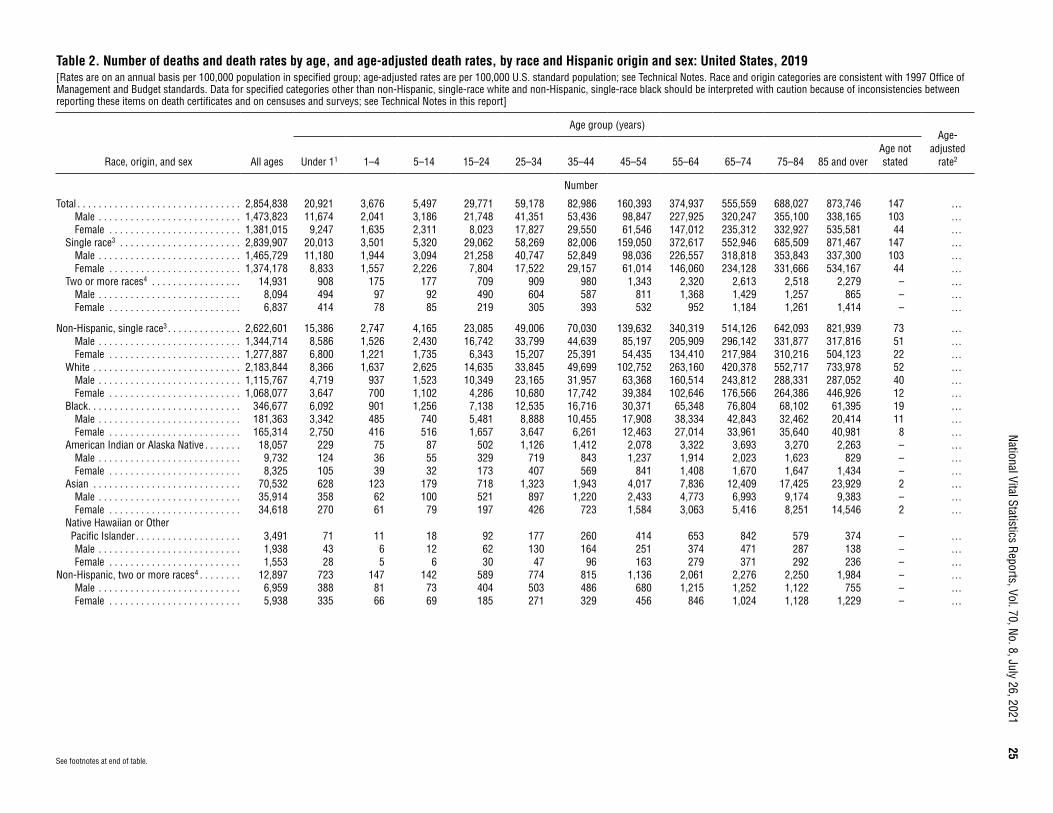
National Vital Statistics Reports, Vol. 70, No. 8, July 26, 2021
25
Table 2. Number of deaths and death rates by age, and age-adjusted death rates, by race and Hispanic origin and sex: United States, 2019[Rates are on an annual basis per 100,000 population in specified group; age-adjusted rates are per 100,000 U.S. standard population; see Technical Notes. Race and origin categories are consistent with 1997 Office of Management and Budget standards. Data for specified categories other than non-Hispanic, single-race white and non-Hispanic, single-race black should be interpreted with caution because of inconsistencies between reporting these items on death certificates and on censuses and surveys; see Technical Notes in this report]
Race, origin, and sex All ages
Age group (years)Age-
adjusted rate2Under 11 1–4 5–14 15–24 25–34 35–44 45–54 55–64 65–74 75–84 85 and over
Age not stated
Number
Total . . . . . . . . . . . . . . . . . . . . . . . . . . . . . . . 2,854,838 20,921 3,676 5,497 29,771 59,178 82,986 160,393 374,937 555,559 688,027 873,746 147 …Male . . . . . . . . . . . . . . . . . . . . . . . . . . . 1,473,823 11,674 2,041 3,186 21,748 41,351 53,436 98,847 227,925 320,247 355,100 338,165 103 …Female . . . . . . . . . . . . . . . . . . . . . . . . . 1,381,015 9,247 1,635 2,311 8,023 17,827 29,550 61,546 147,012 235,312 332,927 535,581 44 …
Single race3 . . . . . . . . . . . . . . . . . . . . . . . 2,839,907 20,013 3,501 5,320 29,062 58,269 82,006 159,050 372,617 552,946 685,509 871,467 147 …Male . . . . . . . . . . . . . . . . . . . . . . . . . . . 1,465,729 11,180 1,944 3,094 21,258 40,747 52,849 98,036 226,557 318,818 353,843 337,300 103 …Female . . . . . . . . . . . . . . . . . . . . . . . . . 1,374,178 8,833 1,557 2,226 7,804 17,522 29,157 61,014 146,060 234,128 331,666 534,167 44 …
Two or more races4 . . . . . . . . . . . . . . . . . 14,931 908 175 177 709 909 980 1,343 2,320 2,613 2,518 2,279 – …Male . . . . . . . . . . . . . . . . . . . . . . . . . . . 8,094 494 97 92 490 604 587 811 1,368 1,429 1,257 865 – …Female . . . . . . . . . . . . . . . . . . . . . . . . . 6,837 414 78 85 219 305 393 532 952 1,184 1,261 1,414 – …
Non-Hispanic, single race3 . . . . . . . . . . . . . . 2,622,601 15,386 2,747 4,165 23,085 49,006 70,030 139,632 340,319 514,126 642,093 821,939 73 …Male . . . . . . . . . . . . . . . . . . . . . . . . . . . 1,344,714 8,586 1,526 2,430 16,742 33,799 44,639 85,197 205,909 296,142 331,877 317,816 51 …Female . . . . . . . . . . . . . . . . . . . . . . . . . 1,277,887 6,800 1,221 1,735 6,343 15,207 25,391 54,435 134,410 217,984 310,216 504,123 22 …
White . . . . . . . . . . . . . . . . . . . . . . . . . . . . 2,183,844 8,366 1,637 2,625 14,635 33,845 49,699 102,752 263,160 420,378 552,717 733,978 52 …Male . . . . . . . . . . . . . . . . . . . . . . . . . . . 1,115,767 4,719 937 1,523 10,349 23,165 31,957 63,368 160,514 243,812 288,331 287,052 40 …Female . . . . . . . . . . . . . . . . . . . . . . . . . 1,068,077 3,647 700 1,102 4,286 10,680 17,742 39,384 102,646 176,566 264,386 446,926 12 …
Black . . . . . . . . . . . . . . . . . . . . . . . . . . . . . 346,677 6,092 901 1,256 7,138 12,535 16,716 30,371 65,348 76,804 68,102 61,395 19 …Male . . . . . . . . . . . . . . . . . . . . . . . . . . . 181,363 3,342 485 740 5,481 8,888 10,455 17,908 38,334 42,843 32,462 20,414 11 …Female . . . . . . . . . . . . . . . . . . . . . . . . . 165,314 2,750 416 516 1,657 3,647 6,261 12,463 27,014 33,961 35,640 40,981 8 …
American Indian or Alaska Native . . . . . . . 18,057 229 75 87 502 1,126 1,412 2,078 3,322 3,693 3,270 2,263 – …Male . . . . . . . . . . . . . . . . . . . . . . . . . . . 9,732 124 36 55 329 719 843 1,237 1,914 2,023 1,623 829 – …Female . . . . . . . . . . . . . . . . . . . . . . . . . 8,325 105 39 32 173 407 569 841 1,408 1,670 1,647 1,434 – …
Asian . . . . . . . . . . . . . . . . . . . . . . . . . . . . 70,532 628 123 179 718 1,323 1,943 4,017 7,836 12,409 17,425 23,929 2 …Male . . . . . . . . . . . . . . . . . . . . . . . . . . . 35,914 358 62 100 521 897 1,220 2,433 4,773 6,993 9,174 9,383 – …Female . . . . . . . . . . . . . . . . . . . . . . . . . 34,618 270 61 79 197 426 723 1,584 3,063 5,416 8,251 14,546 2 …
Native Hawaiian or Other Pacific Islander . . . . . . . . . . . . . . . . . . . . 3,491 71 11 18 92 177 260 414 653 842 579 374 – …Male . . . . . . . . . . . . . . . . . . . . . . . . . . . 1,938 43 6 12 62 130 164 251 374 471 287 138 – …Female . . . . . . . . . . . . . . . . . . . . . . . . . 1,553 28 5 6 30 47 96 163 279 371 292 236 – …
Non-Hispanic, two or more races4 . . . . . . . . 12,897 723 147 142 589 774 815 1,136 2,061 2,276 2,250 1,984 – …Male . . . . . . . . . . . . . . . . . . . . . . . . . . . 6,959 388 81 73 404 503 486 680 1,215 1,252 1,122 755 – …Female . . . . . . . . . . . . . . . . . . . . . . . . . 5,938 335 66 69 185 271 329 456 846 1,024 1,128 1,229 – …
See footnotes at end of table.
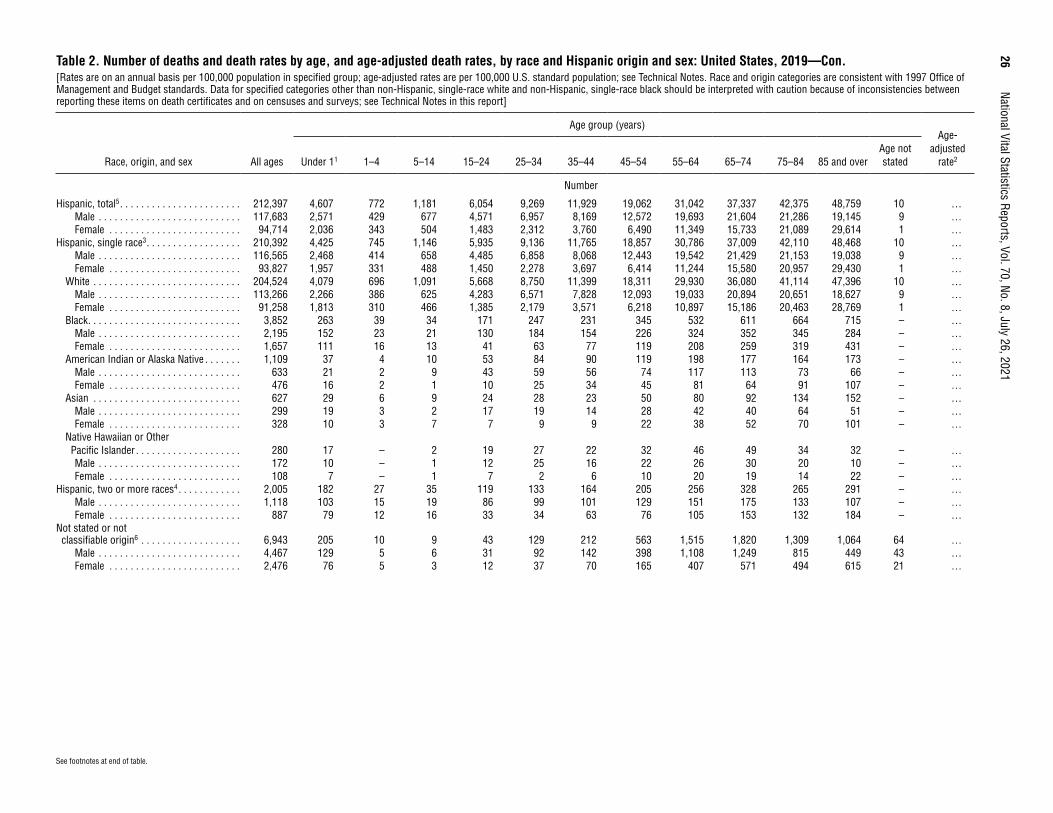
26
National Vital Statistics Reports, Vol. 70, No. 8, July 26, 2021Table 2. Number of deaths and death rates by age, and age-adjusted death rates, by race and Hispanic origin and sex: United States, 2019—Con.[Rates are on an annual basis per 100,000 population in specified group; age-adjusted rates are per 100,000 U.S. standard population; see Technical Notes. Race and origin categories are consistent with 1997 Office of Management and Budget standards. Data for specified categories other than non-Hispanic, single-race white and non-Hispanic, single-race black should be interpreted with caution because of inconsistencies between reporting these items on death certificates and on censuses and surveys; see Technical Notes in this report]
Race, origin, and sex All ages
Age group (years)Age-
adjusted rate2Under 11 1–4 5–14 15–24 25–34 35–44 45–54 55–64 65–74 75–84 85 and over
Age not stated
Number
Hispanic, total5 . . . . . . . . . . . . . . . . . . . . . . . 212,397 4,607 772 1,181 6,054 9,269 11,929 19,062 31,042 37,337 42,375 48,759 10 …Male . . . . . . . . . . . . . . . . . . . . . . . . . . . 117,683 2,571 429 677 4,571 6,957 8,169 12,572 19,693 21,604 21,286 19,145 9 …Female . . . . . . . . . . . . . . . . . . . . . . . . . 94,714 2,036 343 504 1,483 2,312 3,760 6,490 11,349 15,733 21,089 29,614 1 …
Hispanic, single race3 . . . . . . . . . . . . . . . . . . 210,392 4,425 745 1,146 5,935 9,136 11,765 18,857 30,786 37,009 42,110 48,468 10 …Male . . . . . . . . . . . . . . . . . . . . . . . . . . . 116,565 2,468 414 658 4,485 6,858 8,068 12,443 19,542 21,429 21,153 19,038 9 …Female . . . . . . . . . . . . . . . . . . . . . . . . . 93,827 1,957 331 488 1,450 2,278 3,697 6,414 11,244 15,580 20,957 29,430 1 …
White . . . . . . . . . . . . . . . . . . . . . . . . . . . . 204,524 4,079 696 1,091 5,668 8,750 11,399 18,311 29,930 36,080 41,114 47,396 10 …Male . . . . . . . . . . . . . . . . . . . . . . . . . . . 113,266 2,266 386 625 4,283 6,571 7,828 12,093 19,033 20,894 20,651 18,627 9 …Female . . . . . . . . . . . . . . . . . . . . . . . . . 91,258 1,813 310 466 1,385 2,179 3,571 6,218 10,897 15,186 20,463 28,769 1 …
Black . . . . . . . . . . . . . . . . . . . . . . . . . . . . . 3,852 263 39 34 171 247 231 345 532 611 664 715 – …Male . . . . . . . . . . . . . . . . . . . . . . . . . . . 2,195 152 23 21 130 184 154 226 324 352 345 284 – …Female . . . . . . . . . . . . . . . . . . . . . . . . . 1,657 111 16 13 41 63 77 119 208 259 319 431 – …
American Indian or Alaska Native . . . . . . . 1,109 37 4 10 53 84 90 119 198 177 164 173 – …Male . . . . . . . . . . . . . . . . . . . . . . . . . . . 633 21 2 9 43 59 56 74 117 113 73 66 – …Female . . . . . . . . . . . . . . . . . . . . . . . . . 476 16 2 1 10 25 34 45 81 64 91 107 – …
Asian . . . . . . . . . . . . . . . . . . . . . . . . . . . . 627 29 6 9 24 28 23 50 80 92 134 152 – …Male . . . . . . . . . . . . . . . . . . . . . . . . . . . 299 19 3 2 17 19 14 28 42 40 64 51 – …Female . . . . . . . . . . . . . . . . . . . . . . . . . 328 10 3 7 7 9 9 22 38 52 70 101 – …
Native Hawaiian or Other Pacific Islander . . . . . . . . . . . . . . . . . . . . 280 17 – 2 19 27 22 32 46 49 34 32 – …Male . . . . . . . . . . . . . . . . . . . . . . . . . . . 172 10 – 1 12 25 16 22 26 30 20 10 – …Female . . . . . . . . . . . . . . . . . . . . . . . . . 108 7 – 1 7 2 6 10 20 19 14 22 – …
Hispanic, two or more races4 . . . . . . . . . . . . 2,005 182 27 35 119 133 164 205 256 328 265 291 – …Male . . . . . . . . . . . . . . . . . . . . . . . . . . . 1,118 103 15 19 86 99 101 129 151 175 133 107 – …Female . . . . . . . . . . . . . . . . . . . . . . . . . 887 79 12 16 33 34 63 76 105 153 132 184 – …
Not stated or not classifiable origin6 . . . . . . . . . . . . . . . . . . . 6,943 205 10 9 43 129 212 563 1,515 1,820 1,309 1,064 64 …
Male . . . . . . . . . . . . . . . . . . . . . . . . . . . 4,467 129 5 6 31 92 142 398 1,108 1,249 815 449 43 …Female . . . . . . . . . . . . . . . . . . . . . . . . . 2,476 76 5 3 12 37 70 165 407 571 494 615 21 …
See footnotes at end of table.
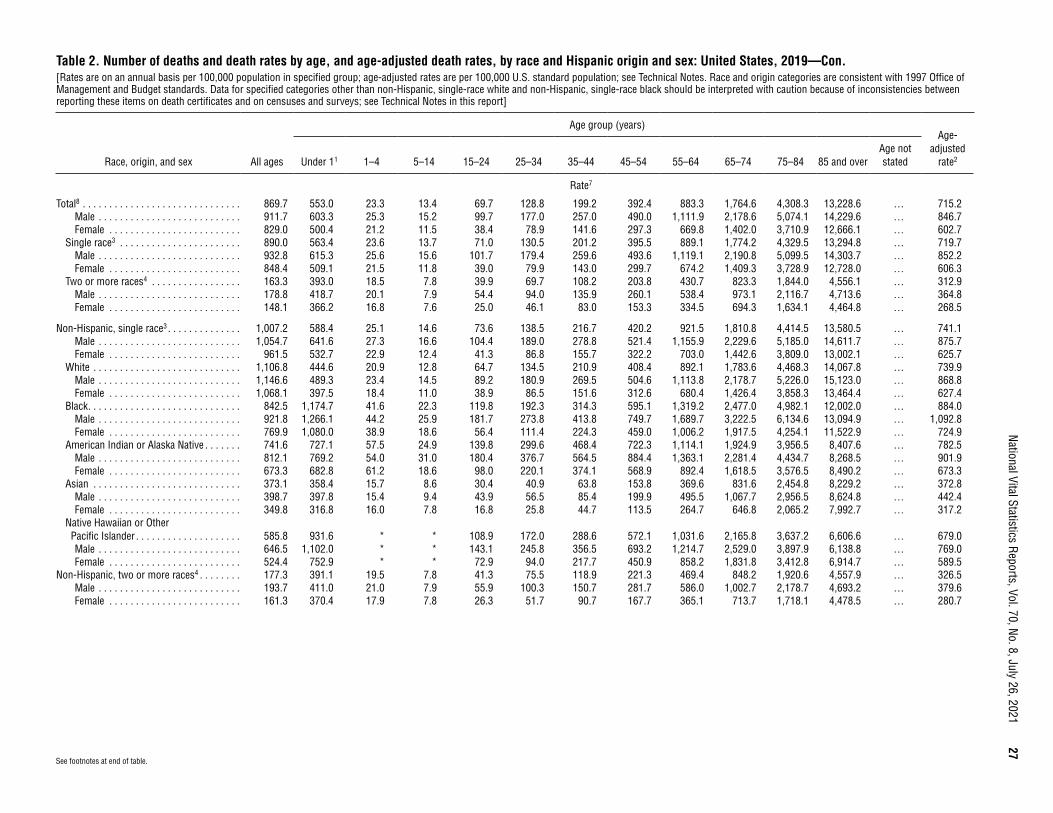
National Vital Statistics Reports, Vol. 70, No. 8, July 26, 2021
27
See footnotes at end of table.
Table 2. Number of deaths and death rates by age, and age-adjusted death rates, by race and Hispanic origin and sex: United States, 2019—Con.[Rates are on an annual basis per 100,000 population in specified group; age-adjusted rates are per 100,000 U.S. standard population; see Technical Notes. Race and origin categories are consistent with 1997 Office of Management and Budget standards. Data for specified categories other than non-Hispanic, single-race white and non-Hispanic, single-race black should be interpreted with caution because of inconsistencies between reporting these items on death certificates and on censuses and surveys; see Technical Notes in this report]
Race, origin, and sex All ages
Age group (years)Age-
adjusted rate2Under 11 1–4 5–14 15–24 25–34 35–44 45–54 55–64 65–74 75–84 85 and over
Age not stated
Rate7
Total8 . . . . . . . . . . . . . . . . . . . . . . . . . . . . . . 869.7 553.0 23.3 13.4 69.7 128.8 199.2 392.4 883.3 1,764.6 4,308.3 13,228.6 … 715.2Male . . . . . . . . . . . . . . . . . . . . . . . . . . . 911.7 603.3 25.3 15.2 99.7 177.0 257.0 490.0 1,111.9 2,178.6 5,074.1 14,229.6 … 846.7Female . . . . . . . . . . . . . . . . . . . . . . . . . 829.0 500.4 21.2 11.5 38.4 78.9 141.6 297.3 669.8 1,402.0 3,710.9 12,666.1 … 602.7
Single race3 . . . . . . . . . . . . . . . . . . . . . . . 890.0 563.4 23.6 13.7 71.0 130.5 201.2 395.5 889.1 1,774.2 4,329.5 13,294.8 … 719.7Male . . . . . . . . . . . . . . . . . . . . . . . . . . . 932.8 615.3 25.6 15.6 101.7 179.4 259.6 493.6 1,119.1 2,190.8 5,099.5 14,303.7 … 852.2Female . . . . . . . . . . . . . . . . . . . . . . . . . 848.4 509.1 21.5 11.8 39.0 79.9 143.0 299.7 674.2 1,409.3 3,728.9 12,728.0 … 606.3
Two or more races4 . . . . . . . . . . . . . . . . . 163.3 393.0 18.5 7.8 39.9 69.7 108.2 203.8 430.7 823.3 1,844.0 4,556.1 … 312.9Male . . . . . . . . . . . . . . . . . . . . . . . . . . . 178.8 418.7 20.1 7.9 54.4 94.0 135.9 260.1 538.4 973.1 2,116.7 4,713.6 … 364.8Female . . . . . . . . . . . . . . . . . . . . . . . . . 148.1 366.2 16.8 7.6 25.0 46.1 83.0 153.3 334.5 694.3 1,634.1 4,464.8 … 268.5
Non-Hispanic, single race3 . . . . . . . . . . . . . . 1,007.2 588.4 25.1 14.6 73.6 138.5 216.7 420.2 921.5 1,810.8 4,414.5 13,580.5 … 741.1Male . . . . . . . . . . . . . . . . . . . . . . . . . . . 1,054.7 641.6 27.3 16.6 104.4 189.0 278.8 521.4 1,155.9 2,229.6 5,185.0 14,611.7 … 875.7Female . . . . . . . . . . . . . . . . . . . . . . . . . 961.5 532.7 22.9 12.4 41.3 86.8 155.7 322.2 703.0 1,442.6 3,809.0 13,002.1 … 625.7
White . . . . . . . . . . . . . . . . . . . . . . . . . . . . 1,106.8 444.6 20.9 12.8 64.7 134.5 210.9 408.4 892.1 1,783.6 4,468.3 14,067.8 … 739.9Male . . . . . . . . . . . . . . . . . . . . . . . . . . . 1,146.6 489.3 23.4 14.5 89.2 180.9 269.5 504.6 1,113.8 2,178.7 5,226.0 15,123.0 … 868.8Female . . . . . . . . . . . . . . . . . . . . . . . . . 1,068.1 397.5 18.4 11.0 38.9 86.5 151.6 312.6 680.4 1,426.4 3,858.3 13,464.4 … 627.4
Black . . . . . . . . . . . . . . . . . . . . . . . . . . . . . 842.5 1,174.7 41.6 22.3 119.8 192.3 314.3 595.1 1,319.2 2,477.0 4,982.1 12,002.0 … 884.0Male . . . . . . . . . . . . . . . . . . . . . . . . . . . 921.8 1,266.1 44.2 25.9 181.7 273.8 413.8 749.7 1,689.7 3,222.5 6,134.6 13,094.9 … 1,092.8Female . . . . . . . . . . . . . . . . . . . . . . . . . 769.9 1,080.0 38.9 18.6 56.4 111.4 224.3 459.0 1,006.2 1,917.5 4,254.1 11,522.9 … 724.9
American Indian or Alaska Native . . . . . . . 741.6 727.1 57.5 24.9 139.8 299.6 468.4 722.3 1,114.1 1,924.9 3,956.5 8,407.6 … 782.5Male . . . . . . . . . . . . . . . . . . . . . . . . . . . 812.1 769.2 54.0 31.0 180.4 376.7 564.5 884.4 1,363.1 2,281.4 4,434.7 8,268.5 … 901.9Female . . . . . . . . . . . . . . . . . . . . . . . . . 673.3 682.8 61.2 18.6 98.0 220.1 374.1 568.9 892.4 1,618.5 3,576.5 8,490.2 … 673.3
Asian . . . . . . . . . . . . . . . . . . . . . . . . . . . . 373.1 358.4 15.7 8.6 30.4 40.9 63.8 153.8 369.6 831.6 2,454.8 8,229.2 … 372.8Male . . . . . . . . . . . . . . . . . . . . . . . . . . . 398.7 397.8 15.4 9.4 43.9 56.5 85.4 199.9 495.5 1,067.7 2,956.5 8,624.8 … 442.4Female . . . . . . . . . . . . . . . . . . . . . . . . . 349.8 316.8 16.0 7.8 16.8 25.8 44.7 113.5 264.7 646.8 2,065.2 7,992.7 … 317.2
Native Hawaiian or Other Pacific Islander . . . . . . . . . . . . . . . . . . . . 585.8 931.6 * * 108.9 172.0 288.6 572.1 1,031.6 2,165.8 3,637.2 6,606.6 … 679.0Male . . . . . . . . . . . . . . . . . . . . . . . . . . . 646.5 1,102.0 * * 143.1 245.8 356.5 693.2 1,214.7 2,529.0 3,897.9 6,138.8 … 769.0Female . . . . . . . . . . . . . . . . . . . . . . . . . 524.4 752.9 * * 72.9 94.0 217.7 450.9 858.2 1,831.8 3,412.8 6,914.7 … 589.5
Non-Hispanic, two or more races4 . . . . . . . . 177.3 391.1 19.5 7.8 41.3 75.5 118.9 221.3 469.4 848.2 1,920.6 4,557.9 … 326.5Male . . . . . . . . . . . . . . . . . . . . . . . . . . . 193.7 411.0 21.0 7.9 55.9 100.3 150.7 281.7 586.0 1,002.7 2,178.7 4,693.2 … 379.6Female . . . . . . . . . . . . . . . . . . . . . . . . . 161.3 370.4 17.9 7.8 26.3 51.7 90.7 167.7 365.1 713.7 1,718.1 4,478.5 … 280.7
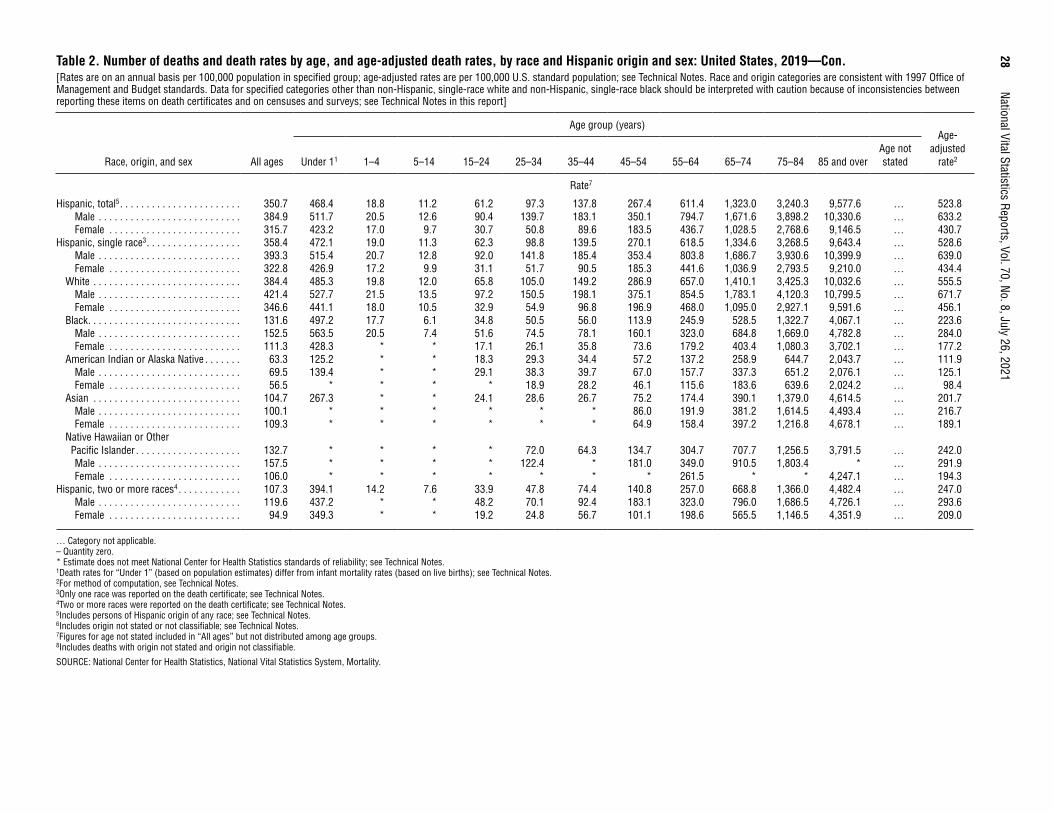
28
National Vital Statistics Reports, Vol. 70, No. 8, July 26, 2021Table 2. Number of deaths and death rates by age, and age-adjusted death rates, by race and Hispanic origin and sex: United States, 2019—Con.[Rates are on an annual basis per 100,000 population in specified group; age-adjusted rates are per 100,000 U.S. standard population; see Technical Notes. Race and origin categories are consistent with 1997 Office of Management and Budget standards. Data for specified categories other than non-Hispanic, single-race white and non-Hispanic, single-race black should be interpreted with caution because of inconsistencies between reporting these items on death certificates and on censuses and surveys; see Technical Notes in this report]
Race, origin, and sex All ages
Age group (years)Age-
adjusted rate2Under 11 1–4 5–14 15–24 25–34 35–44 45–54 55–64 65–74 75–84 85 and over
Age not stated
Rate7
Hispanic, total5 . . . . . . . . . . . . . . . . . . . . . . . 350.7 468.4 18.8 11.2 61.2 97.3 137.8 267.4 611.4 1,323.0 3,240.3 9,577.6 … 523.8Male . . . . . . . . . . . . . . . . . . . . . . . . . . . 384.9 511.7 20.5 12.6 90.4 139.7 183.1 350.1 794.7 1,671.6 3,898.2 10,330.6 … 633.2Female . . . . . . . . . . . . . . . . . . . . . . . . . 315.7 423.2 17.0 9.7 30.7 50.8 89.6 183.5 436.7 1,028.5 2,768.6 9,146.5 … 430.7
Hispanic, single race3 . . . . . . . . . . . . . . . . . . 358.4 472.1 19.0 11.3 62.3 98.8 139.5 270.1 618.5 1,334.6 3,268.5 9,643.4 … 528.6Male . . . . . . . . . . . . . . . . . . . . . . . . . . . 393.3 515.4 20.7 12.8 92.0 141.8 185.4 353.4 803.8 1,686.7 3,930.6 10,399.9 … 639.0Female . . . . . . . . . . . . . . . . . . . . . . . . . 322.8 426.9 17.2 9.9 31.1 51.7 90.5 185.3 441.6 1,036.9 2,793.5 9,210.0 … 434.4
White . . . . . . . . . . . . . . . . . . . . . . . . . . . . 384.4 485.3 19.8 12.0 65.8 105.0 149.2 286.9 657.0 1,410.1 3,425.3 10,032.6 … 555.5Male . . . . . . . . . . . . . . . . . . . . . . . . . . . 421.4 527.7 21.5 13.5 97.2 150.5 198.1 375.1 854.5 1,783.1 4,120.3 10,799.5 … 671.7Female . . . . . . . . . . . . . . . . . . . . . . . . . 346.6 441.1 18.0 10.5 32.9 54.9 96.8 196.9 468.0 1,095.0 2,927.1 9,591.6 … 456.1
Black . . . . . . . . . . . . . . . . . . . . . . . . . . . . . 131.6 497.2 17.7 6.1 34.8 50.5 56.0 113.9 245.9 528.5 1,322.7 4,067.1 … 223.6Male . . . . . . . . . . . . . . . . . . . . . . . . . . . 152.5 563.5 20.5 7.4 51.6 74.5 78.1 160.1 323.0 684.8 1,669.0 4,782.8 … 284.0Female . . . . . . . . . . . . . . . . . . . . . . . . . 111.3 428.3 * * 17.1 26.1 35.8 73.6 179.2 403.4 1,080.3 3,702.1 … 177.2
American Indian or Alaska Native . . . . . . . 63.3 125.2 * * 18.3 29.3 34.4 57.2 137.2 258.9 644.7 2,043.7 … 111.9Male . . . . . . . . . . . . . . . . . . . . . . . . . . . 69.5 139.4 * * 29.1 38.3 39.7 67.0 157.7 337.3 651.2 2,076.1 … 125.1Female . . . . . . . . . . . . . . . . . . . . . . . . . 56.5 * * * * 18.9 28.2 46.1 115.6 183.6 639.6 2,024.2 … 98.4
Asian . . . . . . . . . . . . . . . . . . . . . . . . . . . . 104.7 267.3 * * 24.1 28.6 26.7 75.2 174.4 390.1 1,379.0 4,614.5 … 201.7Male . . . . . . . . . . . . . . . . . . . . . . . . . . . 100.1 * * * * * * 86.0 191.9 381.2 1,614.5 4,493.4 … 216.7Female . . . . . . . . . . . . . . . . . . . . . . . . . 109.3 * * * * * * 64.9 158.4 397.2 1,216.8 4,678.1 … 189.1
Native Hawaiian or Other Pacific Islander . . . . . . . . . . . . . . . . . . . . 132.7 * * * * 72.0 64.3 134.7 304.7 707.7 1,256.5 3,791.5 … 242.0Male . . . . . . . . . . . . . . . . . . . . . . . . . . . 157.5 * * * * 122.4 * 181.0 349.0 910.5 1,803.4 * … 291.9Female . . . . . . . . . . . . . . . . . . . . . . . . . 106.0 * * * * * * * 261.5 * * 4,247.1 … 194.3
Hispanic, two or more races4 . . . . . . . . . . . . 107.3 394.1 14.2 7.6 33.9 47.8 74.4 140.8 257.0 668.8 1,366.0 4,482.4 … 247.0Male . . . . . . . . . . . . . . . . . . . . . . . . . . . 119.6 437.2 * * 48.2 70.1 92.4 183.1 323.0 796.0 1,686.5 4,726.1 … 293.6Female . . . . . . . . . . . . . . . . . . . . . . . . . 94.9 349.3 * * 19.2 24.8 56.7 101.1 198.6 565.5 1,146.5 4,351.9 … 209.0
… Category not applicable. – Quantity zero. * Estimate does not meet National Center for Health Statistics standards of reliability; see Technical Notes. 1Death rates for “Under 1” (based on population estimates) differ from infant mortality rates (based on live births); see Technical Notes. 2For method of computation, see Technical Notes. 3Only one race was reported on the death certificate; see Technical Notes. 4Two or more races were reported on the death certificate; see Technical Notes. 5Includes persons of Hispanic origin of any race; see Technical Notes. 6Includes origin not stated or not classifiable; see Technical Notes. 7Figures for age not stated included in “All ages” but not distributed among age groups. 8Includes deaths with origin not stated and origin not classifiable.
SOURCE: National Center for Health Statistics, National Vital Statistics System, Mortality.
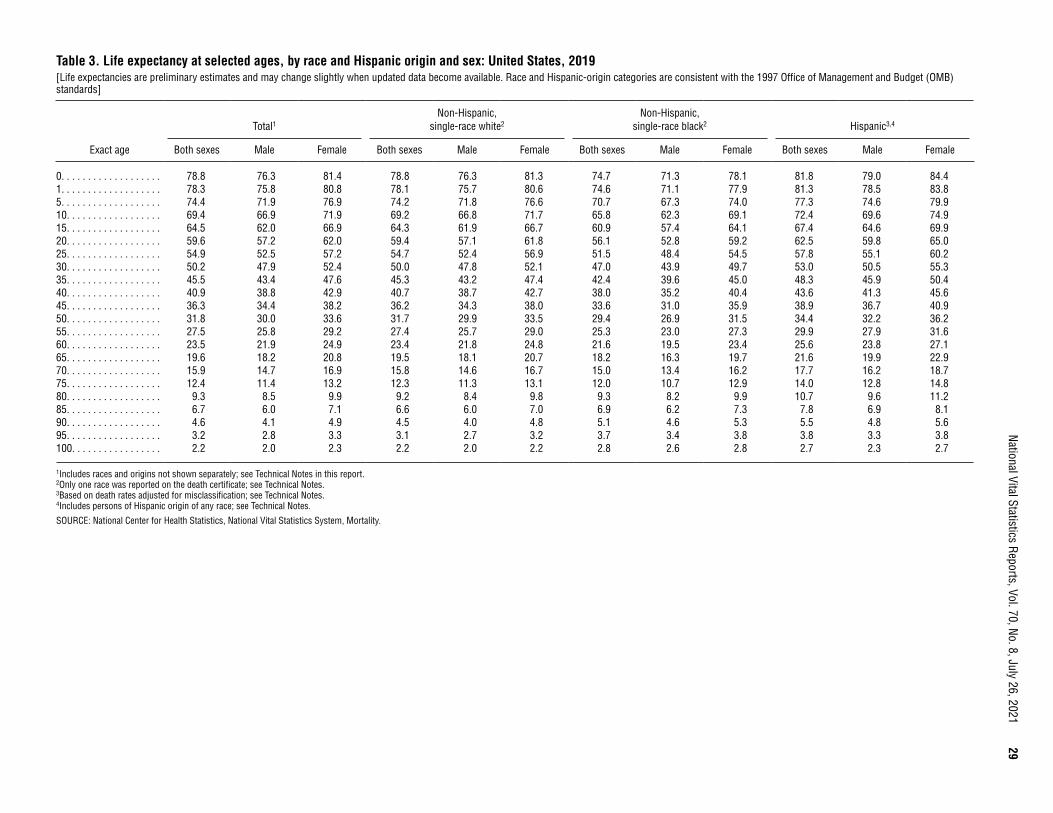
National Vital Statistics Reports, Vol. 70, No. 8, July 26, 2021
29
Table 3. Life expectancy at selected ages, by race and Hispanic origin and sex: United States, 2019[Life expectancies are preliminary estimates and may change slightly when updated data become available. Race and Hispanic-origin categories are consistent with the 1997 Office of Management and Budget (OMB) standards]
Exact age
Total1Non-Hispanic,
single-race white2Non-Hispanic,
single-race black2 Hispanic3,4
Both sexes Male Female Both sexes Male Female Both sexes Male Female Both sexes Male Female
0. . . . . . . . . . . . . . . . . . . 78.8 76.3 81.4 78.8 76.3 81.3 74.7 71.3 78.1 81.8 79.0 84.41. . . . . . . . . . . . . . . . . . . 78.3 75.8 80.8 78.1 75.7 80.6 74.6 71.1 77.9 81.3 78.5 83.85. . . . . . . . . . . . . . . . . . . 74.4 71.9 76.9 74.2 71.8 76.6 70.7 67.3 74.0 77.3 74.6 79.910. . . . . . . . . . . . . . . . . . 69.4 66.9 71.9 69.2 66.8 71.7 65.8 62.3 69.1 72.4 69.6 74.915. . . . . . . . . . . . . . . . . . 64.5 62.0 66.9 64.3 61.9 66.7 60.9 57.4 64.1 67.4 64.6 69.920. . . . . . . . . . . . . . . . . . 59.6 57.2 62.0 59.4 57.1 61.8 56.1 52.8 59.2 62.5 59.8 65.025. . . . . . . . . . . . . . . . . . 54.9 52.5 57.2 54.7 52.4 56.9 51.5 48.4 54.5 57.8 55.1 60.230. . . . . . . . . . . . . . . . . . 50.2 47.9 52.4 50.0 47.8 52.1 47.0 43.9 49.7 53.0 50.5 55.335. . . . . . . . . . . . . . . . . . 45.5 43.4 47.6 45.3 43.2 47.4 42.4 39.6 45.0 48.3 45.9 50.440. . . . . . . . . . . . . . . . . . 40.9 38.8 42.9 40.7 38.7 42.7 38.0 35.2 40.4 43.6 41.3 45.645. . . . . . . . . . . . . . . . . . 36.3 34.4 38.2 36.2 34.3 38.0 33.6 31.0 35.9 38.9 36.7 40.950. . . . . . . . . . . . . . . . . . 31.8 30.0 33.6 31.7 29.9 33.5 29.4 26.9 31.5 34.4 32.2 36.255. . . . . . . . . . . . . . . . . . 27.5 25.8 29.2 27.4 25.7 29.0 25.3 23.0 27.3 29.9 27.9 31.660. . . . . . . . . . . . . . . . . . 23.5 21.9 24.9 23.4 21.8 24.8 21.6 19.5 23.4 25.6 23.8 27.165. . . . . . . . . . . . . . . . . . 19.6 18.2 20.8 19.5 18.1 20.7 18.2 16.3 19.7 21.6 19.9 22.970. . . . . . . . . . . . . . . . . . 15.9 14.7 16.9 15.8 14.6 16.7 15.0 13.4 16.2 17.7 16.2 18.775. . . . . . . . . . . . . . . . . . 12.4 11.4 13.2 12.3 11.3 13.1 12.0 10.7 12.9 14.0 12.8 14.880. . . . . . . . . . . . . . . . . . 9.3 8.5 9.9 9.2 8.4 9.8 9.3 8.2 9.9 10.7 9.6 11.285. . . . . . . . . . . . . . . . . . 6.7 6.0 7.1 6.6 6.0 7.0 6.9 6.2 7.3 7.8 6.9 8.190. . . . . . . . . . . . . . . . . . 4.6 4.1 4.9 4.5 4.0 4.8 5.1 4.6 5.3 5.5 4.8 5.695. . . . . . . . . . . . . . . . . . 3.2 2.8 3.3 3.1 2.7 3.2 3.7 3.4 3.8 3.8 3.3 3.8100. . . . . . . . . . . . . . . . . 2.2 2.0 2.3 2.2 2.0 2.2 2.8 2.6 2.8 2.7 2.3 2.7
1Includes races and origins not shown separately; see Technical Notes in this report. 2Only one race was reported on the death certificate; see Technical Notes. 3Based on death rates adjusted for misclassification; see Technical Notes. 4Includes persons of Hispanic origin of any race; see Technical Notes.
SOURCE: National Center for Health Statistics, National Vital Statistics System, Mortality.
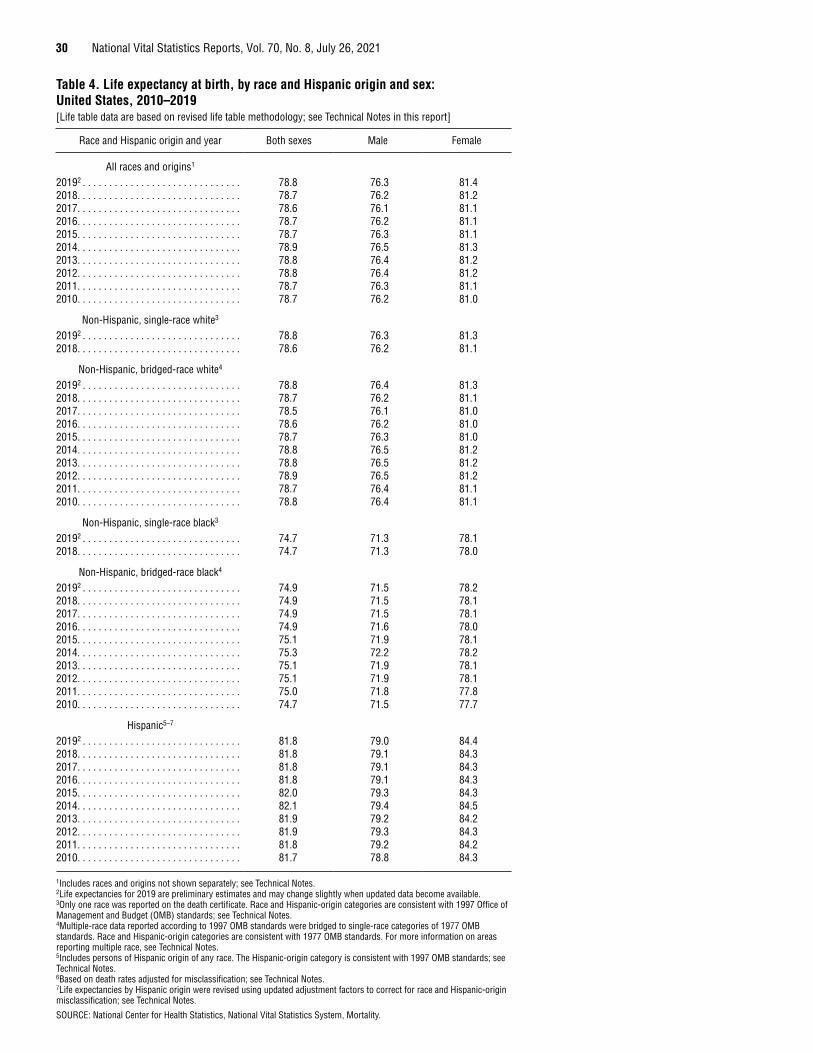
30 National Vital Statistics Reports, Vol. 70, No. 8, July 26, 2021
Table 4. Life expectancy at birth, by race and Hispanic origin and sex: United States, 2010–2019[Life table data are based on revised life table methodology; see Technical Notes in this report]
Race and Hispanic origin and year Both sexes Male Female
All races and origins1
20192 . . . . . . . . . . . . . . . . . . . . . . . . . . . . . . 78.8 76.3 81.42018. . . . . . . . . . . . . . . . . . . . . . . . . . . . . . . 78.7 76.2 81.22017. . . . . . . . . . . . . . . . . . . . . . . . . . . . . . . 78.6 76.1 81.12016. . . . . . . . . . . . . . . . . . . . . . . . . . . . . . . 78.7 76.2 81.12015. . . . . . . . . . . . . . . . . . . . . . . . . . . . . . . 78.7 76.3 81.12014. . . . . . . . . . . . . . . . . . . . . . . . . . . . . . . 78.9 76.5 81.32013. . . . . . . . . . . . . . . . . . . . . . . . . . . . . . . 78.8 76.4 81.22012. . . . . . . . . . . . . . . . . . . . . . . . . . . . . . . 78.8 76.4 81.22011. . . . . . . . . . . . . . . . . . . . . . . . . . . . . . . 78.7 76.3 81.12010. . . . . . . . . . . . . . . . . . . . . . . . . . . . . . . 78.7 76.2 81.0
Non-Hispanic, single-race white3
20192 . . . . . . . . . . . . . . . . . . . . . . . . . . . . . . 78.8 76.3 81.32018. . . . . . . . . . . . . . . . . . . . . . . . . . . . . . . 78.6 76.2 81.1
Non-Hispanic, bridged-race white4
20192 . . . . . . . . . . . . . . . . . . . . . . . . . . . . . . 78.8 76.4 81.32018. . . . . . . . . . . . . . . . . . . . . . . . . . . . . . . 78.7 76.2 81.12017. . . . . . . . . . . . . . . . . . . . . . . . . . . . . . . 78.5 76.1 81.02016. . . . . . . . . . . . . . . . . . . . . . . . . . . . . . . 78.6 76.2 81.02015. . . . . . . . . . . . . . . . . . . . . . . . . . . . . . . 78.7 76.3 81.02014. . . . . . . . . . . . . . . . . . . . . . . . . . . . . . . 78.8 76.5 81.22013. . . . . . . . . . . . . . . . . . . . . . . . . . . . . . . 78.8 76.5 81.22012. . . . . . . . . . . . . . . . . . . . . . . . . . . . . . . 78.9 76.5 81.22011. . . . . . . . . . . . . . . . . . . . . . . . . . . . . . . 78.7 76.4 81.12010. . . . . . . . . . . . . . . . . . . . . . . . . . . . . . . 78.8 76.4 81.1
Non-Hispanic, single-race black3
20192 . . . . . . . . . . . . . . . . . . . . . . . . . . . . . . 74.7 71.3 78.12018. . . . . . . . . . . . . . . . . . . . . . . . . . . . . . . 74.7 71.3 78.0
Non-Hispanic, bridged-race black4
20192 . . . . . . . . . . . . . . . . . . . . . . . . . . . . . . 74.9 71.5 78.22018. . . . . . . . . . . . . . . . . . . . . . . . . . . . . . . 74.9 71.5 78.12017. . . . . . . . . . . . . . . . . . . . . . . . . . . . . . . 74.9 71.5 78.12016. . . . . . . . . . . . . . . . . . . . . . . . . . . . . . . 74.9 71.6 78.02015. . . . . . . . . . . . . . . . . . . . . . . . . . . . . . . 75.1 71.9 78.12014. . . . . . . . . . . . . . . . . . . . . . . . . . . . . . . 75.3 72.2 78.22013. . . . . . . . . . . . . . . . . . . . . . . . . . . . . . . 75.1 71.9 78.12012. . . . . . . . . . . . . . . . . . . . . . . . . . . . . . . 75.1 71.9 78.12011. . . . . . . . . . . . . . . . . . . . . . . . . . . . . . . 75.0 71.8 77.82010. . . . . . . . . . . . . . . . . . . . . . . . . . . . . . . 74.7 71.5 77.7
Hispanic5–7
20192 . . . . . . . . . . . . . . . . . . . . . . . . . . . . . . 81.8 79.0 84.42018. . . . . . . . . . . . . . . . . . . . . . . . . . . . . . . 81.8 79.1 84.32017. . . . . . . . . . . . . . . . . . . . . . . . . . . . . . . 81.8 79.1 84.32016. . . . . . . . . . . . . . . . . . . . . . . . . . . . . . . 81.8 79.1 84.32015. . . . . . . . . . . . . . . . . . . . . . . . . . . . . . . 82.0 79.3 84.32014. . . . . . . . . . . . . . . . . . . . . . . . . . . . . . . 82.1 79.4 84.52013. . . . . . . . . . . . . . . . . . . . . . . . . . . . . . . 81.9 79.2 84.22012. . . . . . . . . . . . . . . . . . . . . . . . . . . . . . . 81.9 79.3 84.32011. . . . . . . . . . . . . . . . . . . . . . . . . . . . . . . 81.8 79.2 84.22010. . . . . . . . . . . . . . . . . . . . . . . . . . . . . . . 81.7 78.8 84.3
1Includes races and origins not shown separately; see Technical Notes. 2Life expectancies for 2019 are preliminary estimates and may change slightly when updated data become available. 3Only one race was reported on the death certificate. Race and Hispanic-origin categories are consistent with 1997 Office of Management and Budget (OMB) standards; see Technical Notes. 4Multiple-race data reported according to 1997 OMB standards were bridged to single-race categories of 1977 OMB standards. Race and Hispanic-origin categories are consistent with 1977 OMB standards. For more information on areas reporting multiple race, see Technical Notes. 5Includes persons of Hispanic origin of any race. The Hispanic-origin category is consistent with 1997 OMB standards; see Technical Notes. 6Based on death rates adjusted for misclassification; see Technical Notes. 7Life expectancies by Hispanic origin were revised using updated adjustment factors to correct for race and Hispanic-origin misclassification; see Technical Notes.
SOURCE: National Center for Health Statistics, National Vital Statistics System, Mortality.
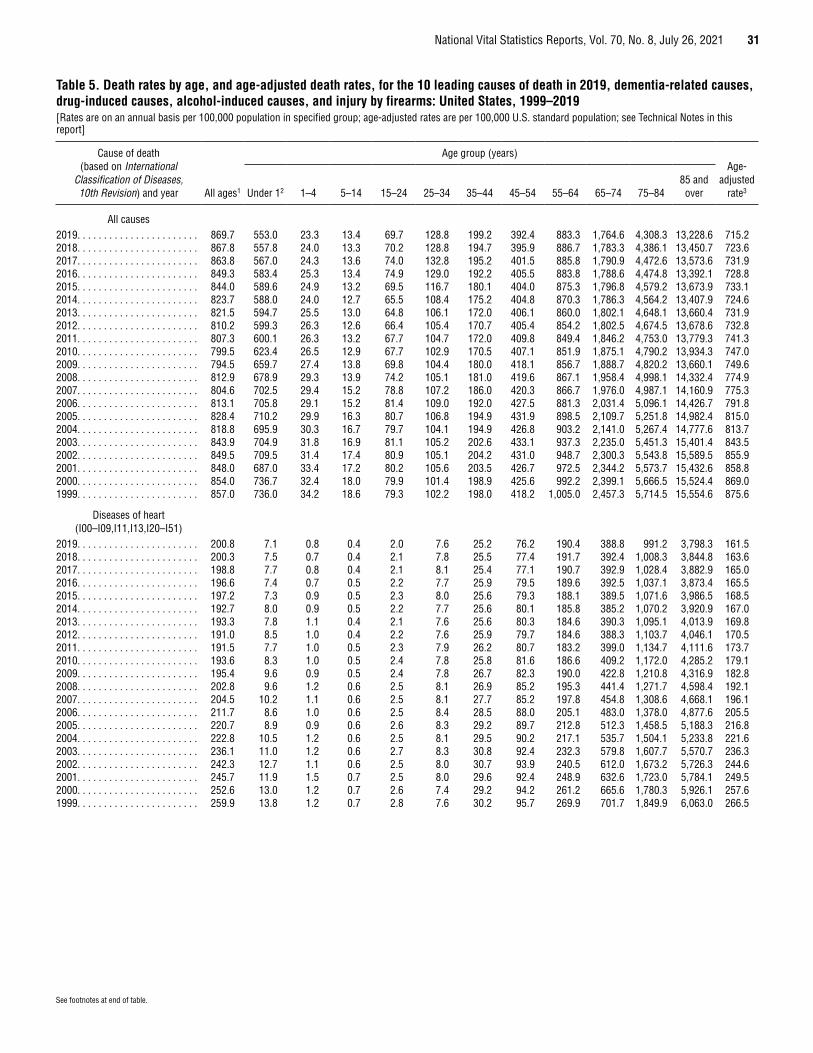
National Vital Statistics Reports, Vol. 70, No. 8, July 26, 2021 31
See footnotes at end of table.
Table 5. Death rates by age, and age-adjusted death rates, for the 10 leading causes of death in 2019, dementia-related causes, drug-induced causes, alcohol-induced causes, and injury by firearms: United States, 1999–2019[Rates are on an annual basis per 100,000 population in specified group; age-adjusted rates are per 100,000 U.S. standard population; see Technical Notes in this report]
Cause of death (based on International
Classification of Diseases, 10th Revision) and year All ages1
Age group (years)Age-
adjusted rate3 Under 12 1–4 5–14 15–24 25–34 35–44 45–54 55–64 65–74 75–84
85 and over
All causes 2019. . . . . . . . . . . . . . . . . . . . . . . 869.7 553.0 23.3 13.4 69.7 128.8 199.2 392.4 883.3 1,764.6 4,308.3 13,228.6 715.22018. . . . . . . . . . . . . . . . . . . . . . . 867.8 557.8 24.0 13.3 70.2 128.8 194.7 395.9 886.7 1,783.3 4,386.1 13,450.7 723.62017. . . . . . . . . . . . . . . . . . . . . . . 863.8 567.0 24.3 13.6 74.0 132.8 195.2 401.5 885.8 1,790.9 4,472.6 13,573.6 731.92016. . . . . . . . . . . . . . . . . . . . . . . 849.3 583.4 25.3 13.4 74.9 129.0 192.2 405.5 883.8 1,788.6 4,474.8 13,392.1 728.82015. . . . . . . . . . . . . . . . . . . . . . . 844.0 589.6 24.9 13.2 69.5 116.7 180.1 404.0 875.3 1,796.8 4,579.2 13,673.9 733.12014. . . . . . . . . . . . . . . . . . . . . . . 823.7 588.0 24.0 12.7 65.5 108.4 175.2 404.8 870.3 1,786.3 4,564.2 13,407.9 724.62013. . . . . . . . . . . . . . . . . . . . . . . 821.5 594.7 25.5 13.0 64.8 106.1 172.0 406.1 860.0 1,802.1 4,648.1 13,660.4 731.92012. . . . . . . . . . . . . . . . . . . . . . . 810.2 599.3 26.3 12.6 66.4 105.4 170.7 405.4 854.2 1,802.5 4,674.5 13,678.6 732.82011. . . . . . . . . . . . . . . . . . . . . . . 807.3 600.1 26.3 13.2 67.7 104.7 172.0 409.8 849.4 1,846.2 4,753.0 13,779.3 741.32010. . . . . . . . . . . . . . . . . . . . . . . 799.5 623.4 26.5 12.9 67.7 102.9 170.5 407.1 851.9 1,875.1 4,790.2 13,934.3 747.02009. . . . . . . . . . . . . . . . . . . . . . . 794.5 659.7 27.4 13.8 69.8 104.4 180.0 418.1 856.7 1,888.7 4,820.2 13,660.1 749.62008. . . . . . . . . . . . . . . . . . . . . . . 812.9 678.9 29.3 13.9 74.2 105.1 181.0 419.6 867.1 1,958.4 4,998.1 14,332.4 774.92007. . . . . . . . . . . . . . . . . . . . . . . 804.6 702.5 29.4 15.2 78.8 107.2 186.0 420.3 866.7 1,976.0 4,987.1 14,160.9 775.32006. . . . . . . . . . . . . . . . . . . . . . . 813.1 705.8 29.1 15.2 81.4 109.0 192.0 427.5 881.3 2,031.4 5,096.1 14,426.7 791.82005. . . . . . . . . . . . . . . . . . . . . . . 828.4 710.2 29.9 16.3 80.7 106.8 194.9 431.9 898.5 2,109.7 5,251.8 14,982.4 815.02004. . . . . . . . . . . . . . . . . . . . . . . 818.8 695.9 30.3 16.7 79.7 104.1 194.9 426.8 903.2 2,141.0 5,267.4 14,777.6 813.72003. . . . . . . . . . . . . . . . . . . . . . . 843.9 704.9 31.8 16.9 81.1 105.2 202.6 433.1 937.3 2,235.0 5,451.3 15,401.4 843.52002. . . . . . . . . . . . . . . . . . . . . . . 849.5 709.5 31.4 17.4 80.9 105.1 204.2 431.0 948.7 2,300.3 5,543.8 15,589.5 855.92001. . . . . . . . . . . . . . . . . . . . . . . 848.0 687.0 33.4 17.2 80.2 105.6 203.5 426.7 972.5 2,344.2 5,573.7 15,432.6 858.82000. . . . . . . . . . . . . . . . . . . . . . . 854.0 736.7 32.4 18.0 79.9 101.4 198.9 425.6 992.2 2,399.1 5,666.5 15,524.4 869.01999. . . . . . . . . . . . . . . . . . . . . . . 857.0 736.0 34.2 18.6 79.3 102.2 198.0 418.2 1,005.0 2,457.3 5,714.5 15,554.6 875.6
Diseases of heart (I00–I09,I11,I13,I20–I51)
2019. . . . . . . . . . . . . . . . . . . . . . . 200.8 7.1 0.8 0.4 2.0 7.6 25.2 76.2 190.4 388.8 991.2 3,798.3 161.52018. . . . . . . . . . . . . . . . . . . . . . . 200.3 7.5 0.7 0.4 2.1 7.8 25.5 77.4 191.7 392.4 1,008.3 3,844.8 163.62017. . . . . . . . . . . . . . . . . . . . . . . 198.8 7.7 0.8 0.4 2.1 8.1 25.4 77.1 190.7 392.9 1,028.4 3,882.9 165.02016. . . . . . . . . . . . . . . . . . . . . . . 196.6 7.4 0.7 0.5 2.2 7.7 25.9 79.5 189.6 392.5 1,037.1 3,873.4 165.52015. . . . . . . . . . . . . . . . . . . . . . . 197.2 7.3 0.9 0.5 2.3 8.0 25.6 79.3 188.1 389.5 1,071.6 3,986.5 168.52014. . . . . . . . . . . . . . . . . . . . . . . 192.7 8.0 0.9 0.5 2.2 7.7 25.6 80.1 185.8 385.2 1,070.2 3,920.9 167.02013. . . . . . . . . . . . . . . . . . . . . . . 193.3 7.8 1.1 0.4 2.1 7.6 25.6 80.3 184.6 390.3 1,095.1 4,013.9 169.82012. . . . . . . . . . . . . . . . . . . . . . . 191.0 8.5 1.0 0.4 2.2 7.6 25.9 79.7 184.6 388.3 1,103.7 4,046.1 170.52011. . . . . . . . . . . . . . . . . . . . . . . 191.5 7.7 1.0 0.5 2.3 7.9 26.2 80.7 183.2 399.0 1,134.7 4,111.6 173.72010. . . . . . . . . . . . . . . . . . . . . . . 193.6 8.3 1.0 0.5 2.4 7.8 25.8 81.6 186.6 409.2 1,172.0 4,285.2 179.12009. . . . . . . . . . . . . . . . . . . . . . . 195.4 9.6 0.9 0.5 2.4 7.8 26.7 82.3 190.0 422.8 1,210.8 4,316.9 182.82008. . . . . . . . . . . . . . . . . . . . . . . 202.8 9.6 1.2 0.6 2.5 8.1 26.9 85.2 195.3 441.4 1,271.7 4,598.4 192.12007. . . . . . . . . . . . . . . . . . . . . . . 204.5 10.2 1.1 0.6 2.5 8.1 27.7 85.2 197.8 454.8 1,308.6 4,668.1 196.12006. . . . . . . . . . . . . . . . . . . . . . . 211.7 8.6 1.0 0.6 2.5 8.4 28.5 88.0 205.1 483.0 1,378.0 4,877.6 205.52005. . . . . . . . . . . . . . . . . . . . . . . 220.7 8.9 0.9 0.6 2.6 8.3 29.2 89.7 212.8 512.3 1,458.5 5,188.3 216.82004. . . . . . . . . . . . . . . . . . . . . . . 222.8 10.5 1.2 0.6 2.5 8.1 29.5 90.2 217.1 535.7 1,504.1 5,233.8 221.62003. . . . . . . . . . . . . . . . . . . . . . . 236.1 11.0 1.2 0.6 2.7 8.3 30.8 92.4 232.3 579.8 1,607.7 5,570.7 236.32002. . . . . . . . . . . . . . . . . . . . . . . 242.3 12.7 1.1 0.6 2.5 8.0 30.7 93.9 240.5 612.0 1,673.2 5,726.3 244.62001. . . . . . . . . . . . . . . . . . . . . . . 245.7 11.9 1.5 0.7 2.5 8.0 29.6 92.4 248.9 632.6 1,723.0 5,784.1 249.52000. . . . . . . . . . . . . . . . . . . . . . . 252.6 13.0 1.2 0.7 2.6 7.4 29.2 94.2 261.2 665.6 1,780.3 5,926.1 257.61999. . . . . . . . . . . . . . . . . . . . . . . 259.9 13.8 1.2 0.7 2.8 7.6 30.2 95.7 269.9 701.7 1,849.9 6,063.0 266.5
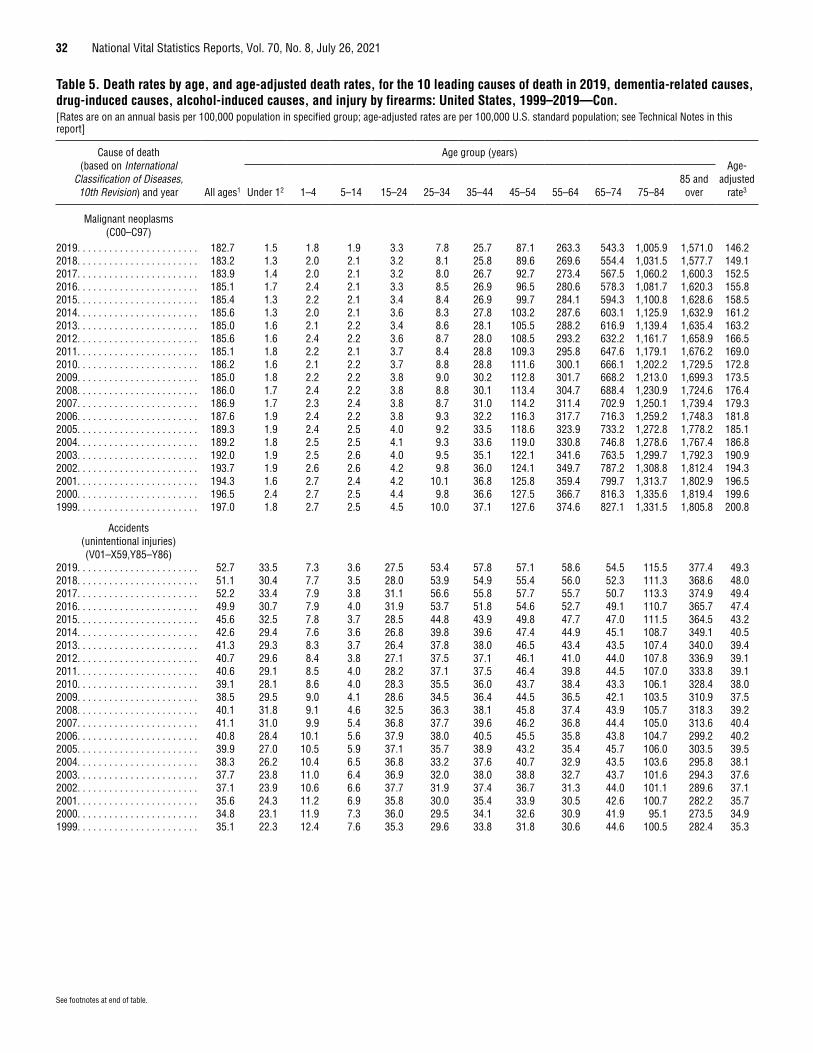
32 National Vital Statistics Reports, Vol. 70, No. 8, July 26, 2021
See footnotes at end of table.
Table 5. Death rates by age, and age-adjusted death rates, for the 10 leading causes of death in 2019, dementia-related causes, drug-induced causes, alcohol-induced causes, and injury by firearms: United States, 1999–2019—Con.[Rates are on an annual basis per 100,000 population in specified group; age-adjusted rates are per 100,000 U.S. standard population; see Technical Notes in this report]
Cause of death (based on International
Classification of Diseases, 10th Revision) and year All ages1
Age group (years)Age-
adjusted rate3 Under 12 1–4 5–14 15–24 25–34 35–44 45–54 55–64 65–74 75–84
85 and over
Malignant neoplasms (C00–C97)
2019. . . . . . . . . . . . . . . . . . . . . . . 182.7 1.5 1.8 1.9 3.3 7.8 25.7 87.1 263.3 543.3 1,005.9 1,571.0 146.22018. . . . . . . . . . . . . . . . . . . . . . . 183.2 1.3 2.0 2.1 3.2 8.1 25.8 89.6 269.6 554.4 1,031.5 1,577.7 149.12017. . . . . . . . . . . . . . . . . . . . . . . 183.9 1.4 2.0 2.1 3.2 8.0 26.7 92.7 273.4 567.5 1,060.2 1,600.3 152.52016. . . . . . . . . . . . . . . . . . . . . . . 185.1 1.7 2.4 2.1 3.3 8.5 26.9 96.5 280.6 578.3 1,081.7 1,620.3 155.82015. . . . . . . . . . . . . . . . . . . . . . . 185.4 1.3 2.2 2.1 3.4 8.4 26.9 99.7 284.1 594.3 1,100.8 1,628.6 158.52014. . . . . . . . . . . . . . . . . . . . . . . 185.6 1.3 2.0 2.1 3.6 8.3 27.8 103.2 287.6 603.1 1,125.9 1,632.9 161.22013. . . . . . . . . . . . . . . . . . . . . . . 185.0 1.6 2.1 2.2 3.4 8.6 28.1 105.5 288.2 616.9 1,139.4 1,635.4 163.22012. . . . . . . . . . . . . . . . . . . . . . . 185.6 1.6 2.4 2.2 3.6 8.7 28.0 108.5 293.2 632.2 1,161.7 1,658.9 166.52011. . . . . . . . . . . . . . . . . . . . . . . 185.1 1.8 2.2 2.1 3.7 8.4 28.8 109.3 295.8 647.6 1,179.1 1,676.2 169.02010. . . . . . . . . . . . . . . . . . . . . . . 186.2 1.6 2.1 2.2 3.7 8.8 28.8 111.6 300.1 666.1 1,202.2 1,729.5 172.82009. . . . . . . . . . . . . . . . . . . . . . . 185.0 1.8 2.2 2.2 3.8 9.0 30.2 112.8 301.7 668.2 1,213.0 1,699.3 173.52008. . . . . . . . . . . . . . . . . . . . . . . 186.0 1.7 2.4 2.2 3.8 8.8 30.1 113.4 304.7 688.4 1,230.9 1,724.6 176.42007. . . . . . . . . . . . . . . . . . . . . . . 186.9 1.7 2.3 2.4 3.8 8.7 31.0 114.2 311.4 702.9 1,250.1 1,739.4 179.32006. . . . . . . . . . . . . . . . . . . . . . . 187.6 1.9 2.4 2.2 3.8 9.3 32.2 116.3 317.7 716.3 1,259.2 1,748.3 181.82005. . . . . . . . . . . . . . . . . . . . . . . 189.3 1.9 2.4 2.5 4.0 9.2 33.5 118.6 323.9 733.2 1,272.8 1,778.2 185.12004. . . . . . . . . . . . . . . . . . . . . . . 189.2 1.8 2.5 2.5 4.1 9.3 33.6 119.0 330.8 746.8 1,278.6 1,767.4 186.82003. . . . . . . . . . . . . . . . . . . . . . . 192.0 1.9 2.5 2.6 4.0 9.5 35.1 122.1 341.6 763.5 1,299.7 1,792.3 190.92002. . . . . . . . . . . . . . . . . . . . . . . 193.7 1.9 2.6 2.6 4.2 9.8 36.0 124.1 349.7 787.2 1,308.8 1,812.4 194.32001. . . . . . . . . . . . . . . . . . . . . . . 194.3 1.6 2.7 2.4 4.2 10.1 36.8 125.8 359.4 799.7 1,313.7 1,802.9 196.52000. . . . . . . . . . . . . . . . . . . . . . . 196.5 2.4 2.7 2.5 4.4 9.8 36.6 127.5 366.7 816.3 1,335.6 1,819.4 199.61999. . . . . . . . . . . . . . . . . . . . . . . 197.0 1.8 2.7 2.5 4.5 10.0 37.1 127.6 374.6 827.1 1,331.5 1,805.8 200.8
Accidents (unintentional injuries) (V01–X59,Y85–Y86)
2019. . . . . . . . . . . . . . . . . . . . . . . 52.7 33.5 7.3 3.6 27.5 53.4 57.8 57.1 58.6 54.5 115.5 377.4 49.32018. . . . . . . . . . . . . . . . . . . . . . . 51.1 30.4 7.7 3.5 28.0 53.9 54.9 55.4 56.0 52.3 111.3 368.6 48.02017. . . . . . . . . . . . . . . . . . . . . . . 52.2 33.4 7.9 3.8 31.1 56.6 55.8 57.7 55.7 50.7 113.3 374.9 49.42016. . . . . . . . . . . . . . . . . . . . . . . 49.9 30.7 7.9 4.0 31.9 53.7 51.8 54.6 52.7 49.1 110.7 365.7 47.42015. . . . . . . . . . . . . . . . . . . . . . . 45.6 32.5 7.8 3.7 28.5 44.8 43.9 49.8 47.7 47.0 111.5 364.5 43.22014. . . . . . . . . . . . . . . . . . . . . . . 42.6 29.4 7.6 3.6 26.8 39.8 39.6 47.4 44.9 45.1 108.7 349.1 40.52013. . . . . . . . . . . . . . . . . . . . . . . 41.3 29.3 8.3 3.7 26.4 37.8 38.0 46.5 43.4 43.5 107.4 340.0 39.42012. . . . . . . . . . . . . . . . . . . . . . . 40.7 29.6 8.4 3.8 27.1 37.5 37.1 46.1 41.0 44.0 107.8 336.9 39.12011. . . . . . . . . . . . . . . . . . . . . . . 40.6 29.1 8.5 4.0 28.2 37.1 37.5 46.4 39.8 44.5 107.0 333.8 39.12010. . . . . . . . . . . . . . . . . . . . . . . 39.1 28.1 8.6 4.0 28.3 35.5 36.0 43.7 38.4 43.3 106.1 328.4 38.02009. . . . . . . . . . . . . . . . . . . . . . . 38.5 29.5 9.0 4.1 28.6 34.5 36.4 44.5 36.5 42.1 103.5 310.9 37.52008. . . . . . . . . . . . . . . . . . . . . . . 40.1 31.8 9.1 4.6 32.5 36.3 38.1 45.8 37.4 43.9 105.7 318.3 39.22007. . . . . . . . . . . . . . . . . . . . . . . 41.1 31.0 9.9 5.4 36.8 37.7 39.6 46.2 36.8 44.4 105.0 313.6 40.42006. . . . . . . . . . . . . . . . . . . . . . . 40.8 28.4 10.1 5.6 37.9 38.0 40.5 45.5 35.8 43.8 104.7 299.2 40.22005. . . . . . . . . . . . . . . . . . . . . . . 39.9 27.0 10.5 5.9 37.1 35.7 38.9 43.2 35.4 45.7 106.0 303.5 39.52004. . . . . . . . . . . . . . . . . . . . . . . 38.3 26.2 10.4 6.5 36.8 33.2 37.6 40.7 32.9 43.5 103.6 295.8 38.12003. . . . . . . . . . . . . . . . . . . . . . . 37.7 23.8 11.0 6.4 36.9 32.0 38.0 38.8 32.7 43.7 101.6 294.3 37.62002. . . . . . . . . . . . . . . . . . . . . . . 37.1 23.9 10.6 6.6 37.7 31.9 37.4 36.7 31.3 44.0 101.1 289.6 37.12001. . . . . . . . . . . . . . . . . . . . . . . 35.6 24.3 11.2 6.9 35.8 30.0 35.4 33.9 30.5 42.6 100.7 282.2 35.72000. . . . . . . . . . . . . . . . . . . . . . . 34.8 23.1 11.9 7.3 36.0 29.5 34.1 32.6 30.9 41.9 95.1 273.5 34.91999. . . . . . . . . . . . . . . . . . . . . . . 35.1 22.3 12.4 7.6 35.3 29.6 33.8 31.8 30.6 44.6 100.5 282.4 35.3
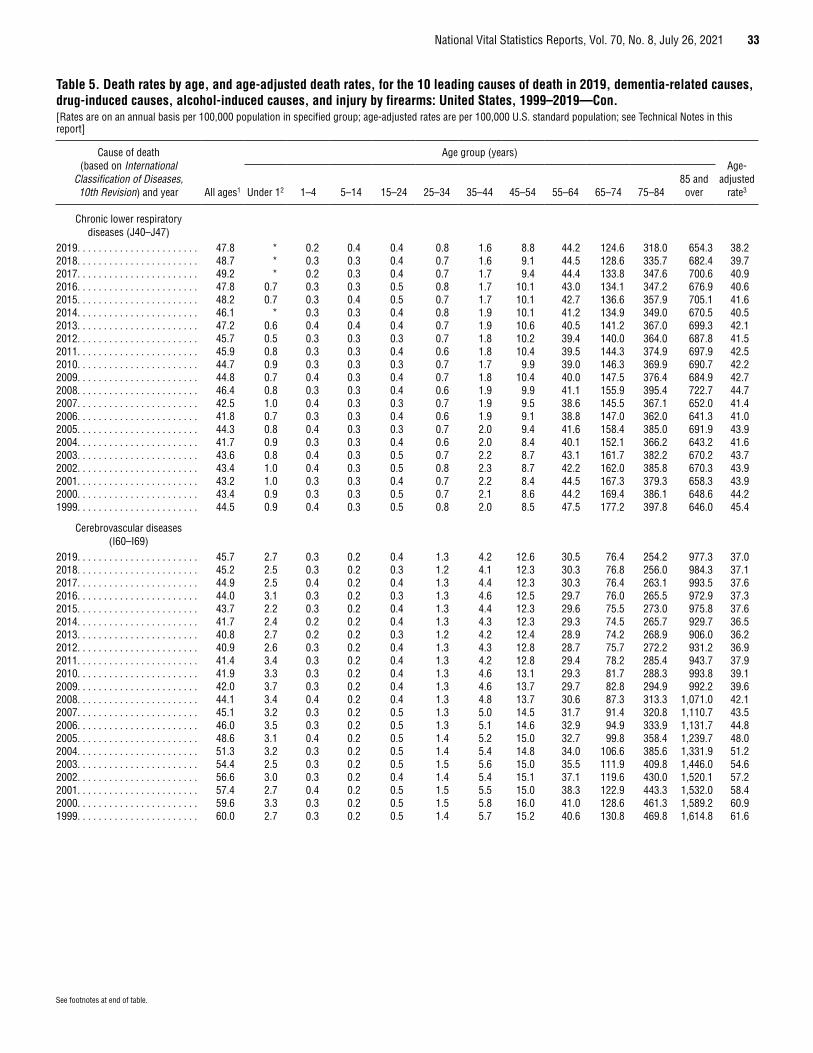
National Vital Statistics Reports, Vol. 70, No. 8, July 26, 2021 33
See footnotes at end of table.
Table 5. Death rates by age, and age-adjusted death rates, for the 10 leading causes of death in 2019, dementia-related causes, drug-induced causes, alcohol-induced causes, and injury by firearms: United States, 1999–2019—Con.[Rates are on an annual basis per 100,000 population in specified group; age-adjusted rates are per 100,000 U.S. standard population; see Technical Notes in this report]
Cause of death (based on International
Classification of Diseases, 10th Revision) and year All ages1
Age group (years)Age-
adjusted rate3 Under 12 1–4 5–14 15–24 25–34 35–44 45–54 55–64 65–74 75–84
85 and over
Chronic lower respiratory diseases (J40–J47)
2019. . . . . . . . . . . . . . . . . . . . . . . 47.8 * 0.2 0.4 0.4 0.8 1.6 8.8 44.2 124.6 318.0 654.3 38.22018. . . . . . . . . . . . . . . . . . . . . . . 48.7 * 0.3 0.3 0.4 0.7 1.6 9.1 44.5 128.6 335.7 682.4 39.72017. . . . . . . . . . . . . . . . . . . . . . . 49.2 * 0.2 0.3 0.4 0.7 1.7 9.4 44.4 133.8 347.6 700.6 40.92016. . . . . . . . . . . . . . . . . . . . . . . 47.8 0.7 0.3 0.3 0.5 0.8 1.7 10.1 43.0 134.1 347.2 676.9 40.62015. . . . . . . . . . . . . . . . . . . . . . . 48.2 0.7 0.3 0.4 0.5 0.7 1.7 10.1 42.7 136.6 357.9 705.1 41.62014. . . . . . . . . . . . . . . . . . . . . . . 46.1 * 0.3 0.3 0.4 0.8 1.9 10.1 41.2 134.9 349.0 670.5 40.52013. . . . . . . . . . . . . . . . . . . . . . . 47.2 0.6 0.4 0.4 0.4 0.7 1.9 10.6 40.5 141.2 367.0 699.3 42.12012. . . . . . . . . . . . . . . . . . . . . . . 45.7 0.5 0.3 0.3 0.3 0.7 1.8 10.2 39.4 140.0 364.0 687.8 41.52011. . . . . . . . . . . . . . . . . . . . . . . 45.9 0.8 0.3 0.3 0.4 0.6 1.8 10.4 39.5 144.3 374.9 697.9 42.52010. . . . . . . . . . . . . . . . . . . . . . . 44.7 0.9 0.3 0.3 0.3 0.7 1.7 9.9 39.0 146.3 369.9 690.7 42.22009. . . . . . . . . . . . . . . . . . . . . . . 44.8 0.7 0.4 0.3 0.4 0.7 1.8 10.4 40.0 147.5 376.4 684.9 42.72008. . . . . . . . . . . . . . . . . . . . . . . 46.4 0.8 0.3 0.3 0.4 0.6 1.9 9.9 41.1 155.9 395.4 722.7 44.72007. . . . . . . . . . . . . . . . . . . . . . . 42.5 1.0 0.4 0.3 0.3 0.7 1.9 9.5 38.6 145.5 367.1 652.0 41.42006. . . . . . . . . . . . . . . . . . . . . . . 41.8 0.7 0.3 0.3 0.4 0.6 1.9 9.1 38.8 147.0 362.0 641.3 41.02005. . . . . . . . . . . . . . . . . . . . . . . 44.3 0.8 0.4 0.3 0.3 0.7 2.0 9.4 41.6 158.4 385.0 691.9 43.92004. . . . . . . . . . . . . . . . . . . . . . . 41.7 0.9 0.3 0.3 0.4 0.6 2.0 8.4 40.1 152.1 366.2 643.2 41.62003. . . . . . . . . . . . . . . . . . . . . . . 43.6 0.8 0.4 0.3 0.5 0.7 2.2 8.7 43.1 161.7 382.2 670.2 43.72002. . . . . . . . . . . . . . . . . . . . . . . 43.4 1.0 0.4 0.3 0.5 0.8 2.3 8.7 42.2 162.0 385.8 670.3 43.92001. . . . . . . . . . . . . . . . . . . . . . . 43.2 1.0 0.3 0.3 0.4 0.7 2.2 8.4 44.5 167.3 379.3 658.3 43.92000. . . . . . . . . . . . . . . . . . . . . . . 43.4 0.9 0.3 0.3 0.5 0.7 2.1 8.6 44.2 169.4 386.1 648.6 44.21999. . . . . . . . . . . . . . . . . . . . . . . 44.5 0.9 0.4 0.3 0.5 0.8 2.0 8.5 47.5 177.2 397.8 646.0 45.4
Cerebrovascular diseases (I60–I69)
2019. . . . . . . . . . . . . . . . . . . . . . . 45.7 2.7 0.3 0.2 0.4 1.3 4.2 12.6 30.5 76.4 254.2 977.3 37.02018. . . . . . . . . . . . . . . . . . . . . . . 45.2 2.5 0.3 0.2 0.3 1.2 4.1 12.3 30.3 76.8 256.0 984.3 37.12017. . . . . . . . . . . . . . . . . . . . . . . 44.9 2.5 0.4 0.2 0.4 1.3 4.4 12.3 30.3 76.4 263.1 993.5 37.62016. . . . . . . . . . . . . . . . . . . . . . . 44.0 3.1 0.3 0.2 0.3 1.3 4.6 12.5 29.7 76.0 265.5 972.9 37.32015. . . . . . . . . . . . . . . . . . . . . . . 43.7 2.2 0.3 0.2 0.4 1.3 4.4 12.3 29.6 75.5 273.0 975.8 37.62014. . . . . . . . . . . . . . . . . . . . . . . 41.7 2.4 0.2 0.2 0.4 1.3 4.3 12.3 29.3 74.5 265.7 929.7 36.52013. . . . . . . . . . . . . . . . . . . . . . . 40.8 2.7 0.2 0.2 0.3 1.2 4.2 12.4 28.9 74.2 268.9 906.0 36.22012. . . . . . . . . . . . . . . . . . . . . . . 40.9 2.6 0.3 0.2 0.4 1.3 4.3 12.8 28.7 75.7 272.2 931.2 36.92011. . . . . . . . . . . . . . . . . . . . . . . 41.4 3.4 0.3 0.2 0.4 1.3 4.2 12.8 29.4 78.2 285.4 943.7 37.92010. . . . . . . . . . . . . . . . . . . . . . . 41.9 3.3 0.3 0.2 0.4 1.3 4.6 13.1 29.3 81.7 288.3 993.8 39.12009. . . . . . . . . . . . . . . . . . . . . . . 42.0 3.7 0.3 0.2 0.4 1.3 4.6 13.7 29.7 82.8 294.9 992.2 39.62008. . . . . . . . . . . . . . . . . . . . . . . 44.1 3.4 0.4 0.2 0.4 1.3 4.8 13.7 30.6 87.3 313.3 1,071.0 42.12007. . . . . . . . . . . . . . . . . . . . . . . 45.1 3.2 0.3 0.2 0.5 1.3 5.0 14.5 31.7 91.4 320.8 1,110.7 43.52006. . . . . . . . . . . . . . . . . . . . . . . 46.0 3.5 0.3 0.2 0.5 1.3 5.1 14.6 32.9 94.9 333.9 1,131.7 44.82005. . . . . . . . . . . . . . . . . . . . . . . 48.6 3.1 0.4 0.2 0.5 1.4 5.2 15.0 32.7 99.8 358.4 1,239.7 48.02004. . . . . . . . . . . . . . . . . . . . . . . 51.3 3.2 0.3 0.2 0.5 1.4 5.4 14.8 34.0 106.6 385.6 1,331.9 51.22003. . . . . . . . . . . . . . . . . . . . . . . 54.4 2.5 0.3 0.2 0.5 1.5 5.6 15.0 35.5 111.9 409.8 1,446.0 54.62002. . . . . . . . . . . . . . . . . . . . . . . 56.6 3.0 0.3 0.2 0.4 1.4 5.4 15.1 37.1 119.6 430.0 1,520.1 57.22001. . . . . . . . . . . . . . . . . . . . . . . 57.4 2.7 0.4 0.2 0.5 1.5 5.5 15.0 38.3 122.9 443.3 1,532.0 58.42000. . . . . . . . . . . . . . . . . . . . . . . 59.6 3.3 0.3 0.2 0.5 1.5 5.8 16.0 41.0 128.6 461.3 1,589.2 60.91999. . . . . . . . . . . . . . . . . . . . . . . 60.0 2.7 0.3 0.2 0.5 1.4 5.7 15.2 40.6 130.8 469.8 1,614.8 61.6
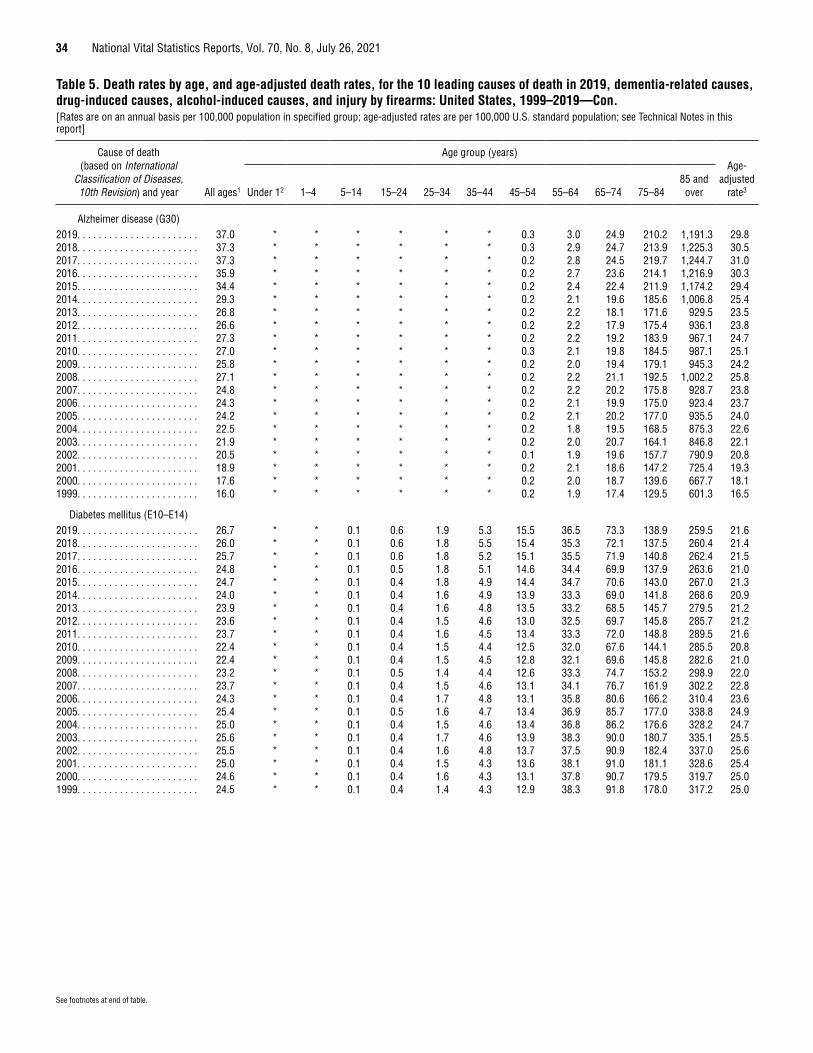
34 National Vital Statistics Reports, Vol. 70, No. 8, July 26, 2021
See footnotes at end of table.
Table 5. Death rates by age, and age-adjusted death rates, for the 10 leading causes of death in 2019, dementia-related causes, drug-induced causes, alcohol-induced causes, and injury by firearms: United States, 1999–2019—Con.[Rates are on an annual basis per 100,000 population in specified group; age-adjusted rates are per 100,000 U.S. standard population; see Technical Notes in this report]
Cause of death (based on International
Classification of Diseases, 10th Revision) and year All ages1
Age group (years)Age-
adjusted rate3 Under 12 1–4 5–14 15–24 25–34 35–44 45–54 55–64 65–74 75–84
85 and over
Alzheimer disease (G30)2019. . . . . . . . . . . . . . . . . . . . . . . 37.0 * * * * * * 0.3 3.0 24.9 210.2 1,191.3 29.82018. . . . . . . . . . . . . . . . . . . . . . . 37.3 * * * * * * 0.3 2.9 24.7 213.9 1,225.3 30.52017. . . . . . . . . . . . . . . . . . . . . . . 37.3 * * * * * * 0.2 2.8 24.5 219.7 1,244.7 31.02016. . . . . . . . . . . . . . . . . . . . . . . 35.9 * * * * * * 0.2 2.7 23.6 214.1 1,216.9 30.32015. . . . . . . . . . . . . . . . . . . . . . . 34.4 * * * * * * 0.2 2.4 22.4 211.9 1,174.2 29.42014. . . . . . . . . . . . . . . . . . . . . . . 29.3 * * * * * * 0.2 2.1 19.6 185.6 1,006.8 25.42013. . . . . . . . . . . . . . . . . . . . . . . 26.8 * * * * * * 0.2 2.2 18.1 171.6 929.5 23.52012. . . . . . . . . . . . . . . . . . . . . . . 26.6 * * * * * * 0.2 2.2 17.9 175.4 936.1 23.82011. . . . . . . . . . . . . . . . . . . . . . . 27.3 * * * * * * 0.2 2.2 19.2 183.9 967.1 24.72010. . . . . . . . . . . . . . . . . . . . . . . 27.0 * * * * * * 0.3 2.1 19.8 184.5 987.1 25.12009. . . . . . . . . . . . . . . . . . . . . . . 25.8 * * * * * * 0.2 2.0 19.4 179.1 945.3 24.22008. . . . . . . . . . . . . . . . . . . . . . . 27.1 * * * * * * 0.2 2.2 21.1 192.5 1,002.2 25.82007. . . . . . . . . . . . . . . . . . . . . . . 24.8 * * * * * * 0.2 2.2 20.2 175.8 928.7 23.82006. . . . . . . . . . . . . . . . . . . . . . . 24.3 * * * * * * 0.2 2.1 19.9 175.0 923.4 23.72005. . . . . . . . . . . . . . . . . . . . . . . 24.2 * * * * * * 0.2 2.1 20.2 177.0 935.5 24.02004. . . . . . . . . . . . . . . . . . . . . . . 22.5 * * * * * * 0.2 1.8 19.5 168.5 875.3 22.62003. . . . . . . . . . . . . . . . . . . . . . . 21.9 * * * * * * 0.2 2.0 20.7 164.1 846.8 22.12002. . . . . . . . . . . . . . . . . . . . . . . 20.5 * * * * * * 0.1 1.9 19.6 157.7 790.9 20.82001. . . . . . . . . . . . . . . . . . . . . . . 18.9 * * * * * * 0.2 2.1 18.6 147.2 725.4 19.32000. . . . . . . . . . . . . . . . . . . . . . . 17.6 * * * * * * 0.2 2.0 18.7 139.6 667.7 18.11999. . . . . . . . . . . . . . . . . . . . . . . 16.0 * * * * * * 0.2 1.9 17.4 129.5 601.3 16.5
Diabetes mellitus (E10–E14)2019. . . . . . . . . . . . . . . . . . . . . . . 26.7 * * 0.1 0.6 1.9 5.3 15.5 36.5 73.3 138.9 259.5 21.62018. . . . . . . . . . . . . . . . . . . . . . . 26.0 * * 0.1 0.6 1.8 5.5 15.4 35.3 72.1 137.5 260.4 21.42017. . . . . . . . . . . . . . . . . . . . . . . 25.7 * * 0.1 0.6 1.8 5.2 15.1 35.5 71.9 140.8 262.4 21.52016. . . . . . . . . . . . . . . . . . . . . . . 24.8 * * 0.1 0.5 1.8 5.1 14.6 34.4 69.9 137.9 263.6 21.02015. . . . . . . . . . . . . . . . . . . . . . . 24.7 * * 0.1 0.4 1.8 4.9 14.4 34.7 70.6 143.0 267.0 21.32014. . . . . . . . . . . . . . . . . . . . . . . 24.0 * * 0.1 0.4 1.6 4.9 13.9 33.3 69.0 141.8 268.6 20.92013. . . . . . . . . . . . . . . . . . . . . . . 23.9 * * 0.1 0.4 1.6 4.8 13.5 33.2 68.5 145.7 279.5 21.22012. . . . . . . . . . . . . . . . . . . . . . . 23.6 * * 0.1 0.4 1.5 4.6 13.0 32.5 69.7 145.8 285.7 21.22011. . . . . . . . . . . . . . . . . . . . . . . 23.7 * * 0.1 0.4 1.6 4.5 13.4 33.3 72.0 148.8 289.5 21.62010. . . . . . . . . . . . . . . . . . . . . . . 22.4 * * 0.1 0.4 1.5 4.4 12.5 32.0 67.6 144.1 285.5 20.82009. . . . . . . . . . . . . . . . . . . . . . . 22.4 * * 0.1 0.4 1.5 4.5 12.8 32.1 69.6 145.8 282.6 21.02008. . . . . . . . . . . . . . . . . . . . . . . 23.2 * * 0.1 0.5 1.4 4.4 12.6 33.3 74.7 153.2 298.9 22.02007. . . . . . . . . . . . . . . . . . . . . . . 23.7 * * 0.1 0.4 1.5 4.6 13.1 34.1 76.7 161.9 302.2 22.82006. . . . . . . . . . . . . . . . . . . . . . . 24.3 * * 0.1 0.4 1.7 4.8 13.1 35.8 80.6 166.2 310.4 23.62005. . . . . . . . . . . . . . . . . . . . . . . 25.4 * * 0.1 0.5 1.6 4.7 13.4 36.9 85.7 177.0 338.8 24.92004. . . . . . . . . . . . . . . . . . . . . . . 25.0 * * 0.1 0.4 1.5 4.6 13.4 36.8 86.2 176.6 328.2 24.72003. . . . . . . . . . . . . . . . . . . . . . . 25.6 * * 0.1 0.4 1.7 4.6 13.9 38.3 90.0 180.7 335.1 25.52002. . . . . . . . . . . . . . . . . . . . . . . 25.5 * * 0.1 0.4 1.6 4.8 13.7 37.5 90.9 182.4 337.0 25.62001. . . . . . . . . . . . . . . . . . . . . . . 25.0 * * 0.1 0.4 1.5 4.3 13.6 38.1 91.0 181.1 328.6 25.42000. . . . . . . . . . . . . . . . . . . . . . . 24.6 * * 0.1 0.4 1.6 4.3 13.1 37.8 90.7 179.5 319.7 25.01999. . . . . . . . . . . . . . . . . . . . . . . 24.5 * * 0.1 0.4 1.4 4.3 12.9 38.3 91.8 178.0 317.2 25.0
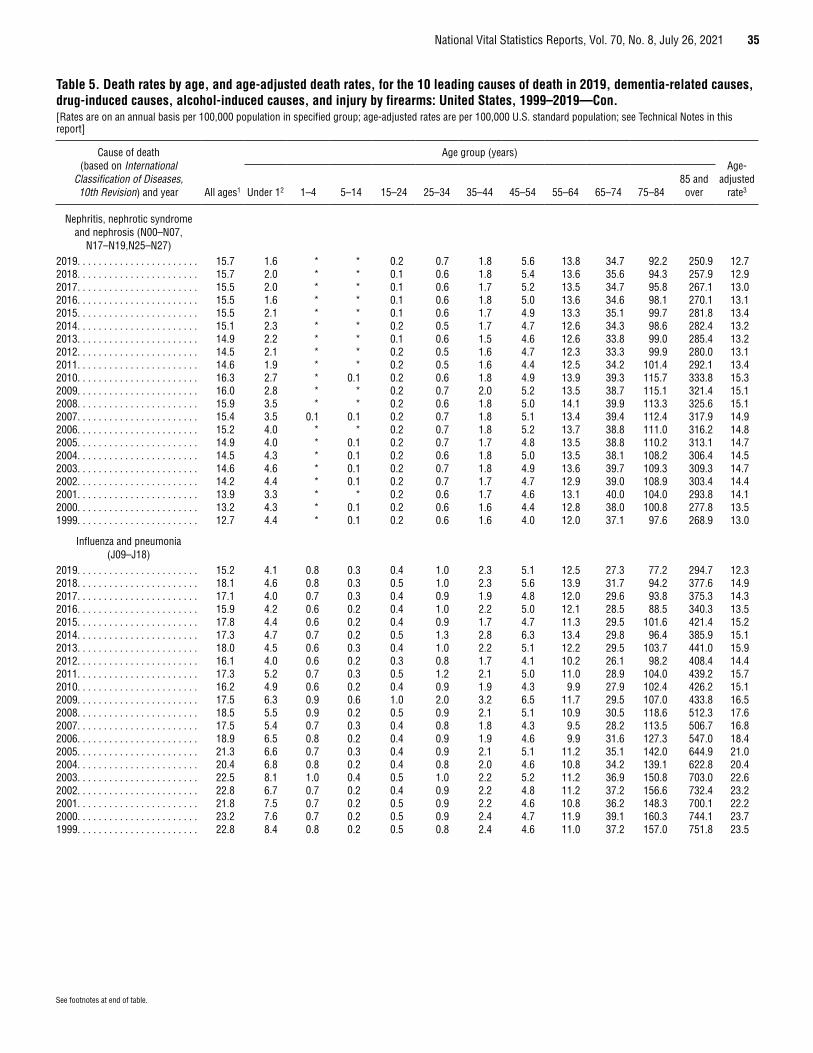
National Vital Statistics Reports, Vol. 70, No. 8, July 26, 2021 35
See footnotes at end of table.
Table 5. Death rates by age, and age-adjusted death rates, for the 10 leading causes of death in 2019, dementia-related causes, drug-induced causes, alcohol-induced causes, and injury by firearms: United States, 1999–2019—Con.[Rates are on an annual basis per 100,000 population in specified group; age-adjusted rates are per 100,000 U.S. standard population; see Technical Notes in this report]
Cause of death (based on International
Classification of Diseases, 10th Revision) and year All ages1
Age group (years)Age-
adjusted rate3 Under 12 1–4 5–14 15–24 25–34 35–44 45–54 55–64 65–74 75–84
85 and over
Nephritis, nephrotic syndrome and nephrosis (N00–N07,
N17–N19,N25–N27)2019. . . . . . . . . . . . . . . . . . . . . . . 15.7 1.6 * * 0.2 0.7 1.8 5.6 13.8 34.7 92.2 250.9 12.72018. . . . . . . . . . . . . . . . . . . . . . . 15.7 2.0 * * 0.1 0.6 1.8 5.4 13.6 35.6 94.3 257.9 12.92017. . . . . . . . . . . . . . . . . . . . . . . 15.5 2.0 * * 0.1 0.6 1.7 5.2 13.5 34.7 95.8 267.1 13.02016. . . . . . . . . . . . . . . . . . . . . . . 15.5 1.6 * * 0.1 0.6 1.8 5.0 13.6 34.6 98.1 270.1 13.12015. . . . . . . . . . . . . . . . . . . . . . . 15.5 2.1 * * 0.1 0.6 1.7 4.9 13.3 35.1 99.7 281.8 13.42014. . . . . . . . . . . . . . . . . . . . . . . 15.1 2.3 * * 0.2 0.5 1.7 4.7 12.6 34.3 98.6 282.4 13.22013. . . . . . . . . . . . . . . . . . . . . . . 14.9 2.2 * * 0.1 0.6 1.5 4.6 12.6 33.8 99.0 285.4 13.22012. . . . . . . . . . . . . . . . . . . . . . . 14.5 2.1 * * 0.2 0.5 1.6 4.7 12.3 33.3 99.9 280.0 13.12011. . . . . . . . . . . . . . . . . . . . . . . 14.6 1.9 * * 0.2 0.5 1.6 4.4 12.5 34.2 101.4 292.1 13.42010. . . . . . . . . . . . . . . . . . . . . . . 16.3 2.7 * 0.1 0.2 0.6 1.8 4.9 13.9 39.3 115.7 333.8 15.32009. . . . . . . . . . . . . . . . . . . . . . . 16.0 2.8 * * 0.2 0.7 2.0 5.2 13.5 38.7 115.1 321.4 15.12008. . . . . . . . . . . . . . . . . . . . . . . 15.9 3.5 * * 0.2 0.6 1.8 5.0 14.1 39.9 113.3 325.6 15.12007. . . . . . . . . . . . . . . . . . . . . . . 15.4 3.5 0.1 0.1 0.2 0.7 1.8 5.1 13.4 39.4 112.4 317.9 14.92006. . . . . . . . . . . . . . . . . . . . . . . 15.2 4.0 * * 0.2 0.7 1.8 5.2 13.7 38.8 111.0 316.2 14.82005. . . . . . . . . . . . . . . . . . . . . . . 14.9 4.0 * 0.1 0.2 0.7 1.7 4.8 13.5 38.8 110.2 313.1 14.72004. . . . . . . . . . . . . . . . . . . . . . . 14.5 4.3 * 0.1 0.2 0.6 1.8 5.0 13.5 38.1 108.2 306.4 14.52003. . . . . . . . . . . . . . . . . . . . . . . 14.6 4.6 * 0.1 0.2 0.7 1.8 4.9 13.6 39.7 109.3 309.3 14.72002. . . . . . . . . . . . . . . . . . . . . . . 14.2 4.4 * 0.1 0.2 0.7 1.7 4.7 12.9 39.0 108.9 303.4 14.42001. . . . . . . . . . . . . . . . . . . . . . . 13.9 3.3 * * 0.2 0.6 1.7 4.6 13.1 40.0 104.0 293.8 14.12000. . . . . . . . . . . . . . . . . . . . . . . 13.2 4.3 * 0.1 0.2 0.6 1.6 4.4 12.8 38.0 100.8 277.8 13.51999. . . . . . . . . . . . . . . . . . . . . . . 12.7 4.4 * 0.1 0.2 0.6 1.6 4.0 12.0 37.1 97.6 268.9 13.0
Influenza and pneumonia (J09–J18)
2019. . . . . . . . . . . . . . . . . . . . . . . 15.2 4.1 0.8 0.3 0.4 1.0 2.3 5.1 12.5 27.3 77.2 294.7 12.32018. . . . . . . . . . . . . . . . . . . . . . . 18.1 4.6 0.8 0.3 0.5 1.0 2.3 5.6 13.9 31.7 94.2 377.6 14.92017. . . . . . . . . . . . . . . . . . . . . . . 17.1 4.0 0.7 0.3 0.4 0.9 1.9 4.8 12.0 29.6 93.8 375.3 14.32016. . . . . . . . . . . . . . . . . . . . . . . 15.9 4.2 0.6 0.2 0.4 1.0 2.2 5.0 12.1 28.5 88.5 340.3 13.52015. . . . . . . . . . . . . . . . . . . . . . . 17.8 4.4 0.6 0.2 0.4 0.9 1.7 4.7 11.3 29.5 101.6 421.4 15.22014. . . . . . . . . . . . . . . . . . . . . . . 17.3 4.7 0.7 0.2 0.5 1.3 2.8 6.3 13.4 29.8 96.4 385.9 15.12013. . . . . . . . . . . . . . . . . . . . . . . 18.0 4.5 0.6 0.3 0.4 1.0 2.2 5.1 12.2 29.5 103.7 441.0 15.92012. . . . . . . . . . . . . . . . . . . . . . . 16.1 4.0 0.6 0.2 0.3 0.8 1.7 4.1 10.2 26.1 98.2 408.4 14.42011. . . . . . . . . . . . . . . . . . . . . . . 17.3 5.2 0.7 0.3 0.5 1.2 2.1 5.0 11.0 28.9 104.0 439.2 15.72010. . . . . . . . . . . . . . . . . . . . . . . 16.2 4.9 0.6 0.2 0.4 0.9 1.9 4.3 9.9 27.9 102.4 426.2 15.12009. . . . . . . . . . . . . . . . . . . . . . . 17.5 6.3 0.9 0.6 1.0 2.0 3.2 6.5 11.7 29.5 107.0 433.8 16.52008. . . . . . . . . . . . . . . . . . . . . . . 18.5 5.5 0.9 0.2 0.5 0.9 2.1 5.1 10.9 30.5 118.6 512.3 17.62007. . . . . . . . . . . . . . . . . . . . . . . 17.5 5.4 0.7 0.3 0.4 0.8 1.8 4.3 9.5 28.2 113.5 506.7 16.82006. . . . . . . . . . . . . . . . . . . . . . . 18.9 6.5 0.8 0.2 0.4 0.9 1.9 4.6 9.9 31.6 127.3 547.0 18.42005. . . . . . . . . . . . . . . . . . . . . . . 21.3 6.6 0.7 0.3 0.4 0.9 2.1 5.1 11.2 35.1 142.0 644.9 21.02004. . . . . . . . . . . . . . . . . . . . . . . 20.4 6.8 0.8 0.2 0.4 0.8 2.0 4.6 10.8 34.2 139.1 622.8 20.42003. . . . . . . . . . . . . . . . . . . . . . . 22.5 8.1 1.0 0.4 0.5 1.0 2.2 5.2 11.2 36.9 150.8 703.0 22.62002. . . . . . . . . . . . . . . . . . . . . . . 22.8 6.7 0.7 0.2 0.4 0.9 2.2 4.8 11.2 37.2 156.6 732.4 23.22001. . . . . . . . . . . . . . . . . . . . . . . 21.8 7.5 0.7 0.2 0.5 0.9 2.2 4.6 10.8 36.2 148.3 700.1 22.22000. . . . . . . . . . . . . . . . . . . . . . . 23.2 7.6 0.7 0.2 0.5 0.9 2.4 4.7 11.9 39.1 160.3 744.1 23.71999. . . . . . . . . . . . . . . . . . . . . . . 22.8 8.4 0.8 0.2 0.5 0.8 2.4 4.6 11.0 37.2 157.0 751.8 23.5
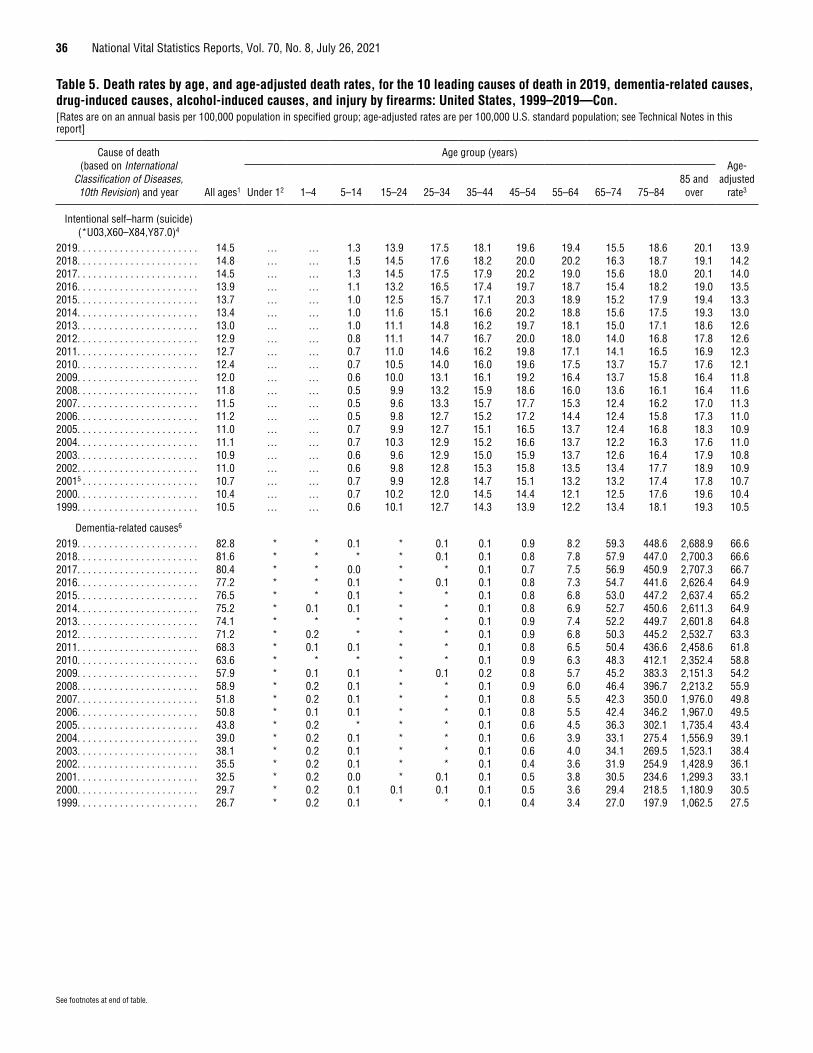
36 National Vital Statistics Reports, Vol. 70, No. 8, July 26, 2021
See footnotes at end of table.
Table 5. Death rates by age, and age-adjusted death rates, for the 10 leading causes of death in 2019, dementia-related causes, drug-induced causes, alcohol-induced causes, and injury by firearms: United States, 1999–2019—Con.[Rates are on an annual basis per 100,000 population in specified group; age-adjusted rates are per 100,000 U.S. standard population; see Technical Notes in this report]
Cause of death (based on International
Classification of Diseases, 10th Revision) and year All ages1
Age group (years)Age-
adjusted rate3 Under 12 1–4 5–14 15–24 25–34 35–44 45–54 55–64 65–74 75–84
85 and over
Intentional self–harm (suicide) (*U03,X60–X84,Y87.0)4
2019. . . . . . . . . . . . . . . . . . . . . . . 14.5 … … 1.3 13.9 17.5 18.1 19.6 19.4 15.5 18.6 20.1 13.92018. . . . . . . . . . . . . . . . . . . . . . . 14.8 … … 1.5 14.5 17.6 18.2 20.0 20.2 16.3 18.7 19.1 14.22017. . . . . . . . . . . . . . . . . . . . . . . 14.5 … … 1.3 14.5 17.5 17.9 20.2 19.0 15.6 18.0 20.1 14.02016. . . . . . . . . . . . . . . . . . . . . . . 13.9 … … 1.1 13.2 16.5 17.4 19.7 18.7 15.4 18.2 19.0 13.52015. . . . . . . . . . . . . . . . . . . . . . . 13.7 … … 1.0 12.5 15.7 17.1 20.3 18.9 15.2 17.9 19.4 13.32014. . . . . . . . . . . . . . . . . . . . . . . 13.4 … … 1.0 11.6 15.1 16.6 20.2 18.8 15.6 17.5 19.3 13.02013. . . . . . . . . . . . . . . . . . . . . . . 13.0 … … 1.0 11.1 14.8 16.2 19.7 18.1 15.0 17.1 18.6 12.62012. . . . . . . . . . . . . . . . . . . . . . . 12.9 … … 0.8 11.1 14.7 16.7 20.0 18.0 14.0 16.8 17.8 12.62011. . . . . . . . . . . . . . . . . . . . . . . 12.7 … … 0.7 11.0 14.6 16.2 19.8 17.1 14.1 16.5 16.9 12.32010. . . . . . . . . . . . . . . . . . . . . . . 12.4 … … 0.7 10.5 14.0 16.0 19.6 17.5 13.7 15.7 17.6 12.12009. . . . . . . . . . . . . . . . . . . . . . . 12.0 … … 0.6 10.0 13.1 16.1 19.2 16.4 13.7 15.8 16.4 11.82008. . . . . . . . . . . . . . . . . . . . . . . 11.8 … … 0.5 9.9 13.2 15.9 18.6 16.0 13.6 16.1 16.4 11.62007. . . . . . . . . . . . . . . . . . . . . . . 11.5 … … 0.5 9.6 13.3 15.7 17.7 15.3 12.4 16.2 17.0 11.32006. . . . . . . . . . . . . . . . . . . . . . . 11.2 … … 0.5 9.8 12.7 15.2 17.2 14.4 12.4 15.8 17.3 11.02005. . . . . . . . . . . . . . . . . . . . . . . 11.0 … … 0.7 9.9 12.7 15.1 16.5 13.7 12.4 16.8 18.3 10.92004. . . . . . . . . . . . . . . . . . . . . . . 11.1 … … 0.7 10.3 12.9 15.2 16.6 13.7 12.2 16.3 17.6 11.02003. . . . . . . . . . . . . . . . . . . . . . . 10.9 … … 0.6 9.6 12.9 15.0 15.9 13.7 12.6 16.4 17.9 10.82002. . . . . . . . . . . . . . . . . . . . . . . 11.0 … … 0.6 9.8 12.8 15.3 15.8 13.5 13.4 17.7 18.9 10.920015 . . . . . . . . . . . . . . . . . . . . . . 10.7 … … 0.7 9.9 12.8 14.7 15.1 13.2 13.2 17.4 17.8 10.72000. . . . . . . . . . . . . . . . . . . . . . . 10.4 … … 0.7 10.2 12.0 14.5 14.4 12.1 12.5 17.6 19.6 10.41999. . . . . . . . . . . . . . . . . . . . . . . 10.5 … … 0.6 10.1 12.7 14.3 13.9 12.2 13.4 18.1 19.3 10.5
Dementia-related causes6
2019. . . . . . . . . . . . . . . . . . . . . . . 82.8 * * 0.1 * 0.1 0.1 0.9 8.2 59.3 448.6 2,688.9 66.62018. . . . . . . . . . . . . . . . . . . . . . . 81.6 * * * * 0.1 0.1 0.8 7.8 57.9 447.0 2,700.3 66.62017. . . . . . . . . . . . . . . . . . . . . . . 80.4 * * 0.0 * * 0.1 0.7 7.5 56.9 450.9 2,707.3 66.72016. . . . . . . . . . . . . . . . . . . . . . . 77.2 * * 0.1 * 0.1 0.1 0.8 7.3 54.7 441.6 2,626.4 64.92015. . . . . . . . . . . . . . . . . . . . . . . 76.5 * * 0.1 * * 0.1 0.8 6.8 53.0 447.2 2,637.4 65.22014. . . . . . . . . . . . . . . . . . . . . . . 75.2 * 0.1 0.1 * * 0.1 0.8 6.9 52.7 450.6 2,611.3 64.92013. . . . . . . . . . . . . . . . . . . . . . . 74.1 * * * * * 0.1 0.9 7.4 52.2 449.7 2,601.8 64.82012. . . . . . . . . . . . . . . . . . . . . . . 71.2 * 0.2 * * * 0.1 0.9 6.8 50.3 445.2 2,532.7 63.32011. . . . . . . . . . . . . . . . . . . . . . . 68.3 * 0.1 0.1 * * 0.1 0.8 6.5 50.4 436.6 2,458.6 61.82010. . . . . . . . . . . . . . . . . . . . . . . 63.6 * * * * * 0.1 0.9 6.3 48.3 412.1 2,352.4 58.82009. . . . . . . . . . . . . . . . . . . . . . . 57.9 * 0.1 0.1 * 0.1 0.2 0.8 5.7 45.2 383.3 2,151.3 54.22008. . . . . . . . . . . . . . . . . . . . . . . 58.9 * 0.2 0.1 * * 0.1 0.9 6.0 46.4 396.7 2,213.2 55.92007. . . . . . . . . . . . . . . . . . . . . . . 51.8 * 0.2 0.1 * * 0.1 0.8 5.5 42.3 350.0 1,976.0 49.82006. . . . . . . . . . . . . . . . . . . . . . . 50.8 * 0.1 0.1 * * 0.1 0.8 5.5 42.4 346.2 1,967.0 49.52005. . . . . . . . . . . . . . . . . . . . . . . 43.8 * 0.2 * * * 0.1 0.6 4.5 36.3 302.1 1,735.4 43.42004. . . . . . . . . . . . . . . . . . . . . . . 39.0 * 0.2 0.1 * * 0.1 0.6 3.9 33.1 275.4 1,556.9 39.12003. . . . . . . . . . . . . . . . . . . . . . . 38.1 * 0.2 0.1 * * 0.1 0.6 4.0 34.1 269.5 1,523.1 38.42002. . . . . . . . . . . . . . . . . . . . . . . 35.5 * 0.2 0.1 * * 0.1 0.4 3.6 31.9 254.9 1,428.9 36.12001. . . . . . . . . . . . . . . . . . . . . . . 32.5 * 0.2 0.0 * 0.1 0.1 0.5 3.8 30.5 234.6 1,299.3 33.12000. . . . . . . . . . . . . . . . . . . . . . . 29.7 * 0.2 0.1 0.1 0.1 0.1 0.5 3.6 29.4 218.5 1,180.9 30.51999. . . . . . . . . . . . . . . . . . . . . . . 26.7 * 0.2 0.1 * * 0.1 0.4 3.4 27.0 197.9 1,062.5 27.5
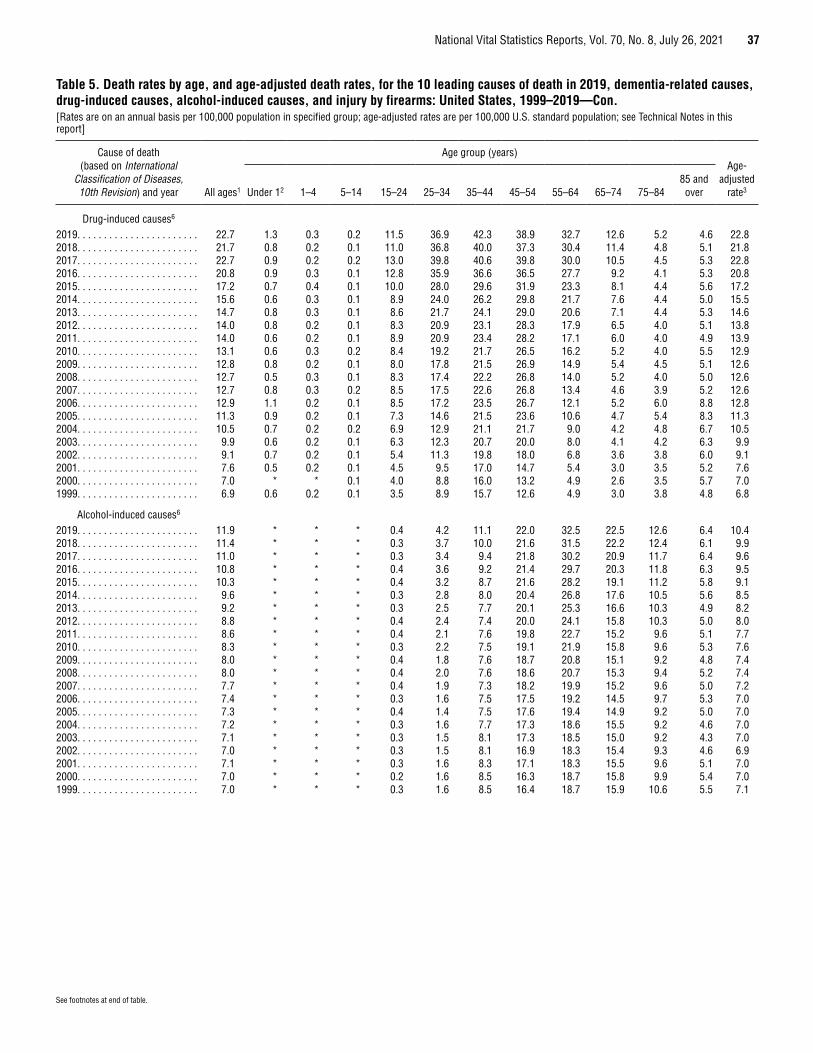
National Vital Statistics Reports, Vol. 70, No. 8, July 26, 2021 37
See footnotes at end of table.
Table 5. Death rates by age, and age-adjusted death rates, for the 10 leading causes of death in 2019, dementia-related causes, drug-induced causes, alcohol-induced causes, and injury by firearms: United States, 1999–2019—Con.[Rates are on an annual basis per 100,000 population in specified group; age-adjusted rates are per 100,000 U.S. standard population; see Technical Notes in this report]
Cause of death (based on International
Classification of Diseases, 10th Revision) and year All ages1
Age group (years)Age-
adjusted rate3 Under 12 1–4 5–14 15–24 25–34 35–44 45–54 55–64 65–74 75–84
85 and over
Drug-induced causes6
2019. . . . . . . . . . . . . . . . . . . . . . . 22.7 1.3 0.3 0.2 11.5 36.9 42.3 38.9 32.7 12.6 5.2 4.6 22.82018. . . . . . . . . . . . . . . . . . . . . . . 21.7 0.8 0.2 0.1 11.0 36.8 40.0 37.3 30.4 11.4 4.8 5.1 21.82017. . . . . . . . . . . . . . . . . . . . . . . 22.7 0.9 0.2 0.2 13.0 39.8 40.6 39.8 30.0 10.5 4.5 5.3 22.82016. . . . . . . . . . . . . . . . . . . . . . . 20.8 0.9 0.3 0.1 12.8 35.9 36.6 36.5 27.7 9.2 4.1 5.3 20.82015. . . . . . . . . . . . . . . . . . . . . . . 17.2 0.7 0.4 0.1 10.0 28.0 29.6 31.9 23.3 8.1 4.4 5.6 17.22014. . . . . . . . . . . . . . . . . . . . . . . 15.6 0.6 0.3 0.1 8.9 24.0 26.2 29.8 21.7 7.6 4.4 5.0 15.52013. . . . . . . . . . . . . . . . . . . . . . . 14.7 0.8 0.3 0.1 8.6 21.7 24.1 29.0 20.6 7.1 4.4 5.3 14.62012. . . . . . . . . . . . . . . . . . . . . . . 14.0 0.8 0.2 0.1 8.3 20.9 23.1 28.3 17.9 6.5 4.0 5.1 13.82011. . . . . . . . . . . . . . . . . . . . . . . 14.0 0.6 0.2 0.1 8.9 20.9 23.4 28.2 17.1 6.0 4.0 4.9 13.92010. . . . . . . . . . . . . . . . . . . . . . . 13.1 0.6 0.3 0.2 8.4 19.2 21.7 26.5 16.2 5.2 4.0 5.5 12.92009. . . . . . . . . . . . . . . . . . . . . . . 12.8 0.8 0.2 0.1 8.0 17.8 21.5 26.9 14.9 5.4 4.5 5.1 12.62008. . . . . . . . . . . . . . . . . . . . . . . 12.7 0.5 0.3 0.1 8.3 17.4 22.2 26.8 14.0 5.2 4.0 5.0 12.62007. . . . . . . . . . . . . . . . . . . . . . . 12.7 0.8 0.3 0.2 8.5 17.5 22.6 26.8 13.4 4.6 3.9 5.2 12.62006. . . . . . . . . . . . . . . . . . . . . . . 12.9 1.1 0.2 0.1 8.5 17.2 23.5 26.7 12.1 5.2 6.0 8.8 12.82005. . . . . . . . . . . . . . . . . . . . . . . 11.3 0.9 0.2 0.1 7.3 14.6 21.5 23.6 10.6 4.7 5.4 8.3 11.32004. . . . . . . . . . . . . . . . . . . . . . . 10.5 0.7 0.2 0.2 6.9 12.9 21.1 21.7 9.0 4.2 4.8 6.7 10.52003. . . . . . . . . . . . . . . . . . . . . . . 9.9 0.6 0.2 0.1 6.3 12.3 20.7 20.0 8.0 4.1 4.2 6.3 9.92002. . . . . . . . . . . . . . . . . . . . . . . 9.1 0.7 0.2 0.1 5.4 11.3 19.8 18.0 6.8 3.6 3.8 6.0 9.12001. . . . . . . . . . . . . . . . . . . . . . . 7.6 0.5 0.2 0.1 4.5 9.5 17.0 14.7 5.4 3.0 3.5 5.2 7.62000. . . . . . . . . . . . . . . . . . . . . . . 7.0 * * 0.1 4.0 8.8 16.0 13.2 4.9 2.6 3.5 5.7 7.01999. . . . . . . . . . . . . . . . . . . . . . . 6.9 0.6 0.2 0.1 3.5 8.9 15.7 12.6 4.9 3.0 3.8 4.8 6.8
Alcohol-induced causes6
2019. . . . . . . . . . . . . . . . . . . . . . . 11.9 * * * 0.4 4.2 11.1 22.0 32.5 22.5 12.6 6.4 10.42018. . . . . . . . . . . . . . . . . . . . . . . 11.4 * * * 0.3 3.7 10.0 21.6 31.5 22.2 12.4 6.1 9.92017. . . . . . . . . . . . . . . . . . . . . . . 11.0 * * * 0.3 3.4 9.4 21.8 30.2 20.9 11.7 6.4 9.62016. . . . . . . . . . . . . . . . . . . . . . . 10.8 * * * 0.4 3.6 9.2 21.4 29.7 20.3 11.8 6.3 9.52015. . . . . . . . . . . . . . . . . . . . . . . 10.3 * * * 0.4 3.2 8.7 21.6 28.2 19.1 11.2 5.8 9.12014. . . . . . . . . . . . . . . . . . . . . . . 9.6 * * * 0.3 2.8 8.0 20.4 26.8 17.6 10.5 5.6 8.52013. . . . . . . . . . . . . . . . . . . . . . . 9.2 * * * 0.3 2.5 7.7 20.1 25.3 16.6 10.3 4.9 8.22012. . . . . . . . . . . . . . . . . . . . . . . 8.8 * * * 0.4 2.4 7.4 20.0 24.1 15.8 10.3 5.0 8.02011. . . . . . . . . . . . . . . . . . . . . . . 8.6 * * * 0.4 2.1 7.6 19.8 22.7 15.2 9.6 5.1 7.72010. . . . . . . . . . . . . . . . . . . . . . . 8.3 * * * 0.3 2.2 7.5 19.1 21.9 15.8 9.6 5.3 7.62009. . . . . . . . . . . . . . . . . . . . . . . 8.0 * * * 0.4 1.8 7.6 18.7 20.8 15.1 9.2 4.8 7.42008. . . . . . . . . . . . . . . . . . . . . . . 8.0 * * * 0.4 2.0 7.6 18.6 20.7 15.3 9.4 5.2 7.42007. . . . . . . . . . . . . . . . . . . . . . . 7.7 * * * 0.4 1.9 7.3 18.2 19.9 15.2 9.6 5.0 7.22006. . . . . . . . . . . . . . . . . . . . . . . 7.4 * * * 0.3 1.6 7.5 17.5 19.2 14.5 9.7 5.3 7.02005. . . . . . . . . . . . . . . . . . . . . . . 7.3 * * * 0.4 1.4 7.5 17.6 19.4 14.9 9.2 5.0 7.02004. . . . . . . . . . . . . . . . . . . . . . . 7.2 * * * 0.3 1.6 7.7 17.3 18.6 15.5 9.2 4.6 7.02003. . . . . . . . . . . . . . . . . . . . . . . 7.1 * * * 0.3 1.5 8.1 17.3 18.5 15.0 9.2 4.3 7.02002. . . . . . . . . . . . . . . . . . . . . . . 7.0 * * * 0.3 1.5 8.1 16.9 18.3 15.4 9.3 4.6 6.92001. . . . . . . . . . . . . . . . . . . . . . . 7.1 * * * 0.3 1.6 8.3 17.1 18.3 15.5 9.6 5.1 7.02000. . . . . . . . . . . . . . . . . . . . . . . 7.0 * * * 0.2 1.6 8.5 16.3 18.7 15.8 9.9 5.4 7.01999. . . . . . . . . . . . . . . . . . . . . . . 7.0 * * * 0.3 1.6 8.5 16.4 18.7 15.9 10.6 5.5 7.1

38 National Vital Statistics Reports, Vol. 70, No. 8, July 26, 2021
Table 5. Death rates by age, and age-adjusted death rates, for the 10 leading causes of death in 2019, dementia-related causes, drug-induced causes, alcohol-induced causes, and injury by firearms: United States, 1999–2019—Con.[Rates are on an annual basis per 100,000 population in specified group; age-adjusted rates are per 100,000 U.S. standard population; see Technical Notes in this report]
Cause of death (based on International
Classification of Diseases, 10th Revision) and year All ages1
Age group (years)Age-
adjusted rate3 Under 12 1–4 5–14 15–24 25–34 35–44 45–54 55–64 65–74 75–84
85 and over
Injury by firearms6
2019. . . . . . . . . . . . . . . . . . . . . . . 12.1 * 0.5 1.0 17.4 18.1 14.6 12.7 12.3 11.1 15.0 16.1 11.92018. . . . . . . . . . . . . . . . . . . . . . . 12.1 * 0.6 1.1 17.2 17.7 14.6 12.8 12.7 12.0 15.4 14.7 11.92017. . . . . . . . . . . . . . . . . . . . . . . 12.2 * 0.5 1.1 17.7 18.5 14.4 13.1 12.3 11.4 14.8 15.6 12.02016. . . . . . . . . . . . . . . . . . . . . . . 12.0 * 0.6 0.9 17.2 18.2 14.5 12.8 11.9 11.4 14.7 14.3 11.82015. . . . . . . . . . . . . . . . . . . . . . . 11.3 * 0.5 0.9 15.7 16.8 13.1 12.4 11.7 11.3 14.5 14.5 11.12014. . . . . . . . . . . . . . . . . . . . . . . 10.5 * 0.4 0.9 14.0 14.7 12.1 12.2 11.4 11.5 13.9 15.0 10.32013. . . . . . . . . . . . . . . . . . . . . . . 10.6 * 0.4 0.8 14.1 15.3 12.3 12.3 11.5 11.3 14.1 13.9 10.42012. . . . . . . . . . . . . . . . . . . . . . . 10.7 * 0.4 0.8 14.7 15.3 12.4 12.4 11.6 10.8 14.1 13.6 10.52011. . . . . . . . . . . . . . . . . . . . . . . 10.4 * 0.5 0.8 14.4 15.0 11.7 12.2 11.0 10.9 13.7 13.1 10.22010. . . . . . . . . . . . . . . . . . . . . . . 10.3 * 0.4 0.7 14.2 15.0 11.7 12.0 11.1 10.7 12.7 13.2 10.12009. . . . . . . . . . . . . . . . . . . . . . . 10.2 * 0.4 0.7 14.4 14.5 11.9 11.8 10.8 10.9 13.3 12.5 10.12008. . . . . . . . . . . . . . . . . . . . . . . 10.4 * 0.5 0.7 15.4 15.4 11.8 11.5 10.8 10.7 13.2 12.5 10.32007. . . . . . . . . . . . . . . . . . . . . . . 10.4 * 0.4 0.8 16.0 15.9 12.0 11.1 10.1 9.8 13.1 12.7 10.32006. . . . . . . . . . . . . . . . . . . . . . . 10.4 * 0.4 0.9 16.7 15.7 11.6 11.2 9.7 9.9 12.9 12.5 10.32005. . . . . . . . . . . . . . . . . . . . . . . 10.4 * 0.4 0.8 16.1 16.1 11.7 11.2 9.7 10.2 13.6 13.0 10.32004. . . . . . . . . . . . . . . . . . . . . . . 10.1 * 0.3 0.7 15.6 15.3 11.4 11.0 9.8 10.1 13.3 12.7 10.02003. . . . . . . . . . . . . . . . . . . . . . . 10.4 * 0.3 0.8 16.5 15.8 11.6 11.1 10.0 10.3 13.4 13.2 10.32002. . . . . . . . . . . . . . . . . . . . . . . 10.5 * 0.4 0.8 16.6 15.6 12.2 10.8 10.2 10.8 14.4 13.2 10.52001. . . . . . . . . . . . . . . . . . . . . . . 10.4 * 0.5 0.8 16.6 15.5 11.7 10.5 10.1 10.9 14.3 13.1 10.32000. . . . . . . . . . . . . . . . . . . . . . . 10.2 * 0.3 0.9 16.8 14.5 11.9 10.5 9.4 10.6 13.9 14.2 10.21999. . . . . . . . . . . . . . . . . . . . . . . 10.3 * 0.4 1.0 17.6 14.9 11.6 10.2 9.7 11.0 14.2 13.5 10.3
* Estimate does not meet National Center for Health Statistics standards of reliability; see Technical Notes. … Category not applicable. 1Figures for age not stated included in “All ages” but not distributed among age groups. 2Death rates for “Under 1” (based on population estimates) differ from infant mortality rates (based on live births); see Technical Notes. 3For method of computation, see Technical Notes. 4Asterisks (*) preceding cause-of-death codes indicate they are not part of the International Classification of Diseases, 10th Revision (ICD–10); see Technical Notes. 5Figures include September 11, 2001-related deaths for which death certificates were filed as of October 24, 2002; see Technical Notes for “Deaths: Final Data for 2001,” Vital Statistics Reports vol 52 no 3. 6For the list of ICD–10 codes included, see Technical Notes.
SOURCE: National Center for Health Statistics, National Vital Statistics System, Mortality.
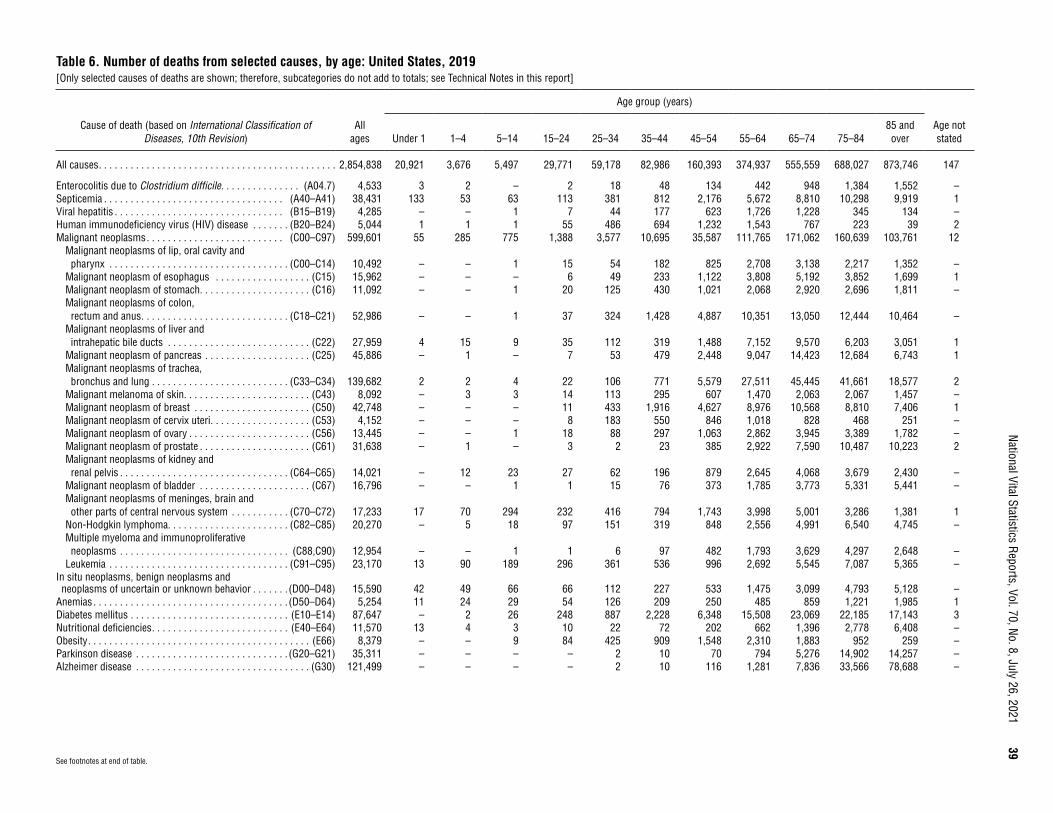
National Vital Statistics Reports, Vol. 70, No. 8, July 26, 2021
39
Table 6. Number of deaths from selected causes, by age: United States, 2019[Only selected causes of deaths are shown; therefore, subcategories do not add to totals; see Technical Notes in this report]
Cause of death (based on International Classification of Diseases, 10th Revision)
All ages
Age group (years)
Age not statedUnder 1 1–4 5–14 15–24 25–34 35–44 45–54 55–64 65–74 75–84
85 and over
All causes . . . . . . . . . . . . . . . . . . . . . . . . . . . . . . . . . . . . . . . . . . . . . 2,854,838 20,921 3,676 5,497 29,771 59,178 82,986 160,393 374,937 555,559 688,027 873,746 147
Enterocolitis due to Clostridium difficile . . . . . . . . . . . . . . . (A04.7) 4,533 3 2 – 2 18 48 134 442 948 1,384 1,552 –Septicemia . . . . . . . . . . . . . . . . . . . . . . . . . . . . . . . . . . (A40–A41) 38,431 133 53 63 113 381 812 2,176 5,672 8,810 10,298 9,919 1Viral hepatitis . . . . . . . . . . . . . . . . . . . . . . . . . . . . . . . . (B15–B19) 4,285 – – 1 7 44 177 623 1,726 1,228 345 134 –Human immunodeficiency virus (HIV) disease . . . . . . . (B20–B24) 5,044 1 1 1 55 486 694 1,232 1,543 767 223 39 2Malignant neoplasms . . . . . . . . . . . . . . . . . . . . . . . . . . (C00–C97) 599,601 55 285 775 1,388 3,577 10,695 35,587 111,765 171,062 160,639 103,761 12
Malignant neoplasms of lip, oral cavity and pharynx . . . . . . . . . . . . . . . . . . . . . . . . . . . . . . . . . . (C00–C14) 10,492 – – 1 15 54 182 825 2,708 3,138 2,217 1,352 –
Malignant neoplasm of esophagus . . . . . . . . . . . . . . . . . . (C15) 15,962 – – – 6 49 233 1,122 3,808 5,192 3,852 1,699 1Malignant neoplasm of stomach. . . . . . . . . . . . . . . . . . . . . (C16) 11,092 – – 1 20 125 430 1,021 2,068 2,920 2,696 1,811 –Malignant neoplasms of colon, rectum and anus . . . . . . . . . . . . . . . . . . . . . . . . . . . . (C18–C21) 52,986 – – 1 37 324 1,428 4,887 10,351 13,050 12,444 10,464 –
Malignant neoplasms of liver and intrahepatic bile ducts . . . . . . . . . . . . . . . . . . . . . . . . . . . (C22) 27,959 4 15 9 35 112 319 1,488 7,152 9,570 6,203 3,051 1
Malignant neoplasm of pancreas . . . . . . . . . . . . . . . . . . . . (C25) 45,886 – 1 – 7 53 479 2,448 9,047 14,423 12,684 6,743 1Malignant neoplasms of trachea, bronchus and lung . . . . . . . . . . . . . . . . . . . . . . . . . . (C33–C34) 139,682 2 2 4 22 106 771 5,579 27,511 45,445 41,661 18,577 2
Malignant melanoma of skin. . . . . . . . . . . . . . . . . . . . . . . . (C43) 8,092 – 3 3 14 113 295 607 1,470 2,063 2,067 1,457 –Malignant neoplasm of breast . . . . . . . . . . . . . . . . . . . . . . (C50) 42,748 – – – 11 433 1,916 4,627 8,976 10,568 8,810 7,406 1Malignant neoplasm of cervix uteri . . . . . . . . . . . . . . . . . . . (C53) 4,152 – – – 8 183 550 846 1,018 828 468 251 –Malignant neoplasm of ovary . . . . . . . . . . . . . . . . . . . . . . . (C56) 13,445 – – 1 18 88 297 1,063 2,862 3,945 3,389 1,782 –Malignant neoplasm of prostate . . . . . . . . . . . . . . . . . . . . . (C61) 31,638 – 1 – 3 2 23 385 2,922 7,590 10,487 10,223 2Malignant neoplasms of kidney and renal pelvis . . . . . . . . . . . . . . . . . . . . . . . . . . . . . . . . (C64–C65) 14,021 – 12 23 27 62 196 879 2,645 4,068 3,679 2,430 –
Malignant neoplasm of bladder . . . . . . . . . . . . . . . . . . . . . (C67) 16,796 – – 1 1 15 76 373 1,785 3,773 5,331 5,441 –Malignant neoplasms of meninges, brain and other parts of central nervous system . . . . . . . . . . . (C70–C72) 17,233 17 70 294 232 416 794 1,743 3,998 5,001 3,286 1,381 1
Non-Hodgkin lymphoma. . . . . . . . . . . . . . . . . . . . . . . (C82–C85) 20,270 – 5 18 97 151 319 848 2,556 4,991 6,540 4,745 –Multiple myeloma and immunoproliferative neoplasms . . . . . . . . . . . . . . . . . . . . . . . . . . . . . . . . (C88,C90) 12,954 – – 1 1 6 97 482 1,793 3,629 4,297 2,648 –
Leukemia . . . . . . . . . . . . . . . . . . . . . . . . . . . . . . . . . . (C91–C95) 23,170 13 90 189 296 361 536 996 2,692 5,545 7,087 5,365 –In situ neoplasms, benign neoplasms and neoplasms of uncertain or unknown behavior . . . . . . . (D00–D48) 15,590 42 49 66 66 112 227 533 1,475 3,099 4,793 5,128 –
Anemias . . . . . . . . . . . . . . . . . . . . . . . . . . . . . . . . . . . . . (D50–D64) 5,254 11 24 29 54 126 209 250 485 859 1,221 1,985 1Diabetes mellitus . . . . . . . . . . . . . . . . . . . . . . . . . . . . . . (E10–E14) 87,647 – 2 26 248 887 2,228 6,348 15,508 23,069 22,185 17,143 3Nutritional deficiencies . . . . . . . . . . . . . . . . . . . . . . . . . . (E40–E64) 11,570 13 4 3 10 22 72 202 662 1,396 2,778 6,408 –Obesity . . . . . . . . . . . . . . . . . . . . . . . . . . . . . . . . . . . . . . . . . . (E66) 8,379 – – 9 84 425 909 1,548 2,310 1,883 952 259 –Parkinson disease . . . . . . . . . . . . . . . . . . . . . . . . . . . . . (G20–G21) 35,311 – – – – 2 10 70 794 5,276 14,902 14,257 –Alzheimer disease . . . . . . . . . . . . . . . . . . . . . . . . . . . . . . . . . (G30) 121,499 – – – – 2 10 116 1,281 7,836 33,566 78,688 –
See footnotes at end of table.
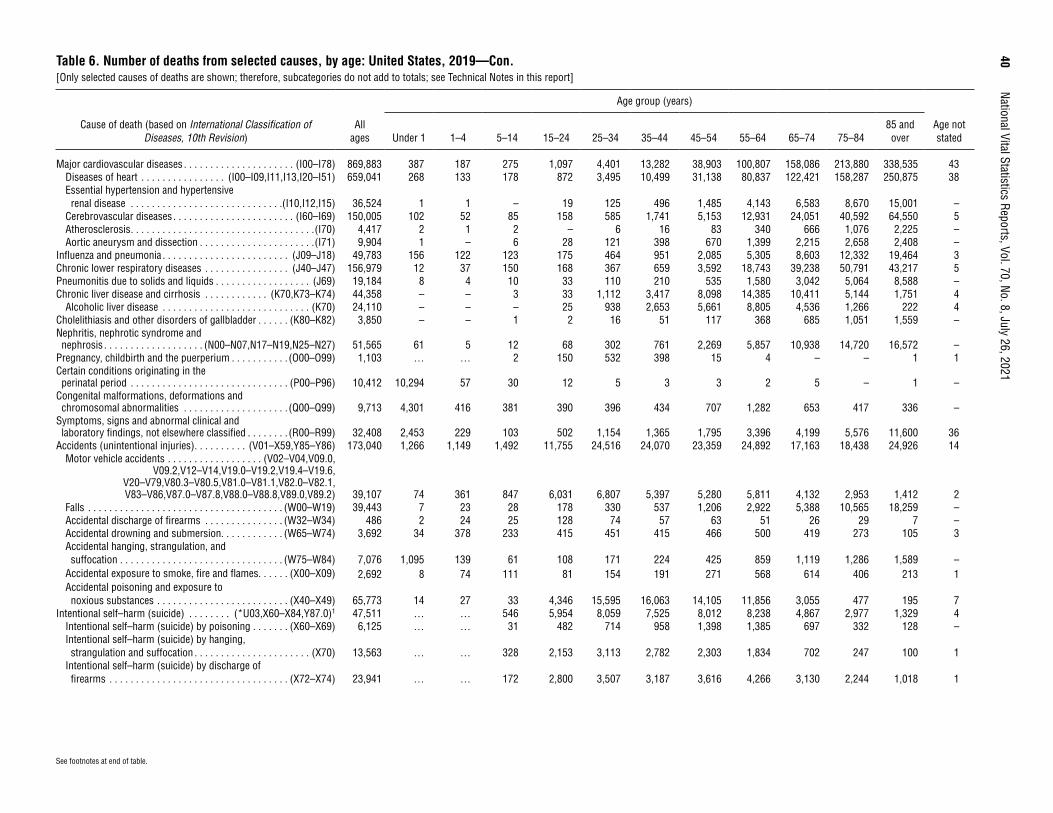
40
National Vital Statistics Reports, Vol. 70, No. 8, July 26, 2021Table 6. Number of deaths from selected causes, by age: United States, 2019—Con.[Only selected causes of deaths are shown; therefore, subcategories do not add to totals; see Technical Notes in this report]
Cause of death (based on International Classification of Diseases, 10th Revision)
All ages
Age group (years)
Age not statedUnder 1 1–4 5–14 15–24 25–34 35–44 45–54 55–64 65–74 75–84
85 and over
Major cardiovascular diseases . . . . . . . . . . . . . . . . . . . . . (I00–I78) 869,883 387 187 275 1,097 4,401 13,282 38,903 100,807 158,086 213,880 338,535 43Diseases of heart . . . . . . . . . . . . . . . . (I00–I09,I11,I13,I20–I51) 659,041 268 133 178 872 3,495 10,499 31,138 80,837 122,421 158,287 250,875 38Essential hypertension and hypertensive renal disease . . . . . . . . . . . . . . . . . . . . . . . . . . . . .(I10,I12,I15) 36,524 1 1 – 19 125 496 1,485 4,143 6,583 8,670 15,001 –
Cerebrovascular diseases . . . . . . . . . . . . . . . . . . . . . . . (I60–I69) 150,005 102 52 85 158 585 1,741 5,153 12,931 24,051 40,592 64,550 5Atherosclerosis . . . . . . . . . . . . . . . . . . . . . . . . . . . . . . . . . . .(I70) 4,417 2 1 2 – 6 16 83 340 666 1,076 2,225 –Aortic aneurysm and dissection . . . . . . . . . . . . . . . . . . . . . .(I71) 9,904 1 – 6 28 121 398 670 1,399 2,215 2,658 2,408 –
Influenza and pneumonia . . . . . . . . . . . . . . . . . . . . . . . . (J09–J18) 49,783 156 122 123 175 464 951 2,085 5,305 8,603 12,332 19,464 3Chronic lower respiratory diseases . . . . . . . . . . . . . . . . (J40–J47) 156,979 12 37 150 168 367 659 3,592 18,743 39,238 50,791 43,217 5Pneumonitis due to solids and liquids . . . . . . . . . . . . . . . . . . (J69) 19,184 8 4 10 33 110 210 535 1,580 3,042 5,064 8,588 –Chronic liver disease and cirrhosis . . . . . . . . . . . . (K70,K73–K74) 44,358 – – 3 33 1,112 3,417 8,098 14,385 10,411 5,144 1,751 4
Alcoholic liver disease . . . . . . . . . . . . . . . . . . . . . . . . . . . . (K70) 24,110 – – – 25 938 2,653 5,661 8,805 4,536 1,266 222 4Cholelithiasis and other disorders of gallbladder . . . . . . (K80–K82) 3,850 – – 1 2 16 51 117 368 685 1,051 1,559 –Nephritis, nephrotic syndrome and nephrosis . . . . . . . . . . . . . . . . . . . (N00–N07,N17–N19,N25–N27) 51,565 61 5 12 68 302 761 2,269 5,857 10,938 14,720 16,572 –
Pregnancy, childbirth and the puerperium . . . . . . . . . . . (O00–O99) 1,103 … … 2 150 532 398 15 4 – – 1 1Certain conditions originating in the perinatal period . . . . . . . . . . . . . . . . . . . . . . . . . . . . . . (P00–P96) 10,412 10,294 57 30 12 5 3 3 2 5 – 1 –
Congenital malformations, deformations and chromosomal abnormalities . . . . . . . . . . . . . . . . . . . . (Q00–Q99) 9,713 4,301 416 381 390 396 434 707 1,282 653 417 336 –
Symptoms, signs and abnormal clinical and laboratory findings, not elsewhere classified . . . . . . . . (R00–R99) 32,408 2,453 229 103 502 1,154 1,365 1,795 3,396 4,199 5,576 11,600 36
Accidents (unintentional injuries) . . . . . . . . . . (V01–X59,Y85–Y86) 173,040 1,266 1,149 1,492 11,755 24,516 24,070 23,359 24,892 17,163 18,438 24,926 14Motor vehicle accidents . . . . . . . . . . . . . . . . . . (V02–V04,V09.0,
V09.2,V12–V14,V19.0–V19.2,V19.4–V19.6, V20–V79,V80.3–V80.5,V81.0–V81.1,V82.0–V82.1, V83–V86,V87.0–V87.8,V88.0–V88.8,V89.0,V89.2) 39,107 74 361 847 6,031 6,807 5,397 5,280 5,811 4,132 2,953 1,412 2
Falls . . . . . . . . . . . . . . . . . . . . . . . . . . . . . . . . . . . . . (W00–W19) 39,443 7 23 28 178 330 537 1,206 2,922 5,388 10,565 18,259 –Accidental discharge of firearms . . . . . . . . . . . . . . . (W32–W34) 486 2 24 25 128 74 57 63 51 26 29 7 –Accidental drowning and submersion. . . . . . . . . . . . (W65–W74) 3,692 34 378 233 415 451 415 466 500 419 273 105 3Accidental hanging, strangulation, and suffocation . . . . . . . . . . . . . . . . . . . . . . . . . . . . . . . (W75–W84) 7,076 1,095 139 61 108 171 224 425 859 1,119 1,286 1,589 –
Accidental exposure to smoke, fire and flames. . . . . . (X00–X09) 2,692 8 74 111 81 154 191 271 568 614 406 213 1Accidental poisoning and exposure to noxious substances . . . . . . . . . . . . . . . . . . . . . . . . . (X40–X49) 65,773 14 27 33 4,346 15,595 16,063 14,105 11,856 3,055 477 195 7
Intentional self–harm (suicide) . . . . . . . . (*U03,X60–X84,Y87.0)1 47,511 … … 546 5,954 8,059 7,525 8,012 8,238 4,867 2,977 1,329 4Intentional self–harm (suicide) by poisoning . . . . . . . (X60–X69) 6,125 … … 31 482 714 958 1,398 1,385 697 332 128 –Intentional self–harm (suicide) by hanging, strangulation and suffocation . . . . . . . . . . . . . . . . . . . . . . (X70) 13,563 … … 328 2,153 3,113 2,782 2,303 1,834 702 247 100 1
Intentional self–harm (suicide) by discharge of firearms . . . . . . . . . . . . . . . . . . . . . . . . . . . . . . . . . . (X72–X74) 23,941 … … 172 2,800 3,507 3,187 3,616 4,266 3,130 2,244 1,018 1
See footnotes at end of table.
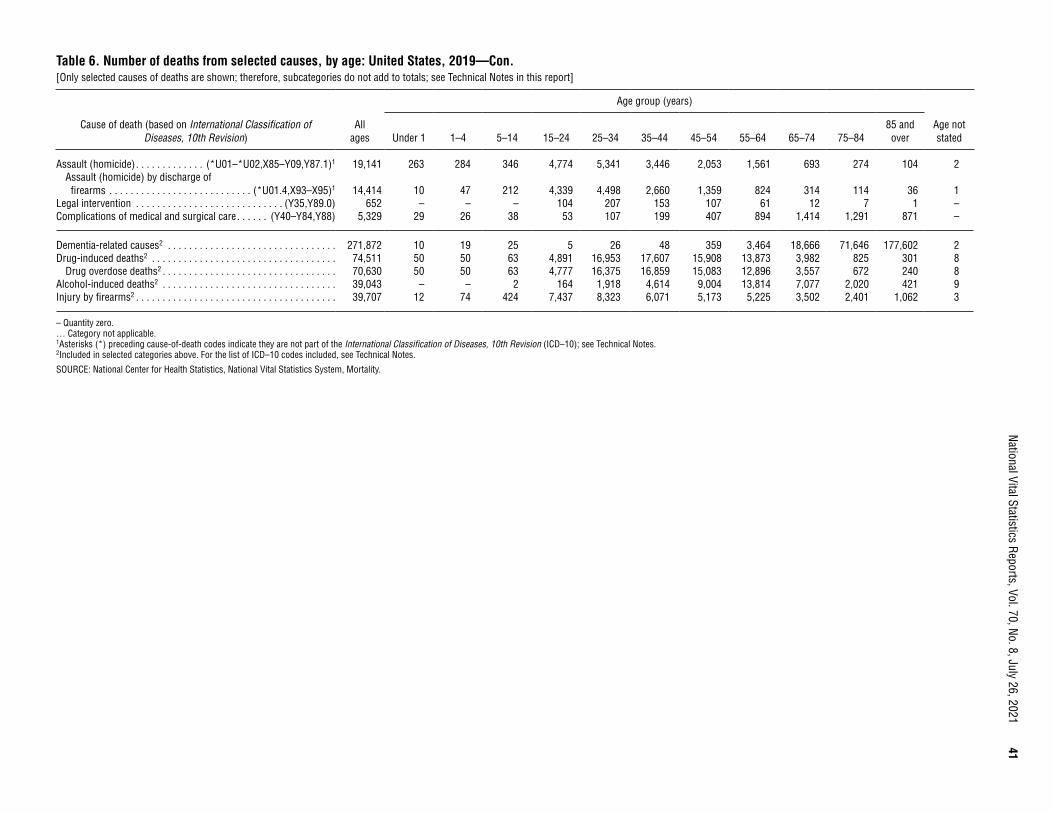
National Vital Statistics Reports, Vol. 70, No. 8, July 26, 2021
41
Table 6. Number of deaths from selected causes, by age: United States, 2019—Con.[Only selected causes of deaths are shown; therefore, subcategories do not add to totals; see Technical Notes in this report]
Cause of death (based on International Classification of Diseases, 10th Revision)
All ages
Age group (years)
Age not statedUnder 1 1–4 5–14 15–24 25–34 35–44 45–54 55–64 65–74 75–84
85 and over
Assault (homicide) . . . . . . . . . . . . . (*U01–*U02,X85–Y09,Y87.1)1 19,141 263 284 346 4,774 5,341 3,446 2,053 1,561 693 274 104 2Assault (homicide) by discharge of firearms . . . . . . . . . . . . . . . . . . . . . . . . . . . (*U01.4,X93–X95)1 14,414 10 47 212 4,339 4,498 2,660 1,359 824 314 114 36 1
Legal intervention . . . . . . . . . . . . . . . . . . . . . . . . . . . . (Y35,Y89.0) 652 – – – 104 207 153 107 61 12 7 1 –Complications of medical and surgical care . . . . . . (Y40–Y84,Y88) 5,329 29 26 38 53 107 199 407 894 1,414 1,291 871 –
Dementia-related causes2 . . . . . . . . . . . . . . . . . . . . . . . . . . . . . . . . 271,872 10 19 25 5 26 48 359 3,464 18,666 71,646 177,602 2Drug-induced deaths2 . . . . . . . . . . . . . . . . . . . . . . . . . . . . . . . . . . . 74,511 50 50 63 4,891 16,953 17,607 15,908 13,873 3,982 825 301 8
Drug overdose deaths2 . . . . . . . . . . . . . . . . . . . . . . . . . . . . . . . . . 70,630 50 50 63 4,777 16,375 16,859 15,083 12,896 3,557 672 240 8Alcohol-induced deaths2 . . . . . . . . . . . . . . . . . . . . . . . . . . . . . . . . . 39,043 – – 2 164 1,918 4,614 9,004 13,814 7,077 2,020 421 9Injury by firearms2 . . . . . . . . . . . . . . . . . . . . . . . . . . . . . . . . . . . . . . 39,707 12 74 424 7,437 8,323 6,071 5,173 5,225 3,502 2,401 1,062 3
– Quantity zero. … Category not applicable. 1Asterisks (*) preceding cause-of-death codes indicate they are not part of the International Classification of Diseases, 10th Revision (ICD–10); see Technical Notes. 2Included in selected categories above. For the list of ICD–10 codes included, see Technical Notes.
SOURCE: National Center for Health Statistics, National Vital Statistics System, Mortality.

42
National Vital Statistics Reports, Vol. 70, No. 8, July 26, 2021Table 7. Death rates for selected causes, by age: United States, 2019[Rates are on an annual basis per 100,000 population in specified group; see Technical Notes in this report]
Cause of death (based on International Classification of Diseases, 10th Revision)
All ages1
Age group (years)
Under 12 1–4 5–14 15–24 25–34 35–44 45–54 55–64 65–74 75–8485 and over
All causes . . . . . . . . . . . . . . . . . . . . . . . . . . . . . . . . . . . . . . . . . . . . . . . . . . . . . . . . . . 869.7 553.0 23.3 13.4 69.7 128.8 199.2 392.4 883.3 1,764.6 4,308.3 13,228.6
Enterocolitis due to Clostridium difficile . . . . . . . . . . . . . . . . . . . . . . . . . . . . . (A04.7) 1.4 * * * * * 0.1 0.3 1.0 3.0 8.7 23.5Septicemia . . . . . . . . . . . . . . . . . . . . . . . . . . . . . . . . . . . . . . . . . . . . . . . . (A40–A41) 11.7 3.5 0.3 0.2 0.3 0.8 1.9 5.3 13.4 28.0 64.5 150.2Viral hepatitis . . . . . . . . . . . . . . . . . . . . . . . . . . . . . . . . . . . . . . . . . . . . . . (B15–B19) 1.3 * * * * 0.1 0.4 1.5 4.1 3.9 2.2 2.0Human immunodeficiency virus (HIV) disease . . . . . . . . . . . . . . . . . . . . (B20–B24) 1.5 * * * 0.1 1.1 1.7 3.0 3.6 2.4 1.4 0.6Malignant neoplasms . . . . . . . . . . . . . . . . . . . . . . . . . . . . . . . . . . . . . . . . (C00–C97) 182.7 1.5 1.8 1.9 3.3 7.8 25.7 87.1 263.3 543.3 1,005.9 1,571.0
Malignant neoplasms of lip, oral cavity and pharynx . . . . . . . . . . . . . . (C00–C14) 3.2 * * * * 0.1 0.4 2.0 6.4 10.0 13.9 20.5Malignant neoplasm of esophagus . . . . . . . . . . . . . . . . . . . . . . . . . . . . . . . . (C15) 4.9 * * * * 0.1 0.6 2.7 9.0 16.5 24.1 25.7Malignant neoplasm of stomach. . . . . . . . . . . . . . . . . . . . . . . . . . . . . . . . . . (C16) 3.4 * * * 0.0 0.3 1.0 2.5 4.9 9.3 16.9 27.4Malignant neoplasms of colon, rectum and anus . . . . . . . . . . . . . . . . . (C18–C21) 16.1 * * * 0.1 0.7 3.4 12.0 24.4 41.5 77.9 158.4Malignant neoplasms of liver and intrahepatic bile ducts . . . . . . . . . . . . . . . (C22) 8.5 * * * 0.1 0.2 0.8 3.6 16.8 30.4 38.8 46.2Malignant neoplasm of pancreas . . . . . . . . . . . . . . . . . . . . . . . . . . . . . . . . . (C25) 14.0 * * * * 0.1 1.1 6.0 21.3 45.8 79.4 102.1Malignant neoplasms of trachea, bronchus and lung . . . . . . . . . . . . . . (C33–C34) 42.6 * * * 0.1 0.2 1.9 13.6 64.8 144.3 260.9 281.3Malignant melanoma of skin. . . . . . . . . . . . . . . . . . . . . . . . . . . . . . . . . . . . . (C43) 2.5 * * * * 0.2 0.7 1.5 3.5 6.6 12.9 22.1Malignant neoplasm of breast . . . . . . . . . . . . . . . . . . . . . . . . . . . . . . . . . . . (C50) 13.0 * * * * 0.9 4.6 11.3 21.1 33.6 55.2 112.1Malignant neoplasm of cervix uteri . . . . . . . . . . . . . . . . . . . . . . . . . . . . . . . . (C53) 1.3 * * * * 0.4 1.3 2.1 2.4 2.6 2.9 3.8Malignant neoplasm of ovary . . . . . . . . . . . . . . . . . . . . . . . . . . . . . . . . . . . . (C56) 4.1 * * * * 0.2 0.7 2.6 6.7 12.5 21.2 27.0Malignant neoplasm of prostate . . . . . . . . . . . . . . . . . . . . . . . . . . . . . . . . . . (C61) 9.6 * * * * * 0.1 0.9 6.9 24.1 65.7 154.8Malignant neoplasms of kidney and renal pelvis . . . . . . . . . . . . . . . . . (C64–C65) 4.3 * * 0.1 0.1 0.1 0.5 2.2 6.2 12.9 23.0 36.8Malignant neoplasm of bladder . . . . . . . . . . . . . . . . . . . . . . . . . . . . . . . . . . (C67) 5.1 * * * * * 0.2 0.9 4.2 12.0 33.4 82.4Malignant neoplasms of meninges, brain and other parts of central nervous system . . . . . . . . . . . . . . . . . . . . . . . . . . . . . . . . . . . (C70–C72) 5.3 * 0.4 0.7 0.5 0.9 1.9 4.3 9.4 15.9 20.6 20.9
Non-Hodgkin lymphoma. . . . . . . . . . . . . . . . . . . . . . . . . . . . . . . . . . . . (C82–C85) 6.2 * * * 0.2 0.3 0.8 2.1 6.0 15.9 41.0 71.8Multiple myeloma and immunoproliferative neoplasms . . . . . . . . . . . . . (C88,C90) 3.9 * * * * * 0.2 1.2 4.2 11.5 26.9 40.1Leukemia . . . . . . . . . . . . . . . . . . . . . . . . . . . . . . . . . . . . . . . . . . . . . . . (C91–C95) 7.1 * 0.6 0.5 0.7 0.8 1.3 2.4 6.3 17.6 44.4 81.2
In situ neoplasms, benign neoplasms and neoplasms of uncertain or unknown behavior . . . . . . . . . . . . . . . . . . . . . . . . . . . . . . . (D00–D48) 4.7 1.1 0.3 0.2 0.2 0.2 0.5 1.3 3.5 9.8 30.0 77.6
Anemias . . . . . . . . . . . . . . . . . . . . . . . . . . . . . . . . . . . . . . . . . . . . . . . . . . (D50–D64) 1.6 * 0.2 0.1 0.1 0.3 0.5 0.6 1.1 2.7 7.6 30.1Diabetes mellitus . . . . . . . . . . . . . . . . . . . . . . . . . . . . . . . . . . . . . . . . . . . (E10–E14) 26.7 * * 0.1 0.6 1.9 5.3 15.5 36.5 73.3 138.9 259.5Nutritional deficiencies . . . . . . . . . . . . . . . . . . . . . . . . . . . . . . . . . . . . . . . (E40–E64) 3.5 * * * * 0.0 0.2 0.5 1.6 4.4 17.4 97.0Obesity . . . . . . . . . . . . . . . . . . . . . . . . . . . . . . . . . . . . . . . . . . . . . . . . . . . . . . . (E66) 2.6 * * * 0.2 0.9 2.2 3.8 5.4 6.0 6.0 3.9Parkinson disease . . . . . . . . . . . . . . . . . . . . . . . . . . . . . . . . . . . . . . . . . . (G20–G21) 10.8 * * * * * * 0.2 1.9 16.8 93.3 215.9Alzheimer disease . . . . . . . . . . . . . . . . . . . . . . . . . . . . . . . . . . . . . . . . . . . . . . (G30) 37.0 * * * * * * 0.3 3.0 24.9 210.2 1,191.3
See footnotes at end of table.

National Vital Statistics Reports, Vol. 70, No. 8, July 26, 2021
43
Table 7. Death rates for selected causes, by age: United States, 2019—Con.[Rates are on an annual basis per 100,000 population in specified group; see Technical Notes in this report]
Cause of death (based on International Classification of Diseases, 10th Revision)
All ages1
Age group (years)
Under 12 1–4 5–14 15–24 25–34 35–44 45–54 55–64 65–74 75–8485 and over
Major cardiovascular diseases . . . . . . . . . . . . . . . . . . . . . . . . . . . . . . . . . . (I00–I78) 265.0 10.2 1.2 0.7 2.6 9.6 31.9 95.2 237.5 502.1 1,339.3 5,125.5Diseases of heart . . . . . . . . . . . . . . . . . . . . . . . . . . . . . .(I00–I09,I11,I13,I20–I51) 200.8 7.1 0.8 0.4 2.0 7.6 25.2 76.2 190.4 388.8 991.2 3,798.3Essential hypertension and hypertensive renal disease . . . . . . . . . . . (I10,I12,I15) 11.1 * * * * 0.3 1.2 3.6 9.8 20.9 54.3 227.1Cerebrovascular diseases . . . . . . . . . . . . . . . . . . . . . . . . . . . . . . . . . . . . (I60–I69) 45.7 2.7 0.3 0.2 0.4 1.3 4.2 12.6 30.5 76.4 254.2 977.3Atherosclerosis . . . . . . . . . . . . . . . . . . . . . . . . . . . . . . . . . . . . . . . . . . . . . . . . (I70) 1.3 * * * * * * 0.2 0.8 2.1 6.7 33.7Aortic aneurysm and dissection . . . . . . . . . . . . . . . . . . . . . . . . . . . . . . . . . . . (I71) 3.0 * * * 0.1 0.3 1.0 1.6 3.3 7.0 16.6 36.5
Influenza and pneumonia . . . . . . . . . . . . . . . . . . . . . . . . . . . . . . . . . . . . . . (J09–J18) 15.2 4.1 0.8 0.3 0.4 1.0 2.3 5.1 12.5 27.3 77.2 294.7Chronic lower respiratory diseases . . . . . . . . . . . . . . . . . . . . . . . . . . . . . . (J40–J47) 47.8 * 0.2 0.4 0.4 0.8 1.6 8.8 44.2 124.6 318.0 654.3Pneumonitis due to solids and liquids . . . . . . . . . . . . . . . . . . . . . . . . . . . . . . . .(J69) 5.8 * * * 0.1 0.2 0.5 1.3 3.7 9.7 31.7 130.0Chronic liver disease and cirrhosis . . . . . . . . . . . . . . . . . . . . . . . . . .(K70,K73–K74) 13.5 * * * 0.1 2.4 8.2 19.8 33.9 33.1 32.2 26.5
Alcoholic liver disease . . . . . . . . . . . . . . . . . . . . . . . . . . . . . . . . . . . . . . . . . (K70) 7.3 * * * 0.1 2.0 6.4 13.8 20.7 14.4 7.9 3.4Cholelithiasis and other disorders of gallbladder . . . . . . . . . . . . . . . . . . . (K80–K82) 1.2 * * * * * 0.1 0.3 0.9 2.2 6.6 23.6Nephritis, nephrotic syndrome and nephrosis . . . . . (N00–N07,N17–N19,N25–N27) 15.7 1.6 * * 0.2 0.7 1.8 5.6 13.8 34.7 92.2 250.9Pregnancy, childbirth and the puerperium . . . . . . . . . . . . . . . . . . . . . . . . (O00–O99) 0.3 … … * 0.4 1.2 1.0 * * * * *Certain conditions originating in the perinatal period . . . . . . . . . . . . . . . . (P00–P96) 3.2 272.1 0.4 0.1 * * * * * * * *Congenital malformations, deformations and chromosomal abnormalities . . . . . . . . . . . . . . . . . . . . . . . . . . . . . . . . . (Q00–Q99) 3.0 113.7 2.6 0.9 0.9 0.9 1.0 1.7 3.0 2.1 2.6 5.1
Symptoms, signs and abnormal clinical and laboratory findings, not elsewhere classified . . . . . . . . . . . . . . . . . . . . . . . . . . . . . . . . . . . . . (R00–R99) 9.9 64.8 1.4 0.3 1.2 2.5 3.3 4.4 8.0 13.3 34.9 175.6
Accidents (unintentional injuries) . . . . . . . . . . . . . . . . . . . . . . . .(V01–X59,Y85–Y86) 52.7 33.5 7.3 3.6 27.5 53.4 57.8 57.1 58.6 54.5 115.5 377.4Motor vehicle accidents . . . . . . . . . . . . . . . . . . (V02–V04,V09.0,V09.2,V12–V14,
V19.0–V19.2,V19.4–V19.6,V20–V79, V80.3–V80.5,V81.0–V81.1,V82.0–V82.1,V83–V86,
V87.0–V87.8,V88.0–V88.8,V89.0,V89.2) 11.9 2.0 2.3 2.1 14.1 14.8 13.0 12.9 13.7 13.1 18.5 21.4Falls . . . . . . . . . . . . . . . . . . . . . . . . . . . . . . . . . . . . . . . . . . . . . . . . . . (W00–W19) 12.0 * 0.1 0.1 0.4 0.7 1.3 3.0 6.9 17.1 66.2 276.4Accidental discharge of firearms . . . . . . . . . . . . . . . . . . . . . . . . . . . . (W32–W34) 0.1 * 0.2 0.1 0.3 0.2 0.1 0.2 0.1 0.1 0.2 *Accidental drowning and submersion. . . . . . . . . . . . . . . . . . . . . . . . . (W65–W74) 1.1 0.9 2.4 0.6 1.0 1.0 1.0 1.1 1.2 1.3 1.7 1.6Accidental hanging, strangulation, and suffocation . . . . . . . . . . . . . . . . . . . . . . . . . . . . . . . . . . . . . . . . . . . . (W75–W84) 2.2 28.9 0.9 0.1 0.3 0.4 0.5 1.0 2.0 3.6 8.1 24.1
Accidental exposure to smoke, fire and flames . . . . . . . . . . . . . . . . . . . . . . . . . . . . . . . . . . . . . . . . . . . . . . . . . (X00–X09) 0.8 * 0.5 0.3 0.2 0.3 0.5 0.7 1.3 2.0 2.5 3.2
Accidental poisoning and exposure to noxious substances . . . . . . . . . . . . . . . . . . . . . . . . . . . . . . . . . . . . . . . . . . . . . (X40–X49) 20.0 * 0.2 0.1 10.2 33.9 38.6 34.5 27.9 9.7 3.0 3.0
See footnotes at end of table.
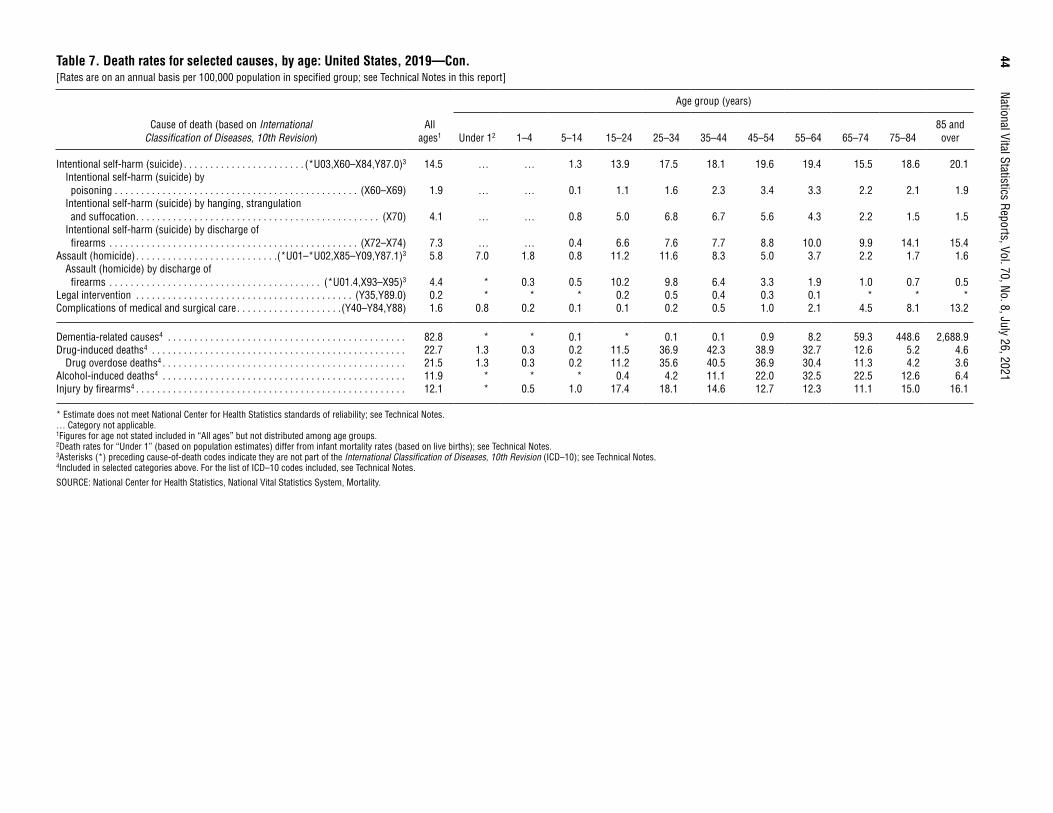
44
National Vital Statistics Reports, Vol. 70, No. 8, July 26, 2021Table 7. Death rates for selected causes, by age: United States, 2019—Con.[Rates are on an annual basis per 100,000 population in specified group; see Technical Notes in this report]
Cause of death (based on International Classification of Diseases, 10th Revision)
All ages1
Age group (years)
Under 12 1–4 5–14 15–24 25–34 35–44 45–54 55–64 65–74 75–8485 and over
Intentional self-harm (suicide) . . . . . . . . . . . . . . . . . . . . . . . (*U03,X60–X84,Y87.0)3 14.5 … … 1.3 13.9 17.5 18.1 19.6 19.4 15.5 18.6 20.1Intentional self-harm (suicide) by poisoning . . . . . . . . . . . . . . . . . . . . . . . . . . . . . . . . . . . . . . . . . . . . . . (X60–X69) 1.9 … … 0.1 1.1 1.6 2.3 3.4 3.3 2.2 2.1 1.9
Intentional self-harm (suicide) by hanging, strangulation and suffocation . . . . . . . . . . . . . . . . . . . . . . . . . . . . . . . . . . . . . . . . . . . . . . (X70) 4.1 … … 0.8 5.0 6.8 6.7 5.6 4.3 2.2 1.5 1.5
Intentional self-harm (suicide) by discharge of firearms . . . . . . . . . . . . . . . . . . . . . . . . . . . . . . . . . . . . . . . . . . . . . . . (X72–X74) 7.3 … … 0.4 6.6 7.6 7.7 8.8 10.0 9.9 14.1 15.4
Assault (homicide) . . . . . . . . . . . . . . . . . . . . . . . . . . .(*U01–*U02,X85–Y09,Y87.1)3 5.8 7.0 1.8 0.8 11.2 11.6 8.3 5.0 3.7 2.2 1.7 1.6Assault (homicide) by discharge of firearms . . . . . . . . . . . . . . . . . . . . . . . . . . . . . . . . . . . . . . . . (*U01.4,X93–X95)3 4.4 * 0.3 0.5 10.2 9.8 6.4 3.3 1.9 1.0 0.7 0.5
Legal intervention . . . . . . . . . . . . . . . . . . . . . . . . . . . . . . . . . . . . . . . . . (Y35,Y89.0) 0.2 * * * 0.2 0.5 0.4 0.3 0.1 * * *Complications of medical and surgical care . . . . . . . . . . . . . . . . . . . .(Y40–Y84,Y88) 1.6 0.8 0.2 0.1 0.1 0.2 0.5 1.0 2.1 4.5 8.1 13.2
Dementia-related causes4 . . . . . . . . . . . . . . . . . . . . . . . . . . . . . . . . . . . . . . . . . . . . . 82.8 * * 0.1 * 0.1 0.1 0.9 8.2 59.3 448.6 2,688.9Drug-induced deaths4 . . . . . . . . . . . . . . . . . . . . . . . . . . . . . . . . . . . . . . . . . . . . . . . . 22.7 1.3 0.3 0.2 11.5 36.9 42.3 38.9 32.7 12.6 5.2 4.6
Drug overdose deaths4 . . . . . . . . . . . . . . . . . . . . . . . . . . . . . . . . . . . . . . . . . . . . . . 21.5 1.3 0.3 0.2 11.2 35.6 40.5 36.9 30.4 11.3 4.2 3.6Alcohol-induced deaths4 . . . . . . . . . . . . . . . . . . . . . . . . . . . . . . . . . . . . . . . . . . . . . . 11.9 * * * 0.4 4.2 11.1 22.0 32.5 22.5 12.6 6.4Injury by firearms4 . . . . . . . . . . . . . . . . . . . . . . . . . . . . . . . . . . . . . . . . . . . . . . . . . . . 12.1 * 0.5 1.0 17.4 18.1 14.6 12.7 12.3 11.1 15.0 16.1
* Estimate does not meet National Center for Health Statistics standards of reliability; see Technical Notes. … Category not applicable. 1Figures for age not stated included in “All ages” but not distributed among age groups. 2Death rates for “Under 1” (based on population estimates) differ from infant mortality rates (based on live births); see Technical Notes. 3Asterisks (*) preceding cause-of-death codes indicate they are not part of the International Classification of Diseases, 10th Revision (ICD–10); see Technical Notes. 4Included in selected categories above. For the list of ICD–10 codes included, see Technical Notes.
SOURCE: National Center for Health Statistics, National Vital Statistics System, Mortality.

National Vital Statistics Reports, Vol. 70, No. 8, July 26, 2021
45
Table 8. Number of deaths from selected causes, by race and Hispanic origin and sex: United States, 2019[Includes selected causes of deaths; therefore, subcategories do not add to totals; see Technical Notes in this report. Race and Hispanic-origin categories are consistent with 1997 Office of Management and Budget standards. Data for specified categories other than non-Hispanic, single-race white and non-Hispanic, single-race black should be interpreted with caution because of inconsistencies in reporting these items on death certificates and surveys; see Technical Notes]
Cause of death (based on International
Classification of Diseases, 10th Revision)
Total1
Non-Hispanic, single race
Hispanic3White2 Black2American Indian or
Alaska Native2 Asian2
Native Hawaiian or Other Pacific
Islander2
Both sexes Male Female
Both sexes Male Female
Both sexes Male Female
Both sexes Male Female
Both sexes Male Female
Both sexes Male Female
Both sexes Male Female
All causes . . . . . . . . . . . . . . . . 2,854,838 1,473,823 1,381,015 2,183,844 1,115,767 1,068,077 346,677 181,363 165,314 18,057 9,732 8,325 70,532 35,914 34,618 3,491 1,938 1,553 212,397 117,683 94,714
Enterocolitis due to Clostridium difficile . . . . . . . . . . . (A04.7) 4,533 1,889 2,644 3,584 1,502 2,082 435 161 274 42 17 25 83 35 48 8 2 6 358 163 195
Septicemia . . . . . . . (A40–A41) 38,431 18,867 19,564 28,143 13,808 14,335 6,347 3,015 3,332 261 131 130 716 335 381 49 22 27 2,701 1,428 1,273Viral hepatitis . . . . . (B15–B19) 4,285 2,777 1,508 2,703 1,770 933 618 410 208 55 30 25 181 115 66 7 2 5 644 393 251Human immunodeficiency virus (HIV) disease . . . . . . . . . (B20–B24) 5,044 3,753 1,291 1,598 1,327 271 2,556 1,717 839 31 22 9 54 49 5 5 3 2 736 587 149
Malignant neoplasms . . . . . . (C00–C97) 599,601 315,876 283,725 460,950 245,380 215,570 70,513 35,426 35,087 2,979 1,536 1,443 17,702 8,889 8,813 752 375 377 43,079 22,320 20,759Malignant neoplasms of lip, oral cavity and pharynx . . . . . . (C00–C14) 10,492 7,375 3,117 8,269 5,790 2,479 1,062 775 287 43 30 13 411 275 136 16 11 5 626 438 188
Malignant neoplasm of esophagus . . . . . . . . (C15) 15,962 12,823 3,139 13,467 10,965 2,502 1,241 867 374 84 58 26 289 218 71 11 9 2 789 643 146
Malignant neoplasm of stomach . . . . . . . . . (C16) 11,092 6,622 4,470 6,185 3,846 2,339 1,903 1,128 775 98 62 36 852 463 389 30 17 13 1,946 1,063 883
Malignant neoplasms of colon, rectum and anus . . . . . . . . . (C18–C21) 52,986 28,093 24,893 39,131 20,591 18,540 7,021 3,751 3,270 294 146 148 1,769 923 846 58 34 24 4,373 2,458 1,915
Malignant neoplasms of liver and intrahepatic bile ducts . . . . . . . . . (C22) 27,959 18,692 9,267 18,459 12,296 6,163 3,632 2,516 1,116 240 160 80 1,631 1,073 558 60 46 14 3,710 2,440 1,270
Malignant neoplasm of pancreas . . . . . . . . . . (C25) 45,886 23,732 22,154 34,759 18,261 16,498 5,695 2,718 2,977 191 94 97 1,420 693 727 43 21 22 3,512 1,809 1,703
Malignant neoplasms of trachea, bronchus and lung . . . . . . . . . (C33–C34) 139,682 74,909 64,773 113,788 60,285 53,503 14,891 8,420 6,471 703 348 355 3,640 1,989 1,651 144 83 61 5,667 3,327 2,340
Malignant melanoma of skin . . . . . . . . . . . . . . (C43) 8,092 5,295 2,797 7,619 5,024 2,595 121 68 53 18 13 5 45 20 25 4 3 1 254 146 108
Malignant neoplasm of breast . . . . . . . . . . . . (C50) 42,748 467 42,281 30,985 357 30,628 6,642 82 6,560 212 3 209 1,262 6 1,256 64 – 64 3,319 19 3,300
Malignant neoplasm of cervix uteri . . . . . . . . (C53) 4,152 … 4,152 2,545 … 2,545 783 … 783 31 … 31 157 … 157 13 … 13 588 … 588
Malignant neoplasm of ovary . . . . . . . . . . . . (C56) 13,445 … 13,445 10,314 … 10,314 1,387 … 1,387 49 … 49 485 … 485 12 … 12 1,113 … 1,113
Malignant neoplasm of prostate . . . . . . . . . . (C61) 31,638 31,638 … 23,262 23,262 … 5,312 5,312 … 132 132 … 566 566 … 31 31 … 2,135 2,135 …
See footnotes at end of table.
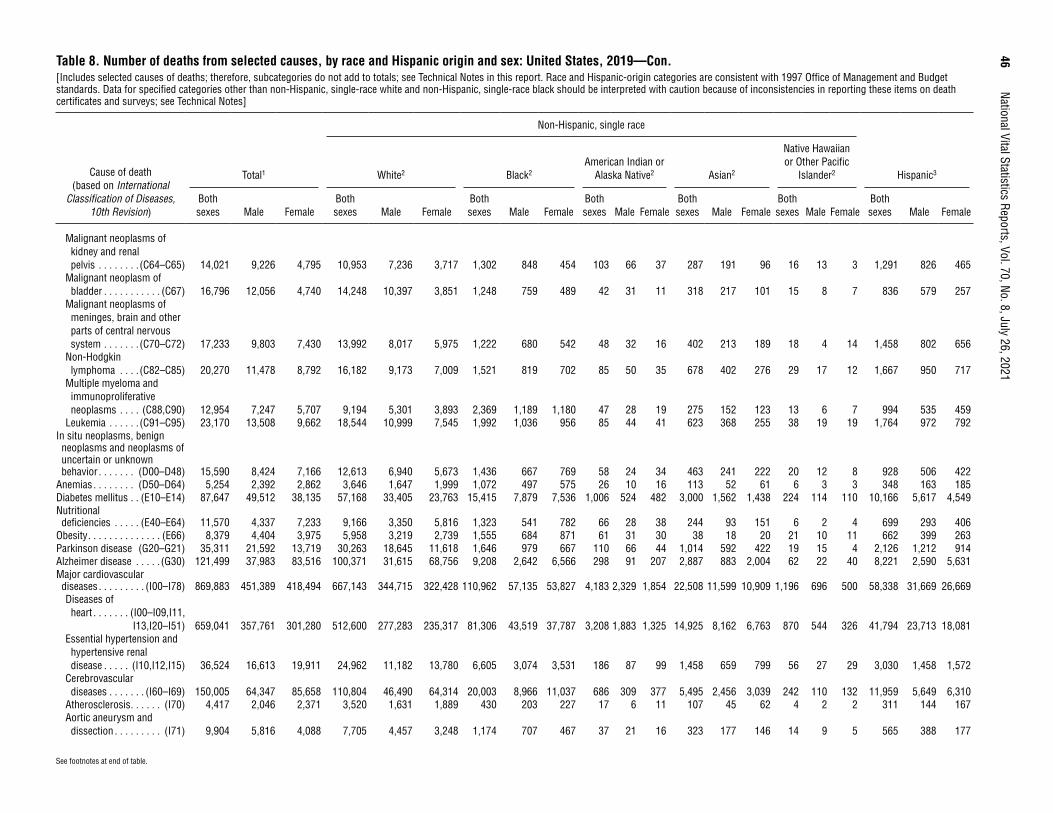
46
National Vital Statistics Reports, Vol. 70, No. 8, July 26, 2021Table 8. Number of deaths from selected causes, by race and Hispanic origin and sex: United States, 2019—Con.[Includes selected causes of deaths; therefore, subcategories do not add to totals; see Technical Notes in this report. Race and Hispanic-origin categories are consistent with 1997 Office of Management and Budget standards. Data for specified categories other than non-Hispanic, single-race white and non-Hispanic, single-race black should be interpreted with caution because of inconsistencies in reporting these items on death certificates and surveys; see Technical Notes]
Cause of death (based on International
Classification of Diseases, 10th Revision)
Total1
Non-Hispanic, single race
Hispanic3White2 Black2American Indian or
Alaska Native2 Asian2
Native Hawaiian or Other Pacific
Islander2
Both sexes Male Female
Both sexes Male Female
Both sexes Male Female
Both sexes Male Female
Both sexes Male Female
Both sexes Male Female
Both sexes Male Female
Malignant neoplasms of kidney and renal pelvis . . . . . . . . (C64–C65) 14,021 9,226 4,795 10,953 7,236 3,717 1,302 848 454 103 66 37 287 191 96 16 13 3 1,291 826 465
Malignant neoplasm of bladder . . . . . . . . . . . (C67) 16,796 12,056 4,740 14,248 10,397 3,851 1,248 759 489 42 31 11 318 217 101 15 8 7 836 579 257
Malignant neoplasms of meninges, brain and other parts of central nervous system . . . . . . . (C70–C72) 17,233 9,803 7,430 13,992 8,017 5,975 1,222 680 542 48 32 16 402 213 189 18 4 14 1,458 802 656
Non-Hodgkin lymphoma . . . . (C82–C85) 20,270 11,478 8,792 16,182 9,173 7,009 1,521 819 702 85 50 35 678 402 276 29 17 12 1,667 950 717
Multiple myeloma and immunoproliferative neoplasms . . . . (C88,C90) 12,954 7,247 5,707 9,194 5,301 3,893 2,369 1,189 1,180 47 28 19 275 152 123 13 6 7 994 535 459
Leukemia . . . . . . (C91–C95) 23,170 13,508 9,662 18,544 10,999 7,545 1,992 1,036 956 85 44 41 623 368 255 38 19 19 1,764 972 792In situ neoplasms, benign neoplasms and neoplasms of uncertain or unknown behavior . . . . . . . (D00–D48) 15,590 8,424 7,166 12,613 6,940 5,673 1,436 667 769 58 24 34 463 241 222 20 12 8 928 506 422
Anemias . . . . . . . . (D50–D64) 5,254 2,392 2,862 3,646 1,647 1,999 1,072 497 575 26 10 16 113 52 61 6 3 3 348 163 185Diabetes mellitus . . (E10–E14) 87,647 49,512 38,135 57,168 33,405 23,763 15,415 7,879 7,536 1,006 524 482 3,000 1,562 1,438 224 114 110 10,166 5,617 4,549Nutritional deficiencies . . . . . (E40–E64) 11,570 4,337 7,233 9,166 3,350 5,816 1,323 541 782 66 28 38 244 93 151 6 2 4 699 293 406
Obesity . . . . . . . . . . . . . . (E66) 8,379 4,404 3,975 5,958 3,219 2,739 1,555 684 871 61 31 30 38 18 20 21 10 11 662 399 263Parkinson disease (G20–G21) 35,311 21,592 13,719 30,263 18,645 11,618 1,646 979 667 110 66 44 1,014 592 422 19 15 4 2,126 1,212 914Alzheimer disease . . . . . (G30) 121,499 37,983 83,516 100,371 31,615 68,756 9,208 2,642 6,566 298 91 207 2,887 883 2,004 62 22 40 8,221 2,590 5,631Major cardiovascular diseases . . . . . . . . . (I00–I78) 869,883 451,389 418,494 667,143 344,715 322,428 110,962 57,135 53,827 4,183 2,329 1,854 22,508 11,599 10,909 1,196 696 500 58,338 31,669 26,669Diseases of heart . . . . . . . (I00–I09,I11,
I13,I20–I51) 659,041 357,761 301,280 512,600 277,283 235,317 81,306 43,519 37,787 3,208 1,883 1,325 14,925 8,162 6,763 870 544 326 41,794 23,713 18,081Essential hypertension and hypertensive renal disease . . . . . (I10,I12,I15) 36,524 16,613 19,911 24,962 11,182 13,780 6,605 3,074 3,531 186 87 99 1,458 659 799 56 27 29 3,030 1,458 1,572
Cerebrovascular diseases . . . . . . . (I60–I69) 150,005 64,347 85,658 110,804 46,490 64,314 20,003 8,966 11,037 686 309 377 5,495 2,456 3,039 242 110 132 11,959 5,649 6,310
Atherosclerosis . . . . . . (I70) 4,417 2,046 2,371 3,520 1,631 1,889 430 203 227 17 6 11 107 45 62 4 2 2 311 144 167Aortic aneurysm and dissection . . . . . . . . . (I71) 9,904 5,816 4,088 7,705 4,457 3,248 1,174 707 467 37 21 16 323 177 146 14 9 5 565 388 177
See footnotes at end of table.
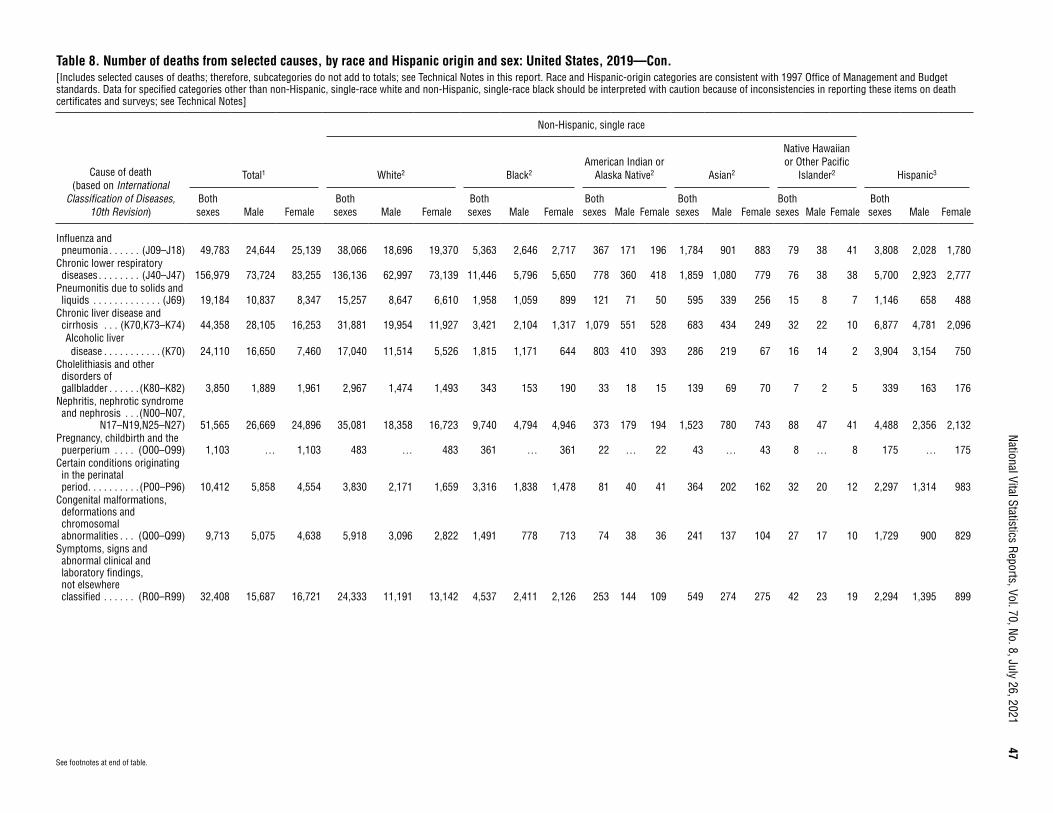
National Vital Statistics Reports, Vol. 70, No. 8, July 26, 2021
47
Table 8. Number of deaths from selected causes, by race and Hispanic origin and sex: United States, 2019—Con.[Includes selected causes of deaths; therefore, subcategories do not add to totals; see Technical Notes in this report. Race and Hispanic-origin categories are consistent with 1997 Office of Management and Budget standards. Data for specified categories other than non-Hispanic, single-race white and non-Hispanic, single-race black should be interpreted with caution because of inconsistencies in reporting these items on death certificates and surveys; see Technical Notes]
Cause of death (based on International
Classification of Diseases, 10th Revision)
Total1
Non-Hispanic, single race
Hispanic3White2 Black2American Indian or
Alaska Native2 Asian2
Native Hawaiian or Other Pacific
Islander2
Both sexes Male Female
Both sexes Male Female
Both sexes Male Female
Both sexes Male Female
Both sexes Male Female
Both sexes Male Female
Both sexes Male Female
Influenza and pneumonia . . . . . . (J09–J18) 49,783 24,644 25,139 38,066 18,696 19,370 5,363 2,646 2,717 367 171 196 1,784 901 883 79 38 41 3,808 2,028 1,780
Chronic lower respiratory diseases . . . . . . . . (J40–J47) 156,979 73,724 83,255 136,136 62,997 73,139 11,446 5,796 5,650 778 360 418 1,859 1,080 779 76 38 38 5,700 2,923 2,777
Pneumonitis due to solids and liquids . . . . . . . . . . . . . (J69) 19,184 10,837 8,347 15,257 8,647 6,610 1,958 1,059 899 121 71 50 595 339 256 15 8 7 1,146 658 488
Chronic liver disease and cirrhosis . . . (K70,K73–K74) 44,358 28,105 16,253 31,881 19,954 11,927 3,421 2,104 1,317 1,079 551 528 683 434 249 32 22 10 6,877 4,781 2,096Alcoholic liver disease . . . . . . . . . . . (K70) 24,110 16,650 7,460 17,040 11,514 5,526 1,815 1,171 644 803 410 393 286 219 67 16 14 2 3,904 3,154 750
Cholelithiasis and other disorders of gallbladder . . . . . . (K80–K82) 3,850 1,889 1,961 2,967 1,474 1,493 343 153 190 33 18 15 139 69 70 7 2 5 339 163 176
Nephritis, nephrotic syndrome and nephrosis . . .(N00–N07,
N17–N19,N25–N27) 51,565 26,669 24,896 35,081 18,358 16,723 9,740 4,794 4,946 373 179 194 1,523 780 743 88 47 41 4,488 2,356 2,132Pregnancy, childbirth and the puerperium . . . . (O00–O99) 1,103 … 1,103 483 … 483 361 … 361 22 … 22 43 … 43 8 … 8 175 … 175
Certain conditions originating in the perinatal period . . . . . . . . . . (P00–P96) 10,412 5,858 4,554 3,830 2,171 1,659 3,316 1,838 1,478 81 40 41 364 202 162 32 20 12 2,297 1,314 983
Congenital malformations, deformations and chromosomal abnormalities . . . (Q00–Q99) 9,713 5,075 4,638 5,918 3,096 2,822 1,491 778 713 74 38 36 241 137 104 27 17 10 1,729 900 829
Symptoms, signs and abnormal clinical and laboratory findings, not elsewhere classified . . . . . . (R00–R99) 32,408 15,687 16,721 24,333 11,191 13,142 4,537 2,411 2,126 253 144 109 549 274 275 42 23 19 2,294 1,395 899
See footnotes at end of table.

48
National Vital Statistics Reports, Vol. 70, No. 8, July 26, 2021Table 8. Number of deaths from selected causes, by race and Hispanic origin and sex: United States, 2019—Con.[Includes selected causes of deaths; therefore, subcategories do not add to totals; see Technical Notes in this report. Race and Hispanic-origin categories are consistent with 1997 Office of Management and Budget standards. Data for specified categories other than non-Hispanic, single-race white and non-Hispanic, single-race black should be interpreted with caution because of inconsistencies in reporting these items on death certificates and surveys; see Technical Notes]
Cause of death (based on International
Classification of Diseases, 10th Revision)
Total1
Non-Hispanic, single race
Hispanic3White2 Black2American Indian or
Alaska Native2 Asian2
Native Hawaiian or Other Pacific
Islander2
Both sexes Male Female
Both sexes Male Female
Both sexes Male Female
Both sexes Male Female
Both sexes Male Female
Both sexes Male Female
Both sexes Male Female
Accidents (unintentional injuries) . . . . . . . . (V01–X59,
Y85–Y86) 173,040 112,720 60,320 125,151 78,616 46,535 21,615 15,142 6,473 2,046 1,303 743 3,092 1,978 1,114 189 143 46 18,874 14,147 4,727Motor vehicle accidents . . .
(V02–V04,V09.0, V09.2,V12–V14, V19.0–V19.2,V19.4–V19.6,V20–V79,
V80.3–V80.5, V81.0–V81.1,V82.0–V82.1, V83–V86,
V87.0–V87.8, V88.0–V88.8,V89.0,V89.2) 39,107 27,835 11,272 24,770 17,501 7,269 6,196 4,481 1,715 633 385 248 824 515 309 65 54 11 6,165 4,584 1,581
Falls . . . . . . . . .(W00–W19) 39,443 20,088 19,355 33,801 16,785 17,016 1,789 1,000 789 202 118 84 1,024 580 444 31 20 11 2,424 1,494 930Accidental discharge of firearms . . . . .(W32–W34) 486 436 50 291 257 34 115 105 10 6 5 1 8 8 – 1 1 – 60 55 5
Accidental drowning and submersion . .(W65–W74) 3,692 2,784 908 2,270 1,641 629 564 458 106 68 57 11 175 125 50 8 8 – 534 438 96
Accidental hanging, strangulation,and suffocation . . .(W75–W84) 7,076 4,124 2,952 5,113 2,969 2,144 1,066 607 459 71 45 26 170 99 71 9 4 5 540 334 206
Accidental exposure to smoke, fire and flames . . . . . . . . (X00–X09) 2,692 1,613 1,079 1,897 1,119 778 496 301 195 34 21 13 34 21 13 – – – 200 136 64
Accidental poisoning and exposure to noxious substances . . . . (X40–X49) 65,773 46,169 19,604 45,981 31,344 14,637 9,702 7,045 2,657 822 510 312 586 464 122 56 42 14 7,543 6,029 1,514
Intentional self-harm (suicide) . . . . . . . . . . . (*U03,
X60–X84, Y87.0)4 47,511 37,256 10,255 37,428 29,382 8,046 3,115 2,491 624 546 401 145 1,342 950 392 90 72 18 4,331 3,445 886Intentional self-harm (suicide) by poisoning . . . . . (X60–X69) 6,125 3,046 3,079 5,086 2,522 2,564 318 148 170 45 20 25 183 105 78 5 3 2 418 218 200
Intentional self-harm (suicide) by hanging, strangulation and suffocation . . . . . . . . (X70) 13,563 10,592 2,971 9,588 7,549 2,039 871 669 202 303 221 82 606 407 199 54 44 10 1,896 1,516 380
Intentional self-harm (suicide) by discharge of firearms . . . . . . (X72–X74) 23,941 20,725 3,216 20,090 17,329 2,761 1,546 1,378 168 154 128 26 316 276 40 21 19 2 1,534 1,350 184
See footnotes at end of table.
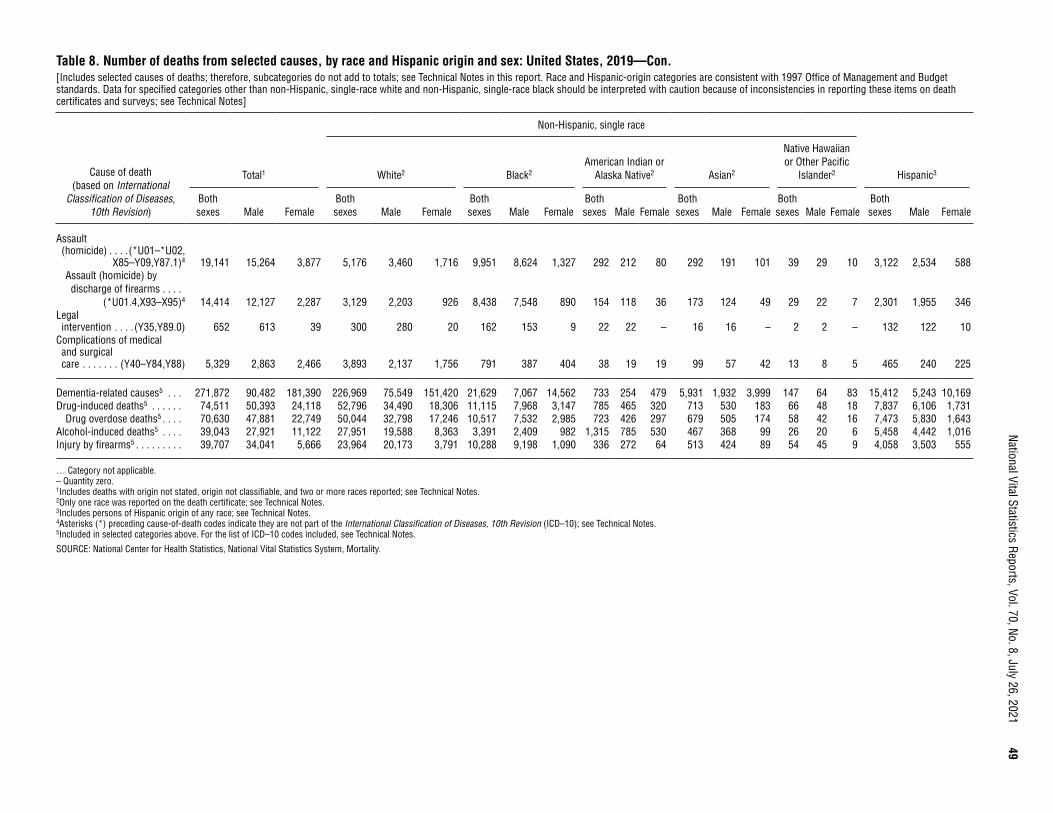
National Vital Statistics Reports, Vol. 70, No. 8, July 26, 2021
49
Table 8. Number of deaths from selected causes, by race and Hispanic origin and sex: United States, 2019—Con.[Includes selected causes of deaths; therefore, subcategories do not add to totals; see Technical Notes in this report. Race and Hispanic-origin categories are consistent with 1997 Office of Management and Budget standards. Data for specified categories other than non-Hispanic, single-race white and non-Hispanic, single-race black should be interpreted with caution because of inconsistencies in reporting these items on death certificates and surveys; see Technical Notes]
Cause of death (based on International
Classification of Diseases, 10th Revision)
Total1
Non-Hispanic, single race
Hispanic3White2 Black2American Indian or
Alaska Native2 Asian2
Native Hawaiian or Other Pacific
Islander2
Both sexes Male Female
Both sexes Male Female
Both sexes Male Female
Both sexes Male Female
Both sexes Male Female
Both sexes Male Female
Both sexes Male Female
Assault (homicide) . . . .(*U01–*U02,
X85–Y09,Y87.1)4 19,141 15,264 3,877 5,176 3,460 1,716 9,951 8,624 1,327 292 212 80 292 191 101 39 29 10 3,122 2,534 588Assault (homicide) by discharge of firearms . . . .
(*U01.4,X93–X95)4 14,414 12,127 2,287 3,129 2,203 926 8,438 7,548 890 154 118 36 173 124 49 29 22 7 2,301 1,955 346Legal intervention . . . . (Y35,Y89.0) 652 613 39 300 280 20 162 153 9 22 22 – 16 16 – 2 2 – 132 122 10
Complications of medical and surgical care . . . . . . . (Y40–Y84,Y88) 5,329 2,863 2,466 3,893 2,137 1,756 791 387 404 38 19 19 99 57 42 13 8 5 465 240 225
Dementia-related causes5 . . . 271,872 90,482 181,390 226,969 75,549 151,420 21,629 7,067 14,562 733 254 479 5,931 1,932 3,999 147 64 83 15,412 5,243 10,169Drug-induced deaths5 . . . . . . 74,511 50,393 24,118 52,796 34,490 18,306 11,115 7,968 3,147 785 465 320 713 530 183 66 48 18 7,837 6,106 1,731
Drug overdose deaths5 . . . . 70,630 47,881 22,749 50,044 32,798 17,246 10,517 7,532 2,985 723 426 297 679 505 174 58 42 16 7,473 5,830 1,643Alcohol-induced deaths5 . . . . 39,043 27,921 11,122 27,951 19,588 8,363 3,391 2,409 982 1,315 785 530 467 368 99 26 20 6 5,458 4,442 1,016Injury by firearms5 . . . . . . . . . 39,707 34,041 5,666 23,964 20,173 3,791 10,288 9,198 1,090 336 272 64 513 424 89 54 45 9 4,058 3,503 555
… Category not applicable. – Quantity zero. 1Includes deaths with origin not stated, origin not classifiable, and two or more races reported; see Technical Notes. 2Only one race was reported on the death certificate; see Technical Notes. 3Includes persons of Hispanic origin of any race; see Technical Notes. 4Asterisks (*) preceding cause-of-death codes indicate they are not part of the International Classification of Diseases, 10th Revision (ICD–10); see Technical Notes. 5Included in selected categories above. For the list of ICD–10 codes included, see Technical Notes.
SOURCE: National Center for Health Statistics, National Vital Statistics System, Mortality.

50
National Vital Statistics Reports, Vol. 70, No. 8, July 26, 2021Table 9. Death rates for selected causes, by race and Hispanic origin and sex: United States, 2019[Rates are on an annual basis per 100,000 population in specified group; see Technical Notes in this report. Race and Hispanic-origin categories are consistent with 1997 Office of Management and Budget standards. Data for specified categories other than non-Hispanic, single-race white and non-Hispanic, single-race black should be interpreted with caution because of inconsistencies in reporting these items on death certificates and surveys; see Technical Notes]
Cause of death (based on International
Classification of Diseases, 10th Revision)
Total1
Non-Hispanic, single race
Hispanic3White2 Black2American Indian or
Alaska Native2 Asian2Native Hawaiian or
Other Pacific Islander2
Both sexes Male Female
Both sexes Male Female
Both sexes Male Female
Both sexes Male Female
Both sexes Male Female
Both sexes Male Female
Both sexes Male Female
All causes . . . . . . . . . . . . . . . . 869.7 911.7 829.0 1,106.8 1,146.6 1,068.1 842.5 921.8 769.9 741.6 812.1 673.3 373.1 398.7 349.8 585.8 646.5 524.4 350.7 384.9 315.7
Enterocolitis due to Clostridium difficile . . . . . . . . . . . (A04.7) 1.4 1.2 1.6 1.8 1.5 2.1 1.1 0.8 1.3 1.7 * 2.0 0.4 0.4 0.5 * * * 0.6 0.5 0.6
Septicemia . . . . . . . (A40–A41) 11.7 11.7 11.7 14.3 14.2 14.3 15.4 15.3 15.5 10.7 10.9 10.5 3.8 3.7 3.8 8.2 7.3 9.1 4.5 4.7 4.2Viral hepatitis . . . . . (B15–B19) 1.3 1.7 0.9 1.4 1.8 0.9 1.5 2.1 1.0 2.3 2.5 2.0 1.0 1.3 0.7 * * * 1.1 1.3 0.8Human immunodeficiency virus (HIV) disease . . . . . . . . . (B20–B24) 1.5 2.3 0.8 0.8 1.4 0.3 6.2 8.7 3.9 1.3 1.8 * 0.3 0.5 * * * * 1.2 1.9 0.5
Malignant neoplasms . . . . . . (C00–C97) 182.7 195.4 170.3 233.6 252.2 215.6 171.4 180.1 163.4 122.3 128.2 116.7 93.6 98.7 89.0 126.2 125.1 127.3 71.1 73.0 69.2Malignant neoplasms of lip, oral cavity and pharynx . . . . . . (C00–C14) 3.2 4.6 1.9 4.2 5.9 2.5 2.6 3.9 1.3 1.8 2.5 * 2.2 3.1 1.4 * * * 1.0 1.4 0.6
Malignant neoplasm of esophagus . . . . . . . . (C15) 4.9 7.9 1.9 6.8 11.3 2.5 3.0 4.4 1.7 3.4 4.8 2.1 1.5 2.4 0.7 * * * 1.3 2.1 0.5
Malignant neoplasm of stomach . . . . . . . . . (C16) 3.4 4.1 2.7 3.1 4.0 2.3 4.6 5.7 3.6 4.0 5.2 2.9 4.5 5.1 3.9 5.0 * * 3.2 3.5 2.9
Malignant neoplasms of colon, rectum and anus . . . . . . . . . (C18–C21) 16.1 17.4 14.9 19.8 21.2 18.5 17.1 19.1 15.2 12.1 12.2 12.0 9.4 10.2 8.5 9.7 11.3 8.1 7.2 8.0 6.4
Malignant neoplasms of liver and intrahepatic bile ducts . . . . . . . . . . . . (C22) 8.5 11.6 5.6 9.4 12.6 6.2 8.8 12.8 5.2 9.9 13.4 6.5 8.6 11.9 5.6 10.1 15.3 * 6.1 8.0 4.2
Malignant neoplasm of pancreas . . . . . . . . . . (C25) 14.0 14.7 13.3 17.6 18.8 16.5 13.8 13.8 13.9 7.8 7.8 7.8 7.5 7.7 7.3 7.2 7.0 7.4 5.8 5.9 5.7
Malignant neoplasms of trachea, bronchus and lung . . . . . . . . . (C33–C34) 42.6 46.3 38.9 57.7 61.9 53.5 36.2 42.8 30.1 28.9 29.0 28.7 19.3 22.1 16.7 24.2 27.7 20.6 9.4 10.9 7.8
Malignant melanoma of skin . . . . . . . . . . . . . (C43) 2.5 3.3 1.7 3.9 5.2 2.6 0.3 0.3 0.2 * * * 0.2 0.2 0.3 * * * 0.4 0.5 0.4
Malignant neoplasm of breast . . . . . . . . . . . (C50) 13.0 0.3 25.4 15.7 0.4 30.6 16.1 0.4 30.5 8.7 * 16.9 6.7 * 12.7 10.7 * 21.6 5.5 * 11.0
Malignant neoplasm of cervix uteri . . . . . . . . (C53) 1.3 … 2.5 1.3 … 2.5 1.9 … 3.6 1.3 … 2.5 0.8 … 1.6 * … * 1.0 … 2.0
Malignant neoplasm of ovary . . . . . . . . . . . . (C56) 4.1 … 8.1 5.2 … 10.3 3.4 … 6.5 2.0 … 4.0 2.6 … 4.9 * … * 1.8 … 3.7
Malignant neoplasm of prostate . . . . . . . . . . (C61) 9.6 19.6 … 11.8 23.9 … 12.9 27.0 … 5.4 11.0 … 3.0 6.3 … 5.2 10.3 … 3.5 7.0 …
See footnotes at end of table.
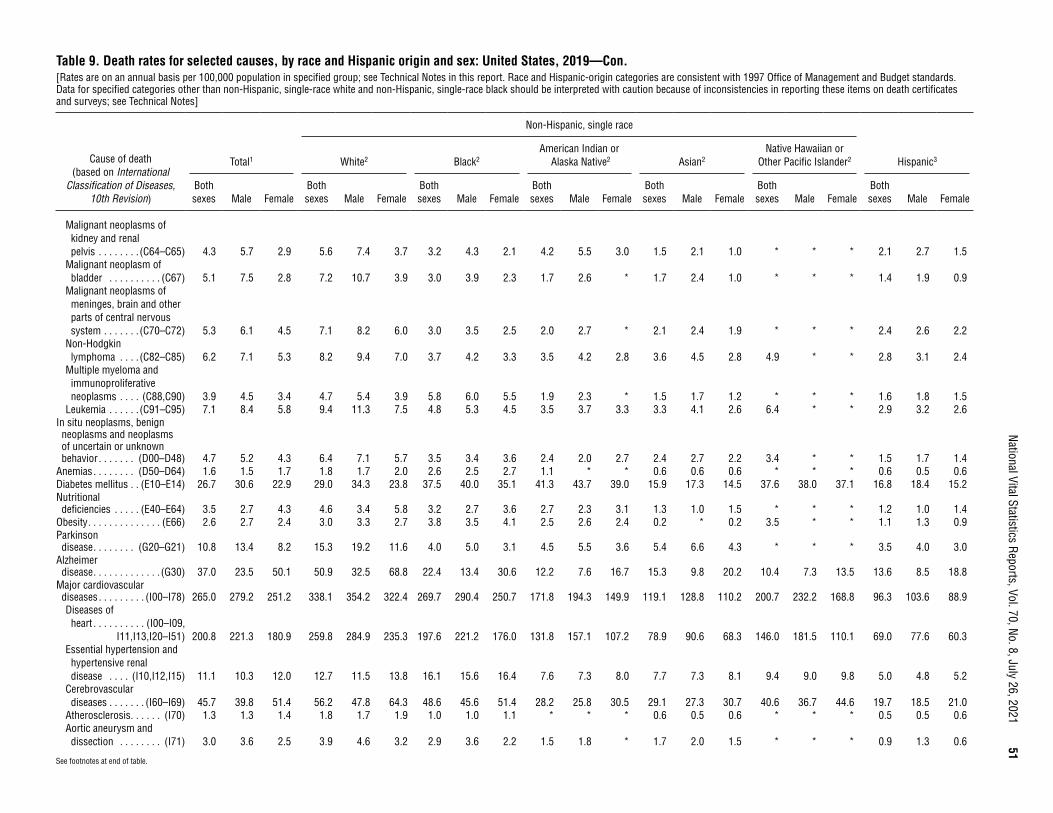
National Vital Statistics Reports, Vol. 70, No. 8, July 26, 2021
51
See footnotes at end of table.
Table 9. Death rates for selected causes, by race and Hispanic origin and sex: United States, 2019—Con.[Rates are on an annual basis per 100,000 population in specified group; see Technical Notes in this report. Race and Hispanic-origin categories are consistent with 1997 Office of Management and Budget standards. Data for specified categories other than non-Hispanic, single-race white and non-Hispanic, single-race black should be interpreted with caution because of inconsistencies in reporting these items on death certificates and surveys; see Technical Notes]
Cause of death (based on International
Classification of Diseases, 10th Revision)
Total1
Non-Hispanic, single race
Hispanic3White2 Black2American Indian or
Alaska Native2 Asian2Native Hawaiian or
Other Pacific Islander2
Both sexes Male Female
Both sexes Male Female
Both sexes Male Female
Both sexes Male Female
Both sexes Male Female
Both sexes Male Female
Both sexes Male Female
Malignant neoplasms of kidney and renal pelvis . . . . . . . . (C64–C65) 4.3 5.7 2.9 5.6 7.4 3.7 3.2 4.3 2.1 4.2 5.5 3.0 1.5 2.1 1.0 * * * 2.1 2.7 1.5
Malignant neoplasm of bladder . . . . . . . . . . (C67) 5.1 7.5 2.8 7.2 10.7 3.9 3.0 3.9 2.3 1.7 2.6 * 1.7 2.4 1.0 * * * 1.4 1.9 0.9
Malignant neoplasms of meninges, brain and other parts of central nervous system . . . . . . . (C70–C72) 5.3 6.1 4.5 7.1 8.2 6.0 3.0 3.5 2.5 2.0 2.7 * 2.1 2.4 1.9 * * * 2.4 2.6 2.2
Non-Hodgkin lymphoma . . . . (C82–C85) 6.2 7.1 5.3 8.2 9.4 7.0 3.7 4.2 3.3 3.5 4.2 2.8 3.6 4.5 2.8 4.9 * * 2.8 3.1 2.4
Multiple myeloma and immunoproliferative neoplasms . . . . (C88,C90) 3.9 4.5 3.4 4.7 5.4 3.9 5.8 6.0 5.5 1.9 2.3 * 1.5 1.7 1.2 * * * 1.6 1.8 1.5
Leukemia . . . . . . (C91–C95) 7.1 8.4 5.8 9.4 11.3 7.5 4.8 5.3 4.5 3.5 3.7 3.3 3.3 4.1 2.6 6.4 * * 2.9 3.2 2.6In situ neoplasms, benign neoplasms and neoplasms of uncertain or unknown behavior . . . . . . . (D00–D48) 4.7 5.2 4.3 6.4 7.1 5.7 3.5 3.4 3.6 2.4 2.0 2.7 2.4 2.7 2.2 3.4 * * 1.5 1.7 1.4
Anemias . . . . . . . . (D50–D64) 1.6 1.5 1.7 1.8 1.7 2.0 2.6 2.5 2.7 1.1 * * 0.6 0.6 0.6 * * * 0.6 0.5 0.6Diabetes mellitus . . (E10–E14) 26.7 30.6 22.9 29.0 34.3 23.8 37.5 40.0 35.1 41.3 43.7 39.0 15.9 17.3 14.5 37.6 38.0 37.1 16.8 18.4 15.2Nutritional deficiencies . . . . . (E40–E64) 3.5 2.7 4.3 4.6 3.4 5.8 3.2 2.7 3.6 2.7 2.3 3.1 1.3 1.0 1.5 * * * 1.2 1.0 1.4
Obesity . . . . . . . . . . . . . . (E66) 2.6 2.7 2.4 3.0 3.3 2.7 3.8 3.5 4.1 2.5 2.6 2.4 0.2 * 0.2 3.5 * * 1.1 1.3 0.9Parkinson disease . . . . . . . . (G20–G21) 10.8 13.4 8.2 15.3 19.2 11.6 4.0 5.0 3.1 4.5 5.5 3.6 5.4 6.6 4.3 * * * 3.5 4.0 3.0
Alzheimer disease . . . . . . . . . . . . . (G30) 37.0 23.5 50.1 50.9 32.5 68.8 22.4 13.4 30.6 12.2 7.6 16.7 15.3 9.8 20.2 10.4 7.3 13.5 13.6 8.5 18.8
Major cardiovascular diseases . . . . . . . . . (I00–I78) 265.0 279.2 251.2 338.1 354.2 322.4 269.7 290.4 250.7 171.8 194.3 149.9 119.1 128.8 110.2 200.7 232.2 168.8 96.3 103.6 88.9Diseases of heart . . . . . . . . . . (I00–I09,
I11,I13,I20–I51) 200.8 221.3 180.9 259.8 284.9 235.3 197.6 221.2 176.0 131.8 157.1 107.2 78.9 90.6 68.3 146.0 181.5 110.1 69.0 77.6 60.3Essential hypertension and hypertensive renal disease . . . . (I10,I12,I15) 11.1 10.3 12.0 12.7 11.5 13.8 16.1 15.6 16.4 7.6 7.3 8.0 7.7 7.3 8.1 9.4 9.0 9.8 5.0 4.8 5.2
Cerebrovascular diseases . . . . . . . (I60–I69) 45.7 39.8 51.4 56.2 47.8 64.3 48.6 45.6 51.4 28.2 25.8 30.5 29.1 27.3 30.7 40.6 36.7 44.6 19.7 18.5 21.0
Atherosclerosis . . . . . . (I70) 1.3 1.3 1.4 1.8 1.7 1.9 1.0 1.0 1.1 * * * 0.6 0.5 0.6 * * * 0.5 0.5 0.6Aortic aneurysm and dissection . . . . . . . . (I71) 3.0 3.6 2.5 3.9 4.6 3.2 2.9 3.6 2.2 1.5 1.8 * 1.7 2.0 1.5 * * * 0.9 1.3 0.6
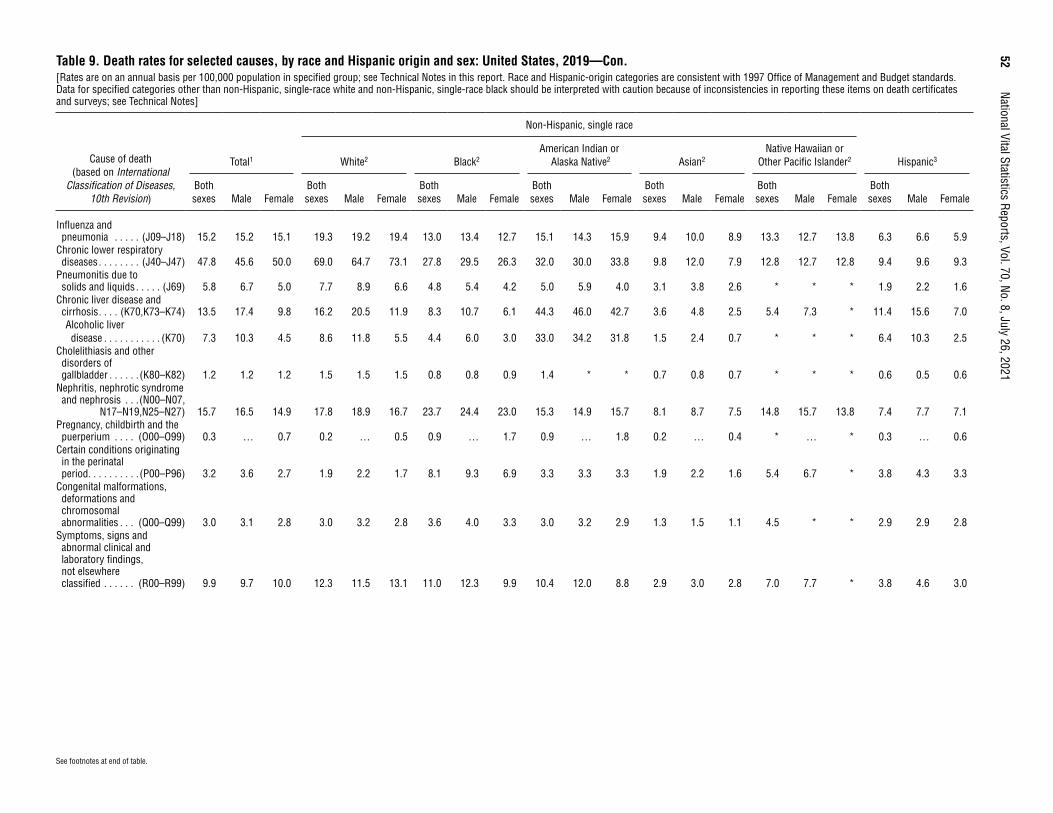
52
National Vital Statistics Reports, Vol. 70, No. 8, July 26, 2021
See footnotes at end of table.
Table 9. Death rates for selected causes, by race and Hispanic origin and sex: United States, 2019—Con.[Rates are on an annual basis per 100,000 population in specified group; see Technical Notes in this report. Race and Hispanic-origin categories are consistent with 1997 Office of Management and Budget standards. Data for specified categories other than non-Hispanic, single-race white and non-Hispanic, single-race black should be interpreted with caution because of inconsistencies in reporting these items on death certificates and surveys; see Technical Notes]
Cause of death (based on International
Classification of Diseases, 10th Revision)
Total1
Non-Hispanic, single race
Hispanic3White2 Black2American Indian or
Alaska Native2 Asian2Native Hawaiian or
Other Pacific Islander2
Both sexes Male Female
Both sexes Male Female
Both sexes Male Female
Both sexes Male Female
Both sexes Male Female
Both sexes Male Female
Both sexes Male Female
Influenza and pneumonia . . . . . (J09–J18) 15.2 15.2 15.1 19.3 19.2 19.4 13.0 13.4 12.7 15.1 14.3 15.9 9.4 10.0 8.9 13.3 12.7 13.8 6.3 6.6 5.9
Chronic lower respiratory diseases . . . . . . . . (J40–J47) 47.8 45.6 50.0 69.0 64.7 73.1 27.8 29.5 26.3 32.0 30.0 33.8 9.8 12.0 7.9 12.8 12.7 12.8 9.4 9.6 9.3
Pneumonitis due to solids and liquids . . . . . (J69) 5.8 6.7 5.0 7.7 8.9 6.6 4.8 5.4 4.2 5.0 5.9 4.0 3.1 3.8 2.6 * * * 1.9 2.2 1.6
Chronic liver disease and cirrhosis . . . . (K70,K73–K74) 13.5 17.4 9.8 16.2 20.5 11.9 8.3 10.7 6.1 44.3 46.0 42.7 3.6 4.8 2.5 5.4 7.3 * 11.4 15.6 7.0Alcoholic liver disease . . . . . . . . . . . (K70) 7.3 10.3 4.5 8.6 11.8 5.5 4.4 6.0 3.0 33.0 34.2 31.8 1.5 2.4 0.7 * * * 6.4 10.3 2.5
Cholelithiasis and other disorders of gallbladder . . . . . . (K80–K82) 1.2 1.2 1.2 1.5 1.5 1.5 0.8 0.8 0.9 1.4 * * 0.7 0.8 0.7 * * * 0.6 0.5 0.6
Nephritis, nephrotic syndrome and nephrosis . . .(N00–N07,
N17–N19,N25–N27) 15.7 16.5 14.9 17.8 18.9 16.7 23.7 24.4 23.0 15.3 14.9 15.7 8.1 8.7 7.5 14.8 15.7 13.8 7.4 7.7 7.1Pregnancy, childbirth and the puerperium . . . . (O00–O99) 0.3 … 0.7 0.2 … 0.5 0.9 … 1.7 0.9 … 1.8 0.2 … 0.4 * … * 0.3 … 0.6
Certain conditions originating in the perinatal period . . . . . . . . . . (P00–P96) 3.2 3.6 2.7 1.9 2.2 1.7 8.1 9.3 6.9 3.3 3.3 3.3 1.9 2.2 1.6 5.4 6.7 * 3.8 4.3 3.3
Congenital malformations, deformations and chromosomal abnormalities . . . (Q00–Q99) 3.0 3.1 2.8 3.0 3.2 2.8 3.6 4.0 3.3 3.0 3.2 2.9 1.3 1.5 1.1 4.5 * * 2.9 2.9 2.8
Symptoms, signs and abnormal clinical and laboratory findings, not elsewhere classified . . . . . . (R00–R99) 9.9 9.7 10.0 12.3 11.5 13.1 11.0 12.3 9.9 10.4 12.0 8.8 2.9 3.0 2.8 7.0 7.7 * 3.8 4.6 3.0
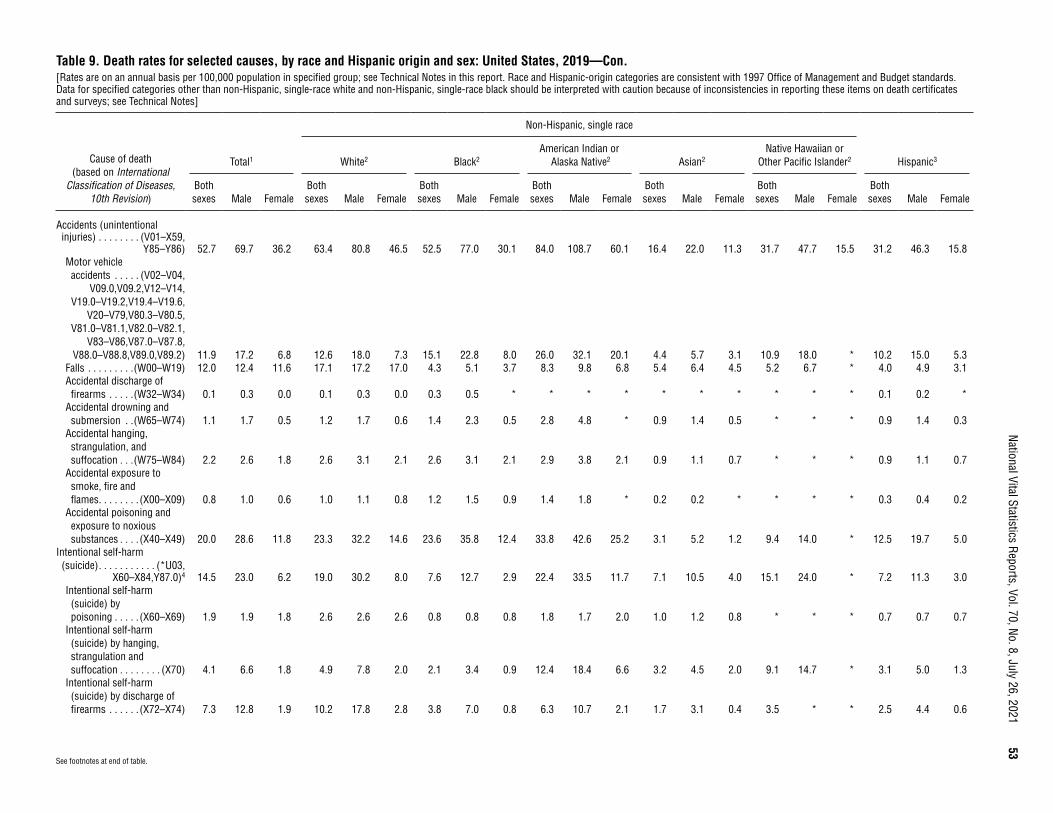
National Vital Statistics Reports, Vol. 70, No. 8, July 26, 2021
53
See footnotes at end of table.
Table 9. Death rates for selected causes, by race and Hispanic origin and sex: United States, 2019—Con.[Rates are on an annual basis per 100,000 population in specified group; see Technical Notes in this report. Race and Hispanic-origin categories are consistent with 1997 Office of Management and Budget standards. Data for specified categories other than non-Hispanic, single-race white and non-Hispanic, single-race black should be interpreted with caution because of inconsistencies in reporting these items on death certificates and surveys; see Technical Notes]
Cause of death (based on International
Classification of Diseases, 10th Revision)
Total1
Non-Hispanic, single race
Hispanic3White2 Black2American Indian or
Alaska Native2 Asian2Native Hawaiian or
Other Pacific Islander2
Both sexes Male Female
Both sexes Male Female
Both sexes Male Female
Both sexes Male Female
Both sexes Male Female
Both sexes Male Female
Both sexes Male Female
Accidents (unintentional injuries) . . . . . . . . (V01–X59,
Y85–Y86) 52.7 69.7 36.2 63.4 80.8 46.5 52.5 77.0 30.1 84.0 108.7 60.1 16.4 22.0 11.3 31.7 47.7 15.5 31.2 46.3 15.8Motor vehicle accidents . . . . . (V02–V04,
V09.0,V09.2,V12–V14,V19.0–V19.2,V19.4–V19.6,
V20–V79,V80.3–V80.5,V81.0–V81.1,V82.0–V82.1,
V83–V86,V87.0–V87.8,V88.0–V88.8,V89.0,V89.2) 11.9 17.2 6.8 12.6 18.0 7.3 15.1 22.8 8.0 26.0 32.1 20.1 4.4 5.7 3.1 10.9 18.0 * 10.2 15.0 5.3
Falls . . . . . . . . .(W00–W19) 12.0 12.4 11.6 17.1 17.2 17.0 4.3 5.1 3.7 8.3 9.8 6.8 5.4 6.4 4.5 5.2 6.7 * 4.0 4.9 3.1Accidental discharge of firearms . . . . .(W32–W34) 0.1 0.3 0.0 0.1 0.3 0.0 0.3 0.5 * * * * * * * * * * 0.1 0.2 *
Accidental drowning and submersion . .(W65–W74) 1.1 1.7 0.5 1.2 1.7 0.6 1.4 2.3 0.5 2.8 4.8 * 0.9 1.4 0.5 * * * 0.9 1.4 0.3
Accidental hanging, strangulation, and suffocation . . .(W75–W84) 2.2 2.6 1.8 2.6 3.1 2.1 2.6 3.1 2.1 2.9 3.8 2.1 0.9 1.1 0.7 * * * 0.9 1.1 0.7
Accidental exposure to smoke, fire and flames . . . . . . . . (X00–X09) 0.8 1.0 0.6 1.0 1.1 0.8 1.2 1.5 0.9 1.4 1.8 * 0.2 0.2 * * * * 0.3 0.4 0.2
Accidental poisoning and exposure to noxious substances . . . . (X40–X49) 20.0 28.6 11.8 23.3 32.2 14.6 23.6 35.8 12.4 33.8 42.6 25.2 3.1 5.2 1.2 9.4 14.0 * 12.5 19.7 5.0
Intentional self-harm (suicide) . . . . . . . . . . . (*U03,
X60–X84,Y87.0)4 14.5 23.0 6.2 19.0 30.2 8.0 7.6 12.7 2.9 22.4 33.5 11.7 7.1 10.5 4.0 15.1 24.0 * 7.2 11.3 3.0Intentional self-harm (suicide) by poisoning . . . . . (X60–X69) 1.9 1.9 1.8 2.6 2.6 2.6 0.8 0.8 0.8 1.8 1.7 2.0 1.0 1.2 0.8 * * * 0.7 0.7 0.7
Intentional self-harm (suicide) by hanging, strangulation and suffocation . . . . . . . . (X70) 4.1 6.6 1.8 4.9 7.8 2.0 2.1 3.4 0.9 12.4 18.4 6.6 3.2 4.5 2.0 9.1 14.7 * 3.1 5.0 1.3
Intentional self-harm (suicide) by discharge of firearms . . . . . . (X72–X74) 7.3 12.8 1.9 10.2 17.8 2.8 3.8 7.0 0.8 6.3 10.7 2.1 1.7 3.1 0.4 3.5 * * 2.5 4.4 0.6
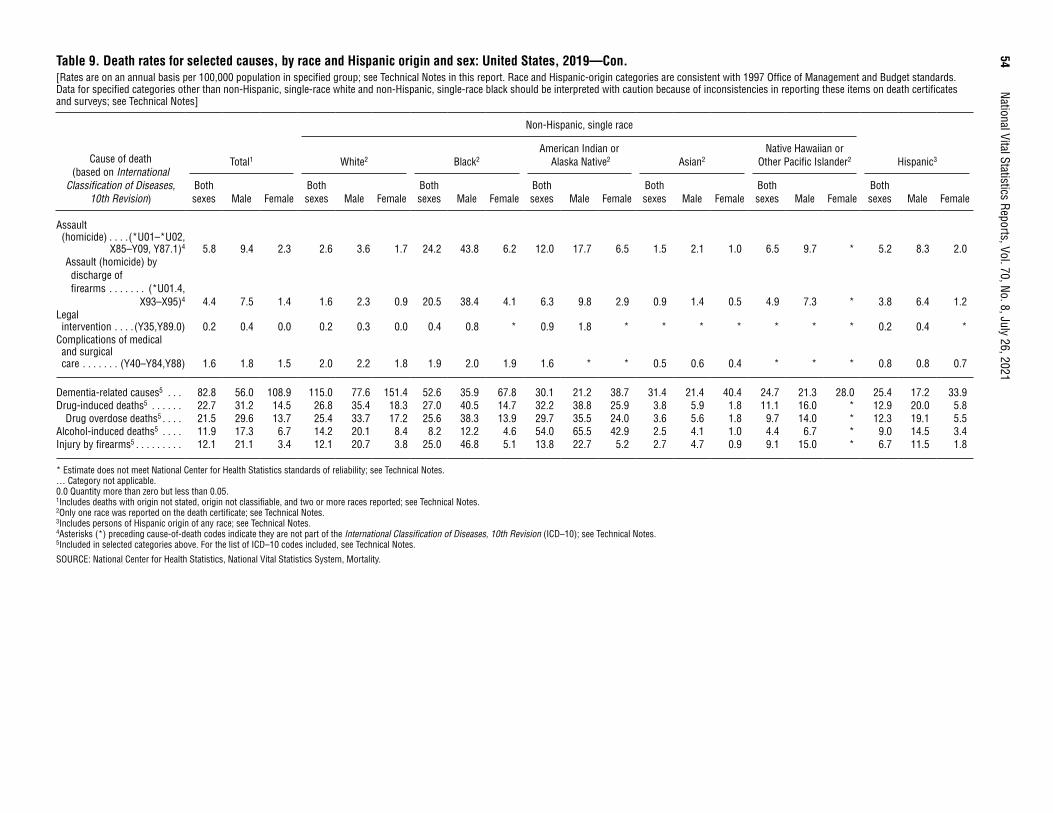
54 National Vital Statistics Reports, Vol. 70, No. 8, July 26, 2021
Table 9. Death rates for selected causes, by race and Hispanic origin and sex: United States, 2019—Con.[Rates are on an annual basis per 100,000 population in specified group; see Technical Notes in this report. Race and Hispanic-origin categories are consistent with 1997 Office of Management and Budget standards. Data for specified categories other than non-Hispanic, single-race white and non-Hispanic, single-race black should be interpreted with caution because of inconsistencies in reporting these items on death certificates and surveys; see Technical Notes]
Cause of death (based on International
Classification of Diseases, 10th Revision)
Total1
Non-Hispanic, single race
Hispanic3White2 Black2American Indian or
Alaska Native2 Asian2Native Hawaiian or
Other Pacific Islander2
Both sexes Male Female
Both sexes Male Female
Both sexes Male Female
Both sexes Male Female
Both sexes Male Female
Both sexes Male Female
Both sexes Male Female
Assault (homicide) . . . .(*U01–*U02,
X85–Y09, Y87.1)4 5.8 9.4 2.3 2.6 3.6 1.7 24.2 43.8 6.2 12.0 17.7 6.5 1.5 2.1 1.0 6.5 9.7 * 5.2 8.3 2.0Assault (homicide) by discharge of firearms . . . . . . . (*U01.4,
X93–X95)4 4.4 7.5 1.4 1.6 2.3 0.9 20.5 38.4 4.1 6.3 9.8 2.9 0.9 1.4 0.5 4.9 7.3 * 3.8 6.4 1.2Legal intervention . . . . (Y35,Y89.0) 0.2 0.4 0.0 0.2 0.3 0.0 0.4 0.8 * 0.9 1.8 * * * * * * * 0.2 0.4 *
Complications of medical and surgical care . . . . . . . (Y40–Y84,Y88) 1.6 1.8 1.5 2.0 2.2 1.8 1.9 2.0 1.9 1.6 * * 0.5 0.6 0.4 * * * 0.8 0.8 0.7
Dementia-related causes5 . . . 82.8 56.0 108.9 115.0 77.6 151.4 52.6 35.9 67.8 30.1 21.2 38.7 31.4 21.4 40.4 24.7 21.3 28.0 25.4 17.2 33.9Drug-induced deaths5 . . . . . . 22.7 31.2 14.5 26.8 35.4 18.3 27.0 40.5 14.7 32.2 38.8 25.9 3.8 5.9 1.8 11.1 16.0 * 12.9 20.0 5.8
Drug overdose deaths5 . . . . 21.5 29.6 13.7 25.4 33.7 17.2 25.6 38.3 13.9 29.7 35.5 24.0 3.6 5.6 1.8 9.7 14.0 * 12.3 19.1 5.5Alcohol-induced deaths5 . . . . 11.9 17.3 6.7 14.2 20.1 8.4 8.2 12.2 4.6 54.0 65.5 42.9 2.5 4.1 1.0 4.4 6.7 * 9.0 14.5 3.4Injury by firearms5 . . . . . . . . . 12.1 21.1 3.4 12.1 20.7 3.8 25.0 46.8 5.1 13.8 22.7 5.2 2.7 4.7 0.9 9.1 15.0 * 6.7 11.5 1.8
* Estimate does not meet National Center for Health Statistics standards of reliability; see Technical Notes. … Category not applicable. 0.0 Quantity more than zero but less than 0.05. 1Includes deaths with origin not stated, origin not classifiable, and two or more races reported; see Technical Notes. 2Only one race was reported on the death certificate; see Technical Notes. 3Includes persons of Hispanic origin of any race; see Technical Notes. 4Asterisks (*) preceding cause-of-death codes indicate they are not part of the International Classification of Diseases, 10th Revision (ICD–10); see Technical Notes. 5Included in selected categories above. For the list of ICD–10 codes included, see Technical Notes.
SOURCE: National Center for Health Statistics, National Vital Statistics System, Mortality.
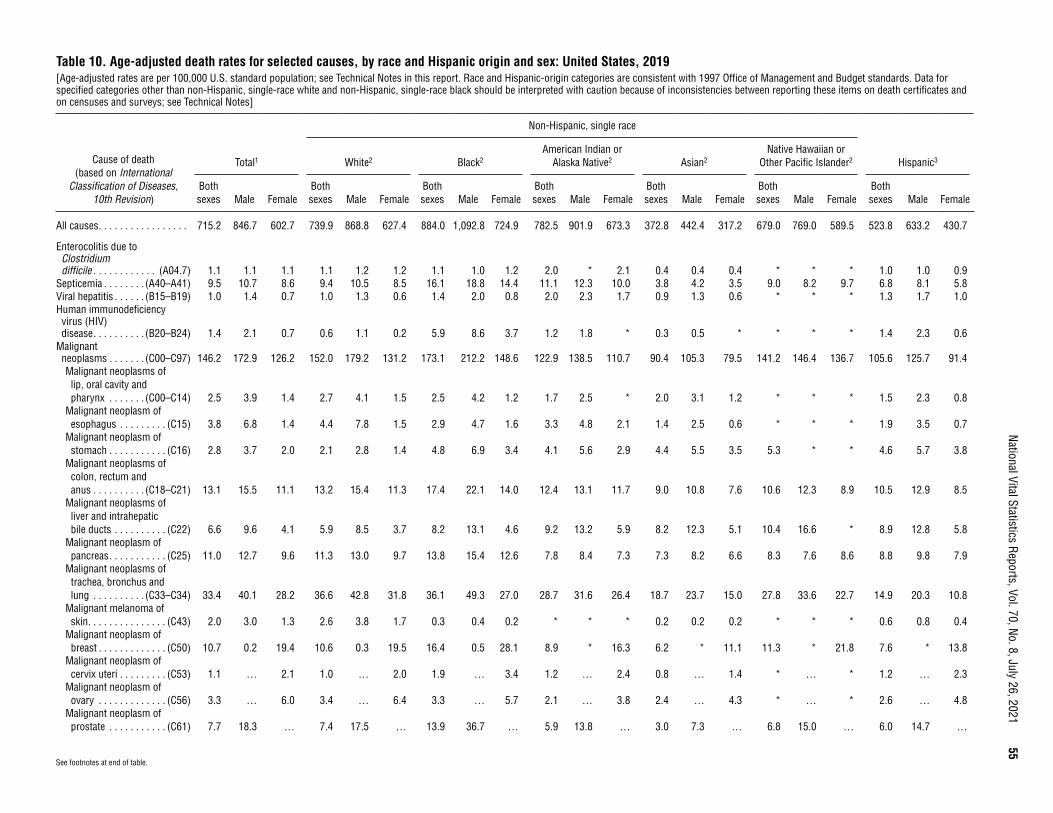
National Vital Statistics Reports, Vol. 70, No. 8, July 26, 2021
55
Table 10. Age-adjusted death rates for selected causes, by race and Hispanic origin and sex: United States, 2019[Age-adjusted rates are per 100,000 U.S. standard population; see Technical Notes in this report. Race and Hispanic-origin categories are consistent with 1997 Office of Management and Budget standards. Data for specified categories other than non-Hispanic, single-race white and non-Hispanic, single-race black should be interpreted with caution because of inconsistencies between reporting these items on death certificates and on censuses and surveys; see Technical Notes]
Cause of death (based on International
Classification of Diseases, 10th Revision)
Total1
Non-Hispanic, single race
Hispanic3White2 Black2American Indian or
Alaska Native2 Asian2Native Hawaiian or
Other Pacific Islander2
Both sexes Male Female
Both sexes Male Female
Both sexes Male Female
Both sexes Male Female
Both sexes Male Female
Both sexes Male Female
Both sexes Male Female
All causes . . . . . . . . . . . . . . . . . 715.2 846.7 602.7 739.9 868.8 627.4 884.0 1,092.8 724.9 782.5 901.9 673.3 372.8 442.4 317.2 679.0 769.0 589.5 523.8 633.2 430.7
Enterocolitis due to Clostridium difficile . . . . . . . . . . . . (A04.7) 1.1 1.1 1.1 1.1 1.2 1.2 1.1 1.0 1.2 2.0 * 2.1 0.4 0.4 0.4 * * * 1.0 1.0 0.9
Septicemia . . . . . . . . (A40–A41) 9.5 10.7 8.6 9.4 10.5 8.5 16.1 18.8 14.4 11.1 12.3 10.0 3.8 4.2 3.5 9.0 8.2 9.7 6.8 8.1 5.8Viral hepatitis . . . . . . (B15–B19) 1.0 1.4 0.7 1.0 1.3 0.6 1.4 2.0 0.8 2.0 2.3 1.7 0.9 1.3 0.6 * * * 1.3 1.7 1.0Human immunodeficiency virus (HIV) disease . . . . . . . . . . (B20–B24) 1.4 2.1 0.7 0.6 1.1 0.2 5.9 8.6 3.7 1.2 1.8 * 0.3 0.5 * * * * 1.4 2.3 0.6
Malignant neoplasms . . . . . . . (C00–C97) 146.2 172.9 126.2 152.0 179.2 131.2 173.1 212.2 148.6 122.9 138.5 110.7 90.4 105.3 79.5 141.2 146.4 136.7 105.6 125.7 91.4Malignant neoplasms of lip, oral cavity and pharynx . . . . . . . (C00–C14) 2.5 3.9 1.4 2.7 4.1 1.5 2.5 4.2 1.2 1.7 2.5 * 2.0 3.1 1.2 * * * 1.5 2.3 0.8
Malignant neoplasm of esophagus . . . . . . . . . (C15) 3.8 6.8 1.4 4.4 7.8 1.5 2.9 4.7 1.6 3.3 4.8 2.1 1.4 2.5 0.6 * * * 1.9 3.5 0.7
Malignant neoplasm of stomach . . . . . . . . . . . (C16) 2.8 3.7 2.0 2.1 2.8 1.4 4.8 6.9 3.4 4.1 5.6 2.9 4.4 5.5 3.5 5.3 * * 4.6 5.7 3.8
Malignant neoplasms of colon, rectum and anus . . . . . . . . . . (C18–C21) 13.1 15.5 11.1 13.2 15.4 11.3 17.4 22.1 14.0 12.4 13.1 11.7 9.0 10.8 7.6 10.6 12.3 8.9 10.5 12.9 8.5
Malignant neoplasms of liver and intrahepatic bile ducts . . . . . . . . . . (C22) 6.6 9.6 4.1 5.9 8.5 3.7 8.2 13.1 4.6 9.2 13.2 5.9 8.2 12.3 5.1 10.4 16.6 * 8.9 12.8 5.8
Malignant neoplasm of pancreas . . . . . . . . . . . (C25) 11.0 12.7 9.6 11.3 13.0 9.7 13.8 15.4 12.6 7.8 8.4 7.3 7.3 8.2 6.6 8.3 7.6 8.6 8.8 9.8 7.9
Malignant neoplasms of trachea, bronchus and lung . . . . . . . . . . (C33–C34) 33.4 40.1 28.2 36.6 42.8 31.8 36.1 49.3 27.0 28.7 31.6 26.4 18.7 23.7 15.0 27.8 33.6 22.7 14.9 20.3 10.8
Malignant melanoma of skin . . . . . . . . . . . . . . . (C43) 2.0 3.0 1.3 2.6 3.8 1.7 0.3 0.4 0.2 * * * 0.2 0.2 0.2 * * * 0.6 0.8 0.4
Malignant neoplasm of breast . . . . . . . . . . . . . (C50) 10.7 0.2 19.4 10.6 0.3 19.5 16.4 0.5 28.1 8.9 * 16.3 6.2 * 11.1 11.3 * 21.8 7.6 * 13.8
Malignant neoplasm of cervix uteri . . . . . . . . . (C53) 1.1 … 2.1 1.0 … 2.0 1.9 … 3.4 1.2 … 2.4 0.8 … 1.4 * … * 1.2 … 2.3
Malignant neoplasm of ovary . . . . . . . . . . . . . (C56) 3.3 … 6.0 3.4 … 6.4 3.3 … 5.7 2.1 … 3.8 2.4 … 4.3 * … * 2.6 … 4.8
Malignant neoplasm of prostate . . . . . . . . . . . (C61) 7.7 18.3 … 7.4 17.5 … 13.9 36.7 … 5.9 13.8 … 3.0 7.3 … 6.8 15.0 … 6.0 14.7 …
See footnotes at end of table.
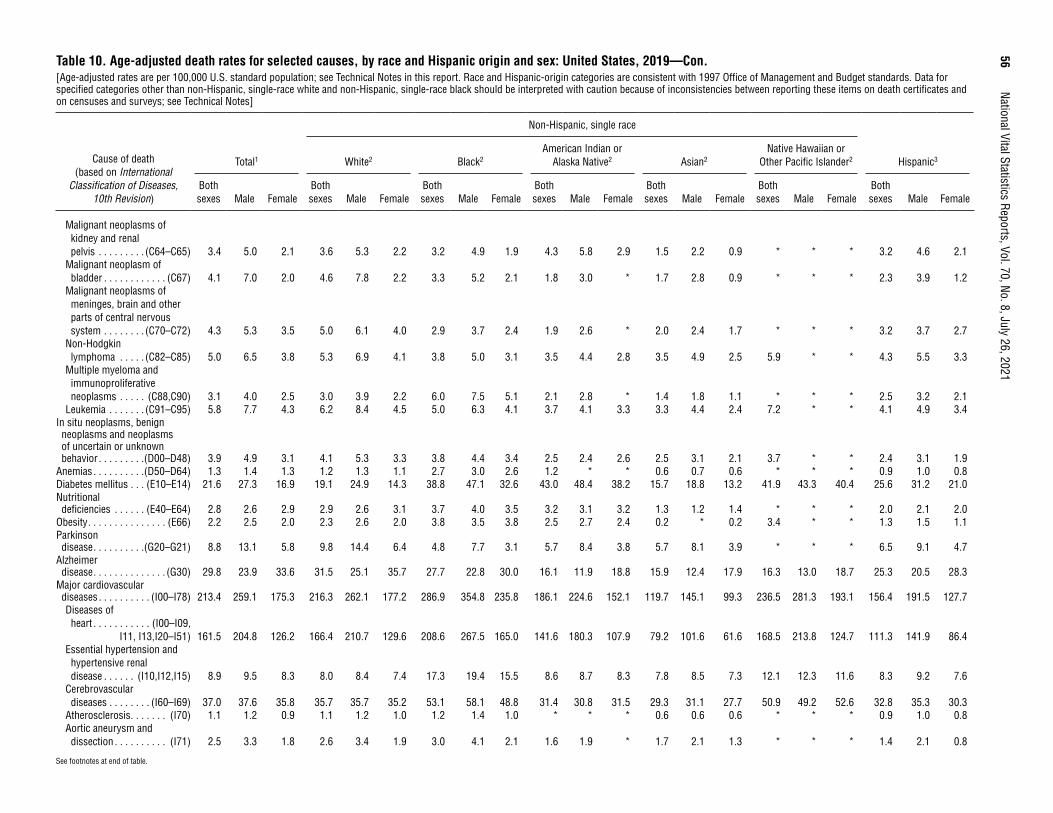
56
National Vital Statistics Reports, Vol. 70, No. 8, July 26, 2021Table 10. Age-adjusted death rates for selected causes, by race and Hispanic origin and sex: United States, 2019—Con.[Age-adjusted rates are per 100,000 U.S. standard population; see Technical Notes in this report. Race and Hispanic-origin categories are consistent with 1997 Office of Management and Budget standards. Data for specified categories other than non-Hispanic, single-race white and non-Hispanic, single-race black should be interpreted with caution because of inconsistencies between reporting these items on death certificates and on censuses and surveys; see Technical Notes]
Cause of death (based on International
Classification of Diseases, 10th Revision)
Total1
Non-Hispanic, single race
Hispanic3White2 Black2American Indian or
Alaska Native2 Asian2Native Hawaiian or
Other Pacific Islander2
Both sexes Male Female
Both sexes Male Female
Both sexes Male Female
Both sexes Male Female
Both sexes Male Female
Both sexes Male Female
Both sexes Male Female
Malignant neoplasms of kidney and renal pelvis . . . . . . . . . (C64–C65) 3.4 5.0 2.1 3.6 5.3 2.2 3.2 4.9 1.9 4.3 5.8 2.9 1.5 2.2 0.9 * * * 3.2 4.6 2.1
Malignant neoplasm of bladder . . . . . . . . . . . . (C67) 4.1 7.0 2.0 4.6 7.8 2.2 3.3 5.2 2.1 1.8 3.0 * 1.7 2.8 0.9 * * * 2.3 3.9 1.2
Malignant neoplasms of meninges, brain and other parts of central nervous system . . . . . . . . (C70–C72) 4.3 5.3 3.5 5.0 6.1 4.0 2.9 3.7 2.4 1.9 2.6 * 2.0 2.4 1.7 * * * 3.2 3.7 2.7
Non-Hodgkin lymphoma . . . . . (C82–C85) 5.0 6.5 3.8 5.3 6.9 4.1 3.8 5.0 3.1 3.5 4.4 2.8 3.5 4.9 2.5 5.9 * * 4.3 5.5 3.3
Multiple myeloma and immunoproliferative neoplasms . . . . . (C88,C90) 3.1 4.0 2.5 3.0 3.9 2.2 6.0 7.5 5.1 2.1 2.8 * 1.4 1.8 1.1 * * * 2.5 3.2 2.1
Leukemia . . . . . . . (C91–C95) 5.8 7.7 4.3 6.2 8.4 4.5 5.0 6.3 4.1 3.7 4.1 3.3 3.3 4.4 2.4 7.2 * * 4.1 4.9 3.4In situ neoplasms, benign neoplasms and neoplasms of uncertain or unknown behavior . . . . . . . . .(D00–D48) 3.9 4.9 3.1 4.1 5.3 3.3 3.8 4.4 3.4 2.5 2.4 2.6 2.5 3.1 2.1 3.7 * * 2.4 3.1 1.9
Anemias . . . . . . . . . .(D50–D64) 1.3 1.4 1.3 1.2 1.3 1.1 2.7 3.0 2.6 1.2 * * 0.6 0.7 0.6 * * * 0.9 1.0 0.8Diabetes mellitus . . . (E10–E14) 21.6 27.3 16.9 19.1 24.9 14.3 38.8 47.1 32.6 43.0 48.4 38.2 15.7 18.8 13.2 41.9 43.3 40.4 25.6 31.2 21.0Nutritional deficiencies . . . . . . (E40–E64) 2.8 2.6 2.9 2.9 2.6 3.1 3.7 4.0 3.5 3.2 3.1 3.2 1.3 1.2 1.4 * * * 2.0 2.1 2.0
Obesity . . . . . . . . . . . . . . . (E66) 2.2 2.5 2.0 2.3 2.6 2.0 3.8 3.5 3.8 2.5 2.7 2.4 0.2 * 0.2 3.4 * * 1.3 1.5 1.1Parkinson disease . . . . . . . . . .(G20–G21) 8.8 13.1 5.8 9.8 14.4 6.4 4.8 7.7 3.1 5.7 8.4 3.8 5.7 8.1 3.9 * * * 6.5 9.1 4.7
Alzheimer disease . . . . . . . . . . . . . . (G30) 29.8 23.9 33.6 31.5 25.1 35.7 27.7 22.8 30.0 16.1 11.9 18.8 15.9 12.4 17.9 16.3 13.0 18.7 25.3 20.5 28.3
Major cardiovascular diseases . . . . . . . . . . (I00–I78) 213.4 259.1 175.3 216.3 262.1 177.2 286.9 354.8 235.8 186.1 224.6 152.1 119.7 145.1 99.3 236.5 281.3 193.1 156.4 191.5 127.7Diseases of heart . . . . . . . . . . . (I00–I09,
I11, I13,I20–I51) 161.5 204.8 126.2 166.4 210.7 129.6 208.6 267.5 165.0 141.6 180.3 107.9 79.2 101.6 61.6 168.5 213.8 124.7 111.3 141.9 86.4Essential hypertension and hypertensive renal disease . . . . . . (I10,I12,I15) 8.9 9.5 8.3 8.0 8.4 7.4 17.3 19.4 15.5 8.6 8.7 8.3 7.8 8.5 7.3 12.1 12.3 11.6 8.3 9.2 7.6
Cerebrovascular diseases . . . . . . . . (I60–I69) 37.0 37.6 35.8 35.7 35.7 35.2 53.1 58.1 48.8 31.4 30.8 31.5 29.3 31.1 27.7 50.9 49.2 52.6 32.8 35.3 30.3
Atherosclerosis . . . . . . . (I70) 1.1 1.2 0.9 1.1 1.2 1.0 1.2 1.4 1.0 * * * 0.6 0.6 0.6 * * * 0.9 1.0 0.8Aortic aneurysm and dissection . . . . . . . . . . (I71) 2.5 3.3 1.8 2.6 3.4 1.9 3.0 4.1 2.1 1.6 1.9 * 1.7 2.1 1.3 * * * 1.4 2.1 0.8
See footnotes at end of table.

National Vital Statistics Reports, Vol. 70, No. 8, July 26, 2021
57
Table 10. Age-adjusted death rates for selected causes, by race and Hispanic origin and sex: United States, 2019—Con.[Age-adjusted rates are per 100,000 U.S. standard population; see Technical Notes in this report. Race and Hispanic-origin categories are consistent with 1997 Office of Management and Budget standards. Data for specified categories other than non-Hispanic, single-race white and non-Hispanic, single-race black should be interpreted with caution because of inconsistencies between reporting these items on death certificates and on censuses and surveys; see Technical Notes]
Cause of death (based on International
Classification of Diseases, 10th Revision)
Total1
Non-Hispanic, single race
Hispanic3White2 Black2American Indian or
Alaska Native2 Asian2Native Hawaiian or
Other Pacific Islander2
Both sexes Male Female
Both sexes Male Female
Both sexes Male Female
Both sexes Male Female
Both sexes Male Female
Both sexes Male Female
Both sexes Male Female
Influenza and pneumonia . . . . . . . (J09–J18) 12.3 14.4 10.7 12.5 14.4 11.0 13.9 17.0 11.9 16.3 17.3 15.5 9.6 11.8 8.0 16.4 17.0 15.8 9.9 12.1 8.3
Chronic lower respiratory diseases . . . . . . . . . (J40–J47) 38.2 41.6 35.7 43.7 46.3 41.8 29.2 37.2 24.2 33.9 35.4 32.6 10.2 14.4 7.2 16.7 17.8 15.7 16.1 19.8 13.4
Pneumonitis due to solids and liquids . . . . . . (J69) 4.7 6.5 3.5 4.9 6.7 3.7 5.2 7.2 4.0 5.4 7.3 3.9 3.2 4.6 2.3 * * * 3.2 4.4 2.3
Chronic liver disease and cirrhosis . . . . . (K70,K73–K74) 11.3 15.1 8.0 11.9 15.4 8.7 7.7 10.4 5.5 44.7 46.9 42.8 3.4 4.7 2.3 5.9 8.0 * 14.6 20.8 8.8Alcoholic liver disease . . . . . . . . . . . . (K70) 6.4 9.0 3.9 6.8 9.2 4.5 4.0 5.7 2.7 33.5 35.1 32.1 1.4 2.3 0.6 * * * 7.7 12.9 2.8
Cholelithiasis and other disorders of gallbladder . . . . . . . (K80–K82) 0.9 1.1 0.8 1.0 1.1 0.8 0.9 1.0 0.8 1.4 * * 0.8 0.9 0.7 * * * 0.9 1.0 0.8
Nephritis, nephrotic syndrome and nephrosis . . . . (N00–N07,
N17–N19,N25–N27) 12.7 15.4 10.7 11.4 14.0 9.5 25.4 30.6 21.8 16.7 17.6 16.0 8.1 9.9 6.8 18.0 20.4 16.0 11.8 14.0 10.1Pregnancy, childbirth and the puerperium . . . . . .(O00–O99) 0.4 … 0.7 0.3 … 0.6 0.9 … 1.7 0.9 … 1.8 0.2 … 0.4 * … * 0.3 … 0.6
Certain conditions originating in the perinatal period . . . . . . . . . . . (P00–P96) 3.8 4.2 3.4 2.8 3.1 2.5 8.8 9.6 8.0 3.6 3.4 3.7 2.9 3.1 2.6 5.7 7.0 * 3.2 3.6 2.8
Congenital malformations, deformations and chromosomal abnormalities . . . . .(Q00–Q99) 3.1 3.3 2.9 3.2 3.3 3.0 3.8 4.1 3.6 3.3 3.3 3.2 1.6 1.8 1.4 4.6 * * 2.6 2.7 2.5
Symptoms, signs and abnormal clinical and laboratory findings, not elsewhere classified . . . . . . . .(R00–R99) 8.5 9.3 7.6 8.8 9.4 8.0 11.7 13.8 9.8 11.0 12.6 9.2 2.9 3.3 2.6 7.9 8.8 * 4.8 5.9 3.6
See footnotes at end of table.
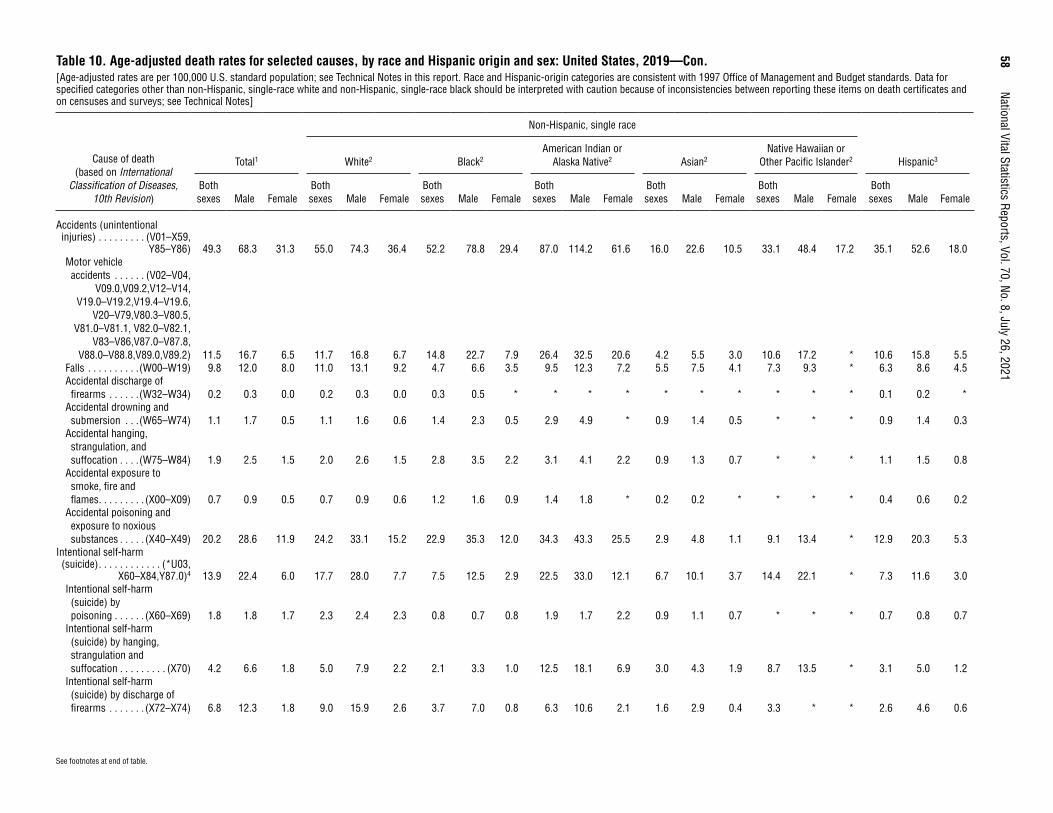
58
National Vital Statistics Reports, Vol. 70, No. 8, July 26, 2021Table 10. Age-adjusted death rates for selected causes, by race and Hispanic origin and sex: United States, 2019—Con.[Age-adjusted rates are per 100,000 U.S. standard population; see Technical Notes in this report. Race and Hispanic-origin categories are consistent with 1997 Office of Management and Budget standards. Data for specified categories other than non-Hispanic, single-race white and non-Hispanic, single-race black should be interpreted with caution because of inconsistencies between reporting these items on death certificates and on censuses and surveys; see Technical Notes]
Cause of death (based on International
Classification of Diseases, 10th Revision)
Total1
Non-Hispanic, single race
Hispanic3White2 Black2American Indian or
Alaska Native2 Asian2Native Hawaiian or
Other Pacific Islander2
Both sexes Male Female
Both sexes Male Female
Both sexes Male Female
Both sexes Male Female
Both sexes Male Female
Both sexes Male Female
Both sexes Male Female
Accidents (unintentional injuries) . . . . . . . . . (V01–X59,
Y85–Y86) 49.3 68.3 31.3 55.0 74.3 36.4 52.2 78.8 29.4 87.0 114.2 61.6 16.0 22.6 10.5 33.1 48.4 17.2 35.1 52.6 18.0Motor vehicle accidents . . . . . . (V02–V04,
V09.0,V09.2,V12–V14,V19.0–V19.2,V19.4–V19.6,
V20–V79,V80.3–V80.5,V81.0–V81.1, V82.0–V82.1,
V83–V86,V87.0–V87.8,V88.0–V88.8,V89.0,V89.2) 11.5 16.7 6.5 11.7 16.8 6.7 14.8 22.7 7.9 26.4 32.5 20.6 4.2 5.5 3.0 10.6 17.2 * 10.6 15.8 5.5
Falls . . . . . . . . . .(W00–W19) 9.8 12.0 8.0 11.0 13.1 9.2 4.7 6.6 3.5 9.5 12.3 7.2 5.5 7.5 4.1 7.3 9.3 * 6.3 8.6 4.5Accidental discharge of firearms . . . . . .(W32–W34) 0.2 0.3 0.0 0.2 0.3 0.0 0.3 0.5 * * * * * * * * * * 0.1 0.2 *
Accidental drowning and submersion . . .(W65–W74) 1.1 1.7 0.5 1.1 1.6 0.6 1.4 2.3 0.5 2.9 4.9 * 0.9 1.4 0.5 * * * 0.9 1.4 0.3
Accidental hanging, strangulation, and suffocation . . . .(W75–W84) 1.9 2.5 1.5 2.0 2.6 1.5 2.8 3.5 2.2 3.1 4.1 2.2 0.9 1.3 0.7 * * * 1.1 1.5 0.8
Accidental exposure to smoke, fire and flames . . . . . . . . . (X00–X09) 0.7 0.9 0.5 0.7 0.9 0.6 1.2 1.6 0.9 1.4 1.8 * 0.2 0.2 * * * * 0.4 0.6 0.2
Accidental poisoning and exposure to noxious substances . . . . . (X40–X49) 20.2 28.6 11.9 24.2 33.1 15.2 22.9 35.3 12.0 34.3 43.3 25.5 2.9 4.8 1.1 9.1 13.4 * 12.9 20.3 5.3
Intentional self-harm (suicide) . . . . . . . . . . . . (*U03,
X60–X84,Y87.0)4 13.9 22.4 6.0 17.7 28.0 7.7 7.5 12.5 2.9 22.5 33.0 12.1 6.7 10.1 3.7 14.4 22.1 * 7.3 11.6 3.0Intentional self-harm (suicide) by poisoning . . . . . . (X60–X69) 1.8 1.8 1.7 2.3 2.4 2.3 0.8 0.7 0.8 1.9 1.7 2.2 0.9 1.1 0.7 * * * 0.7 0.8 0.7
Intentional self-harm (suicide) by hanging, strangulation and suffocation . . . . . . . . . (X70) 4.2 6.6 1.8 5.0 7.9 2.2 2.1 3.3 1.0 12.5 18.1 6.9 3.0 4.3 1.9 8.7 13.5 * 3.1 5.0 1.2
Intentional self-harm (suicide) by discharge of firearms . . . . . . . (X72–X74) 6.8 12.3 1.8 9.0 15.9 2.6 3.7 7.0 0.8 6.3 10.6 2.1 1.6 2.9 0.4 3.3 * * 2.6 4.6 0.6
See footnotes at end of table.

National Vital Statistics Reports, Vol. 70, No. 8, July 26, 2021
59
Table 10. Age-adjusted death rates for selected causes, by race and Hispanic origin and sex: United States, 2019—Con.[Age-adjusted rates are per 100,000 U.S. standard population; see Technical Notes in this report. Race and Hispanic-origin categories are consistent with 1997 Office of Management and Budget standards. Data for specified categories other than non-Hispanic, single-race white and non-Hispanic, single-race black should be interpreted with caution because of inconsistencies between reporting these items on death certificates and on censuses and surveys; see Technical Notes]
Cause of death (based on International
Classification of Diseases, 10th Revision)
Total1
Non-Hispanic, single race
Hispanic3White2 Black2American Indian or
Alaska Native2 Asian2Native Hawaiian or
Other Pacific Islander2
Both sexes Male Female
Both sexes Male Female
Both sexes Male Female
Both sexes Male Female
Both sexes Male Female
Both sexes Male Female
Both sexes Male Female
Assault (homicide) . . . . . (*U01–*U02,
X85–Y09,Y87.1)4 6.0 9.6 2.4 2.7 3.7 1.7 23.7 41.8 6.3 12.2 17.7 6.6 1.5 2.0 1.0 6.5 9.5 * 5.0 7.9 2.0Assault (homicide) by discharge of firearms . . . . . . . . (*U01.4,
X93–X95)4 4.6 7.7 1.4 1.7 2.4 0.9 20.0 36.4 4.2 6.4 9.8 3.0 0.9 1.3 0.5 4.6 6.9 * 3.6 6.0 1.1Legal intervention . . . . . (Y35,Y89.0) 0.2 0.4 0.0 0.2 0.3 0.0 0.4 0.7 * 0.9 1.8 * * * * * * * 0.2 0.4 *
Complications of medical and surgical care . . . . . . . . (Y40–Y84,Y88) 1.3 1.6 1.1 1.4 1.6 1.1 2.0 2.3 1.7 1.5 * * 0.5 0.7 0.4 * * * 1.1 1.2 1.0
Dementia-related causes5 . . . . 66.6 56.6 72.6 71.2 59.9 78.1 64.5 59.6 66.3 39.2 32.3 43.3 32.6 27.0 35.9 38.1 36.9 38.7 47.3 41.2 50.9Drug-induced deaths5 . . . . . . . 22.8 31.1 14.5 27.4 36.1 18.7 26.1 39.9 14.2 33.0 40.0 26.2 3.5 5.5 1.7 10.8 15.4 * 13.4 20.5 6.0
Drug overdose deaths5 . . . . . 21.6 29.6 13.7 26.2 34.5 17.6 24.8 37.7 13.4 30.5 36.6 24.5 3.3 5.2 1.6 9.5 13.4 * 12.7 19.5 5.7Alcohol-induced deaths5 . . . . . 10.4 15.2 5.9 11.2 15.8 6.8 7.6 11.9 4.2 54.0 65.7 43.3 2.3 3.9 0.9 4.3 7.0 * 10.6 17.8 3.8Injury by firearms5 . . . . . . . . . . 11.9 20.7 3.4 11.1 19.0 3.6 24.5 44.8 5.1 13.8 22.5 5.3 2.5 4.4 0.8 8.6 14.0 * 6.6 11.2 1.9
* Estimate does not meet National Center for Health Statistics standards of reliability; see Technical Notes. … Category not applicable. 1Includes deaths with origin not stated, origin not classifiable, and two or more races reported; see Technical Notes. 2Only one race was reported on the death certificate; see Technical Notes. 3Includes persons of Hispanic origin of any race; see Technical Notes. 4Asterisks (*) preceding cause-of-death codes indicate they are not part of the International Classification of Diseases, 10th Revision (ICD–10); see Technical Notes. 5Included in selected categories above. For the list of ICD–10 codes included, see Technical Notes.
SOURCE: National Center for Health Statistics, National Vital Statistics System, Mortality.

60 National Vital Statistics Reports, Vol. 70, No. 8, July 26, 2021
Table 11. Number of deaths, death rates, and age-adjusted death rates for injury deaths, by mechanism and intent of death for all injury death and the leading causes of injury death: United States, 2019[Totals for selected causes of death may differ from those shown in other tables that use standard mortality tabulation lists; see Technical Notes in this report. Rates are per 100,000 population; age-adjusted rates are per 100,000 U.S. standard population; see Technical Notes. Populations used for computing death rates are postcensal estimates based on the 2010 census estimated as of July 1, 2019; see Technical Notes. Numbers in brackets [ ] apply to the code or range of codes preceding them. Asterisks (*) preceding cause-of-death codes indicate they are not part of the International Classification of Diseases, 10th Revision (ICD–10); see Technical Notes]
Mechanism and intent of death (based on ICD–10) Number Rate Age-adjusted rate1
All injury . . . . . . . . . . . . . . . . . . . . . . . . . . . . . . . . . . . . . . . . . . . (*U01–*U03,V01–Y36,Y85–Y87,Y89) 246,041 75.0 71.2Unintentional . . . . . . . . . . . . . . . . . . . . . . . . . . . . . . . . . . . . . . . . . . . . . . . . . . . (V01–X59,Y85–Y86) 173,040 52.7 49.3Suicide . . . . . . . . . . . . . . . . . . . . . . . . . . . . . . . . . . . . . . . . . . . . . . . . . . . . . . (*U03,X60–X84,Y87.0) 47,511 14.5 13.9Homicide . . . . . . . . . . . . . . . . . . . . . . . . . . . . . . . . . . . . . . . . . . . . . . .(*U01–*U02,X85–Y09,Y87.1) 19,141 5.8 6.0Undetermined . . . . . . . . . . . . . . . . . . . . . . . . . . . . . . . . . . . . . . . . . . . . . . . . .(Y10–Y34,Y87.2,Y89.9) 5,683 1.7 1.7Legal intervention/war . . . . . . . . . . . . . . . . . . . . . . . . . . . . . . . . . . . . . . . . . . . (Y35–Y36,Y89[.0,.1]) 666 0.2 0.2
Poisoning . . . . . . . . . . . . . . . . . . . . . . . . . (*U01[.6–.7],X40–X49,X60–X69,X85–X90,Y10–Y19,Y35.2) 75,795 23.1 23.2Unintentional . . . . . . . . . . . . . . . . . . . . . . . . . . . . . . . . . . . . . . . . . . . . . . . . . . . . . . . . . . . (X40–X49) 65,773 20.0 20.2Suicide . . . . . . . . . . . . . . . . . . . . . . . . . . . . . . . . . . . . . . . . . . . . . . . . . . . . . . . . . . . . . . . . (X60–X69) 6,125 1.9 1.8Homicide . . . . . . . . . . . . . . . . . . . . . . . . . . . . . . . . . . . . . . . . . . . . . . . . . . . .(*U01[.6–.7],X85–X90) 159 0.0 0.0Undetermined . . . . . . . . . . . . . . . . . . . . . . . . . . . . . . . . . . . . . . . . . . . . . . . . . . . . . . . . . . . (Y10–Y19) 3,736 1.1 1.1Legal intervention/war . . . . . . . . . . . . . . . . . . . . . . . . . . . . . . . . . . . . . . . . . . . . . . . . . . . . . . (Y35.2) 2 * *
Motor vehicle traffic . . . . . . . . . . . (V02–V04[.1,.9],V09.2,V12–V14[.3–.9],V19[.4–.6],V20–V28[.3–.9], V29–V79[.4–.9],V80[.3–.5],V81.1,V82.1,V83–V86[.0–.3],V87[.0–.8],V89.2)2 37,595 11.5 11.1
Occupant . . . . . . . . . . . . . . . . . . . . . . . . . . . . . . . . . . . . . . . . . . .(V30–V79[.4–.9],V83–V86[.0–.3])2 8,760 2.7 2.6Motorcyclist . . . . . . . . . . . . . . . . . . . . . . . . . . . . . . . . . . . . . . . . . . . . . (V20–V28[.3–.9],V29[.4–.9])2 4,576 1.4 1.4Pedal cyclist . . . . . . . . . . . . . . . . . . . . . . . . . . . . . . . . . . . . . . . . . . . . . (V12–V14[.3–.9],V19[.4–.6])2 712 0.2 0.2Pedestrian . . . . . . . . . . . . . . . . . . . . . . . . . . . . . . . . . . . . . . . . . . . . . . . . . . (V02–V04[.1,.9],V09.2)2 6,681 2.0 2.0Other . . . . . . . . . . . . . . . . . . . . . . . . . . . . . . . . . . . . . . . . . . . . . . . . . . . . .(V80[.3–.5],V81.1,V82.1)2 10 * *Unspecified . . . . . . . . . . . . . . . . . . . . . . . . . . . . . . . . . . . . . . . . . . . . . . . . . . . . . . (V87[.0–.8],V89.2)2 16,856 5.1 5.0
Firearm . . . . . . . . . . . . . . . . . . . . . . . . . . . . . . (*U01.4,W32–W34,X72–X74,X93–X95,Y22–Y24,Y35.0) 39,707 12.1 11.9Unintentional . . . . . . . . . . . . . . . . . . . . . . . . . . . . . . . . . . . . . . . . . . . . . . . . . . . . . . . . . .(W32–W34) 486 0.1 0.2Suicide . . . . . . . . . . . . . . . . . . . . . . . . . . . . . . . . . . . . . . . . . . . . . . . . . . . . . . . . . . . . . . . . (X72–X74) 23,941 7.3 6.8Homicide . . . . . . . . . . . . . . . . . . . . . . . . . . . . . . . . . . . . . . . . . . . . . . . . . . . . . . . .(*U01.4,X93–X95) 14,414 4.4 4.6Undetermined . . . . . . . . . . . . . . . . . . . . . . . . . . . . . . . . . . . . . . . . . . . . . . . . . . . . . . . . . . . (Y22–Y24) 346 0.1 0.1Legal intervention/war . . . . . . . . . . . . . . . . . . . . . . . . . . . . . . . . . . . . . . . . . . . . . . . . . . . . . . (Y35.0) 520 0.2 0.2
Fall . . . . . . . . . . . . . . . . . . . . . . . . . . . . . . . . . . . . . . . . . . . . . . . . . . . . . . . . . (W00–W19,X80,Y01,Y30) 40,727 12.4 10.2Unintentional . . . . . . . . . . . . . . . . . . . . . . . . . . . . . . . . . . . . . . . . . . . . . . . . . . . . . . . . . .(W00–W19) 39,443 12.0 9.8Suicide . . . . . . . . . . . . . . . . . . . . . . . . . . . . . . . . . . . . . . . . . . . . . . . . . . . . . . . . . . . . . . . . . . . . (X80) 1,183 0.4 0.3Homicide . . . . . . . . . . . . . . . . . . . . . . . . . . . . . . . . . . . . . . . . . . . . . . . . . . . . . . . . . . . . . . . . . . (Y01) 12 * *Undetermined . . . . . . . . . . . . . . . . . . . . . . . . . . . . . . . . . . . . . . . . . . . . . . . . . . . . . . . . . . . . . . . (Y30) 89 0.0 0.0
0.0 Quantity more than zero but less than 0.05. * Estimate does not meet National Center for Health Statistics standards of reliability; see Technical Notes. 1For method of computation, see Technical Notes. 2Intent of death is unintentional.
SOURCE: National Center for Health Statistics, National Vital Statistics System, Mortality.
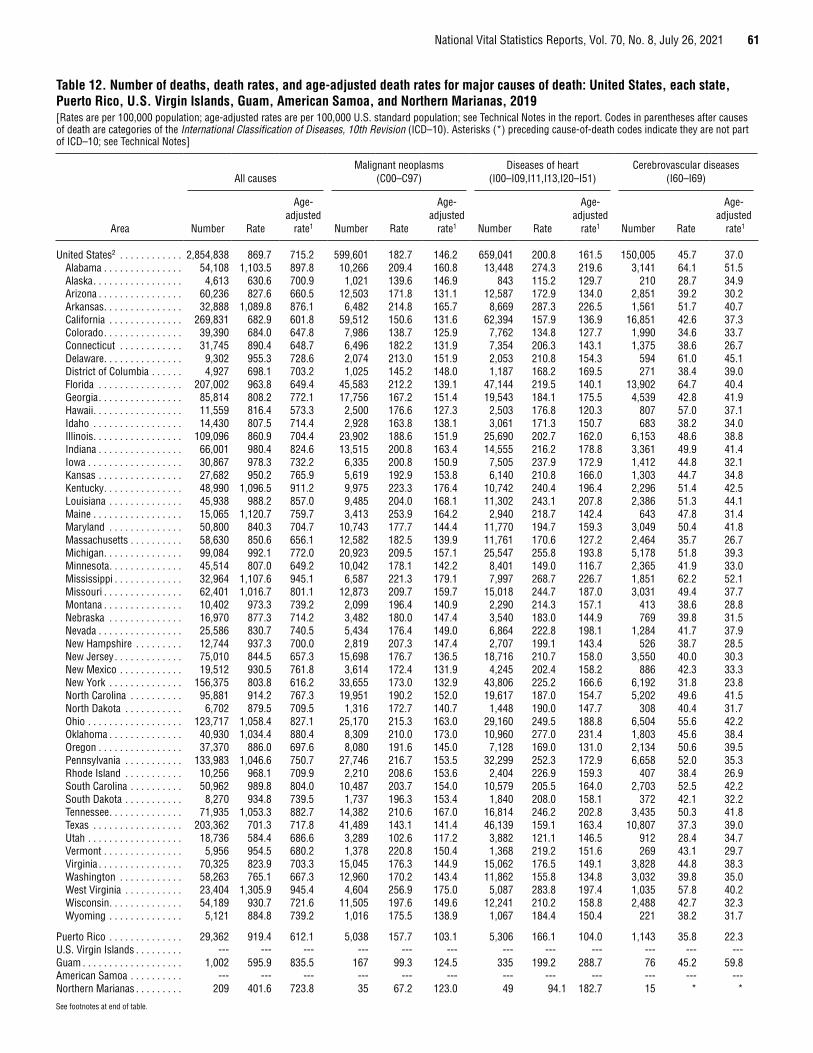
National Vital Statistics Reports, Vol. 70, No. 8, July 26, 2021 61
Table 12. Number of deaths, death rates, and age-adjusted death rates for major causes of death: United States, each state, Puerto Rico, U.S. Virgin Islands, Guam, American Samoa, and Northern Marianas, 2019[Rates are per 100,000 population; age-adjusted rates are per 100,000 U.S. standard population; see Technical Notes in the report. Codes in parentheses after causes of death are categories of the International Classification of Diseases, 10th Revision (ICD–10). Asterisks (*) preceding cause-of-death codes indicate they are not part of ICD–10; see Technical Notes]
Area
All causesMalignant neoplasms
(C00–C97)Diseases of heart
(I00–I09,I11,I13,I20–I51)Cerebrovascular diseases
(I60–I69)
Number Rate
Age- adjusted
rate1 Number Rate
Age- adjusted
rate1 Number Rate
Age- adjusted
rate1 Number Rate
Age- adjusted
rate1
United States2 . . . . . . . . . . . . 2,854,838 869.7 715.2 599,601 182.7 146.2 659,041 200.8 161.5 150,005 45.7 37.0Alabama . . . . . . . . . . . . . . . 54,108 1,103.5 897.8 10,266 209.4 160.8 13,448 274.3 219.6 3,141 64.1 51.5Alaska . . . . . . . . . . . . . . . . . 4,613 630.6 700.9 1,021 139.6 146.9 843 115.2 129.7 210 28.7 34.9Arizona . . . . . . . . . . . . . . . . 60,236 827.6 660.5 12,503 171.8 131.1 12,587 172.9 134.0 2,851 39.2 30.2Arkansas . . . . . . . . . . . . . . . 32,888 1,089.8 876.1 6,482 214.8 165.7 8,669 287.3 226.5 1,561 51.7 40.7California . . . . . . . . . . . . . . 269,831 682.9 601.8 59,512 150.6 131.6 62,394 157.9 136.9 16,851 42.6 37.3Colorado . . . . . . . . . . . . . . . 39,390 684.0 647.8 7,986 138.7 125.9 7,762 134.8 127.7 1,990 34.6 33.7Connecticut . . . . . . . . . . . . 31,745 890.4 648.7 6,496 182.2 131.9 7,354 206.3 143.1 1,375 38.6 26.7Delaware . . . . . . . . . . . . . . . 9,302 955.3 728.6 2,074 213.0 151.9 2,053 210.8 154.3 594 61.0 45.1District of Columbia . . . . . . 4,927 698.1 703.2 1,025 145.2 148.0 1,187 168.2 169.5 271 38.4 39.0Florida . . . . . . . . . . . . . . . . 207,002 963.8 649.4 45,583 212.2 139.1 47,144 219.5 140.1 13,902 64.7 40.4Georgia . . . . . . . . . . . . . . . . 85,814 808.2 772.1 17,756 167.2 151.4 19,543 184.1 175.5 4,539 42.8 41.9Hawaii . . . . . . . . . . . . . . . . . 11,559 816.4 573.3 2,500 176.6 127.3 2,503 176.8 120.3 807 57.0 37.1Idaho . . . . . . . . . . . . . . . . . 14,430 807.5 714.4 2,928 163.8 138.1 3,061 171.3 150.7 683 38.2 34.0Illinois . . . . . . . . . . . . . . . . . 109,096 860.9 704.4 23,902 188.6 151.9 25,690 202.7 162.0 6,153 48.6 38.8Indiana . . . . . . . . . . . . . . . . 66,001 980.4 824.6 13,515 200.8 163.4 14,555 216.2 178.8 3,361 49.9 41.4Iowa . . . . . . . . . . . . . . . . . . 30,867 978.3 732.2 6,335 200.8 150.9 7,505 237.9 172.9 1,412 44.8 32.1Kansas . . . . . . . . . . . . . . . . 27,682 950.2 765.9 5,619 192.9 153.8 6,140 210.8 166.0 1,303 44.7 34.8Kentucky . . . . . . . . . . . . . . . 48,990 1,096.5 911.2 9,975 223.3 176.4 10,742 240.4 196.4 2,296 51.4 42.5Louisiana . . . . . . . . . . . . . . 45,938 988.2 857.0 9,485 204.0 168.1 11,302 243.1 207.8 2,386 51.3 44.1Maine . . . . . . . . . . . . . . . . . 15,065 1,120.7 759.7 3,413 253.9 164.2 2,940 218.7 142.4 643 47.8 31.4Maryland . . . . . . . . . . . . . . 50,800 840.3 704.7 10,743 177.7 144.4 11,770 194.7 159.3 3,049 50.4 41.8Massachusetts . . . . . . . . . . 58,630 850.6 656.1 12,582 182.5 139.9 11,761 170.6 127.2 2,464 35.7 26.7Michigan . . . . . . . . . . . . . . . 99,084 992.1 772.0 20,923 209.5 157.1 25,547 255.8 193.8 5,178 51.8 39.3Minnesota . . . . . . . . . . . . . . 45,514 807.0 649.2 10,042 178.1 142.2 8,401 149.0 116.7 2,365 41.9 33.0Mississippi . . . . . . . . . . . . . 32,964 1,107.6 945.1 6,587 221.3 179.1 7,997 268.7 226.7 1,851 62.2 52.1Missouri . . . . . . . . . . . . . . . 62,401 1,016.7 801.1 12,873 209.7 159.7 15,018 244.7 187.0 3,031 49.4 37.7Montana . . . . . . . . . . . . . . . 10,402 973.3 739.2 2,099 196.4 140.9 2,290 214.3 157.1 413 38.6 28.8Nebraska . . . . . . . . . . . . . . 16,970 877.3 714.2 3,482 180.0 147.4 3,540 183.0 144.9 769 39.8 31.5Nevada . . . . . . . . . . . . . . . . 25,586 830.7 740.5 5,434 176.4 149.0 6,864 222.8 198.1 1,284 41.7 37.9New Hampshire . . . . . . . . . 12,744 937.3 700.0 2,819 207.3 147.4 2,707 199.1 143.4 526 38.7 28.5New Jersey . . . . . . . . . . . . . 75,010 844.5 657.3 15,698 176.7 136.5 18,716 210.7 158.0 3,550 40.0 30.3New Mexico . . . . . . . . . . . . 19,512 930.5 761.8 3,614 172.4 131.9 4,245 202.4 158.2 886 42.3 33.3New York . . . . . . . . . . . . . . 156,375 803.8 616.2 33,655 173.0 132.9 43,806 225.2 166.6 6,192 31.8 23.8North Carolina . . . . . . . . . . 95,881 914.2 767.3 19,951 190.2 152.0 19,617 187.0 154.7 5,202 49.6 41.5North Dakota . . . . . . . . . . . 6,702 879.5 709.5 1,316 172.7 140.7 1,448 190.0 147.7 308 40.4 31.7Ohio . . . . . . . . . . . . . . . . . . 123,717 1,058.4 827.1 25,170 215.3 163.0 29,160 249.5 188.8 6,504 55.6 42.2Oklahoma . . . . . . . . . . . . . . 40,930 1,034.4 880.4 8,309 210.0 173.0 10,960 277.0 231.4 1,803 45.6 38.4Oregon . . . . . . . . . . . . . . . . 37,370 886.0 697.6 8,080 191.6 145.0 7,128 169.0 131.0 2,134 50.6 39.5Pennsylvania . . . . . . . . . . . 133,983 1,046.6 750.7 27,746 216.7 153.5 32,299 252.3 172.9 6,658 52.0 35.3Rhode Island . . . . . . . . . . . 10,256 968.1 709.9 2,210 208.6 153.6 2,404 226.9 159.3 407 38.4 26.9South Carolina . . . . . . . . . . 50,962 989.8 804.0 10,487 203.7 154.0 10,579 205.5 164.0 2,703 52.5 42.2South Dakota . . . . . . . . . . . 8,270 934.8 739.5 1,737 196.3 153.4 1,840 208.0 158.1 372 42.1 32.2Tennessee . . . . . . . . . . . . . . 71,935 1,053.3 882.7 14,382 210.6 167.0 16,814 246.2 202.8 3,435 50.3 41.8Texas . . . . . . . . . . . . . . . . . 203,362 701.3 717.8 41,489 143.1 141.4 46,139 159.1 163.4 10,807 37.3 39.0Utah . . . . . . . . . . . . . . . . . . 18,736 584.4 686.6 3,289 102.6 117.2 3,882 121.1 146.5 912 28.4 34.7Vermont . . . . . . . . . . . . . . . 5,956 954.5 680.2 1,378 220.8 150.4 1,368 219.2 151.6 269 43.1 29.7Virginia . . . . . . . . . . . . . . . . 70,325 823.9 703.3 15,045 176.3 144.9 15,062 176.5 149.1 3,828 44.8 38.3Washington . . . . . . . . . . . . 58,263 765.1 667.3 12,960 170.2 143.4 11,862 155.8 134.8 3,032 39.8 35.0West Virginia . . . . . . . . . . . 23,404 1,305.9 945.4 4,604 256.9 175.0 5,087 283.8 197.4 1,035 57.8 40.2Wisconsin . . . . . . . . . . . . . . 54,189 930.7 721.6 11,505 197.6 149.6 12,241 210.2 158.8 2,488 42.7 32.3Wyoming . . . . . . . . . . . . . . 5,121 884.8 739.2 1,016 175.5 138.9 1,067 184.4 150.4 221 38.2 31.7
Puerto Rico . . . . . . . . . . . . . . 29,362 919.4 612.1 5,038 157.7 103.1 5,306 166.1 104.0 1,143 35.8 22.3U.S. Virgin Islands . . . . . . . . . --- --- --- --- --- --- --- --- --- --- --- ---Guam . . . . . . . . . . . . . . . . . . . 1,002 595.9 835.5 167 99.3 124.5 335 199.2 288.7 76 45.2 59.8American Samoa . . . . . . . . . . --- --- --- --- --- --- --- --- --- --- --- ---Northern Marianas . . . . . . . . . 209 401.6 723.8 35 67.2 123.0 49 94.1 182.7 15 * *
See footnotes at end of table.
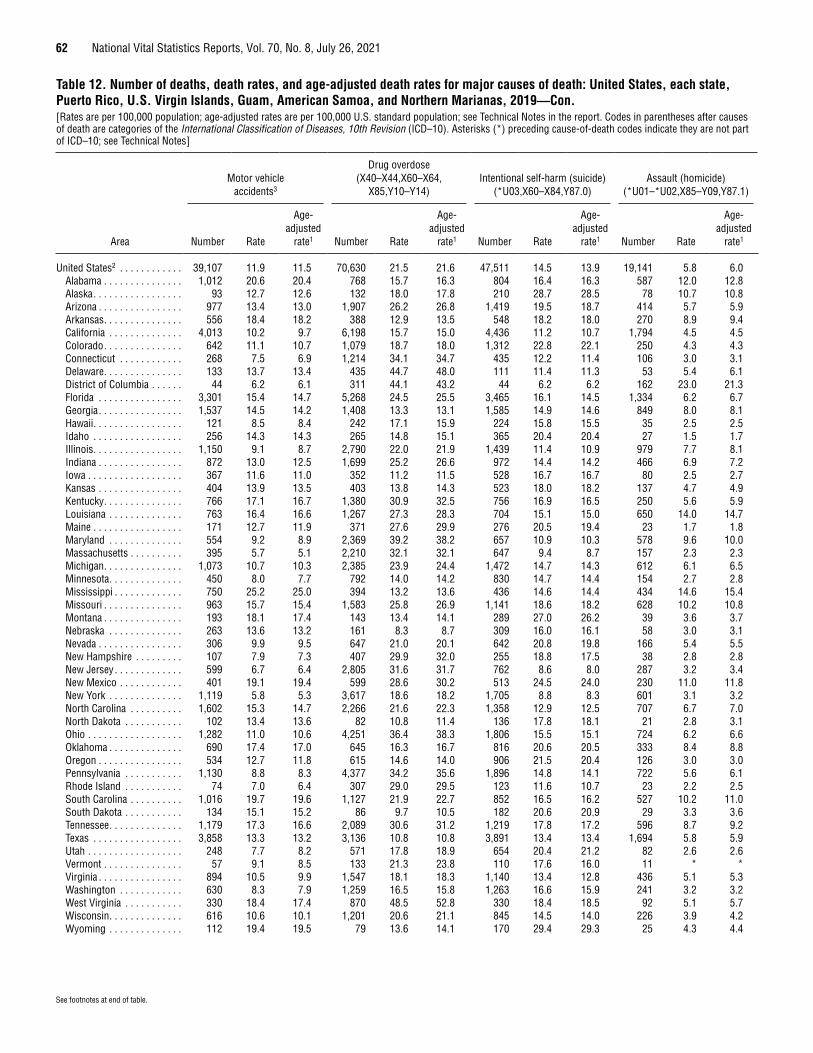
62 National Vital Statistics Reports, Vol. 70, No. 8, July 26, 2021
Table 12. Number of deaths, death rates, and age-adjusted death rates for major causes of death: United States, each state, Puerto Rico, U.S. Virgin Islands, Guam, American Samoa, and Northern Marianas, 2019—Con.[Rates are per 100,000 population; age-adjusted rates are per 100,000 U.S. standard population; see Technical Notes in the report. Codes in parentheses after causes of death are categories of the International Classification of Diseases, 10th Revision (ICD–10). Asterisks (*) preceding cause-of-death codes indicate they are not part of ICD–10; see Technical Notes]
Area
Motor vehicle accidents3
Drug overdose (X40–X44,X60–X64,
X85,Y10–Y14)Intentional self-harm (suicide)
(*U03,X60–X84,Y87.0)Assault (homicide)
(*U01–*U02,X85–Y09,Y87.1)
Number Rate
Age-adjusted
rate1 Number Rate
Age-adjusted
rate1 Number Rate
Age-adjusted
rate1 Number Rate
Age-adjusted
rate1
United States2 . . . . . . . . . . . . 39,107 11.9 11.5 70,630 21.5 21.6 47,511 14.5 13.9 19,141 5.8 6.0Alabama . . . . . . . . . . . . . . . 1,012 20.6 20.4 768 15.7 16.3 804 16.4 16.3 587 12.0 12.8Alaska . . . . . . . . . . . . . . . . . 93 12.7 12.6 132 18.0 17.8 210 28.7 28.5 78 10.7 10.8Arizona . . . . . . . . . . . . . . . . 977 13.4 13.0 1,907 26.2 26.8 1,419 19.5 18.7 414 5.7 5.9Arkansas . . . . . . . . . . . . . . . 556 18.4 18.2 388 12.9 13.5 548 18.2 18.0 270 8.9 9.4California . . . . . . . . . . . . . . 4,013 10.2 9.7 6,198 15.7 15.0 4,436 11.2 10.7 1,794 4.5 4.5Colorado . . . . . . . . . . . . . . . 642 11.1 10.7 1,079 18.7 18.0 1,312 22.8 22.1 250 4.3 4.3Connecticut . . . . . . . . . . . . 268 7.5 6.9 1,214 34.1 34.7 435 12.2 11.4 106 3.0 3.1Delaware . . . . . . . . . . . . . . . 133 13.7 13.4 435 44.7 48.0 111 11.4 11.3 53 5.4 6.1District of Columbia . . . . . . 44 6.2 6.1 311 44.1 43.2 44 6.2 6.2 162 23.0 21.3Florida . . . . . . . . . . . . . . . . 3,301 15.4 14.7 5,268 24.5 25.5 3,465 16.1 14.5 1,334 6.2 6.7Georgia . . . . . . . . . . . . . . . . 1,537 14.5 14.2 1,408 13.3 13.1 1,585 14.9 14.6 849 8.0 8.1Hawaii . . . . . . . . . . . . . . . . . 121 8.5 8.4 242 17.1 15.9 224 15.8 15.5 35 2.5 2.5Idaho . . . . . . . . . . . . . . . . . 256 14.3 14.3 265 14.8 15.1 365 20.4 20.4 27 1.5 1.7Illinois . . . . . . . . . . . . . . . . . 1,150 9.1 8.7 2,790 22.0 21.9 1,439 11.4 10.9 979 7.7 8.1Indiana . . . . . . . . . . . . . . . . 872 13.0 12.5 1,699 25.2 26.6 972 14.4 14.2 466 6.9 7.2Iowa . . . . . . . . . . . . . . . . . . 367 11.6 11.0 352 11.2 11.5 528 16.7 16.7 80 2.5 2.7Kansas . . . . . . . . . . . . . . . . 404 13.9 13.5 403 13.8 14.3 523 18.0 18.2 137 4.7 4.9Kentucky . . . . . . . . . . . . . . . 766 17.1 16.7 1,380 30.9 32.5 756 16.9 16.5 250 5.6 5.9Louisiana . . . . . . . . . . . . . . 763 16.4 16.6 1,267 27.3 28.3 704 15.1 15.0 650 14.0 14.7Maine . . . . . . . . . . . . . . . . . 171 12.7 11.9 371 27.6 29.9 276 20.5 19.4 23 1.7 1.8Maryland . . . . . . . . . . . . . . 554 9.2 8.9 2,369 39.2 38.2 657 10.9 10.3 578 9.6 10.0Massachusetts . . . . . . . . . . 395 5.7 5.1 2,210 32.1 32.1 647 9.4 8.7 157 2.3 2.3Michigan . . . . . . . . . . . . . . . 1,073 10.7 10.3 2,385 23.9 24.4 1,472 14.7 14.3 612 6.1 6.5Minnesota . . . . . . . . . . . . . . 450 8.0 7.7 792 14.0 14.2 830 14.7 14.4 154 2.7 2.8Mississippi . . . . . . . . . . . . . 750 25.2 25.0 394 13.2 13.6 436 14.6 14.4 434 14.6 15.4Missouri . . . . . . . . . . . . . . . 963 15.7 15.4 1,583 25.8 26.9 1,141 18.6 18.2 628 10.2 10.8Montana . . . . . . . . . . . . . . . 193 18.1 17.4 143 13.4 14.1 289 27.0 26.2 39 3.6 3.7Nebraska . . . . . . . . . . . . . . 263 13.6 13.2 161 8.3 8.7 309 16.0 16.1 58 3.0 3.1Nevada . . . . . . . . . . . . . . . . 306 9.9 9.5 647 21.0 20.1 642 20.8 19.8 166 5.4 5.5New Hampshire . . . . . . . . . 107 7.9 7.3 407 29.9 32.0 255 18.8 17.5 38 2.8 2.8New Jersey . . . . . . . . . . . . . 599 6.7 6.4 2,805 31.6 31.7 762 8.6 8.0 287 3.2 3.4New Mexico . . . . . . . . . . . . 401 19.1 19.4 599 28.6 30.2 513 24.5 24.0 230 11.0 11.8New York . . . . . . . . . . . . . . 1,119 5.8 5.3 3,617 18.6 18.2 1,705 8.8 8.3 601 3.1 3.2North Carolina . . . . . . . . . . 1,602 15.3 14.7 2,266 21.6 22.3 1,358 12.9 12.5 707 6.7 7.0North Dakota . . . . . . . . . . . 102 13.4 13.6 82 10.8 11.4 136 17.8 18.1 21 2.8 3.1Ohio . . . . . . . . . . . . . . . . . . 1,282 11.0 10.6 4,251 36.4 38.3 1,806 15.5 15.1 724 6.2 6.6Oklahoma . . . . . . . . . . . . . . 690 17.4 17.0 645 16.3 16.7 816 20.6 20.5 333 8.4 8.8Oregon . . . . . . . . . . . . . . . . 534 12.7 11.8 615 14.6 14.0 906 21.5 20.4 126 3.0 3.0Pennsylvania . . . . . . . . . . . 1,130 8.8 8.3 4,377 34.2 35.6 1,896 14.8 14.1 722 5.6 6.1Rhode Island . . . . . . . . . . . 74 7.0 6.4 307 29.0 29.5 123 11.6 10.7 23 2.2 2.5South Carolina . . . . . . . . . . 1,016 19.7 19.6 1,127 21.9 22.7 852 16.5 16.2 527 10.2 11.0South Dakota . . . . . . . . . . . 134 15.1 15.2 86 9.7 10.5 182 20.6 20.9 29 3.3 3.6Tennessee . . . . . . . . . . . . . . 1,179 17.3 16.6 2,089 30.6 31.2 1,219 17.8 17.2 596 8.7 9.2Texas . . . . . . . . . . . . . . . . . 3,858 13.3 13.2 3,136 10.8 10.8 3,891 13.4 13.4 1,694 5.8 5.9Utah . . . . . . . . . . . . . . . . . . 248 7.7 8.2 571 17.8 18.9 654 20.4 21.2 82 2.6 2.6Vermont . . . . . . . . . . . . . . . 57 9.1 8.5 133 21.3 23.8 110 17.6 16.0 11 * *Virginia . . . . . . . . . . . . . . . . 894 10.5 9.9 1,547 18.1 18.3 1,140 13.4 12.8 436 5.1 5.3Washington . . . . . . . . . . . . 630 8.3 7.9 1,259 16.5 15.8 1,263 16.6 15.9 241 3.2 3.2West Virginia . . . . . . . . . . . 330 18.4 17.4 870 48.5 52.8 330 18.4 18.5 92 5.1 5.7Wisconsin . . . . . . . . . . . . . . 616 10.6 10.1 1,201 20.6 21.1 845 14.5 14.0 226 3.9 4.2Wyoming . . . . . . . . . . . . . . 112 19.4 19.5 79 13.6 14.1 170 29.4 29.3 25 4.3 4.4
See footnotes at end of table.

National Vital Statistics Reports, Vol. 70, No. 8, July 26, 2021 63
Table 12. Number of deaths, death rates, and age-adjusted death rates for major causes of death: United States, each state, Puerto Rico, U.S. Virgin Islands, Guam, American Samoa, and Northern Marianas, 2019—Con.[Rates are per 100,000 population; age-adjusted rates are per 100,000 U.S. standard population; see Technical Notes in the report. Codes in parentheses after causes of death are categories of the International Classification of Diseases, 10th Revision (ICD–10). Asterisks (*) preceding cause-of-death codes indicate they are not part of ICD–10; see Technical Notes]
Area
Motor vehicle accidents3
Drug overdose (X40–X44,X60–X64,
X85,Y10–Y14)Intentional self-harm (suicide)
(*U03,X60–X84,Y87.0)Assault (homicide)
(*U01–*U02,X85–Y09,Y87.1)
Number Rate
Age-adjusted
rate1 Number Rate
Age-adjusted
rate1 Number Rate
Age-adjusted
rate1 Number Rate
Age-adjusted
rate1
Puerto Rico . . . . . . . . . . . . . . 319 10.0 9.4 166 5.2 5.5 203 6.4 5.9 593 18.6 20.4U.S.Virgin Islands . . . . . . . . . --- --- --- --- --- --- --- --- --- --- --- ---Guam . . . . . . . . . . . . . . . . . . . 17 * * 2 * * 29 17.2 19.7 6 * *American Samoa . . . . . . . . . . --- --- --- --- --- --- --- --- --- --- --- ---Northern Marianas . . . . . . . . . 2 * * - * * 9 * * 2 * *
--- Data not available. * Estimate does not meet National Center for Health Statistics standards of reliability; see Technical Notes. – Quantity zero. 1Death rates are affected by the population composition of the area. Age-adjusted death rates should be used for comparisons between areas; for method of computation, see Technical Notes. 2Excludes data for Puerto Rico, U.S.Virgin Islands, Guam, American Samoa, and Northern Marianas. 3ICD–10 codes for Motor vehicle accidents are V02–V04,V09.0,V09.2,V12–V14,V19.0–V19.2,V19.4–V19.6,V20–V79,V80.3–V80.5,V81.0–V81.1,V82.0–V82.1,V83–V86,V87.0–V87.8, V88.0–V88.8,V89.0, and V89.2; see Technical Notes.
SOURCE: National Center for Health Statistics, National Vital Statistics System, Mortality.
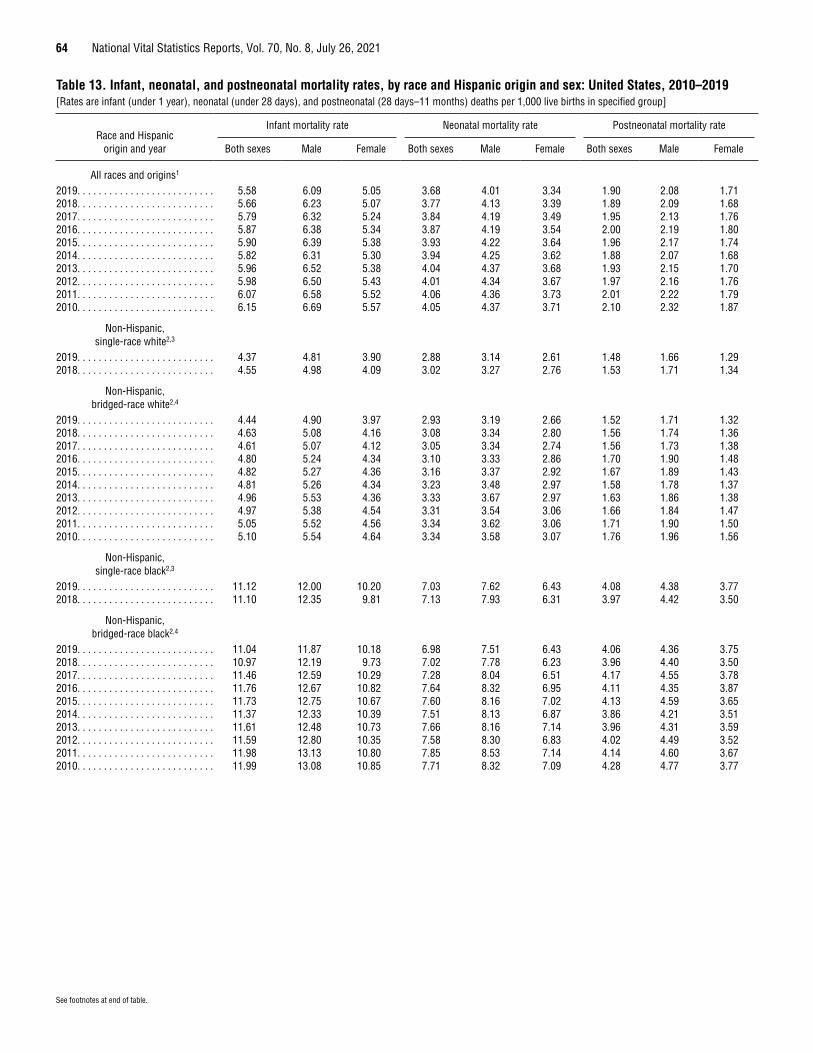
64 National Vital Statistics Reports, Vol. 70, No. 8, July 26, 2021
See footnotes at end of table.
Table 13. Infant, neonatal, and postneonatal mortality rates, by race and Hispanic origin and sex: United States, 2010–2019[Rates are infant (under 1 year), neonatal (under 28 days), and postneonatal (28 days–11 months) deaths per 1,000 live births in specified group]
Race and Hispanic origin and year
Infant mortality rate Neonatal mortality rate Postneonatal mortality rate
Both sexes Male Female Both sexes Male Female Both sexes Male Female
All races and origins1
2019. . . . . . . . . . . . . . . . . . . . . . . . . . 5.58 6.09 5.05 3.68 4.01 3.34 1.90 2.08 1.712018. . . . . . . . . . . . . . . . . . . . . . . . . . 5.66 6.23 5.07 3.77 4.13 3.39 1.89 2.09 1.682017. . . . . . . . . . . . . . . . . . . . . . . . . . 5.79 6.32 5.24 3.84 4.19 3.49 1.95 2.13 1.762016. . . . . . . . . . . . . . . . . . . . . . . . . . 5.87 6.38 5.34 3.87 4.19 3.54 2.00 2.19 1.802015. . . . . . . . . . . . . . . . . . . . . . . . . . 5.90 6.39 5.38 3.93 4.22 3.64 1.96 2.17 1.742014. . . . . . . . . . . . . . . . . . . . . . . . . . 5.82 6.31 5.30 3.94 4.25 3.62 1.88 2.07 1.682013. . . . . . . . . . . . . . . . . . . . . . . . . . 5.96 6.52 5.38 4.04 4.37 3.68 1.93 2.15 1.702012. . . . . . . . . . . . . . . . . . . . . . . . . . 5.98 6.50 5.43 4.01 4.34 3.67 1.97 2.16 1.762011. . . . . . . . . . . . . . . . . . . . . . . . . . 6.07 6.58 5.52 4.06 4.36 3.73 2.01 2.22 1.792010. . . . . . . . . . . . . . . . . . . . . . . . . . 6.15 6.69 5.57 4.05 4.37 3.71 2.10 2.32 1.87
Non-Hispanic, single-race white2,3
2019. . . . . . . . . . . . . . . . . . . . . . . . . . 4.37 4.81 3.90 2.88 3.14 2.61 1.48 1.66 1.292018. . . . . . . . . . . . . . . . . . . . . . . . . . 4.55 4.98 4.09 3.02 3.27 2.76 1.53 1.71 1.34
Non-Hispanic, bridged-race white2,4
2019. . . . . . . . . . . . . . . . . . . . . . . . . . 4.44 4.90 3.97 2.93 3.19 2.66 1.52 1.71 1.322018. . . . . . . . . . . . . . . . . . . . . . . . . . 4.63 5.08 4.16 3.08 3.34 2.80 1.56 1.74 1.362017. . . . . . . . . . . . . . . . . . . . . . . . . . 4.61 5.07 4.12 3.05 3.34 2.74 1.56 1.73 1.382016. . . . . . . . . . . . . . . . . . . . . . . . . . 4.80 5.24 4.34 3.10 3.33 2.86 1.70 1.90 1.482015. . . . . . . . . . . . . . . . . . . . . . . . . . 4.82 5.27 4.36 3.16 3.37 2.92 1.67 1.89 1.432014. . . . . . . . . . . . . . . . . . . . . . . . . . 4.81 5.26 4.34 3.23 3.48 2.97 1.58 1.78 1.372013. . . . . . . . . . . . . . . . . . . . . . . . . . 4.96 5.53 4.36 3.33 3.67 2.97 1.63 1.86 1.382012. . . . . . . . . . . . . . . . . . . . . . . . . . 4.97 5.38 4.54 3.31 3.54 3.06 1.66 1.84 1.472011. . . . . . . . . . . . . . . . . . . . . . . . . . 5.05 5.52 4.56 3.34 3.62 3.06 1.71 1.90 1.502010. . . . . . . . . . . . . . . . . . . . . . . . . . 5.10 5.54 4.64 3.34 3.58 3.07 1.76 1.96 1.56
Non-Hispanic, single-race black2,3
2019. . . . . . . . . . . . . . . . . . . . . . . . . . 11.12 12.00 10.20 7.03 7.62 6.43 4.08 4.38 3.772018. . . . . . . . . . . . . . . . . . . . . . . . . . 11.10 12.35 9.81 7.13 7.93 6.31 3.97 4.42 3.50
Non-Hispanic, bridged-race black2,4
2019. . . . . . . . . . . . . . . . . . . . . . . . . . 11.04 11.87 10.18 6.98 7.51 6.43 4.06 4.36 3.752018. . . . . . . . . . . . . . . . . . . . . . . . . . 10.97 12.19 9.73 7.02 7.78 6.23 3.96 4.40 3.502017. . . . . . . . . . . . . . . . . . . . . . . . . . 11.46 12.59 10.29 7.28 8.04 6.51 4.17 4.55 3.782016. . . . . . . . . . . . . . . . . . . . . . . . . . 11.76 12.67 10.82 7.64 8.32 6.95 4.11 4.35 3.872015. . . . . . . . . . . . . . . . . . . . . . . . . . 11.73 12.75 10.67 7.60 8.16 7.02 4.13 4.59 3.652014. . . . . . . . . . . . . . . . . . . . . . . . . . 11.37 12.33 10.39 7.51 8.13 6.87 3.86 4.21 3.512013. . . . . . . . . . . . . . . . . . . . . . . . . . 11.61 12.48 10.73 7.66 8.16 7.14 3.96 4.31 3.592012. . . . . . . . . . . . . . . . . . . . . . . . . . 11.59 12.80 10.35 7.58 8.30 6.83 4.02 4.49 3.522011. . . . . . . . . . . . . . . . . . . . . . . . . . 11.98 13.13 10.80 7.85 8.53 7.14 4.14 4.60 3.672010. . . . . . . . . . . . . . . . . . . . . . . . . . 11.99 13.08 10.85 7.71 8.32 7.09 4.28 4.77 3.77
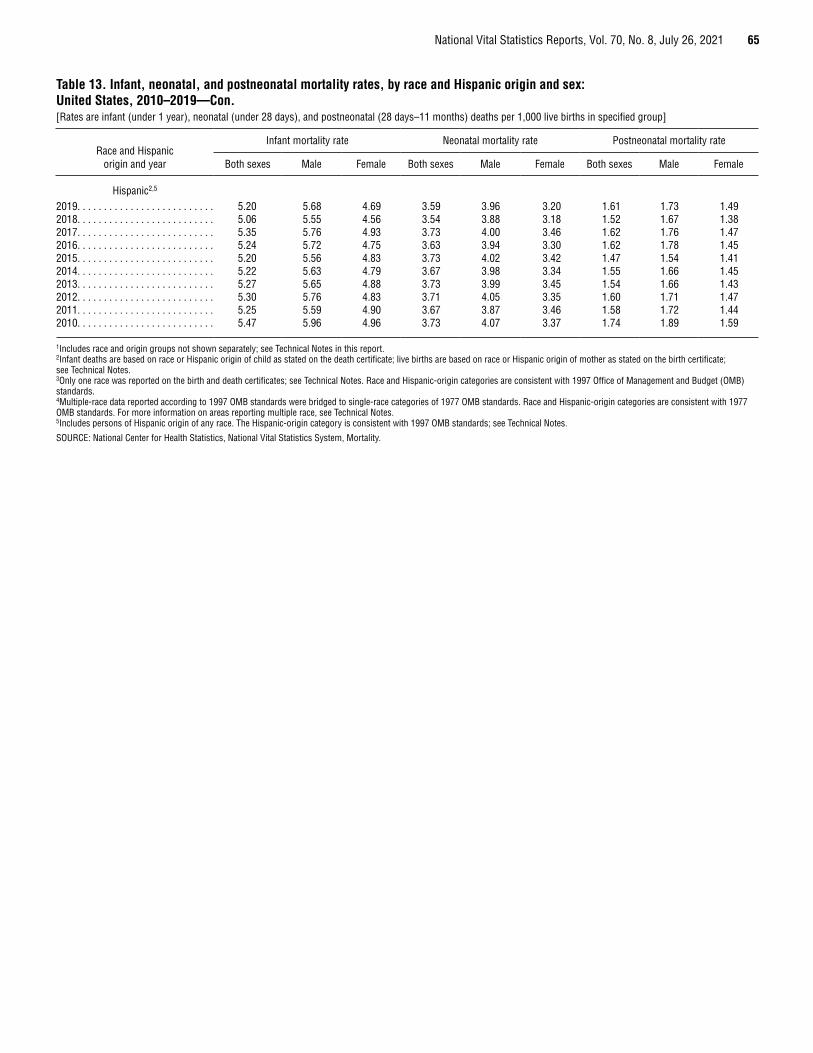
National Vital Statistics Reports, Vol. 70, No. 8, July 26, 2021 65
Table 13. Infant, neonatal, and postneonatal mortality rates, by race and Hispanic origin and sex: United States, 2010–2019—Con.[Rates are infant (under 1 year), neonatal (under 28 days), and postneonatal (28 days–11 months) deaths per 1,000 live births in specified group]
Race and Hispanic origin and year
Infant mortality rate Neonatal mortality rate Postneonatal mortality rate
Both sexes Male Female Both sexes Male Female Both sexes Male Female
Hispanic2,5
2019. . . . . . . . . . . . . . . . . . . . . . . . . . 5.20 5.68 4.69 3.59 3.96 3.20 1.61 1.73 1.492018. . . . . . . . . . . . . . . . . . . . . . . . . . 5.06 5.55 4.56 3.54 3.88 3.18 1.52 1.67 1.382017. . . . . . . . . . . . . . . . . . . . . . . . . . 5.35 5.76 4.93 3.73 4.00 3.46 1.62 1.76 1.472016. . . . . . . . . . . . . . . . . . . . . . . . . . 5.24 5.72 4.75 3.63 3.94 3.30 1.62 1.78 1.452015. . . . . . . . . . . . . . . . . . . . . . . . . . 5.20 5.56 4.83 3.73 4.02 3.42 1.47 1.54 1.412014. . . . . . . . . . . . . . . . . . . . . . . . . . 5.22 5.63 4.79 3.67 3.98 3.34 1.55 1.66 1.452013. . . . . . . . . . . . . . . . . . . . . . . . . . 5.27 5.65 4.88 3.73 3.99 3.45 1.54 1.66 1.432012. . . . . . . . . . . . . . . . . . . . . . . . . . 5.30 5.76 4.83 3.71 4.05 3.35 1.60 1.71 1.472011. . . . . . . . . . . . . . . . . . . . . . . . . . 5.25 5.59 4.90 3.67 3.87 3.46 1.58 1.72 1.442010. . . . . . . . . . . . . . . . . . . . . . . . . . 5.47 5.96 4.96 3.73 4.07 3.37 1.74 1.89 1.59
1Includes race and origin groups not shown separately; see Technical Notes in this report. 2Infant deaths are based on race or Hispanic origin of child as stated on the death certificate; live births are based on race or Hispanic origin of mother as stated on the birth certificate; see Technical Notes.3Only one race was reported on the birth and death certificates; see Technical Notes. Race and Hispanic-origin categories are consistent with 1997 Office of Management and Budget (OMB) standards.4Multiple-race data reported according to 1997 OMB standards were bridged to single-race categories of 1977 OMB standards. Race and Hispanic-origin categories are consistent with 1977 OMB standards. For more information on areas reporting multiple race, see Technical Notes. 5Includes persons of Hispanic origin of any race. The Hispanic-origin category is consistent with 1997 OMB standards; see Technical Notes.
SOURCE: National Center for Health Statistics, National Vital Statistics System, Mortality.
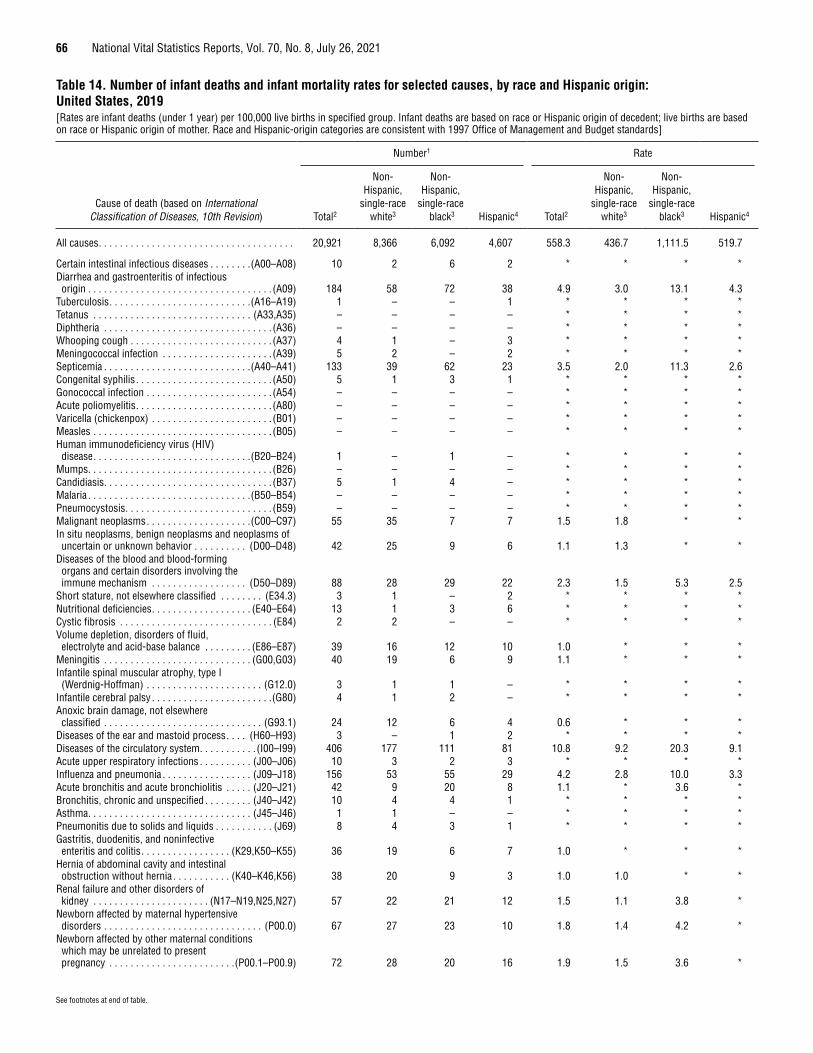
66 National Vital Statistics Reports, Vol. 70, No. 8, July 26, 2021
See footnotes at end of table.
Table 14. Number of infant deaths and infant mortality rates for selected causes, by race and Hispanic origin: United States, 2019[Rates are infant deaths (under 1 year) per 100,000 live births in specified group. Infant deaths are based on race or Hispanic origin of decedent; live births are based on race or Hispanic origin of mother. Race and Hispanic-origin categories are consistent with 1997 Office of Management and Budget standards]
Cause of death (based on International Classification of Diseases, 10th Revision)
Number1 Rate
Total2
Non- Hispanic,
single-race white3
Non-Hispanic,
single-race black3 Hispanic4 Total2
Non- Hispanic,
single-race white3
Non-Hispanic,
single-race black3 Hispanic4
All causes . . . . . . . . . . . . . . . . . . . . . . . . . . . . . . . . . . . . . 20,921 8,366 6,092 4,607 558.3 436.7 1,111.5 519.7
Certain intestinal infectious diseases . . . . . . . .(A00–A08) 10 2 6 2 * * * *Diarrhea and gastroenteritis of infectious origin . . . . . . . . . . . . . . . . . . . . . . . . . . . . . . . . . . . (A09) 184 58 72 38 4.9 3.0 13.1 4.3
Tuberculosis . . . . . . . . . . . . . . . . . . . . . . . . . . .(A16–A19) 1 – – 1 * * * *Tetanus . . . . . . . . . . . . . . . . . . . . . . . . . . . . . . (A33,A35) – – – – * * * *Diphtheria . . . . . . . . . . . . . . . . . . . . . . . . . . . . . . . . (A36) – – – – * * * *Whooping cough . . . . . . . . . . . . . . . . . . . . . . . . . . . (A37) 4 1 – 3 * * * *Meningococcal infection . . . . . . . . . . . . . . . . . . . . . (A39) 5 2 – 2 * * * *Septicemia . . . . . . . . . . . . . . . . . . . . . . . . . . . .(A40–A41) 133 39 62 23 3.5 2.0 11.3 2.6Congenital syphilis . . . . . . . . . . . . . . . . . . . . . . . . . . (A50) 5 1 3 1 * * * *Gonococcal infection . . . . . . . . . . . . . . . . . . . . . . . . (A54) – – – – * * * *Acute poliomyelitis . . . . . . . . . . . . . . . . . . . . . . . . . . (A80) – – – – * * * *Varicella (chickenpox) . . . . . . . . . . . . . . . . . . . . . . . (B01) – – – – * * * *Measles . . . . . . . . . . . . . . . . . . . . . . . . . . . . . . . . . . (B05) – – – – * * * *Human immunodeficiency virus (HIV) disease . . . . . . . . . . . . . . . . . . . . . . . . . . . . . .(B20–B24) 1 – 1 – * * * *
Mumps . . . . . . . . . . . . . . . . . . . . . . . . . . . . . . . . . . . (B26) – – – – * * * *Candidiasis . . . . . . . . . . . . . . . . . . . . . . . . . . . . . . . . (B37) 5 1 4 – * * * *Malaria . . . . . . . . . . . . . . . . . . . . . . . . . . . . . . .(B50–B54) – – – – * * * *Pneumocystosis . . . . . . . . . . . . . . . . . . . . . . . . . . . . (B59) – – – – * * * *Malignant neoplasms . . . . . . . . . . . . . . . . . . . .(C00–C97) 55 35 7 7 1.5 1.8 * *In situ neoplasms, benign neoplasms and neoplasms of uncertain or unknown behavior . . . . . . . . . . (D00–D48) 42 25 9 6 1.1 1.3 * *
Diseases of the blood and blood-forming organs and certain disorders involving the immune mechanism . . . . . . . . . . . . . . . . . . (D50–D89) 88 28 29 22 2.3 1.5 5.3 2.5
Short stature, not elsewhere classified . . . . . . . . (E34.3) 3 1 – 2 * * * *Nutritional deficiencies . . . . . . . . . . . . . . . . . . . (E40–E64) 13 1 3 6 * * * *Cystic fibrosis . . . . . . . . . . . . . . . . . . . . . . . . . . . . . (E84) 2 2 – – * * * *Volume depletion, disorders of fluid, electrolyte and acid-base balance . . . . . . . . . (E86–E87) 39 16 12 10 1.0 * * *
Meningitis . . . . . . . . . . . . . . . . . . . . . . . . . . . . (G00,G03) 40 19 6 9 1.1 * * *Infantile spinal muscular atrophy, type I (Werdnig-Hoffman) . . . . . . . . . . . . . . . . . . . . . . (G12.0) 3 1 1 – * * * *
Infantile cerebral palsy . . . . . . . . . . . . . . . . . . . . . . .(G80) 4 1 2 – * * * *Anoxic brain damage, not elsewhere classified . . . . . . . . . . . . . . . . . . . . . . . . . . . . . . (G93.1) 24 12 6 4 0.6 * * *
Diseases of the ear and mastoid process . . . . (H60–H93) 3 – 1 2 * * * *Diseases of the circulatory system . . . . . . . . . . . (I00–I99) 406 177 111 81 10.8 9.2 20.3 9.1Acute upper respiratory infections . . . . . . . . . . (J00–J06) 10 3 2 3 * * * *Influenza and pneumonia . . . . . . . . . . . . . . . . . (J09–J18) 156 53 55 29 4.2 2.8 10.0 3.3Acute bronchitis and acute bronchiolitis . . . . . (J20–J21) 42 9 20 8 1.1 * 3.6 *Bronchitis, chronic and unspecified . . . . . . . . . (J40–J42) 10 4 4 1 * * * *Asthma . . . . . . . . . . . . . . . . . . . . . . . . . . . . . . . (J45–J46) 1 1 – – * * * *Pneumonitis due to solids and liquids . . . . . . . . . . . (J69) 8 4 3 1 * * * *Gastritis, duodenitis, and noninfective enteritis and colitis . . . . . . . . . . . . . . . . . (K29,K50–K55) 36 19 6 7 1.0 * * *
Hernia of abdominal cavity and intestinal obstruction without hernia . . . . . . . . . . . (K40–K46,K56) 38 20 9 3 1.0 1.0 * *
Renal failure and other disorders of kidney . . . . . . . . . . . . . . . . . . . . . . (N17–N19,N25,N27) 57 22 21 12 1.5 1.1 3.8 *
Newborn affected by maternal hypertensive disorders . . . . . . . . . . . . . . . . . . . . . . . . . . . . . . (P00.0) 67 27 23 10 1.8 1.4 4.2 *
Newborn affected by other maternal conditions which may be unrelated to present pregnancy . . . . . . . . . . . . . . . . . . . . . . . .(P00.1–P00.9) 72 28 20 16 1.9 1.5 3.6 *

National Vital Statistics Reports, Vol. 70, No. 8, July 26, 2021 67
Table 14. Number of infant deaths and infant mortality rates for selected causes, by race and Hispanic origin: United States, 2019—Con.[Rates are infant deaths (under 1 year) per 100,000 live births in specified group. Infant deaths are based on race or Hispanic origin of decedent; live births are based on race or Hispanic origin of mother. Race and Hispanic-origin categories are consistent with 1997 Office of Management and Budget standards]
Cause of death (based on International Classification of Diseases, 10th Revision)
Number1 Rate
Total2
Non- Hispanic,
single-race white3
Non-Hispanic,
single-race black3 Hispanic4 Total2
Non- Hispanic,
single-race white3
Non-Hispanic,
single-race black3 Hispanic4
Newborn affected by maternal complications of pregnancy . . . . . . . . . . . . . . . . . . . . . . . . . . . . . . . (P01) 1,245 404 380 320 33.2 21.1 69.3 36.1
Newborn affected by complications of placenta, cord and membranes . . . . . . . . . . . . . . . . . . . . . . . (P02) 742 284 208 167 19.8 14.8 38.0 18.8
Newborn affected by other complications of labor and delivery . . . . . . . . . . . . . . . . . . . . . . . . . (P03) 79 40 21 10 2.1 2.1 3.8 *
Newborn affected by noxious influences transmitted via placenta or breast milk . . . . . . . . . (P04) 36 17 5 6 1.0 * * *
Slow fetal growth and fetal malnutrition . . . . . . . . . (P05) 110 40 38 25 2.9 2.1 6.9 2.8Disorders related to short gestation and low birth weight, not elsewhere classified . . . . . . . (P07) 3,445 1,102 1,289 702 91.9 57.5 235.2 79.2
Disorders related to long gestation and high birth weight . . . . . . . . . . . . . . . . . . . . . . . . . . (P08) – – – – * * * *
Birth trauma . . . . . . . . . . . . . . . . . . . . . . . . . . .(P10–P15) 13 5 3 2 * * * *Intrauterine hypoxia and birth asphyxia . . . . . .(P20–P21) 336 153 95 62 9.0 8.0 17.3 7.0Respiratory distress of newborn . . . . . . . . . . . . . . . (P22) 424 181 118 100 11.3 9.4 21.5 11.3Other respiratory conditions originating in the perinatal period . . . . . . . . . . . . . . . . . . . . . . .(P23–P28) 787 325 238 176 21.0 17.0 43.4 19.9
Congenital pneumonia . . . . . . . . . . . . . . . . . . . . . . . (P23) 47 14 17 10 1.3 * * *Neonatal aspiration syndromes . . . . . . . . . . . . . . . . (P24) 38 21 10 3 1.0 1.1 * *Interstitial emphysema and related conditions originating in the perinatal period . . . . . . . . . . . . . (P25) 90 42 20 26 2.4 2.2 3.6 2.9
Pulmonary hemorrhage originating in the perinatal period . . . . . . . . . . . . . . . . . . . . . . . . . . . (P26) 136 47 50 30 3.6 2.5 9.1 3.4
Chronic respiratory disease originating in the perinatal period . . . . . . . . . . . . . . . . . . . . . . . . . . . (P27) 157 56 61 32 4.2 2.9 11.1 3.6
Atelectasis . . . . . . . . . . . . . . . . . . . . . . . . .(P28.0–P28.1) 248 116 63 54 6.6 6.1 11.5 6.1Bacterial sepsis of newborn . . . . . . . . . . . . . . . . . . . (P36) 603 237 189 135 16.1 12.4 34.5 15.2Omphalitis of newborn with or without mild hemorrhage . . . . . . . . . . . . . . . . . . . . . . . . . . . . . . (P38) 1 – – 1 * * * *
Neonatal hemorrhage . . . . . . . . . . . . . . . . (P50–P52,P54) 348 150 91 84 9.3 7.8 16.6 9.5Hemorrhagic disease of newborn . . . . . . . . . . . . . . (P53) 1 1 – – * * * *Hemolytic disease of newborn due to isoimmunization and other perinatal jaundice . . . . . . . . . . . . . . . . . . . . . .(P55–P59) 17 6 7 2 * * * *
Hematological disorders . . . . . . . . . . . . . . . . .(P60–P61) 94 38 22 27 2.5 2.0 4.0 3.0Syndrome of infant of a diabetic mother and neonatal diabetes mellitus . . . . . . . . . . . .(P70.0–P70.2) 12 1 6 5 * * * *
Necrotizing enterocolitis of newborn . . . . . . . . . . . . (P77) 354 122 119 83 9.4 6.4 21.7 9.4Hydrops fetalis not due to hemolytic disease . . . . (P83.2) 174 93 27 35 4.6 4.9 4.9 3.9Congenital malformations, deformations and chromosomal abnormalities . . . . . . . . . . . . (Q00–Q99) 4,301 2,015 801 1,138 114.8 105.2 146.1 128.4
Symptoms, signs and abnormal clinical and laboratory findings, not elsewhere classified . . . . . . . . . . . . . . . . . . . . . . . . . . . (R00–R99) 2,453 938 864 450 65.5 49.0 157.6 50.8
Sudden infant death syndrome . . . . . . . . . . . . . . . .(R95) 1,248 495 434 217 33.3 25.8 79.2 24.5Accidents (unintentional injuries) . . . . . . . . . . .(V01–X59) 1,266 589 369 184 33.8 30.7 67.3 20.8Assault (homicide) . . . . . . . . . . . . . . . . (*U01,X85–Y09)5 263 96 98 52 7.0 5.0 17.9 5.9Complications of medical and surgical care . . .(Y40–Y84) 29 9 7 11 0.8 * * *
* Estimate does not meet National Center for Health Statistics standards of reliability; see Technical Notes in this report. – Quantity zero. 1Only selected causes of death are shown; therefore, subcategories do not add to totals; see Technical Notes. 2Includes race and origin groups not shown separately; see Technical Notes. 3Only one race was reported on the death certificate; see Technical Notes. 4Includes persons of Hispanic origin of any race; see Technical Notes. 5Asterisks (*) preceding cause-of-death codes indicate they are not part of the International Classification of Diseases, 10th Revision; see Technical Notes.
SOURCE: National Center for Health Statistics, National Vital Statistics System, Mortality.
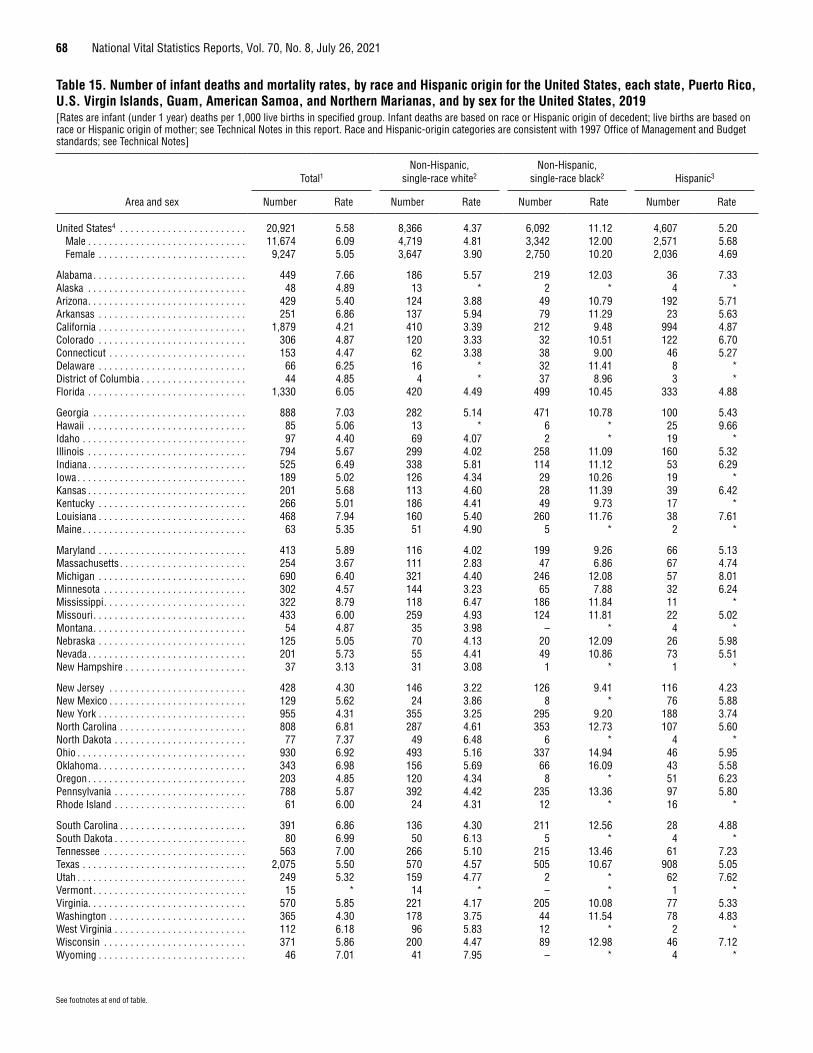
68 National Vital Statistics Reports, Vol. 70, No. 8, July 26, 2021
See footnotes at end of table.
Table 15. Number of infant deaths and mortality rates, by race and Hispanic origin for the United States, each state, Puerto Rico, U.S. Virgin Islands, Guam, American Samoa, and Northern Marianas, and by sex for the United States, 2019[Rates are infant (under 1 year) deaths per 1,000 live births in specified group. Infant deaths are based on race or Hispanic origin of decedent; live births are based on race or Hispanic origin of mother; see Technical Notes in this report. Race and Hispanic-origin categories are consistent with 1997 Office of Management and Budget standards; see Technical Notes]
Area and sex
Total1Non-Hispanic,
single-race white2Non-Hispanic,
single-race black2 Hispanic3
Number Rate Number Rate Number Rate Number Rate
United States4 . . . . . . . . . . . . . . . . . . . . . . . . 20,921 5.58 8,366 4.37 6,092 11.12 4,607 5.20Male . . . . . . . . . . . . . . . . . . . . . . . . . . . . . . 11,674 6.09 4,719 4.81 3,342 12.00 2,571 5.68Female . . . . . . . . . . . . . . . . . . . . . . . . . . . . 9,247 5.05 3,647 3.90 2,750 10.20 2,036 4.69
Alabama . . . . . . . . . . . . . . . . . . . . . . . . . . . . . 449 7.66 186 5.57 219 12.03 36 7.33Alaska . . . . . . . . . . . . . . . . . . . . . . . . . . . . . . 48 4.89 13 * 2 * 4 *Arizona . . . . . . . . . . . . . . . . . . . . . . . . . . . . . . 429 5.40 124 3.88 49 10.79 192 5.71Arkansas . . . . . . . . . . . . . . . . . . . . . . . . . . . . 251 6.86 137 5.94 79 11.29 23 5.63California . . . . . . . . . . . . . . . . . . . . . . . . . . . . 1,879 4.21 410 3.39 212 9.48 994 4.87Colorado . . . . . . . . . . . . . . . . . . . . . . . . . . . . 306 4.87 120 3.33 32 10.51 122 6.70Connecticut . . . . . . . . . . . . . . . . . . . . . . . . . . 153 4.47 62 3.38 38 9.00 46 5.27Delaware . . . . . . . . . . . . . . . . . . . . . . . . . . . . 66 6.25 16 * 32 11.41 8 *District of Columbia . . . . . . . . . . . . . . . . . . . . 44 4.85 4 * 37 8.96 3 *Florida . . . . . . . . . . . . . . . . . . . . . . . . . . . . . . 1,330 6.05 420 4.49 499 10.45 333 4.88
Georgia . . . . . . . . . . . . . . . . . . . . . . . . . . . . . 888 7.03 282 5.14 471 10.78 100 5.43Hawaii . . . . . . . . . . . . . . . . . . . . . . . . . . . . . . 85 5.06 13 * 6 * 25 9.66Idaho . . . . . . . . . . . . . . . . . . . . . . . . . . . . . . . 97 4.40 69 4.07 2 * 19 *Illinois . . . . . . . . . . . . . . . . . . . . . . . . . . . . . . 794 5.67 299 4.02 258 11.09 160 5.32Indiana . . . . . . . . . . . . . . . . . . . . . . . . . . . . . . 525 6.49 338 5.81 114 11.12 53 6.29Iowa . . . . . . . . . . . . . . . . . . . . . . . . . . . . . . . . 189 5.02 126 4.34 29 10.26 19 *Kansas . . . . . . . . . . . . . . . . . . . . . . . . . . . . . . 201 5.68 113 4.60 28 11.39 39 6.42Kentucky . . . . . . . . . . . . . . . . . . . . . . . . . . . . 266 5.01 186 4.41 49 9.73 17 *Louisiana . . . . . . . . . . . . . . . . . . . . . . . . . . . . 468 7.94 160 5.40 260 11.76 38 7.61Maine . . . . . . . . . . . . . . . . . . . . . . . . . . . . . . . 63 5.35 51 4.90 5 * 2 *
Maryland . . . . . . . . . . . . . . . . . . . . . . . . . . . . 413 5.89 116 4.02 199 9.26 66 5.13Massachusetts . . . . . . . . . . . . . . . . . . . . . . . . 254 3.67 111 2.83 47 6.86 67 4.74Michigan . . . . . . . . . . . . . . . . . . . . . . . . . . . . 690 6.40 321 4.40 246 12.08 57 8.01Minnesota . . . . . . . . . . . . . . . . . . . . . . . . . . . 302 4.57 144 3.23 65 7.88 32 6.24Mississippi . . . . . . . . . . . . . . . . . . . . . . . . . . . 322 8.79 118 6.47 186 11.84 11 *Missouri . . . . . . . . . . . . . . . . . . . . . . . . . . . . . 433 6.00 259 4.93 124 11.81 22 5.02Montana . . . . . . . . . . . . . . . . . . . . . . . . . . . . . 54 4.87 35 3.98 – * 4 *Nebraska . . . . . . . . . . . . . . . . . . . . . . . . . . . . 125 5.05 70 4.13 20 12.09 26 5.98Nevada . . . . . . . . . . . . . . . . . . . . . . . . . . . . . . 201 5.73 55 4.41 49 10.86 73 5.51New Hampshire . . . . . . . . . . . . . . . . . . . . . . . 37 3.13 31 3.08 1 * 1 *
New Jersey . . . . . . . . . . . . . . . . . . . . . . . . . . 428 4.30 146 3.22 126 9.41 116 4.23New Mexico . . . . . . . . . . . . . . . . . . . . . . . . . . 129 5.62 24 3.86 8 * 76 5.88New York . . . . . . . . . . . . . . . . . . . . . . . . . . . . 955 4.31 355 3.25 295 9.20 188 3.74North Carolina . . . . . . . . . . . . . . . . . . . . . . . . 808 6.81 287 4.61 353 12.73 107 5.60North Dakota . . . . . . . . . . . . . . . . . . . . . . . . . 77 7.37 49 6.48 6 * 4 *Ohio . . . . . . . . . . . . . . . . . . . . . . . . . . . . . . . . 930 6.92 493 5.16 337 14.94 46 5.95Oklahoma . . . . . . . . . . . . . . . . . . . . . . . . . . . . 343 6.98 156 5.69 66 16.09 43 5.58Oregon . . . . . . . . . . . . . . . . . . . . . . . . . . . . . . 203 4.85 120 4.34 8 * 51 6.23Pennsylvania . . . . . . . . . . . . . . . . . . . . . . . . . 788 5.87 392 4.42 235 13.36 97 5.80Rhode Island . . . . . . . . . . . . . . . . . . . . . . . . . 61 6.00 24 4.31 12 * 16 *
South Carolina . . . . . . . . . . . . . . . . . . . . . . . . 391 6.86 136 4.30 211 12.56 28 4.88South Dakota . . . . . . . . . . . . . . . . . . . . . . . . . 80 6.99 50 6.13 5 * 4 *Tennessee . . . . . . . . . . . . . . . . . . . . . . . . . . . 563 7.00 266 5.10 215 13.46 61 7.23Texas . . . . . . . . . . . . . . . . . . . . . . . . . . . . . . . 2,075 5.50 570 4.57 505 10.67 908 5.05Utah . . . . . . . . . . . . . . . . . . . . . . . . . . . . . . . . 249 5.32 159 4.77 2 * 62 7.62Vermont . . . . . . . . . . . . . . . . . . . . . . . . . . . . . 15 * 14 * – * 1 *Virginia . . . . . . . . . . . . . . . . . . . . . . . . . . . . . . 570 5.85 221 4.17 205 10.08 77 5.33Washington . . . . . . . . . . . . . . . . . . . . . . . . . . 365 4.30 178 3.75 44 11.54 78 4.83West Virginia . . . . . . . . . . . . . . . . . . . . . . . . . 112 6.18 96 5.83 12 * 2 *Wisconsin . . . . . . . . . . . . . . . . . . . . . . . . . . . 371 5.86 200 4.47 89 12.98 46 7.12Wyoming . . . . . . . . . . . . . . . . . . . . . . . . . . . . 46 7.01 41 7.95 – * 4 *
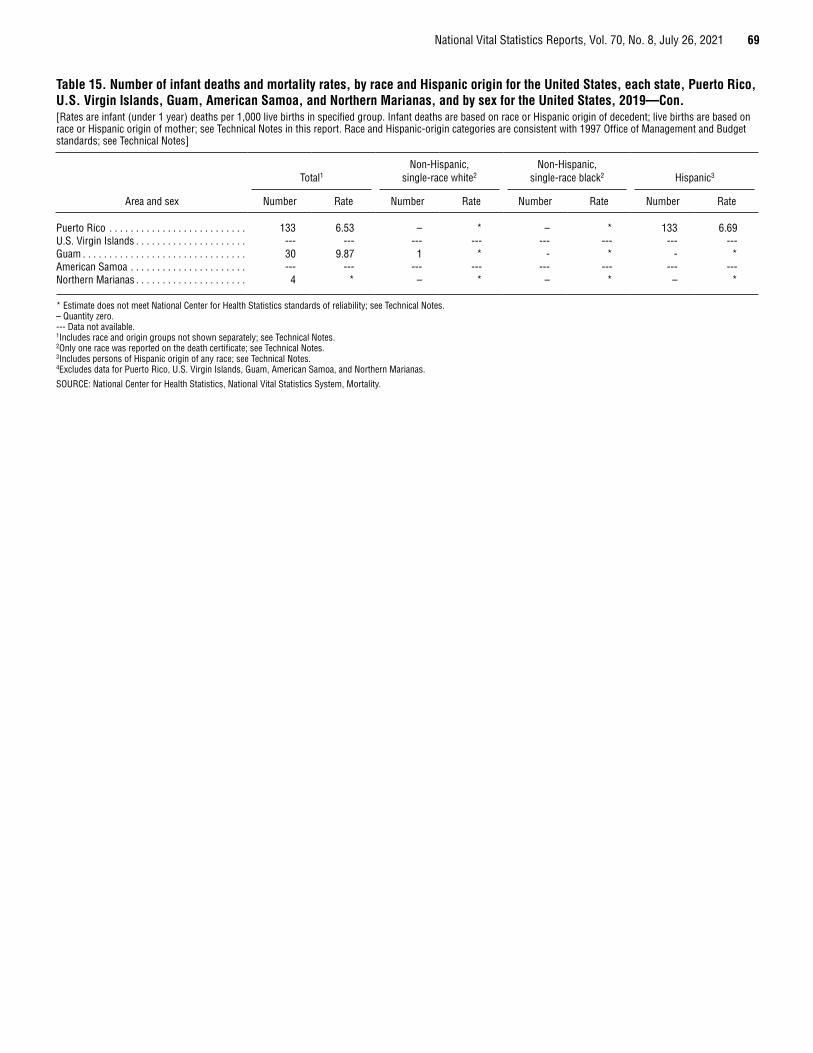
National Vital Statistics Reports, Vol. 70, No. 8, July 26, 2021 69
Table 15. Number of infant deaths and mortality rates, by race and Hispanic origin for the United States, each state, Puerto Rico, U.S. Virgin Islands, Guam, American Samoa, and Northern Marianas, and by sex for the United States, 2019—Con.[Rates are infant (under 1 year) deaths per 1,000 live births in specified group. Infant deaths are based on race or Hispanic origin of decedent; live births are based on race or Hispanic origin of mother; see Technical Notes in this report. Race and Hispanic-origin categories are consistent with 1997 Office of Management and Budget standards; see Technical Notes]
Area and sex
Total1Non-Hispanic,
single-race white2Non-Hispanic,
single-race black2 Hispanic3
Number Rate Number Rate Number Rate Number Rate
Puerto Rico . . . . . . . . . . . . . . . . . . . . . . . . . . 133 6.53 – * – * 133 6.69U.S. Virgin Islands . . . . . . . . . . . . . . . . . . . . . --- --- --- --- --- --- --- ---Guam . . . . . . . . . . . . . . . . . . . . . . . . . . . . . . . 30 9.87 1 * - * - *American Samoa . . . . . . . . . . . . . . . . . . . . . . --- --- --- --- --- --- --- ---Northern Marianas . . . . . . . . . . . . . . . . . . . . . 4 * – * – * – *
* Estimate does not meet National Center for Health Statistics standards of reliability; see Technical Notes. – Quantity zero. --- Data not available. 1Includes race and origin groups not shown separately; see Technical Notes. 2Only one race was reported on the death certificate; see Technical Notes. 3Includes persons of Hispanic origin of any race; see Technical Notes. 4Excludes data for Puerto Rico, U.S. Virgin Islands, Guam, American Samoa, and Northern Marianas.
SOURCE: National Center for Health Statistics, National Vital Statistics System, Mortality.

70 National Vital Statistics Reports, Vol. 70, No. 8, July 26, 2021
See footnotes at end of table.
Table 16. Number of maternal deaths and maternal mortality rates for selected causes, by race and Hispanic origin: United States, 2019[Race and Hispanic-origin categories are consistent with 1997 Office of Management and Budget standards. Data for specified categories other than non-Hispanic, single-race white and non-Hispanic, single-race black should be interpreted with caution because of inconsistencies between reporting these items on death certificates and on censuses and surveys; see Technical Notes in this report]
Cause of death (based on International Classification of Diseases, 10th Revision) Total1
Non-Hispanic, single race
Hispanic3White2 Black2
American Indian or
Alaska Native2 Asian2
Native Hawaiian or Other Pacific
Islander2
NumberMaternal causes . . . . . . . . . . . . . . . . . . . . (A34,O00–O95,O98–O99) 754 343 241 14 33 5 112
Direct obstetric causes . . . . . . . . . . . . . . . . . . . . . (A34,O00–O95) 530 229 172 13 26 5 79Pregnancy with abortive outcome . . . . . . . . . . . . . . . (O00–O07) 26 6 9 1 1 – 9
Ectopic pregnancy . . . . . . . . . . . . . . . . . . . . . . . . . . . . . (O00) 13 2 5 – 1 – 5Spontaneous abortion . . . . . . . . . . . . . . . . . . . . . . . . . . (O03) 6 1 2 – – – 3Medical abortion . . . . . . . . . . . . . . . . . . . . . . . . . . . . . . (O04) – – – – – – –Other abortion . . . . . . . . . . . . . . . . . . . . . . . . . . . . . . . . (O05) 3 2 1 – – – –Other and unspecified pregnancy with abortive outcome . . . . . . . . . . . . . . . . . (O01–O02,O06–O07) 4 1 1 1 – – 1
Other direct obstetric causes . . . . . . . . . . . . . . (A34,O10–O92) 474 209 151 12 25 5 67Eclampsia and pre-eclampsia . . . . . . . . . . . . (O11,O13–O16) 46 13 24 1 1 – 7Hemorrhage of pregnancy and childbirth and placenta previa . . . . . . . . . . . . . . .(O20,O44–O46,O67,O72) 32 15 7 1 3 1 4
Complications predominantly related to the puerperium . . . . . . . . . . . . . . . . . . . . . . (A34,O85–O92) 76 30 30 1 7 1 7Obstetrical tetanus . . . . . . . . . . . . . . . . . . . . . . . . . . . (A34) – – – – – – –Obstetric embolism . . . . . . . . . . . . . . . . . . . . . . . . . . (O88) 37 14 12 1 6 – 4Other complications predominantly related to the puerperium . . . . . . . . . . . . . . . . (O85–O87,O89–O92) 39 16 18 – 1 1 3
All other direct obstetric causes . . . . . . (O10,O12,O21–O43,O47–O66,O68–O71,O73–O75) 320 151 90 9 14 3 49
Obstetric death of unspecified cause . . . . . . . . . . . . . . . . (O95) 30 14 12 – – – 3Indirect obstetric causes . . . . . . . . . . . . . . . . . . . . . . . (O98–O99) 224 114 69 1 7 – 33
Death from any obstetric cause occurring more than 42 days but less than 1 year after delivery . . . . . . . . . . . . . . (O96)4 322 132 111 6 9 2 57
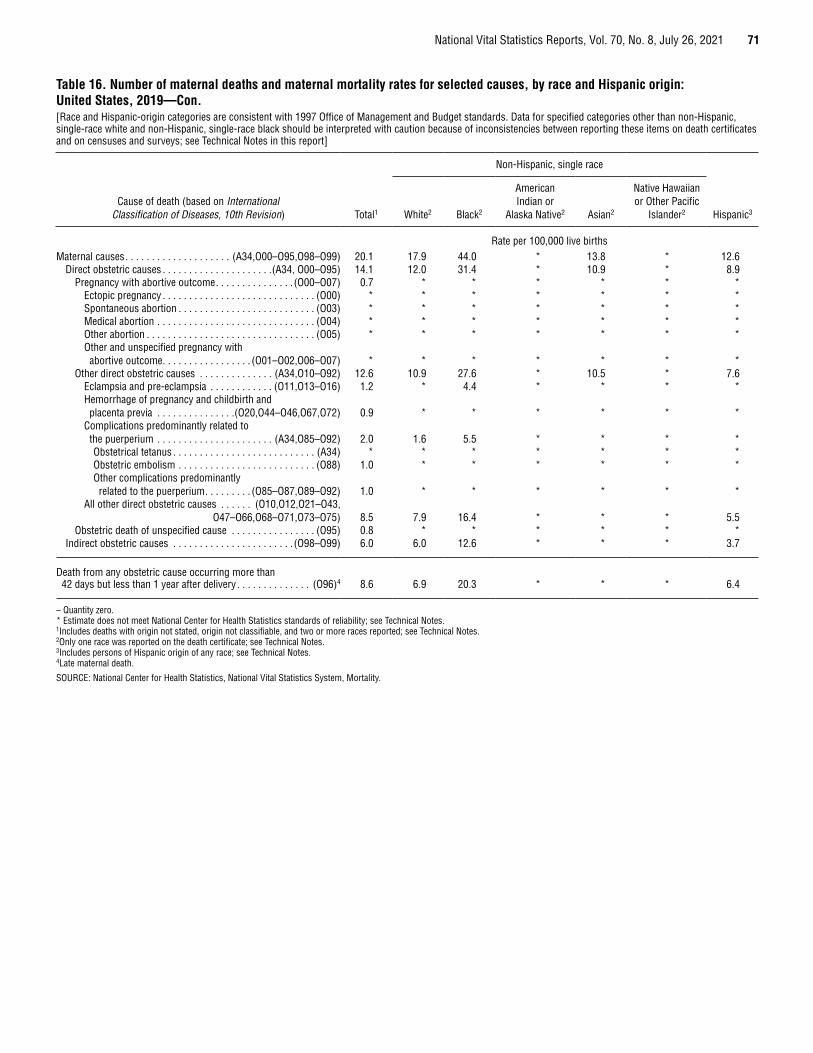
National Vital Statistics Reports, Vol. 70, No. 8, July 26, 2021 71
Table 16. Number of maternal deaths and maternal mortality rates for selected causes, by race and Hispanic origin: United States, 2019—Con.[Race and Hispanic-origin categories are consistent with 1997 Office of Management and Budget standards. Data for specified categories other than non-Hispanic, single-race white and non-Hispanic, single-race black should be interpreted with caution because of inconsistencies between reporting these items on death certificates and on censuses and surveys; see Technical Notes in this report]
Cause of death (based on International Classification of Diseases, 10th Revision) Total1
Non-Hispanic, single race
Hispanic3White2 Black2
American Indian or
Alaska Native2 Asian2
Native Hawaiian or Other Pacific
Islander2
Rate per 100,000 live birthsMaternal causes . . . . . . . . . . . . . . . . . . . . (A34,O00–O95,O98–O99) 20.1 17.9 44.0 * 13.8 * 12.6
Direct obstetric causes . . . . . . . . . . . . . . . . . . . . .(A34, O00–O95) 14.1 12.0 31.4 * 10.9 * 8.9Pregnancy with abortive outcome . . . . . . . . . . . . . . . (O00–O07) 0.7 * * * * * *
Ectopic pregnancy . . . . . . . . . . . . . . . . . . . . . . . . . . . . . (O00) * * * * * * *Spontaneous abortion . . . . . . . . . . . . . . . . . . . . . . . . . . (O03) * * * * * * *Medical abortion . . . . . . . . . . . . . . . . . . . . . . . . . . . . . . (O04) * * * * * * *Other abortion . . . . . . . . . . . . . . . . . . . . . . . . . . . . . . . . (O05) * * * * * * *Other and unspecified pregnancy with abortive outcome . . . . . . . . . . . . . . . . . (O01–O02,O06–O07) * * * * * * *
Other direct obstetric causes . . . . . . . . . . . . . . (A34,O10–O92) 12.6 10.9 27.6 * 10.5 * 7.6Eclampsia and pre-eclampsia . . . . . . . . . . . . (O11,O13–O16) 1.2 * 4.4 * * * *Hemorrhage of pregnancy and childbirth and placenta previa . . . . . . . . . . . . . . .(O20,O44–O46,O67,O72) 0.9 * * * * * *
Complications predominantly related to the puerperium . . . . . . . . . . . . . . . . . . . . . . (A34,O85–O92) 2.0 1.6 5.5 * * * *Obstetrical tetanus . . . . . . . . . . . . . . . . . . . . . . . . . . . (A34) * * * * * * *Obstetric embolism . . . . . . . . . . . . . . . . . . . . . . . . . . (O88) 1.0 * * * * * *Other complications predominantly related to the puerperium . . . . . . . . . (O85–O87,O89–O92) 1.0 * * * * * *
All other direct obstetric causes . . . . . . (O10,O12,O21–O43,O47–O66,O68–O71,O73–O75) 8.5 7.9 16.4 * * * 5.5
Obstetric death of unspecified cause . . . . . . . . . . . . . . . . (O95) 0.8 * * * * * *Indirect obstetric causes . . . . . . . . . . . . . . . . . . . . . . . (O98–O99) 6.0 6.0 12.6 * * * 3.7
Death from any obstetric cause occurring more than 42 days but less than 1 year after delivery . . . . . . . . . . . . . . (O96)4 8.6 6.9 20.3 * * * 6.4
– Quantity zero. * Estimate does not meet National Center for Health Statistics standards of reliability; see Technical Notes. 1Includes deaths with origin not stated, origin not classifiable, and two or more races reported; see Technical Notes. 2Only one race was reported on the death certificate; see Technical Notes. 3Includes persons of Hispanic origin of any race; see Technical Notes. 4Late maternal death.
SOURCE: National Center for Health Statistics, National Vital Statistics System, Mortality.
72 National Vital Statistics Reports, Vol. 70, No. 8, July 26, 2021
Technical Notes
Nature and sources of dataData in this report are based on information from all death
certificates filed in the 50 states and the District of Columbia and are processed by the National Center for Health Statistics (NCHS). Death certificates are completed by funeral directors, attending physicians, medical examiners, coroners, or other persons legally authorized to certify deaths. Data for 2019 are based on records of deaths that occurred during 2019 and were received as of July 27, 2020. Data for earlier years can be obtained via CDC WONDER (10).
The U.S. Standard Certificate of Death, which the states use as a model, was revised in 2003 (4). Prior to 2003, the standard certificate of death had not been revised since 1989 (15). Beginning in 2018, all 50 states and the District of Columbia used the 2003 revision of the U.S. Standard Certificate of Death for the entire year. During 2003–2017, both the 1989 and the 2003 standard certificates were used. For this transitional period, race and Hispanic ethnicity of decedents was reported using the 1977 Office of Management and Budget (OMB) guidelines (1989 certificate), which allowed the reporting of only one race and provided four choices and the 1997 OMB guidelines (2003 certificate) which allowed the reporting of more than one race and provided five categories (6,7).
Data for Guam, Commonwealth of the Northern Mariana Islands (Northern Marianas), and Puerto Rico are included in tables showing data by state but are not included in U.S. totals. Data for American Samoa and U.S. Virgin Islands for the 2019 data year were not available at the time of file closing and, therefore, are not included in this report. In 2019, Guam, Northern Marianas, and Puerto Rico collected and reported death data using the 2003 revision of the U.S. Standard Certificate of Death. Mortality statistics are based on information submitted by the jurisdictions and coded by NCHS through the Vital Statistics Cooperative Program. For the 2019 data year, all states, the District of Columbia, New York City, and Puerto Rico submitted mortality medical data and demographic data in electronic data files to NCHS. Guam and Northern Marianas submitted copies of death certificates from which NCHS entered and coded all medical data and demographic data.
Data for the entire United States refer to events occurring within the United States. Data shown for geographic areas are by place of residence. Beginning with 1970, mortality statistics for the United States exclude deaths of nonresidents of the United States. All data exclude fetal deaths.
Mortality statistics for Northern Marianas and Puerto Rico exclude deaths of nonresidents for each area. For Guam, however, mortality statistics exclude deaths that occurred to nonresidents of Guam or the United States (50 states and the District of Columbia).
Cause-of-death classificationThe mortality statistics presented in this report were
compiled in accordance with World Health Organization (WHO) regulations, which specify that member countries classify and code causes of death in accordance with the current revision of
the International Classification of Diseases (ICD). ICD provides the basic guidance used in virtually all countries to code and classify causes of death. Effective with deaths occurring in 1999, the United States began using the 10th revision of this classification (ICD–10) (39). For earlier years, causes of death were classified according to the revisions then in use: 1979–1998, Ninth Revision; 1968–1978, Eighth Revision, adapted for use in the United States; 1958–1967, Seventh Revision; and 1949–1957, Sixth Revision.
Changes in classification of causes of death due to these revisions may result in discontinuities in cause-of-death trends. Consequently, cause-of-death comparisons among revisions require consideration of comparability ratios and, where available, estimates of their standard errors. Comparability ratios between the Ninth and Tenth revisions, Eighth and Ninth revisions, Seventh and Eighth revisions, and Sixth and Seventh revisions may be found in other NCHS reports and independent tabulations (40–45).
ICD not only details disease classification but also provides definitions, tabulation lists, the format of the death certificate, and the rules for coding cause of death. Cause-of-death data presented in this publication were coded by procedures outlined in annual issues of the NCHS Instruction Manual (12,46,47). ICD includes rules for selecting the underlying cause of death and regulations on the use of ICD.
Prior to data year 1968, mortality medical data were based on manual coding of an underlying cause of death for each certificate, in accordance with WHO rules. Effective with data year 1968, NCHS converted to computerized coding of the underlying cause and manual coding of all causes (multiple causes) on the death certificate. In this system, called Automated Classification of Medical Entities (ACME) (48), multiple-cause codes are inputted into computer software that uses WHO rules to select the underlying cause. All cause-of-death data in this report are coded using ACME.
The ACME system is used to select the underlying cause of death for all death certificates in the United States. In addition, NCHS developed two computer systems as inputs to ACME. Beginning with 1990 data, the Mortality Medical Indexing, Classification, and Retrieval system (MICAR) (49,50) was introduced to automate the coding of multiple causes of death. In addition, MICAR provides more detailed information on the conditions reported on death certificates than is available through ICD code structure. Beginning with data year 1993, SuperMICAR (51), an enhancement of the MICAR system, was introduced, allowing for literal entry of the multiple cause-of-death text as reported by the certifier. This information is then automatically processed by the MICAR and ACME computer systems. Records that cannot be automatically processed by MICAR are manually multiple-cause coded and then further processed through ACME to determine the underlying cause of death. In 2019, SuperMICAR was used to process all of the country’s death records.
In this report, tabulations of cause-of-death statistics are based solely on the underlying cause of death. The underlying cause is defined by WHO as “the disease or injury which initiated the train of morbid events leading directly to death, or the circumstances of the accident or violence which produced the fatal injury” (12). The underlying cause is selected from the conditions
National Vital Statistics Reports, Vol. 70, No. 8, July 26, 2021 73
entered by the medical certifier in the cause-of-death section of the death certificate. When more than one cause or condition is entered by the medical certifier, the underlying cause is determined by the sequence of conditions on the certificate, provisions of ICD, and associated selection rules and modifications. Generally, more medical information is reported on death certificates than is directly reflected in the underlying cause of death. This is captured in NCHS multiple cause-of-death statistics (52–54).
Tabulation lists and cause-of-death rankingTabulation lists for ICD–10 are published in NCHS Instruction
Manual, Part 9, “ICD–10 Cause-of-Death Lists for Tabulating Mortality Statistics” (updated September 2020 to include WHO updates to ICD–10 for data year 2019) (55). Tabulation lists: a) “List of 113 Selected Causes of Death” and Enterocolitis due to Clostridium difficile (the title of which was modified in 2009 to include Enterocolitis due to Clostridium difficile), used for deaths of all ages; and b) “List of 130 Selected Causes of Infant Death,” used for infants, are used to rank leading causes of death for the two population groups (55). Prior to the 2015 data year, annual reports of final data presented cause-of-death data based on these two tabulation lists. To streamline cause-of-death information shown in this report, beginning with the 2015 data year, cause-of-death data are only presented for select causes of death. The select causes include all rankable causes as well as other select causes based on public health impact and future planning. Data for all causes on the “List of 113 Selected Causes of Death” and “List of 130 Selected Causes of Infant Death” are available from the NCHS website at: https://www.cdc.gov/nchs/data/nvsr/nvsr70/nvsr70-08-tables-508.pdf and through CDC’s WONDER (https://wonder.cdc.gov/). In the list of 113 causes, the group titles of Major cardiovascular diseases (ICD–10 codes I00–I78) and Symptoms, signs and abnormal clinical and laboratory findings, not elsewhere classified (R00–R99) are not ranked. In addition, category titles that begin with the words “other” and “all other” are not ranked to determine the leading causes of death. When one of the titles that represents a subtotal is ranked, for example, Tuberculosis (A16–A19), its component parts are not ranked, as in this case, Respiratory tuberculosis (A16) and Other tuberculosis (A17–A19). For the list of 130 causes of infant death, the same ranking procedures are used except that the category of Major cardiovascular diseases is not on the list. More detail regarding ranking procedures can be found in “Deaths: Leading Causes for 2019” (2).
Leading cause-of-death trends discussed in this report are based on cause-of-death data according to ICD–10 for 1999–2019 and ICD–9 for the most comparable cause-of-death titles for 1979–1998.
Although, in some cases, categories from the “List of 113 Selected Causes of Death” are identical to those in the earlier “List of 72 Selected Causes of Death” used with ICD–9, caution must be used because many of these categories are not comparable even though the cause-of-death titles may be the same. Tables showing ICD–9 categories that are comparable with ICD–10 titles in the “List of 113 Selected Causes of Death” may be found in the reports, “Comparability of Cause of Death Between ICD–9 and ICD–10: Preliminary Estimates” (42) and “Deaths: Final Data for 1999” (56).
Trend data for 1979–1998 that are classified by ICD–9 but sorted into the “List of 113 Selected Causes of Death” developed for ICD–10 are available from the NCHS website: https://www.cdc.gov/nchs/data/statab/hist001r.pdf.
Revision of ICD and resulting changes in classification and rules for selecting the underlying cause of death have important implications for the analysis of mortality trends by cause of death. For some causes of death, the discontinuity in trend can be substantial (40–42). Therefore, considerable caution should be used in analyzing cause-of-death trends for periods of time that extend across more than one revision of ICD.
Codes added or deleted in 2019Effective with data year 2019, ICD–10 code U07.0, Vaping
related disorder was added as a new, valid underlying cause-of-death code. No other codes were added or deleted from the list of valid underlying cause-of-death codes in 2019. Information on the addition of U07.0 as well as codes added or deleted in previous years is available from: https://www.cdc.gov/nchs/data/dvs/Part9InstructionManual2019-508.pdf (55).
Codes for terrorismBeginning with data for 2001, NCHS introduced categories
*U01–*U03 for classifying and coding deaths due to acts of terrorism. The asterisks before the category codes indicate that they are not part of ICD–10. Deaths classified to the terrorism categories are included in the 113 causes of death list in the categories for Assault (homicide) and Intentional self-harm (suicide), and in the 130 causes of death list for infants in the category for Assault (homicide). Additional information on these new categories is available from: https://www.cdc.gov/nchs/icd/terrorism_code.htm. In 2019, deaths resulting from a mass shooting in El Paso, Texas and deaths from a separate mass shooting incident at the Naval Air Station in Pensacola, Florida were assigned code U01.4, Terrorism involving firearms. This report includes 20 deaths assigned to a terrorism code in 2019. Only deaths to residents of the United States are included in this report.
In any given year, it is possible that deaths resulting from acts of terrorism may not be identified as such if: a) information identifying an incident as an act of terrorism is not available to the certifier at the time of certification; b) the certificate is not updated with the information if it later becomes available; or c) official results of the investigation declaring the incident to be an act of terrorism have not yet been made public.
Enterocolitis due to Clostridium difficile The number of deaths from Enterocolitis due to Clostridium
difficile (C. difficile) (ICD–10 code A04.7) was 4,533 in 2019. Deaths from this cause increased dramatically from 793 deaths in 1999 to a high of 8,085 deaths in 2011 (10). Because of the increasing importance of this cause of death (28,29), beginning with data year 2006, C. difficile was added to the list of rankable causes.
74 National Vital Statistics Reports, Vol. 70, No. 8, July 26, 2021
Quality of reporting and processing cause of death
The quality of mortality data is largely dependent on proper and thorough completion of death certificates by certifiers. Accuracy and completeness of information entered on death certificates can vary by state from year to year.
One index of the quality of reporting causes of death is the proportion of death certificates coded to Chapter XVIII—Symptoms, signs and abnormal clinical and laboratory findings, not elsewhere classified (ICD–10 codes R00–R99). Although which deaths occur for which underlying causes are impossible to determine, the proportion coded to R00–R99 indicates the consideration given to the cause-of-death statement by the medical certifier. This proportion also may be used as a rough measure of the specificity of medical diagnoses made by the certifier in various areas. The percentage of all reported deaths in the United States assigned to Symptoms, signs and abnormal clinical and laboratory findings, not elsewhere classified, decreased from 1.15% in 2018 to 1.14% in 2019.
Rules for coding a cause or causes of death may sometimes require modification when evidence suggests it will improve the quality of cause-of-death data. Prior to 1999, such modifications were made only when a new ICD revision was implemented. A process for updating ICD was introduced with ICD–10 that allows for midrevision changes. These changes, however, may affect comparability of data between years for selected causes of death.
Detail on coding and classification rule changes can be found in NCHS Instruction Manual, Part 2, available from: https://www.cdc.gov/nchs/nvss/instruction_manuals.htm (46–48). For example, Part 2c, “ICD–10 ACME Decision Tables for Classifying Underlying Causes of Death,” documents that the code assignment for the term “sarcopenia” changed in 2019 from R29.8, Other and unspecified symptoms and signs involving the nervous and musculoskeletal system, to M62.5, Muscle wasting and atrophy, not elsewhere classified (48). Deaths coded to M62.5 increased from 126 deaths in 2018 to 553 deaths in 2019 and deaths coded to R29.8 decreased from 215 in 2018 to 168 in 2019. Although coding rule changes can impact the number of deaths assigned to a given code, other factors, such as increased use of a term by certifiers, can also influence changes from year to year. Trend data for causes of death affected by coding rule changes should be interpreted with caution.
Rare causes of deathSelected causes of death considered to be of public health
concern are supposed to be routinely confirmed by states according to agreed-upon procedures between state vital statistics programs and NCHS. These causes, termed “infrequent and rare causes of death,” are listed in the NCHS Instruction Manual, Parts 2a, 11, and 20 (46,57,58). In 2019, some states did not confirm some or all deaths from rare causes.
Codes for dementia-related causesCauses of death attributable to dementia-related mortality
include ICD–10 codes F01, Vascular dementia; F03, Unspecified dementia; G30, Alzheimer disease; and G31, Other degenerative diseases of nervous system, not elsewhere classified.
Codes for drug-induced deaths Causes of death attributable to drug-induced mortality
include ICD–10 codes D52.1, Drug-induced folate deficiency anemia; D59.0, Drug-induced hemolytic anemia; D59.2, Drug-induced nonautoimmune hemolytic anemia; D61.1, Drug-induced aplastic anemia; D64.2, Secondary sideroblastic anemia due to drugs and toxins; E06.4, Drug-induced thyroiditis; E16.0, Drug-induced hypoglycemia without coma; E23.1, Drug-induced hypopituitarism; E24.2, Drug-induced Cushing syndrome; E27.3, Drug-induced adrenocortical insufficiency; E66.1, Drug-induced obesity; selected codes from the ICD–10 title of Mental and behavioral disorders due to psychoactive substance use, specifically, F11.1–F11.5, F11.7–F11.9, F12.1–F12.5, F12.7–F12.9, F13.1–F13.5, F13.7–F13.9, F14.1– F14.5, F14.7–F14.9, F15.1–F15.5, F15.7–F15.9, F16.1–F16.5, F16.7–F16.9, F17.3–F17.5, F17.7–F17.9, F18.1–F18.5, F18.7–F18.9, F19.1–F19.5, and F19.7–F19.9; G21.1, Other drug-induced secondary parkinsonism; G24.0, Drug-induced dystonia; G25.1, Drug-induced tremor; G25.4, Drug-induced chorea; G25.6, Drug-induced tics and other tics of organic origin; G44.4, Drug-induced headache, not elsewhere classified; G62.0, Drug-induced polyneuropathy; G72.0, Drug-induced myopathy; I95.2, Hypotension due to drugs; J70.2, Acute drug-induced interstitial lung disorders; J70.3, Chronic drug-induced interstitial lung disorders; J70.4, Drug-induced interstitial lung disorder, unspecified; K85.3, Drug-induced acute pancreatitis; L10.5, Drug-induced pemphigus; L27.0, Generalized skin eruption due to drugs and medicaments; L27.1, Localized skin eruption due to drugs and medicaments; M10.2, Drug-induced gout; M32.0, Drug-induced systemic lupus erythematosus; M80.4, Drug-induced osteoporosis with pathological fracture; M81.4, Drug-induced osteoporosis; M83.5, Other drug-induced osteomalacia in adults; M87.1, Osteonecrosis due to drugs; R50.2, Drug-induced fever; R78.1, Finding of opiate drug in blood; R78.2, Finding of cocaine in blood; R78.3, Finding of hallucinogen in blood; R78.4, Finding of other drugs of addictive potential in blood; R78.5, Finding of psychotropic drug in blood; X40–X44, Accidental poisoning by and exposure to drugs, medicaments and biological substances; X60–X64, Intentional self-poisoning (suicide) by and exposure to drugs, medicaments and biological substances; X85, Assault (homicide) by drugs, medicaments and biological substances; and Y10–Y14, Poisoning by and exposure to drugs, medicaments and biological substances, undetermined intent. Drug-induced causes exclude unintentional injuries, homicide, and other causes indirectly related to drug use, as well as newborn deaths associated with the mother’s drug use.
Codes for drug-overdose causes—Causes of death attributable to drug overdose are a subcategory of drug-induced causes. Drug-overdose mortality includes ICD–10 codes X40–X44, X60–X64, X85, and Y10–Y14.
National Vital Statistics Reports, Vol. 70, No. 8, July 26, 2021 75
Codes for alcohol-induced deathsCauses of death attributable to alcohol-induced mortality
include ICD–10 codes E24.4, Alcohol-induced pseudo-Cushing syndrome; F10, Mental and behavioral disorders due to alcohol use; G31.2, Degeneration of nervous system due to alcohol; G62.1, Alcoholic polyneuropathy; G72.1, Alcoholic myopathy; I42.6, Alcoholic cardiomyopathy; K29.2, Alcoholic gastritis; K70, Alcoholic liver disease; K85.2, Alcohol-induced acute pancreatitis; K86.0, Alcohol-induced chronic pancreatitis; R78.0, Finding of alcohol in blood; X45, Accidental poisoning by and exposure to alcohol; X65, Intentional self-poisoning by and exposure to alcohol; and Y15, Poisoning by and exposure to alcohol, undetermined intent. Alcohol-induced causes exclude unintentional injuries, homicides, and other causes indirectly related to alcohol use, as well as newborn deaths associated with maternal alcohol use.
Codes for firearm-related deathsCauses of death attributable to firearm-related injuries
include ICD–10 codes *U01.4, Terrorism involving firearms (homicide); W32–W34, Accidental discharge of firearms; X72–X74, Intentional self-harm (suicide) by discharge of firearms; X93–X95, Assault (homicide) by discharge of firearms; Y22–Y24, Discharge of firearms, undetermined intent; and Y35.0, Legal intervention involving firearm discharge. Deaths from firearm-related injuries exclude deaths due to explosives and other causes indirectly related to firearms.
Race and Hispanic originThe 2003 revision of the U.S. Standard Certificate of Death
allows the reporting of more than one race (multiple races) (4). This change was implemented to reflect the increasing diversity of the U.S. population and to be consistent with the decennial census and the 1997 “Revisions to the Standards for the Classification of Federal Data on Race and Ethnicity,” issued by OMB (5). This revision replaced standards that were issued in 1977 (16). The new standards mandate the collection of more than one race, where applicable, for federal data (5) and require the collection of information on a minimum set of five races (more than the minimum number of race categories are reported on death certificates) (4). Multiple race includes any combination of white, black or African American, American Indian or Alaska Native (AIAN), Asian, and Native Hawaiian or Other Pacific Islander (NHOPI). If two or more specific subgroups such as Korean and Chinese are reported, these count as a single race of Asian rather than as multiple races.
The number of states reporting multiple race increased, from 7 states in 2003 to all 50 states and the District of Columbia by 2018 (Table I). In 2019, more than one race was reported for 0.5% of decedents of non-Hispanic origin and for 0.9% of Hispanic origin (Table II). Although still uncommon, multiple races were reported more often for younger decedents than for older decedents (3.3% of decedents under age 25 compared with 0.8% of decedents aged 25–64 and 0.3% of decedents aged 65 and over). In 2019, no more than four races were reported for any decedent.
During 2003–2017, both the 1989 and the 2003 standard death certificates were used. For this transitional period, states using the 1989 death certificate reported the race and Hispanic ethnicity of decedents based on the OMB 1977 guidelines, which allowed the reporting of only one race and provided four choices: white, black or African American, AIAN, and Asian or Pacific Islander (API). Under these standards, data for API persons were collected as a single group; that is, data for Asian persons were not reported separately from NHOPI persons (15,16). States using the 2003 death certificate reported the race and Hispanic ethnicity of decedents based on the OMB 1997 guidelines, which allowed the reporting of more than one race and provided five categories (4,5). These guidelines provide for the reporting of Asian persons separately from NHOPI persons (5).
Beginning with data year 2018, multiple race data were collected and reported for the entire year by all 50 states and the District of Columbia. Previously, data by race for death certificates collecting only one race—the source of the numerators for death rates—were incompatible with the reporting in other states that had adopted the new standards and with population data collected in the 2000 and 2010 censuses, intercensal estimates for 1991–1999 and 2001–2009, and postcensal estimates for 2011–2017—the denominators for the rates. To produce death rates by race, the reported multiple race data from death certificates and population data for multiple-race persons had to be “bridged” to single-race categories. The bridging procedures used for the mortality records, and the multiple race population estimates were similar (20,21). Multiracial decedents were imputed to a single race (white, black, AIAN, or API) according to their combination of races, Hispanic origin, sex, and geographic area indicated on the death certificate. The imputation procedure is described in detail in “NCHS Procedures for Multiple-Race and Hispanic Origin Data: Collection, Coding, Editing, and Transmitting,” available from: https://www.cdc.gov/nchs/data/dvs/Multiple_race_documentation_5-10-04.pdf. Similarly, when calculating infant mortality rates, multiracial infants were bridged to a single race. The bridging procedure for multiple-race mothers and fathers was based on the procedure used to bridge the multiple-race population estimates (59). Beginning with the 2018 data year, use of the bridged-race process was no longer needed because all states collected data on race according to 1997 OMB guidelines for the entire year; however, bridged estimates will be calculated through 2020 to inform the reporting of trends over time.
Race and Hispanic origin are two distinct attributes and are reported separately on the death certificate. Therefore, data shown by Hispanic origin and race are based on a combination of the two attributes for the non-Hispanic population. Data shown for the Hispanic population include persons of any race.
Changing from bridged-race to single-race data had a relatively minor impact on age-adjusted death rates in 2019. Table A presents age-adjusted rates for 2019 based on 1977 bridged-race categories and 1997 race categories. Age-adjusted rates based on single-race data were higher than rates based on bridged data for the non-Hispanic white population by 0.4% and for the non-Hispanic black population by 1.5%. The difference between rates for the non-Hispanic AIAN population was not significant.
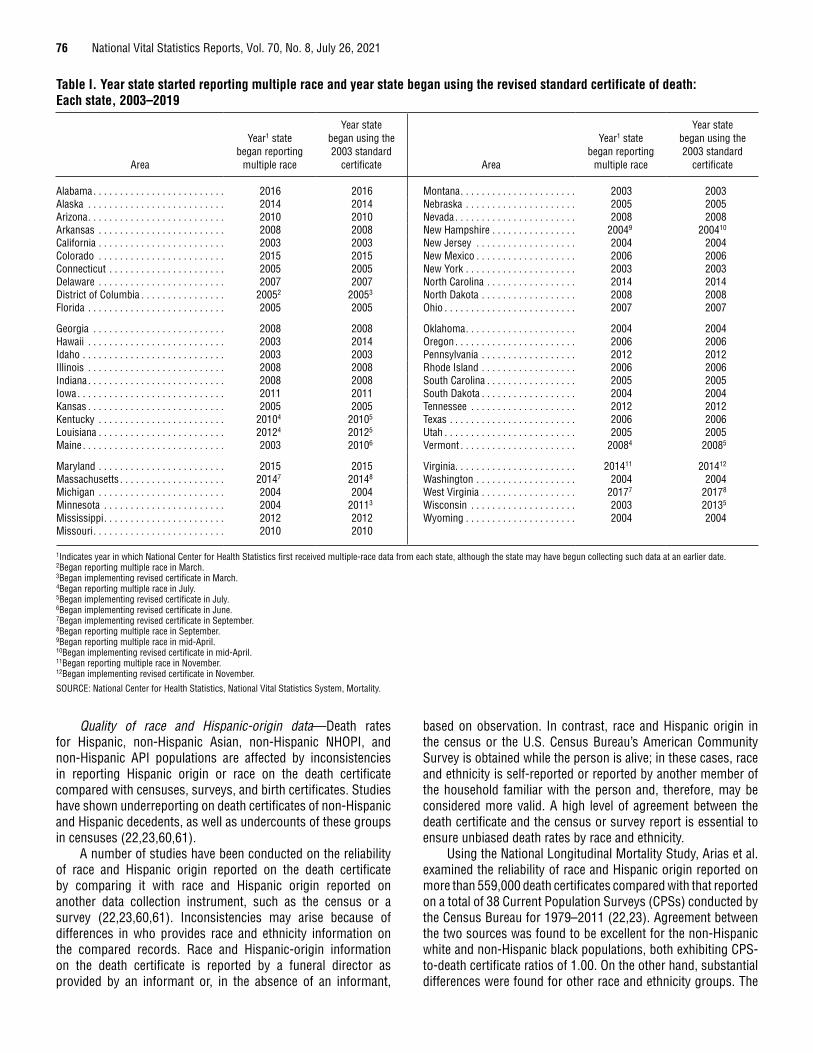
76 National Vital Statistics Reports, Vol. 70, No. 8, July 26, 2021
Quality of race and Hispanic-origin data—Death rates for Hispanic, non-Hispanic Asian, non-Hispanic NHOPI, and non-Hispanic API populations are affected by inconsistencies in reporting Hispanic origin or race on the death certificate compared with censuses, surveys, and birth certificates. Studies have shown underreporting on death certificates of non-Hispanic and Hispanic decedents, as well as undercounts of these groups in censuses (22,23,60,61).
A number of studies have been conducted on the reliability of race and Hispanic origin reported on the death certificate by comparing it with race and Hispanic origin reported on another data collection instrument, such as the census or a survey (22,23,60,61). Inconsistencies may arise because of differences in who provides race and ethnicity information on the compared records. Race and Hispanic-origin information on the death certificate is reported by a funeral director as provided by an informant or, in the absence of an informant,
based on observation. In contrast, race and Hispanic origin in the census or the U.S. Census Bureau’s American Community Survey is obtained while the person is alive; in these cases, race and ethnicity is self-reported or reported by another member of the household familiar with the person and, therefore, may be considered more valid. A high level of agreement between the death certificate and the census or survey report is essential to ensure unbiased death rates by race and ethnicity.
Using the National Longitudinal Mortality Study, Arias et al. examined the reliability of race and Hispanic origin reported on more than 559,000 death certificates compared with that reported on a total of 38 Current Population Surveys (CPSs) conducted by the Census Bureau for 1979–2011 (22,23). Agreement between the two sources was found to be excellent for the non-Hispanic white and non-Hispanic black populations, both exhibiting CPS-to-death certificate ratios of 1.00. On the other hand, substantial differences were found for other race and ethnicity groups. The
Table I. Year state started reporting multiple race and year state began using the revised standard certificate of death: Each state, 2003–2019
Area
Year1 state began reporting
multiple race
Year state began using the 2003 standard
certificate Area
Year1 state began reporting
multiple race
Year state began using the 2003 standard
certificate
Alabama . . . . . . . . . . . . . . . . . . . . . . . . . 2016 2016 Montana . . . . . . . . . . . . . . . . . . . . . . 2003 2003Alaska . . . . . . . . . . . . . . . . . . . . . . . . . . 2014 2014 Nebraska . . . . . . . . . . . . . . . . . . . . . 2005 2005Arizona . . . . . . . . . . . . . . . . . . . . . . . . . . 2010 2010 Nevada . . . . . . . . . . . . . . . . . . . . . . . 2008 2008Arkansas . . . . . . . . . . . . . . . . . . . . . . . . 2008 2008 New Hampshire . . . . . . . . . . . . . . . . 20049 200410
California . . . . . . . . . . . . . . . . . . . . . . . . 2003 2003 New Jersey . . . . . . . . . . . . . . . . . . . 2004 2004Colorado . . . . . . . . . . . . . . . . . . . . . . . . 2015 2015 New Mexico . . . . . . . . . . . . . . . . . . . 2006 2006Connecticut . . . . . . . . . . . . . . . . . . . . . . 2005 2005 New York . . . . . . . . . . . . . . . . . . . . . 2003 2003Delaware . . . . . . . . . . . . . . . . . . . . . . . . 2007 2007 North Carolina . . . . . . . . . . . . . . . . . 2014 2014District of Columbia . . . . . . . . . . . . . . . . 20052 20053 North Dakota . . . . . . . . . . . . . . . . . . 2008 2008Florida . . . . . . . . . . . . . . . . . . . . . . . . . . 2005 2005 Ohio . . . . . . . . . . . . . . . . . . . . . . . . . 2007 2007
Georgia . . . . . . . . . . . . . . . . . . . . . . . . . 2008 2008 Oklahoma . . . . . . . . . . . . . . . . . . . . . 2004 2004Hawaii . . . . . . . . . . . . . . . . . . . . . . . . . . 2003 2014 Oregon . . . . . . . . . . . . . . . . . . . . . . . 2006 2006Idaho . . . . . . . . . . . . . . . . . . . . . . . . . . . 2003 2003 Pennsylvania . . . . . . . . . . . . . . . . . . 2012 2012Illinois . . . . . . . . . . . . . . . . . . . . . . . . . . 2008 2008 Rhode Island . . . . . . . . . . . . . . . . . . 2006 2006Indiana . . . . . . . . . . . . . . . . . . . . . . . . . . 2008 2008 South Carolina . . . . . . . . . . . . . . . . . 2005 2005Iowa . . . . . . . . . . . . . . . . . . . . . . . . . . . . 2011 2011 South Dakota . . . . . . . . . . . . . . . . . . 2004 2004Kansas . . . . . . . . . . . . . . . . . . . . . . . . . . 2005 2005 Tennessee . . . . . . . . . . . . . . . . . . . . 2012 2012Kentucky . . . . . . . . . . . . . . . . . . . . . . . . 20104 20105 Texas . . . . . . . . . . . . . . . . . . . . . . . . 2006 2006Louisiana . . . . . . . . . . . . . . . . . . . . . . . . 20124 20125 Utah . . . . . . . . . . . . . . . . . . . . . . . . . 2005 2005Maine . . . . . . . . . . . . . . . . . . . . . . . . . . . 2003 20106 Vermont . . . . . . . . . . . . . . . . . . . . . . 20084 20085
Maryland . . . . . . . . . . . . . . . . . . . . . . . . 2015 2015 Virginia . . . . . . . . . . . . . . . . . . . . . . . 201411 201412
Massachusetts . . . . . . . . . . . . . . . . . . . . 20147 20148 Washington . . . . . . . . . . . . . . . . . . . 2004 2004Michigan . . . . . . . . . . . . . . . . . . . . . . . . 2004 2004 West Virginia . . . . . . . . . . . . . . . . . . 20177 20178
Minnesota . . . . . . . . . . . . . . . . . . . . . . . 2004 20113 Wisconsin . . . . . . . . . . . . . . . . . . . . 2003 20135
Mississippi . . . . . . . . . . . . . . . . . . . . . . . 2012 2012 Wyoming . . . . . . . . . . . . . . . . . . . . . 2004 2004Missouri . . . . . . . . . . . . . . . . . . . . . . . . . 2010 2010
1Indicates year in which National Center for Health Statistics first received multiple-race data from each state, although the state may have begun collecting such data at an earlier date. 2Began reporting multiple race in March. 3Began implementing revised certificate in March. 4Began reporting multiple race in July. 5Began implementing revised certificate in July. 6Began implementing revised certificate in June. 7Began implementing revised certificate in September. 8Began reporting multiple race in September. 9Began reporting multiple race in mid-April. 10Began implementing revised certificate in mid-April. 11Began reporting multiple race in November. 12Began implementing revised certificate in November.
SOURCE: National Center for Health Statistics, National Vital Statistics System, Mortality.

National Vital Statistics Reports, Vol. 70, No. 8, July 26, 2021 77
ratio of CPS to death certificates was found to be 1.33 for the non-Hispanic AIAN population and 1.03 for the non-Hispanic API population, indicating net underreporting on death certificates of 33% for non-Hispanic AIAN and 3% for non-Hispanic API. Using the new race standard, Asian and Pacific Islander are separate categories. The ratio of deaths for CPS to death certificates for Hispanic persons was found to be 1.03, indicating a net underreporting on death certificates for the Hispanic population of 3%. The net effect of misclassification is an underestimation of deaths and death rates for some race-ethnicity populations.
In addition, undercoverage of minority groups in the census and resultant population estimates introduces biases into death rates by race and Hispanic origin (22,23,60–63). Unlike the 1990 census, coverage error in the 2000 census was found
to be statistically significant only for the non-Hispanic white population (overcounted by approximately 1.13%) and non-Hispanic black population (undercounted by approximately 1.84%) (62). Overall, the 2010 census coverage error was minor, with a net overcount of 0.01%. The net undercounts were statistically different from zero for the following groups: non-Hispanic black (2.07%), non-Hispanic white (–0.84%), Hispanic (1.54%), and on-reservation AIAN (4.88%) populations. The net undercounts were not statistically different from zero for the non-Hispanic Asian (0.08%), non-Hispanic NHOPI (1.34%), and off-reservation AIAN (–1.95%) populations (64).
Data year 1997 was the first year in which mortality data by Hispanic origin were available for the entire United States.
Table II. Deaths, by origin and race: United States, 2019[By state of occurrence. Data exclude deaths with origin not stated or not classifiable. Records with race not stated or not classifiable are imputed; see Technical Notes in this report]
Origin and race Deaths
Percent of non-Hispanic
deaths Origin and race DeathsPercent of
Hispanic deaths
Non-Hispanic . . . . . . . . . . . . . . . . . . . . . . . . . . . 2,635,498 100.0 Hispanic . . . . . . . . . . . . . . . . . . . . . . . . . . . . 212,397 100.0One race . . . . . . . . . . . . . . . . . . . . . . . . . . . . . 2,622,601 99.5 One race . . . . . . . . . . . . . . . . . . . . . . . . . . 210,392 99.1
White . . . . . . . . . . . . . . . . . . . . . . . . . . . . 2,183,844 82.9 White . . . . . . . . . . . . . . . . . . . . . . . . . 204,524 96.3Black . . . . . . . . . . . . . . . . . . . . . . . . . . . . 346,677 13.2 Black . . . . . . . . . . . . . . . . . . . . . . . . . 3,852 1.8AIAN . . . . . . . . . . . . . . . . . . . . . . . . . . . . 18,057 0.7 AIAN . . . . . . . . . . . . . . . . . . . . . . . . . 1,109 0.5Asian . . . . . . . . . . . . . . . . . . . . . . . . . . . . 70,532 2.7 Asian . . . . . . . . . . . . . . . . . . . . . . . . . 627 0.3NHOPI . . . . . . . . . . . . . . . . . . . . . . . . . . . 3,491 0.1 NHOPI . . . . . . . . . . . . . . . . . . . . . . . . 280 0.1
Two or more races . . . . . . . . . . . . . . . . . . . . . 12,897 0.5 Two or more races . . . . . . . . . . . . . . . . . . 2,005 0.9Two races . . . . . . . . . . . . . . . . . . . . . . . . . . 12,110 0.5 Two races . . . . . . . . . . . . . . . . . . . . . . . 1,819 0.9
Black and White . . . . . . . . . . . . . . . . . . . . 2,032 0.1 Black and White . . . . . . . . . . . . . . . . . 459 0.2Black and AIAN . . . . . . . . . . . . . . . . . . . . 698 0.0 Black and AIAN . . . . . . . . . . . . . . . . . 27 0.0Black and Asian . . . . . . . . . . . . . . . . . . . . 316 0.0 Black and Asian . . . . . . . . . . . . . . . . . 15 0.0Black and NHOPI . . . . . . . . . . . . . . . . . . . 108 0.0 Black and NHOPI . . . . . . . . . . . . . . . . 5 0.0AIAN and White . . . . . . . . . . . . . . . . . . . . 4,580 0.2 AIAN and White . . . . . . . . . . . . . . . . . 711 0.3AIAN and Asian . . . . . . . . . . . . . . . . . . . . 134 0.0 AIAN and Asian . . . . . . . . . . . . . . . . . 25 0.0AIAN and NHOPI . . . . . . . . . . . . . . . . . . . 25 0.0 AIAN and NHOPI . . . . . . . . . . . . . . . . 2 0.0Asian and White. . . . . . . . . . . . . . . . . . . . 2,392 0.1 Asian and White. . . . . . . . . . . . . . . . . 448 0.2Asian and NHOPI . . . . . . . . . . . . . . . . . . . 1,016 0.0 Asian and NHOPI . . . . . . . . . . . . . . . . 27 0.0NHOPI and White . . . . . . . . . . . . . . . . . . 809 0.0 NHOPI and White . . . . . . . . . . . . . . . 100 0.0
Three races . . . . . . . . . . . . . . . . . . . . . . . . . 773 0.0 Three races . . . . . . . . . . . . . . . . . . . . . . 180 0.1Black, AIAN and White . . . . . . . . . . . . . . . 167 0.0 Black, AIAN and White . . . . . . . . . . . . 32 0.0Black, AIAN and Asian . . . . . . . . . . . . . . . 15 0.0 Black, AIAN and Asian . . . . . . . . . . . . 2 0.0Black, AIAN and NHOPI . . . . . . . . . . . . . . 3 0.0 Black, AIAN and NHOPI . . . . . . . . . . . 0 0.0Black, Asian and White . . . . . . . . . . . . . . 33 0.0 Black, Asian and White . . . . . . . . . . . 10 0.0Black, Asian and NHOPI. . . . . . . . . . . . . . 4 0.0 Black, Asian and NHOPI. . . . . . . . . . . 4 0.0Black, NHOPI and White . . . . . . . . . . . . . 7 0.0 Black, NHOPI and White . . . . . . . . . . 1 0.0AIAN, Asian and White . . . . . . . . . . . . . . 21 0.0 AIAN, Asian and White . . . . . . . . . . . 19 0.0AIAN, NHOPI and White . . . . . . . . . . . . . 6 0.0 AIAN, NHOPI and White . . . . . . . . . . 6 0.0AIAN, Asian and NHOPI . . . . . . . . . . . . . . 9 0.0 AIAN, Asian and NHOPI . . . . . . . . . . . 1 0.0Asian, NHOPI and White . . . . . . . . . . . . . 508 0.0 Asian, NHOPI and White . . . . . . . . . . 105 0.0
Four races . . . . . . . . . . . . . . . . . . . . . . . . . . 14 0.0 Four races . . . . . . . . . . . . . . . . . . . . . . . 6 0.0Black, AIAN, Asian and White . . . . . . . . . 3 0.0 Black, AIAN, Asian and White . . . . . . 3 0.0Black, AIAN, Asian and NHOPI . . . . . . . . – 0.0 Black, AIAN, Asian and NHOPI . . . . . – 0.0Black, AIAN, NHOPI and White . . . . . . . . 1 0.0 Black, AIAN, NHOPI and White . . . . . – 0.0Black, Asian, NHOPI and White . . . . . . . . 3 0.0 Black, Asian, NHOPI and White . . . . . – 0.0AIAN, Asian, NHOPI and White . . . . . . . . 7 0.0 AIAN, Asian, NHOPI and White . . . . . 3 0.0
Five races . . . . . . . . . . . . . . . . . . . . . . . . . . – 0.0 Five races . . . . . . . . . . . . . . . . . . . . . . . – 0.0Black, AIAN, Asian, NHOPI and White . . . . . . . . . . . . . . . . . . . . . . . – 0.0
Black, AIAN, Asian, NHOPI and White . . . . . . . . . . . . . . . . . . . . – 0.0
0.0 Quantity more than zero but less than 0.05. – Quantity zero.
NOTE: AIAN is American Indian or Alaska Native, and NHOPI is Native Hawaiian or Other Pacific Islander.
SOURCE: National Center for Health Statistics, National Vital Statistics System, Mortality.
78 National Vital Statistics Reports, Vol. 70, No. 8, July 26, 2021
Race not stated or not classifiable and Hispanic origin not stated or not classifiable—In 2019, death records with race not stated or not classifiable (1.0% of all records) were imputed to one of the five-single race categories by assigning the record a single-race value based on the last single-race record processed. Records with Hispanic origin not stated or not classifiable were not imputed and accounted for 0.2% of all records.
Infant and maternal mortality rates—Infant and maternal deaths in this report are tabulated by the race and Hispanic origin of the decedent. Live births, the denominators of infant and maternal mortality rates, are tabulated by race and Hispanic origin of mother.
In 2019, multiple race was reported on the revised birth certificates of all 50 states, the District of Columbia, Puerto Rico, Guam, and Northern Marianas using the 2003 revision of the U.S. Standard Certificate of Birth (65).
Infant mortality rates by race and origin are based on numbers of resident infant deaths by race and origin and numbers of resident live births by race and origin of mother for the United States. In computing infant mortality rates, deaths and live births of unknown or not classifiable origin are not distributed among the specified Hispanic and non-Hispanic groups. In the United States in 2019, the percentage of infant deaths of unknown origin was 1.0%, and the percentage of live births to mothers of unknown origin was 1.0%.
Small numbers of infant deaths for specific Hispanic-origin groups result in infant mortality rates subject to relatively large random variation (see “Random variation”).
Infant mortality rates calculated from the general mortality file for specified race and Hispanic origin contain errors because of reporting problems that affect the classification of race and Hispanic origin on the birth and death certificates for the same infant. Infant mortality rates by specified race and Hispanic origin are more accurate when based on the linked file of infant deaths and live births (37). The linked file computes infant mortality rates using the race and Hispanic origin of the mother from the birth certificate in both the numerator and denominator of the rate. In addition, the mother’s race and Hispanic origin from the birth certificate are considered to be more accurately reported than the infant’s race and Hispanic origin from the death certificate. On the birth certificate, race and Hispanic origin are generally reported by the mother at the time of delivery, whereas on the death certificate, the infant’s race and Hispanic origin are reported by an informant, usually the mother but sometimes the funeral director.
Estimates of reporting errors have been made by comparing rates based on the linked files with those in which the infant’s race and Hispanic origin are based on information from the death certificate (37,60).
Life tables The life table provides a comprehensive measure of the
effect of mortality on life expectancy. It is composed of sets of values showing the mortality experience of a hypothetical group of infants born at the same time and subject throughout their lifetime to the age-specific death rates of a particular time period, usually a given year. Prior to data year 1997, U.S. life
tables were abridged and constructed by reference to a standard table (66). In addition, the age range for these life tables was limited to 5-year age groups ending with age group 85 and over. Beginning with final data reported for 1997, complete life tables were constructed by single years of age extending to age 100 (67), using a methodology similar to that of the 1989–1991 decennial life tables (68). The methodology was again revised for data years 2000–2007 using a methodology similar to that of the 1999–2001 decennial life tables (69).
Research into the methodology used for the 1999–2001 decennial life tables, which was applied to the 2000–2007 annual life tables, revealed that it is not necessary to model (or “smooth”) the probabilities of death beginning at age 66. The observed blended vital statistics and Medicare data for ages 66–85 are robust enough and do not require additional smoothing. Beginning with final data reported for 2008 (70), the life table methodology was refined by changing the smoothing technique used to estimate the life table functions at the oldest ages. Beginning with the 2008 data year, the methodology used to produce the life tables does not model the probabilities of death beginning at age 66, but rather at ages above 85 or so. See “United States Life Tables, 2008” for a detailed description of the new methodology (71). Life table data shown in this report for data years 2001–2019 are based on the new methodology.
Because life table values presented in this report for 2001–2009 were re-estimated using the new methodology and revised 2001–2009 intercensal population estimates based on the 2010 decennial census (19), the values may differ from those previously published in annual final mortality and life table reports. Historically, NCHS has produced annual life tables by race, including the white and black populations, but did not produce life tables for other racial or ethnic groups. Beginning with data year 2006 (originally published elsewhere) (24), NCHS began producing life tables by Hispanic origin, after conducting research into the quality of race and ethnicity reporting on death certificates and developing methodologies to correct for misclassification of these populations on death certificates (22,23). These methods that adjust for misclassification are applied to the production of the life tables, but not to the death rates shown throughout this report.
Race-specific life tables for 2018 and 2019 presented in this report are based on the new standard and show estimates for single-race groups. These estimates are the official life expectancies for these years and may not be comparable to those of previous years that are based on bridged-race groups. To document the impact of changing to the 1997 standards, trend life expectancy estimates for bridged-race categories are included in this report for years 2010–2019 (Table 4) and in supplemental internet Table I–21 for 2006–2019. Estimates for bridged-race categories will continue to be calculated through data year 2020. The category “Hispanic” is consistent with previous reports, and trend data for the Hispanic population are not affected by the race category changes.
Although the life table methodology used produces complete life tables (by single years of age), the life table data shown in this report are summarized in 5-year age groupings.
National Vital Statistics Reports, Vol. 70, No. 8, July 26, 2021 79
Causes of death contributing to changes in life expectancy
A life table partitioning technique was used to estimate causes of death contributing to changes in life expectancy in this report. The method partitions changes into component additive parts and identifies the causes of death having the greatest influence, positive or negative, on changes in life expectancy (72–74).
Injury mortality by mechanism and intentInjury mortality data are presented using the external cause-
of-injury mortality matrix for ICD–10 (Table 11). In this framework, cause-of-injury deaths are organized principally by mechanism (e.g., firearm or poisoning), and secondarily by manner or intent of death (e.g., unintentional, suicide, or homicide).
The number of deaths for selected causes in this framework may differ from those shown in tables that use the standard mortality tabulation lists. Following WHO conventions, standard mortality tabulations (Table 8) present external causes of death (ICD–10 codes *U01–*U03 and V01–Y89); in contrast, the matrix (Table 11) excludes deaths classified as Complications of medical and surgical care (Y40–Y84 and Y88). For additional information on injury data presented in this framework, see “Deaths: Injuries, 2002,” available from: https://www.cdc.gov/nchs/data/nvsr/nvsr54/nvsr54_10.pdf (75). Data for later years are available through CDC WONDER (https://wonder.cdc.gov/) or through CDC WISQARS (https://www.cdc.gov/injury/wisqars/index.html). Implementation of changes to ICD–10 may affect the matrix, requiring modification of codes in selected categories. No changes were made to the matrix in 2019. For more information on the latest ICD–10 external cause-of-injury codes included in the matrix, see https://www.cdc.gov/nchs/injury/injury_tools.htm.
Infant mortalityInfant mortality rates are the most commonly used index
for measuring the risk of dying during the first year of life. The rates presented in this report are calculated by dividing the number of infant deaths in a calendar year by the number of live births registered for the same period and are presented as rates per 1,000 or per 100,000 live births. For final birth figures used in the denominator for infant mortality rates, see the report “Births: Final Data for 2019” (65). In contrast to infant mortality rates based on live births, infant death rates are based on the estimated population under age 1 year. Infant death rates that appear in tabulations of age-specific death rates in this report are calculated by dividing the number of infant deaths by the July 1, 2019, population estimate of persons under age 1, based on 2010 census populations. These rates are presented per 100,000 population in this age group. Because of differences in the denominators, infant death rates may differ from infant mortality rates.
There are two sources of infant mortality data: a) the general mortality file, and b) the linked file of live births and infant deaths. Data from the linked file differ from the infant mortality
data presented in this report because the linked file includes only those events in which both the birth and the death occur in the United States, and late-filed births. Processing of the linked file allows for further exclusion of infant records due to duplicates and records with additional information that raise questions about an infant’s age. Although the differences are usually very small, infant mortality rates based on the linked file tend to be somewhat smaller than those based on data from the general mortality file as presented in this report. The linked file is the preferred source for infant mortality by race because it uses the mother’s self-reported race from the child’s birth certificate (37), which is more reliable than the infant’s race listed on the death certificate, and because the numerator and denominator are referring to the same person’s race.
Maternal mortalityMaternal mortality rates are computed based on the number
of live births. The maternal mortality rate indicates the likelihood of a pregnant woman dying of maternal causes. The rates are calculated by dividing the number of maternal deaths in a calendar year by the number of live births registered for the same period and are presented as rates per 100,000 live births. Since the population of pregnant women who are at risk of a maternal death is unknown, the number of live births is used as the denominator.
Maternal deaths are defined by WHO as “the death of a woman while pregnant or within 42 days of termination of pregnancy, irrespective of the duration and the site of the pregnancy, from any cause related to or aggravated by the pregnancy or its management but not from accidental or incidental causes” (12). Included in these deaths are ICD–10 codes A34, O00–O95, and O98–O99.
The 2003 revision of the U.S. Standard Certificate of Death introduced a pregnancy-related checkbox question to help identify pregnancy-related deaths. Adopting a pregnancy status question consistent with the standard death certificate increased the identification of maternal deaths. Because maternal mortality was not comparable between states using a pregnancy checkbox and those not using a checkbox, NCHS suspended publishing maternal mortality data after the 2007 data year until all states adopted use of the revised certificate (38).
Beginning in 2018, all 50 states and D.C. used the revised certificate for the entire year including its pregnancy checkbox (California implemented a different checkbox from that on the U.S. Standard Certificate of Death that specifies if pregnant within the last year but does not indicate detail on whether pregnant at the time of death, pregnant 42 days before death, or pregnant 2 days to one year before death) (38). Because maternal mortality data among states became comparable, NCHS resumed publication of maternal mortality statistics in 2018.
NCHS recently adopted a new method (called the 2018 method) for coding maternal deaths, which was developed to improve the quality of maternal mortality data after studies concluded that implementation of the checkbox had resulted in overreporting of maternal deaths, particularly among older women (38). The 2018 method further restricts application of the pregnancy checkbox to decedents aged 10–44 years (previously application of the checkbox was restricted to age
80 National Vital Statistics Reports, Vol. 70, No. 8, July 26, 2021
group 10–54). In addition, if the checkbox is the only indication of pregnancy on the death certificate and no other pregnancy information is provided in the cause-of-death section, the 2018 method restricts assignment of maternal codes solely to the underlying cause of death.
Other variables available onlineHispanic subgroup
Mortality data by Hispanic subgroup no longer appear in the printed version of this report but are available in Table I–5 from the NCHS website at: https://www.cdc.gov/nchs/data/nvsr/nvsr70/nvsr70-08-tables-508.pdf.
Marital status
Mortality data by marital status no longer appear in the printed version of this report but are available in Table I–6 from the NCHS website at: https://www.cdc.gov/nchs/data/nvsr/nvsr70/nvsr70-08-tables-508.pdf.
Educational attainment
Mortality data by educational attainment no longer appear in the printed version of this report but are available in Table I–7 from the NCHS website at: https://www.cdc.gov/nchs/data/nvsr/nvsr70/nvsr70-08-tables-508.pdf.
Injury at work
Mortality data by injury at work no longer appear in the printed version of this report but are available in Tables I–8 and I–9 from the NCHS website at: https://www.cdc.gov/nchs/data/nvsr/nvsr70/nvsr70-08-tables-508.pdf.
Population bases for computing ratesPopulations used for computing death rates and life tables
shown in this report represent the population residing in the United States, enumerated as of April 1 for census years and estimated as of July 1 for all other years. Population estimates used to compute death rates for the United States for 2019 are shown for 5-year age groups by race and Hispanic origin in Table III (17).
Populations used for computing death rates by state, shown in Table IV, represent state postcensal population estimates based on the 2010 census, estimated as of July 1, 2019 (17). Rates for Puerto Rico also are based on population estimates from the 2010 census as of July 1, 2019, and are provided by the Census Bureau (76). Rates for Guam and Northern Marianas are based on population estimates provided by the Census Bureau’s International Data Base (77). Population estimates for each state and territory are not subject to sampling variation because the sources used in demographic analysis are complete counts.
Rates for 2011–2019 are based on postcensal population estimates consistent with the 2010 census, estimated as of July 1 (17–19). Rates for 2010 are based on populations enumerated as
of April 1, 2010 (19). Rates for 2001–2009 shown in this report were revised using revised intercensal population estimates based on the 2010 census, estimated as of July 1 (19). Death rates for 2000 are based on populations enumerated as of April 1, 2000 (78). Rates for 1991–1999 are based on intercensal population estimates consistent with the 2000 census levels (79).
Prior to 2018, population estimates were produced under a collaborative arrangement with the Census Bureau, based on the 2000 census counts by age, race, and sex, and were modified for consistency with 1977 OMB race categories and historical categories for death data (16,80). The modification procedures are described in detail elsewhere (20,21).
Beginning with 2018, death rates are based on unbridged, multiple-race data collected on death certificates according to the 1997 OMB standards. The denominator of the rates is unbridged, multiple-race population data collected according to the same standards by the U.S. Census Bureau. Overall, changing from bridged-race to unbridged data had a relatively minor impact on mortality rates in 2019 (7).
Computing ratesExcept for infant and maternal mortality rates, rates are on
an annual basis per 100,000 estimated population residing in the specified area. Infant and maternal mortality rates are per 1,000 or per 100,000 live births. Comparisons made in the text among rates, unless otherwise specified, are statistically significant at the 0.05 level of significance. Lack of comment in this report about any two rates does not mean that the difference was tested and found not to be significant at this level.
Age-adjusted rates (R ' ) are used to compare relative mortality risks among groups and over time. However, they should be viewed as relative indexes rather than as actual measures of mortality risk. They were computed by the direct method—that is, by applying age-specific death rates (Ri ) to the U.S. standard population age distribution (Table V), as in
where Psi is the standard population for age group i and Ps is the total U.S. standard population (all ages combined).
Beginning with the 1999 data year, NCHS adopted a new population standard for use in age-adjusting death rates. Based on the projected year 2000 population of the United States, the new standard replaced the 1940 standard population that had been used for more than 50 years. The new population standard affects levels of mortality and, to some extent, trends and group comparisons. Of particular note are the effects on race mortality comparisons. For detailed discussion, see: “Age Standardization of Death Rates: Implementation of the Year 2000 Standard” (81). Beginning with 2003 data, the traditional standard million population along with corresponding standard weights to six decimal places were replaced by the projected year 2000 population age distribution (Table V). The effect of the change is negligible and does not significantly affect comparability with age-adjusted rates calculated using the previous method. All age-adjusted rates shown in this report are based on the 2000 U.S. standard population.
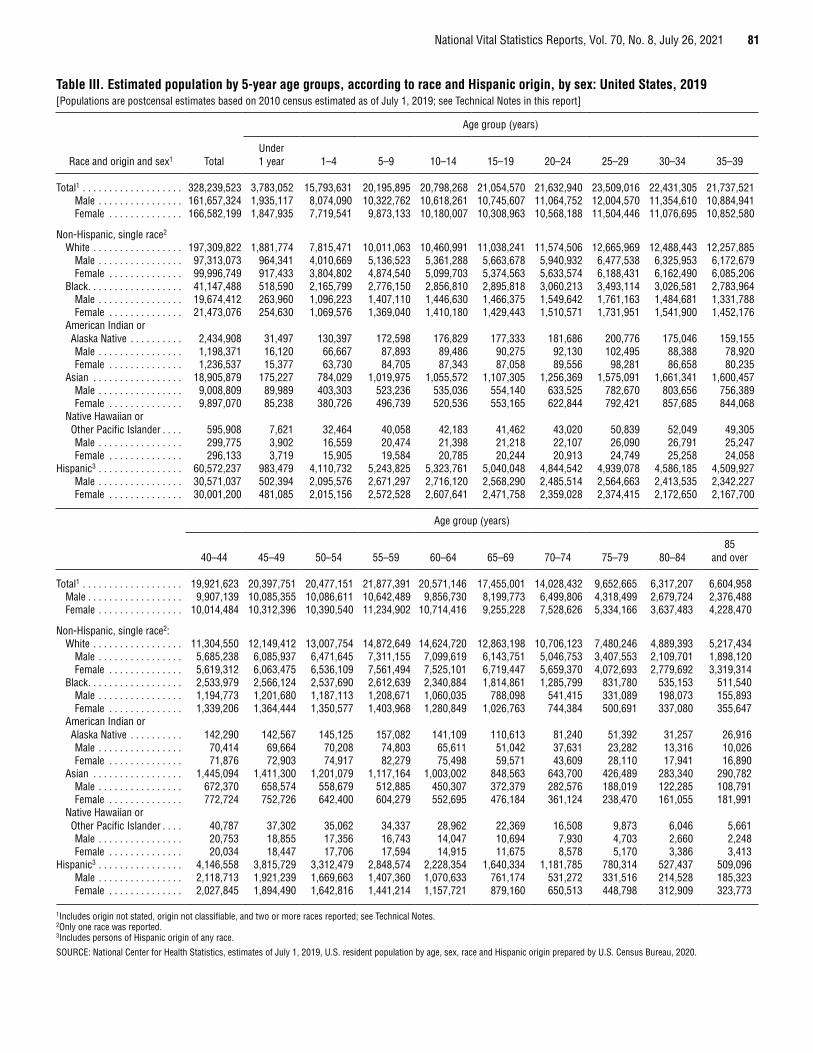
National Vital Statistics Reports, Vol. 70, No. 8, July 26, 2021 81
Table III. Estimated population by 5-year age groups, according to race and Hispanic origin, by sex: United States, 2019[Populations are postcensal estimates based on 2010 census estimated as of July 1, 2019; see Technical Notes in this report]
Race and origin and sex1 Total
Age group (years)
Under 1 year 1–4 5–9 10–14 15–19 20–24 25–29 30–34 35–39
Total1 . . . . . . . . . . . . . . . . . . . 328,239,523 3,783,052 15,793,631 20,195,895 20,798,268 21,054,570 21,632,940 23,509,016 22,431,305 21,737,521Male . . . . . . . . . . . . . . . . 161,657,324 1,935,117 8,074,090 10,322,762 10,618,261 10,745,607 11,064,752 12,004,570 11,354,610 10,884,941Female . . . . . . . . . . . . . . 166,582,199 1,847,935 7,719,541 9,873,133 10,180,007 10,308,963 10,568,188 11,504,446 11,076,695 10,852,580
Non-Hispanic, single race2
White . . . . . . . . . . . . . . . . . 197,309,822 1,881,774 7,815,471 10,011,063 10,460,991 11,038,241 11,574,506 12,665,969 12,488,443 12,257,885Male . . . . . . . . . . . . . . . . 97,313,073 964,341 4,010,669 5,136,523 5,361,288 5,663,678 5,940,932 6,477,538 6,325,953 6,172,679Female . . . . . . . . . . . . . . 99,996,749 917,433 3,804,802 4,874,540 5,099,703 5,374,563 5,633,574 6,188,431 6,162,490 6,085,206
Black . . . . . . . . . . . . . . . . . . 41,147,488 518,590 2,165,799 2,776,150 2,856,810 2,895,818 3,060,213 3,493,114 3,026,581 2,783,964Male . . . . . . . . . . . . . . . . 19,674,412 263,960 1,096,223 1,407,110 1,446,630 1,466,375 1,549,642 1,761,163 1,484,681 1,331,788Female . . . . . . . . . . . . . . 21,473,076 254,630 1,069,576 1,369,040 1,410,180 1,429,443 1,510,571 1,731,951 1,541,900 1,452,176
American Indian or Alaska Native . . . . . . . . . . 2,434,908 31,497 130,397 172,598 176,829 177,333 181,686 200,776 175,046 159,155Male . . . . . . . . . . . . . . . . 1,198,371 16,120 66,667 87,893 89,486 90,275 92,130 102,495 88,388 78,920Female . . . . . . . . . . . . . . 1,236,537 15,377 63,730 84,705 87,343 87,058 89,556 98,281 86,658 80,235
Asian . . . . . . . . . . . . . . . . . 18,905,879 175,227 784,029 1,019,975 1,055,572 1,107,305 1,256,369 1,575,091 1,661,341 1,600,457Male . . . . . . . . . . . . . . . . 9,008,809 89,989 403,303 523,236 535,036 554,140 633,525 782,670 803,656 756,389Female . . . . . . . . . . . . . . 9,897,070 85,238 380,726 496,739 520,536 553,165 622,844 792,421 857,685 844,068
Native Hawaiian or Other Pacific Islander . . . . 595,908 7,621 32,464 40,058 42,183 41,462 43,020 50,839 52,049 49,305Male . . . . . . . . . . . . . . . . 299,775 3,902 16,559 20,474 21,398 21,218 22,107 26,090 26,791 25,247Female . . . . . . . . . . . . . . 296,133 3,719 15,905 19,584 20,785 20,244 20,913 24,749 25,258 24,058
Hispanic3 . . . . . . . . . . . . . . . . 60,572,237 983,479 4,110,732 5,243,825 5,323,761 5,040,048 4,844,542 4,939,078 4,586,185 4,509,927Male . . . . . . . . . . . . . . . . 30,571,037 502,394 2,095,576 2,671,297 2,716,120 2,568,290 2,485,514 2,564,663 2,413,535 2,342,227Female . . . . . . . . . . . . . . 30,001,200 481,085 2,015,156 2,572,528 2,607,641 2,471,758 2,359,028 2,374,415 2,172,650 2,167,700
Age group (years)
40–44 45–49 50–54 55–59 60–64 65–69 70–74 75–79 80–8485
and over
Total1 . . . . . . . . . . . . . . . . . . . 19,921,623 20,397,751 20,477,151 21,877,391 20,571,146 17,455,001 14,028,432 9,652,665 6,317,207 6,604,958Male . . . . . . . . . . . . . . . . . . 9,907,139 10,085,355 10,086,611 10,642,489 9,856,730 8,199,773 6,499,806 4,318,499 2,679,724 2,376,488Female . . . . . . . . . . . . . . . . 10,014,484 10,312,396 10,390,540 11,234,902 10,714,416 9,255,228 7,528,626 5,334,166 3,637,483 4,228,470
Non-Hispanic, single race2:White . . . . . . . . . . . . . . . . . 11,304,550 12,149,412 13,007,754 14,872,649 14,624,720 12,863,198 10,706,123 7,480,246 4,889,393 5,217,434
Male . . . . . . . . . . . . . . . . 5,685,238 6,085,937 6,471,645 7,311,155 7,099,619 6,143,751 5,046,753 3,407,553 2,109,701 1,898,120Female . . . . . . . . . . . . . . 5,619,312 6,063,475 6,536,109 7,561,494 7,525,101 6,719,447 5,659,370 4,072,693 2,779,692 3,319,314
Black . . . . . . . . . . . . . . . . . . 2,533,979 2,566,124 2,537,690 2,612,639 2,340,884 1,814,861 1,285,799 831,780 535,153 511,540Male . . . . . . . . . . . . . . . . 1,194,773 1,201,680 1,187,113 1,208,671 1,060,035 788,098 541,415 331,089 198,073 155,893Female . . . . . . . . . . . . . . 1,339,206 1,364,444 1,350,577 1,403,968 1,280,849 1,026,763 744,384 500,691 337,080 355,647
American Indian or Alaska Native . . . . . . . . . . 142,290 142,567 145,125 157,082 141,109 110,613 81,240 51,392 31,257 26,916Male . . . . . . . . . . . . . . . . 70,414 69,664 70,208 74,803 65,611 51,042 37,631 23,282 13,316 10,026Female . . . . . . . . . . . . . . 71,876 72,903 74,917 82,279 75,498 59,571 43,609 28,110 17,941 16,890
Asian . . . . . . . . . . . . . . . . . 1,445,094 1,411,300 1,201,079 1,117,164 1,003,002 848,563 643,700 426,489 283,340 290,782Male . . . . . . . . . . . . . . . . 672,370 658,574 558,679 512,885 450,307 372,379 282,576 188,019 122,285 108,791Female . . . . . . . . . . . . . . 772,724 752,726 642,400 604,279 552,695 476,184 361,124 238,470 161,055 181,991
Native Hawaiian or Other Pacific Islander . . . . 40,787 37,302 35,062 34,337 28,962 22,369 16,508 9,873 6,046 5,661Male . . . . . . . . . . . . . . . . 20,753 18,855 17,356 16,743 14,047 10,694 7,930 4,703 2,660 2,248Female . . . . . . . . . . . . . . 20,034 18,447 17,706 17,594 14,915 11,675 8,578 5,170 3,386 3,413
Hispanic3 . . . . . . . . . . . . . . . . 4,146,558 3,815,729 3,312,479 2,848,574 2,228,354 1,640,334 1,181,785 780,314 527,437 509,096Male . . . . . . . . . . . . . . . . 2,118,713 1,921,239 1,669,663 1,407,360 1,070,633 761,174 531,272 331,516 214,528 185,323Female . . . . . . . . . . . . . . 2,027,845 1,894,490 1,642,816 1,441,214 1,157,721 879,160 650,513 448,798 312,909 323,773
1Includes origin not stated, origin not classifiable, and two or more races reported; see Technical Notes. 2Only one race was reported. 3Includes persons of Hispanic origin of any race.
SOURCE: National Center for Health Statistics, estimates of July 1, 2019, U.S. resident population by age, sex, race and Hispanic origin prepared by U.S. Census Bureau, 2020.
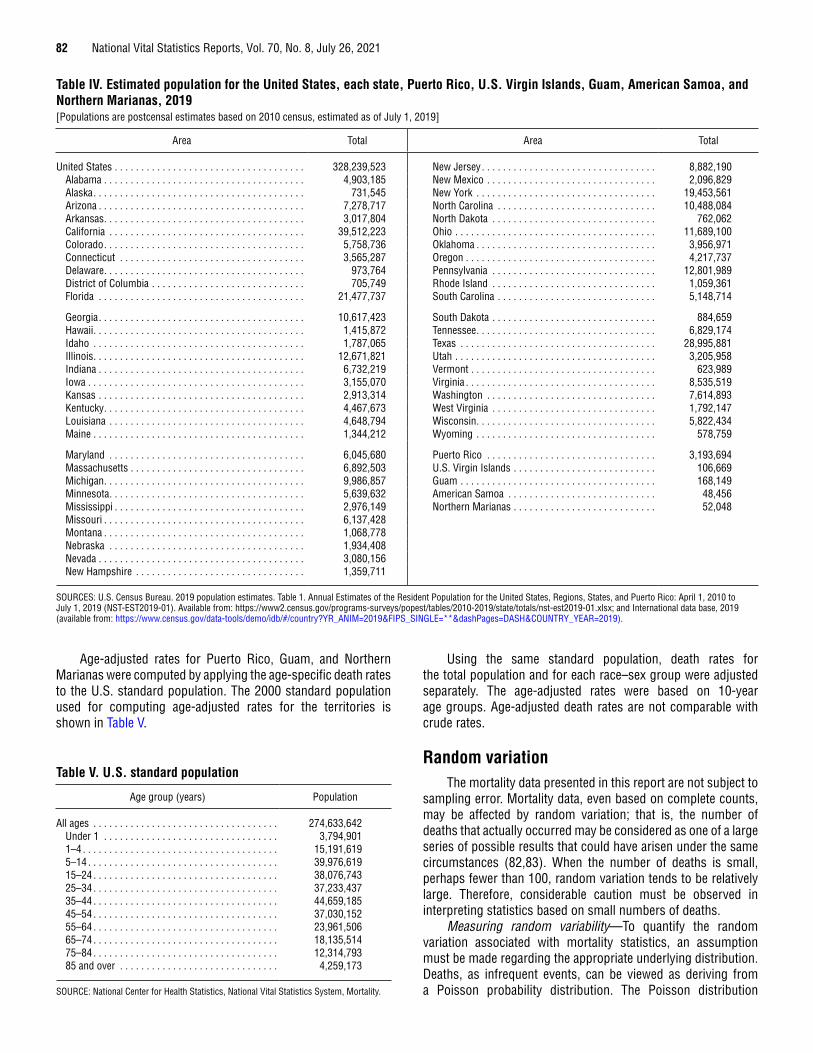
82 National Vital Statistics Reports, Vol. 70, No. 8, July 26, 2021
Age-adjusted rates for Puerto Rico, Guam, and Northern Marianas were computed by applying the age-specific death rates to the U.S. standard population. The 2000 standard population used for computing age-adjusted rates for the territories is shown in Table V.
Table V. U.S. standard population
Age group (years) Population
All ages . . . . . . . . . . . . . . . . . . . . . . . . . . . . . . . . . . . 274,633,642Under 1 . . . . . . . . . . . . . . . . . . . . . . . . . . . . . . . . . 3,794,9011–4 . . . . . . . . . . . . . . . . . . . . . . . . . . . . . . . . . . . . . 15,191,6195–14 . . . . . . . . . . . . . . . . . . . . . . . . . . . . . . . . . . . . 39,976,61915–24 . . . . . . . . . . . . . . . . . . . . . . . . . . . . . . . . . . . 38,076,74325–34 . . . . . . . . . . . . . . . . . . . . . . . . . . . . . . . . . . . 37,233,43735–44 . . . . . . . . . . . . . . . . . . . . . . . . . . . . . . . . . . . 44,659,18545–54 . . . . . . . . . . . . . . . . . . . . . . . . . . . . . . . . . . . 37,030,15255–64 . . . . . . . . . . . . . . . . . . . . . . . . . . . . . . . . . . . 23,961,50665–74 . . . . . . . . . . . . . . . . . . . . . . . . . . . . . . . . . . . 18,135,51475–84 . . . . . . . . . . . . . . . . . . . . . . . . . . . . . . . . . . . 12,314,79385 and over . . . . . . . . . . . . . . . . . . . . . . . . . . . . . . 4,259,173
SOURCE: National Center for Health Statistics, National Vital Statistics System, Mortality.
Using the same standard population, death rates for the total population and for each race–sex group were adjusted separately. The age-adjusted rates were based on 10-year age groups. Age-adjusted death rates are not comparable with crude rates.
Random variationThe mortality data presented in this report are not subject to
sampling error. Mortality data, even based on complete counts, may be affected by random variation; that is, the number of deaths that actually occurred may be considered as one of a large series of possible results that could have arisen under the same circumstances (82,83). When the number of deaths is small, perhaps fewer than 100, random variation tends to be relatively large. Therefore, considerable caution must be observed in interpreting statistics based on small numbers of deaths.
Measuring random variability—To quantify the random variation associated with mortality statistics, an assumption must be made regarding the appropriate underlying distribution. Deaths, as infrequent events, can be viewed as deriving from a Poisson probability distribution. The Poisson distribution
Table IV. Estimated population for the United States, each state, Puerto Rico, U.S. Virgin Islands, Guam, American Samoa, and Northern Marianas, 2019[Populations are postcensal estimates based on 2010 census, estimated as of July 1, 2019]
Area Total Area Total
United States . . . . . . . . . . . . . . . . . . . . . . . . . . . . . . . . . . . . 328,239,523 New Jersey . . . . . . . . . . . . . . . . . . . . . . . . . . . . . . . . . 8,882,190Alabama . . . . . . . . . . . . . . . . . . . . . . . . . . . . . . . . . . . . . . 4,903,185 New Mexico . . . . . . . . . . . . . . . . . . . . . . . . . . . . . . . . 2,096,829Alaska . . . . . . . . . . . . . . . . . . . . . . . . . . . . . . . . . . . . . . . . 731,545 New York . . . . . . . . . . . . . . . . . . . . . . . . . . . . . . . . . . 19,453,561Arizona . . . . . . . . . . . . . . . . . . . . . . . . . . . . . . . . . . . . . . . 7,278,717 North Carolina . . . . . . . . . . . . . . . . . . . . . . . . . . . . . . 10,488,084Arkansas . . . . . . . . . . . . . . . . . . . . . . . . . . . . . . . . . . . . . . 3,017,804 North Dakota . . . . . . . . . . . . . . . . . . . . . . . . . . . . . . . 762,062California . . . . . . . . . . . . . . . . . . . . . . . . . . . . . . . . . . . . . 39,512,223 Ohio . . . . . . . . . . . . . . . . . . . . . . . . . . . . . . . . . . . . . . 11,689,100Colorado . . . . . . . . . . . . . . . . . . . . . . . . . . . . . . . . . . . . . . 5,758,736 Oklahoma . . . . . . . . . . . . . . . . . . . . . . . . . . . . . . . . . . 3,956,971Connecticut . . . . . . . . . . . . . . . . . . . . . . . . . . . . . . . . . . . 3,565,287 Oregon . . . . . . . . . . . . . . . . . . . . . . . . . . . . . . . . . . . . 4,217,737Delaware . . . . . . . . . . . . . . . . . . . . . . . . . . . . . . . . . . . . . . 973,764 Pennsylvania . . . . . . . . . . . . . . . . . . . . . . . . . . . . . . . 12,801,989District of Columbia . . . . . . . . . . . . . . . . . . . . . . . . . . . . . 705,749 Rhode Island . . . . . . . . . . . . . . . . . . . . . . . . . . . . . . . 1,059,361Florida . . . . . . . . . . . . . . . . . . . . . . . . . . . . . . . . . . . . . . . 21,477,737 South Carolina . . . . . . . . . . . . . . . . . . . . . . . . . . . . . . 5,148,714
Georgia . . . . . . . . . . . . . . . . . . . . . . . . . . . . . . . . . . . . . . . 10,617,423 South Dakota . . . . . . . . . . . . . . . . . . . . . . . . . . . . . . . 884,659Hawaii . . . . . . . . . . . . . . . . . . . . . . . . . . . . . . . . . . . . . . . . 1,415,872 Tennessee . . . . . . . . . . . . . . . . . . . . . . . . . . . . . . . . . . 6,829,174Idaho . . . . . . . . . . . . . . . . . . . . . . . . . . . . . . . . . . . . . . . . 1,787,065 Texas . . . . . . . . . . . . . . . . . . . . . . . . . . . . . . . . . . . . . 28,995,881Illinois . . . . . . . . . . . . . . . . . . . . . . . . . . . . . . . . . . . . . . . . 12,671,821 Utah . . . . . . . . . . . . . . . . . . . . . . . . . . . . . . . . . . . . . . 3,205,958Indiana . . . . . . . . . . . . . . . . . . . . . . . . . . . . . . . . . . . . . . . 6,732,219 Vermont . . . . . . . . . . . . . . . . . . . . . . . . . . . . . . . . . . . 623,989Iowa . . . . . . . . . . . . . . . . . . . . . . . . . . . . . . . . . . . . . . . . . 3,155,070 Virginia . . . . . . . . . . . . . . . . . . . . . . . . . . . . . . . . . . . . 8,535,519Kansas . . . . . . . . . . . . . . . . . . . . . . . . . . . . . . . . . . . . . . . 2,913,314 Washington . . . . . . . . . . . . . . . . . . . . . . . . . . . . . . . . 7,614,893Kentucky . . . . . . . . . . . . . . . . . . . . . . . . . . . . . . . . . . . . . . 4,467,673 West Virginia . . . . . . . . . . . . . . . . . . . . . . . . . . . . . . . 1,792,147Louisiana . . . . . . . . . . . . . . . . . . . . . . . . . . . . . . . . . . . . . 4,648,794 Wisconsin . . . . . . . . . . . . . . . . . . . . . . . . . . . . . . . . . . 5,822,434Maine . . . . . . . . . . . . . . . . . . . . . . . . . . . . . . . . . . . . . . . . 1,344,212 Wyoming . . . . . . . . . . . . . . . . . . . . . . . . . . . . . . . . . . 578,759
Maryland . . . . . . . . . . . . . . . . . . . . . . . . . . . . . . . . . . . . . 6,045,680 Puerto Rico . . . . . . . . . . . . . . . . . . . . . . . . . . . . . . . . 3,193,694Massachusetts . . . . . . . . . . . . . . . . . . . . . . . . . . . . . . . . . 6,892,503 U.S. Virgin Islands . . . . . . . . . . . . . . . . . . . . . . . . . . . 106,669Michigan . . . . . . . . . . . . . . . . . . . . . . . . . . . . . . . . . . . . . . 9,986,857 Guam . . . . . . . . . . . . . . . . . . . . . . . . . . . . . . . . . . . . . 168,149Minnesota . . . . . . . . . . . . . . . . . . . . . . . . . . . . . . . . . . . . . 5,639,632 American Samoa . . . . . . . . . . . . . . . . . . . . . . . . . . . . 48,456Mississippi . . . . . . . . . . . . . . . . . . . . . . . . . . . . . . . . . . . . 2,976,149 Northern Marianas . . . . . . . . . . . . . . . . . . . . . . . . . . . 52,048Missouri . . . . . . . . . . . . . . . . . . . . . . . . . . . . . . . . . . . . . . 6,137,428Montana . . . . . . . . . . . . . . . . . . . . . . . . . . . . . . . . . . . . . . 1,068,778Nebraska . . . . . . . . . . . . . . . . . . . . . . . . . . . . . . . . . . . . . 1,934,408Nevada . . . . . . . . . . . . . . . . . . . . . . . . . . . . . . . . . . . . . . . 3,080,156New Hampshire . . . . . . . . . . . . . . . . . . . . . . . . . . . . . . . . 1,359,711
SOURCES: U.S. Census Bureau. 2019 population estimates. Table 1. Annual Estimates of the Resident Population for the United States, Regions, States, and Puerto Rico: April 1, 2010 to July 1, 2019 (NST-EST2019-01). Available from: https://www2.census.gov/programs-surveys/popest/tables/2010-2019/state/totals/nst-est2019-01.xlsx; and International data base, 2019 (available from: https://www.census.gov/data-tools/demo/idb/#/country?YR_ANIM=2019&FIPS_SINGLE=**&dashPages=DASH&COUNTRY_YEAR=2019).
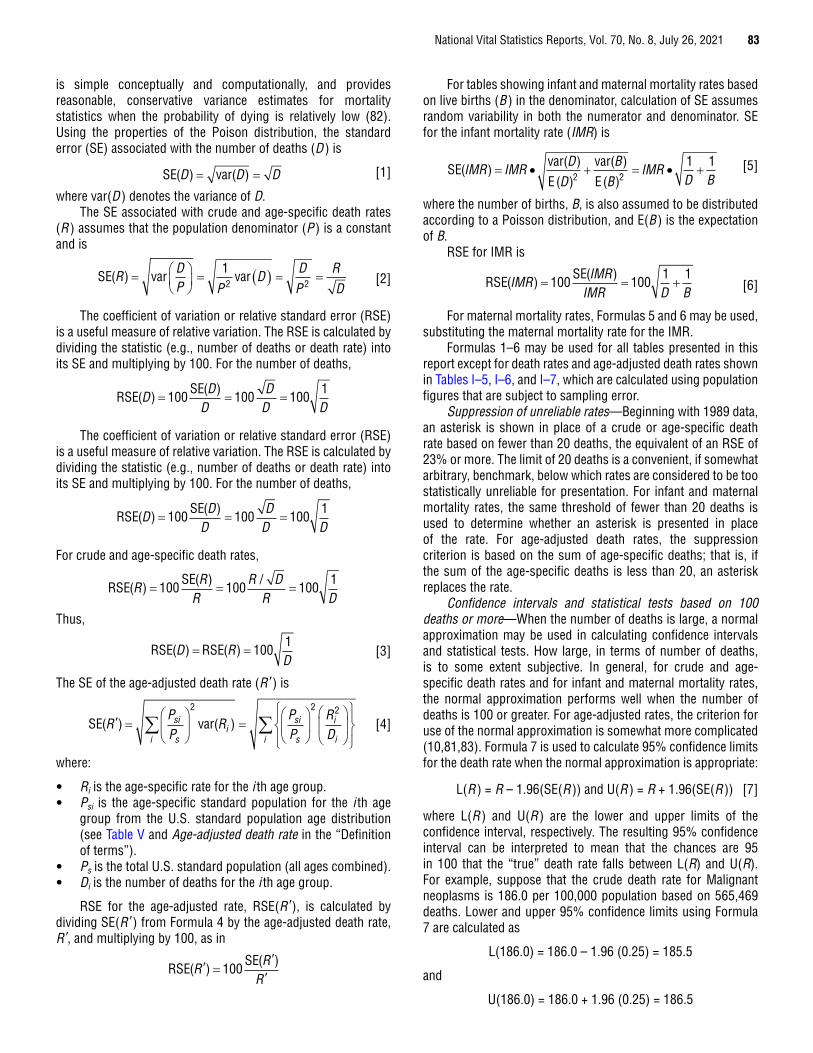
National Vital Statistics Reports, Vol. 70, No. 8, July 26, 2021 83
is simple conceptually and computationally, and provides reasonable, conservative variance estimates for mortality statistics when the probability of dying is relatively low (82). Using the properties of the Poison distribution, the standard error (SE) associated with the number of deaths (D ) is
SE( ) var( )D D D [1]
where var(D ) denotes the variance of D.The SE associated with crude and age-specific death rates
(R ) assumes that the population denominator (P ) is a constant and is
SE( ) var varR DP P
D DP
RD
12 2 [2]
The coefficient of variation or relative standard error (RSE) is a useful measure of relative variation. The RSE is calculated by dividing the statistic (e.g., number of deaths or death rate) into its SE and multiplying by 100. For the number of deaths,
The coefficient of variation or relative standard error (RSE) is a useful measure of relative variation. The RSE is calculated by dividing the statistic (e.g., number of deaths or death rate) into its SE and multiplying by 100. For the number of deaths,
For crude and age-specific death rates,
RSESE
( )( ) /R RR
R DR D
100 100 1001
Thus,
RSE RSE( ) ( )D RD
1001
[3]
The SE of the age-adjusted death rate (R ' ) is
SE( ) var( )RPP
RPP
RD
si
sii
si
s
i
i
2 2 2
i[4]
where:
• Ri is the age-specific rate for the i th age group.• Psi is the age-specific standard population for the i th age
group from the U.S. standard population age distribution(see Table V and Age-adjusted death rate in the “Definitionof terms”).
• Ps is the total U.S. standard population (all ages combined).• Di is the number of deaths for the i th age group.
RSE for the age-adjusted rate, RSE(R ' ), is calculated bydividing SE(R ' ) from Formula 4 by the age-adjusted death rate, R ', and multiplying by 100, as in
RSESE
( )( )R RR
100
RSESE
( )( )D DD
DD D
100 100 1001
RSESE
( )( )D DD
DD D
100 100 1001
For tables showing infant and maternal mortality rates based on live births (B ) in the denominator, calculation of SE assumes random variability in both the numerator and denominator. SE for the infant mortality rate (IMR) is
SE( )var( )( )
var( )( )
IMR IMR DE D
BE B
IMRD B2 2
1 1 [5]
where the number of births, B, is also assumed to be distributed according to a Poisson distribution, and E(B ) is the expectation of B.
RSE for IMR is
RSESE
( )( )IMR IMRIMR D B
100 1001 1
[6]
For maternal mortality rates, Formulas 5 and 6 may be used, substituting the maternal mortality rate for the IMR.
Formulas 1–6 may be used for all tables presented in this report except for death rates and age-adjusted death rates shown in Tables I–5, I–6, and I–7, which are calculated using population figures that are subject to sampling error.
Suppression of unreliable rates—Beginning with 1989 data, an asterisk is shown in place of a crude or age-specific death rate based on fewer than 20 deaths, the equivalent of an RSE of 23% or more. The limit of 20 deaths is a convenient, if somewhat arbitrary, benchmark, below which rates are considered to be too statistically unreliable for presentation. For infant and maternal mortality rates, the same threshold of fewer than 20 deaths is used to determine whether an asterisk is presented in place of the rate. For age-adjusted death rates, the suppression criterion is based on the sum of age-specific deaths; that is, if the sum of the age-specific deaths is less than 20, an asterisk replaces the rate.
Confidence intervals and statistical tests based on 100 deaths or more—When the number of deaths is large, a normal approximation may be used in calculating confidence intervals and statistical tests. How large, in terms of number of deaths, is to some extent subjective. In general, for crude and age-specific death rates and for infant and maternal mortality rates, the normal approximation performs well when the number of deaths is 100 or greater. For age-adjusted rates, the criterion for use of the normal approximation is somewhat more complicated (10,81,83). Formula 7 is used to calculate 95% confidence limits for the death rate when the normal approximation is appropriate:
L(R ) = R – 1.96(SE(R )) and U(R ) = R + 1.96(SE(R )) [7]
where L(R ) and U(R ) are the lower and upper limits of the confidence interval, respectively. The resulting 95% confidence interval can be interpreted to mean that the chances are 95 in 100 that the “true” death rate falls between L(R) and U(R). For example, suppose that the crude death rate for Malignant neoplasms is 186.0 per 100,000 population based on 565,469 deaths. Lower and upper 95% confidence limits using Formula 7 are calculated as
L(186.0) = 186.0 – 1.96 (0.25) = 185.5
and
U(186.0) = 186.0 + 1.96 (0.25) = 186.5
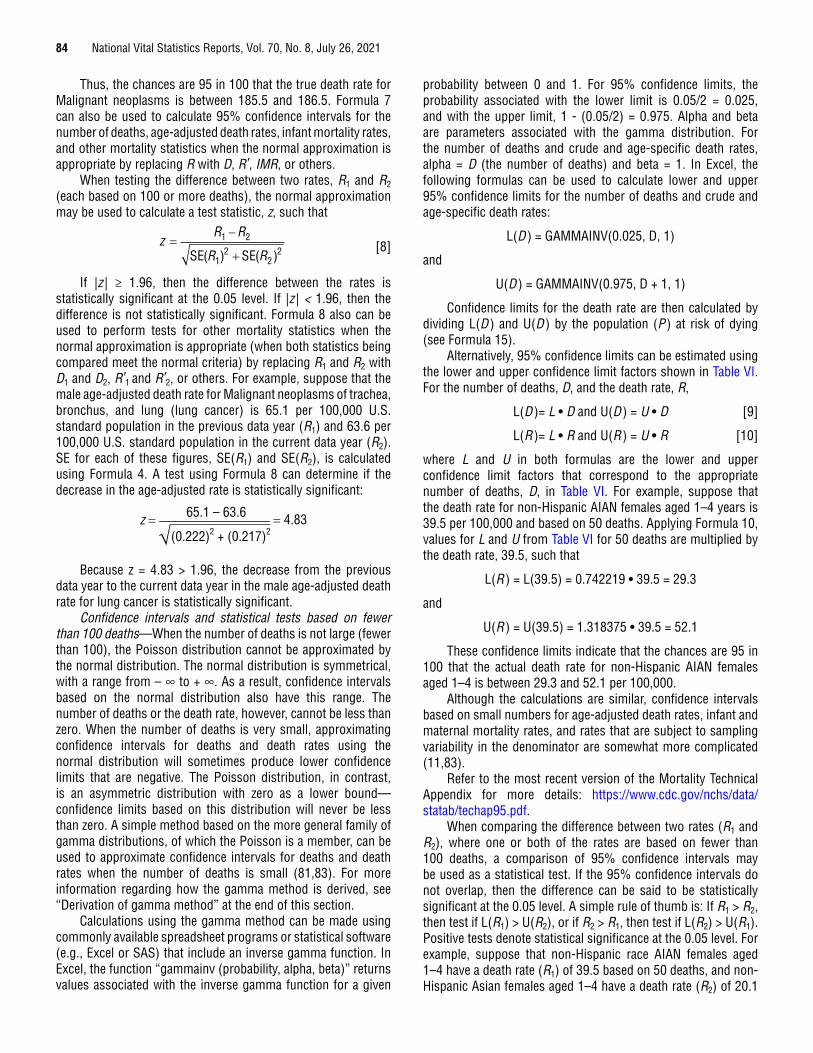
84 National Vital Statistics Reports, Vol. 70, No. 8, July 26, 2021
Thus, the chances are 95 in 100 that the true death rate for Malignant neoplasms is between 185.5 and 186.5. Formula 7 can also be used to calculate 95% confidence intervals for the number of deaths, age-adjusted death rates, infant mortality rates, and other mortality statistics when the normal approximation is appropriate by replacing R with D, R', IMR, or others.
When testing the difference between two rates, R1 and R2
(each based on 100 or more deaths), the normal approximation may be used to calculate a test statistic, z, such that
zR R
R R1 2
12
22SE SE( ) ( )
[8]
If |z | ≥ 1.96, then the difference between the rates is statistically significant at the 0.05 level. If |z | < 1.96, then the difference is not statistically significant. Formula 8 also can be used to perform tests for other mortality statistics when the normal approximation is appropriate (when both statistics being compared meet the normal criteria) by replacing R1 and R2 with D1 and D2, R'1 and R'2, or others. For example, suppose that the male age-adjusted death rate for Malignant neoplasms of trachea, bronchus, and lung (lung cancer) is 65.1 per 100,000 U.S. standard population in the previous data year (R1) and 63.6 per 100,000 U.S. standard population in the current data year (R2). SE for each of these figures, SE(R1) and SE(R2), is calculated using Formula 4. A test using Formula 8 can determine if the decrease in the age-adjusted rate is statistically significant:
(0.222)2 + (0.217)2
65.1 – 63.6 4.83z
Because z = 4.83 > 1.96, the decrease from the previous data year to the current data year in the male age-adjusted death rate for lung cancer is statistically significant.
Confidence intervals and statistical tests based on fewer than 100 deaths—When the number of deaths is not large (fewer than 100), the Poisson distribution cannot be approximated by the normal distribution. The normal distribution is symmetrical, with a range from – ∞ to + ∞. As a result, confidence intervals based on the normal distribution also have this range. The number of deaths or the death rate, however, cannot be less than zero. When the number of deaths is very small, approximating confidence intervals for deaths and death rates using the normal distribution will sometimes produce lower confidence limits that are negative. The Poisson distribution, in contrast, is an asymmetric distribution with zero as a lower bound—confidence limits based on this distribution will never be less than zero. A simple method based on the more general family of gamma distributions, of which the Poisson is a member, can be used to approximate confidence intervals for deaths and death rates when the number of deaths is small (81,83). For more information regarding how the gamma method is derived, see “Derivation of gamma method” at the end of this section.
Calculations using the gamma method can be made using commonly available spreadsheet programs or statistical software (e.g., Excel or SAS) that include an inverse gamma function. In Excel, the function “gammainv (probability, alpha, beta)” returns values associated with the inverse gamma function for a given
probability between 0 and 1. For 95% confidence limits, the probability associated with the lower limit is 0.05/2 = 0.025, and with the upper limit, 1 - (0.05/2) = 0.975. Alpha and beta are parameters associated with the gamma distribution. For the number of deaths and crude and age-specific death rates, alpha = D (the number of deaths) and beta = 1. In Excel, the following formulas can be used to calculate lower and upper 95% confidence limits for the number of deaths and crude and age-specific death rates:
L(D ) = GAMMAINV(0.025, D, 1)
and
U(D ) = GAMMAINV(0.975, D + 1, 1)
Confidence limits for the death rate are then calculated by dividing L(D ) and U(D ) by the population (P ) at risk of dying (see Formula 15).
Alternatively, 95% confidence limits can be estimated using the lower and upper confidence limit factors shown in Table VI. For the number of deaths, D, and the death rate, R,
L(D )= L • D and U(D ) = U • D [9]
L(R )= L • R and U(R ) = U • R [10]
where L and U in both formulas are the lower and upper confidence limit factors that correspond to the appropriate number of deaths, D, in Table VI. For example, suppose that the death rate for non-Hispanic AIAN females aged 1–4 years is 39.5 per 100,000 and based on 50 deaths. Applying Formula 10, values for L and U from Table VI for 50 deaths are multiplied by the death rate, 39.5, such that
L(R ) = L(39.5) = 0.742219 • 39.5 = 29.3
and
U(R ) = U(39.5) = 1.318375 • 39.5 = 52.1
These confidence limits indicate that the chances are 95 in 100 that the actual death rate for non-Hispanic AIAN females aged 1–4 is between 29.3 and 52.1 per 100,000.
Although the calculations are similar, confidence intervals based on small numbers for age-adjusted death rates, infant and maternal mortality rates, and rates that are subject to sampling variability in the denominator are somewhat more complicated (11,83).
Refer to the most recent version of the Mortality Technical Appendix for more details: https://www.cdc.gov/nchs/data/statab/techap95.pdf.
When comparing the difference between two rates (R1 and R2), where one or both of the rates are based on fewer than 100 deaths, a comparison of 95% confidence intervals may be used as a statistical test. If the 95% confidence intervals do not overlap, then the difference can be said to be statistically significant at the 0.05 level. A simple rule of thumb is: If R1 > R2, then test if L(R1) > U(R2), or if R2 > R1, then test if L(R2) > U(R1). Positive tests denote statistical significance at the 0.05 level. For example, suppose that non-Hispanic race AIAN females aged 1–4 have a death rate (R1) of 39.5 based on 50 deaths, and non- Hispanic Asian females aged 1–4 have a death rate (R2) of 20.1
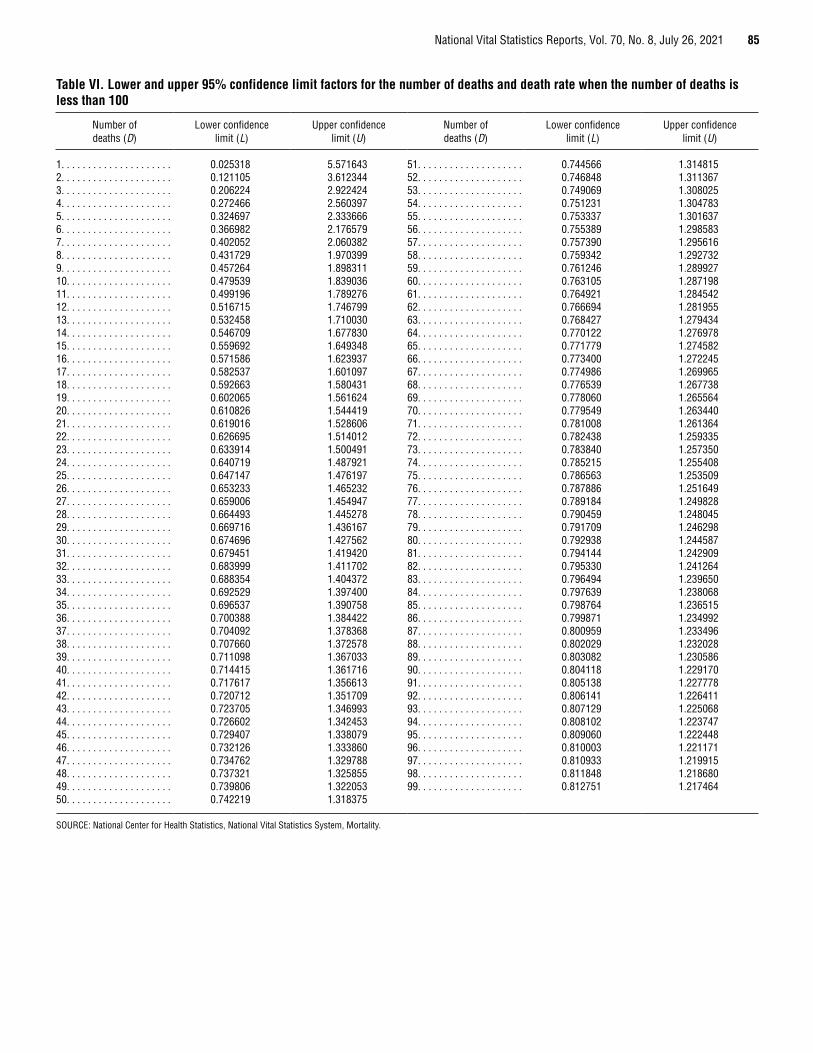
National Vital Statistics Reports, Vol. 70, No. 8, July 26, 2021 85
Table VI. Lower and upper 95% confidence limit factors for the number of deaths and death rate when the number of deaths is less than 100
Number of deaths (D)
Lower confidence limit (L)
Upper confidence limit (U)
Number of deaths (D)
Lower confidence limit (L)
Upper confidence limit (U)
1. . . . . . . . . . . . . . . . . . . . . 0.025318 5.571643 51. . . . . . . . . . . . . . . . . . . . 0.744566 1.3148152. . . . . . . . . . . . . . . . . . . . . 0.121105 3.612344 52. . . . . . . . . . . . . . . . . . . . 0.746848 1.3113673. . . . . . . . . . . . . . . . . . . . . 0.206224 2.922424 53. . . . . . . . . . . . . . . . . . . . 0.749069 1.3080254. . . . . . . . . . . . . . . . . . . . . 0.272466 2.560397 54. . . . . . . . . . . . . . . . . . . . 0.751231 1.3047835. . . . . . . . . . . . . . . . . . . . . 0.324697 2.333666 55. . . . . . . . . . . . . . . . . . . . 0.753337 1.3016376. . . . . . . . . . . . . . . . . . . . . 0.366982 2.176579 56. . . . . . . . . . . . . . . . . . . . 0.755389 1.2985837. . . . . . . . . . . . . . . . . . . . . 0.402052 2.060382 57. . . . . . . . . . . . . . . . . . . . 0.757390 1.2956168. . . . . . . . . . . . . . . . . . . . . 0.431729 1.970399 58. . . . . . . . . . . . . . . . . . . . 0.759342 1.2927329. . . . . . . . . . . . . . . . . . . . . 0.457264 1.898311 59. . . . . . . . . . . . . . . . . . . . 0.761246 1.28992710. . . . . . . . . . . . . . . . . . . . 0.479539 1.839036 60. . . . . . . . . . . . . . . . . . . . 0.763105 1.28719811. . . . . . . . . . . . . . . . . . . . 0.499196 1.789276 61. . . . . . . . . . . . . . . . . . . . 0.764921 1.28454212. . . . . . . . . . . . . . . . . . . . 0.516715 1.746799 62. . . . . . . . . . . . . . . . . . . . 0.766694 1.28195513. . . . . . . . . . . . . . . . . . . . 0.532458 1.710030 63. . . . . . . . . . . . . . . . . . . . 0.768427 1.27943414. . . . . . . . . . . . . . . . . . . . 0.546709 1.677830 64. . . . . . . . . . . . . . . . . . . . 0.770122 1.27697815. . . . . . . . . . . . . . . . . . . . 0.559692 1.649348 65. . . . . . . . . . . . . . . . . . . . 0.771779 1.27458216. . . . . . . . . . . . . . . . . . . . 0.571586 1.623937 66. . . . . . . . . . . . . . . . . . . . 0.773400 1.27224517. . . . . . . . . . . . . . . . . . . . 0.582537 1.601097 67. . . . . . . . . . . . . . . . . . . . 0.774986 1.26996518. . . . . . . . . . . . . . . . . . . . 0.592663 1.580431 68. . . . . . . . . . . . . . . . . . . . 0.776539 1.26773819. . . . . . . . . . . . . . . . . . . . 0.602065 1.561624 69. . . . . . . . . . . . . . . . . . . . 0.778060 1.26556420. . . . . . . . . . . . . . . . . . . . 0.610826 1.544419 70. . . . . . . . . . . . . . . . . . . . 0.779549 1.26344021. . . . . . . . . . . . . . . . . . . . 0.619016 1.528606 71. . . . . . . . . . . . . . . . . . . . 0.781008 1.26136422. . . . . . . . . . . . . . . . . . . . 0.626695 1.514012 72. . . . . . . . . . . . . . . . . . . . 0.782438 1.25933523. . . . . . . . . . . . . . . . . . . . 0.633914 1.500491 73. . . . . . . . . . . . . . . . . . . . 0.783840 1.25735024. . . . . . . . . . . . . . . . . . . . 0.640719 1.487921 74. . . . . . . . . . . . . . . . . . . . 0.785215 1.25540825. . . . . . . . . . . . . . . . . . . . 0.647147 1.476197 75. . . . . . . . . . . . . . . . . . . . 0.786563 1.25350926. . . . . . . . . . . . . . . . . . . . 0.653233 1.465232 76. . . . . . . . . . . . . . . . . . . . 0.787886 1.25164927. . . . . . . . . . . . . . . . . . . . 0.659006 1.454947 77. . . . . . . . . . . . . . . . . . . . 0.789184 1.24982828. . . . . . . . . . . . . . . . . . . . 0.664493 1.445278 78. . . . . . . . . . . . . . . . . . . . 0.790459 1.24804529. . . . . . . . . . . . . . . . . . . . 0.669716 1.436167 79. . . . . . . . . . . . . . . . . . . . 0.791709 1.24629830. . . . . . . . . . . . . . . . . . . . 0.674696 1.427562 80. . . . . . . . . . . . . . . . . . . . 0.792938 1.24458731. . . . . . . . . . . . . . . . . . . . 0.679451 1.419420 81. . . . . . . . . . . . . . . . . . . . 0.794144 1.24290932. . . . . . . . . . . . . . . . . . . . 0.683999 1.411702 82. . . . . . . . . . . . . . . . . . . . 0.795330 1.24126433. . . . . . . . . . . . . . . . . . . . 0.688354 1.404372 83. . . . . . . . . . . . . . . . . . . . 0.796494 1.23965034. . . . . . . . . . . . . . . . . . . . 0.692529 1.397400 84. . . . . . . . . . . . . . . . . . . . 0.797639 1.23806835. . . . . . . . . . . . . . . . . . . . 0.696537 1.390758 85. . . . . . . . . . . . . . . . . . . . 0.798764 1.23651536. . . . . . . . . . . . . . . . . . . . 0.700388 1.384422 86. . . . . . . . . . . . . . . . . . . . 0.799871 1.23499237. . . . . . . . . . . . . . . . . . . . 0.704092 1.378368 87. . . . . . . . . . . . . . . . . . . . 0.800959 1.23349638. . . . . . . . . . . . . . . . . . . . 0.707660 1.372578 88. . . . . . . . . . . . . . . . . . . . 0.802029 1.23202839. . . . . . . . . . . . . . . . . . . . 0.711098 1.367033 89. . . . . . . . . . . . . . . . . . . . 0.803082 1.23058640. . . . . . . . . . . . . . . . . . . . 0.714415 1.361716 90. . . . . . . . . . . . . . . . . . . . 0.804118 1.22917041. . . . . . . . . . . . . . . . . . . . 0.717617 1.356613 91. . . . . . . . . . . . . . . . . . . . 0.805138 1.22777842. . . . . . . . . . . . . . . . . . . . 0.720712 1.351709 92. . . . . . . . . . . . . . . . . . . . 0.806141 1.22641143. . . . . . . . . . . . . . . . . . . . 0.723705 1.346993 93. . . . . . . . . . . . . . . . . . . . 0.807129 1.22506844. . . . . . . . . . . . . . . . . . . . 0.726602 1.342453 94. . . . . . . . . . . . . . . . . . . . 0.808102 1.22374745. . . . . . . . . . . . . . . . . . . . 0.729407 1.338079 95. . . . . . . . . . . . . . . . . . . . 0.809060 1.22244846. . . . . . . . . . . . . . . . . . . . 0.732126 1.333860 96. . . . . . . . . . . . . . . . . . . . 0.810003 1.22117147. . . . . . . . . . . . . . . . . . . . 0.734762 1.329788 97. . . . . . . . . . . . . . . . . . . . 0.810933 1.21991548. . . . . . . . . . . . . . . . . . . . 0.737321 1.325855 98. . . . . . . . . . . . . . . . . . . . 0.811848 1.21868049. . . . . . . . . . . . . . . . . . . . 0.739806 1.322053 99. . . . . . . . . . . . . . . . . . . . 0.812751 1.21746450. . . . . . . . . . . . . . . . . . . . 0.742219 1.318375
SOURCE: National Center for Health Statistics, National Vital Statistics System, Mortality.
86 National Vital Statistics Reports, Vol. 70, No. 8, July 26, 2021
per 100,000 based on 86 deaths. The 95% confidence limits for R1 and R2 calculated using Formula 10 would be
L(R1) = L(39.5) = 0.742219 • 39.5 = 29.3
and
U(R1) = U(39.5) = 1.318375 • 39.5 = 52.1
L(R2) = L(20.1) = 0.799871 • 17.9 = 16.1
and
U(R2) = U(20.1) = 1.234992 • 17.9 = 24.8
Because R1 > R2 and L(R1) > U(R2), it can be concluded that the difference between the death rates for non-Hispanic AIAN females aged 1–4 and non-Hispanic Asian females of the same age is statistically significant at the 0.05 level. That is, accounting for random variability, non-Hispanic Asian females aged 1–4 have a death rate significantly lower than that for non-Hispanic AIAN females of the same age.
This test also may be used to perform tests for other statistics when the normal approximation is not appropriate for one or both of the statistics being compared, by replacing R1 and R2 with D1 and D2, R'1 and R'2, or others.
Users of the method of comparing confidence intervals should be aware that this method is a conservative test for statistical significance—the difference between two rates may, in fact, be statistically significant even though confidence intervals for the two rates overlap (84). Caution should be observed when interpreting a nonsignificant difference between two rates, especially when the lower and upper limits being compared overlap only slightly.
Derivation of gamma method—For a random variable X that follows a gamma distribution G(y,z ), where y and z are the parameters that determine the shape of the distribution (85), E(X ) = yz and Var(X ) = yz 2. For the number of deaths, D, E(D ) = D and Var(D ) = D. It follows that y = D and z = 1, and thus,
D ~ G(D,1) [11]
From Equation 11, it is clear that the shape of the distribution of deaths depends only on the number of deaths.
For the death rate, R, E(R ) = R and Var(R ) = D/P 2. It follows, in this case, that y = D and z = P –1, and thus,
R ~ G(D,P –1) [12]
A useful property of the gamma distribution is that for X ~ Γ(y,z ), X can be divided by z such that X/z ~ Γ(y,1). This converts the gamma distribution into a simplified, standard form, dependent only on parameter y. Expressing Equation 12 in its simplified form gives
R/P –1 = D ~ Γ(D,1) [13]
From Equation 13, it is clear that the shape of the distribution of the death rate also is dependent solely on the number of deaths.
Using the results of Equations 11 and 13, the inverse gamma distribution can be used to calculate upper and lower confidence
limits. Lower and upper 100(1 – a) percent confidence limits for the number of deaths, L(D ) and U(D ), are estimated as
L(D) = Γ–1(D,1)(a / 2) and U(D) = Γ–1
(D +1,1)(1 – a /2) [14]
where G–1 represents the inverse of the gamma distribution and D + 1 in the formula for U(D) reflects a continuity correction, which is necessary because D is a discrete random variable and the gamma distribution is a continuous distribution. For a 95% confidence interval, a = 0.05. For the death rate, it can be shown that
L(R ) = L(D )/P and U(R ) = U(D )/P [15]
For more detail regarding the derivation of the gamma method and its application to age-adjusted death rates and other mortality statistics, see References (10,82,84).
Availability of mortality dataMortality data are available in publications, unpublished
tables, and electronic products as described on the NCHS mortality website at: https://www.cdc.gov/nchs/deaths.htm. More detailed analysis than this report provides can be obtained from the mortality public-use data set issued each data year. Since 1968, the data set has been available through NCHS in ASCII format and can now be downloaded: https://www.cdc.gov/nchs/data_access/Vitalstatsonline.htm. Additional resources available from NCHS include Vital Statistics of the United States, Mortality; Vital and Health Statistics, Series 20 reports; and National Vital Statistics Reports.
Definition of termsAge-adjusted death rate—The death rate used to make
comparisons of relative mortality risks across groups and over time. This rate should be viewed as a construct or an index rather than a direct or actual measure of mortality risk. Statistically, it is a weighted average of age-specific death rates, where the weights represent the fixed population proportions by age.
Age-specific death rate—Deaths per 100,000 population in a specified age group, such as 1–4 or 5–9 years, for a specified period.
Crude death rate—Total deaths per 100,000 population for a specified period. This rate represents the average chance of dying during a specified period for persons in the entire population.
Infant deaths—Deaths of infants under age 1 year.Neonatal deaths—Deaths of infants aged 0–27 days.Postneonatal deaths—Deaths of infants aged 28 days–11
months.
U.S. DEPARTMENT OF HEALTH & HUMAN SERVICES
Centers for Disease Control and Prevention National Center for Health Statistics 3311 Toledo Road, Room 4551 Hyattsville, MD 20782–2064
OFFICIAL BUSINESS PENALTY FOR PRIVATE USE, $300
National Vital Statistics Reports, Vol. 70, No. 8, July 26, 2021
For more NCHS NVSRs, visit: https://www.cdc.gov/nchs/products/nvsr.htm.
For e-mail updates on NCHS publication releases, subscribe online at: https://www.cdc.gov/nchs/email-updates.htm. For questions or general information about NCHS: Tel: 1–800–CDC–INFO (1–800–232–4636) • TTY: 1–888–232–6348
Internet: https://www.cdc.gov/nchs • Online request form: https://www.cdc.gov/info • CS324415
FIRST CLASS MAIL POSTAGE & FEES PAID
CDC/NCHS PERMIT NO. G-284
Suggested citation
Xu JQ, Murphy SL, Kochanek KD, and Arias E. Deaths: Final data for 2019. National Vital Statistics Reports; vol 70 no 08. Hyattsville, MD: National Center for Health Statistics. 2021. DOI: https://dx.doi.org/10.15620/cdc:106058.
Copyright information
All material appearing in this report is in the public domain and may be reproduced or copied without permission; citation as to source, however, is appreciated.
National Center for Health Statistics
Brian C. Moyer, Ph.D., Director Amy M. Branum, Ph.D., Associate Director for
Science
Division of Vital Statistics
Steven Schwartz, Ph.D., Director Isabelle Horon, Dr.P.H., Acting Associate
Director for Science
ContentsAbstract . . . . . . . . . . . . . . . . . . . . . . . . . . . . . . . . . . . . . . . . . . . . . . . . . . . . . . . 1Highlights . . . . . . . . . . . . . . . . . . . . . . . . . . . . . . . . . . . . . . . . . . . . . . . . . . . . . . 1
Mortality experience in 2019 . . . . . . . . . . . . . . . . . . . . . . . . . . . . . . . . . . . . . 1Comparison to previous year . . . . . . . . . . . . . . . . . . . . . . . . . . . . . . . . . . . . . 2
Introduction . . . . . . . . . . . . . . . . . . . . . . . . . . . . . . . . . . . . . . . . . . . . . . . . . . . . 2Methods . . . . . . . . . . . . . . . . . . . . . . . . . . . . . . . . . . . . . . . . . . . . . . . . . . . . . . . 3Results and Discussion . . . . . . . . . . . . . . . . . . . . . . . . . . . . . . . . . . . . . . . . . . . 4
Deaths and death rates . . . . . . . . . . . . . . . . . . . . . . . . . . . . . . . . . . . . . . . . . . 4Expectation of life at birth and at specified ages . . . . . . . . . . . . . . . . . . . . . . . 8Leading causes of death . . . . . . . . . . . . . . . . . . . . . . . . . . . . . . . . . . . . . . . . . 9Other select causes . . . . . . . . . . . . . . . . . . . . . . . . . . . . . . . . . . . . . . . . . . . 12Effect on life expectancy of changes in mortality by age and cause of death . . . . . . . . . . . . . . . . . . . . . . . . . . . . . . . . . . . . . . . . . . . . . . 13
Injury mortality by mechanism and intent . . . . . . . . . . . . . . . . . . . . . . . . . . 14State of residence . . . . . . . . . . . . . . . . . . . . . . . . . . . . . . . . . . . . . . . . . . . . . 15Infant mortality . . . . . . . . . . . . . . . . . . . . . . . . . . . . . . . . . . . . . . . . . . . . . . . 15Maternal mortality . . . . . . . . . . . . . . . . . . . . . . . . . . . . . . . . . . . . . . . . . . . . 16Additional mortality tables based on 2019 final data . . . . . . . . . . . . . . . . . . 16
References . . . . . . . . . . . . . . . . . . . . . . . . . . . . . . . . . . . . . . . . . . . . . . . . . . . . 17List of Detailed Tables . . . . . . . . . . . . . . . . . . . . . . . . . . . . . . . . . . . . . . . . . . . 21List of Internet Tables. . . . . . . . . . . . . . . . . . . . . . . . . . . . . . . . . . . . . . . . . . . . 21 Technical Notes . . . . . . . . . . . . . . . . . . . . . . . . . . . . . . . . . . . . . . . . . . . . . . . . 72
AcknowledgmentsThis report was prepared in the Division of Vital Statistics (DVS) under the
direction of Steven Schwartz, Director, DVS; Isabelle Horon, Acting Associate Director for Science, DVS; Robert N. Anderson, Chief, Mortality Statistics Branch (MSB); and Elizabeth Arias, Team Leader, Statistical Analysis and Research Team (MSB). Brigham Bastian and Sally Curtin (MSB) provided content review. Donna L. Hoyert (MSB) and David W. Justice, Adrienne Rouse, and Matthew Rowe of the Data Acquisition, Classification and Evaluation Branch (DACEB) contributed to Technical Notes. Rajesh Virkar, Chief, Information Technology Branch (ITB), and Joseph Bohn and Veronique Benie (ITB) provided computer programming support. Veronique Benie also prepared the mortality file.
Registration Methods staff and DACEB staff provided consultation to state vital statistics offices regarding collection of the death certificate data on which this report is based. The report was edited and produced by NCHS Office of Information Services, Information Design and Publishing Staff: editor Yolanda L. Jones, typesetter and designer Erik Richardson (contractor), designer Kyung Park (Internet tables), and designer Odell Eldridge (Figures, contractor).
Related Documents