MD AM HalfͲday Tutorial 11/11/2013 8:30 AM "Dealing with Estimation, Uncertainty, Risk, and Commitment" Presented by: Todd Little Landmark Graphics Corporation Brought to you by: 340 Corporate Way, Suite 300, Orange Park, FL 32073 888Ͳ268Ͳ8770 ͼ 904Ͳ278Ͳ0524 ͼ [email protected] ͼ www.sqe.com

Dealing with Estimation, Uncertainty, Risk, and Commitment
Nov 28, 2014
Software projects are known to have challenges with estimation, uncertainty, risk, and commitment—and the most valuable projects often carry the most risk. Other industries also encounter risk and generate value by understanding and managing that risk effectively. Todd Little explores techniques used in a number of risky businesses—product development, oil and gas exploration, investment banking, medicine, weather forecasting, and gambling—and shares what those industries have done to manage uncertainty. With studies of software development estimations and uncertainties, Todd discusses how software practitioners can learn from a better understanding of uncertainty and its dynamics. In addition, he introduces techniques and approaches to estimation and risk management including using real options and one of its key elements—understanding commitment. Take away a better understanding of the challenges of estimation and what software practitioners can do to better manage estimation, risks, and their commitments.
Welcome message from author
This document is posted to help you gain knowledge. Please leave a comment to let me know what you think about it! Share it to your friends and learn new things together.
Transcript

�
MD AM�HalfͲday�Tutorial�11/11/2013�8:30�AM�
������
"Dealing with Estimation, Uncertainty, Risk, and
Commitment" ���
Presented by:
Todd Little Landmark Graphics Corporation
�����
Brought�to�you�by:��
��
340�Corporate�Way,�Suite�300,�Orange�Park,�FL�32073�888Ͳ268Ͳ8770�ͼ�904Ͳ278Ͳ0524�ͼ�[email protected]�ͼ�www.sqe.com

Todd Little Landmark Graphics Corporation
Todd Little is a senior development manager for Landmark Graphics. Todd has been involved in most aspects of software development with a focus on commercial software applications for oil and gas exploration and production. He is a coauthor of the Declaration of Interdependence and a founding member and past president of the Agile Leadership Network. Todd has served on the board of directors of both the Agile Alliance and the Agile Leadership Network, is a coauthor of Stand Back and Deliver: Accelerating Business Agility, has written several articles for IEEE Software, and posts all his publications and presentations on his websitetoddlittleweb.com.

1
Dealing with Estimation, Uncertainty, Risk, and Commitment : An Outside-In Look at Agility and Risk Management
Todd Little Sr. Development Manager
Landmark Software & Services
Agenda
• Introduction • Exercise • Estimation and Uncertainty • Risk • Break • Risk Management Tools • Exercise • Summary

2
Estimation Exercise
• Number of Jellybeans in the jar
• Ratio of the highest estimate (P90) to the lowest estimate (P10)
#1: Estimation challenges are well understood by General Management, Project Management, and Teams

3
#2: Estimators and teams understand the limitations of their estimates
#3: It is normal to be able to estimate projects within 25% accuracy

4
#4: Estimation accuracy significantly improves as the project progresses
#5: Estimations are frequently impacted by biases and these biases can be significant.

5
#6: We’re pretty good as estimating things relatively
#7: Velocity is a good tool for adjusting estimates.

6
#8: We’re a bit behind, but we’ll make it up in testing since most of our uncertainty was in the features.
#9: Scope Creep is a major source of estimation error.

7
#10: Having more estimators, even if they are not experts, improves estimation accuracy
#11: Estimation tools are more accurate than expert or judgment estimation

8
#12: Project success is determined by on-time delivery
#13: Estimation is waste
9
Hurricane Rita Delivery Challenges/Failures
Challenged46%
Failed19%Succesful
35%
Standish Group 2006, reported by CEO Jim Johnson, CIO.com, ‘How to Spot a Failing Project’

10
Managing the Coming Storm Inside the Tornado
When will we get the requirements? All in good time, my little pretty, all in good time But I guess it doesn't matter anyway
Doesn't anybody believe me?
You're a very bad man!
Just give me your estimates by this afternoon
No, we need something today!
I already promised the customer it will be out in 6 months
No, we need it sooner.
Not so fast! Not so fast! ... I'll have to give the matter a little thought. Go away and come back tomorrow
Ok then, it will take 2 years.
Team Unity
Project Kickoff
We’re not in Kansas Anymore
My! People come and go so quickly here!
I may not come out alive, but I'm goin' in there!
The Great and Powerful Oz has got matters well in hand.
"Hee hee hee ha ha! Going so soon? I wouldn't hear of it! Why, my little party's just beginning!
Developer Hero
Reorg
Testing
11
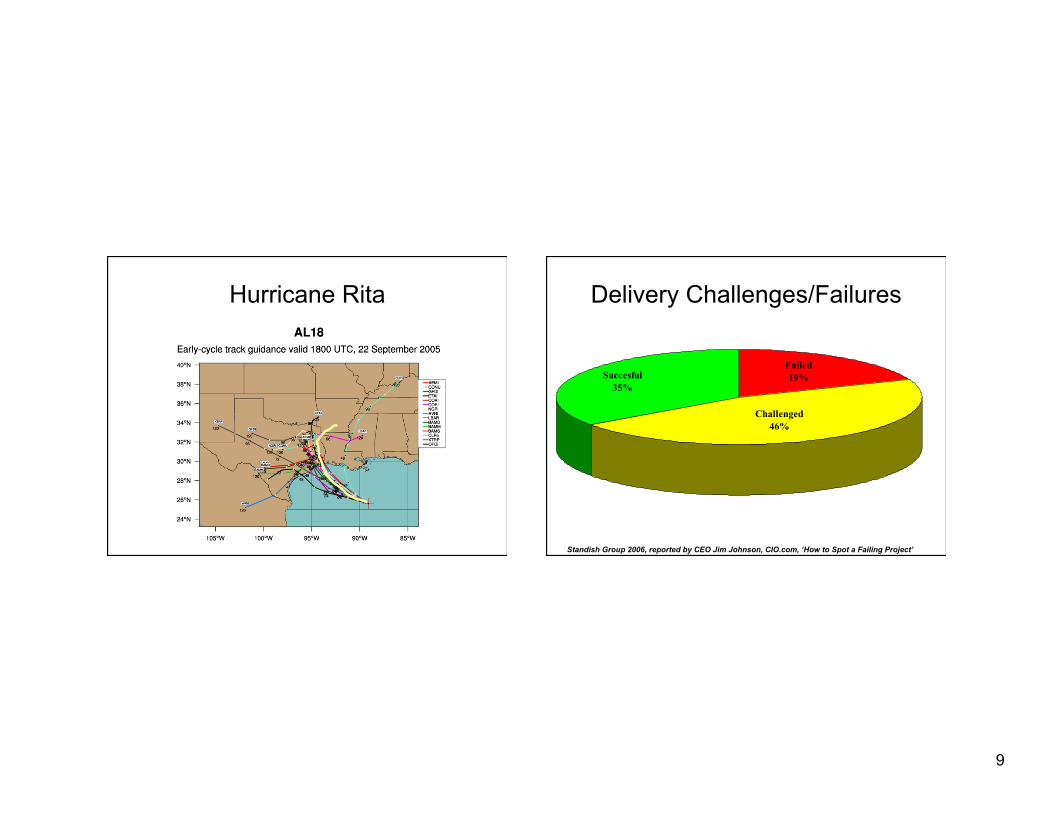
Why is Software Late? Genuchten 1991 IEEE
General Manager
Project Manager Item
1 10 Insufficient front end planning
2 3 Unrealistic project plan 3 8 Project scope underestimated 4 1 Customer/management changes 5 14 Insufficient contingency planning 6 13 Inability to track progress 7 5 Inability to track problems early 8 9 Insufficient Number of checkpoints 9 4 Staffing problems
10 2 Technical complexity 11 6 Priority Shifts 12 11 No commitment by personnel to plan 13 12 Uncooperative support groups 14 7 Sinking team spirit 15 15 Unqualified project personnel
The Context of Feedback
12
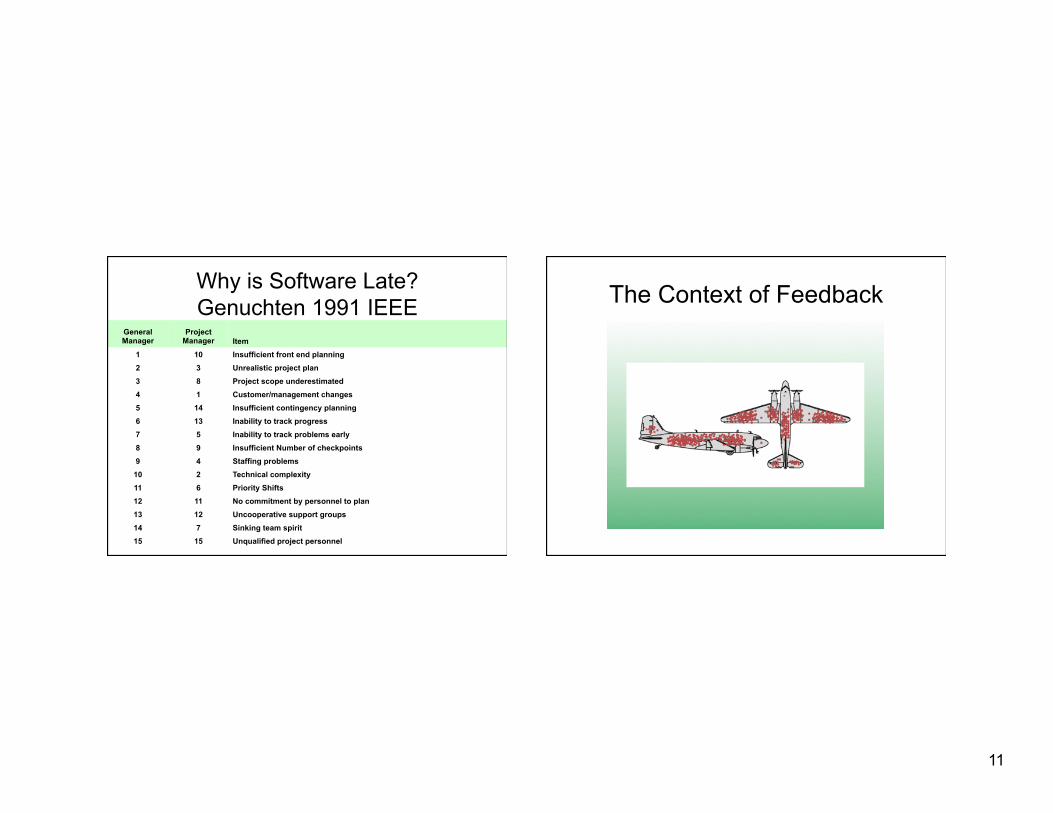
Why is Software Late? Genuchten 1991 IEEE
General Manager
Project Manager Item
4 1 Customer/management changes
10 2 Technical complexity
2 3 Unrealistic project plan
9 4 Staffing problems
7 5 Inability to track problems early
11 6 Priority Shifts
14 7 Sinking team spirit 3 8 Project scope underestimated
8 9 Insufficient Number of checkpoints
1 10 Insufficient front end planning
12 11 No commitment by personnel to plan
13 12 Uncooperative support groups
6 13 Inability to track progress
5 14 Insufficient contingency planning
15 15 Unqualified project personnel
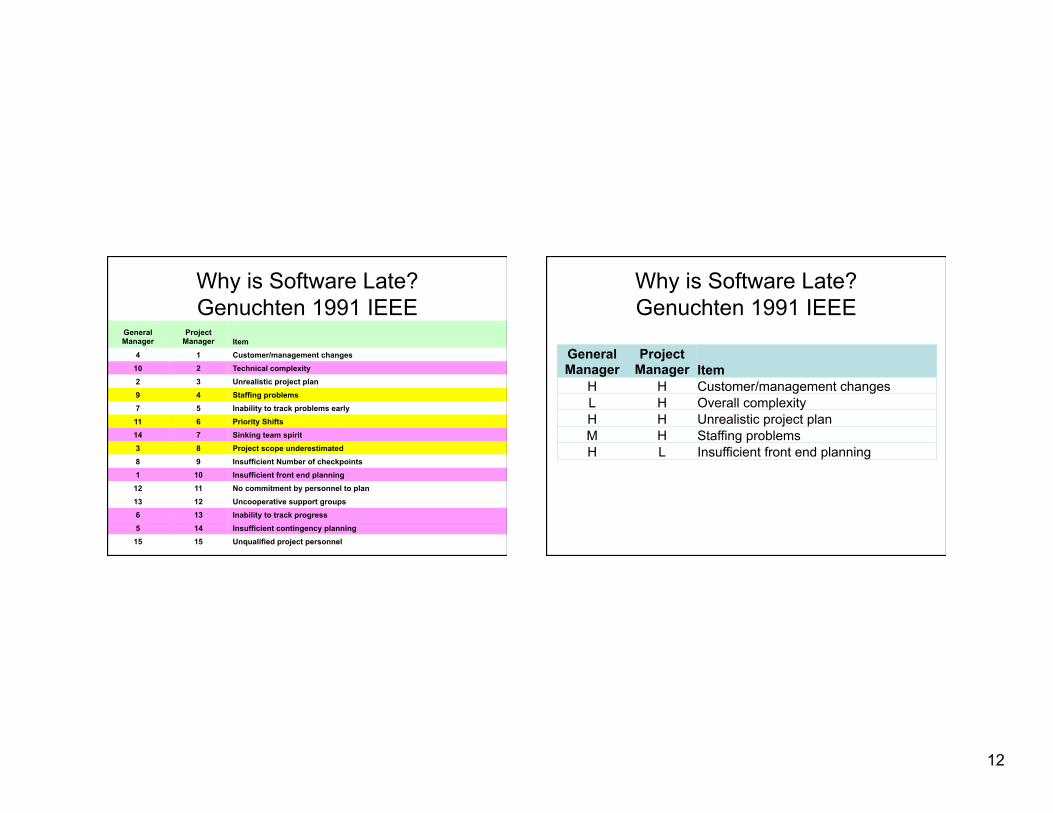
Why is Software Late? Genuchten 1991 IEEE
General Manager
Project Manager Item
H H Customer/management changes L H Overall complexity H H Unrealistic project plan M H Staffing problems H L Insufficient front end planning

13
The Goal
On Time To Spec Within Budget
Da Plan, Boss – Da Plan
14
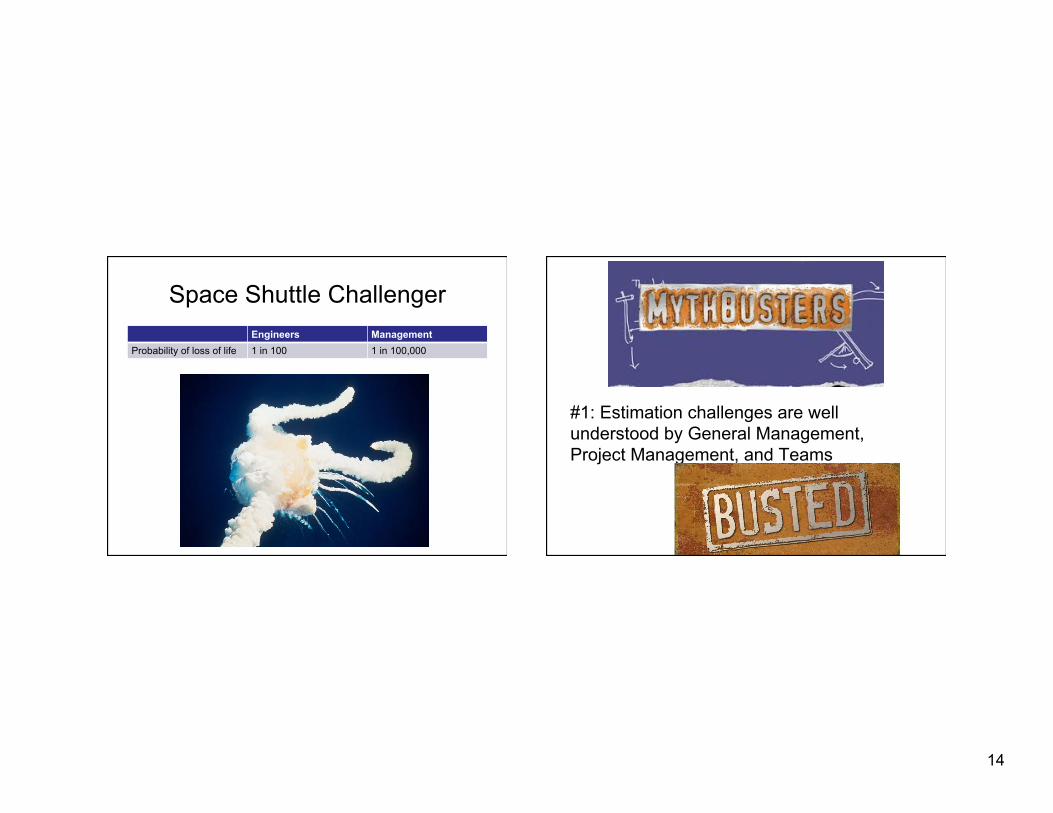
Space Shuttle Challenger Engineers Management
Probability of loss of life 1 in 100 1 in 100,000
#1: Estimation challenges are well understood by General Management, Project Management, and Teams

15
29
Group Subject % Correct (target 90%)Harvard MBAs General Trivia 40%Chemical Co. Employees General Industry 50%Chemical Co. Employees Company-Specific 48%Computer Co. Managers General Business 17%Computer Co. Managers Company-Specific 36%AIE Seminar (before training) General Trivia & IT 35%-50%AIE Seminar (after training) General Trivia & IT ~90%
90% Confidence Interval
Overconfidence in Ranges
• Most people are significantly overconfident about their estimates, especially educated professionals
Overconfidence of Success
42%
79%
0%
20%
40%
60%
80%
100%
Measured Perceived
Project Success
Matthew G. Miller, Ray J. Dawson, Kieran B. Miller, Malcolm Bradley (2008). New Insights into IT Project Failure & How to Avoid It. Presented at 22nd IPMA World Congress --� Rome (Italy) November 9--�11, 2008, in Stream 6. As of May 2013, self published at http://www.mgmiller.co.uk/files/paper.pdf

16
#2: Estimators and teams understand the limitations of their estimates
IEEE Software, May/June 2006

17
Accuracy of Initial Estimate
Act
ual
Initial Estimate
Initial Estimate vs. Actual Duration
Ideal LGC Data DeMarco
Probability Distribution Curve Distribution Curve of Actual/Estimated (DeMarco data vs. LGC)(Demarco data is Effort/Effort; LGC data is Duration/Duration)
0
0.5
1
1.5
2
2.5
0 1 2 3 4 5 6 7 8
(Actual/Estimated)
Fre
qu
ency
DeMarco
LGC

18
Log Normal Distribution
• Estimation Accuracy follows a Log Normal distribution
0.1 1 10 0 0.5 1 1.5 2 2.5 3 3.5 4 4.5 5
Median
Mean
0 0.5 1 1.5 2 2.5 3 3.5 4 4.5 50.1 1 10 0 0.5 1 1.5 2 2.5 3 3.5 4 4.5 50.1 1 10 0 0.5 1 1.5 2 2.5 3 3.5 4 4.5 5
Uncertainty Bounds
0%
10%
20%
30%
40%
50%
60%
70%
80%
90%
100%
0.1 1 10
CD
F Pr
obab
ility
Ratio of Actual/Estimate
Cumulative Distribution Function of Actual/Estimate Ratio
DeMarco Data DeMarco Log-Normal Landmark Data Landmark Log-Normal

19
#3: It is normal to be able to estimate projects within 25% accuracy
How does Estimation Accuracy Improve Over Time?
Feasibility Concept of Operation
Requirements Spec
Product Design Spec
Detail Design Spec
Accepted Software
Rel
ativ
e C
ost R
ange
Cone of Uncertainty from Boehm
4.0
2.0
0.5
0.25
1.5
0.67
1.25
0.8 1.0
20
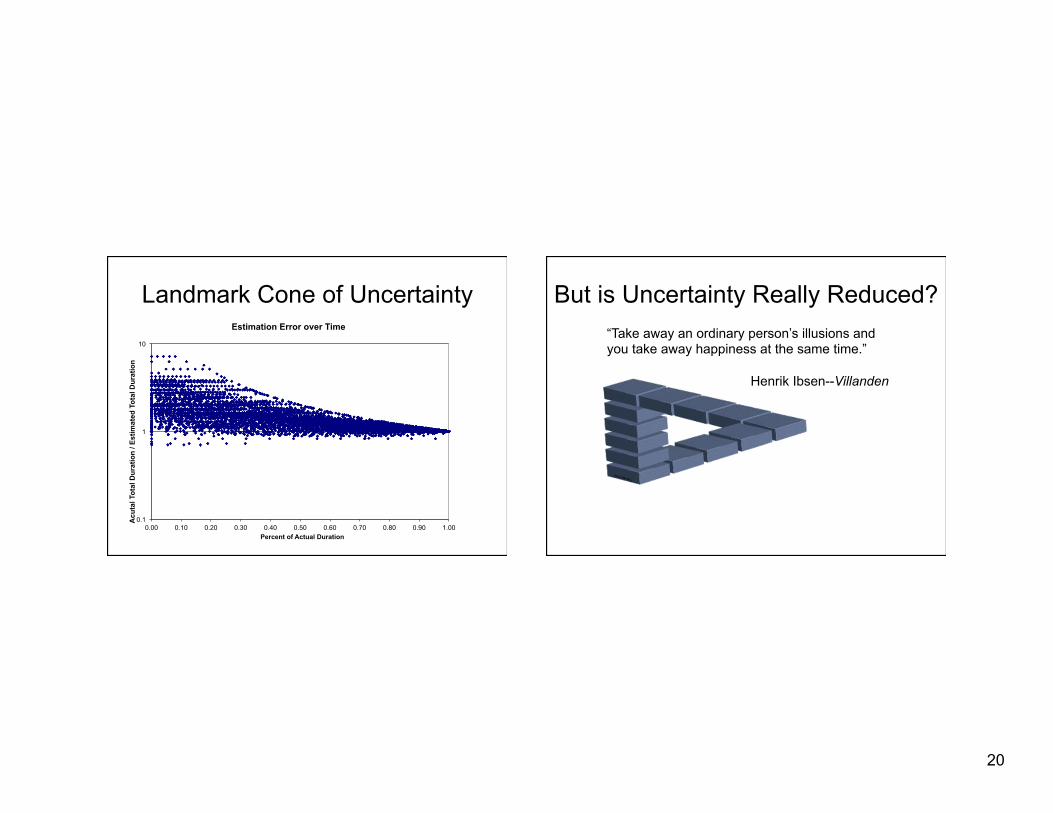
Landmark Cone of Uncertainty
0.1
1
10
0.00 0.10 0.20 0.30 0.40 0.50 0.60 0.70 0.80 0.90 1.00
Acu
tal T
otal
Dur
atio
n / E
stim
ated
Tot
al D
urat
ion
Percent of Actual Duration
Estimation Error over Time
But is Uncertainty Really Reduced? “Take away an ordinary person’s illusions and you take away happiness at the same time.”
Henrik Ibsen--Villanden
21
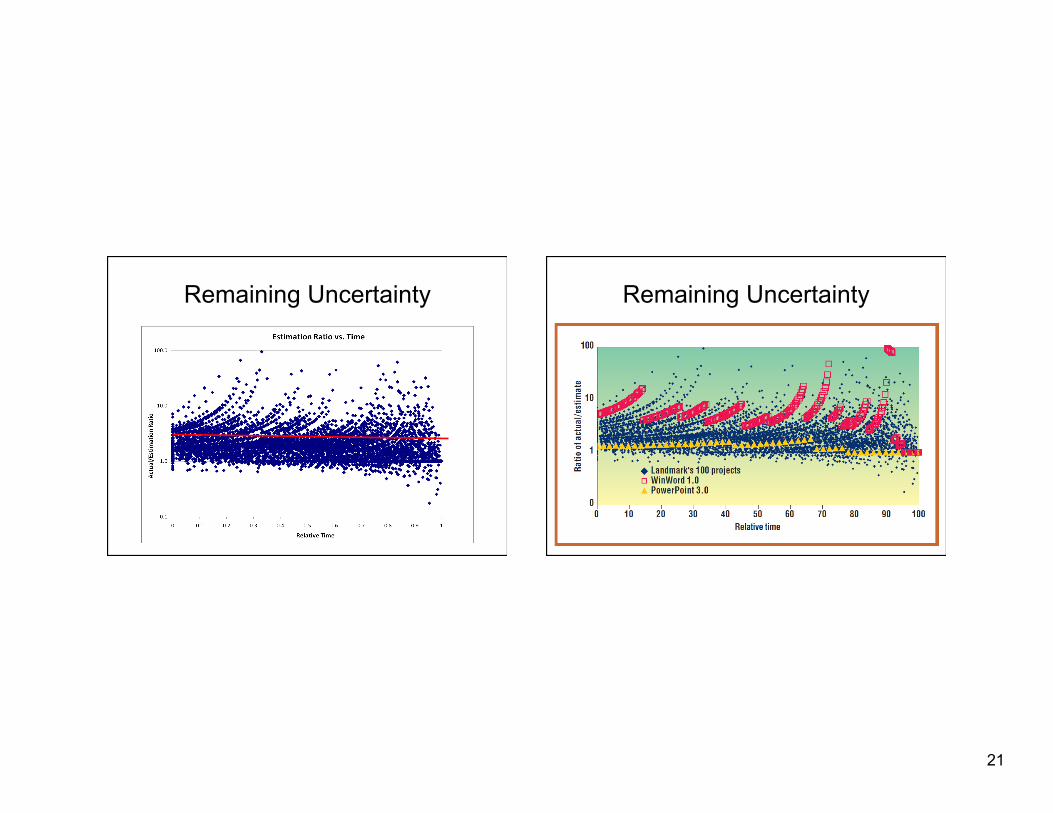
Remaining Uncertainty Remaining Uncertainty

22
#4: Estimation accuracy significantly improves as the project progresses
Sources of Error
• Bias • Uncertainty Range • Scope Creep

23
Sources of Error
• Bias Median
Mean
0 0.5 1 1.5 2 2.5 3 3.5 4 4.5 5
Estimate
Negotiation Bias
• "It is difficult to get a man to understand something when his salary depends upon his not understanding it.“
» Upton Sinclair:
24
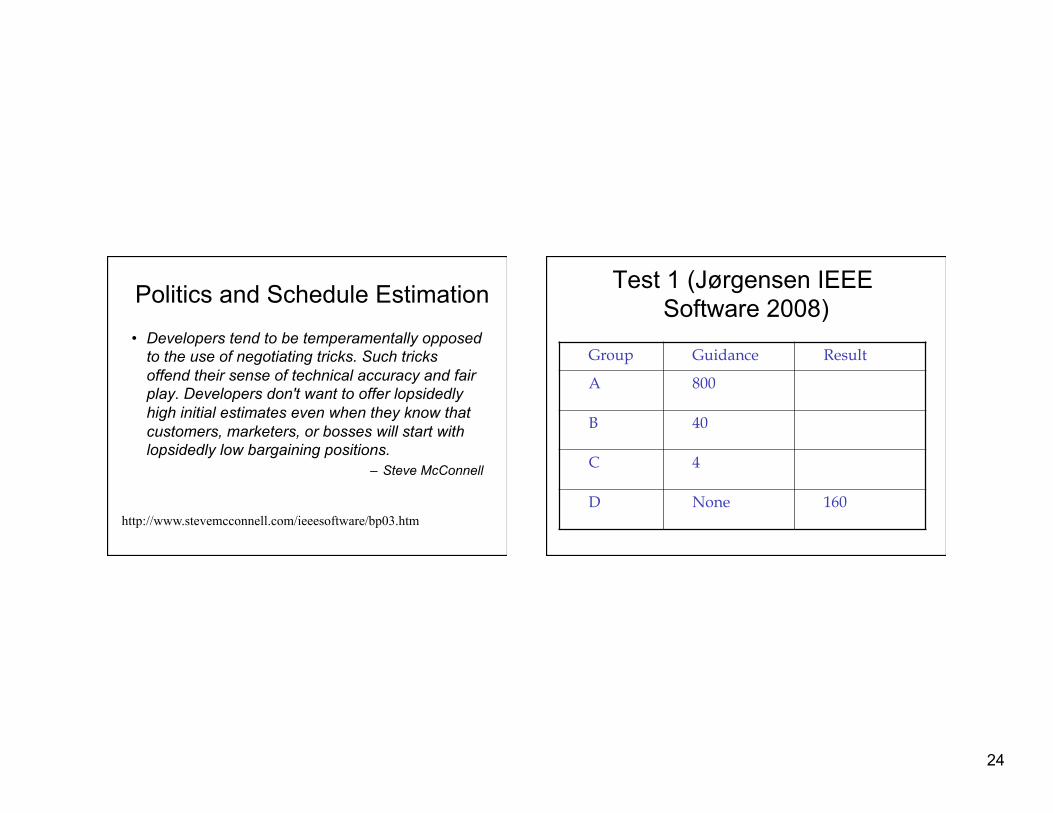
Politics and Schedule Estimation
http://www.stevemcconnell.com/ieeesoftware/bp03.htm
• Developers tend to be temperamentally opposed to the use of negotiating tricks. Such tricks offend their sense of technical accuracy and fair play. Developers don't want to offer lopsidedly high initial estimates even when they know that customers, marketers, or bosses will start with lopsidedly low bargaining positions.
– Steve McConnell
Test 1 (Jørgensen IEEE Software 2008)
Group Guidance Result
A 800
B 40
C 4
D None 160

25
Test 1
Group Guidance Result
A 800 300
B 40 100
C 4 60
D None 160
Test 2
Group Guidance Result
A Minor Extension
B New Functionality
C Extension 50

26
Test 2
Group Guidance Result
A Minor Extension
40
B New Functionality
80
C Extension 50
Test 3
Group Guidance Result
A Future work at stake, efficiency will be measured
B Control 100

27
Test 3
Group Guidance Result
A Future work at stake, efficiency will be measured
40
B Control 100
Understand Bias
• "What gets us into trouble is not what we don't know. It's what we know for sure that just ain't so.“
» Mark Twain

28
#5: Estimations are frequently impacted by biases and these biases can be significant.
Relative Sizing

29
Did you know? (Jørgensen IEEE Software March 2013)
• The US has 155 million more inhabitants than Mexico, but Mexico only has 100 million fewer inhabitants than the US.
• Poland has 10 million more inhabitants than Romania, but Romania has about the same number of inhabitants as Poland.
• Austria’s population is 70% of Hungary’s, while Hungary’s population is 80% of Austria’s.
#6: We’re pretty good as estimating things relatively

30
Velocity Helps Remove Bias
• "#$%&"'$()#*/,-.$/(#&=" "#$%&"'$()#*/0#-%1#($) =0#-%1#($)*
8/25/2009
10/14/2009
12/3/2009
1/22/2010
3/13/2010
5/2/2010
6/21/2010
8/10/2010
9/29/2010
11/18/2010
0 1 2 3 4 5 6 7 8 Iteration
Projected Ship Date
But Velocity is not a Silver Bullet
Sto
ry
Est
imat
e

31
#7: Velocity is a good tool for adjusting estimates.
Sources of Error
• Range of Uncertainty

32
Estimation Errors
• Lan Cao - Estimating Agile Software Project Effort: An Empirical Study
Lan Cao - Estimating Agile Software Project Effort: An Empirical Study

33
#8: We’re a bit behind, but we’ll make it up in testing since most of our uncertainty was in the features.
Sources of Error
• Scope Creep

34
We want this Scope Creep
• Capers Jones ! 2% per month ! 27% per year

35
#9: Scope Creep is a major source of estimation error.
Group Estimation Exercise
• Number of Jellybeans in the jar

36
Wisdom of Crowds
• “Who Wants To Be a Millionaire?” audience correct 91%
• Dutch Tulips
Collaborating with Non-Collaborators
Agreement Disagree Agree
Col
labo
ratio
n N
on-
Col
labo
rato
r C
olla
bora
tor
Compliance Combative
Creative Tension
Collegial
Common Practice
Mor
e us
eful

37
#10: Having more estimators, even if they are not experts, improves estimation accuracy
Capers Jones, Estimating Software Costs 1998
0% 10% 20% 30% 40% 50% 60%
>25%
optim
istic
10-25
% optim
istic
With
in 10
%
10-25
% cons
ervati
ve
>25%
cons
ervati
ve
Manual Tool

38
Other Studies
• Jørgensen 2007 – 10 out of 16 studies reviewed report that
judgment-based effort estimation methods led to more accurate effort estimates than formal models.
– Informal analogy with expert judgment based on intuition and experience is used 80-100%.
• Basic COCOMO reports within 30% accuracy 29% of the time.
Other Studies
"Variants in FP counting methodologies can result in variances of up to +/- 50%."
Capers Jones Selecting a FP Counting Method
At any one system size, the effort required to build it varies widely. For example collected project data at the size of 100,000 SLOC, effort ranges from a low of 10 person months to a high of 2,500 person months.
Putnam and Myers, 2000; Stutzke, 2000

39
#11: Estimation tools are more accurate than expert or judgment estimation
Inconclusive
Risk and Uncertainty Risk Uncertainty
Frank Knight Immeasurable Quantifiable
PMI Risk can be positive or negative
???
English A situation involving exposure to danger
The state of being uncertain Not known or established; questionable

40
Risky Business War They couldn't hit an elephant at this dist…
General John B. Sedgwick, Union Army Civil War officer's last words, uttered during the Battle of Spotsylvania, 1864
41
Gordon the Guided Missile Movies

42
Books Poker

43
Texas Hold’em: Which is the best hole hand?
A B C
Texas Hold’em: Which is the best hole hand?
33.5% 29.6% 36.5%
A B C
44
Poker Metric: Percent of Hands Won
Oil & Gas Exploration

45
Oil & Gas Exploration
I’m beginning to think it wasn’t such a good idea to turn off those unit tests

46
Which Uncertainties Are Important?

47
Wrong Priorities Compute This
"I recently asked a colleague [CIO] whether he would prefer to deliver a project somewhat late and over-budget but rich with business benefits or one that is on-time and underbudget but of scant value to the business. He thought it was a tough call, and then went for the on-time scenario. Delivering on-time and within budget is part of his IT department's performance metrics. Chasing after the elusive business value, over which he thought he had little control anyway, is not."
Cutter Sr. Consultant Helen Pukszta

48
Software Tornado Example
Item -15M 0M 15M 30M 45M Product Acceptance Uncertainty ██ ███ ███ ███ ███ ███ ███
Schedule Uncertainty █ ███ ███ ██
General Market Uncertainty ██ ██
Cost Uncertainty ██ █
Software Tornado Example
Item -15M 0M 15M 30M 45M Product Acceptance Uncertainty ███ ███ ███ ███ ███ ███
Schedule Uncertainty ███ ███ ██
General Market Uncertainty ██ ██
Cost Uncertainty ██ █

49
Software Tornado Example
Item -15M 0M 15M 30M 45M Product Acceptance Uncertainty ███ ███
Schedule Uncertainty ███ ██
General Market Uncertainty ██ ██
Cost Uncertainty ██ █
The Measurement Inversion
98
• Initial cost • Long-term costs
• Cost saving benefit other than labor productivity
• Labor productivity
• Revenue enhancement
• Technology adoption rate • Project value
Lowest Information Value
Highest Information Value
Most Measured
Least Measured
In a business case, the economic value of measuring a variable is usually inversely proportional to the measurement attention it typically gets.

50
#12: Project success is determined by on-time delivery
#13: Estimation is waste

51
Break Risk management tools

52
Real Options
• The right — but not the obligation — to undertake certain actions prior to an expiry date
Airline Tickets

53
Real Options • The right, but not the obligation to take
some action prior to an expiry date

54
Do you have a choice?
107
Option
Commitment
Decision

55
Real Options
Value of Information
Value of Flexibility
Value of Information

56
Value of Information
Valu
e or
Cos
t
EVI
ECI
Increasing Value & Cost of Info.
• EVPI – Expected Value of Perfect Information
• ECI – Expected Cost of Information
• EVI – Expected Value of Information
$0
$$$
Low certainty High certainty
EVPI
Aim for this range
112
Perfect Information

57
Value of Flexibility
• The right — but not the obligation — to undertake certain actions prior to an expiry date
Making An Agile Conference Agile
0
100
200
300
400
500
600
700
800
900
1000
0 10 20 30 40 50 60 70
Days Before Deadline
Submissions for 2011 compared to 2010
Y2010
Y2011-IT1
Y2011-IT2
5 Extra weeks to review sessions

58
0
200
400
600
800
1000
1200
1400
1600
1800
16 15 14 13 12 11 10 9 8 7 6 5 4 3 2 1 FINAL
Weeks Out
Estimated Agile 2010 Attendance
Most Likely
Pessimistic
Optimistic
From Variation to Chaos (De Meyer, Loch, and Pich, MIT Sloan 2002)
Type of Uncertainty
No Uncertainty Simple cause and effect
Variation Activities have normal variation not specifically related to an identifiable cause
Foreseen Uncertainty A known potential uncertainty
Unforeseen Uncertainty
An unknown potential uncertainty
Chaos Fundamental uncertainy about the basic structure of the project itself

59
From Variation to Chaos (De Meyer, Loch, and Pich, MIT Sloan 2002)
Type of Uncertainty
PM Style Actions
No Uncertainty Coordinator Optimize schedule and manage critical path
Variation Trouble Shooter and Expediter
Manage buffers
Foreseen Uncertainty
Risk Planner Anticipate uncertainty and execute on mitigation triggers
Unforeseen Uncertainty
Flexible Orchestrator and Proactive Risk Manager
Proactively re-evaluate risk and re-plan as necessary
Chaos Entrepreneurial and Knowledge Manager
Iteratively re-plan
From Variation to Chaos (De Meyer, Loch, and Pich, MIT Sloan 2002)
Cruise ship with known components
Earth-moving, Infra-structure development with unknown ground conditions
Hi-tech startup with unknown market
Chaos " " "
Unforeseen Risk " " "
Foreseen Risk " " "
Variation " " "
Action Focus on schedule optimization and management of variation via buffers
Manage contingency plans for Foreseen risk, while continually updating plans based on Unforeseen risks.
Iteratively re-plan on a regular basis.
60
61
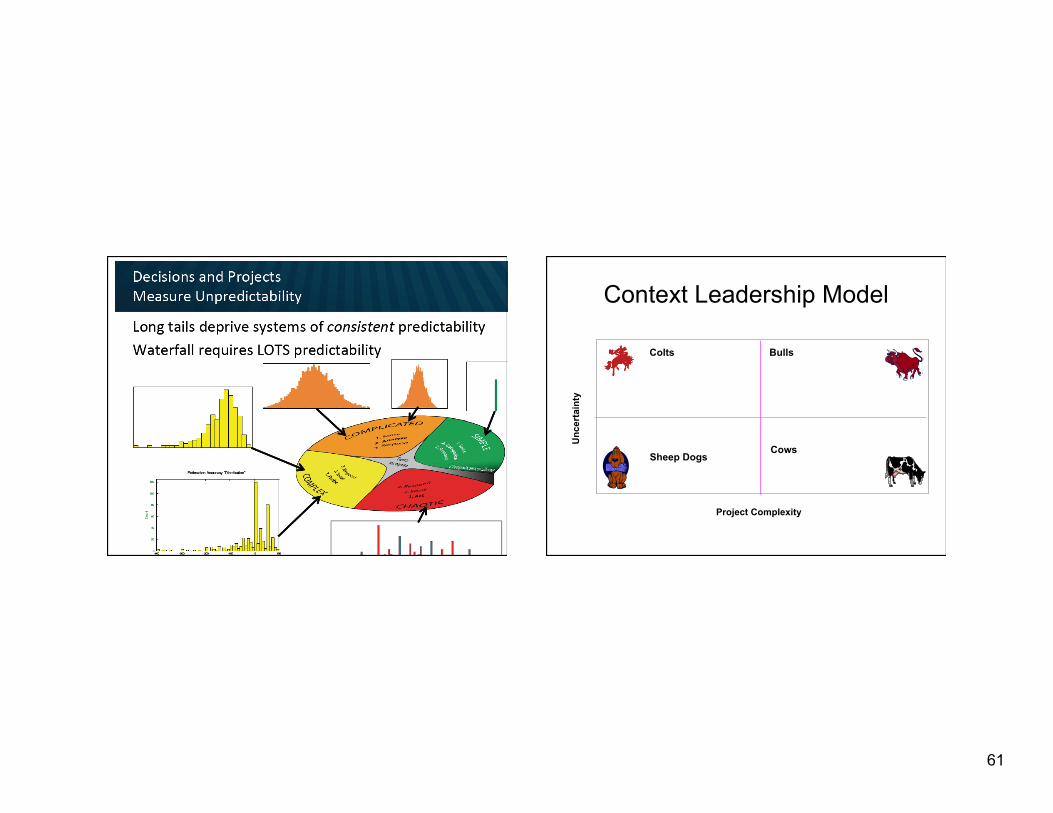
Context Leadership Model
Project Complexity
Unc
erta
inty
Cows
Bulls Colts
Sheep Dogs

62
Context Leadership Model
Project Complexity
Unc
erta
inty
Simple, young projects. Need agility Tight Teams
Sheep Dogs Complex, mature market Need defined interfaces Cows
Bulls Agility to handle uncertainty Process definition to cope
with complexity
laissez faire
Colts
Low Low
High
High
Bull Product Release

63
Reduce Uncertainty or Complexity
Uncertainty Complexity
Opportunities to Reduce Uncertainty: • Use proven technologies • Reduce project duration
Opportunities to Reduce Complexity: • Collocate the team • Break project into sub-projects
Attribute Score Market ███
Technical ███
# Customers █████████ Duration █████████ Change ███
Attribute Score Team Size █████████ Mission Critical █████████ Team Location █████████ Team Maturity ███ Domain Gaps ███ Dependencies █████████
Partitioning
Dog Project
Cow Project
Colt Project
Bull Program
Remember: Loose Coupling and Strong Cohesion
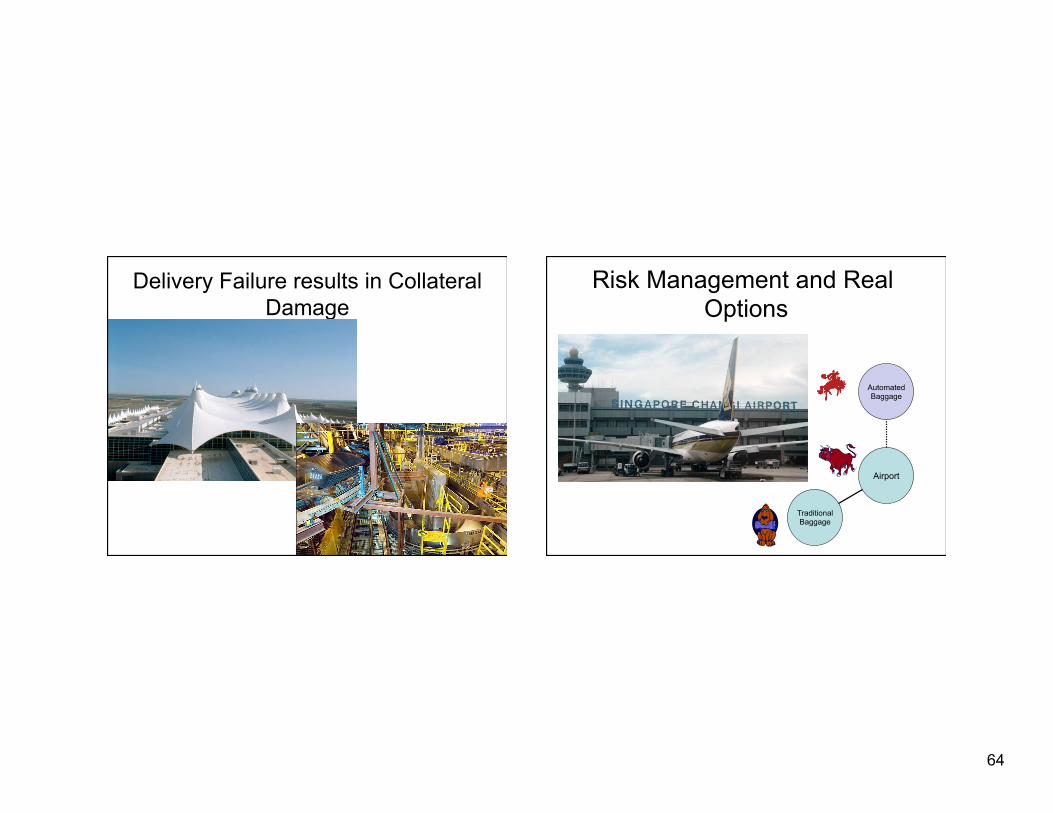
64
Delivery Failure results in Collateral Damage
Risk Management and Real Options
Traditional Baggage
Automated Baggage
Airport

65
Leadership Development
Process
People
Technology
Business
Leadership Development
Project Complexity
Unc
erta
inty
SheepDogs Cows
Bulls Colts
Low Low
High
High
Business & Technology
People & Process

66
Portfolio Management
RAPID Quadrant Assessment
0.0
2.0
4.0
6.0
8.0
10.0
12.0
0.0 5.0 10.0 15.0 20.0 25.0 30.0
Project Complexity
Un
cert
ain
ty
Project Complexity
Unc
erta
inty
Project Leadership Guide
Mar
ket
Diff
eren
tiatin
g
High
Low
Mission Critical Low High
Invent
Manage Offload
Create Change
Embrace Change
Eliminate Change
Control Change
Ad Hoc Agile
Outsource Structured
Deploy

67
Not all dogs are the same The Cone of Uncertainty
We expect uncertainty and manage for it through iterations, anticipation, and adaptation.

68
Uncertainty Bounds
0%
10%
20%
30%
40%
50%
60%
70%
80%
90%
100%
0.1 1 10
CD
F Pr
obab
ility
Ratio of Actual/Estimate
Cumulative Distribution Function of Actual/Estimate Ratio
DeMarco Data DeMarco Log-Normal Landmark Data Landmark Log-Normal
The A/B/C List sets proper expectations
A MUST be completed in order to ship the product and the schedule will be slipped if necessary to make this commitment.
B Is TARGETED to be completed in order to ship the product, but may be dropped without consequence.
C Is NOT TARGETED to be completed prior to shipping, but might make it if time allows.
Only “A” features may be committed to customers.
If more than 50% of the planned effort is allocated to “A” items the project is at risk.

69
A
0
0.2
0.4
0.6
0.8
1
1.2
January
February
March Ap
rilMay
June Ju
ly
August
September
October
November
December
A/B/C List
50% 100%
Backlog Plan
Typical Delivery
25%
A B C
B C D
50% 25%
Target Delivery Date
0
0.2
0.4
0.6
0.8
1
1.2
January
February
March Ap
rilMay
June Ju
ly
August
September
October
November
December
A/B/C List
50% 100%
Backlog Plan
Uncertainty Risk
25%
A B C
B C D
50% 25%
Target Delivery Date
A

70
Estimating Story Difficulty Es#ma#on(
XL#
L#
M#
S#
S# M# L# XL#
Cost
Valu
e

71
Product Innovation Flow
Adaptive Activities
Proj
ect
San
ctio
n
RTM
CORE Activities
Idea Filter
Hot Items
A Backlog Burnup
Sales
Services
Customer Support
Product Backlog
A Items
Iteration Backlog
Flexible Scope Backlog
New
ly D
isco
vere
d
It
ems
Most Items for consideration in next release
B & C Release Backlog
B/C/D
No
Surprises!
Risk Management = Expectation Management

72
Iteration Review Questions
• What promises have been made, to whom were they made, and who made them?
• What key decisions or commitments might we have to make within the next 2 iterations?
• Questions to ask team anonymously – When will we be ready to ship? – Will we be able to keep our promises? – Is the team healthy and operating effectively? – Is the team on the right path?
Ask the Team
0
0.1
0.2
0.3
0.4
0.5
0.6
0.7
0.8
0.9
1
2/6/2011 2/26/2011 3/18/2011 4/7/2011 4/27/2011 5/17/2011 6/6/2011 6/26/2011 7/16/2011

73
Analyze Uncertainty
probability
impa
ct
show
stop
per
oppo
rtuni
ty
improbable near certainty
Alien Invasion
We’ll rock at Scrum
Early Finish
Task Switching
Evaluation Sickness
Scope creep
negl
igib
le
0
5
10
15
20
25
30
1 2 3 4 5 6 7
Ris
k
Iteration
Risk Burndown
Risk 5
Risk 4
Risk 3
Risk 2
Risk 1

74
Risk
Technical#Uncertainty
Manual#Process Complexity
Rules#Engine Complexity
Lack#of StandardizaAon
Uncertain Benefits
Technical#Uncertainty
Manual#Process Complexity
Rules#Engine Complexity
Lack#of StandardizaAon
Uncertain Benefits
Cost of Delay
75
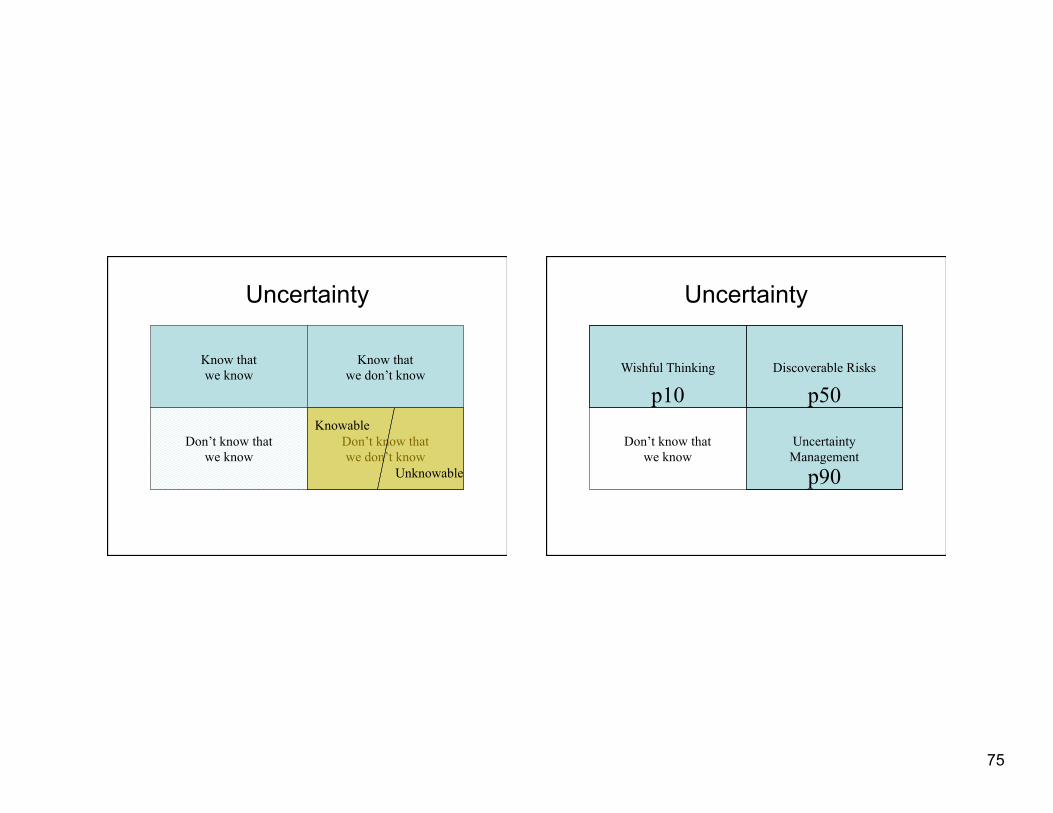
Don’t know that we don’t know
Knowable
Unknowable
Uncertainty
Know that we know
Know that we don’t know
Don’t know that we know
Don’t know that we don’t know
Knowable
Unknowable
Uncertainty
Know that we know
Know that we don’t know
Don’t know that we know
Uncertainty Management
Wishful Thinking Discoverable Risks
p10
p50
p90

76
Simulation Exercise
ID: 1 Value: Sum of all dice Major feature Test: Roll 3 dice - 2 or more dice are the same Commit Points: 2
Risk Management is not Risk Aversion

Related Documents