TECHNICAL NOTE DEA based estimation of the technical efficiency of state transport undertakings in India Shivi Agarwal & Shiv Prasad Yadav & S. P. Singh Accepted: 29 May 2009 / Published online: 1 February 2011 # Operational Research Society of India 2011 Abstract This paper measures the technical efficiency of public transport sector in India. The study makes an attempt to provide an overview of the general status of the State Transport Undertakings (STUs) in terms of their productive efficiency. Data have been collected for 35 STUs for the year 2004-2005. Technical efficiency of the STUs is measured by applying Data Envelopment Analysis (DEA) technique with the use of four input and three output variables. Fleet size, Total staff, Fuel consumption and Accident per lakh kilometer are considered as inputs and Bus utilization, Passenger kilometers and Load factor as outputs. On the basis of the status of technical efficiency, it is concluded that the performance of the STUs are good but still very far from the optimal level. The mean overall technical efficiency (OTE) is 83.26% which indicates that an average STU has the scope of producing the same output with the inputs 16.74% lesser than their existing level. Significant variation in OTE across STUs is also observed. Keywords DEA . Efficiency . Transport 1 Introduction Transport sector plays a significant role in the overall development of a nation’ s economy. Road transport is the prime motorized mode of transport linking the remote and hilly areas with rest of the country. The State Transport Undertakings OPSEARCH (July–Sept 2010) 47(3):216–230 DOI 10.1007/s12597-011-0035-4 S. Agarwal Department of Mathematics, BITS, Pilani -333031, India e-mail: [email protected] S. P. Yadav(*) Department of Mathematics, IIT, Roorkee 247667, India e-mail: [email protected] S. P. Singh Department of Humanities and Social Sciences, IIT, Roorkee 247667, India e-mail: [email protected]

Welcome message from author
This document is posted to help you gain knowledge. Please leave a comment to let me know what you think about it! Share it to your friends and learn new things together.
Transcript
TECHNICAL NOTE
DEA based estimation of the technical efficiency of statetransport undertakings in India
Shivi Agarwal & Shiv Prasad Yadav & S. P. Singh
Accepted: 29 May 2009 /Published online: 1 February 2011# Operational Research Society of India 2011
Abstract This paper measures the technical efficiency of public transport sector inIndia. The study makes an attempt to provide an overview of the general status of theState Transport Undertakings (STUs) in terms of their productive efficiency. Data havebeen collected for 35 STUs for the year 2004-2005. Technical efficiency of the STUs ismeasured by applyingData Envelopment Analysis (DEA) technique with the use of fourinput and three output variables. Fleet size, Total staff, Fuel consumption and Accidentper lakh kilometer are considered as inputs and Bus utilization, Passenger kilometersand Load factor as outputs. On the basis of the status of technical efficiency, it isconcluded that the performance of the STUs are good but still very far from the optimallevel. The mean overall technical efficiency (OTE) is 83.26% which indicates that anaverage STU has the scope of producing the same output with the inputs 16.74% lesserthan their existing level. Significant variation in OTE across STUs is also observed.
Keywords DEA . Efficiency . Transport
1 Introduction
Transport sector plays a significant role in the overall development of a nation’seconomy. Road transport is the prime motorized mode of transport linking theremote and hilly areas with rest of the country. The State Transport Undertakings
OPSEARCH (July–Sept 2010) 47(3):216–230DOI 10.1007/s12597-011-0035-4
S. AgarwalDepartment of Mathematics, BITS, Pilani -333031, Indiae-mail: [email protected]
S. P. Yadav (*)Department of Mathematics, IIT, Roorkee 247667, Indiae-mail: [email protected]
S. P. SinghDepartment of Humanities and Social Sciences, IIT, Roorkee 247667, Indiae-mail: [email protected]
(STUs), controlled by the respective state government, are the imperative mode ofpassenger mobility in public road transport sector.
Since STUs are public utility service with a social objective, it is essential toregularly monitor their performance, specifically with a view to identifyingappropriate measures including proper investment and pricing policy and to improvetheir output efficiency. In public transport sector, efficiency measurement is the firststep in the evaluation of individual performance of STUs. This study is an attempt inthis direction to assess the relative technical efficiency of STUs in India.
Passenger road transportation is a “service business” and evaluating the efficiencyof a service business is a complex matter. Transport efficiency is often more difficultto evaluate than manufacturing business efficiency, because it is difficult todetermine the efficient amount of resources required to produce various serviceoutputs. The manufacturing standard can be used to identify operating inefficienciesthrough classical cost accounting variance analyses. However, in service organiza-tion like road passenger transportation system, it is difficult to identify the specificresources required to provide a specific service output.
The purpose of this article is to evaluate the performance of STUs by providing themwith a mathematical technique to analyse the efficiency with which service is rendered.The paper attempts to estimate technical efficiency of the STUs, sets benchmark forinefficient STUs, and suggests alternative actions that would make them relativelyefficient. The paper is organized as follows: in Section 2 methodology is given. EmpiricalResults and discussions are given in Section 3, followed by conclusions in the last.
2 Methodology
This paper measures the technical efficiencies of the STUs. The technical efficiencyrefers to the extent to which a STU can produce maximum output from its chosencombination of factor inputs.
The mathematical relationship between inputs and outputs in transport sector isnot known clearly, so STU efficiency is operationalized using Data EnvelopmentAnalysis (DEA). It is a non-parametric linear programming model that estimates themagnitude of departure from efficiency frontiers for each STU. The DEA model isused to measure the OTE. The DEA is initially proposed by Charnes, Cooper andRhodes [2]. DEA measures the relative technical efficiency of a group of decision-making units (DMUs) by simultaneously evaluating multiple inputs and outputscommon to each unit; each DMU is thus assigned an efficiency score. The DEAmodel is a family of fractional linear programs; each linear program measures therelative efficiency of a particular DMU. Even though the modeling is nonlinear butunder appropriate transformations the efficiency rating can be derived from anequivalent linear program (Charnes and Cooper [4]).
DEA is chosen over other methods because
➢ It handles multiple inputs and multiple outputs;➢ It does not require a prior weights (as in index numbers);➢ It emphasizes individual observations rather than statistical estimates (as in
regression analysis);
OPSEARCH (July–Sept 2010) 47(3):216–230 217217
➢ It is a dynamic analytical decision-making tool that not only provides a“snapshot” of the current efficiency of the DMU compared with the group,but also indicates possibilities for improving relative efficiency;
➢ It uses benchmarking approach to measure STU efficiency relative to othersin their group.
➢ It can assist in identifying best-practice or efficient STUs and inefficientSTUs within the group.
➢ The DEA results can allow policy makers to develop policies that can assistthe relatively inefficient STUs to improve their performance.
2.1 Algorithm
First Step: Selection of the Homogeneous DMUsWe measure the OTE of 35 STUs using data from CIRT [5] for the year
2004–05. A list of these 35 selected STUs is given in the Appendix A.1.Second Step: Selection of Input and Output Variables
To evaluate the relative efficiency of the STUs, four inputs, viz., Fleet size(FS), Total Staff (TS), Fuel consumption (FC) and Accident per lakh kilometers(APLK) and three outputs, namely, Bus Utilisation (BU), Passenger kilometers(Pass-Kms) and Load Factor (LF) are considered.
2.2 Inputs
1. Fleet Size (number of buses in hundred) comprises the average number of buseson-road in a STU; it is representative of the capital input.
2. Total Staff (numbers in thousand) refers to the total number of employeesworked in a STU; it is representative of the labour input.
3. Fuel Consumption refers to the fuel consumed (in ten thousand kilolitres) whichis measured by dividing total earned kilometer by fuel average; it isrepresentative of the material input.
4. Accident per lakh kilometers is important parameter of safety in bus operation.
2.3 Outputs
1. Bus Utilisation (in kilometers) is defined as kilometers done per bus on road perday. It is calculated from dividing total effective kilometers done on a day bytotal buses on road on that day.
2. Passenger-kilometers (in Billions) is a measure of service utilization whichrepresents the cumulative sum of the distances ridden by each passenger. It isnormally calculated by summation of the passenger load times the distancebetween individual bus stops.
3. Load Factor is the percent of the ratio of passengers actually carried versus thetotal passenger seating capacity.
The details of the observed data for the selected STUs of the input and outputvariables are shown in Table 1. There is a perceptible variation in the inputs and the
218 OPSEARCH (July–Sept 2010) 47(3):216–230
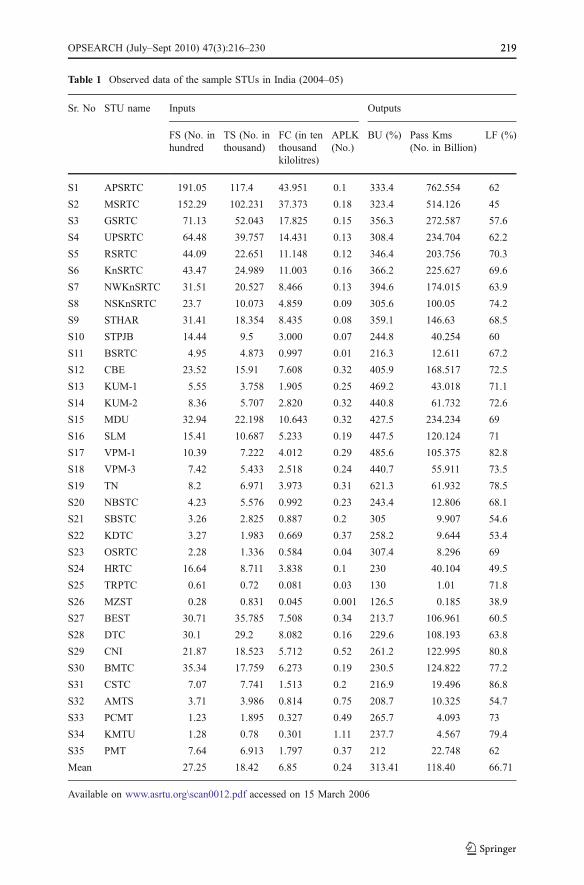
Table 1 Observed data of the sample STUs in India (2004–05)
Sr. No STU name Inputs Outputs
FS (No. inhundred
TS (No. inthousand)
FC (in tenthousandkilolitres)
APLK(No.)
BU (%) Pass Kms(No. in Billion)
LF (%)
S1 APSRTC 191.05 117.4 43.951 0.1 333.4 762.554 62
S2 MSRTC 152.29 102.231 37.373 0.18 323.4 514.126 45
S3 GSRTC 71.13 52.043 17.825 0.15 356.3 272.587 57.6
S4 UPSRTC 64.48 39.757 14.431 0.13 308.4 234.704 62.2
S5 RSRTC 44.09 22.651 11.148 0.12 346.4 203.756 70.3
S6 KnSRTC 43.47 24.989 11.003 0.16 366.2 225.627 69.6
S7 NWKnSRTC 31.51 20.527 8.466 0.13 394.6 174.015 63.9
S8 NSKnSRTC 23.7 10.073 4.859 0.09 305.6 100.05 74.2
S9 STHAR 31.41 18.354 8.435 0.08 359.1 146.63 68.5
S10 STPJB 14.44 9.5 3.000 0.07 244.8 40.254 60
S11 BSRTC 4.95 4.873 0.997 0.01 216.3 12.611 67.2
S12 CBE 23.52 15.91 7.608 0.32 405.9 168.517 72.5
S13 KUM-1 5.55 3.758 1.905 0.25 469.2 43.018 71.1
S14 KUM-2 8.36 5.707 2.820 0.32 440.8 61.732 72.6
S15 MDU 32.94 22.198 10.643 0.32 427.5 234.234 69
S16 SLM 15.41 10.687 5.233 0.19 447.5 120.124 71
S17 VPM-1 10.39 7.222 4.012 0.29 485.6 105.375 82.8
S18 VPM-3 7.42 5.433 2.518 0.24 440.7 55.911 73.5
S19 TN 8.2 6.971 3.973 0.31 621.3 61.932 78.5
S20 NBSTC 4.23 5.576 0.992 0.23 243.4 12.806 68.1
S21 SBSTC 3.26 2.825 0.887 0.2 305 9.907 54.6
S22 KDTC 3.27 1.983 0.669 0.37 258.2 9.644 53.4
S23 OSRTC 2.28 1.336 0.584 0.04 307.4 8.296 69
S24 HRTC 16.64 8.711 3.838 0.1 230 40.104 49.5
S25 TRPTC 0.61 0.72 0.081 0.03 130 1.01 71.8
S26 MZST 0.28 0.831 0.045 0.001 126.5 0.185 38.9
S27 BEST 30.71 35.785 7.508 0.34 213.7 106.961 60.5
S28 DTC 30.1 29.2 8.082 0.16 229.6 108.193 63.8
S29 CNI 21.87 18.523 5.712 0.52 261.2 122.995 80.8
S30 BMTC 35.34 17.759 6.273 0.19 230.5 124.822 77.2
S31 CSTC 7.07 7.741 1.513 0.2 216.9 19.496 86.8
S32 AMTS 3.71 3.986 0.814 0.75 208.7 10.325 54.7
S33 PCMT 1.23 1.895 0.327 0.49 265.7 4.093 73
S34 KMTU 1.28 0.78 0.301 1.11 237.7 4.567 79.4
S35 PMT 7.64 6.913 1.797 0.37 212 22.748 62
Mean 27.25 18.42 6.85 0.24 313.41 118.40 66.71
Available on www.asrtu.org\scan0012.pdf accessed on 15 March 2006
OPSEARCH (July–Sept 2010) 47(3):216–230 219219

outputs across STUs. All the inputs used are in some cases hundred times larger thanthat used by other STU. The variations in outputs produced are not so high exceptPass-Kms.
Third Step: Fourth Step: Selection of the modelIn this study, CCR input-oriented model has been employed, i.e., how much
resources can be reduced without changing the outputs produced to make STUsefficient (Charnes et al. [4]). In order to decompose the overall technicalefficiency (OTE) into pure technical efficiency (PTE) and scale efficiency (SE),BCC input-oriented model is also applied to the data. Descriptive statistics ofthe results are given in Tables 2 and 5.Fourth Step: Calculating the overall technical efficiency (OTE) of STU
To describe DEA efficiency evaluation, assume that the performance of thehomogeneous set of n decision making units (DMUj; j=1…n) be measured byDEA. The performance of DMUj is characterized by a production process of minputs (xij; i=1…m) to yield s outputs (yrj; r=1… s). According to Charnes etal. [2], the ratio of the virtual output to the virtual input of any DMUk is to bemaximized with the condition that the ratio of virtual output to virtual input ofevery DMU should be less than or equal to unity.
Mathematically,
Max Ek ¼Ps
r¼1urkyrk
Pm
i¼1vikxik
subject to
Ps
r¼1urkyrj
Pm
i¼1vikxij
� 1 8j ¼ 1; 2; . . . ; n
urkPm
i¼1vikxik
� " 8 r ¼ 1; 2; . . . ; s
vikPm
i¼1vikxik
� " 8i ¼ 1; 2; . . . ;m
ð1Þ
where yrk is the amount of the rth output produced by the kth DMU; xik is theamount of the ith input used by the kth DMU; urk is the weight given to therthoutput of the kth DMU; vik is the weight given to the ith input of the kth DMU;n is the no. of DMUs ; s is the no. of outputs; m is the no. of inputs and ε is anon-Archimedean (infinitesimal) constant.
The model (1) is popularly known as the classical CCR ratio model namedafter Charnes, Cooper and Rhodes. The theory of fractional linear programming
220 OPSEARCH (July–Sept 2010) 47(3):216–230
[3] makes it possible to replace (1) with an equivalent linear programming
problem by imposing the conditionPm
i¼1vikxik ¼ 1 which provides:
Maxwk ¼Xs
r¼1
urkyrk
Table 2 Resulting efficiency scores of STUs by DEA model
STU No. Efficiency scores Reference set Peer weight Peer count
S1 1.00 S1 1.00 4
S2 0.790 S1, S7 0.51, 0.70 0
S3 0.821 S1, S7 0.17, 0.82 0
S4 0.853 S1, S6, S26 0.13, 0.61, 0.33 0
S5 1.00 S5 1.00 0
S6 1.00 S6 1.00 5
S7 1.00 S7 1.00 3
S8 1.00 S8 1.00 1
S9 1.00 S9 1.00 0
S10 0.638 S6, S7, S16, S26 0.06, 0.06, 0.14, 1.09 0
S11 0.725 S1, S6, S26 0.01, 0.03, 1.66 0
S12 0.943 S16, S17 1.15, 0.29 0
S13 1.00 S13 1.00 2
S14 0.862 S17, S23, S25, S34 0.58, 0.12, 0.86, 0.07 0
S15 1.00 S15 1.00 0
S16 1.00 S16 1.00 6
S17 1.00 S17 1.00 12
S18 0.873 S17, S23, S25, S34 0.51, 0.04, 1.34, 0.02 0
S19 0.866 S13, S17, S26, S34 0.37, 0.43, 1.80, 0.04 0
S20 0.548 S17, S25, S26 0.12, 0.04, 1.43 0
S21 0.626 S13, S23, S25, S26, S34 0.14, 0.37, 0.25, 0.61, 0.06 0
S22 0.743 S17, S23, S25, S34 0.05, 0.26, 0.79, 0.20 0
S23 1.00 S23 1.00 5
S24 0.499 S8, S16, S23, S26 0.25, 0.12, 0.12, 0.52 0
S25 1.00 S25 1.00 7
S26 1.00 S26 1.00 13
S27 0.599 S16, S17 0.64, 0.28 0
S28 0.637 S6, S16, S26 0.35, 0.24, 0.58 0
S29 0.820 S17 1.17 0
S30 0.895 S6, S16, S26 0.14, 0.78, 0.32 0
S31 0.519 S17, S25, S26 0.18, 1.00, 0.02 0
S32 0.542 S17, S26 0.10, 1.28 0
S33 0.842 S17, S26, S34 0.02, 1.43, 0.31 0
S34 1.00 S34 1.00 6
S35 0.501 S17, S25, S26 0.21, 0.34, 0.51 0
Mean 0.833
OPSEARCH (July–Sept 2010) 47(3):216–230 221221
subject to
Pm
i¼1vikxik ¼ 1
Ps
r¼1urkyrj �
Pm
i¼1vikxij � 0 8j ¼ 1; 2; :::; n
urk � " 8r ¼ 1; 2; :::; svik � " 8i ¼ 1; 2; :::;m
ð2Þ
Model (2) is interpreted that the objective is to maximize virtual output ofDMUk subject to unit virtual input of DMUk while maintaining the conditionthat virtual output cannot exceed virtual input for every DMU. This is known asCCR multiplier model whose dual LPP is
Min zk ¼ qk � "Xs
r¼1
Sþrk � "Xm
i¼1
S�ik
subject to
Pn
j¼1ljkyrj � Sþrk ¼ yrk 8r ¼ 1 . . . . . . . . . :s
Pn
j¼1ljkxij þ S�ik ¼ qkxik 8i ¼ 1 . . . . . . . . . :m
ljk � 0 8j ¼ 1 . . . . . . . . . :nqk is unrestricted in signSþrk ; S
�ik � 0; r ¼ 1 . . . ::s; i ¼ 1 . . . . . .m
ð3Þ
where Sþrk is slack in the rth output of the kth DMU; S�ik is slack in the ith input ofthe kth DMU; ljk 0s are non negative dual variables and θk (scalar) is the(proportional) reduction applied to all inputs of DMUk to improve efficiency.This reduction is applied simultaneously to all inputs and results in a radialmovement towards the envelopment surface. This is popularly known as CCRenvelopment model.
The interpretation of the results of the envelopment model (3) can besummarized as:
The kth STU is Pareto efficient if
(a) q»k ¼ 1
(b) All slacks are zero, i.e., Sþ»
rk and S�»ik = 0 for every r and i.
The non-zero slacks and (or) q»k � 1 identify the sources and amount of
any inefficiency that may exist in the DMUk. If the optimal value l»jk of 1 jk
is non zero then jth DMU represents the reference set (peers) of the kth DMU.
Fifth Step: Calculate OTE of every sample STU. The detailed information of theresults is given in Table 2Sixth Step: Calculating the pure technical efficiency (PTE) and scale efficiency(SE) of STU: Another version of DEA is BCC model given by Banker, Charnesand Cooper [1]. The primary difference between BCC model and CCR model is
222 OPSEARCH (July–Sept 2010) 47(3):216–230
the convexity constraint, which represents the returns to scale. Returns to scalereflects the extent to which a proportional increase in all inputs increases
outputs. In the BCC model 1 jk’s are now restricted toPn
j¼1ljk ¼ 1 which is
known as convexity constraint. Technical efficiency assessed by BCC model ispure technical efficiency because it has net of any scale effect. The impact ofscale-size on efficiency of a DMU is measured by scale efficiency.
Scale Efficiency of the kth DMU ¼ Overall Technical Efficiency of the kth DMU
Pure Technical Efficiency of the kth DMU
¼ CCREfficiency Score of the kth DMU
BCC Efficiency Score of the kth DMU
The overall technical efficiency (OTE) of a DMU can never exceed its puretechnical efficiency (PTE). All the three efficiencies (overall technical, puretechnical and scale) are bounded by zero and one.Seventh Step: Calculate PTE and SE of every sample STU. The detailedinformation of DEA results is given in Table 5.
3 Empirical results and discussions
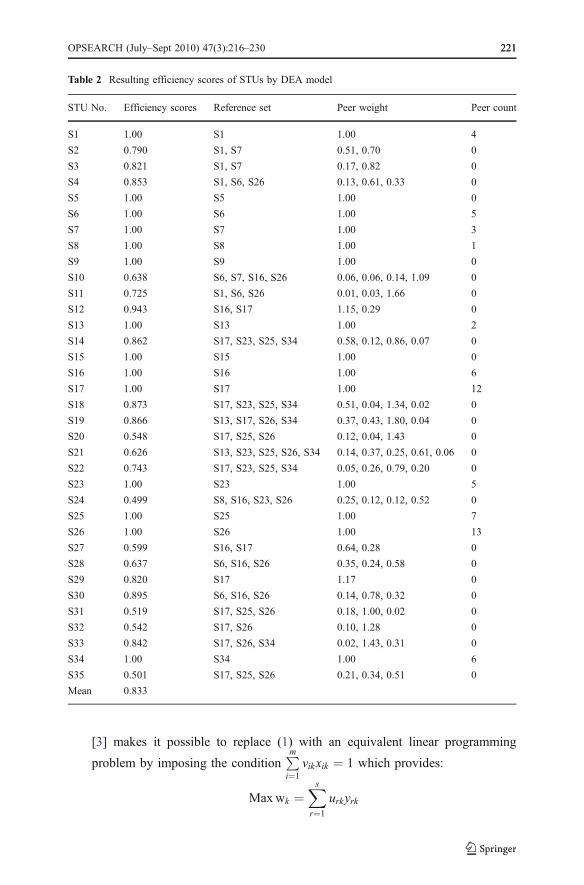
Table 2 presents the information on OTE, reference set, peer weights and referencecount (peer count) of the sample STUs for the year 2004–05. The DEA analysisevaluates the set of STUs which construct the production frontier. The STUs havingvalues of the OTE score equal to 1.00 are form the efficient frontier and those havingthe values less than 1.00 are less efficient relative to the STUs on the frontier. Thelower the efficiency score, the higher scope for the potential reduction in inputs(while maintaining the existing level of outputs) relative to the best practice STUs.
The results indicate that out of 35 STUs, 14 STUs (40%) are relatively efficient(efficiency score =1) while remaining 21 STUS are relatively inefficient (efficiencyscore <1). These fourteen efficient STUs are APSRTC (S1), RSRTC (S5), KnSRTC(S6), NWKnSRTC (S7), NSKnSRTC (S8), STHAR (S9), KUM-1 (S13), MDU(S15), SLM (S16), VPM-1 (S17), OSRTC (S23), TRPTC (S25), MZST (S26), andKMTU (S34). These STUs are on the best-practice frontier and thus form the“reference set”, i.e., these STUs can set an example of good operating practice forthe remaining 21 inefficient STUs to emulate. HRTC (S24) is the most technicalinefficient STU. Among the inefficient STUs, 7 STUs have the efficiency scoresabove the average efficiency scores.
The average of OTE scores works out to be 0.833. This reveals that an averageSTU can reduce its resources by 16.74% to obtain the existing level of outputs.
We use the frequency of efficient STUs in the reference set (i.e., peer count) todiscriminate among them. The higher peer count represents the extent of robustnessof that STU compared with other efficient STUs. In other words, a STU with higherpeer count is likely to be a STU which is efficient with respect to a large number offactors and is probably a good example of a “global leader” or a STU with a high
OPSEARCH (July–Sept 2010) 47(3):216–230 223223
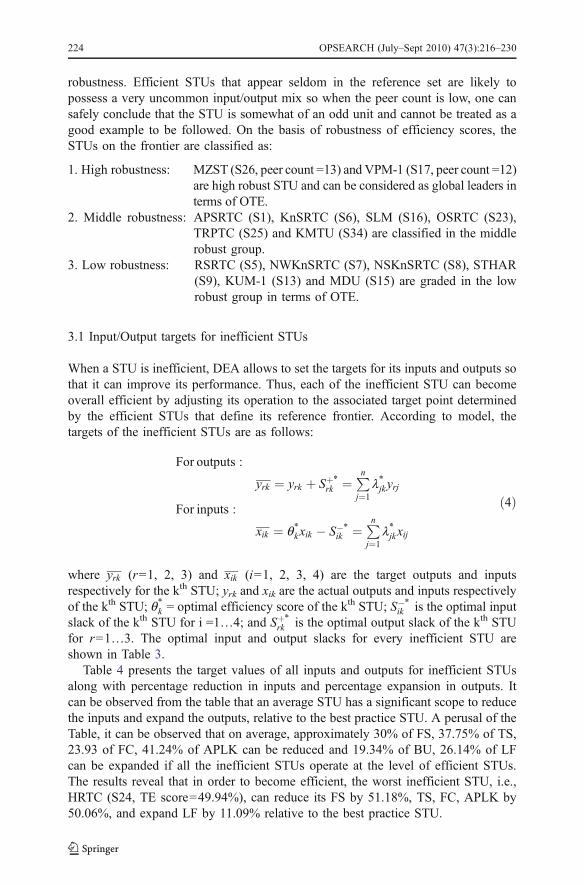
robustness. Efficient STUs that appear seldom in the reference set are likely topossess a very uncommon input/output mix so when the peer count is low, one cansafely conclude that the STU is somewhat of an odd unit and cannot be treated as agood example to be followed. On the basis of robustness of efficiency scores, theSTUs on the frontier are classified as:
1. High robustness: MZST (S26, peer count =13) and VPM-1 (S17, peer count =12)are high robust STU and can be considered as global leaders interms of OTE.
2. Middle robustness: APSRTC (S1), KnSRTC (S6), SLM (S16), OSRTC (S23),TRPTC (S25) and KMTU (S34) are classified in the middlerobust group.
3. Low robustness: RSRTC (S5), NWKnSRTC (S7), NSKnSRTC (S8), STHAR(S9), KUM-1 (S13) and MDU (S15) are graded in the lowrobust group in terms of OTE.
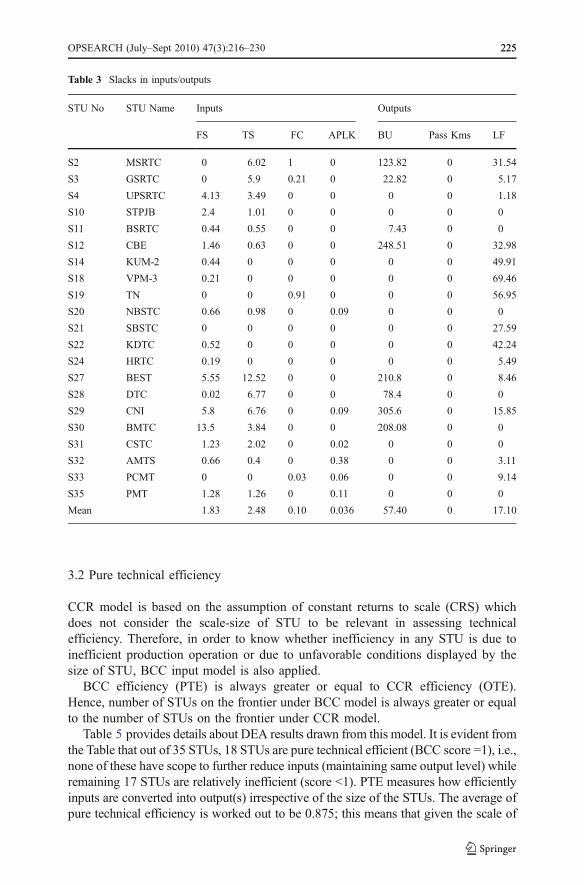
3.1 Input/Output targets for inefficient STUs
When a STU is inefficient, DEA allows to set the targets for its inputs and outputs sothat it can improve its performance. Thus, each of the inefficient STU can becomeoverall efficient by adjusting its operation to the associated target point determinedby the efficient STUs that define its reference frontier. According to model, thetargets of the inefficient STUs are as follows:
For outputs :
yrk ¼ yrk þ Sþ»
rk ¼ Pn
j¼1l»jkyrj
For inputs :
xik ¼ q»kxik � S�»
ik ¼ Pn
j¼1l»jkxij
ð4Þ
where yrk (r=1, 2, 3) and xik (i=1, 2, 3, 4) are the target outputs and inputsrespectively for the kth STU; yrk and xik are the actual outputs and inputs respectivelyof the kth STU; q
»k = optimal efficiency score of the kth STU; S�»
ik is the optimal inputslack of the kth STU for i =1…4; and Sþ»
rk is the optimal output slack of the kth STUfor r=1…3. The optimal input and output slacks for every inefficient STU areshown in Table 3.
Table 4 presents the target values of all inputs and outputs for inefficient STUsalong with percentage reduction in inputs and percentage expansion in outputs. Itcan be observed from the table that an average STU has a significant scope to reducethe inputs and expand the outputs, relative to the best practice STU. A perusal of theTable, it can be observed that on average, approximately 30% of FS, 37.75% of TS,23.93 of FC, 41.24% of APLK can be reduced and 19.34% of BU, 26.14% of LFcan be expanded if all the inefficient STUs operate at the level of efficient STUs.The results reveal that in order to become efficient, the worst inefficient STU, i.e.,HRTC (S24, TE score=49.94%), can reduce its FS by 51.18%, TS, FC, APLK by50.06%, and expand LF by 11.09% relative to the best practice STU.
224 OPSEARCH (July–Sept 2010) 47(3):216–230
3.2 Pure technical efficiency
CCR model is based on the assumption of constant returns to scale (CRS) whichdoes not consider the scale-size of STU to be relevant in assessing technicalefficiency. Therefore, in order to know whether inefficiency in any STU is due toinefficient production operation or due to unfavorable conditions displayed by thesize of STU, BCC input model is also applied.
BCC efficiency (PTE) is always greater or equal to CCR efficiency (OTE).Hence, number of STUs on the frontier under BCC model is always greater or equalto the number of STUs on the frontier under CCR model.
Table 5 provides details about DEA results drawn from this model. It is evident fromthe Table that out of 35 STUs, 18 STUs are pure technical efficient (BCC score =1), i.e.,none of these have scope to further reduce inputs (maintaining same output level) whileremaining 17 STUs are relatively inefficient (score <1). PTE measures how efficientlyinputs are converted into output(s) irrespective of the size of the STUs. The average ofpure technical efficiency is worked out to be 0.875; this means that given the scale of
Table 3 Slacks in inputs/outputs
STU No STU Name Inputs Outputs
FS TS FC APLK BU Pass Kms LF
S2 MSRTC 0 6.02 1 0 123.82 0 31.54
S3 GSRTC 0 5.9 0.21 0 22.82 0 5.17
S4 UPSRTC 4.13 3.49 0 0 0 0 1.18
S10 STPJB 2.4 1.01 0 0 0 0 0
S11 BSRTC 0.44 0.55 0 0 7.43 0 0
S12 CBE 1.46 0.63 0 0 248.51 0 32.98
S14 KUM-2 0.44 0 0 0 0 0 49.91
S18 VPM-3 0.21 0 0 0 0 0 69.46
S19 TN 0 0 0.91 0 0 0 56.95
S20 NBSTC 0.66 0.98 0 0.09 0 0 0
S21 SBSTC 0 0 0 0 0 0 27.59
S22 KDTC 0.52 0 0 0 0 0 42.24
S24 HRTC 0.19 0 0 0 0 0 5.49
S27 BEST 5.55 12.52 0 0 210.8 0 8.46
S28 DTC 0.02 6.77 0 0 78.4 0 0
S29 CNI 5.8 6.76 0 0.09 305.6 0 15.85
S30 BMTC 13.5 3.84 0 0 208.08 0 0
S31 CSTC 1.23 2.02 0 0.02 0 0 0
S32 AMTS 0.66 0.4 0 0.38 0 0 3.11
S33 PCMT 0 0 0.03 0.06 0 0 9.14
S35 PMT 1.28 1.26 0 0.11 0 0 0
Mean 1.83 2.48 0.10 0.036 57.40 0 17.10
OPSEARCH (July–Sept 2010) 47(3):216–230 225225

Tab
le4
Target
values
ofinpu
tandou
tput
variablesun
derCCRinpu
tmod
el
STU
No
STU
Nam
eInputs
Outputs
FS
TS
FC
APLK
BU
PassKms
LF
S2
MSRTC
120.37(20.96)
74.78(26.85)
28.54(23.63)
0.14(20.96)
447.22(38.29)
514.13(0)
76.54(70.10)
S3
GSRTC
58.43(17.86)
36.85(29.18)
14.43(19.02)
0.12(17.86)
379.12(6.41)
272.59(0)
62.77(8.97)
S4
UPSRTC
50.89(21.08)
30.43(23.45)
12.31(14.67)
0.11(14.67)
308.4(0)
234.70(0)
63.38(1.9)
S10
STPJB
6.81(52.84)
5.05(46.86)
1.91(36.25)
0.04(36.25)
244.8(0)
40.25(0)
60(0)
S11
BSRTC
3.15(36.36)
2.98(38.88)
0.72(27.53)
0.001(0)
223.73(3.43)
12.61(0)
67.2(0)
S12
CBE
20.72(11.89)
14.38(9.64)
7.18(5.67)
0.30(5.67)
654.41(61.23)
168.52(0)
105.48(45.48)
S14
KUM-2
6.76(19.08)
4.92(13.85)
2.43(13.85)
0.28(13.85)
440.8(0)
61.73(0)
122.51(68.74)
S18
VPM-3
6.27(15.46)
4.74(12.68)
2.20(12.68)
0.21(12.68)
440.7(0)
55.91(0)
142.96(94.5)
S19
TN
7.1(13.42)
6.04(13.42)
2.53(36.31)
0.27(13.42)
621.3(0)
61.93(0)
135.45(72.54)
S20
NBSTC
1.66(60.86)
2.07(62.83)
0.54(45.24)
0.04(83.94)
243.4(0)
12.81(0)
68.1(0)
S21
SBSTC
2.04(37.37)
1.77(37.37)
0.56(37.37)
0.13(37.37)
305(0)
9.91(0)
82.19(50.54)
S22
KDTC
1.91(41.70)
1.47(25.73)
0.50(25.73)
0.27(25.73)
258.2(0)
9.64(0)
95.64(79.10)
S24
HRTC
8.12(51.18)
4.35(50.06)
1.92(50.06)
0.05(50.06)
230(0)
40.10(0)
54.99(11.09)
S27
BEST
12.85(58.17)
8.91(75.09)
4.50(40.09)
0.20(40.09)
424.5(98.64)
106.96(0)
68.96(13.98)
S28
DTC
19.16(36.34)
11.83(59.48)
5.15(36.28)
0.10(36.28)
308(34.15)
108.19(0)
63.8(0)
S29
CNI
12.13(44.55)
8.43(54.49)
4.68(18.02)
0.34(34.91)
566.80(117)
122.99(0)
96.64(19.61)
S30
BMTC
18.13(48.69)
12.05(32.12)
5.61(10.50)
0.17(10.50)
438.58(90.27)
124.82(0)
77.2(0)
S31
CSTC
2.44(65.55)
2.00(74.18)
0.78(48.11)
8.08E–0
2(59.58)
216.9(0)
19.50(0)
86.8(0)
S32
AMTS
1.35
(63.51)
1.76(55.92)
0.44(45.78)
2.90E–0
2(96.13)
208.7(0)
10.32(0)
57.81(5.68)
S33
PCMT
1.03
(15.83)
1.59(15.83)
0.25(23.76)
0.35(28.02)
265.7(0)
4.09(0)
82.14(12.52)
S35
PMT
2.55
(66.60)
2.20(68.17)
0.90(49.91)
7.22E–0
2(80.49)
212(0)
22.75(0)
62(0)
Mean
17.33(30)
11.36(37.75)
4.67(23.93)
0.16(41.24)
354.20(19.34)
95.93(0)
82.50(26.14)
Figures
inbraces
arethepercentage
reductions
inthecorrespondinginputsandpercentage
additio
nsin
correspondingoutputsto
maketheSTU
efficient
226 OPSEARCH (July–Sept 2010) 47(3):216–230
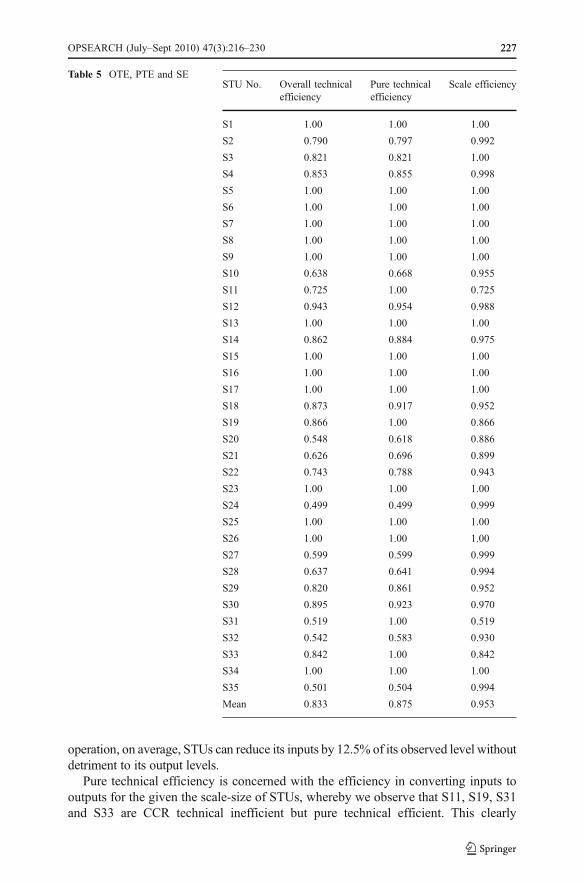
operation, on average, STUs can reduce its inputs by 12.5% of its observed level withoutdetriment to its output levels.
Pure technical efficiency is concerned with the efficiency in converting inputs tooutputs for the given the scale-size of STUs, whereby we observe that S11, S19, S31and S33 are CCR technical inefficient but pure technical efficient. This clearly
STU No. Overall technicalefficiency
Pure technicalefficiency
Scale efficiency
S1 1.00 1.00 1.00
S2 0.790 0.797 0.992
S3 0.821 0.821 1.00
S4 0.853 0.855 0.998
S5 1.00 1.00 1.00
S6 1.00 1.00 1.00
S7 1.00 1.00 1.00
S8 1.00 1.00 1.00
S9 1.00 1.00 1.00
S10 0.638 0.668 0.955
S11 0.725 1.00 0.725
S12 0.943 0.954 0.988
S13 1.00 1.00 1.00
S14 0.862 0.884 0.975
S15 1.00 1.00 1.00
S16 1.00 1.00 1.00
S17 1.00 1.00 1.00
S18 0.873 0.917 0.952
S19 0.866 1.00 0.866
S20 0.548 0.618 0.886
S21 0.626 0.696 0.899
S22 0.743 0.788 0.943
S23 1.00 1.00 1.00
S24 0.499 0.499 0.999
S25 1.00 1.00 1.00
S26 1.00 1.00 1.00
S27 0.599 0.599 0.999
S28 0.637 0.641 0.994
S29 0.820 0.861 0.952
S30 0.895 0.923 0.970
S31 0.519 1.00 0.519
S32 0.542 0.583 0.930
S33 0.842 1.00 0.842
S34 1.00 1.00 1.00
S35 0.501 0.504 0.994
Mean 0.833 0.875 0.953
Table 5 OTE, PTE and SE
OPSEARCH (July–Sept 2010) 47(3):216–230 227227
evinces that these STUs are able to convert its inputs into outputs with 100%efficiency, but their overall efficiency (OTE) is low due to their scale-sizedisadvantageous (low scale efficiency).
3.2.1 Scale efficiency (SE)
A comparison of the results for CCR and BCC gives an assessment of whether the sizeof a STU has an influence on its OTE. Scale efficiency (SE) is the ratio of OTE to PTEscores. If the value of SE score is one, then the STU is apparently operating at optimalscale. If the value is less than one, then the STU appears either small or big relative to itsoptimum scale-size. Table 5 represents the SE score of the STUs at fourth column.Results show that out of 35 STUs, 15 STUs are scale efficient while remaining 20STUs are scale inefficient. The average of scale efficiency is 0.953. It indicates that anaverage STU may be able to decrease its inputs by 4.7% beyond its best practicetargets under variable returns to scale, if it were to operate at constant returns to scale.
4 Conclusions and policy implementations
This paper measures technical efficiency (OTE) of 35 STUs in India through DEAmethodology. The study finds that 14 STUs have the maximum degree of efficiency.The overall mean TE of the STUs is 83.26%, indicating that on average 16.74% of thetechnical potential of the STUs is not in use. This implies that these STUs have the scopeof producing the same output with the inputs 16.74% lesser than their existing level. Themost efficient STUs are MZST and VPM-1 while HRTC is the most inefficient STU.
The targets setting results show that all the inputs have the significant scope to reduce.The model suggests that on average, non-frontier STUs may be able to reduce Fleet Sizeby 30%, Total Staff by 37.75%, Fuel Consumption by 2.93%, APKL by 41.24%, and toexpand BU by 19.34%, LF by 26.14%, relative to the best practice STUs.
The results of BCC model show that out of 35 STUs, 18 STUs are pure technicalefficient as they efficiently convert their inputs into the output. However, 4 STUs of themare technical inefficient due to scale-size effect. S31 has the least scale efficiency score(51.9%), implying that S31 has the maximum effect of scale-size on its efficiency score.
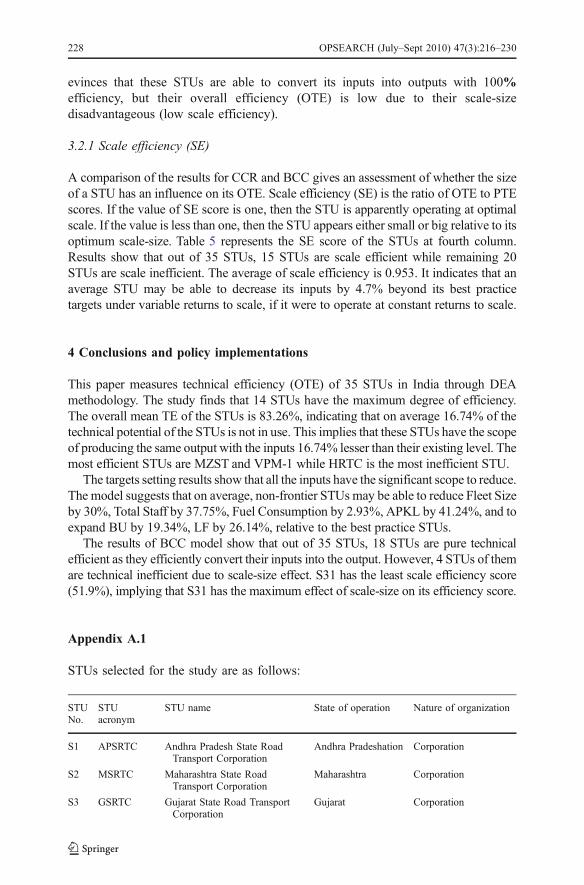
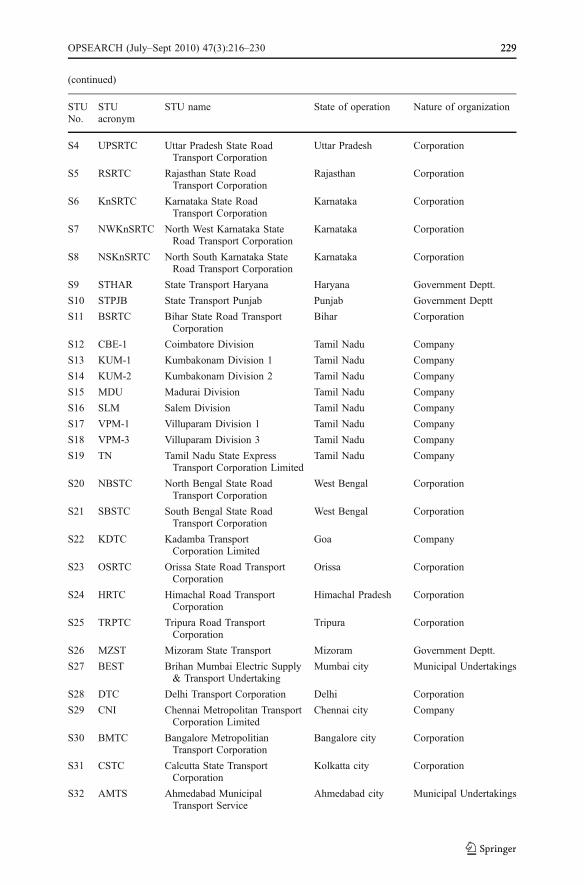
Appendix A.1
STUs selected for the study are as follows:
STUNo.
STUacronym
STU name State of operation Nature of organization
S1 APSRTC Andhra Pradesh State RoadTransport Corporation
Andhra Pradeshation Corporation
S2 MSRTC Maharashtra State RoadTransport Corporation
Maharashtra Corporation
S3 GSRTC Gujarat State Road TransportCorporation
Gujarat Corporation
228 OPSEARCH (July–Sept 2010) 47(3):216–230
(continued)
STUNo.
STUacronym
STU name State of operation Nature of organization
S4 UPSRTC Uttar Pradesh State RoadTransport Corporation
Uttar Pradesh Corporation
S5 RSRTC Rajasthan State RoadTransport Corporation
Rajasthan Corporation
S6 KnSRTC Karnataka State RoadTransport Corporation
Karnataka Corporation
S7 NWKnSRTC North West Karnataka StateRoad Transport Corporation
Karnataka Corporation
S8 NSKnSRTC North South Karnataka StateRoad Transport Corporation
Karnataka Corporation
S9 STHAR State Transport Haryana Haryana Government Deptt.
S10 STPJB State Transport Punjab Punjab Government Deptt
S11 BSRTC Bihar State Road TransportCorporation
Bihar Corporation
S12 CBE-1 Coimbatore Division Tamil Nadu Company
S13 KUM-1 Kumbakonam Division 1 Tamil Nadu Company
S14 KUM-2 Kumbakonam Division 2 Tamil Nadu Company
S15 MDU Madurai Division Tamil Nadu Company
S16 SLM Salem Division Tamil Nadu Company
S17 VPM-1 Villuparam Division 1 Tamil Nadu Company
S18 VPM-3 Villuparam Division 3 Tamil Nadu Company
S19 TN Tamil Nadu State ExpressTransport Corporation Limited
Tamil Nadu Company
S20 NBSTC North Bengal State RoadTransport Corporation
West Bengal Corporation
S21 SBSTC South Bengal State RoadTransport Corporation
West Bengal Corporation
S22 KDTC Kadamba TransportCorporation Limited
Goa Company
S23 OSRTC Orissa State Road TransportCorporation
Orissa Corporation
S24 HRTC Himachal Road TransportCorporation
Himachal Pradesh Corporation
S25 TRPTC Tripura Road TransportCorporation
Tripura Corporation
S26 MZST Mizoram State Transport Mizoram Government Deptt.
S27 BEST Brihan Mumbai Electric Supply& Transport Undertaking
Mumbai city Municipal Undertakings
S28 DTC Delhi Transport Corporation Delhi Corporation
S29 CNI Chennai Metropolitan TransportCorporation Limited
Chennai city Company
S30 BMTC Bangalore MetropolitianTransport Corporation
Bangalore city Corporation
S31 CSTC Calcutta State TransportCorporation
Kolkatta city Corporation
S32 AMTS Ahmedabad MunicipalTransport Service
Ahmedabad city Municipal Undertakings
OPSEARCH (July–Sept 2010) 47(3):216–230 229229
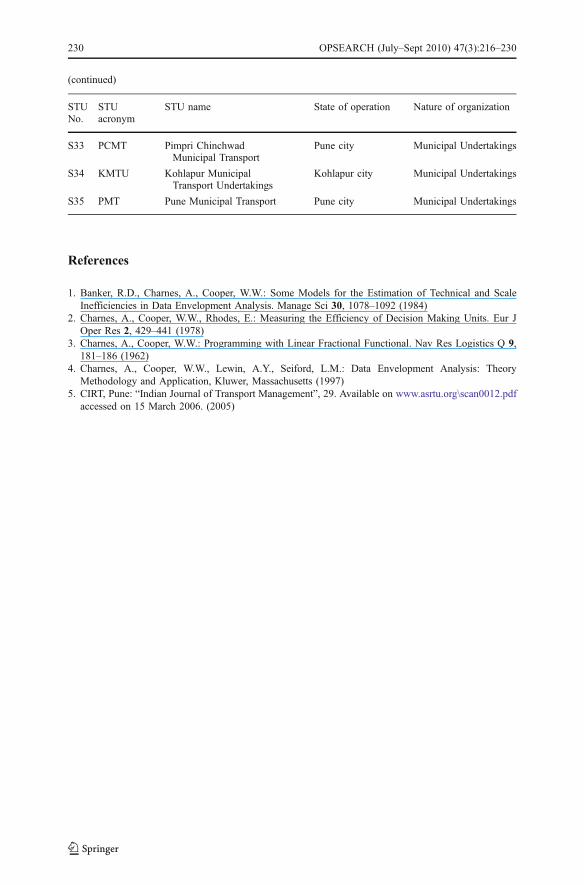
References
1. Banker, R.D., Charnes, A., Cooper, W.W.: Some Models for the Estimation of Technical and ScaleInefficiencies in Data Envelopment Analysis. Manage Sci 30, 1078–1092 (1984)
2. Charnes, A., Cooper, W.W., Rhodes, E.: Measuring the Efficiency of Decision Making Units. Eur JOper Res 2, 429–441 (1978)
3. Charnes, A., Cooper, W.W.: Programming with Linear Fractional Functional. Nav Res Logistics Q 9,181–186 (1962)
4. Charnes, A., Cooper, W.W., Lewin, A.Y., Seiford, L.M.: Data Envelopment Analysis: TheoryMethodology and Application, Kluwer, Massachusetts (1997)
5. CIRT, Pune: “Indian Journal of Transport Management”, 29. Available on www.asrtu.org\scan0012.pdfaccessed on 15 March 2006. (2005)
(continued)
STUNo.
STUacronym
STU name State of operation Nature of organization
S33 PCMT Pimpri ChinchwadMunicipal Transport
Pune city Municipal Undertakings
S34 KMTU Kohlapur MunicipalTransport Undertakings
Kohlapur city Municipal Undertakings
S35 PMT Pune Municipal Transport Pune city Municipal Undertakings
230 OPSEARCH (July–Sept 2010) 47(3):216–230
Related Documents