DE-RISKING, RENMINBI INTERNATIONALIZATION, AND REGIONAL INTEGRATION TRENDS IN AFRICAN PAYMENT FLOWS Amadou Sy and Tao Wang AFRICA GROWTH INITIATIVE WORKING PAPER 18 | SEPTEMBER 2016

Welcome message from author
This document is posted to help you gain knowledge. Please leave a comment to let me know what you think about it! Share it to your friends and learn new things together.
Transcript

DE-RISKING, RENMINBI INTERNATIONALIZATION, AND REGIONAL INTEGRATIONTRENDS IN AFRICAN PAYMENT FLOWS
Amadou Sy and Tao Wang
AFRICA GROWTH INITIATIVE
WORKING PAPER 18 | SEPTEMBER 2016

DE-RISKING, RENMINBI INTERNATIONALIZATION, AND REGIONAL INTEGRATION:TRENDS IN AFRICAN PAYMENT FLOWS 3
Amadou Sy is a senior fellow and director of the
Africa Growth Initiative at the Brookings Institution.
Tao Wang was a research intern at the Brookings
Institution.
The Africa Growth Initiative at the Brookings Institution engages in timely, high quality policy analysis with six lead-
ing African think tanks and external partners. With the help of these partners, AGI and Brookings tap into the latest
trends and data from the region, access local expertise and knowledge, and work to elevate the voice of African
scholars in policy discussions in Washington and across the globe.
The Brookings Institution is a nonprofit organization devoted to independent research and policy solutions. Its mis-
sion is to conduct high-quality, independent research and, based on that research, to provide innovative, practi-
cal recommendations for policymakers and the public. The conclusions and recommendations of any Brookings
publication are solely those of its author(s), and do not reflect the views of the Institution, its management, or its
other scholars.
Brookings recognizes that the value it provides is in its absolute commitment to quality, independence and
impact. Activities supported by its donors reflect this commitment and the analysis and recommendations are not
determined or influenced by any donation. A full list of contributors to the Brookings Institution can be found in
the Annual Report at https://www.brookings.edu/about-us/annual-report/.
Acknowledgements:
The authors would like to extend thanks to the SWIFT Institute for generously providing the payment data used in
this paper.


DE-RISKING, RENMINBI INTERNATIONALIZATION, AND REGIONAL INTEGRATION:TRENDS IN AFRICAN PAYMENT FLOWS 1
DE-RISKING, RENMINBI INTERNATIONALIZATION, AND REGIONAL INTEGRATIONTRENDS IN AFRICAN PAYMENT FLOWS
Amadou Sy and Tao Wang
INTRODUCTION AND POLICY RECOMMENDATIONS
This paper takes a close look at sub-Saharan
Africa’s (SSA) trade and payment integration with
the rest of the world as well as its regional integration.
Using a unique dataset of cross-border payments (MT
103 messages from the Society for Worldwide Interbank
Financial Telecommunication, SWIFT) as well as bilat-
eral trade data from the International Monetary Fund
(IMF) (Direction of Trade Statistics-DOTS) from 2003 to
2014, we find a number of stylized facts:
• Euro-SSA corridor: The 2008 global financial crisis has led to significantly lower payments from the eu-rozone area, suggesting that in addition to spillover effects from reduced economic activity and banks’ compliance with new financial regulations, European banks may have engaged in de-risking activities with respect to their African counterparts. Global financial regulation and the associated adjustment of global banks can, therefore, have important unintended consequences on African economies.
• U.S.-SSA corridor: The U.S. is SSA’s largest coun-terpart when it comes to payments transactions, and U.S. dollar-denominated transactions dominate payments with SSA. While many goods such as
commodities are traded in the U.S. dollar, having the U.S. as the “middle man” between African coun-tries and the rest of the world can be costly in terms of transaction costs and exposes African countries to de-risking from global banks and to the conse-quences of U.S. sanctions on third-party countries.
• China-SSA corridor: Although China has become SSA’s largest trading partner, China accounts for a negligible share of cross-border payments. Whereas China accounts for 15.8 percent of SSA’s trade with the rest of the world, 70.9 percent of this trade is denominated in U.S. dollars while the renminbi ac-counts for only 1.2 percent of Sino-African transac-tions. However, in its payment flows with SSA, China relies more than other countries on trade finance tools such as letters of credit and documentary col-lections (MT400 and MT700). Although such tools help mitigate risks for exporters, they are costly compared to other types of payments (MT104). The internationalization of the renminbi will reduce the dominance of the U.S. dollar, and efforts are under-way to gradually promote the use of the renminbi by African countries. However, it is likely that the U.S. dollar will remain used for the payments of commod-ity trade transactions.
• Intra-SSA corridor: Regional integration within SSA is increasing and has proved resilient to the 2008 financial crisis. The resilience of intra-African flows

2 GLOBAL ECONOMY AND DEVELOPMENT PROGRAM
point to increased intra-regional transactions that helped buffer the fall of transactions from the euro-zone. As discussed above, de-risking by European banks seems to have contributed to the reduced payment flows from Europe to SSA.
A number of policy recommendations follow from the
above stylized facts:
1. Global financial regulation is important for SSA, and its unintended consequences on the region such as the extent of de-risking by global banks should be assessed and managed. Stricter international financial regulation in the aftermath of the crisis was aimed at strengthening global financial stability. Increased global security concerns have also led to a tightening of anti-money laundering (AML), know your customer (KYC), and combating the financing of terrorism (CFT) regulations. However, regulatory compliance by global banks can have unintended consequences on African countries if payment flows are negatively impacted. This seems to have been the case for payments flows between the eurozone and SSA.6 The enforcement of U.S. economic and trade sanctions (by the Office of Foreign Assets Control-OFAC) can have a negative effect on pay-ments with Africa as payments to third-party coun-tries mostly transit through U.S. banks.7 African policymakers should be fully aware of current devel-opments in the global financial architecture and as-sess their consequences on domestic and regional economies. African policymakers, regulators, and supervisors, as well as financial institutions should clearly articulate the costs to their domestic econo-mies of the unintended consequences of global financial regulation and have a voice in international standards setting bodies. Exercises such as the joint World Bank-IMF Financial Sector Assessment Programs (FSAPs) could be used to provide detailed information on the impact of global financial regula-tion such as de-risking by global banks on African economies.
2. As China is SSA’s largest bilateral trading partner, the use of the renminbi as a currency of payment
between the two regions should be increased. The re-gion’s payment flows with China—its largest bilateral trade partner—are routed through correspondent or clearing U.S. banks with associated costs and risks. Although a large share of Sino-African trade includes commodities whose international prices are denomi-nated in U.S. dollars, the renminbi accounts for less than 2 percent of payments between China and SSA. This is in part due to the limited internationalization of the Chinese renminbi, which increases transaction costs and exposes Sino-African payments to global spillover financial risks (outside the two regions), ex-change risks, and the risks from economic and trade sanctions. A number of initiatives are under way to increase the use of the renminbi in Sino-African trade, including the clearing of renminbi business and the opening of individual renminbi accounts in South Africa, as well as the establishment of currency swap agreements with six African countries.8 Going for-ward, African countries should have a clear strategy on how the internationalization of the renminbi will affect their economies and how best to take advan-tage of this trend. For instance, as China reduces its imports of commodities from the region, there is an opportunity for the region to attract Chinese direct in-vestment in sectors such as manufacturing. Efficient payments between China and Africa can help facili-tate such an adjustment.
3. Regional financial integration should be encouraged as it helps support trade and investment integra-tion and increase the region’s resilience to external shocks. Regional trade integration in sub-Saharan Africa is the lowest globally and countries in the re-gion trade more with the rest of the world than with themselves. Regional integration has become a policy priority on the continent and as African coun-tries reduce non-tariff trade barriers and improve regional infrastructure, it will be important to also strengthen regional financial integration. At the mo-ment apart from the Southern African Development Community (SADC) and the West African Economic and Monetary Union (WAEMU), payments be-tween African countries have to be mostly chan-neled through banks in the U.S. and eurozone. By

DE-RISKING, RENMINBI INTERNATIONALIZATION, AND REGIONAL INTEGRATION:TRENDS IN AFRICAN PAYMENT FLOWS 3
harmonizing legal and regulatory frameworks and building regional payment systems and other fi-nancial market infrastructure, African countries can help facilitate regional trade integration. Facilitating intra-regional payments can also help support the operations of pan-African banks and corporations, and support the development of regional money and capital markets. For instance, central banks in the five East African Community (EAC) member states have recently agreed on direct convertibility of their national currencies.9 The data suggest that Nigeria can play a much more important role in terms of payment integration in the WAMZ and that there is a potential to increase integration in the Economic Community of Central African States (ECCAS).
Finally, it will be important for African countries to
consider the opportunities and challenges from the
emergence of new technology such as blockchain
technology and developments in electronic commerce.

4 GLOBAL ECONOMY AND DEVELOPMENT PROGRAM
DATA DESCRIPTION: SWIFT MT103 SINGLE CUSTOMER CREDIT TRANSFERS
Data from SWIFT provide a comprehensive source
of transaction flows as cross-border payments
are rarely routed outside of the SWIFT network. About
11,000 financial institutions in more than 200 countries
and territories around the world use SWIFT’s messag-
ing services.
We focus on a specific type of SWIFT message, the
MT103 message, which is a customer credit transfer
(for a single payment) sent by or on behalf of the finan-
cial institution of the ordering customer to the financial
institution of the beneficiary customer, instructing a
fund transfer from the ordering customer to the benefi-
ciary customer. For instance, a MT103 message would
be used when South Africa-based company “ABC”
would like to transfer $1 million for the import of goods
to a foreign company “XYZ”’s U.S. dollar account in a
U.S. bank (account “123456789”) on a specific date.
Figure 1. How an MT103 Transaction is Conducted among Participating Entities.
Paying Bank
Receiving Bank
Sender’sCorrespondent
Receiver’sCorrespondent
MT103 Customer Transfer
Source: SWIFT
It is important to note that we do not have data on the
ultimate beneficiary customer and that a payment,
for instance, from a South Africa-based company to
a Chinese company could be routed through a clear-
ing bank in the U.S. As discussed below, such flows
explain the large disconnect between trade flows and
payments flows between China and SSA.
We also focus on the number of MT103 messages
rather than their value for the following reasons. A lon-
ger time series is available for the number of messages
compared to the value of messages. Furthermore, un-
like the value of messages, the number of messages
series is independent of inflation and exchange rates
and has fewer outliers (see SWIFT for more detail).
The data cover the 2003-2014 period and all SWIFT
messages to and from sub-Saharan Africa. We also
have information on the currency denomination of the
messages for the period 2010-2014.

DE-RISKING, RENMINBI INTERNATIONALIZATION, AND REGIONAL INTEGRATION:TRENDS IN AFRICAN PAYMENT FLOWS 5
FINANCIAL FLOWS FROM SUB-SAHARAN AFRICA
SWIFT payments data are highly correlated with
trade data. The 2008 global financial crisis led to a
sharp reduction in both financial flows (plotted here as
the total number of all types of messages) and trade.
Although both types of flows recovered afterwards,
their co-movement was less pronounced. In particular,
trade (measured as the log of the value of exports and
imports using data from the IMF DOTS) slowed down
in recent years, and global MT103 messages did not
recover from their pre-crisis trend (Figure 2).
In contrast to global MT103 messages, total messages
sent from sub-Saharan Africa were resilient during the
2008 global financial crisis (Figure 3A). However, while
messages sent within SSA and from the U.S. contin-
ued to grow, messages sent from the eurozone fell and
did not recover fully. Messages sent from and to China
are low and have remained at a low level after the cri-
sis (Figure 3B).
There is an asymmetry in the effect of the 2008 finan-
cial crisis on MT103 messages sent and received from
SSA.3 Messages sent from the region did not fall in
the aftermath of the crisis and actually continued to
grow. In contrast, messages received by the region
fell except for intra-African transactions. The fall was
the most pronounced for messages received from the
eurozone, which not only fell after the financial crisis
but did not grow afterwards—while messages from the
U.S. recovered after the crisis. This trend may be ex-
plained by the more severe and more sustained impact
of the financial crisis on the eurozone economy. The
reduced external demand in the eurozone coupled with
the pull back of European banks from trade finance in
the aftermath of the crisis and other de-risking activi-
ties should also be captured by the collapse of MT103
transactions from the eurozone.
100
80
60
40
20
0
28
27.5
27
2002m1 2008m1 2010m1 2012m1 2014m12006m12004m1
Numb
er of
mes
sage
s (in
millio
ns)
Log v
alue o
f trad
e
MT103 All messages Log value of trade (RHS)ym
Figure 2. Global Financial Activity and Global Trade
Log Value of Trade (RHS) refers to the value of exports and imports from the IMF Direction of Trade Statistics (DOTS) database.

6 GLOBAL ECONOMY AND DEVELOPMENT PROGRAM
400
300
200
100
0
2002m1 2008m1 2010m1 2012m1 2014m12006m12004m1
Numb
er of
mes
sage
s sen
t (tho
usan
ds)
United StatesEurozone
ChinaOther
Sub-Saharan Africamonth
400
300
200
100
0
2002m1 2008m1 2010m1 2012m1 2014m12006m12004m1
Numb
er of
mes
sage
s rec
eived
(tho
usan
ds)
United StatesEurozone
ChinaOther
Sub-Saharan Africamonth
Figure 3A. Number of MT103 Messages: Sent from Sub-Saharan Africa
Figure 3B. Number of MT103 Messages: Sent to Sub-Saharan Africa

DE-RISKING, RENMINBI INTERNATIONALIZATION, AND REGIONAL INTEGRATION:TRENDS IN AFRICAN PAYMENT FLOWS 7
The predominance of U.S. dollar-denominated transactions
Where do financial transactions originate from and where do they go?
The U.S. dollar is by far the most-used currency in
transactions to and from SSA. MT103 messages de-
nominated in the U.S. dollar account for 37 percent
and 31 percent of messages sent to and received by
SSA, respectively. The euro is the second-most-used
currency with, respectively, 26 percent and 23 percent
of messages sent to and received by the region. In
contrast to the U.S. dollar and the euro, the share of
the Chinese renminbi is negligible at 0.21 percent and
0.01 percent of messages sent to and received by the
region (Figure 4). Some local currencies of the re-
gion including the South African rand (ZAF), the West
African CFA franc (XOF), and the Central African CFA
franc (XAF) stand among the most-used currencies
(Table 1). However, limited regional financial integra-
tion leads to a large share of intra-African to be de-
nominated in U.S. dollars.
Although China is the region’s largest bilateral trading
partner, the U.S. remains the most important destina-
tion of the region’s payments as measured by MT103
messages. The low volume of renminbi-denominated
transactions is not surprising given that its internation-
alization is limited. The structure of African trade can
also help explain the importance of the U.S. dollar as
the region relies heavily on commodity exports, which
are denominated in U.S. dollars.
Next, we compare trade flows and financial flows to
establish some useful stylized facts.
ChinaJapanSub-Saharan Africa
EuroOtherUnited States
ChinaJapanSub-Saharan Africa
EuroOtherUnited States
Figure 4. Regional Breakdown of MT103 Sent and Received by SSA (2010-2014)
MT103, Sent from SSA
MT103, Received by SSA

8 GLOBAL ECONOMY AND DEVELOPMENT PROGRAM
CurrencyMT103 Sent
by SSA
MT103 Received by SSA
USD 36.54% 30.91%EUR 26.17% 22.59%ZAR 9.38% 16.76%GBP 6.30% 5.07%XOF 2.79% 3.61%XAF 1.94% 2.33%CAD 1.93% 1.47%INR 1.84% 0.01%AUD 1.72% 1.48%KES 1.32% 3.69%JPY 1.30% 0.23%CHF 1.06% 2.22%SGD 0.55% 0.25%AED 0.54% 0.28%THB 0.52% 0.00%MUR 0.46% 1.22%NAD 0.45% 0.74%SEK 0.42% 0.39%UGX 0.41% 0.79%BWP 0.40% 0.60%HKD 0.34% 0.10%ZMW 0.28% 0.45%SAR 0.22% 0.12%NGN 0.22% 0.37%CNY 0.21% 0.01%
Note: Currencies include: USD, U.S. Dollar; EUR, Euro; ZAR, South African Rand; GBP, Great Britain Pound; XOF, West Africa Franc; XAF, Central Africa Franc; CAD, Canadian Dollar; INR, Indian Rupee, AUD, Australian Dollar; KES, Kenyan Shilling; JPY, Japanese Yen; CHF, Swiss Franc; SGD, Singapore Dollar; AED, United Arab Emirates Dirham; THB, Thai Baht; MUR, Mauritian Rupee; NAD, Namibian Dollar; SEK, Swedish Krona; UGX, Uganda Shilling; BWP, Botswanan Pula; HKD, Hong Kong Dollar; ZMW, Zimbabwean Dollar; SAR, Saudi Riyal; NGN, Nigerian Naira; CNY, Chinese RMB.
Table 1. Currency Decomposition of MT103 by SSA

DE-RISKING, RENMINBI INTERNATIONALIZATION, AND REGIONAL INTEGRATION:TRENDS IN AFRICAN PAYMENT FLOWS 9
TRADE AND PAYMENTS FLOWS
How do trade and payments compare over time?
We compare the share of trade defined as the
share of trade between SSA and a country or a
region in global trade (using data from IMF DOTS) with
the share of payments defined as the share of MT103
messages from/to SSA to/from a country or region over
the total number of global MT103 messages. There is
a high correlation between payments and trade flows.
Correlations between the two types of flows range from
0.63 to 0.74. So, in general, countries that trade more
with SSA tend to account for a larger share of the pay-
ment flows with the region.
The general pattern, however, is only part of the story.
As discussed above, the data show that the robust
growth of SSA’s trade with China has not been mir-
rored by payment transactions and the share of China
has remained negligible. Interestingly, however, a
closer look at the trade finance data shows that China
favors using risk-mitigating trade finance tools such as
letters of credit and documentary collections (MT400
and MT700) rather than the MT103 messages ana-
lyzed above. Indeed, we find that China accounts for
about 20 percent of the total of trade finance messages
between SSA and the rest of the world.4
The trade and payment relationship between China
and Africa is in sharp contrast with the U.S. where
trade with SSA has been declining over time while
financial transactions have been growing robustly. In
fact, SSA’s trade with the U.S. has declined recently
because of the fall in Nigerian oil exports to the U.S.
Indeed, American demand for Nigerian oil has been
curtailed by the increase in U.S. oil production as new
technologies such as fracking are being implemented.
The growth in financial transactions between SSA
and the U.S. can be attributed to the increase in Sino-
African trade, which is U.S. dollar-denominated and is
channeled through U.S. banks.
The data show that, unlike the U.S. and China, both
the shares of the eurozone’s trade and financial trans-
actions with SSA have fallen with a more pronounced
decline in the share of financial transactions. While
trade between the eurozone and SSA has consistently
weakened, the effect of the 2008 financial crisis has
been significant in reducing financial flows between
the two regions.
Intra-African trade and financial flows appear to have
been increasing even in the aftermath of the 2008 fi-
nancial crisis (although at a less rapid rate than trade
with China and financial flows with the U.S.). This trend
suggests the possible role of intra-regional trade and
financial flows provides additional buffers to increase
the resilience of the region.
How do trade and financial flows compare by country and by currency?
China is SSA’s largest bilateral partner and is the re-
cipient of about 15.8 percent of the region’s exports
and 16.2 percent of its trade. However, China ranks
relatively low in terms of payments flows, and it ac-
counts for only 1 percent of SSA’s messages sent.
Interestingly, most of SSA’s messages sent to China
are denominated in U.S. dollars (70.9 percent).
The U.S. accounts for 13.5 percent of SSA’s exports
but for about 42 percent of messages sent or received
by SSA. U.S. dollar-denominated transactions account
for 61.7 percent of messages between the region and
the U.S.
10 GLOBAL ECONOMY AND DEVELOPMENT PROGRAM
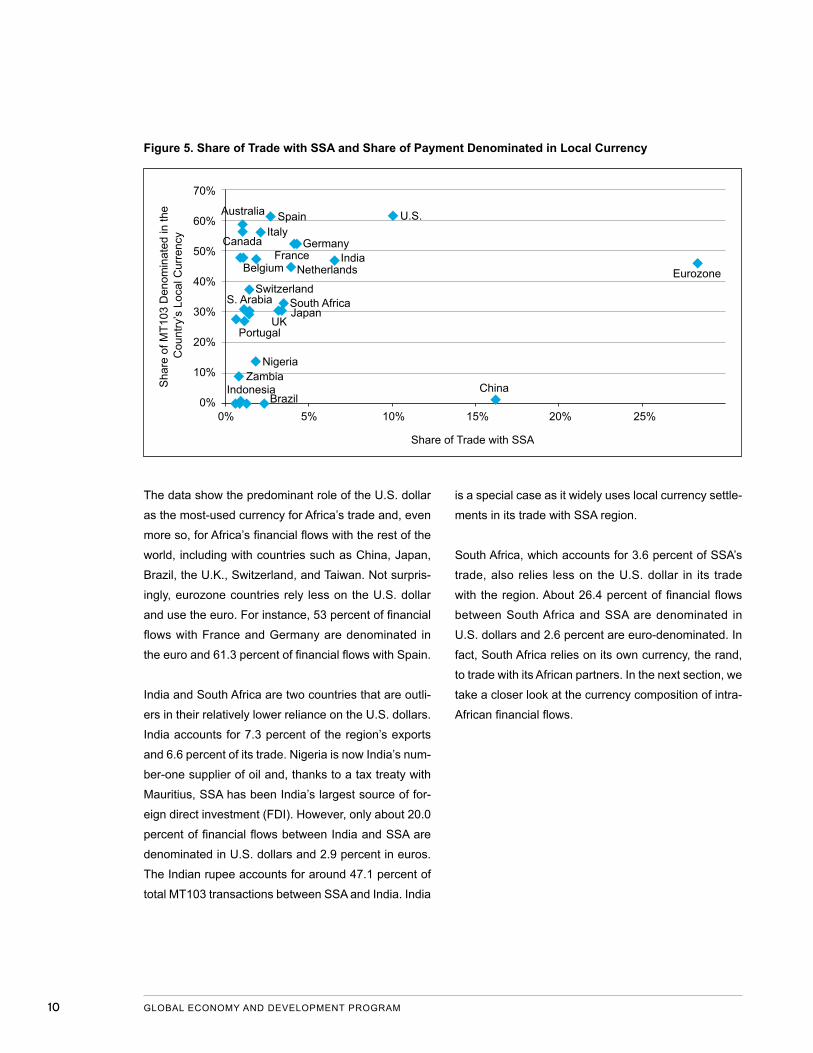
The data show the predominant role of the U.S. dollar
as the most-used currency for Africa’s trade and, even
more so, for Africa’s financial flows with the rest of the
world, including with countries such as China, Japan,
Brazil, the U.K., Switzerland, and Taiwan. Not surpris-
ingly, eurozone countries rely less on the U.S. dollar
and use the euro. For instance, 53 percent of financial
flows with France and Germany are denominated in
the euro and 61.3 percent of financial flows with Spain.
India and South Africa are two countries that are outli-
ers in their relatively lower reliance on the U.S. dollars.
India accounts for 7.3 percent of the region’s exports
and 6.6 percent of its trade. Nigeria is now India’s num-
ber-one supplier of oil and, thanks to a tax treaty with
Mauritius, SSA has been India’s largest source of for-
eign direct investment (FDI). However, only about 20.0
percent of financial flows between India and SSA are
denominated in U.S. dollars and 2.9 percent in euros.
The Indian rupee accounts for around 47.1 percent of
total MT103 transactions between SSA and India. India
is a special case as it widely uses local currency settle-
ments in its trade with SSA region.
South Africa, which accounts for 3.6 percent of SSA’s
trade, also relies less on the U.S. dollar in its trade
with the region. About 26.4 percent of financial flows
between South Africa and SSA are denominated in
U.S. dollars and 2.6 percent are euro-denominated. In
fact, South Africa relies on its own currency, the rand,
to trade with its African partners. In the next section, we
take a closer look at the currency composition of intra-
African financial flows.
70%
60%
50%
40%
30%
20%
10%
0%0% 5% 10% 15% 20% 25%
Australia Spain U.S.
CanadaItaly
GermanyFrance India
NetherlandsBelgium
SwitzerlandSouth AfricaS. ArabiaJapan
UKPortugal
NigeriaZambia
IndonesiaBrazil
China
Eurozone
Share of Trade with SSA
Sha
re o
f MT1
03 D
enom
inat
ed in
the
Cou
ntry
’s L
ocal
Cur
renc
y
Figure 5. Share of Trade with SSA and Share of Payment Denominated in Local Currency

DE-RISKING, RENMINBI INTERNATIONALIZATION, AND REGIONAL INTEGRATION:TRENDS IN AFRICAN PAYMENT FLOWS 11
Coun
terp
art C
ount
ry
Shar
e of E
xpor
ts
Shar
e of E
x+IM
Shar
e of M
T103
Sen
t
Shar
e of M
T103
Rec
eived
Shar
e of M
T103
in U
SD
Shar
e of M
T103
in E
uro
Shar
e of M
T103
in P
ound
St
erlin
g
Shar
e of M
T in
Cen
tral A
frica
CF
A Fr
anc
Shar
e of M
T in
Wes
t Afri
ca
CFA
Fran
c
Shar
e of M
T103
in S
outh
Af
rican
Ran
d
Shar
e of M
T103
in C
ount
erpa
rt Co
untry
’s Lo
cal C
urre
ncy
China 15.8% 16.2% 1.0% 0.0% 70.9% 7.2% 0.1% 0.0% 0.0% 0.1% 1.2%United States 13.5% 10.1% 42.0% 41.6% 61.7% 0.5% 0.3% 0.1% 0.7% 2.6% 61.7%India 7.3% 6.6% 1.3% 0.2% 19.9% 2.9% 0.6% 0.0% 0.0% 8.2% 47.1%Netherlands 4.5% 4.0% 0.5% 1.1% 14.5% 44.9% 1.6% 0.0% 0.0% 16.8% 44.9%Spain 4.0% 2.7% 0.3% 0.4% 12.4% 61.3% 0.5% 0.0% 0.0% 5.6% 61.3%France 3.8% 4.2% 6.2% 6.3% 18.4% 52.5% 0.9% 0.1% 0.3% 4.6% 52.5%Japan 3.6% 3.4% 0.4% 0.4% 40.6% 2.4% 0.1% 0.0% 0.0% 5.6% 30.7%Germany 3.6% 4.3% 6.4% 2.2% 21.1% 52.6% 2.1% 0.0% 0.0% 2.6% 52.6%United Kingdom 3.2% 3.2% 12.6% 7.9% 20.2% 20.4% 30.5% 0.4% 0.8% 0.8% 30.5%Brazil 3.1% 2.4% 0.1% 0.0% 74.2% 3.9% 0.1% 0.0% 0.0% 1.7% 0.0%South Africa 2.7% 3.6% 6.5% 3.2% 26.4% 2.6% 0.5% 0.0% 0.0% 33.2% 33.2%Switzerland 2.3% 1.4% 0.6% 2.1% 21.1% 12.5% 1.6% 0.0% 0.0% 5.5% 37.4%Italy 2.2% 2.2% 0.8% 0.7% 14.1% 56.4% 0.3% 0.0% 0.2% 7.3% 56.4%Taiwan 1.9% 1.3% 0.2% 0.1% 35.8% 0.9% 0.0% 0.0% 0.0% 42.8% 0.0%Belgium 1.5% 1.9% 2.3% 2.1% 21.0% 47.6% 1.8% 0.0% 0.1% 6.7% 47.6%Canada 1.5% 1.1% 0.6% 0.8% 20.2% 1.0% 0.1% 0.0% 0.0% 1.3% 56.6%Korea, Republic of 1.3% 2.3% 0.1% 0.1% 29.6% 3.4% 0.0% 0.0% 0.0% 46.6% 0.1%Australia 1.3% 1.0% 1.2% 2.7% 9.8% 0.7% 0.5% 0.0% 0.0% 5.2% 58.7%Portugal 1.3% 1.4% 3.6% 0.5% 27.9% 29.4% 9.9% 0.0% 0.0% 9.7% 29.4%Botswana 1.2% 0.6% 0.3% 2.6% 34.7% 1.4% 1.4% 0.0% 0.0% 23.6% 17.0%Zambia 1.2% 0.8% 0.2% 1.2% 47.1% 0.6% 0.3% 0.0% 0.0% 14.0% 9.0%Namibia 1.0% 0.6% 0.4% 0.2% 7.9% 0.8% 1.6% 0.0% 0.0% 31.2% 29.8%Indonesia 1.0% 1.0% 0.0% 0.0% 61.0% 16.1% 0.2% 0.0% 0.0% 0.0% 0.9%Ghana 1.0% 0.6% 0.1% 0.2% 38.3% 1.6% 0.4% 0.0% 9.1% 17.3% 10.8%Zimbabwe 0.8% 0.5% 0.3% 1.8% 45.3% 0.7% 0.8% 0.0% 0.0% 27.4% 0.0%Mozambique 0.8% 0.6% 0.1% 0.7% 38.7% 2.8% 0.1% 0.0% 0.0% 28.2% 9.7%Côte d’Ivoire 0.8% 0.9% 0.7% 1.3% 3.3% 1.5% 0.0% 4.9% 48.0% 2.0% 48.0%Malaysia 0.7% 0.9% 0.1% 0.0% 50.0% 3.8% 0.8% 0.0% 0.0% 24.5% 0.0%Nigeria 0.7% 1.8% 0.1% 0.2% 42.5% 6.2% 1.5% 0.2% 5.0% 10.7% 13.9%
Table 2. Payment Flows, Trade Flows and Dependance upon U.S. Dollars (Average over 2010-2014)

12 GLOBAL ECONOMY AND DEVELOPMENT PROGRAM
Table 3. Share of MT103 Payment Flows within the Region, by Country (2003-2014)
Coun
try
Shar
e of M
T103
Sen
t Ou
tsid
e of S
SA
Shar
e of M
T103
Re
ceive
d Ou
tsid
e of
SSA
Shar
e of M
T103
Se
nt &
Rec
eived
Ou
tsid
e of S
SA
Shar
e of M
T103
Sen
t wi
thin
SSA
Shar
e of M
T103
Re
ceive
d wi
thin
SSA
Shar
e of M
T103
Se
nt &
Rec
eived
wi
thin
SSA
South Africa 31.41% 40.18% 35.80% 14.71% 41.12% 27.92%Senegal 1.67% 3.15% 2.41% 15.04% 14.79% 14.92%Botswana 0.94% 0.76% 0.85% 13.52% 2.40% 7.96%Côte d’Ivoire 2.52% 1.29% 1.91% 4.66% 4.35% 4.50%Mali 0.53% 0.91% 0.72% 4.02% 4.30% 4.16%Zimbabwe 1.86% 1.46% 1.66% 5.71% 1.91% 3.81%Burkina Faso 0.49% 0.80% 0.64% 3.67% 3.48% 3.58%Mauritius 6.07% 5.72% 5.90% 3.98% 2.05% 3.02%Zambia 1.73% 1.55% 1.64% 4.65% 1.25% 2.95%Kenya 5.29% 8.36% 6.83% 3.09% 2.53% 2.81%Togo 0.36% 0.48% 0.42% 2.06% 2.95% 2.51%Swaziland 0.12% 0.22% 0.17% 3.63% 1.23% 2.43%Benin 0.61% 0.64% 0.62% 1.82% 2.47% 2.14%Mozambique 1.08% 1.34% 1.21% 2.85% 1.16% 2.00%Niger 0.26% 0.32% 0.29% 1.95% 1.83% 1.89%Namibia 0.74% 1.15% 0.94% 1.15% 2.37% 1.76%Lesotho 0.09% 0.11% 0.10% 1.75% 0.99% 1.37%Cameroon 1.67% 1.34% 1.51% 1.38% 1.33% 1.35%Malawi 0.64% 0.72% 0.68% 1.40% 1.17% 1.28%Tanzania 2.35% 3.10% 2.73% 1.06% 1.20% 1.13%Gabon 2.09% 0.34% 1.22% 1.51% 0.70% 1.10%Uganda 2.06% 3.06% 2.56% 0.96% 1.04% 1.00%Madagascar 1.05% 1.62% 1.34% 0.63% 0.70% 0.66%Nigeria 15.18% 3.78% 9.48% 0.79% 0.48% 0.63%

DE-RISKING, RENMINBI INTERNATIONALIZATION, AND REGIONAL INTEGRATION:TRENDS IN AFRICAN PAYMENT FLOWS 13
TRANSACTIONS WITH THE REST OF THE WORLD
W ith about 45.3 percent of total payments to-
gether, South Africa and Nigeria—the region’s
largest economies—dominate SSA’s payments with
the rest of the world. South Africa accounts for 35.8
percent of payments (share of MT103 sent and re-
ceived) far more than Nigeria, which accounts for
about 9.5 percent of payments. Other countries with
relatively high share of payments include Kenya (6.8
percent) and Mauritius (5.9 percent). As a group,
the EAC (East African Community) remains impor-
tant with more than 12.1 percent of payments (for
Kenya, Tanzania, and Uganda), more than RECs
sharing a common currency like the the West African
Economic and Monetary Union (WAEMU) (4.3 per-
cent for Senegal and Côte d’Ivoire) or the Economic
Community of Central African States (ECCAS) (2.7
percent for Cameroon and Gabon).

14 GLOBAL ECONOMY AND DEVELOPMENT PROGRAM
INTRA-AFRICAN FINANCIAL FLOWS
Regional integration is one of the key priorities for
African policymakers.5 Non-tariff barriers such as
delays along regional transit routes and rent-seeking
activities at border crossings substantially limit cross-
border trade in Africa, and efforts to reduce them
should be accelerated. However, trade integration still
faces another type of obstacle in the form of transac-
tion costs for cross-border payments. Although often
overlooked, stronger financial integration can help
facilitate further regional trade and investment integra-
tion not only through lower transaction costs but also
through lower costs of finance to businesses.
The currency denomination of financial flows to and
from SSA shows that the South African rand (ZAF) and
the CFA franc (XOF for the WAEMU and XAF for the
ECCAS) are the most-used currencies after the U.S.
dollar and the euro.
The data give a good idea of a country’s integration with
the rest of the region in terms of cross-border payments.
Indeed, most intra-regional payment flows are denomi-
nated in the South African rand and occur among the
four member countries of the Common Monetary Area
(CMA) and the 15 member countries of the SADC on
the one hand and among the eight member countries
in the CFA franc zone in West Africa (WAEMU) and to
some extent the six countries using the CFA franc in
Central Africa (ECCAS) on the other.
In particular, the data indicate that South Africa is the
main locus of financial flows in SSA and other coun-
tries in southern Africa such as Botswana, Zimbabwe,
Zambia, Mauritius, Swaziland, Namibia, and Lesotho
are also important. In West Africa, Senegal and Côte
d’Ivoire are the most important sources and recipients
of intra-African flows in West Africa, along with other
CFA franc countries such as Mali, Burkina Faso, Togo,
Benin, and Niger. Central African countries that also use
the CFA franc such as Cameroon and Gabon are also
important. Interestingly, intra-African flows from East
African countries except for Kenya are relatively low.
Kenya has a relatively large banking sector and is a re-
gional financial center, so it is not surprising that it is the
destination or origin of intra-East African financial flows.
With less than 5 percent of intra-regional payment
flows, it is surprising that Nigeria, the largest economy
in SSA and with a sizable banking sector, does not ap-
pear in the list of top recipients and originators of pay-
ment flows within the region. One explanation could
be that Nigeria’s trade (it is the region’s largest oil
exporter) is mostly oriented towards countries outside
Africa. Nigeria’s share of MT103 transaction with rest
of the world outside of SSA turns out to be around 10
percent of the whole region, which is the second-larg-
est share after South Africa. However, this explanation
is not fully convincing. In fact, trade data indicates that
at 16.8 percent, Nigeria has the largest share of intra-
regional trade behind South Africa, which accounts
for 36.8 percent. In spite of being a more important
regional trade partner than Gabon (which is also an oil
exporter), Nigeria accounts for about the same share
of intra-regional financial flows.
A more plausible explanation for the asymmetry be-
tween the trade activity and payment activity via SWIFT
is that, unlike Gabon, Nigeria is less formally finan-
cially integrated with the rest of SSA. In contrast to the
Nigerian naira, the CFA franc used in Gabon (XAF) is
shared with the five other countries of the ECCAS and
is fully convertible with the CFA franc used in the eight
WAEMU countries (XOF). It is also pegged to the euro
under the purview of one regional central bank (BEAC).

DE-RISKING, RENMINBI INTERNATIONALIZATION, AND REGIONAL INTEGRATION:TRENDS IN AFRICAN PAYMENT FLOWS 15
Table 4. Trade Flows and Financial Flows, within SSA Region
Country Share of Exports Share of EX+IM
Share of MT103 Sent to the Rest of the
Region
Share of the MT103 Received from the
Region South Africa 36.85% 33.23% 37.41% 42.17%Nigeria 16.84% 14.98% 4.89% 4.42%Côte d’Ivoire 16.10% 13.62% 9.58% 4.12%Senegal 15.06% 13.38% 28.28% 35.26%Cameroon 14.75% 13.13% 20.76% 17.58%Kenya 13.19% 14.40% 10.34% 12.62%Zambia 10.47% 8.35% 1.36% 1.02%Angola 7.45% 4.79% 5.59% 1.01%Zimbabwe 6.95% 9.22% 3.73% 1.42%Mauritius 5.98% 6.76% 11.74% 6.37%Gabon 4.55% 7.00% 5.76% 4.14%Tanzania 4.41% 5.75% 1.07% 4.31%Mozambique 4.29% 4.20% 1.33% 0.84%Togo 4.16% 3.62% 2.22% 3.87%Uganda 4.16% 5.81% 1.75% 2.24%Congo 2.88% 3.12% 3.34% 2.67%Madagascar 2.76% 4.31% 2.97% 4.41%
Ghana 2.43% 4.11% 3.48% 4.24%Chad 2.01% 3.65% 2.62% 2.23%

16 GLOBAL ECONOMY AND DEVELOPMENT PROGRAM
INTRA-REGIONAL ECONOMIC COMMUNITIES FINANCIAL FLOWS
We next focus on payment flows between re-
gional economic communities and the rest of
the region. We focus on relatively financially inte-
grated RECs such as the SADC where the rand is a
key currency or the WAEMU and the ECCAS where
the CFA franc is the common currency as well as the
EAC, which is stepping up its integration effort and the
WAMZ, which includes Nigeria and is less financially
integrated.
The data show the predominant role played by the
SADC and the WAEMU as locus of financial flows to
the rest of SSA (Figure 6 and Table 5). Interestingly, the
EAC, thanks to its integration efforts such as the inte-
gration of its payment systems, is playing a larger role
than the ECCAS, which has a common currency. While
some EAC countries (such as Kenya) have a relatively
diversified export structure, the ECCAS is dominated
by oil exporters. Thus, the uniformity in the trade struc-
ture of the ECCAS may reduce its intra-regional trade.
However, a lesson from comparing the ECCAS with
the EAC could be that the constraints to financial in-
tegration from not having a common currency can be
Figure 6. MT103 Sent Within SSA, 2013
ECCASSADCWAMZ
EACWAEMU
A. With the Rest of the Region
Country Group within the Region
Share of Trade
Share of MT Sent
Share of MT
Received
Share of MT in
USD
Share of MT in
EURShare of
MT in XAF Share of
MT in XOFShare of
MT in ZARECCAS 10.91% 2.48% 0.90% 3.88% 2.43% 22.26% 45.06% 5.49%EAC 5.62% 11.60% 9.12% 28.42% 1.81% 0.00% 0.24% 23.73%SADC 6.65% 7.89% 11.24% 24.86% 2.91% 0.01% 0.02% 29.32%WAEMU 0.91% 0.10% 0.04% 5.47% 5.83% 11.38% 38.51% 2.15%WAMZ 5.30% 3.09% 2.71% 22.92% 5.05% 0.17% 13.86% 19.05%
B. Within the Economic Community
Regional Group within the Region
Share of Trade
Share of MT Sent
Share of MT
Received
Share of MT in
USD
Share of MT in
EURShare of
MT in XAF Share of
MT in XOFShare of
MT in ZARECCAS 2.65% 9.86% 10.03% 0.01% 0.02% 79.80% 0.02% 0.01%EAC 12.52% 10.40% 10.50% 41.24% 0.39% 0.00% 0.00% 0.45%SADC 47.31% 15.14% 15.35% 29.89% 4.23% 0.00% 0.00% 28.57%WAEMU 8.03% 38.85% 39.50% 0.01% 0.03% 0.00% 77.84% 0.00%WAMZ 0.09% 0.59% 0.60% 73.18% 2.67% 0.00% 0.01% 0.01%
Table 5. Payment Flows, Trade Flows and Transaction Currency – Within and Between Regional Economic Zones

DE-RISKING, RENMINBI INTERNATIONALIZATION, AND REGIONAL INTEGRATION:TRENDS IN AFRICAN PAYMENT FLOWS 17
alleviated by efforts to integrate the regional payment
system.
The data, however, show that for RECs with a com-
mon currency such as the WAEMU and the ECCAS,
intra-REC payments are dominated by the common
currency. For instance, about 65 percent of payment
flows in the ECCAS and 63.5 percent in the WAEMU
are denominated in that REC’s common currency, the
CFA franc, whereas the SADC and the EAC rely more
on the U.S. dollar with 29.1 percent and 35.4 percent,
respectively. The WAMZ, which includes Nigeria, is the
least integrated with 41.5 percent of transactions in
U.S. dollars rather than a regional currency.

18 GLOBAL ECONOMY AND DEVELOPMENT PROGRAM
CONCLUSION
Using a unique dataset of cross-border pay-
ments from the Society for Worldwide Interbank
Financial Telecommunication (SWIFT) as well as
bilateral trade data from the IMF (Direction of Trade
Statistics-DOTS) from 2010 to 2014, we find a number
of stylized facts when looking at the payment and trade
corridors with SSA:
• Payment flows from the eurozone to sub-Saharan Africa (SSA) fell sharply in the aftermath of the 2008 global financial crisis and did not recover. Reduced economic activity in the eurozone and banks’ com-pliance with new global financial regulations such as Basel III can help explain this severe drop. In addi-tion, the data appear to give some support to anec-dotal and survey evidence of de-risking activities by European banks following the 2008 global financial crisis. De-risking—terminating or restricting busi-ness relationships with clients to avoid rather than manage risk—is associated with the reduction in correspondent banking relationships (CBR), which should also be captured by the sharp and persistent reduction in payments from Europe to the region.
• Bilateral trade flows with sub-Saharan Africa follow a different route than payment flows with the region. U.S. dollar-denominated transactions dominate payments between SSA and the rest of the world and U.S. banks dominate payment relationships with SSA. This is also the case for the payment of intra-African trade. Whereas China is the region’s most important bilateral trading partner, very little of its payments with African countries go through Chinese banks or are denominated in Chinese renminbi. These payments may instead go through U.S. dollar payments through U.S. banks. However, the paper finds evidence that payments between Africa and China rely more on risk mitigating trade finance instruments (such as letters of credit and documentary collections, MT400 and MT700 mes-sages) compared to payments between Africa and other regions.
• Regional integration—measured by payment flows between African countries—is increasing and has proved resilient to the 2008 financial crisis. Increased intra-regional trade has been supported and facilitated by improvements in regional finan-cial infrastructure. Within the region, payment flows with the Southern African Development Community (SADC) dominate while within regional economic communities (RECs), payments within the West African Economic and Monetary Union (WAEMU) are the highest and are denominated in its common currency, the CFA franc (XOF).
The data indicate a clear divergence between African
trade and payment corridors, which entail a number of
costs and risks for the region. As Africa relies heavily
on commodity exports typically priced in U.S. dollars,
it is not surprising that the U.S. currency plays such a
central role in African payment flows.1 However, chan-
neling most of African payments through U.S. and eu-
rozone banks entails costs such as higher transaction
costs or longer processing times and exposure to spill-
over effects from advanced economies. Channeling
African payments mainly for the settlement of trade
flows through banks in the U.S. and the eurozone
opens a channel for the transmission of global finan-
cial crises to Africa even in the absence of financial
linkages. A related risk for Africa is the possibility of
having payment channels closed when the ultimate
beneficiary resides in a country that is under U.S. or
European sanctions.
Our findings confirm previous results from Chilosi et
al. (2013) that current payments flows do not reflect
the magnitude of commercial flows between Africa
and Asia; that the U.S. dollar prevails as the dominant
trade currency and the euro is rarely used for transac-
tions with clients that are not based in the eurozone;
and that the relative importance of U.S. dollar clearing
banks has increased over time. 2

DE-RISKING, RENMINBI INTERNATIONALIZATION, AND REGIONAL INTEGRATION:TRENDS IN AFRICAN PAYMENT FLOWS 19
Based on the above stylized facts, the paper offers
a number of policy recommendations to (i) monitor
and assess the unintended consequences of global
financial regulation—such as de-risking by global
banks—on African economies; (ii) increase the use of
the renminbi in Sino-African trade and prepare African
economies for the internationalization of the renminbi;
and (iii) increase regional integration through improve-
ments in the payment systems, especially in the West
African Monetary Zone (WAMZ) where increased pay-
ment flows with Nigeria are relatively limited and in
the Economic Community of Central African States
(ECCAS).
Legal Notice
Data relating to SWIFT messaging flows is pub-
lished with permission of S.W.I.F.T. SCRL. SWIFT
© 2016. All rights reserved.
Because financial institutions have multiple
means to exchange information about their finan-
cial transactions, SWIFT statistics on financial
flows do not represent complete market or indus-
try statistics.
SWIFT disclaims all liability for any decisions
based, in full or in part, on SWIFT statistics, and
for their consequences.

20 GLOBAL ECONOMY AND DEVELOPMENT PROGRAM
ENDNOTES1. For the role of the U.S. dollar as an invoicing cur-
rency in international trade, please see Gopinath, Gita. “The International Price System” No. w21646. National Bureau of Economic Research, 2015.
2. Chilosi Thierry, Damien Dugauquier, Geraldinde Lambe, and Michimaru Onizuka. 2013, “Afri-can Payments: Insights into African Transaction Flows,” SWIFT White Paper
3. There is also an asymmetry in the volume of MT103 transactions as messages sent from SSA are higher than messages received by the region. It is difficult to say whether the asymmetry in the type of MT103 messages to and from SSA is driv-en by the region’s trade balance with the rest of the world. SSA ran a trade surplus with the rest of the world during 2004-2008 and a trade deficit afterwards. In surplus years, eight countries drove the region’s trade surplus. In addition, SSA ran a surplus in goods trade and a deficit in service trade throughout the 2000s.
4. For a detailed discussion on trade finance using SWIFT data, see Niepmann, Friederike, and Tim Schmidt-Eisenlohr (2014), “International Trade, Risk, and the Role of Banks,” Federal Reserve Bank of New York Staff Report No. 633, November. https://www.newyorkfed.org/medialibrary/media/research/staff_reports/sr633.pdf. They clarify that, in a letter of credit, the importer’s bank guarantees payment to an exporter upon proof that the goods were delivered to the importer. A documentary col-lection consists of ownership documents that are forwarded by the exporter’s bank to the importer’s bank; the importer receives the documentary col-lection only upon payment. Whenever a bank in an importing country issues a letter of credit, it sends a MT700 message to the bank in the exporting country; when it releases a payment related to a documentary collection, it sends an MT400 mes-sage to the exporting country.
5. See for instance the Common African Position (CAP) on the Post-2015 Development Agenda http://www.uneca.org/sites/default/files/upload-ed-documents/Macroeconomy/post2015/cap-post2015_en.pdf
6. See also “Withdrawal from Correspondent Bank-ing: Where, Why, and What to Do About it,” World Bank, 2015 http://documents.worldbank.org/cu-rated/en/2015/11/25481335/withdraw-correspon-dent-banking which uses survey data for 11 Afri-can banks.
7. For instance, in 2015, a large global bank was sentenced by a U.S. judge to forfeit $8.3 billion and pay a $140 million fine for violating sanctions against Sudan, Cuba, and Iran.
8. See comments on China’s Africa strategy and the 2015 Forum on China-Africa Cooperation http://english-saceta.people.cn/a/Sino-SA_Rela-tions/2016/0201/210.html
9. See James Anyanzwa, The East African, 30 July 2016 http://www.theeastafrican.co.ke/news/EAC--is-a-single-currency-on-the-way-/2558-3323198-item-0-wtngr9z/index.html


The views expressed in this working paper do not necessarily reflect the official position of Brookings, its board or the advisory council members.
ISSN: 2166-5184 (online) | 2166-5176 (print)
© 2016 The Brookings Institution
Cover photos courtesy of (left to right): Trevor Samson / World Bank, Hansjoerg Richter, John Hogg / World Bank, Andrew Martin Green, Lorenzo Codacci, Eric Miller / World Bank, Ami Vitale / World Bank

1775 Massachusetts Avenue, NW Washington, DC 20036 202-797-6000 www.brookings.edu/global
Related Documents