De Novo Transcriptome Sequencing Analysis and Comparison of Differentially Expressed Genes (DEGs) in Macrobrachium rosenbergii in China Hai Nguyen Thanh 1,2. , Liangjie Zhao 1. , Qigen Liu 1 * 1 Key Laboratory of Freshwater Fishery Germplasm Resources, Shanghai Ocean University, Ministry of Agriculture, Shanghai City, P. R. China, 2 Vietnam Institute of Fisheries Economics and Planning, Directorate of Fisheries, Ministry of Agriculture and Rural Development of Viet Nam, Hanoi City, S.R. Vietnam Abstract Giant freshwater prawn (GFP; Macrobrachium rosenbergii) is an exotic species that was introduced into China in 1976 and thereafter it became a major species in freshwater aquaculture. However the gene discovery in this species has been limited to small-scale data collection in China. We used the next generation sequencing technology for the experiment; the transcriptome was sequenced of samples of hepatopancreas organ in individuals from 4 GFP groups (A1, A2, B1 and B2). De novo transcriptome sequencing generated 66,953 isogenes. Using BLASTX to search the Non-redundant (NR), Search Tool for the Retrieval of Interacting Genes (STRING), and Kyoto Encyclopedia of Genes and Genome (KEGG) databases; 21,224 unigenes were annotated, 9,552 matched unigenes with the Gene Ontology (GO) classification; 5,782 matched unigenes in 25 categories of Clusters of Orthologous Groups of proteins (COG) and 20,859 unigenes were consequently assigned to 312 KEGG pathways. Between the A and B groups 147 differentially expressed genes (DEGs) were identified; between the A1 and A2 groups 6,860 DEGs were identified and between the B1 and B2 groups 5,229 DEGs were identified. After enrichment, the A and B groups identified 38 DEGs, but none of them were significantly enriched. The A1 and A2 groups identified 21,856 DEGs in three main categories based on functional groups: biological process, cellular_component and molecular function and the KEGG pathway defined 2,459 genes had a KEGG Ortholog - ID (KO-ID) and could be categorized into 251 pathways, of those, 9 pathways were significantly enriched. The B1 and B2 groups identified 5,940 DEGs in three main categories based on functional groups: biological process, cellular_component and molecular function, and the KEGG pathway defined 1,543 genes had a KO-ID and could be categorized into 240 pathways, of those, 2 pathways were significantly enriched. We investigated 99 queries (GO) which related to growth of GFP in 4 groups. After enrichment we identified 23 DEGs and 1 KEGG PATHWAY ‘ko04711’ relation with GFP growth. Citation: Nguyen Thanh H, Zhao L, Liu Q (2014) De Novo Transcriptome Sequencing Analysis and Comparison of Differentially Expressed Genes (DEGs) in Macrobrachium rosenbergii in China. PLoS ONE 9(10): e109656. doi:10.1371/journal.pone.0109656 Editor: Silvana Allodi, Federal University of Rio de Janeiro, Brazil Received May 12, 2014; Accepted August 22, 2014; Published October 20, 2014 Copyright: ß 2014 Nguyen Thanh et al. This is an open-access article distributed under the terms of the Creative Commons Attribution License, which permits unrestricted use, distribution, and reproduction in any medium, provided the original author and source are credited. Data Availability: The authors confirm that all data underlying the findings are fully available without restriction. Illumina sequencing data from Macrobrachium rosenbergii hepatopancreas were deposited to NCBI SRA database under accession number of SRP045800. Funding: This study was supported by Special Fund for Agro-scientific Research in the Public Interest, State Agriculture Ministry of China (201203083), by Shanghai University Knowledge Service Platform Project (ZF1206) and by Shanghai Universities First-class Disciplines Project of Fisheries. The funders had no role in study design, data collection and analysis, decision to publish, or preparation of the manuscript. Competing Interests: The authors have declared that no competing interests exist. * Email: [email protected] . These authors contributed equally to this work. Introduction The GFP is one of the two most popularly cultured freshwater species in China that belong to genus Macrobrachium. Recent reports indicate that average world annual GFP production has surpassed 500,000 tons annually with a value of US$ 2.5 billion and that the culture industry for GFP now exceeds US$ 1.4 billion per year in Asia alone [1–3]. As a consequence, there is growing interest in GFP culture, particularly in Asia [4,5]. To increase productivity of farmed GFP there is a need to better understand the basic biology, ecology and production traits of this species to allow development of more productive culture strains for the expanding global industry. China is a country with no natural distribution of GFP, thus it has had to be introduced from tropical and subtropical countries since 1976 [6]. Due to its high value, researchers now focus on improving the growth performance of farmed GFP [4,7–10]. It is now the major species in aquaculture and the culture areas have expanded continuously for more than 3 decades. The total GFP aquaculture production of China is the largest in the world for many years with total annual production of 127.788 tons in 2008 [3]. In addition, the GFP aquaculture industry has also increased jobs and provides food for people. However, GFP aquaculture industry of China faces many problems such as disease, pollution, and undeveloped technology. Consequently, cultured GFP grow slowly in some areas, the time for one crop is prolonged, and the harvest size varies greatly, which has reduced the benefit to farmers recently. Biotechnology has been developing rapidly and many research- ers have applied this new technology to study diseases and their treatments, nutrition, environment interactions and genetic diversity of aquaculture species, including GFP. Although GFP PLOS ONE | www.plosone.org 1 October 2014 | Volume 9 | Issue 10 | e109656

Welcome message from author
This document is posted to help you gain knowledge. Please leave a comment to let me know what you think about it! Share it to your friends and learn new things together.
Transcript

De Novo Transcriptome Sequencing Analysis andComparison of Differentially Expressed Genes (DEGs) inMacrobrachium rosenbergii in ChinaHai Nguyen Thanh1,2., Liangjie Zhao1., Qigen Liu1*
1 Key Laboratory of Freshwater Fishery Germplasm Resources, Shanghai Ocean University, Ministry of Agriculture, Shanghai City, P. R. China, 2 Vietnam Institute of
Fisheries Economics and Planning, Directorate of Fisheries, Ministry of Agriculture and Rural Development of Viet Nam, Hanoi City, S.R. Vietnam
Abstract
Giant freshwater prawn (GFP; Macrobrachium rosenbergii) is an exotic species that was introduced into China in 1976 andthereafter it became a major species in freshwater aquaculture. However the gene discovery in this species has been limitedto small-scale data collection in China. We used the next generation sequencing technology for the experiment; thetranscriptome was sequenced of samples of hepatopancreas organ in individuals from 4 GFP groups (A1, A2, B1 and B2). Denovo transcriptome sequencing generated 66,953 isogenes. Using BLASTX to search the Non-redundant (NR), Search Toolfor the Retrieval of Interacting Genes (STRING), and Kyoto Encyclopedia of Genes and Genome (KEGG) databases; 21,224unigenes were annotated, 9,552 matched unigenes with the Gene Ontology (GO) classification; 5,782 matched unigenes in25 categories of Clusters of Orthologous Groups of proteins (COG) and 20,859 unigenes were consequently assigned to 312KEGG pathways. Between the A and B groups 147 differentially expressed genes (DEGs) were identified; between the A1 andA2 groups 6,860 DEGs were identified and between the B1 and B2 groups 5,229 DEGs were identified. After enrichment, theA and B groups identified 38 DEGs, but none of them were significantly enriched. The A1 and A2 groups identified 21,856DEGs in three main categories based on functional groups: biological process, cellular_component and molecular functionand the KEGG pathway defined 2,459 genes had a KEGG Ortholog - ID (KO-ID) and could be categorized into 251 pathways,of those, 9 pathways were significantly enriched. The B1 and B2 groups identified 5,940 DEGs in three main categoriesbased on functional groups: biological process, cellular_component and molecular function, and the KEGG pathway defined1,543 genes had a KO-ID and could be categorized into 240 pathways, of those, 2 pathways were significantly enriched. Weinvestigated 99 queries (GO) which related to growth of GFP in 4 groups. After enrichment we identified 23 DEGs and 1KEGG PATHWAY ‘ko04711’ relation with GFP growth.
Citation: Nguyen Thanh H, Zhao L, Liu Q (2014) De Novo Transcriptome Sequencing Analysis and Comparison of Differentially Expressed Genes (DEGs) inMacrobrachium rosenbergii in China. PLoS ONE 9(10): e109656. doi:10.1371/journal.pone.0109656
Editor: Silvana Allodi, Federal University of Rio de Janeiro, Brazil
Received May 12, 2014; Accepted August 22, 2014; Published October 20, 2014
Copyright: � 2014 Nguyen Thanh et al. This is an open-access article distributed under the terms of the Creative Commons Attribution License, which permitsunrestricted use, distribution, and reproduction in any medium, provided the original author and source are credited.
Data Availability: The authors confirm that all data underlying the findings are fully available without restriction. Illumina sequencing data from Macrobrachiumrosenbergii hepatopancreas were deposited to NCBI SRA database under accession number of SRP045800.
Funding: This study was supported by Special Fund for Agro-scientific Research in the Public Interest, State Agriculture Ministry of China (201203083), byShanghai University Knowledge Service Platform Project (ZF1206) and by Shanghai Universities First-class Disciplines Project of Fisheries. The funders had no rolein study design, data collection and analysis, decision to publish, or preparation of the manuscript.
Competing Interests: The authors have declared that no competing interests exist.
* Email: [email protected]
. These authors contributed equally to this work.
Introduction
The GFP is one of the two most popularly cultured freshwater
species in China that belong to genus Macrobrachium. Recent
reports indicate that average world annual GFP production has
surpassed 500,000 tons annually with a value of US$ 2.5 billion
and that the culture industry for GFP now exceeds US$ 1.4 billion
per year in Asia alone [1–3]. As a consequence, there is growing
interest in GFP culture, particularly in Asia [4,5]. To increase
productivity of farmed GFP there is a need to better understand
the basic biology, ecology and production traits of this species to
allow development of more productive culture strains for the
expanding global industry.
China is a country with no natural distribution of GFP, thus it
has had to be introduced from tropical and subtropical countries
since 1976 [6]. Due to its high value, researchers now focus on
improving the growth performance of farmed GFP [4,7–10]. It is
now the major species in aquaculture and the culture areas have
expanded continuously for more than 3 decades. The total GFP
aquaculture production of China is the largest in the world for
many years with total annual production of 127.788 tons in 2008
[3]. In addition, the GFP aquaculture industry has also increased
jobs and provides food for people. However, GFP aquaculture
industry of China faces many problems such as disease, pollution,
and undeveloped technology. Consequently, cultured GFP grow
slowly in some areas, the time for one crop is prolonged, and the
harvest size varies greatly, which has reduced the benefit to
farmers recently.
Biotechnology has been developing rapidly and many research-
ers have applied this new technology to study diseases and their
treatments, nutrition, environment interactions and genetic
diversity of aquaculture species, including GFP. Although GFP
PLOS ONE | www.plosone.org 1 October 2014 | Volume 9 | Issue 10 | e109656
is an important species for aquaculture, no complete genome of
GFP in China exists to support scientists who research GFP
growth in culture, disease prevention, nutrition, conservation, and
other fields. Identifying the genes that affect phenotypic variation
and important production traits is a very difficult and challenging
task especially when only limited deoxyribonucleic acid (DNA)
sequence information is published. A lack of basic information
about the genome of GFP can be a major obstacle when
developing improved aquaculture practices for production indus-
tries.
Techniques for molecular research have changed dramatically
in recent years and the Next Generation Sequencing (NGS)
technologies are currently the most important method for
investigating the genomes of organisms, including aquatic animals.
In general, NGS can be separated into three methods: 1) the
Roche (454) Genome Sequencer FLX System based on sequenc-
ing-by-synthesis (pyrosequecing) technology was developed by 454
Life Sciences, as the first NGS platform available on the market
[11]; 2) the Illumina (Solexa) Genome Analyzer sequencing
platform was commercialized in 2006, based also on the principle
of sequencing-by-synthesis chemistry; and 3) the Applied Biosys-
tems SOLiD System, which is based on a sequencing-by-ligation
technology. This platform has its origins in the system described by
Shendure et al. (2005) [12] and in work by McKernan et al. (2006)
[13] at Agencourt Personal Genomics (acquired by Applied
Biosystems in 2006).
Some research on the genome of GFP has already been done.
Jung et al. (2011) [14] used Roche 454 Genome Sequencing FLX
technology to characterize the transcriptome of GFP using cDNA
prepared from mRNA isolated from muscle, ovary and testes
tissue. Maizatul et al. (2013) [15] used transcriptome sequencing of
three tissue types: hepatopancreas, gill and muscle to generate
functional genomics data for GFP at a massive scale.
In this study we collected GFP samples in Zhejiang province of
China, because Zhejiang is a major production area of cultured
GFP. Among the sequencing technologies, Illumina HiSeq 2500
has become the production platform of choice for all major
genome centers and institutes around the world [16] because it has
the biggest output, lowest reagent cost. We used this technology for
de novo transcriptome sequencing analysis in order to provide
functional annotation and classification and measure gene
expression differences among four groups of GFP. This genetic
information will support further research into this important
species.
Materials and Methods
2.1. SpecimensThe GFP samples of this study were collected from two private
prawn farms in Haiyan County, Zhejiang Province, China (This
study did not involve in endangered or protected species; and no
specific permissions were required for the animal experiments).
Samples from each farm were further separated into two groups
based on sizes, one was small and the other was big. That is, from
Farm 1, we got samples of A1 and A2 groups (Owner of the farm
1: Mr. Guanxiang Ye; address: New village, Wuyuan Street,
Haiyan county, Zhejiang province, China. Position: 30u30925.870
N; 120u54950.300E) and from Farm 2, we got samples of B1 and
B2 groups (Owner of the farm 2: Mr. Sannan Bao, address: Daliu
village, Wuyuan Street, Haiyan County, Zhejiang Province,
China. Position: 30u32932.540 N; 120u54928.490E); the owner
had agreed to let us collect the prawn samples for experiment. The
GFP have been cultured for the same period of time and we
extracted hepatopancreas from live GFP. Hepatopancreas is the
major organ for metabolism and plays a vital role in the synthesis
of digestive enzymes, and in secretion, nutrient absorption,
digestion, excretion, reserve storage, mobilization [17,18] and it
is considered to be an important organ affecting crustacean growth
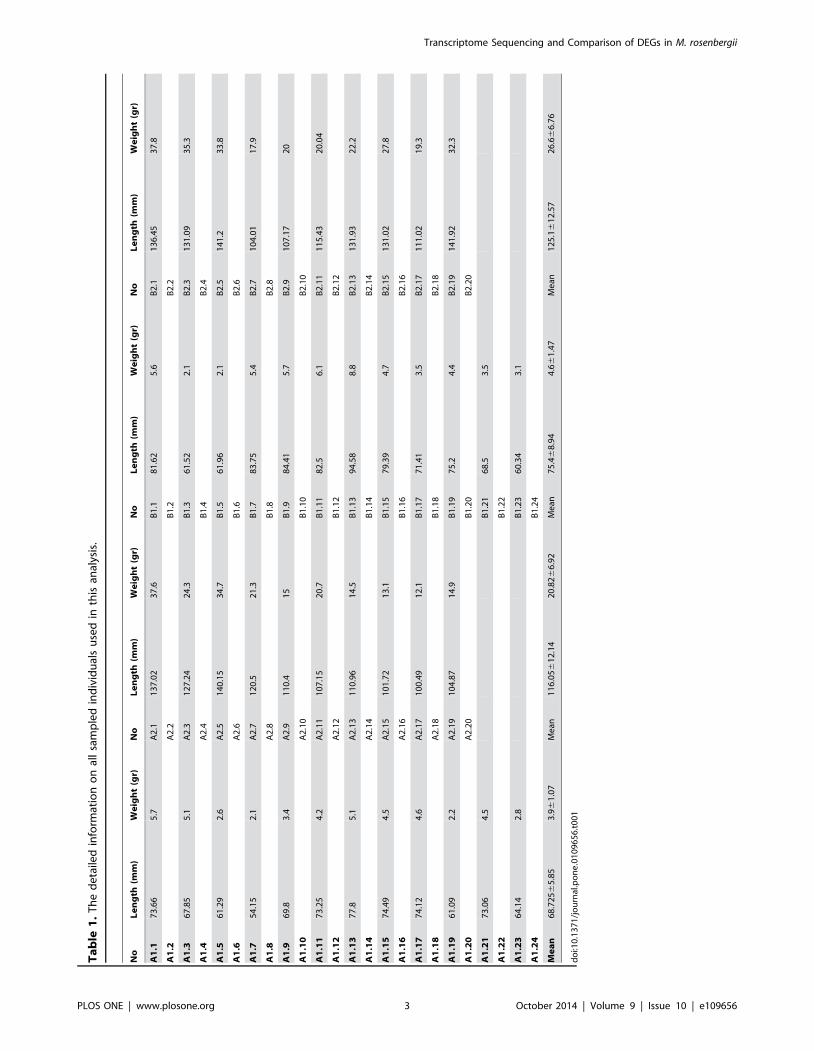
[19–22]. At the first location sampled, we collected 24 samples for
small size from 12 individuals (two samples of hepatopancreas per
individual) and each sample was marked A1.1 to A1.24. The small
GFP were measured with mean of length 68.7565.85 cm and
weight of 3.961.07 g. From the big GFP we collected 20 samples
from 10 individuals and each sample was marked A2.1 to A2.20.
The big GFP sampled had a mean of length 116.05612.14 cm
and weight of 20.8266.92 g. At the second location we collected
24 samples for small size from 12 individuals and each sample was
marked B1.1 to B1.24. These individuals had a mean length of
75.4068.94 cm and weight of 4.6061.47 g. At this location we
collected 20 samples from 10 big GFP individuals and marked the
samples B2.1 to B2.20. These individuals had a mean length of
125.10612.57 cm and weight of 26.6066.76 g (Table 1). All
samples were immediately frozen in liquid nitrogen and stored at
270uC, thereafter they were transported to Shanghai Ocean
University and put in to cold storage (–80uC).
2.2. RNA extractionTotal ribonucleic acid (RNA) was extracted from the tissue
using TRIzol Reagent according the manufacturer’s instructions
(Invitrogen) and genomic DNA was removed using DNase I
(TaKara). Then RNA quality was determined by 2100 Bioanalyser
(Agilent) and quantified using the ND-2000 (NanoDrop Technol-
ogies). Only high-quality RNA sample (OD260/280 = 1.8,2.2,
OD260/230$2.0, RIN$6.5, 28 S:18 S$1.0, .10 mg) was used
to construct sequencing library.
2.3. Library preparation and Illumina Hiseq2500sequencing
RNA-seq transcriptome library was prepared following Tru-
SeqTM RNA sample preparation Kit from Illumina (San Diego,
CA) using 5 mg of total RNA. Messenger RNA was isolated
according to polyA selection method by oligo (dT) beads and then
fragmented (100 bp to 400 bp) by fragmentation buffer. Next,
double-stranded Complementary to RNA (cDNA) was synthesized
using a SuperScript double-stranded cDNA synthesis kit (Invitro-
gen, CA) with random hexamer primers (Illumina). Then the
synthesized cDNA was subjected to end-repair, phosphorylation
and ‘A’ base addition according to Illumina’s library construction
protocol. Libraries were size selected for cDNA target fragments of
200–300 bp on 2% Low Range Ultra Agarose followed by
Polymerase chain reaction (PCR) amplified using Phusion DNA
polymerase (NEB) for 15 PCR cycles. After quantification by
TBS380, a paired-end RNA-seq sequencing library was sequenced
with the Illumina HiSeq 2500 (26100 bp read length) [23,24].
2.4. De novo assembly and annotationThe raw paired-end reads were trimmed and quality controlled
by SeqPrep (https://github.com/jstjohn/SeqPrep) and Sickle
(https://github.com/najoshi/sickle) with default parameters.
Then clean data from the samples (A1, A2, B1 and B2) were
used to do RNA de novo assembly with Trinity (http://
trinityrnaseq.sourceforge.net/) [25]. All the assembled transcripts
were searched against the NCBI protein NR, STRING, Swissprot,
COG database [26,27] and KEGG [28] database and KO
(KEGG Ortholog database [29,30]) using BLASTX. This was
done to identify the proteins that had the highest sequence
similarity with the given transcripts to retrieve their function
Transcriptome Sequencing and Comparison of DEGs in M. rosenbergii
PLOS ONE | www.plosone.org 2 October 2014 | Volume 9 | Issue 10 | e109656
Ta
ble
1.
Th
ed
eta
iled
info
rmat
ion
on
all
sam
ple
din
div
idu
als
use
din
this
anal
ysis
.
No
Le
ng
th(m
m)
We
igh
t(g
r)N
oL
en
gth
(mm
)W
eig
ht
(gr)
No
Le
ng
th(m
m)
We
igh
t(g
r)N
oL
en
gth
(mm
)W
eig
ht
(gr)
A1
.17
3.6
65
.7A
2.1
13
7.0
23
7.6
B1
.18
1.6
25
.6B
2.1
13
6.4
53
7.8
A1
.2A
2.2
B1
.2B
2.2
A1
.36
7.8
55
.1A
2.3
12
7.2
42
4.3
B1
.36
1.5
22
.1B
2.3
13
1.0
93
5.3
A1
.4A
2.4
B1
.4B
2.4
A1
.56
1.2
92
.6A
2.5
14
0.1
53
4.7
B1
.56
1.9
62
.1B
2.5
14
1.2
33
.8
A1
.6A
2.6
B1
.6B
2.6
A1
.75
4.1
52
.1A
2.7
12
0.5
21
.3B
1.7
83
.75
5.4
B2
.71
04
.01
17
.9
A1
.8A
2.8
B1
.8B
2.8
A1
.96
9.8
3.4
A2
.91
10
.41
5B
1.9
84
.41
5.7
B2
.91
07
.17
20
A1
.10
A2
.10
B1
.10
B2
.10
A1
.11
73
.25
4.2
A2
.11
10
7.1
52
0.7
B1
.11
82
.56
.1B
2.1
11
15
.43
20
.04
A1
.12
A2
.12
B1
.12
B2
.12
A1
.13
77
.85
.1A
2.1
31
10
.96
14
.5B
1.1
39
4.5
88
.8B
2.1
31
31
.93
22
.2
A1
.14
A2
.14
B1
.14
B2
.14
A1
.15
74
.49
4.5
A2
.15
10
1.7
21
3.1
B1
.15
79
.39
4.7
B2
.15
13
1.0
22
7.8
A1
.16
A2
.16
B1
.16
B2
.16
A1
.17
74
.12
4.6
A2
.17
10
0.4
91
2.1
B1
.17
71
.41
3.5
B2
.17
11
1.0
21
9.3
A1
.18
A2
.18
B1
.18
B2
.18
A1
.19
61
.09
2.2
A2
.19
10
4.8
71
4.9
B1
.19
75
.24
.4B
2.1
91
41
.92
32
.3
A1
.20
A2
.20
B1
.20
B2
.20
A1
.21
73
.06
4.5
B1
.21
68
.53
.5
A1
.22
B1
.22
A1
.23
64
.14
2.8
B1
.23
60
.34
3.1
A1
.24
B1
.24
Me
an
68
.72
56
5.8
53
.96
1.0
7M
ean
11
6.0
56
12
.14
20
.826
6.9
2M
ean
75
.46
8.9
44
.66
1.4
7M
ean
12
5.1
61
2.5
72
6.6
66
.76
do
i:10
.13
71
/jo
urn
al.p
on
e.0
10
96
56
.t0
01
Transcriptome Sequencing and Comparison of DEGs in M. rosenbergii
PLOS ONE | www.plosone.org 3 October 2014 | Volume 9 | Issue 10 | e109656
annotations and a typical cut-off E-value less than 1.061025 was
set [31]. BLAST2GO (http://www.blast2go.com/b2ghome) [32]
program was used to get GO [33] annotations of unique
assembled transcripts for describing biological processes, molecu-
lar functions and cellular components. Metabolic pathway analysis
was performed using the KEGG (http://www.genome.jp/kegg/)
[34].
2.5. Differential expression analysis and functionalenrichment
To identify DEGs between four different samples, the expres-
sion level of each transcript was calculated according to the
fragments per kilobase of exon per million mapped reads (FRKM)
method. RNASeq by Expectation Maximization (RSEM) (http://
deweylab.biostat.wisc.edu/rsem/) [35] was used to quantify gene
and isoform abundances. The R statistical package software
EdgeR (Empirical analysis of Digital Gene Expression in R,
http://www.bioconductor.org/packages/2.12/bioc/html/edgeR.
html) [36] was used for differential expression analysis. In addition,
functional-enrichment analysis including GO and KEGG [37]
were performed to identify which DEGs were significantly
enriched in GO terms and metabolic pathways at Bonferroni-
corrected P-value #0.05 compared with the whole-transcriptome
background. GO functional enrichment and KEGG pathway
analysis were carried out by Goatools (https://github.com/
tanghaibao/Goatools) and KOBAS (http://kobas.cbi.pku.edu.
cn/home.do) [38].
Results
3.1. Illumina Sequencing and Sequence AssemblyWith the purpose of determining 4 groups of GFP (A1, A2, B1
and B2) transcriptomes, four sequencing libraries were prepared
from the hepatopancreas of the GFP samples and sequenced with
the Illumina paired-end technique (the Illumina HiSeq 2500
(26100 bp read length)). In total, there were 95,133,630 raw reads
generated from A1; 66,023,532 raw reads from A2; 63,157,060
raw reads from B1 and 59,321,096 raw reads from B2; the raw
reads generated of all four groups A1, A2, B1 and B2 at Q20$
93.56%, 91.91%, 93.64% and 93.74%, respectively (Table 2). The
sequencing raw data have been submitted to the SeqPrep (https://
github.com/jstjohn/SeqPrep) and Sickle (https://github.com/
najoshi/sickle) with default parameters. These were used for
de novo assembly and resulting sequences of A1, A2, B1 and B2
groups were 89,527,020 clean reads; 58,980,778 clean reads;
59,479,630 clean reads and 55,842,210 clean reads, respectively
(All sequences are being submitted to the NCBI Sequence Read
Database). Using Trinity to process the transcription of assembled
sequence identified a total 44,751 genes and 66,953 total isogenes.
The lengths of all isogenes were distributed as 1,361.29 bp,
30,832 bp and 351 bp from average, largest and smallest length,
respectively (Table 3). Of these, 16,943 (25.31%) were 401–
600 bp; 8,912 (13.31%) were 601–800 bp; 7,423 (11.09%) were 1–
400 bp; 5,757 (8.60%) were 801–1000 bp; 4,283 (6.40%) were
1001–1200 bp; 3,294 (4.92%) were 1,201–1,400 bp; 18,340
(27.39%) were 1,401–5,000 and 2,001 (2.99%) were 5,001–
40,000 (Table 4, Figure 1) [25].
3.2. Functional annotation and classificationAll the 66,953 assembled isogenes were searched against the
NR, STRING, and KEGG databases using BLASTX (E-values
less than 1.061025 were set). Using BLAST2GO for GO
annotation and KEGG for metabolic pathway analysis, a total
of 21,224 unigenes was annotated, accounting for 31.7%
(Figure 2A). The distribution of NR E-values was 59%, 13%,
9%, 11% and 8% proportional to E value 0, (0–1e230), (1e230–
1e220), (1e220–1e210) and (1e210–1e25), respectively (Figure 2B).
In all unigene annotations, 20% showed high homology (80–
100%) with sequences in the NR database. Of the remaining, 54%
showed homology at 60–80%, 26% showed homology at 40–60%,
and less than 1% showed homology at 20–40% with sequences in
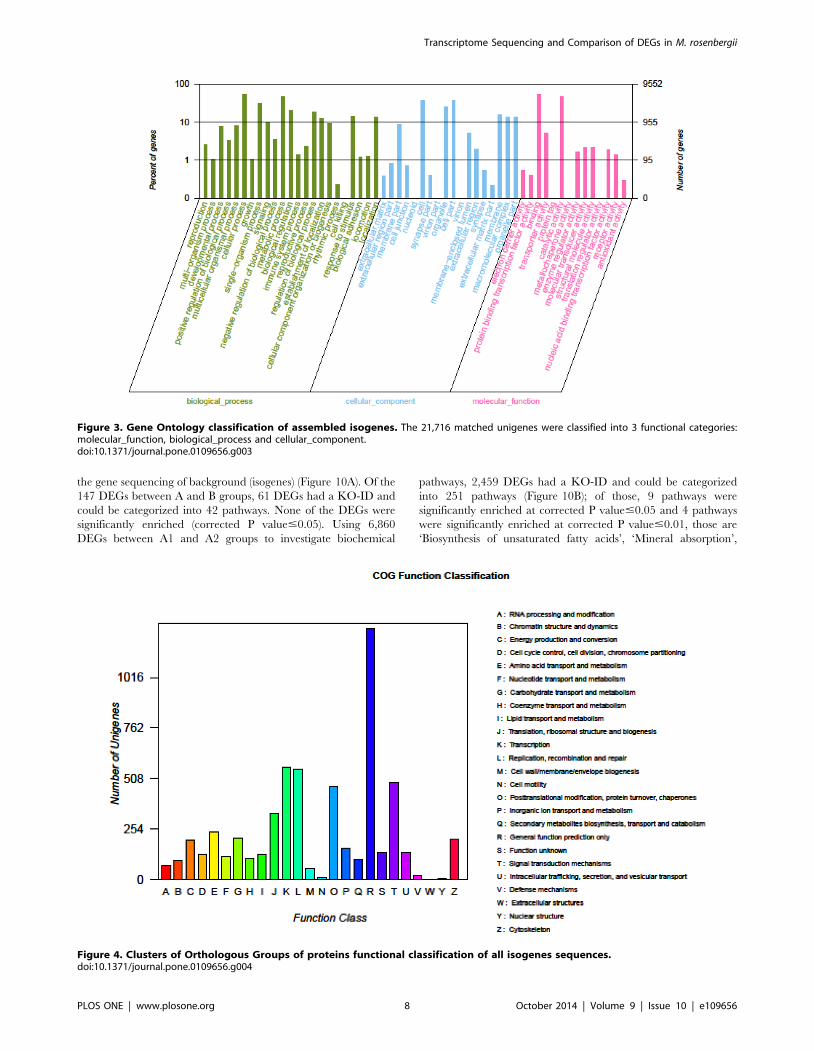
the NR database (Figure 2C) (Table S1). With the GO classifica-
tion, the 9,552 matched unigenes (14.27% in total isogenes) were
classified into 3 functional categories: molecular function, biolog-
ical process and cellular component (Figure 3). In the category of
molecular function, these matched unique sequences were
clustered into 11 classifications. The largest subcategory of the
molecular function was ‘binding’ (53.29%) and the second was
‘catalytic activity’ (47.56%). In the category of biological processes,
these unique sequences were grouped into 22 classifications: the
most represented biological processes were ‘cellular process’
(52.51%) and ‘metabolic process’ (46.38%). In the category of
cellular components, these unique sequences were divided into 15
classifications: the most represented cellular components were
‘cell’ (37.9%) and ‘cell part’ (37.89%). The 5,782 matched
unigenes (8.64% of the isogenes) were clustered into 25 categories
of COG (Figure 4). The largest category was ‘general function
prediction only’ (21.9%); the second category was ‘transcription’
(9.75%); the third category was ‘replication, recombination and
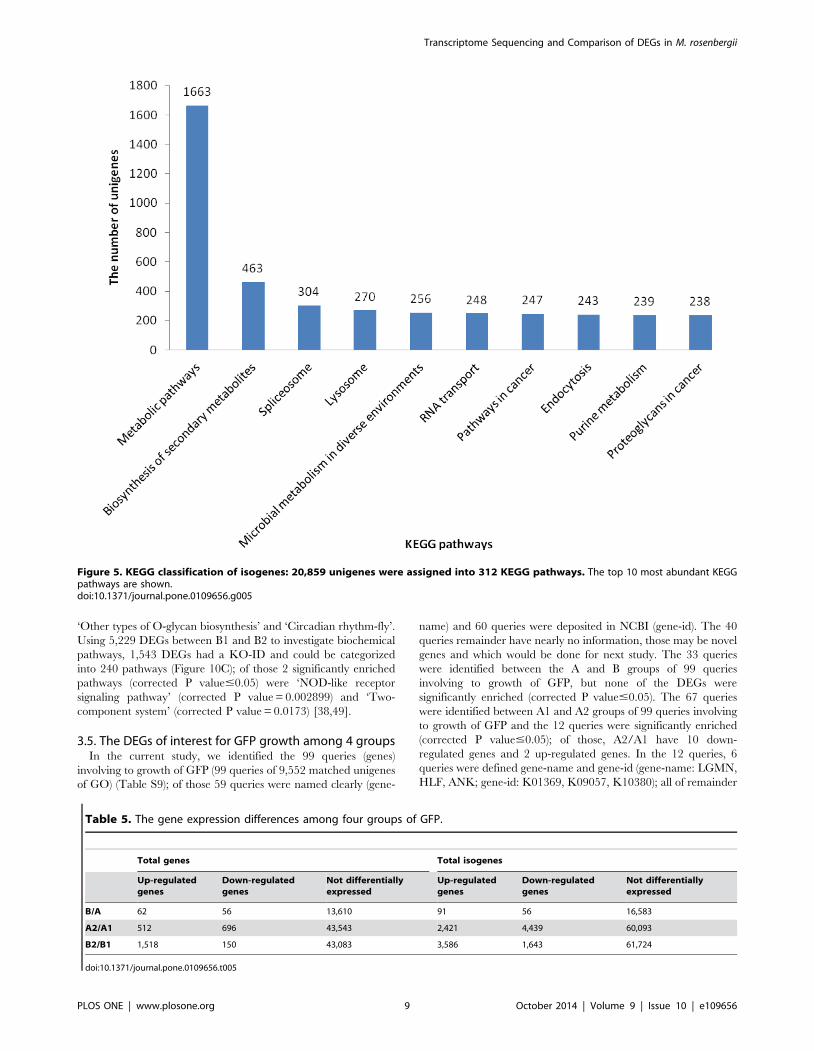
repair’ (9.63%). When the assembled isogenes were assigned to the
biochemical pathways described in KEGG, pathway-based
analysis provided further understanding of the biological functions
of the genes identified [39–41]. To systematically analyze inner-
cell metabolic pathways and complicated biological behaviors, we
classified the unigenes into biological pathways by mapping the
annotated coding region sequences to the reference canonical
pathways in the KEGG database (Figure 5). Consequently, 20,859
unigenes (31.15% of isogenes) were assigned to 312 KEGG
pathways. Among these, 1,663 unigenes assigned to ‘metabolic
pathways’, followed by ‘Biosynthesis of secondary metabolites’
(463 unigenes), ‘Spliceosome’ (304 unigenes), ‘Lysosome’ (270
unigenes), ‘Microbial metabolism in diverse environments’ (256
unigenes), ‘RNA transport’ (248 unigenes), ‘Pathways in cancer’
(247 unigenes), ‘Endocytosis’ (243 unigenes), ‘Purine metabolism’
(239 unigenes, ‘Proteoglycans in cancer’ (238 unigenes) (Table S2)
[25,42,43].
3.3. Gene expression differences among four groups ofGFP
Gene expression was calculated in accordance with the method
of FPKM, which takes into account the influence of both the
sequencing depth and gene length on read count. In the FPKM
distribution for all samples (Figure 6) the A1 group showed the
highest probability density distribution of gene expression, whereas
A2 group displayed the lowest gene expression of probability
density distribution. Among four GFP groups in this study, we
used two types of genes for expression differences. Based on
assembled total genes (44,751 genes) (Table 5). The results
illustrated that 1,208 genes (2.7% of all genes) the A1 and A2
groups were identified as significant DEGs between these two
groups (A1 and A2), which comprised 512 up-regulated genes
(accounting for 42.38% of all significant DEGs) and 696 down-
regulated genes (accounting for 57.62%) in the A1 group (Pearson
correlation: 0.9379). Between the B1 and B2 groups, 1,668 genes
(3.73% of all genes) were identified as significant DEGs, which
comprised 1,518 up-regulated genes (accounting for 91.01% of all
significant DEGs) and 150 down-regulated genes (accounting for
8.99%) in the B1 group (Pearson correlation: 0.9478). Between the
Transcriptome Sequencing and Comparison of DEGs in M. rosenbergii
PLOS ONE | www.plosone.org 4 October 2014 | Volume 9 | Issue 10 | e109656
A and B groups, 118 genes (1.53% of all genes) were identified as
significant DEGs, which comprised 62 up-regulated genes
(accounting for 52.54% of all significant DEGs) and 56 down-
regulated genes (accounting for 47.46%) in the A group (Pearson
correlation: 0.9834).
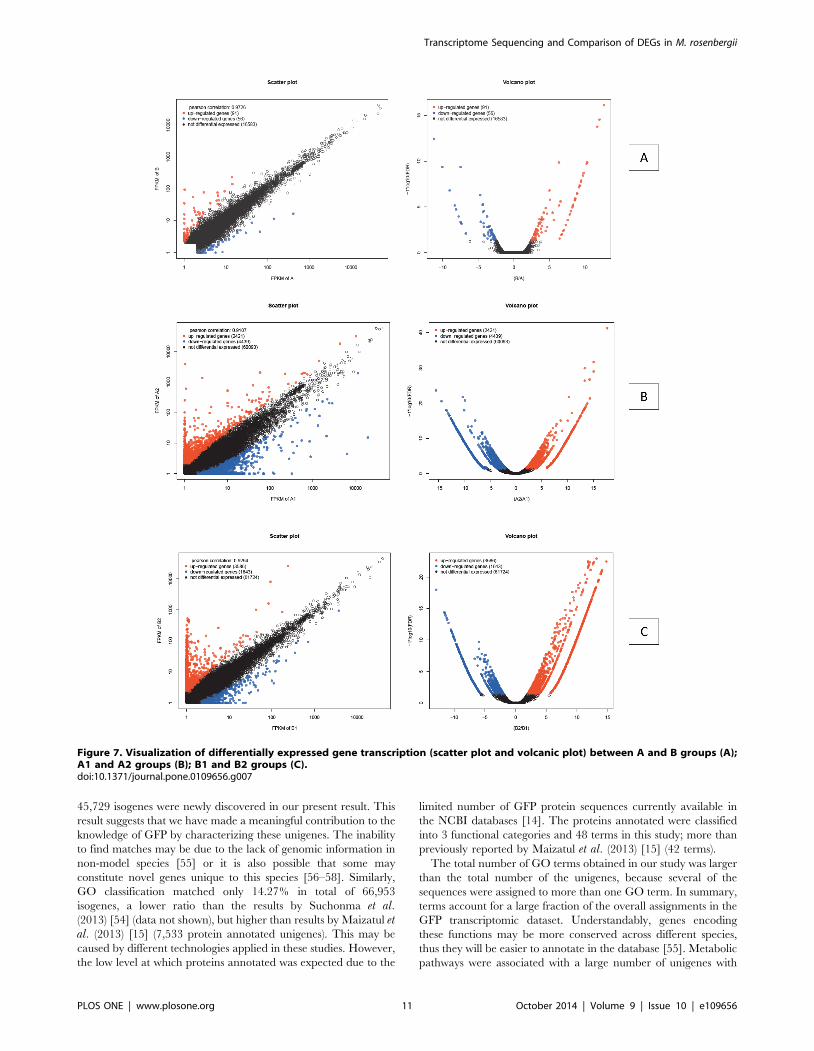
Based on assembled total isogenes (Table 5), 147 genes (0.22%
of all isogenes) in the A and B groups were identified as significant
DEGs between these two groups (A and B), which comprised 91
up-regulated genes (accounting for 61.9% of all significant DEGs)
and 56 down-regulated genes (accounting for 38.1%) in the A
group (Pearson correlation: 0.9704) (Figure 7A) (Table S3).
Between the A1 and A2 groups, 6,860 genes (10.25% of all
isogenes) were identified as significant DEGs, which comprised
2,421 up-regulated genes (accounting for 35.29% of all significant
DEGs) and 4,439 down-regulated genes (accounting for 64.71%)
in the A1 group (Pearson correlation: 0.9107) (Figure 7B) (Table
S4). Between the B1 and B2 groups, 5,229 genes (7.81% of all
isogenes) were identified as significant DEGs, which comprised
3,586 up-regulated genes (accounting for 68.23% of all significant
DEGs) and 1,643 down-regulated genes (accounting for 31.77%)
in the B1 group (Pearson correlation: 0.9294) (Figure 7C) (Table
S5) [44–48].
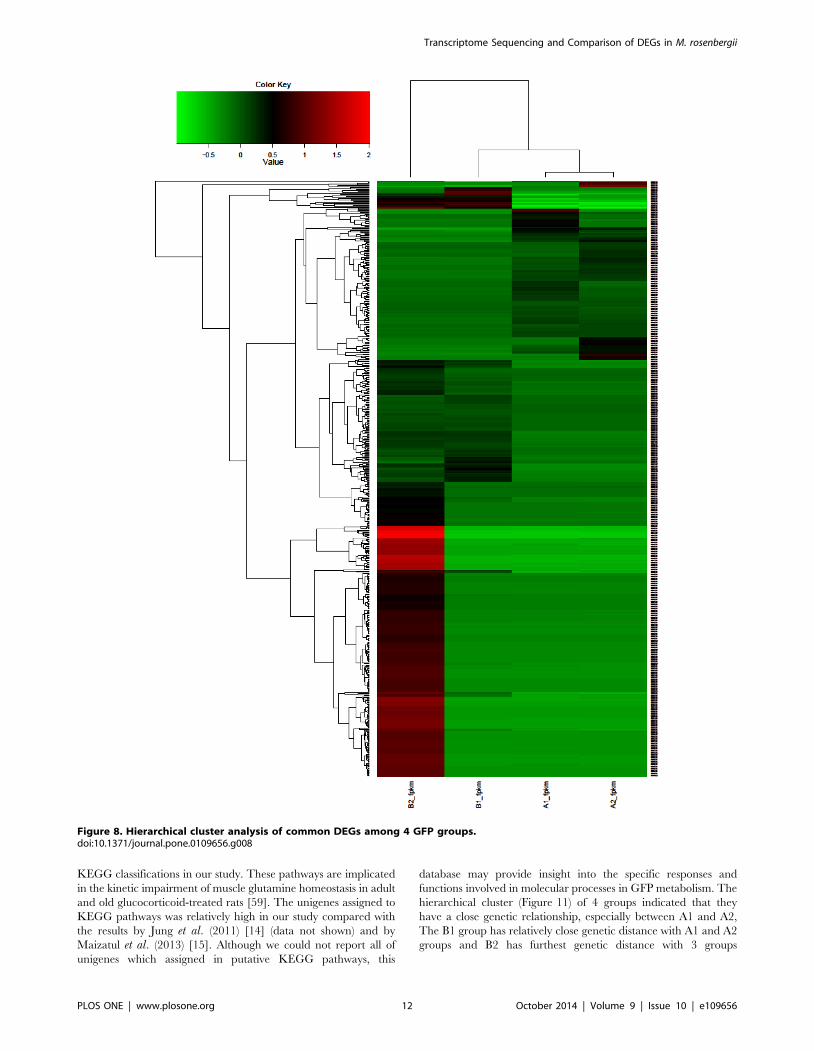
3.4. Functional annotation of DEGsA total of 147 DEGs between A and B groups, 6,860 DEGs
between A1 and A2 and 5,229 DEGs between B1 and B2 were
classified using hierarchical clustering (Figure 8) which indicated
that A1 group was grouped closely with A2 group and that the B2
group was the most distinct of the set. The up-regulated and
down-regulated genes were separated into two clusters based on
tree branching.
All DEGs of A and B groups were mapped in the GO database
to determine functions, looking for significantly enriched GO
terms compared to the whole transcriptome background (total of
isogenes) (Figure 9A). Using 147 DEGs between the A and B
groups for enrichment we identified 38 DEGs that could be
categorized into two main categories based on functional groups:
biological process and molecular function. In biological_process
the predominant term was ‘biosynthetic process’ with 8 DEGs
(corrected P value = 0.19). In molecular_function four predomi-
nant terms were found, those were ‘phosphoenolpyruvate carbox-
ykinase activity’ (2 DEGs, corrected P value = 0.0654), ‘catalytic
activity’ (22 DEGs, corrected P value = 0.13), ‘lyase activity’ (4
DEGs, corrected P value = 0.132), and ‘carboxy-lyase activity’ (2
DEGs, corrected P value = 0.535) (Table S6). Using 6,860 DEGs
between A1 and A2 groups for enrichment, we derived 21,856
DEGs (corrected P value#0.05), because some genes occurred in
more than one term (Figure 9B). These DEGs could be
categorized into three main categories based on functional groups:
biological process had 10,013 DEGs in 68 terms, of which the 30
predominant terms have more than 100 DEGs each. The highest
was the ‘biological_process’ term with 1,005 DEGs. Molecular_-
function had 8,572 DEGs in 55 terms, of which the 23
predominant terms have more than 100 DEGs. The highest was
the ‘molecular_function’ term with 1,275 DEGs. Cellular_com-
ponent had 3,271 DEGs in 19 terms, of which the 13 predominant
terms had more than 100 DEGs. The highest was ‘Cellular_com-
ponent’ term with 687 DEGs (Table S7). Using 5,229 DEGs
between B1 and B2 groups for enrichment, we derived 5,940
DEGs (corrected P value#0.05) (Figure 9C), some genes occurred
in more than one term. These DEGs could be categorized into
three main categories based on functional groups: biological
process had 4,077 DEGs in 18 terms, most of which have more
than 100 DEGs; the highest was ‘biological_process’ term with
656 DEGs. Molecular_function had 1,275 DEGs in 2 terms; one
was ‘catalytic activity’ term with 475 DEGs and other was
‘molecular_function’ with 800 DEGs. Cellular_component had
588 DEGs in 3 terms including ‘cellular_component’ with 444
DEGs, ‘integral to membrane’ with 72 DEGs and ‘intrinsic to
membrane’ with 72 DEGs (Table S8) [49–53].
To further investigate the biochemical pathways of these DEGs,
all DEGs were mapped in the KEGG database and compared to
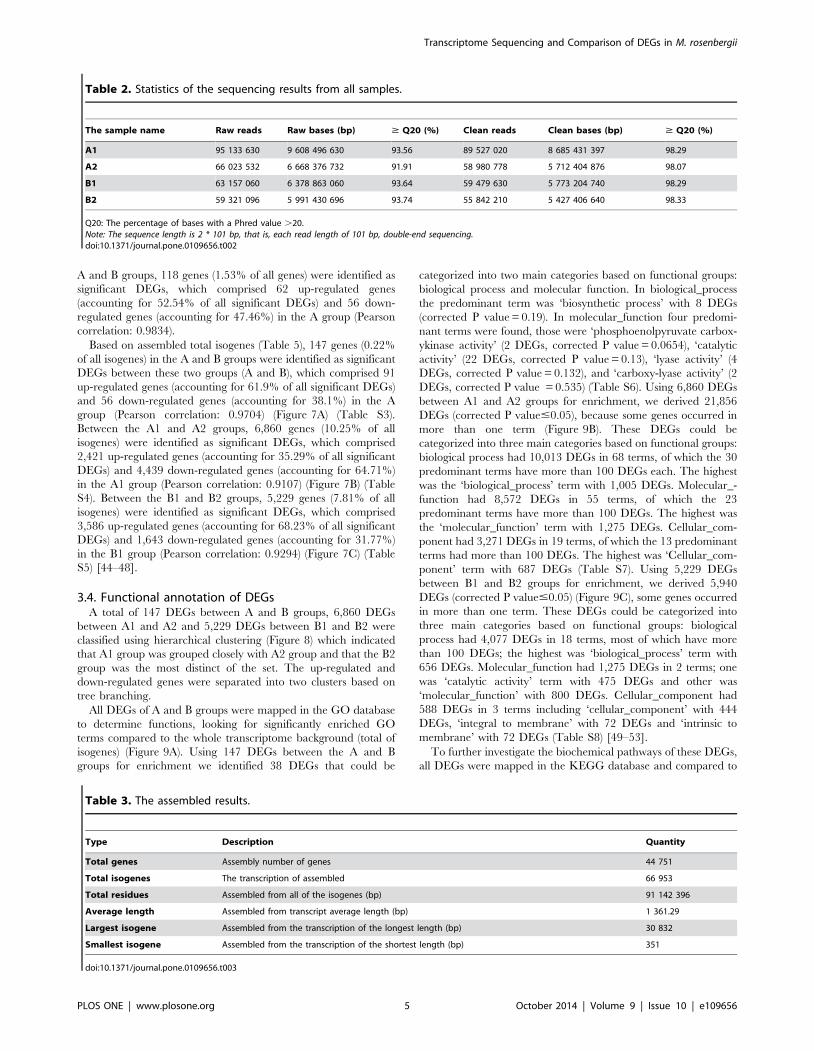
Table 2. Statistics of the sequencing results from all samples.
The sample name Raw reads Raw bases (bp) $ Q20 (%) Clean reads Clean bases (bp) $ Q20 (%)
A1 95 133 630 9 608 496 630 93.56 89 527 020 8 685 431 397 98.29
A2 66 023 532 6 668 376 732 91.91 58 980 778 5 712 404 876 98.07
B1 63 157 060 6 378 863 060 93.64 59 479 630 5 773 204 740 98.29
B2 59 321 096 5 991 430 696 93.74 55 842 210 5 427 406 640 98.33
Q20: The percentage of bases with a Phred value .20.Note: The sequence length is 2 * 101 bp, that is, each read length of 101 bp, double-end sequencing.doi:10.1371/journal.pone.0109656.t002
Table 3. The assembled results.
Type Description Quantity
Total genes Assembly number of genes 44 751
Total isogenes The transcription of assembled 66 953
Total residues Assembled from all of the isogenes (bp) 91 142 396
Average length Assembled from transcript average length (bp) 1 361.29
Largest isogene Assembled from the transcription of the longest length (bp) 30 832
Smallest isogene Assembled from the transcription of the shortest length (bp) 351
doi:10.1371/journal.pone.0109656.t003
Transcriptome Sequencing and Comparison of DEGs in M. rosenbergii
PLOS ONE | www.plosone.org 5 October 2014 | Volume 9 | Issue 10 | e109656

Table 4. Assembled length distribution statistics for isogenes.
Isogene length (bp) Quantity of Isogene Percentage (%)
1–400 7,423 11.09%
401–600 16,943 25.31%
601–800 8,912 13.31%
801–1000 5,757 8.60%
1001–1200 4,283 6.40%
1201–1400 3,294 4.92%
1401–1600 2,725 4.07%
1601–1800 2,356 3.52%
1801–2000 2,116 3.16%
2001–2400 3,115 4.65%
2401–2800 2,307 3.45%
2801–3200 1,835 2.74%
3201–3600 1,275 1.90%
3601–4000 1,000 1.49%
4001–5000 1,611 2.41%
5001–40000 2,001 2.99%
ALL 66,953 100.00%
doi:10.1371/journal.pone.0109656.t004
Figure 1. Assembed distribution of isogene lengths.doi:10.1371/journal.pone.0109656.g001
Transcriptome Sequencing and Comparison of DEGs in M. rosenbergii
PLOS ONE | www.plosone.org 6 October 2014 | Volume 9 | Issue 10 | e109656
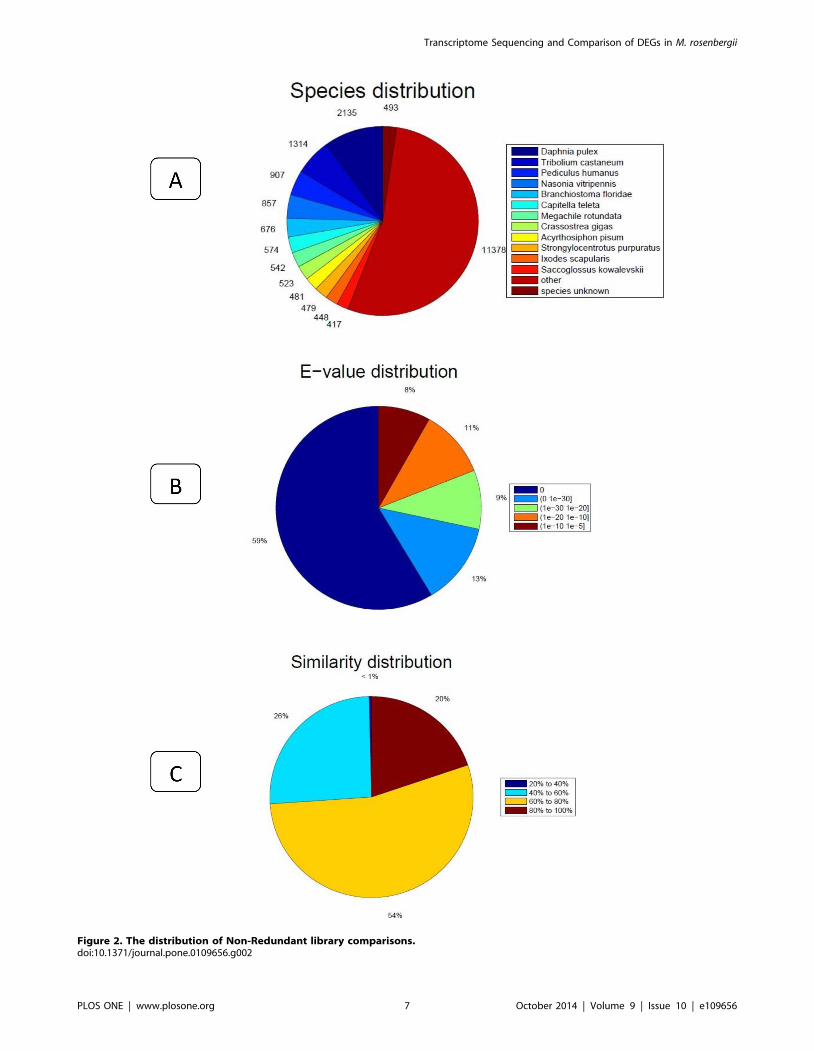
Figure 2. The distribution of Non-Redundant library comparisons.doi:10.1371/journal.pone.0109656.g002
Transcriptome Sequencing and Comparison of DEGs in M. rosenbergii
PLOS ONE | www.plosone.org 7 October 2014 | Volume 9 | Issue 10 | e109656
the gene sequencing of background (isogenes) (Figure 10A). Of the
147 DEGs between A and B groups, 61 DEGs had a KO-ID and
could be categorized into 42 pathways. None of the DEGs were
significantly enriched (corrected P value#0.05). Using 6,860
DEGs between A1 and A2 groups to investigate biochemical
pathways, 2,459 DEGs had a KO-ID and could be categorized
into 251 pathways (Figure 10B); of those, 9 pathways were
significantly enriched at corrected P value#0.05 and 4 pathways
were significantly enriched at corrected P value#0.01, those are
‘Biosynthesis of unsaturated fatty acids’, ‘Mineral absorption’,
Figure 3. Gene Ontology classification of assembled isogenes. The 21,716 matched unigenes were classified into 3 functional categories:molecular_function, biological_process and cellular_component.doi:10.1371/journal.pone.0109656.g003
Figure 4. Clusters of Orthologous Groups of proteins functional classification of all isogenes sequences.doi:10.1371/journal.pone.0109656.g004
Transcriptome Sequencing and Comparison of DEGs in M. rosenbergii
PLOS ONE | www.plosone.org 8 October 2014 | Volume 9 | Issue 10 | e109656
‘Other types of O-glycan biosynthesis’ and ‘Circadian rhythm-fly’.
Using 5,229 DEGs between B1 and B2 to investigate biochemical
pathways, 1,543 DEGs had a KO-ID and could be categorized
into 240 pathways (Figure 10C); of those 2 significantly enriched
pathways (corrected P value#0.05) were ‘NOD-like receptor
signaling pathway’ (corrected P value = 0.002899) and ‘Two-
component system’ (corrected P value = 0.0173) [38,49].
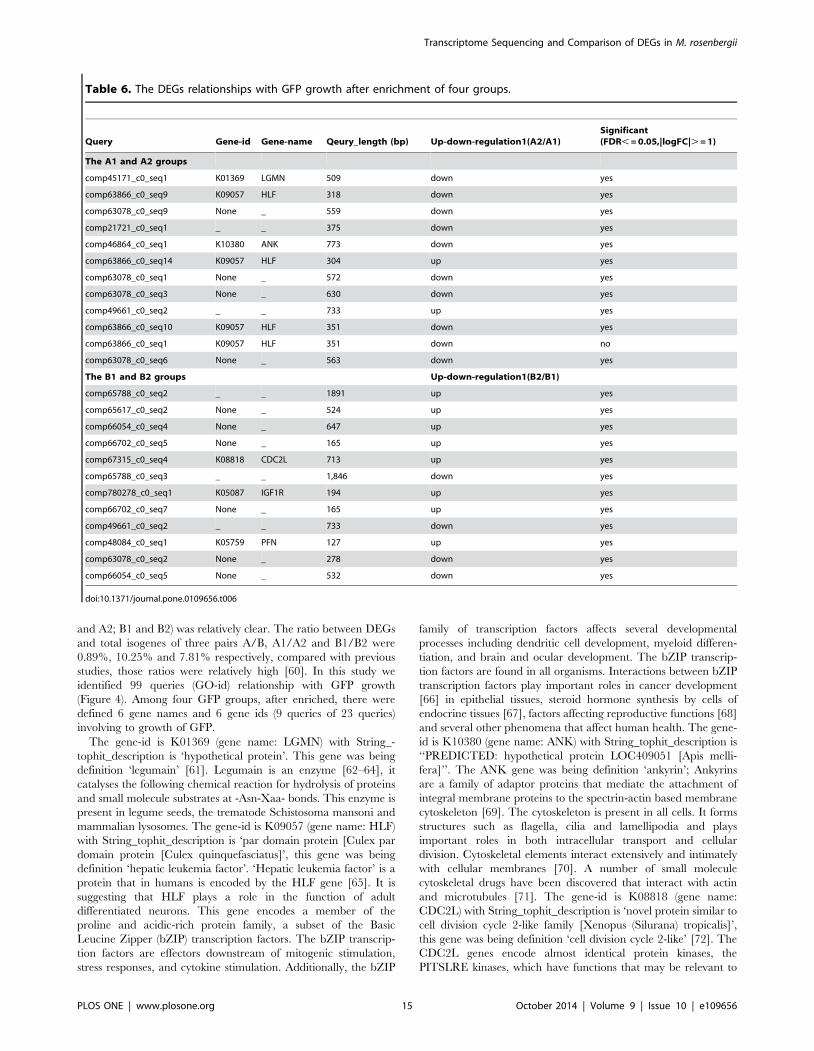
3.5. The DEGs of interest for GFP growth among 4 groupsIn the current study, we identified the 99 queries (genes)
involving to growth of GFP (99 queries of 9,552 matched unigenes
of GO) (Table S9); of those 59 queries were named clearly (gene-
name) and 60 queries were deposited in NCBI (gene-id). The 40
queries remainder have nearly no information, those may be novel
genes and which would be done for next study. The 33 queries
were identified between the A and B groups of 99 queries
involving to growth of GFP, but none of the DEGs were
significantly enriched (corrected P value#0.05). The 67 queries
were identified between A1 and A2 groups of 99 queries involving
to growth of GFP and the 12 queries were significantly enriched
(corrected P value#0.05); of those, A2/A1 have 10 down-
regulated genes and 2 up-regulated genes. In the 12 queries, 6
queries were defined gene-name and gene-id (gene-name: LGMN,
HLF, ANK; gene-id: K01369, K09057, K10380); all of remainder
Figure 5. KEGG classification of isogenes: 20,859 unigenes were assigned into 312 KEGG pathways. The top 10 most abundant KEGGpathways are shown.doi:10.1371/journal.pone.0109656.g005
Table 5. The gene expression differences among four groups of GFP.
Total genes Total isogenes
Up-regulatedgenes
Down-regulatedgenes
Not differentiallyexpressed
Up-regulatedgenes
Down-regulatedgenes
Not differentiallyexpressed
B/A 62 56 13,610 91 56 16,583
A2/A1 512 696 43,543 2,421 4,439 60,093
B2/B1 1,518 150 43,083 3,586 1,643 61,724
doi:10.1371/journal.pone.0109656.t005
Transcriptome Sequencing and Comparison of DEGs in M. rosenbergii
PLOS ONE | www.plosone.org 9 October 2014 | Volume 9 | Issue 10 | e109656

have not defined gene-name and gene-id yet (Table 6). The 71
queries were identified between B1 and B2 groups of 99 queries
involving to growth of GFP, and the 12 queries were significantly
enriched (corrected P value,0.05), of those B2/B1 have 8 up-
regulated genes and 4 down-regulated genes. In the 12 queries,
just 3 queries were defined gene-name and gene-id (gene-name:
CDC2L, IGF1R and PFN; gene-id: K08818, K05087 and
K05759); all of remainder have not defined gene-name and
gene-id yet (Table 6). We used the hypergeometric test method for
testing the most enriched pathway. None of the KEGG
PATHWAY were significantly enriched (corrected P value#
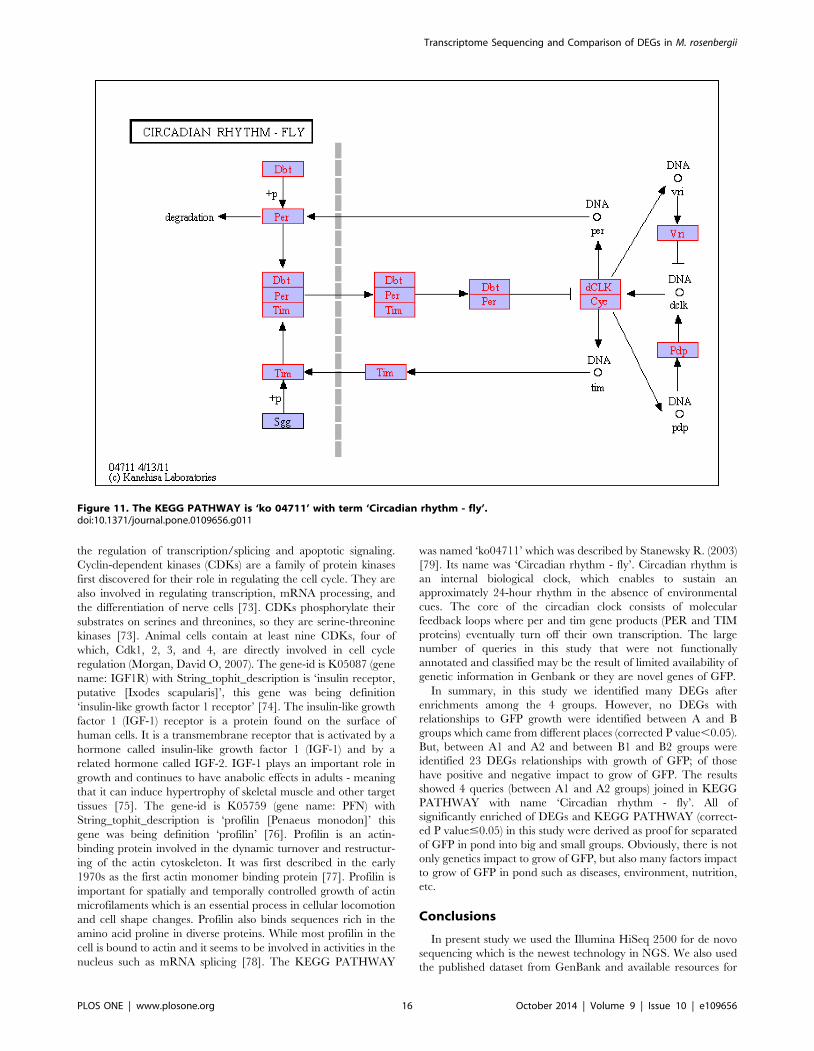
0.05) between A and B groups. The 9 KEGG PATHWAYS were
significantly enriched (corrected P value#0.05) between A1 and
A2 groups, of those one KEGG PATHWAY is ‘ko04711’ with
term ‘Circadian rhythm-fly’ has occurred 4 queries relating with
GFP growth (comp63866_c0_seq9, comp63866_c0_seq14,
comp63866_c0_seq10 and comp63866_c0_seq1) (Figure 11).
The 2 KEGG PATHWAYS were significantly enriched (corrected
P value#0.05) between B1 and B2 groups (ko04621 and ko02020),
but none of the KEGG PATHWAYS have occurred the queries
relating with GFP growth.
Discussion
There have been some researches on the GFP and Litopenaeusvannamei using the next generation sequencing technologies by
Jung et al. (2011), Maizatul et al. (2013), Suchonma et al. (2013),
Keyi et al. (2012) [14,15,54,55], but they used the different
transcriptome method with different experiment objectives.
In the current study, the number of clean reads varied from
55,842,210 to 89,527,020 (.98%) among the 4 GFP groups and
66,953 isogenes were assemble with varying lengths from 1 to
40,000 bp and average of length was 1,361.29 bp. This is higher
than reported in previous research because we used the newest
NGS technology for experiment (Illumina Hiseq 2500) which can
read longer sequences. There was a difference in the number of
clean reads among 4 GFP groups in this study, which may be the
result of differences among the original broodstock or a change of
each group according to culture time.
The large number of raw read sequences and the high ratio of
derived clean read sequences in this study when compared with
previous studies may be the result of using different technology for
sequencing or the result of the size of samples used in the study.
We noted that only 21,224 (31.7%) unigenes matched the
registered sequences of GFP in the GenBank NR database, and
Figure 6. Express (FPKM scores) distribution. Left - all the probability density distribution of gene expression, the diagram for log10 FPKMabscissa, the higher the numerical, said the higher amount of gene expression.doi:10.1371/journal.pone.0109656.g006
Transcriptome Sequencing and Comparison of DEGs in M. rosenbergii
PLOS ONE | www.plosone.org 10 October 2014 | Volume 9 | Issue 10 | e109656
45,729 isogenes were newly discovered in our present result. This
result suggests that we have made a meaningful contribution to the
knowledge of GFP by characterizing these unigenes. The inability
to find matches may be due to the lack of genomic information in
non-model species [55] or it is also possible that some may
constitute novel genes unique to this species [56–58]. Similarly,
GO classification matched only 14.27% in total of 66,953
isogenes, a lower ratio than the results by Suchonma et al.(2013) [54] (data not shown), but higher than results by Maizatul etal. (2013) [15] (7,533 protein annotated unigenes). This may be
caused by different technologies applied in these studies. However,
the low level at which proteins annotated was expected due to the
limited number of GFP protein sequences currently available in
the NCBI databases [14]. The proteins annotated were classified
into 3 functional categories and 48 terms in this study; more than
previously reported by Maizatul et al. (2013) [15] (42 terms).
The total number of GO terms obtained in our study was larger
than the total number of the unigenes, because several of the
sequences were assigned to more than one GO term. In summary,
terms account for a large fraction of the overall assignments in the
GFP transcriptomic dataset. Understandably, genes encoding
these functions may be more conserved across different species,
thus they will be easier to annotate in the database [55]. Metabolic
pathways were associated with a large number of unigenes with
Figure 7. Visualization of differentially expressed gene transcription (scatter plot and volcanic plot) between A and B groups (A);A1 and A2 groups (B); B1 and B2 groups (C).doi:10.1371/journal.pone.0109656.g007
Transcriptome Sequencing and Comparison of DEGs in M. rosenbergii
PLOS ONE | www.plosone.org 11 October 2014 | Volume 9 | Issue 10 | e109656
KEGG classifications in our study. These pathways are implicated
in the kinetic impairment of muscle glutamine homeostasis in adult
and old glucocorticoid-treated rats [59]. The unigenes assigned to
KEGG pathways was relatively high in our study compared with
the results by Jung et al. (2011) [14] (data not shown) and by
Maizatul et al. (2013) [15]. Although we could not report all of
unigenes which assigned in putative KEGG pathways, this
database may provide insight into the specific responses and
functions involved in molecular processes in GFP metabolism. The
hierarchical cluster (Figure 11) of 4 groups indicated that they
have a close genetic relationship, especially between A1 and A2,
The B1 group has relatively close genetic distance with A1 and A2
groups and B2 has furthest genetic distance with 3 groups
Figure 8. Hierarchical cluster analysis of common DEGs among 4 GFP groups.doi:10.1371/journal.pone.0109656.g008
Transcriptome Sequencing and Comparison of DEGs in M. rosenbergii
PLOS ONE | www.plosone.org 12 October 2014 | Volume 9 | Issue 10 | e109656
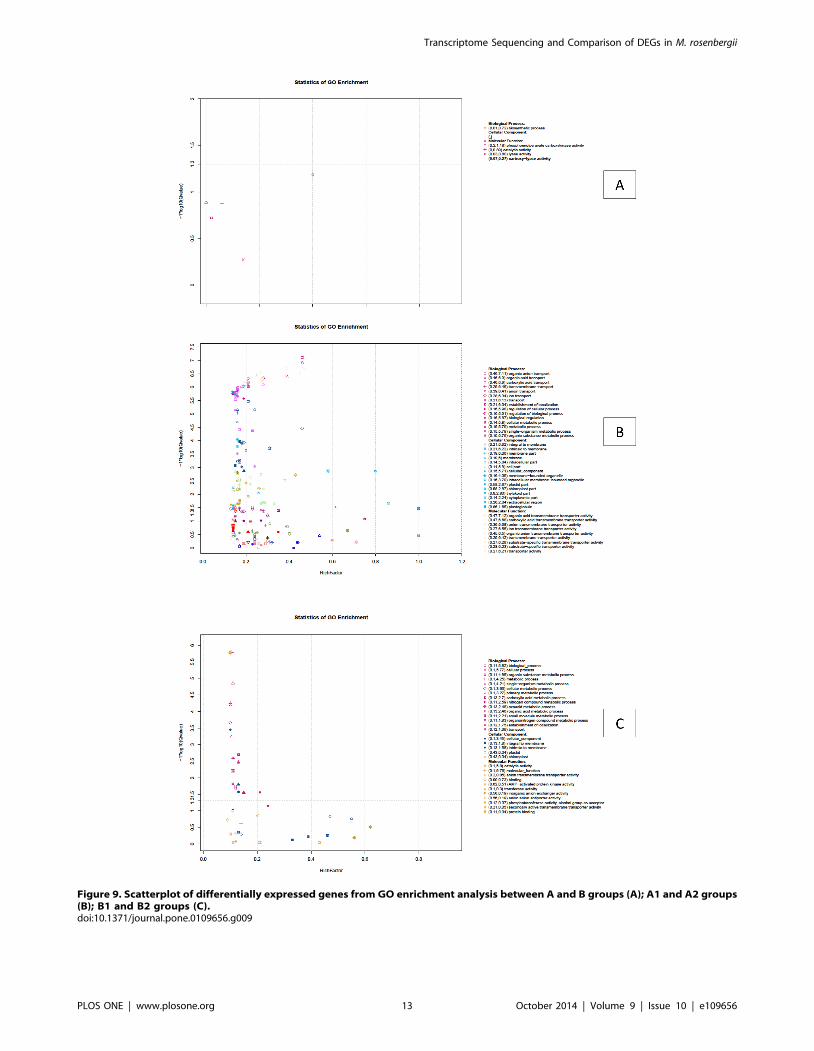
Figure 9. Scatterplot of differentially expressed genes from GO enrichment analysis between A and B groups (A); A1 and A2 groups(B); B1 and B2 groups (C).doi:10.1371/journal.pone.0109656.g009
Transcriptome Sequencing and Comparison of DEGs in M. rosenbergii
PLOS ONE | www.plosone.org 13 October 2014 | Volume 9 | Issue 10 | e109656

remainder. This may be caused by sampling individuals from
different broodstock.
The number of DEGs among the 4 groups was less than results
by Maizatul et al. (2013) [15], because the samples in our study
were extracted from hepatopancreas organ of GFP, while
Maizatul et al. (2013) [15] used different tissues for their
experiment (hepatopancreas, gill and muscles). However the
differentiation of DEGs between three pairs (The A and B; A1
Figure 10. Scatterplot of differentially expressed genes from KEGG PATHWAY enrichment analysis between A and B groups (A); A1and A2 groups (B); B1 and B2 groups (C).doi:10.1371/journal.pone.0109656.g010
Transcriptome Sequencing and Comparison of DEGs in M. rosenbergii
PLOS ONE | www.plosone.org 14 October 2014 | Volume 9 | Issue 10 | e109656
and A2; B1 and B2) was relatively clear. The ratio between DEGs
and total isogenes of three pairs A/B, A1/A2 and B1/B2 were
0.89%, 10.25% and 7.81% respectively, compared with previous
studies, those ratios were relatively high [60]. In this study we
identified 99 queries (GO-id) relationship with GFP growth
(Figure 4). Among four GFP groups, after enriched, there were
defined 6 gene names and 6 gene ids (9 queries of 23 queries)
involving to growth of GFP.
The gene-id is K01369 (gene name: LGMN) with String_-
tophit_description is ‘hypothetical protein’. This gene was being
definition ‘legumain’ [61]. Legumain is an enzyme [62–64], it
catalyses the following chemical reaction for hydrolysis of proteins
and small molecule substrates at -Asn-Xaa- bonds. This enzyme is
present in legume seeds, the trematode Schistosoma mansoni and
mammalian lysosomes. The gene-id is K09057 (gene name: HLF)
with String_tophit_description is ‘par domain protein [Culex par
domain protein [Culex quinquefasciatus]’, this gene was being
definition ‘hepatic leukemia factor’. ‘Hepatic leukemia factor’ is a
protein that in humans is encoded by the HLF gene [65]. It is
suggesting that HLF plays a role in the function of adult
differentiated neurons. This gene encodes a member of the
proline and acidic-rich protein family, a subset of the Basic
Leucine Zipper (bZIP) transcription factors. The bZIP transcrip-
tion factors are effectors downstream of mitogenic stimulation,
stress responses, and cytokine stimulation. Additionally, the bZIP
family of transcription factors affects several developmental
processes including dendritic cell development, myeloid differen-
tiation, and brain and ocular development. The bZIP transcrip-
tion factors are found in all organisms. Interactions between bZIP
transcription factors play important roles in cancer development
[66] in epithelial tissues, steroid hormone synthesis by cells of
endocrine tissues [67], factors affecting reproductive functions [68]
and several other phenomena that affect human health. The gene-
id is K10380 (gene name: ANK) with String_tophit_description is
‘‘PREDICTED: hypothetical protein LOC409051 [Apis melli-
fera]’’. The ANK gene was being definition ‘ankyrin’; Ankyrins
are a family of adaptor proteins that mediate the attachment of
integral membrane proteins to the spectrin-actin based membrane
cytoskeleton [69]. The cytoskeleton is present in all cells. It forms
structures such as flagella, cilia and lamellipodia and plays
important roles in both intracellular transport and cellular
division. Cytoskeletal elements interact extensively and intimately
with cellular membranes [70]. A number of small molecule
cytoskeletal drugs have been discovered that interact with actin
and microtubules [71]. The gene-id is K08818 (gene name:
CDC2L) with String_tophit_description is ‘novel protein similar to
cell division cycle 2-like family [Xenopus (Silurana) tropicalis]’,
this gene was being definition ‘cell division cycle 2-like’ [72]. The
CDC2L genes encode almost identical protein kinases, the
PITSLRE kinases, which have functions that may be relevant to
Table 6. The DEGs relationships with GFP growth after enrichment of four groups.
Query Gene-id Gene-name Qeury_length (bp) Up-down-regulation1(A2/A1)Significant(FDR, = 0.05,|logFC|. = 1)
The A1 and A2 groups
comp45171_c0_seq1 K01369 LGMN 509 down yes
comp63866_c0_seq9 K09057 HLF 318 down yes
comp63078_c0_seq9 None _ 559 down yes
comp21721_c0_seq1 _ _ 375 down yes
comp46864_c0_seq1 K10380 ANK 773 down yes
comp63866_c0_seq14 K09057 HLF 304 up yes
comp63078_c0_seq1 None _ 572 down yes
comp63078_c0_seq3 None _ 630 down yes
comp49661_c0_seq2 _ _ 733 up yes
comp63866_c0_seq10 K09057 HLF 351 down yes
comp63866_c0_seq1 K09057 HLF 351 down no
comp63078_c0_seq6 None _ 563 down yes
The B1 and B2 groups Up-down-regulation1(B2/B1)
comp65788_c0_seq2 _ _ 1891 up yes
comp65617_c0_seq2 None _ 524 up yes
comp66054_c0_seq4 None _ 647 up yes
comp66702_c0_seq5 None _ 165 up yes
comp67315_c0_seq4 K08818 CDC2L 713 up yes
comp65788_c0_seq3 _ _ 1,846 down yes
comp780278_c0_seq1 K05087 IGF1R 194 up yes
comp66702_c0_seq7 None _ 165 up yes
comp49661_c0_seq2 _ _ 733 down yes
comp48084_c0_seq1 K05759 PFN 127 up yes
comp63078_c0_seq2 None _ 278 down yes
comp66054_c0_seq5 None _ 532 down yes
doi:10.1371/journal.pone.0109656.t006
Transcriptome Sequencing and Comparison of DEGs in M. rosenbergii
PLOS ONE | www.plosone.org 15 October 2014 | Volume 9 | Issue 10 | e109656
the regulation of transcription/splicing and apoptotic signaling.
Cyclin-dependent kinases (CDKs) are a family of protein kinases
first discovered for their role in regulating the cell cycle. They are
also involved in regulating transcription, mRNA processing, and
the differentiation of nerve cells [73]. CDKs phosphorylate their
substrates on serines and threonines, so they are serine-threonine
kinases [73]. Animal cells contain at least nine CDKs, four of
which, Cdk1, 2, 3, and 4, are directly involved in cell cycle
regulation (Morgan, David O, 2007). The gene-id is K05087 (gene
name: IGF1R) with String_tophit_description is ‘insulin receptor,
putative [Ixodes scapularis]’, this gene was being definition
‘insulin-like growth factor 1 receptor’ [74]. The insulin-like growth
factor 1 (IGF-1) receptor is a protein found on the surface of
human cells. It is a transmembrane receptor that is activated by a
hormone called insulin-like growth factor 1 (IGF-1) and by a
related hormone called IGF-2. IGF-1 plays an important role in
growth and continues to have anabolic effects in adults - meaning
that it can induce hypertrophy of skeletal muscle and other target
tissues [75]. The gene-id is K05759 (gene name: PFN) with
String_tophit_description is ‘profilin [Penaeus monodon]’ this
gene was being definition ‘profilin’ [76]. Profilin is an actin-
binding protein involved in the dynamic turnover and restructur-
ing of the actin cytoskeleton. It was first described in the early
1970s as the first actin monomer binding protein [77]. Profilin is
important for spatially and temporally controlled growth of actin
microfilaments which is an essential process in cellular locomotion
and cell shape changes. Profilin also binds sequences rich in the
amino acid proline in diverse proteins. While most profilin in the
cell is bound to actin and it seems to be involved in activities in the
nucleus such as mRNA splicing [78]. The KEGG PATHWAY
was named ‘ko04711’ which was described by Stanewsky R. (2003)
[79]. Its name was ‘Circadian rhythm - fly’. Circadian rhythm is
an internal biological clock, which enables to sustain an
approximately 24-hour rhythm in the absence of environmental
cues. The core of the circadian clock consists of molecular
feedback loops where per and tim gene products (PER and TIM
proteins) eventually turn off their own transcription. The large
number of queries in this study that were not functionally
annotated and classified may be the result of limited availability of
genetic information in Genbank or they are novel genes of GFP.
In summary, in this study we identified many DEGs after
enrichments among the 4 groups. However, no DEGs with
relationships to GFP growth were identified between A and B
groups which came from different places (corrected P value,0.05).
But, between A1 and A2 and between B1 and B2 groups were
identified 23 DEGs relationships with growth of GFP; of those
have positive and negative impact to grow of GFP. The results
showed 4 queries (between A1 and A2 groups) joined in KEGG
PATHWAY with name ‘Circadian rhythm - fly’. All of
significantly enriched of DEGs and KEGG PATHWAY (correct-
ed P value#0.05) in this study were derived as proof for separated
of GFP in pond into big and small groups. Obviously, there is not
only genetics impact to grow of GFP, but also many factors impact
to grow of GFP in pond such as diseases, environment, nutrition,
etc.
Conclusions
In present study we used the Illumina HiSeq 2500 for de novo
sequencing which is the newest technology in NGS. We also used
the published dataset from GenBank and available resources for
Figure 11. The KEGG PATHWAY is ‘ko 04711’ with term ‘Circadian rhythm - fly’.doi:10.1371/journal.pone.0109656.g011
Transcriptome Sequencing and Comparison of DEGs in M. rosenbergii
PLOS ONE | www.plosone.org 16 October 2014 | Volume 9 | Issue 10 | e109656
analyzing the prawn transcriptome data through the model-based
methods GO and KEGG pathway. We identified 66,953
assembled isogenes and 44,715 genes but just 21,224 unigenes
were matched and annotated. The large number of isogenes and
genes that were not functionally annotated and classified may be
the result of limited availability of genetic information in Genbank
or they are novel genes of GFP. In this study we also obtained gene
expression differences among four groups of GFP and functional
annotation of DEGs based on enriched GO and KEGG
PATHWAY. Especially, we identified 23 DEGs relation with
GPF growth. The results provide good information for further
research on the mechanisms of DEGs with freshwater prawn
growth processes. The functional genomics resource generated
from our study provides a resource for future molecular research
in freshwater prawn.
Supporting Information
Table S1 The annotation and classification of isogenes.(XLS)
Table S2 The KEGG Pathway_definition.(XLS)
Table S3 The DEGs between the A and B groups.(XLS)
Table S4 The DEGs between the A1 and A2 groups.(XLS)
Table S5 The DEGs between the B1 and B2 groups.(XLS)
Table S6 The results after enrichment of DEGs betweenA and B groups.
(XLT)
Table S7 The results after enrichment of DEGs betweenA1 and A2 groups.
(XLS)
Table S8 The results after enrichment of DEGs betweenB1 and B2 groups.
(XLS)
Table S9 The 99 queries (GO) relationships with GFPgrowth.
(XLS)
Acknowledgments
The authors are grateful to the Majorbio company (Website: www.
majorbio.com) in Shanghai that offered facilities and technical assistance to
conduct our experiments and we thank Mr. William Templin from Gene
Conservation Laboratory in USA for his language editing of the
manuscript.
Author Contributions
Conceived and designed the experiments: HNT LZ QL. Performed the
experiments: HNT LZ QL. Analyzed the data: HNT LZ QL. Contributed
reagents/materials/analysis tools: HNT LZ QL. Contributed to the
writing of the manuscript: HNT. Collected samples and gave comments
for the manuscript: LZ. Last responsible of manuscript: QL.
References
1. Phuong NT, Hai TN, Hien TTT, Bui TV, Huong DTT, et al. (2006) Current
status of freshwater prawn culture in Vietnam and the development and transfer
of seed production technology. Fisheries Science 72: 1–12.
2. Chareontawee K, Poompuang S, Na-Nakorn U, Kamonrat W (2007) Genetic
diversity of hatchery stocks of the giant freshwater prawn (Marcrobrachiumrosenbergii) in Thailand. Aquaculture 271: 121–129.
3. FAO (2012) Fisheries Statistical Database, Global Aquaculture Production
(Fisheries Global Information System, online query).
4. Schwantes VS, Diana JS, Yi Y (2009) Social, economic, and production
characteristics of giant freshwater prawn Macrobrachium rosenbergii culture in
Thailand. Aquaculture 287: 120–127.
5. Nhan DT, Wille M, Hung LT, Sorgeloos P (2010) Effects of larval stocking
density and feeding regime on larval rearing of giant freshwater prawn
(Macrobrachium rosenbergii). Aquaculture 300: 80–86.
6. Guoliang Y, Frinsko M, Xuefeng C, Junyi W, Guo H, et al. (2012) Current
status of the giant freshwater prawn (Macrobrachium rosenbergii) industry in
China, with special reference to live transportation. Aquaculture Research 43:
1049–1055.
7. Nhan DT, Wille M, Hung LT, Sorgeloos P (2009) Comparison of reproductive
performance and offspring quality of giant freshwater prawn (Macrobrachiumrosenbergii) broodstock from different regions. Aquaculture 298: 36–42.
8. Thanh NM, Ponzoni RW, Nguyen NH, Vu NT, Barnes A, et al. (2009)
Evaluation of growth performance in a diallel cross of three strains of giant
freshwater prawn (Macrobrachium rosenbergii) in Vietnam. Aquaculture 287:
75–83.
9. Thanh NM, Nguyen NH, Ponzoni RW, Vu NT, Barnes AC, et al. (2010)
Estimates of strain additive and non-additive genetic effects for growth traits in a
diallel cross of three strains of giant freshwater prawn (Macrobrachiumrosenbergii) in Vietnam. Aquaculture 299: 30–36.
10. Thanh NM, Barnes AC, Mather PB, Yutao L, Lyons RE (2010) Single
nucleotide polymorphisms in the actin and crustacean hyperglycemic hormone
genes and their correlation with individual growth performance in giant
freshwater prawn Macrobrachium rosenbergii. Aquaculture 301: 7–15.
11. Margulies M, Egholm M, Altman WE, Attiya S, Bader JS, et al. (2005) Genome
sequencing in microfabricated high - density picolitre reactors. Nature, 437:
376–380.
12. Shendure J, Porreca GJ, Reppas NB, Lin X, McCutcheon JP, et al. (2005)
Accurate multiplex polony sequencing of an evolved bacterial genome. Science
309: 1728–1732.
13. Mckernan K, Blanchard A, Kotler L, Costa G (2006) Reagents, methods, and
libraries for bead - based sequencing. US patent application 20080003571.
14. Jung H, Russell EL, Hung D, David AH, Sean M, et al. (2011) Transcriptomics
of a Giant Freshwater Prawn (Macrobrachium rosenbergii): de novo assembly,
annotation and marker discovery. PLoS One (6) pages e27938.
15. Maizatul IM, Kang Y, Lili Z, Tiantan T, Kwong QB, et al. (2013) In-Depth
Transcriptomic Analysis on Giant Freshwater Prawns. PLoS One 8(5): e60839.
doi:10.1371/journal.pone.0060839.
16. Nakazato T, Ohta T, Bono H (2013) Experimental design-based functional
mining and characterization of high - throughput sequencing data in the
sequence read archive. Plos One 22; 8(10): e77910.
17. Vigouroux Y, Jaqueth JS, Matsuoka Y, Smith OS, Beavis WD, et al. (2002) Rate
and pattern of mutation at microsatellite loci in maize. Mol Biol Evol, 19: 1251–
1260.
18. Chand V, de Bruyn M, Mather PB (2005) Microsatellite loci in the eastern form
of the giant freshwater prawn (Macrobrachium rosenbergii). Mol Ecol Notes 5:
308–310.
19. Uawisetwathana U, Leelatanawit R, Klanchui A, Prommoon J, Klinbunga S, et
al. (2011) Insights into eyestalk ablation mechanism to induce ovarian
maturation in the black tiger shrimp. PLoS One 6: e24427.
20. Asusens ACJ, Carlos SHJ, Arturo FCJ, Genaro DP (2012) The effects of eyestalk
ablation on the reproductive and immune function of female Macrobrachiumamericanum. Aquaculture Research and Development 3: 1–7.
21. Brady P, Elizur A, Williams R, Cummins SF, Knibb W (2012) Gene expression
profiling of the cephalothorax and eyestalk in Penaeus monodon during ovarian
maturation. International Journal of Biological Sciences 8: 328–343.
22. Zara FJ, Gaeta HH, Costa TM, Toyama MH, Caetano FH (2013) The ovarian
cycle histochemistry and its relationship with hepatopancreas weight in the blue
crab Callinectes danae (Crustacea: Portunidae). Acta Zoologica 94: 134–146.
23. Cock PJ, Fields CJ, Goto N, Heuer ML, Rice PM (2010) The Sanger FASTQ
file format for sequences with quality scores, and the Solexa/Illumina FASTQ
variants. Nucleic Acids Res. 38: 1767–71.
24. Erlich Y, Mitra PP, delaBastide M, McCombie WR, Hannon GJ (2008) Alta-
Cyclic: a self-optimizing base caller for next-generation sequencing. Nat
Methods 5: 679–82.
25. Grabherr MG, Haas BJ, Yassour M, Levin JZ, Thompson DA, et al. (2011) Full-
length transcriptome assembly from RNA-Seq data without a reference genome.
Nat Biotechnol 29: 644–52.
26. Sultan M, Schulz MH, Richard H, Magen A, Klingenhoff A, et al. (2008) A
global view of gene activity and alternative splicing by deep sequencing of the
human transcriptome. Science 321: 956–960.
27. Marguerat S, Bahler J (2009) RNA-seq: from technology to biology. Cell Mol
Life Sci 67: 569–579.
Transcriptome Sequencing and Comparison of DEGs in M. rosenbergii
PLOS ONE | www.plosone.org 17 October 2014 | Volume 9 | Issue 10 | e109656
28. Nunan LM, Arce SM, Staha RJ, Light DV (2001) Prevalence of infectious
hypodermal and hematopoietic necrosis virus (IHHNV) and white spotsyndrome virus (WSSV) in Litopenaeus vannamei in the Pacific Ocean off the
coast of Panama. J World Aquacult Soc 32: 330–334.
29. Kanehisa M, Goto S, Hattori M, Aoki-Kinoshita KF, Itoh M, et al. (2006) Fromgenomics to chemical genomics: new developments in KEGG. Nucleic Acids
Res. 34, D354–D357.30. Kanehisa M, Araki M, Goto S, Hattori M, Hirakawa M, et al. (2008) KEGG for
linking genomes to life and the environment. Nucleic Acids Res. 36, D480–
D484.31. Mortazavi A, Williams BA, McCue K, Schaeffer L, Wold B (2008) Mapping and
quantifying mammalian transcriptomes by RNA-Seq. Nat Methods 5: 621–628.32. Conesa A, Gotz S, Garcia-Gomez JM, Terol J, Talon M, et al. (2005) Blast2GO:
a universal tool for annotation, visualization and analysis in functional genomicsresearch. Bioinformatics 21: 3674–6.
33. Li R, Yu C, Li Y, Lam TW, Kristiansen K, et al. (2009) SOAP2: an improved
ultrafast tool for short read alignment. Bioinformatics 25: 713–714.34. Kanehisa M, Goto S (2000) KEGG: Kyoto Encyclopedia of Genes and
Genomes. Nucleic Acids Research 28: 27–30.35. Li B, Dewey CN (2011) RSEM: accurate transcript quantification from RNA-
Seq data with or without a reference genome. BMC Bioinformatics 12: 323.
36. Robinson MD, McCarthy DJ (2010) Smyth GK2 edgeR: a Bioconductorpackage for differential expression analysis of digital gene expression data.
Bioinformatics 26: 139–40.37. Young MD, Wakefield MJ, Smyth GK, Oshlack A (2010) Gene ontology
analysis for RNA-seq: accounting for selection bias. Genome Biol. 11 (2), R14.38. Xie C, Mao X, Huang J, Ding Y, Wu J, et al. (2011) KOBAS 2.0: a web server
for annotation and identification of enriched pathways and diseases. Nucleic
Acids Res 39: W316–22.39. Ogata H, Goto S, Sato K, Fujibuchi W, Bono H, et al. (1999) KEGG: Kyoto
Encyclopedia of Genes and Genomes. Nucleic Acids Res 27: 29–34.40. Wixon J, Kell D (2000) The Kyoto encyclopedia of genes and genomes–KEGG
Yeast 17: 48–55.
41. Altermann E, Klaenhammer TR (2005) PathwayVoyager: pathway mappingusing the Kyoto Encyclopedia of Genes and Genomes (KEGG) database. BMC
Genomics 6: 60.42. Camacho C, Coulouris G, Avagyan V, Ma N, Papadopoulos J, et al. (2009)
BLAST+: architecture and applications. BMC bioinformatics, 10: 421.43. Conesa A, Stefan G (2009) Blast2GO Tutorial. Bioinformatics and Genomics
Department, Prince Felipe Research Center, Valencia, Spain.
44. Reiner A, Yekutieli D, Benjamini Y (2003) Identifying differential expressedgenes using false discovery rate controlling procedures. Bioinformatics, 19: 368–
75.45. Robinson MD, Smyth GK (2007) Moderated statistical tests for assessing
differences in tag abundance. Bioinformatics, 23: 2881–2887.
46. Carlson J (2009) Trinity Health’s ch-ch-changes. New C-suit e jobs aim to putfocus on ambulatory care. Modern healthcare, 39: 17.
47. Mitchell SG, Khanra S, Miras HN, Boyd T, Long DL, et al. (2009) The trinityof polyoxometalates: connecting Keggin and Dawson clusters to triangles.
Chemical communications 2712–4.48. Trapnell C, Williams BA, Pertea G, Mortazavi A, Kwan G, et al. (2010)
Transcript assembly and quantification by RNA-Seq reveals unannotated
transcripts and isoform switching during cell differentiation. Nature biotechnol-ogy, 28: 511–5.
49. Hochberg YY (2005) Controlling the False Discovery Rate: A Practical andPowerful Approach to Multiple Testing. Journal of the Royal Statistical Society,
57.
50. Jianguo LEP, Haibao T, Joshua L, Zhanjiang L (2012) Profiling of geneduplication patterns of sequenced teleost genomes evidence for rapid lineage-
specific genome expansion mediated by recent tandem duplications. BMCgenomics, 13.
51. MikelAickin P, Helen G (1996) Adjusting for multiple testing when reporting
research results the Bonferroni vs Holm methods. American Journal of PublicHealth, 86.
52. Tang H, Wang X, Bowers JE, Ming R, Alam M, et al. (2008) Unraveling ancienthexaploidy through multiply-aligned angiosperm gene maps. Genome Res, 18:
1944–54.53. Young P (1989) pValue Adjustments for Multiple Tests in Multivariate Binomial
Models. Journal of the American Statistical Association, 84: 780–6.
54. Suchonma S, Fanyue S, Zhanjiang L, Anchalee T (2013) RNA-Seq analysisreveals genes associated with resistance to Taura syndrome virus (TSV) in the
Pacific white shrimp Litopenaeus vannamei. Developmental and ComparativeImmunology, 41: 523–533.
55. Keyi M, Gaofeng Q, Jianbin F, Jiale L (2012) Transcriptome Analysis of the
Oriental River Prawn, Macrobrachium nipponense using 454 Pyrosequencing forDiscovery of Genes and Markers. PLoS ONE 7(6): e39727. 1–11.
56. Wang J-PZ, Lindsay BG, Leebens-Mack J, Cui L, Wall K, et al. (2004) EST
clustering error evaluation and correction. Bioinformatics, 20: 2973–2984.
57. Liang H, Carlson JE, Leebens-Mack JH, Wall PK, Mueller LA, et al. (2008) An
EST database for Liriodendron tulipifera L. floral buds: the first EST resource
for functional and comparative genomics in Liriodendrom. Tree Genet Genom
4: 419–433.
58. Mittapalli O, Bai X, Mamidala P, Rajarapu SP, Bonello P, et al. (2010) Tissue-
specific transcriptomics of the exotic invasive insect pest emerald ash borer.
PLoS One 5: e13708.
59. Minet-Quinard R, Moinard C, Villie F, Vasson MP, Cynober L (2004)
Metabolic pathways implicated in the kinetic impairment of muscle glutamine
homeostasis in adult and old glucocorticoid-treated rats. Am J Physiol
Endocrinol Metab 287: E671–676.
60. Sookruksawong S, Pongsomboon S, Tassanakajon A (2013) Genomic organi-
zation of the cytosolic manganese superoxide dismutase gene from the Pacific
white shrimp, Litopenaeus vannamei, and its response to thermal stress. Fish
Shellfish Immunol 35(5): 1395–405. doi:10.1016/j.fsi.2013.08.003.
61. Chen JM, Dando PM, Rawlings ND, Brown MA, Young NE, et al. (1997)
Cloning, isolation, and characterization of mammalian legumain, an asparaginyl
endopeptidase. J Biol Chem 272: 8090–8.
62. Hara-Nishimura I (1998) Asparaginyl endopeptidase. In: Barrett AJ, Rawlings
ND, Woessner JF. Handbook of Proteolytic Enzymes. London: Academic Press:
746–749.
63. Dalton JP, Brindley PJ (1998) Schistosome legumain. In: Barrett AJ, Rawlings
ND, Woessner, JF. Handbook of Proteolytic Enzymes. London: Academic Press:
749–754.
64. Chen JM, Rawlings ND, Stevens RAE, Barrett AJ (1998) Identification of the
active site of legumain links it to caspases, clostripain and gingipains in a new
clan of cysteine endopeptidases. FEBS Lett. 441: 361–365.
65. Inaba T, Roberts WM, Shapiro LH, Jolly KW, Raimondi SC, et al. (1992)
Fusion of the leucine zipper gene HLF to the E2A gene in human acute B-
lineage leukemia. Science 257(5069): 531–4.
66. Vlahopoulos SA, Logotheti S, Mikas D, Giarika A, Gorgoulis V, et al. (2008)
The role of ATF-2 in oncogenesis. BioEssays 30(4): 314–27.
67. Manna PR, Dyson MT, Eubank DW, Clark BJ, Lalli E, et al. (2002) Regulation
of steroidogenesis and the steroidogenic acute regulatory protein by a member of
the cAMP response-element binding protein family. Mol. Endocrinol. 16(1):
184–99.
68. Hoare S, Copland JA, Wood TG, Jeng YJ, Izban MG, et al. (1999) Identification
of a GABP alpha/beta binding site involved in the induction of oxytocin
receptor gene expression in human breast cells, potentiation by c-Fos/c-Jun.
Endocrinology 140(5): 2268–79.
69. Bennett V, Baines AJ (2001) Spectrin and ankyrin-based pathways: metazoan
inventions for integrating cells into tissues. Physiol. Rev. 81(3): 1353–92. PMID
11427698.
70. Minton AP (1992) Confinement as a determinant of macromolecular structure
and reactivity. Biophys. J. 63(4): 1090–100.
71. Doherty GJ, McMahon HT (2008) Mediation, Modulation and Consequences
of Membrane-Cytoskeleton Interactions. Annual Review of Biophysics 37: 65–
95.
72. Chen S, Yin X, Zhu X, Yan J, Ji S, et al. (2003) The C-terminal kinase domain
of the p34cdc2-related PITSLRE protein kinase (p110C) associates with p21-
activated kinase 1 and inhibits its activity during anoikis. J Biol Chem 278:
20029–36.
73. Morgan DO (2007) The Cell Cycle: Principles of Control. London: New Science
Press, 1st ed.
74. Siddle K, Urso B, Niesler CA, Cope DL, Molina L, et al. (2001) Specificity in
ligand binding and intracellular signalling by insulin and insulin-like growth
factor receptors. Biochem Soc Trans 29: 513–25.
75. Hernandez-Sanchez C, Werner H, Roberts CTJ, Woo EJ, Hum DW, et al.
(1997) Differential regulation of insulin-like growth factor-I (IGF-I) receptor gene
expression by IGF-I and basic fibroblastic growth factor. J Biol Chem; 272 (8):
4663–70.
76. Shao J, Welch WJ, Diprospero NA, Diamond MI (2008) Phosphorylation of
profilin by ROCK1 regulates polyglutamine aggregation. Mol Cell Biol 28:
5196–208.
77. Carlsson L, Nystrom LE, Sundkvist I, Markey F, Lindberg U (1977) Actin
polymerizability is influenced by profilin, a low molecular weight protein in non-
muscle cells. J. Mol. Biol. 115(3): 465–83.
78. Di Nardo A, Gareus R, Kwiatkowski D, Witke W (2000) Alternative splicing of
the mouse profilin II gene generates functionally different profilin isoforms. J.
Cell. Sci. 113(Pt 21): 3795–803. PMID 11034907.
79. Stanewsky R (2003) Genetic analysis of the circadian system in Drosophila
melanogaster and mammals. J Neurobiol 54: 111–47.
Transcriptome Sequencing and Comparison of DEGs in M. rosenbergii
PLOS ONE | www.plosone.org 18 October 2014 | Volume 9 | Issue 10 | e109656
Related Documents