Annual Report 2009 Take a sip of the ocean

Welcome message from author
This document is posted to help you gain knowledge. Please leave a comment to let me know what you think about it! Share it to your friends and learn new things together.
Transcript

Annual Report 2009
Take a sip of the ocean

3 ABOUT ALFA LAVALAlfa Laval in brief 3
Natural processes – Introduction 5
2009 in brief 6
President’s comments 8
The share 10
Article 12
Business model and financial goals 14
Natural process # 1 – Fluid handling 16
Growth strategy 17
Natural process # 2 – Separation / filtration 19
Structural changes 20
Key technologies 22
Research and development 24
Group overview 26
Article 28
Divisions 30
Operations Division 32
Equipment Division 34
Process Technology Division 36
Natural process # 3 – Heat transfer 38
Parts & Service 40
Employees 42
44 SUSTAINABILITYReport 44
Cases 46
Natural process # 4 – Heat transfer 48
49 FINANCIAL STATEMENTSBoard of Directors’ Report 50
Consolidated cash flows 62
Comments to the consolidated cash-flows 63
Consolidated comprehensive income 64
Comments to the consolidated
comprehensive income 65
Consolidated financial position 68
Comments on the consolidated
financial position 70
Changes in consolidated equity 71
Comments on changes
in consolidated equity 73
Parent company cash flows 74
Parent company income 74
Parent company financial position 75
Changes in parent company equity 76
Notes to the financial statements 77
Accounting principles 77
Objectives, policies and processes
for managing capital 83
Financial risks 84
Operational risks 87
Notes 90
Proposed disposition of earnings 118
Audit Report 119
Natural process # 5 – Separation / filtration 120
Ten-year overview 132
Definitions 134
121 CORPORATE GOVERNANCE Corporate Governance Report 121
Board of Directors and Auditors 128
Group Management 130
Financial information 135
Annual General Meeting 2010 135
Contents
H2O.More than three quarters of our planet is covered by water. Unfortunately, 97.5% of it is salty. So, ironically, about 500 million people living in coastal areas don’t have enough water to drink. Desalination of sea water is therefore a very important process. Not just for people, but also to ensure that different types of industry run smoothly. Alfa Laval has revolutionized this field with a completely new technology that’s space-saving, energy-efficient, reliable and long-lasting. Providing thirsty people with what they most desire: a glass of fresh water.
Pure Performance: Water. Oil. Chemicals. Beverages. Foodstuffs. Starch. Pharmaceuticals. You name it. Alfa Laval is helping most types of industries to refine and improve their products and to optimise the performance of their processes. Time and time again. Our equipment, systems and service are hard at work in more than 100 countries. Helping to create better living conditions for mankind. That’s a task that keeps us fully occupied.

3 Alfa Laval Annual Report 2009 / About Alfa Laval
Alfa Laval has developed products since 1883, with the vision of creating better everyday conditions for people. Today, Alfa Laval’s products are highly topical since the world is increasingly focusing on saving energy and protecting the environment. This involves treating water, reducing carbon emissions and minimizing water and energy consumption, as well as heating, cooling, separating and transporting food. These areas, which impact us all in various ways, represent the core of Alfa Laval’s expertise.
Alfa Laval in brief
Three key technologies to meet basic needsAlfa Laval is a leading global supplier of products and solutions for heat transfer, separation and fluid handling. The company’s key products – heat exchangers, separators, pumps and valves – currently play a vital role in areas that are crucial for society, such as energy, the environment and food. Alfa Laval’s products are used in the manufacturing of food, chemicals, pharmaceuticals, starch, sugar and ethanol. They are also used in nuclear power, onboard vessels and in the engineering sector, mining industry and refinery sector, as well as for treating wastewater and creating a comfortable indoor climate. They can also be used to reduce the consumption of energy and water and minimize carbon emissions. Who wouldn’t benefit from such solutions?
11,773 employees, the majority of whom are located in Sweden (2,216), Denmark (1,145), India (1,410), China (969), the US (1,167) and France (816).
FoodEnergyEnvironment
1. Heat transfer2. Separation3. Fluid handling
11,773

External and internal environmental focusAlfa Laval’s broad offering includes products and services that help our customers save energy, produce freshwater, reduce emissions and mini-mize pollution. The company also aims to limit the environmental impact of its operations. In 2009, projects completed contributed to reduc-ing Alfa Laval’s emissions from transportation by about 10 percent.
-10%
+5%Market-adapted organizationAlfa Laval has two marketing and sales divisions: Equipment and Process Technology. In addition, a third division known as Operations is responsible for product-related purchasing, manufacturing and distribution. To ensure that Alfa Laval fulfills its business concept – to optimize the performance of customers’ processes, time and time again – the sales divisions are divided into segments that specialize in various industries. Both divisions also have well-structured aftermarket organizations that manage the installed base of products worldwide. The Parts & Service segment accounted for 28 percent of the Group’s total order intake in 2009.
Optimizing processes in nearly 100 countriesAlfa Laval’s worldwide organization helps customers in nearly 100 countries to optimize their processes. The company also has 28 major production units (15 in Europe, 8 in Asia, 4 in the US and 1 in Latin America).
Focus on profitable growthAlfa Laval aims to grow at a faster rate than its competitors, while maintaining favorable profit-ability. The company’s goal is to achieve an average annual growth rate of at least 5 percent over a business cycle. This growth should occur organically, through existing products and ser-vices, as well as through acquisitions that add complementary products and sales channels, thereby bolstering the company’s already leading position in selected markets. A total of six acquisitions were carried out in 2009, adding 5 percent in sales volumes.
SEK 654 million
Outcome for 2009In the wake of the financial crisis and a weaker global economic growth rate, Alfa Laval’s sales declined 6 percent during the year to SEK 26,039 million.
Continued focus on research and developmentTo strengthen its competitiveness, maintain its leading position and ensure continued profitable growth, Alfa Laval continuously develops products and services. In 2009, ap-proximately 2.5 percent of the company’s sales were devoted to research and develop-ment initiatives.

NATURAL PROCESSES
Water is a basic requirement for all life on earth. And clean water is a requirement for a good life.
More than three-quarters of our planet is covered by water. Unfortunately, 97.5 percent of this is salt water. The problem with the little water that remains is that it is mostly tied up in glaciers and groundwater located so far underground that it cannot be retrieved.
This leaves less than 1 percent of the world’s fresh water available for human use, and this water must be sufficient for both industrial and private use – for example, as drinking water. The United Nations estimates that approximately 1.1 billion people have inadequate access to clean drinking water, a figure that is expected to increase to 2.3 billion by 2025.
At Alfa Laval, we are more than aware of this problem. In fact, our aim is that our products and services should con-tribute to minimizing the negative effects felt by the environ-ment and people.
Focus must be placed on desalinating water – for which we have developed a revolutionary technology – as well as on puri-fying water, reducing carbon emissions, minimizing water and energy consumption, heating, cooling and transporting food.
In this Annual Report, you will find a number of interesting examples of biological phenomena taken from the animal world. These can be found under the heading “Natural processes.” These natural processes also reflect Alfa Laval’s three key technologies: heat transfer, separation and fluid handling.
Mother Nature is as wise as she is fragile. That is why these examples serve as a symbol of our way of working and the vision of our operations – to improve conditions for people in their everyday lives.

6 Alfa Laval Annual Report 2009 / About Alfa Laval
2009 in brief
SEK 21,539 millionOrder intake amounted to SEK 21,539 million (27,464).
SEK 4,585 millionOperating income* declined to SEK 4,585 million (6,160) and the operating margin was 17.6 percent (22.1)
SEK 2.50The Board proposes a dividend of SEK 2.50 (2.25) per share for 2009.
The year in picturesCompletion of the world’s tallest building, Burj Khalifa, for which Alfa Laval supplied the climate system.
Launch of Compabloc 120 and opening of the process line for the product in Fontanil, France.
Two major, Russian refinery orders received in the area of heat recovery/energy efficiency.
Launch of ART, a new flow reactor for large-scale production of pharmaceuticals.
Parts & Service remained resilient during the year and its share of the Group’s order intake grew.
Global cooperation agreement signed with Statoil Hydro.
Opening of the expanded Alfa Laval Packinox plant in Chalon-sur-Saône, France.
1 32 4 5Acquisition of six companies, which added a combined total of approximately 5 percent to the company’s growth. The acquisitions included LHE, a Korean supplier of compact heat exchangers for the oil and gas, marine, nuclear power, process and HVAC industries. LHE reported sales of about SEK 650 million in 2009, with 170 employees.
1
4
2
5
7
3
6
1 2
6
* Adjusted EBITA

7
1) Adjusted EBITDA – Operating income before depreciation, amortization of goodwill and amortization of other surplus values, adjusted for items affecting comparability.
2) Adjusted EBITA – Operating income before amortization of goodwill and other surplus values, adjusted for items affecting comparability.
3) Board proposal to the Annual General Meeting.
4) Free cash flow is the sum of cash flow from operating and investing activities.5) Number of employees at year-end.6) Percentage change between 2008 and 2009.
0
5,000
10,000
15,000
20,000
25,000
30,000
09080706050
1,000
2,000
3,000
4,000
5,000
09080706050
1,300
2,600
3,900
5,200
6,500
09080706050
5
10
15
20
25
Order intake Free cash flow* Operating margin
Order intake rose to SEK 21,539 million in 2009, com -pared with SEK 18,516 million in 2005. Order intake declined 28 percent* in 2009 compared with 2008.
* Excluding exchange-rate variations.
Alfa Laval generated free cash flow of SEK 4,631 million (3,023) in 2009.
* Including cash flow from operating activities, capital expenditure and financial net paid.
The adjusted EBITA margin, or operating margin, amounted to 17.6 percent in 2009, compared with 10.8 percent in 2005.
Amounts in SEK million unless otherwise stated +/- %6) 2009 2008 2007 2006 2005
Order intake -22 21,539 27,464 27,553 24,018 18,516
Net sales -6 26,039 27,850 24,849 19,802 16,330
Adjusted EBITDA 1) -23 4,976 6,464 5,245 3,273 2,030
Adjusted EBITA 2) -26 4,585 6,160 4,980 3,010 1,766
Operating margin (adjusted EBITA 2)), % 17.6 22.1 20.0 15.2 10.8
Profit after financial items -30 3,760 5,341 4,557 2,375 1,099
Return on capital employed, % 33.6 53.8 54.2 35.9 22.7
Return on shareholders’ equity, % 24.5 42.8 44.1 25.3 16.0
Earnings per share, SEK -27 6.42 8.83 7.12 3.78 1.98
Dividend per share, SEK +11 2.503) 2.25 2.25 1.56 1.28
Equity per share, SEK +19 28.98 24.40 17.80 15.30 13.00
Free cash flow per share, SEK 4) +1 6.46 6.38 3.60 2.33 2.13
Equity ratio, % 46.7 36.1 34.2 36.4 35.9
Debt/equity ratio, % 4 20 30 22 35
Number of employees 5) -6 11,390 12,119 11,395 10,115 9,429
4
6
3
18,516
942
1,766
24,018
2,1323,010
27,553
2,464
4,980
27,464
3,023
4,631 6,160
4,585
10.8
15.2
20.0
22.1
17.6
5 7
21,539

8 Alfa Laval Annual Report 2009 / About Alfa Laval
President’s comments
Resilient earnings in 2009In a year characterized by challenging conditions, Alfa Laval’s substantial order intake and early implementation of savings measures helped to bolster sales and earnings. Revenues declined 14 percent to SEK 26.0 billion, while operating income fell to SEK 4.6 billion. The operating margin was 17.6 percent. Two savings programs were initiated during the year with the goal of reducing costs by more than SEK 900 million starting in 2010. These programs included personnel reductions corresponding at year-end to 1,400 full-time positions. The non-recurring cost for the two programs was approximately SEK 495 million.
Order intake declined 28 percent to SEK 21,539 million and was impacted by the negative investment climate that arose in the wake of the global financial crisis. Following a sharp decline in the first six months of the year, order intake stabilized at the same absolute level as in the second quarter. Demand also recovered in Asia and Latin America during the second half of the year, partly driven by a favorable demand situation in China and India and increased raw material prices.
The most significant decline among the Group’s business segments was noted in Marine & Diesel and Process Industry. Marine & Diesel was impacted by the low order intake in the shipbuilding industry, as well as the fact that 7 percent of the order backlog at the beginning of the year was cancelled. The Power and Environment business units continued to experience favorable demand, partly due to the continued expansion of nuclear power in China, while the Parts & Service business segment displayed good resilience. Capacity utilization in the service centers was favorable and the operations were affected only marginally by the savings programs. At year-end, the aftermarket business, which remained a top priority, accounted for 28 percent of the Group’s order intake.
After a challenging year, it is gratifying to be able to say that Alfa Laval remains an attractive company. The number of shareholders increased to 33,780, which means that this figure has tripled in five years. Interest among analysts also continued to grow, with more than 20 analysts monitoring Alfa Laval on a continuous basis.
Continued acquisitions
Acquisitions remain a priority for Alfa Laval, which mainly seeks out companies that complement the Group’s current business in terms of products, geography or by adding new sales channels. Acquisitions added 5 percent to Alfa Laval’s sales growth in 2009* and an additional 1 percent in January 2010. The average level of growth for the past five years was nearly 4 percent. In the future, we intend to maintain our plan of adding 3 to 4 percent annually to the Group’s volume growth through acquisitions.
*For information on all acquisitions conducted during the year, refer to page 18.

9
Through the acquisition of two companies in the aftermarket business, Alfa Laval gained access to supplementary sales channels. The companies, which reported combined sales of SEK 300 million in 2008, added approximately 5 percent to our aftermarket sales.
The acquisition of a South Korean system provider, with sales of SEK 150 million, expanded the Group’s local presence and provided a supplementary sales channel for the key shipbuilding and diesel power markets in Asia. In South Korea, the Group also acquired 90 percent of the shares in LHE, a company in the market for plate heat exchangers. The acquisition strengthened Alfa Laval’s presence in the country and generated opportunities for further market penetration in other areas of Asia. LHE, which reported sales of SEK 650 million in 2009, will continue to offer its own product range, under the LHE brand, through its existing sales network.
Sustainability initiatives – part of Alfa Laval’s daily business
Alfa Laval’s broad offering includes products and services that help our customers save energy, produce freshwater and reduce emissions. Ultimately, we hope that our products will help create better conditions for people in their everyday lives. One example of this is an order received in 2009 from one of Russia’s largest refineries, where Alfa Laval’s energy-efficient heat exchangers are being used to minimize energy consumption, thereby reducing emissions by an amount corresponding to the emissions generated by all passenger cars in Stockholm in one year, approximately 850,000 tons of CO2.
However, the aim of creating better conditions for people is not limited to offering efficient and clean products. It includes all aspects of our operations. Accordingly, Alfa Laval is also governed by its environmental impact, social responsibility, business ethics and transparency. In 2009, the Group’s sustainability initiatives included continued efforts to reduce carbon emissions, the development of a new occupational safety policy and an expansion of the supplier development process.
Continued belief in long-term driving forces
Alfa Laval conducts operations in the areas of energy, the environment and food, areas that we believe offer long-term potential given the world’s focus on solutions designed to conserve energy, protect the environment and ensure hygienic food production. Markets such as China, India, Brazil and Russia are also believed to offer long-term development opportunities.
During the past five years, investments in research and develop-ment have increased 65 percent in absolute terms, with energy and the environment being assigned special priority. At the same time, we have continued to invest in boosting our presence in the BRIC countries. In 2009, 45 percent of Alfa Laval’s order intake came from Asia, Latin America and Eastern Europe.
New and efficient products, the ultimate result of our investments in research and development, serve as the foundation for profitability. Accordingly, Alfa Laval launches between 35 and 40 new products every year to meet the current and future needs of its customers. Among other effects, this has resulted in the introduction of heat exchangers with double heat-recovery capacity in the process industry and products that enable even more efficient separation of fluids in oil extraction, which reduces the impact on the environment. These new products also cut our customers’ total investment cost.
Optimizing processes, time and time again
In addition to new and efficient products, it is crucial that Alfa Laval’s operations are continuously renewed and streamlined. As part of these efforts, we initiated extensive activities during the year to make our internal processes simpler, faster and more reliable. This will ensure that the overall level of quality experienced by our customers improves at the same time as the company becomes more efficient.
Moreover, during the past two years, new executives have been appointed to more than half of Alfa Laval’s 100 top positions. These positions were advertised internally, giving Group employees the chance to participate in an open recruitment process. This provided many employees with new development opportunities, which is important, because as employees develop, so does Alfa Laval.
I am convinced that the prioritized activities and measures we implemented during the economic downturn will enable Alfa Laval to strengthen its positions when demand recovers.
Finally, I would like to extend my warm and sincere thanks to all employees in the Alfa Laval Group for their outstanding performance under extraordinary conditions.
Lund, March 2010
Lars RenströmPresident and Chief Executive Officer
Visit aboard the Wallenius-owned ship m/v FEDORA to study a PureBallast system installed on the vessel.

10 Alfa Laval Annual Report 2009 / About Alfa Laval
The share
With the prospect of improved economic conditions, 2009 was a strong year for shares. The market recovered much of the ground lost in the preceding year’s slump and Alfa Laval’s share rose from SEK 67.50 to SEK 99.00, corresponding to an increase of nearly 47 percent. The highest closing price during the year was SEK 100.20 and the lowest was SEK 55.00. The stock exchange as a whole (OMX Stockholm index) also rose 47 percent, while the industrial sector (SX Industrials index) increased a few additional percentage points, ending the year up 50 percent.
The company’s total market capitalization at year-end 2009 was SEK 41.8 billion (28.6). Alfa Laval is included in the Large Cap segment of the OMX Nordic Exchange Stockholm, as well as the OMXS30 index, which includes the companies with the stock exchange’s 30 most-traded shares. According to the classification of the OMX Nordic Exchange Stockholm, Alfa Laval is included in the Industrials sector.
Shares in Alfa Laval were first listed on the stock exchange as early as 1901. However, the company was purchased and delisted in 1991 and later relisted on May 17, 2002. Since the company’s relisting, yields (including reinvested dividends) have totaled 428 percent. This corresponds to an average annual return of 24 percent over the seven and a half years the company has been listed on the stock market, compared with the 8 percent annual return for the stock market as a whole during the same period, as measured by the SIX Return Index.
Share turnover*
The introduction of the Markets in Financial Instruments Directive (MiFID) changed the structure of share trading in Europe, resulting in more fragmented trading. Alfa Laval’s share is now no longer traded exclusively on the NASDAQ OMX Exchange in Stockholm, but also on several other marketplaces. However, the OMX Nordic Exchange Stockholm accounts for the absolute majority of trading.
In 2009, 73 percent of the trading of shares in Alfa Laval was conducted on the NASDAQ OMX Exchange in Stockholm.
The liquidity in trading of Alfa Laval’s shares is favorable, and 957 (1,127) million shares in the company were traded in 2009 at a value of SEK 71.6 billion (89.8). This corresponds to a turnover rate of 2.25 (2.58) times the company’s total number of outstanding shares.
During the year, an average of slightly more than 2,700 (1,750) share transactions per day were completed in Alfa Laval shares. Each transaction averaged more than 1,400 (2,554) shares.
Dividend policy
The Board of Directors’ goal is to regularly propose a dividend that reflects the Group’s performance, financial status and current and expected capital requirements. Taking into account the Group’s cash-generating capacity, the goal is to pay a dividend of between 40 and 50 percent of net profit over a business cycle, adjusted for surplus value. For 2009, the Board has proposed that the Annual General Meeting approve a dividend of SEK 2.50 (2.25). The proposed dividend corresponds to 36 percent (24) of net profit, adjusted for surplus value.
Share capital
Prior to the 2009 Annual General Meeting on April 20, the Board proposed that all 7.3 million treasury shares held by the company as a result of repurchases be cancelled. The Meeting approved this proposal. The cancellation of the shares corresponded to a reduction in share capital of SEK 19.2 million, which was offset through a bonus issue of the same amount. As a result of this decision, the company’s total number of shares decreased by 7.3 million to 422 million, while the company’s share capital of SEK 1,117 million remained unchanged. The par value at year-end was SEK 2.65 (2.60) per share.
Alfa Laval shares rose 47 percent
*Source: Fidessa
0
20,000
40,000
60,000
80,000
100,000
DecNovOctSeptAugJulyJuneMayAprMarchFebJan40
60
80
100
120
0
100
200
300
400
500
600
700
0
100
200
300
400
500
600
700
02 03 04 05 06 07 08 09
Price trend, January 1 – December 31, 2009 Total return, May 17, 2002 – December 31, 2009
SEK SEK SEKNumber of shares (000s)
Share turnover per month. Refers to the number of shares traded on NASDAQ OMX Nordic Exchange Stockholm.
Alfa Laval Alfa Laval
OMX Stockholm SIX Return
OMX Stockholm Industrials

11
Ten largest owners at December 31, 2009
No. of shares
Capital/Voting rights, %
Change in 2009, %
Tetra Laval B.V. 78,976,056 18.7 0.31
Alecta Pension Insurance 32,470,000 7.7 2.49
Swedbank Robur Funds 24,708,985 5.9 0.05
AMF Insurance and Funds 21,711,459 5.1 -0.76
Lannebo Funds 9,795,000 2.3 1.63
Norwegian state 7,787,085 1.8 1.85
AFA Insurance 7,417,470 1.8 -1.24
First AP Fund 7,206,488 1.7 0.91
Folksam - KPA - Förenade Liv 6 ,317,788 1.5 0.23
Fourth AP Fund 5,991,138 1.4 0.02
Total ten largest shareholders 202,381,469 48.0
Ownership distribution by size at December 31, 2009
No. of shareholders
No. of share- holders, %
No. of shares
Holding, %
1 – 500 18,188 53.8 3,965,709 0.9
501 – 1,000 6,181 18.3 5,223,115 1.2
1,001 – 5,000 7,003 20.7 16,676,245 4.0
5,001 – 10,000 998 3.0 7,467,761 1.8
10,001 – 15,000 323 1.0 4,052,148 1.0
15,001 – 20,000 212 0.6 3,844,370 0.9
20,000 – 874 2.6 380,810,168 90.2
Ownership categories at December 31, 2009
No. of shares Holding, %
Financial companies 156,978,955 37.2
Social insurance funds 19,228,346 4.6
Government and municipalities (Sweden) 2,835,724 0.7
Trade organizations 9,766,294 2.3
Other Swedish legal entities 12,664,686 3.0
Shareholders domiciled abroad (legal entities and individuals)
186,221,316
44.1
Swedish individuals 29,619,458 7.0
Uncategorized legal entities 4,724,687 1.1
Data per share
2009 2008 2007 2006 2005
Market price at year-end, SEK 99.00 67.50 91.00 77.25 42.75
Highest paid, SEK 100.20 107.25 125.25 78.00 43.10
Lowest paid, SEK 55.00 46.40 72.75 39.25 24.60
Shareholders’ equity, SEK 29.00 24.40 17.80 15.30 13
Earnings per share 6.42 8.83 7.12 3.78 1.98
Dividend, SEK 2.501) 2.25 2.25 1.56 1.28
Unrestricted cash flow, SEK 2) 6.46 6.38 3.60 2.33 2.13
Price change during the year, % +47 -23 +18 +80 + 60
Dividend as % of EPS, % 38.9 25.5 31.6 41.4 64.4
Direct return, % 3) 2.5 3.3 2.5 2.0 3.0
Market price/shareholders’ equity, times
3.4
2.8
5.1
5.0
3.6
P/E ratio 4) 15 8 13 20 22
No. of shareholders 33,780 28,078 16,090 12,178 10,964
All shares carry equal voting rights and equal right to the company’s assets. Alfa Laval has no options outstanding that could create a dilution effect for shareholders.
No new mandate to repurchase shares has been established since the 2009 Annual General Meeting. The Board of Directors’ proposal to the 2010 AGM is for a mandate to repurchase up to 5 percent of the oustanding shares until the 2011 AGM. The shares will be repurchased with the purpose to cancel them and reduce the share capital.
Alfa Laval’s shareholders
In 2009, Alfa Laval gained nearly 12,000 new shareholders. The net number of shareholders increased by slightly more than 5,700 to 33,800. The ten largest shareholders at year-end 2009 held 48 percent (45.9) percent of the shares. The single largest shareholder is Tetra Laval B.V., which held 18.7 percent (18.4) of the shares in Alfa Laval at year-end 2009.
0
1
2
3
09080706050
20
40
60
05,000
10,00015,00020,00025,00030,00035,000
09080706050
25
50
75
100
0908070605
1.28
2.25
1.56
2.25
10,964 12,178
16,090
28,078
33,78052
36 36
2924
Dividend and percentage of net profit**
Total number of shareholders
Geographic distribution of the free float, % of capital and voting rights
SEK % %
* Board proposal to AGM.**Adjusted for surplus values.
Excluding Tetra Laval (Netherlands) 18.7 percent.
Sweden
USA
UK
Others
1) Board proposal to the AGM2) Free cash flow is the sum of cash flow from operating and investing activities.3) Measured as proposed dividend in relation to closing price on last trading day.4) Closing price last trading day in relation to earnings per share.
2.50*

12 Alfa Laval Annual Report 2009 / About Alfa Laval
Of all the freshwater on the planet, less than 1 percent is available to mankind. The rest is tied up in glaciers and polar ice or in groundwater so far below surface that it is not possible to extract. “The problem is that the water is not at the right place at the right time,” says Håkan Tropp, project director at the UNDP Water Governance Facility at the Stockholm International Water Institute.
Of the freshwater that is used worldwide, roughly 70 percent goes for agriculture. Industry uses 20 percent and households use the remaining 10 percent. Meanwhile, highly industrialized nations tend to use more water per capita than developing nations.
The United Nations estimates that every sixth person in the world (or some 1.1 billion people) faces inadequate access to safe drinking water. By 2025, according to UN projections, water shortages will affect 2.3 billion people in about 50 of the world’s 200 nations.
Population and economic growth across Asia and the rest of the developing world is a major factor driving freshwater scarcity. The earth’s human population is predicted to rise from 6 billion to about 9 billion by 2050, the UN reports. Feeding them will mean more irrigation for crops. Meanwhile, global warming could disrupt water flow patterns, further reducing the availability of drinking water.
Article
Every sixth person in the world today lacks access to safe drinking water, and the situation is expected to deteriorate. Population, pollution and climate put the squeeze on potable supplies, making water a priority on political and corporate agendas.
Join the water watch
“ The problem is that the water is not at the right place at the right time.”Håkan Tropp, project director at the UNDP Water Governance Facility at the Stockholm International Water Institute

13
“We are in a situation where we need to protect our water sources in order to secure clean freshwater in the future,” says Arjen Hoekstra, professor in Multidisciplinary Water Management at the University of Twente in the Netherlands and author of several books on water policy. “The pace of change is slow. There has been an attitude change in recent years, and water is becoming an issue on the political arena and in industry. Still, there is a lot of room for improvement.”
Efficiency measures increasingly important
But the issue is complex, and one main obstacle is money. Says Tropp: “To a large extent, the water crisis is an agricultural crisis. In agriculture, more efficient irrigation systems could do a tremendous amount, and the technology is there. The question is - who is going to pay for it?”
Another problem, he notes, is that in most instances the price on water is too low and often subsidized by states. This means that there has been little economic incentive, even on the part of industry, to save on water. However, reducing water usage through efficiency measures and reuse will become increasingly important as supplies decrease.
All industries produce wastewater. Some use municipal water treatment facilities to clean it, while others use their own wastewater treatment plants. One trend is that wastewater is beginning to be viewed as a resource, particularly in dry nations of the Middle East and around the Mediterranean.
Water treatment technology can be used to clean wastewater so that it can be used for irrigation or cleaning purposes. In fact, water treatment technology is now so advanced that wastewater can be cleaned and reused as potable water. In Singapore, as much as 10 percent of the tap water stems from reused water. Another way to tackle freshwater scarcity is through desalination – turning seawater into freshwater. This is an expensive option but one that is feasible in coastal areas.
Water footprint in the boardrooms
Both Hoekstra and Tropp see water as the next corporate green trend. Environmental thinking has already made its way into the boardrooms.
To talk about water use, Hoekstra has coined the term “water footprint,” a concept that can be applied to nations, corporations or products.
“Companies have an operational water footprint, which basically is the water used in production,” says Hoekstra. “But the business water footprint looks at the whole process and traces the water used through the supply chain.
Corporate water footprinting offers a way to measure water use and also provides an easy way for consumers to grasp the water involved in the manufacture of a product. It takes, for example, 16,000 litres of water to produce one kilogram of beef, or 10 times more than the water needed to produce a kilogram of rice.
“Companies today are dealing with climate issues and energy issues,” says Hoekstra. “Water issues are likely to become the next big thing.”
“ We are in a situation where we need to protect our water sources in order to secure clean freshwater in the future.”Arjen Hoekstra, professor in Multidisciplinary Water Management
An imminent challenge– Alfa Laval’s solutions tackle the water scarcity
Alfa Laval continues to be at the forefront when it comes to devel-oping solutions and processes for treating water and maximizing water reuse. Its key technologies are in such areas as cleaning of wastewater and reduction of
sludge volumes, recycling of effluents, desalination of seawater and cleaning of ballast and bilge water onboard ships.
Ivar Madsen, manager for the Membrane Bioreactor unit, Energy and Environment at Alfa Laval, says a big trend now is water reuse.
“In the food industry, which is one of our major customer seg-ments and one with extremely high demands on pure water and technology, there are moves to reuse water,” he says. “It may not go back into production, but it can be used for, for example, cleaning purposes.”
Alfa Laval offers several solutions to tackle water scarcity and water reuse. Producing water by desalination is a very energy-intensive method. Alfa Laval’s waste-heat-driven plate-based distillation evaporators use waste heat at, for example, power stations to produce drinking water.
In addition, the company offers a combination of high-speed separators, decanters, membranes and plate evaporators that reuse water before it “becomes” wastewater, thereby reducing overall water consumption.
Further downstream in the wastewater process, membranes in bioreactors provide an opportunity to reuse wastewater for irrigation and cleaning. Wastewater sludge volume is reduced with decanters and drum thickeners, thus reducing transport and disposal costs. Madsen says that a future challenge lies in optimizing the solutions to obtain even more energy-efficient processes.
“That is one of the biggest challenges right now,” he says. “And we are constantly working to improve our technology to accomplish this.”

14 Alfa Laval Annual Report 2009 / About Alfa Laval
Continuously striving to achieve or surpass established goalsAlfa Laval’s business concept is to optimize the performance in customers’ processes, time and time again. This also characterizes the company’s internal work, with Alfa Laval’s employees being driven by the objective of achieving, or preferably surpassing established goals, both large and small.
Return on capital employed, %Goal: at least 25 percent.
Despite the Group’s substantial goodwill and allocated surplus values, the goal for the return on capital employed is a minimum of 25 percent. This level was set taking into account the low level of capital tied up in operating activities.
Goal fulfillment in 2009: The return was 33.6 percent. Significant reductions in working capital and continued favorable earnings contributed to the goal being surpassed.
Financial goalsAlfa Laval’s management conducts operations based on the financial goals and benchmark values established by the Board of Directors. The combination of the Group’s three financial goals indicates the company’s ambition levels in terms of growth, profitability and capital utilization – three fundamental business components. The Board establishes the financial goal levels based on Alfa Laval’s operations and the markets in which it conducts business. The overall target is for Alfa Laval to be among the most successful companies.
Invoicing growth, %Goal: Minimum average of 5 percent annually over a business cycle.
The goal is to be attained through a combination of organic and acquired growth. The underlying organic growth of Alfa Laval’s markets is expected to be on par with average global GDP growth. To this are to be added technological shifts that are favorable for Alfa Laval, which add additional growth, and the structural changes in the world that contribute to increasing demand for Alfa Laval’s products. Globalization, a larger need for energy, increased demand for processed foods due to an improved standard of living, and more stringent environmental rules and regulations are all driving forces that boost demand.
Goal fulfillment in 2009: Invoicing declined 14 percent. The organic decline amounted to 17.3 percent while acquisitions added 2.9 percent.
Operating margin*, %Goal: 15 percent over a business cycle.
Goal fulfillment in 2009: The margin was 17.6 percent. The trend was impacted by a number of factors during the year. Negative factors included a decline in demand for Alfa Laval’s products, a less favorable mix of products sold and price pressure on contract-based sales. These factors were mitigated by the measures initiated and implemented by the company during the year to adapt capacity and costs to the prevailing demand situation and a continued high order backlog including contracts with healthy margins.
*Adjusted EBITA.
Invoicing growth, % Operating margin*, % Return on capital employed, %
Business model and financial goals
-15-10-505
1015202530
09080706050
5
10
15
20
25
09080706050
10
20
30
40
50
60
0908070605
6.810.8 22.7
15.2 35.9
20.0
54.222.1
17.6
53.8
33.6
21.4
29
11.5
-14

15
Foundation for successful operations
Alfa Laval’s ability to realize its business concept depends on the company’s three key technologies, the engineering expertise of its employees and its application know-how. The company receives additional support from its global organization and the resources invested in the further development of products and markets. The company is organized into three divisions. The Equipment Division and Process Technology Division market the company’s products and solutions – based on the key technologies of heat transfer, separation and fluid handling. The Operations Division is responsible for product-related purchasing, manufacturing and distribution. To ensure the long-term functionality of the Group’s supplied equipment and to further enhance customer relations, Alfa Laval has a well-developed global spare parts and service organization known as Parts & Service.
Strategies for continued growth
Alfa Laval’s strategies are based on developing and expanding the
Cash flow from current operations*, %Target: 10 percent of sales.
The value is below the goal for the operating margin, since organic growth normally requires an increase in working capital. In addition, taxes are paid in an amount corresponding to approximately 30 percent of earnings before tax. Regardless of the debt/equity ratio, the free cash flow will be considerable but within the framework of the debt/equity ratio target set by the Group. In 2009, cash flow from current operations amounted to 20.5 percent.
*Including taxes paid and investments in fixed assets.
Financial benchmark valuesTo supplement the Group’s financial goals, the Board of Directors has established benchmark values for three key financial ratios, which further specify the framework and goals for the operation of the company.
Debt/equity ratio, %Target: below 75 percent.
In the long term, the debt/equity ratio, meaning the capital the company borrows in relation to the carrying amount of shareholders’ equity, shall be less than 75 percent. This target has been revised from an earlier benchmark value of 100 percent. Although the ratio may increase in connection with major acquisitions, this should be viewed as merely a temporary rise, since cash flow and earnings are expected to offset this effect. At year-end 2009, the debt/equity ratio was 4 percent.
Investments, %Target: 2.5 percent of sales.
This investment level creates scope for replacement investments and an expansion of capacity in line with organic growth for the Group’s existing core products. Investments in 2009 amounted to 1.7 percent of sales, meaning below the long-term target.
company’s leading positions in well-defined market segments. This can be achieved by systematically working with existing products, further developing the aftermarket sector and establishing new market concepts and key products. It can also be achieved through acquisitions and alliances that supplement and strengthen the company. Alfa Laval has both the expertise and capacity to successfully acquire and integrate operations that enhance the company’s total offering.
Financial goals for development and dividends
Alfa Laval manages its operations to achieve financial goals for growth, operating margin and return.
Favorable earnings mean that the company is able to further invest in line with its strategies, which include investing in organic and acquired growth. This also contributes to creating shareholder value through an annual dividend to the shareholders and increased value of the company.
Debt/equity ratio, % Investments, % Cash flow from current operations*, %
0
25
50
75
100
09080706050
1
2
3
09080706050
4
8
12
16
20
0908070605
35
2.0
9.9
22
1.913.2
30
2.213.1
20
2.7
1.7
14.6
20.5
4

16 Forskning och utveckling
NATURAL PROCESS # 1
ANIMAL / Crocodile
CASE / Brewery
TECHNOLOGY / Fluid handling
Muscle controlAlthough the crocodile may be somewhat lacking in terms of brains, its heart is a highly advanced type of pump. Crocodiles are able to control their hearts, which is an advantage since the creature spends a considerable amount of time under water.
The function is based on the fact that the right chamber of the heart is equipped with special cardiac valves with pointed tooth-shaped projections. These projections fit into one an-other, which means that the valves function as a type of vent. When the vents are closed, approximately one-third of the crocodile’s blood is circulated through one of the main arteries and out into the minor arteries.
This enables the crocodile to redirect the flow of blood back through the left chamber and past the lungs while it is under water and no oxygen is available.
Many of the crocodile’s enemies probably wish the creature did not have such amazing control of its heart and muscles.
Brewery controlsThe same natural process used by the crocodile to control the flow of blood is used by a US brewery. The only difference is that the brewery uses pumps, valves and other fluid management techniques to brew beer.
While brewing beer is, at heart, a traditional craft, the process can also be refined using ultra-modern technology – carefully controlled methods and processes that place demands on the equipment involved. And this is precisely what the quality-conscious breweries behind a number of award-winning beers in the US are doing.
When the beer finally reaches the bottle or barrel, it has passed through seven products from Alfa Laval. The result? Less waste and a more consistent, superior quality.

17
Alfa Laval has identified three key areas which the company will develop to achieve profitable growth and further strengthen its market positions: current technologies, products and services; the aftermarket business; and new market concepts and complementary key products.
Current technologies, products and services-
Alfa Laval’s existing products and technologies have the potential to remain the key factors for profitable growth. The Group’s products are energy efficient and of a high quality. The company boasts strong market positions and broad geographic coverage. Alfa Laval’s
organization, which is divided into customer-based segments, simplifies and enhances the effectiveness of customer dialogs, which increases the company’s ability to understand and fulfill their specific requirements. In addition, the research and development organization helps to continuously improve the company’s offering, which further boosts its competitiveness.
Expansion of the aftermarket business-
One of the most important overall strategies for Alfa Laval is to continue to develop and expand the after- market, meaning the Group’s sales of spare parts and service. This provides customer benefits, promotes closer customer relations, provides favorable profitability
and is less sensitive to economic fluctuations. Continuous customer contacts also provide added support for new sales.
Alfa Laval has an extensive and growing base of installed equip-ment and systems worldwide. The age of the installed base differs depending on the region. In general, the products are older in Western Europe and North America and younger in Central and Eastern Europe and Asia. This means that the aftermarket poten-tial in rapidly developing countries will increase in pace with new sales. A global network of service centers and personnel makes the company well equipped to cope with this growing demand.
The company’s range of products for the aftermarket has also increased, while service agreements in particular play an increas-ingly important role. The goal is to establish an offering that con-tributes to securing and optimizing customer processes through increased accessibility and short lead times.
New market concepts and complementary key products-
Alfa Laval constantly seeks new ways of helping customers to optimize their processes. To be able to offer this service, it is important to identify requirements, as well as problems, from the customer’s perspective. Accordingly, in addition to the company’s continuous
enhancements to existing products, Alfa Laval aims to identify and add products and solutions that complement and broaden its offering. This makes the company a more complete and valuable partner, which is crucial for enhancing the company’s growth.
Strengthened geographic presence
In parallel with focused product development and an expanded service concept, Alfa Laval also aims to continuously develop sales channels to bolster and strengthen its positions in existing geographic markets. This process is an integral part of the operating activities.
Strategy for acquisitions and alliances-
Alfa Laval’s business concept of optimizing the performance in customers’ processes also forms the base for the company’s acquisition and alliance strategy. This strategy stipulates that Alfa Laval is to conduct acquisitions and form alliances that:
– strengthen the existing key technologies,
– add new key products
– contribute complementary products and distribution channels.
Growth strategy
Three ways to achieve profitable growthAlfa Laval’s goal is to grow at an average rate of at least five percent annually over a business cycle. The Group’s growth shall be accompanied by favorable profitability and exceed the growth of the market. Overall growth in the underlying markets in which Alfa Laval is active is expected to increase at a rate equal to the average global GDP growth.
1
2
3

18 Alfa Laval Annual Report 2009 / About Alfa Laval
Alfa Laval has a special central unit known as Corporate Development to facilitate work involving acquisitions and alliances in a systematic and efficient manner. This unit is responsible for developing new market concepts, supporting and facilitating the growth ambitions of the various segments, handling patent issues and conducting mergers and acquisitions. Alfa Laval has the financial strength and the management resources required to continue expanding through acquisitions. The goal is to add between 3 and 4 percent in sales growth annually.
Acquisitions during 2009
Two companies in Parts & ServiceTwo major spare parts and service suppliers, with combined sales of SEK 300 million in 2008. The companies, which provided Alfa Laval with supplementary channels for equipment and service in the aftermarket, were consolidated on January 1 and February 1, 2009, respectively.
Onnuri Industrial Machinery, South KoreaSystem supplier to the shipbuilding and diesel power markets. In 2008, the company had sales of SEK 150 million and approximately 40 employees. The acquisition provided Alfa Laval with a stronger presence and a supplementary channel to the shipbuilding and diesel power markets in Asia. Onnuri was consolidated on February 1, 2009.
HES GmbH Heat Exchanger System, GermanyProducer of spiral heat exchangers, primarily for the process industry. The company, which has been integrated into Tranter, reported sales of about SEK 85 million in 2008 and had approximately 45 employees. HES was consolidated on February 1, 2009.
PHE Indústria e Comércio de Equipamentos Ltda, BrazilA company that services plate heat exchangers in a variety of industries. PHE, which had sales of about SEK 45 million in 2008 and some 35 employees, has been integrated into Tranter. The company was consolidated on August 1, 2009.
LHE Co. Ltd, South KoreaSupplier of compact plate heat exchangers to the oil and gas, marine and nuclear power sectors, as well as the process industry and HVAC. LHE reported sales of approximately SEK 750 million in 2008 and had 170 employees. LHE, which will remain a separate organization, was consolidated on September 1, 2009.
Acquisitions and divestments 2005–2009
Between 2005 and 2009, Alfa Laval acquired 19 companies or units with overall sales of about SEK 4,010 million. This represents an average annual growth of SEK 802 million.
During the same period, only one project business with sales of SEK 100 million was divested. Divestments have been reduced in recent years and are expected to remain at a very low level, since all units in the Group are currently part of the core operations.
Year
Company
Reason*
Sales SEK million**
1999Acquisitions: Vicarb Group, France Product 425
Scandibrew, Denmark Product 70Kvaerner Hetland, US Product 50Dorr Oliver, US Product 125
Divestments: Thermotechnik 50Cardinal 40
2000Acquisitions: Separator division in
Wytworna Sprzeta, PolandProduct 20
Divestments: Tetra Pak division in an Indian subsidiary
50
Aircoil 50
2001Acquisitions: An additional 13 percent of
share capital in Alfa Laval IndiaGeography Did not
affect sales
Divestments: Rema Control 70Industrial Flow 650
2002Acquisitions: DSS, Denmark Product 90
Divestments: –
2003Acquisitions: Toftejorg, Denmark Product 210
Biokinetics, US Product/channel 550
Divestments: –
2004Acquisitions: –
Divestments: Tri-Lad 75
2005Acquisitions: Packinox, France Product 450
Divestments: –
2006Acquisitions: Tranter, US Channel 900
Fruit concentration, Sweden Channel 45Tranter, China Geography 100
Divestments: Bioengineering project transaction 100
2007Acquisitions: Fincoil, Finland Product 375
Helpman, the Netherlands Product 200DSO, US Geography 50AGC Engineering, US Geography 70An additional 13 percent of Share capital in Alfa Laval India. (Total ownership 77 percent)
Geography Did not affect sales
Divestments: –
2008Acquisitions: Standard Refrigeration, US Product/geography 220
Ageratec, Sweden Product 50Høyer Promix, Denmark Product 20Pressko, Germany Product 50Hutchison Hayes, US Channel/geography 150
Divestments: –
2009Acquisitions: P&S Multibrand Channel 200
P&S Multibrand Channel 100Onnuri, South Korea Channel/geography 150HES, Germany Product 85PHE, Brazil Geography 45LHE, South Korea Channel/geography 750An additional 12 percent of share capital in Alfa Laval India. (Total ownership 89 percent)
Geography Did not affect sales
Divestments: –
* The reason for divestment is either an assessment that the unit will not achieve the Group’s financial goals or that it is no longer part of the Group’s core operations.
** Refers to annual sales before acquisitions and divestments.

19NATURAL PROCESS # 2
ANIMAL / CrabCASE / Energy companiesTEHCNOLOGY / Separation/filtration
Separation at its bestMany people probably wonder whether crabs and other crustaceans live on sludge and other less-than-appetizing fare on the ocean floor. In fact, the opposite is true, and the marsh crab is an excellent example of this. The marsh crab has tufts on its legs that allow it to extract water from clay using these hair-like structures.
Certain species have yet another way of uti-lizing the water found in soil. When these clusters of tufts at the base of the crab’s leg comes into contact with moist clay surfaces, the crab is able to filter out the clean water and absorb it into its body.
It is all a matter of separating things and en-suring that rubbish and other less desirable ele-ments can be transformed into something useful.
Used cooking oil trans-formed into biofuelThe same natural process used by the marsh crab to sepa-rate water from sludge is used by a Spanish company in its work to extract something valuable out of something seem-ingly worthless. But instead, the company uses separators and decanters from Alfa Laval to extract biofuel from used cooking oil.
Discarded cooking oil is a waste product that is difficult and expensive to dispose of or clean once it is poured down the drain and reaches treatment plants.
The challenge with biodiesel production is to transform this heterogeneous cooking oil, whose properties change on a daily basis, into a qualitative end-product with an even and high quality. These technological solutions have resulted in higher reliability and longer operating times, as well as better returns and less waste.

20 Alfa Laval Annual Report 2009 / About Alfa Laval
Structural changes
Major global changes – long-term driving forces behind demand
Although global economic growth experienced a dip during the past year, Alfa Laval expects that structural changes in its operating environment will continue to drive long-term demand for the company’s products: growing energy needs, new environmental requirements, an improved standard of living in developing countries and ongoing globalization are the four driving forces expected to play the most crucial role.

21
The world’s growing energy need is paving the way for efficient products and solutions
Demand for Alfa Laval’s products is governed by an increasing need for energy-efficient solutions for various types of processes. High energy costs and a more intense focus on climate and environ-mental issues are prompting companies worldwide to search for products that can contribute to optimizing processes, thereby enhancing cost-effectiveness, reducing emissions and strengthening their competitiveness. This applies to most industries, although companies in energy-related sectors have the most to gain.
Demands for efficiency have resulted in a technology shift, whereby Alfa Laval’s technology in heat transfer – plate heat exchangers – is gradually becoming a more vital substitute for shell-and-tube heat exchangers. Compact heat exchangers not only take up less space, they also reduce energy consumption and emissions, thereby ena-bling a payback period that is often well under one year.
New environmental rules and regulations – opportunities for Alfa Laval
A more intense focus on climate and environmental issues has prompted the implementation of new rules and regulations intended to reduce human impact on the environment. This has resulted in increased demand for products that can minimize energy consump-tion, emissions and other forms of pollution. Of course, a cleaner environment is a reward in itself, but economic gains can also be achieved through investments in new, more environmentally friendly technologies. For example, reusing waste heat can help to reduce energy utilization and carbon emissions, an important step in light of the introduction of emission rights trading. Water purification is another example. Alfa Laval’s high-performance decanters are used in wastewater plants worldwide to separate water from sewage sludge. To recover additional water, the residual product is then heated using a heat exchanger. Utilizing as much water as possible reduces the volume of residual waste and thereby minimizes the transport requirements of wastewater plants.
In a world where natural resources are in short supply, water purification is a crucial process. Today, Alfa Laval has supplied enough decanters to dewater sewage sludge from the wastewater generated by more than 250 million people. Alfa Laval also offers a number of other environmental applications capable of cleaning everything from ballast water onboard ships to the crankcase emissions generated by diesel engines at sea and on land.
Major global changes – long-term driving forces behind demand
Demand for processed foods increasing in fast-growing economies
For a number of years, economic growth has produced a higher standard of living for an increasing number of people worldwide. Although the growth of the global economy has been declining for some time, it is reasonable to expect a recovery in the future. This will be accompanied by a higher level of consumption and lifestyle changes, which are expected to contribute to increased demand for such processed foods as juice, beer and olive oil. Demand is also becoming more intense for products and processes that can contribute to improving the sustainability of foodstuffs and thereby reducing waste.
India is an example of an emerging market with excellent potential in the food sector. A couple of years ago, approximately 300 million people in India consumed processed foods. This group is expected to grow to about 500 million people in the near future – nearly the number of people living in the entire EU. However, India is not unique. Several other countries are expected to experience a similar trend. Alfa Laval, which has focused on the food industry since the company was founded in 1883, has a number of appli-cations and a broad geographic base that is able to efficiently manage and track demand as growth regains momentum.
Increased international trade driving demand for transports
Globalization has progressively intensified over the past century. In order to supply the global market with products, companies have increasingly established production operations in different areas of the world. This trend has been further bolstered by the decline in the number of regulatory obstacles facing trade, investments and capital flow. During the past few decades, this has contributed to increased demand for transportation, including maritime solutions. Although demand in the shipbuilding industry declined sharply during the past year, there is reason to believe that demand for Alfa Laval’s specialized products for ships will continue in the future. Separators used to clean fuel before it enters the vessel’s engines and heat exchangers that produce freshwater are two of many examples. The company also offers clean environmental applications that will increasingly be able to meet the demand expected to arise as new rules and regulations are introduced.

22 Alfa Laval Annual Report 2009 / About Alfa Laval
Three technologies with world-leading positions
Key technologies
hE
AT
TR
AN
SFE
R
SE
PAR
AT
ION
FLU
ID h
AN
DLI
NG
COMFORT & REFRIGERATION
MARINE & DIESEL
OEM
FLUIDS & UTILITy
SANITARy
FOOD
ENERGy & ENVIRONMENT
PROCESS INDUSTRy
LIFE SCIENCE
COMFORT & REFRIGERATION
MARINE & DIESEL
OEM
FLUIDS & UTILITy
SANITARy
FOOD
ENERGy & ENVIRONMENT
PROCESS INDUSTRy
LIFE SCIENCE
COMFORT & REFRIGERATION
MARINE & DIESEL
OEM
FLUIDS & UTILITy
SANITARy
FOOD
ENERGy & ENVIRONMENT
PROCESS INDUSTRy
LIFE SCIENCE
SELECTED MARKET SEGMENTSTEChNOLOGY COMPETITORS MARKET POSITION
Fluid handling
– GEA (Germany)
– SPX/APV/ Waukesha Cherry Burrell (US)
– Fristam (Germany)
Separators
– GEA (Germany)
– Mitsubishi Kakoki Kaisha (Japan)
– Pieralisi (Italy)
Decanters
– GEA (Germany)
– Pieralisi (Italy)
– Guinard/Andritz (France, Austria)
– Flottweg (Germany)
– GEA (Germany)
– Hisaka (Japan)
– SPX/APV (US)
– SWEP (US)
More than 30 percent of the world market
25 to 30 percent of the world market
10 to 12 percent of the world market
1
1
1

23
Alfa Laval’s operations are based on three key technologies – heat transfer, separation and fluid handling, all of which are of decisive importance for many industrial processes. Heat transfer products accounted for 53 percent (58) of sales in 2009, separation products for 25 percent (23) and fluid handling products for 9 percent (9). Alfa Laval is the global leader in all three technology areas.
SALES DESCRIPTION
Various solutions for heat transfer are used in most industrial processes for heating, cooling, freezing, ventilation, evaporation and condensation of fluids. These solutions have numerous fields of application and are used by customers in such areas as the chemical, food processing, oil and gas production, power generation, marine and construction industries.
More efficient energy utilizationA heat exchanger transfers heating or cooling, usually from one fluid to another, but this can also occur with the help of air. The products are of decisive importance in ensuring the efficiency of the customer’s entire manufacturing process. Compact plate heat exchangers, the main product in Alfa Laval’s offering, offer far more efficient energy utilization, which cuts costs and environmental impact.
Transporting and regulating fluids in an efficient and safe manner are crucial processes in many industries. Among other areas, Alfa Laval focuses on sanitary fluid handling in industries with stringent hygiene requirements.
Providing exact flowsThe company’s pumps, valves and installation material are used in fluid handling in such applications as the production of beverages, dairy products, food, pharmaceutical products and health and personal care products. These products are also utilized for cleaning tanks in such areas as the process industry. Flow equipment is used to attain exact pumping of all types of fluids in various applications. Customers often integrate many of
Ever since Alfa Laval was established in 1883, separation technol-ogy has been a core operation. The technology is used to separate liquids from other liquids and solid particles from liquids. The technol-ogy can also be used to separate particles and liquids from gases.
High-speed separators and decantersAlfa Laval’s products in this technology are dominated by high-speed separators and decanter centrifuges. Separators have high rotation speeds, are generally mounted horizontally and are used primarily for separating liquids from one other.
Decanter centrifuges are normally based on horizontal sepa-ration technology and work at slower speeds. They are used, for example, in the dewatering of sludge in wastewater treatment
Share of Group’s sales
Share of Group’s sales
Share of Group’s sales
Plate heat exchangersPlate heat exchangers are made up of a series of corrugated plates assembled closely to each other. Between the plates there are two channels containing a cold and a warm medium. These pass on either side of the plates and in opposite directions to each other. Heating or cooling is transferred via the plates. Different types of plate heat exchangers – gasketed, brazed and welded – have been designed to withstand various forms of pressure and a range of temperatures.
Alfa Laval’s products for fluid handling into their systems, and thus, require continuous product deliveries.
Products for sanitary applicationsThe main types of pumps used in sanitary environments are centrifugal, rotary lobe and liquid ring pumps. Other products used in fluid handling are valves, tank-cleaning products and various types of installation materials.
plants. A third separation product is membrane filtration, which is the established solution for separating very small particles.
Crucial for a number of processesSeparators and decanters play a vital role in a range of industrial processes. Examples include:
– processing of food and pharmaceutical, biotechnology, chemical and petrochemical processes
– extraction and production of crude oil and treatment and recovery of drilling fluids
– management and treatment of fuel and lubricating oils for vessels and electric power plants
– dewatering of sludge in wastewater plants
53%
25%
9%

24 Alfa Laval Annual Report 2009 / About Alfa Laval
Research and development
Good ideaslay the groundwork for profitable development
Innovation is a key prerequisite for development. In fact, good ideas, as well as the company’s pioneering spirit, have contributed to Alfa Laval’s strong market positions. Gustav de Laval – who formed AB Separator, the predecessor to Alfa Laval – was responsible for more than 200 inventions and held 92 patents. This shows that the company has been characterized by a focus on innovation and new ways of thinking since its inception. Alfa Laval makes continuous and consistent investments designed to build, strengthen and develop the company’s global market leadership. Alfa Laval currently holds more than 300 patents, and in 2009, the Group invested SEK 654 million (718), or 2.5 percent (2.6) of its sales, in research and development.
>300Patents:

25
Cooperation crucial for success
To achieve successful results in research and development, meaning efficient and competitive products, it is vital that all areas of the company work together. Accordingly, all segments are involved in the process of taking ideas from the drawing board to the market. Alfa Laval has a well-established structure for assessing, managing and implementing proposed changes. This also includes an innovation portal on the company’s intranet, where employees can submit suggestions for changes, improvements and new development ideas.
The basis for profitable growth
The goal of all research, both basic research and the applied development of products and solutions focusing on heat transfer, separation and fluid handling, is to be able to meet customers’ continually changing demands and requirements with new, updated and improved products.
Often, the focus is on enhancing existing products – minor changes that can generate major improvements for the customer. This could involve new versions of existing products using new materials or with a larger capacity. In other cases, it may involve Alfa Laval participating in customer pilot projects in which new equipment is tested, devel-oped and adapted.
A key factor in the development of all new products is ensuring that they achieve profitability in the shortest time possible. This requires that the Group’s resources are concentrated on a limited number of projects. Taking on fewer projects, preceded by thorough preparations prior to the start of development, is a prerequisite for success. Accordingly, Alfa Laval has established a number of product development criteria. Approval is only given to projects that, after careful consideration, are deemed to fulfil these criteria. This proc-ess helps Alfa Laval to achieve its overall goals for product devel-opment: to reduce the average time from concept to sales target and to increase the new products’ share of the Group’s sales.
The goals themselves have no intrinsic value, but rather are to be used as tools to ensure that Alfa Laval remains one step ahead of the competition and supplies the products of the future at the right time in order to strengthen the brand and benefit its customers, investors and employees. Continuous research and development make it possible to establish a favorable price scenario, which is a prerequisite for achieving profitable growth.
Product centers – research and development hubs
Alfa Laval has specific centers for research and development of all key products – compact and welded heat exchangers, air heat exchangers, separators, decanters, membranes and fluid handling equipment. These centers combine development and technological know-how with expertise in various applications. The organizational structure allows for more comprehensive controls of the develop-ment work, which means that resources can be concentrated to the right activities.
However, the Group’s overall research and development work spans its internal boundaries and involves all of the organizations responsible for sales, manufacturing, purchasing, aftermarket activities and development. This cooperative approach enables Alfa Laval to determine its customers’ needs and wishes, which are then transformed into the development of new products. Between 35 and 40 launches occur annually. To the right is an example of a product that reached the market in 2009.
+50 percent
Efficiency:
New Alfa Laval Compabloc 120 – order bookings received prior to launchIn 2009, Alfa Laval launched the Compabloc 120, the latest addition to the company’s range of compact heat exchangers. Several orders had already been placed before the product even reached the market.
Declining margins and stricter environmental legislation are forcing companies in the refinery sector and process industry to look for solutions that can make their processes cleaner and more energy efficient. The new Compabloc product is both compact and energy efficient and thereby enables companies to reduce their energy costs and CO2 emissions. In other words, it offers the same quality as earlier versions, the only difference being that it is larger.
And this size is, in fact, an asset. Previously, several Compablocs were often required to replace a shell-and-tube heat exchanger. The new model, on the other hand, has sufficient capacity to replace one or more large tube heat exchangers in applications with up to 42 bar of pressure. Compared with traditional shell-and-tube technology, the Compabloc 120 is up to 50 percent more efficient. For the average refinery, this means a 19 MW reduction in energy consumption and a reduction in carbon dioxide emissions of up to 47,500 tons annually.

26 Alfa Laval Annual Report 2009 / About Alfa Laval
Group overview
Alfa Laval is organized into three divisions. The Operations Division is responsible for pur-chasing, production and supply of the company’s products. The Equipment Division and Process Technology Division market and sell products through eleven customer segments. The organization enables the company to work closely with customers in various industries and the sales personnel in each segment are specialized in the customers’ processes.
OperationsEquipmentProcess Technology
Sales/division, SEK million Number of employees/division
TOTAL SALES
26,039TOTAL NUMBER OF EMPLOYEES
11,773
PROCESS TEChNOLOGY
EQUIPMENT
44%
56%
PROCESS TEChNOLOGY
OPERATIONS
EQUIPMENT
33%
28%
39%

27
COMFORT & REFRIGERATIONMARINE & DIESELOEMFLUIDS & UTILITySANITARyFOODENERGy & ENVIRONMENTPROCESS INDUSTRyLIFE SCIENCEPARTS & SERVICE (EQD)
COMFORT & REFRIGERATIONMARINE & DIESELOEMFLUIDS & UTILITySANITARyFOODENERGy & ENVIRONMENTPROCESS INDUSTRyLIFE SCIENCEPARTS & SERVICE (PTD)
Equipment Process Technology
11 CUSTOMER SEGMENTS:
TOTAL, SEK MILLION
21,539
Order intake
OPERATING RESULT*, SEK MILLION
4,585
Sales and operating result
Order intake/customer segment %
Parts & Service (EQD 14%, PTD 14%) 28
Process Industry 13
Comfort & Refrigeration 12
Sanitary 11
Energy & Environment 9
Marine & Diesel 9
Food 7
OEM 5
Fluids & Utility 3
Life Science 3
Order intake/geographic market %
Other EU 32
Asia 31
North America 16
Other Europe 8
Latin America 6
Sweden 4
Other 3
0
5,000
10,000
15,000
20,000
25,000
30,000
09080706050
5,000
10,000
15,000
20,000
25,000
30,000
09080706050
1,500
3,000
4,500
6,000
7,500
9,000
18,516
24,018
27,553 27,464
21,539
16,330
19,802
24,849
27,85026,039
1,765
3,010
4,980
6,160
4,585
SEK million SEK million SEK million
* Adjusted EBITA

28 Alfa Laval Annual Report 2009 / About Alfa Laval
Despite environmental concerns, coal is the world’s fastest growing fuel, according to the BP 2008 Statistical Review of World Energy. Coal is plentiful and cheap compared with fossil fuels such as oil and gas. In the United States, which has the world’s largest coal reserves, more than half of the electricity produced comes from coal-fired power plants. On a global scale, coal provides about 40 percent of the electricity consumed, but as the economies of China and India continue to grow and industrialize this share is likely to increase further, according to the International Energy Agency (IEA).
Meanwhile, coal-fired power plants account for as much as a third of the world’s man-made carbon dioxide emissions, believed to be the root cause of global warming. For this reason, limiting CO2 emissions has been high on the global agenda to reverse cli-mate change.
New technologies instill hope of
clean coalCoal-fired power plants account for about 40 percent of the world’s electricity production, and that figure is expected to rise. Considering the large amount of CO2 emitted by the plants, huge effort is being expended to find cleaner ways to burn coal.
Article
Finding and developing renewable energy sources is one way to tackle the problem, but it will be a long time before these new technologies are sufficiently developed to provide a serious alternative to fossil fuels. “Even with rapid development of alternative energy sources, coal will continue to be important for at least the next 50 years,” says Geoffrey Morrison, programme manager at the London-based IEA Clean Coal Centre. “It’s vital to invest in ways of burning coal more cleanly, particularly with regard to the removal of carbon dioxide.”
Growing concern over CO2 emissions and tougher legislation to minimize them have spawned intensive research into technologies to enable cleaner coal production. Clean coal initiatives basically seek to reduce emissions from coal-fired power plants by employing technologies that facilitate the capture of carbon dioxide. They also address the issue of permanent storage of carbon. “Carbon capture

29
and storage [CCS] has to be part of any serious and affordable cli-mate change strategy,” says Milton Catelin, chief executive of the London-based World Coal Institute. “The IEA tells us that stabilizing emissions without CCS is impossible. If governments are serious about tackling climate change, then they need to get serious about investing in all low-carbon technologies, including CCS.”
Programmes in place to demonstrate CCS
There are three technologies available today for carbon capture – pre-combustion, post-combustion and oxyfuel combustion. Pre-combustion capture involves gasification, or turning coal into a synthesis gas comprising hydrogen and carbon. The technology, termed “integrated gasification combined cycle” (IGCC), was first successfully demonstrated on a commercial scale at the Cool Water Project in Southern California in the 1980s. There are currently a few commercial- size, coal-based IGCC plants in the United States and Europe, and some pilot projects are being launched, particularly in the US. While the technology holds promise, it requires investment in a dedicated new plant, which makes it relatively expensive.
The two other carbon-capture technologies may be retrofitted into existing power plants and power stations. One is oxyfuel com-bustion, which involves burning fossil fuels in pure oxygen, resulting in an exhaust stream with a high concentration of CO2 and water vapour. These are then separated by condensation. The other is post-combustion capture, which involves removing CO2 from flue gases after hydrocarbon combustion. Each of these three carbon-capture technologies has pros and cons, according to Morrison. “Pre-combustion capture on IGCC has the lowest energy penalty [reduction of net electric output], but IGCC is not yet in widespread commercial use,” he explains. “Oxyfuel and post-combustion cap-ture have higher energy penalties, but they can be potentially applied to existing plants. This is important, given the high inventory of existing pulverized coal-fired plants.” All three of the technologies need to be further demonstrated and tested, he says. And all of them are at present less cost efficient than traditional coal burning. Europe currently has several programmes in place to demonstrate carbon capture and storage. The US is developing similar pro-grammes, China is catching up fast, and in Australia a number of small-scale CCS demonstration projects are under way. “Most people in the industry expect CCS to be commercially demonstrated by 2020,” says Morrison.
New technology needs funding
There are cost and regulatory uncertainties connected to CCS technology. The issue of clean coal is also controversial, and some environmental groups and others would rather see money invested in renewable technologies. However, the world energy demand is projected to grow by 55 percent between 2005 and 2030, and renewable technologies are just not sufficiently developed to really make a difference. “Climate change is a serious issue and requires serious funding in all low-carbon technologies – renewables, energy efficiency, nuclear and CCS,” says Catelin. “The UN Intergovernmental Panel on Climate Change maintains that CCS could contribute 55 percent of all emission reductions by 2100.”
Growing impact of clean technologyClean technology permeates many of Alfa Laval’s business areas. “Clean technology is a new market, but Alfa Laval products have always provided customers with solutions that enable them to re-use and protect natural resources such as energy and water in industrial processes,” says Alex Syed, vice president of corporate development at Alfa Laval.
Alfa Laval’s products and processes address clean technology from three different perspectives: The first is reducing resource use such as water and energy by either using them more efficiently or finding ways to re-use them. The second involves technology for cleaning up existing energy production or participating in cleaner energy production such as solar power or biofuels, products that reduce pollution. The third is about minimizing the environmental impact by utilizing products that reduce pollution. In terms of clean coal technology, it holds big potential, partly because renewable energy still contributes relatively little to the world’s overall energy production.
Alfa Laval has got a dedicated carbon capture team who is developing new techniques and efficient solutions for carbon capture processes. At present the team is involved in several research projects and pilot plants for clean coal technology. In spring 2009, for example, Alfa Laval won a contract to supply Packinox heat exchangers to an IGCC plant at a new US power plant. “The technology is there, and there are legislative factors and govern-ment incentives that indicate this area will grow,” says Syed. “There are pilot plants being constructed in the US and Europe, but it is still too early to say how large this market will become. It depends a lot on future legislation.”
He says public investments in CCS represent excellent value for money. “One large-scale CCS power plant can supply the equivalent low-carbon electricity of 1,400 wind turbines,” Catelin says. “The truth is, the world is investing far too little in CCS and other low-carbon technologies.”

Divisions
30 Alfa Laval Annual Report 2009 / About Alfa Laval
Equipment DivisionThe Division’s customers are characterized by a well-defined and regularly recurring requirement for Alfa Laval’s products. In most cases, sales are conducted through system builders and contracting companies, as well as dealers, agents and distributors – direct sales to end-users are limited. The Equipment Division continuously increases its number of sales channels, since it is strategically important that its products are available through several channels worldwide. Given this focus on sales channels, it is natural that the Division also strives to further develop and strengthen the Group’s e-commerce offering.
Significant events in 2009– Sales declined 6.3 percent to SEK 14,665 million.
– A general downturn was noted in all segments.
– The shipbuilding industry experienced a significant decline compared with 2008. One exception to this trend was the environmental application PureBallast, which garnered increased interest among shipowners and shipyards.
– Sanitary reported substantial growth in Asia and favorable trends in pharmaceuticals and personal care.
– Continued strong development for district heating applications in the Comfort & Refrigeration segment.
– The Parts & Service business for the marine area declined as a result of a general downturn in global trading activity. Demand for spare parts and service remained good in other areas.
Sales and operating result Order intake
Customer segment, % Geographic market
Operations DivisionThe Division is responsible for product-related purchasing, manufacturing and distribution of all products. This centralization contributes to increased efficiency and delivery reliability, while at the same time creating economies of scale that result in reduced operating costs. With a global perspective and sound coordination of the division’s various functions, Alfa Laval offers reliable access to the company’s products in markets throughout the world.
Significant events in 2009– During 2009, particularly close attention was
devoted to balancing resources, since capacity adjustments were required as a result of declining demand, while deliveries were to be made to meet the order backlog.
– Continued investments in optimizing the supply structure.
– Continuous agreement reviews contributed to major material-cost savings.
– In line with SixSigma, additional investments were made in quality and efficiency-enhancement measures. At year-end, 95 percent (80) of the production units were certified. Implementation of ISO 14001 also continued. As a result, at year-end, 95 percent (80) of the total delivery value came from certified facilities.
– Alfa Laval’s continuous environmental work resulted in a number of measures to reduce energy consumption and CO2 emissions. In addition, the phasing out of chemicals that are blacklisted by Alfa Laval was completed.
0
5,000
10,000
15,000
20,000
0908070605
SEK million
9,902
12,617
15,896 15,804
11,512
0
5,000
10,000
15,000
20,000
09080706050
1,000
2,000
3,000
4,000
SEK million
8,631
1,162
2,072
2,866
3,602
2,530
10,934
13,586
15,657
14,665
SEK million
117
1 Comfort & Refrigiration 22%2 Sanitary 20%3 Marine & Diesel 17%4 OEM 8%5 Fluids & Utility 6%6 Parts & Service 27%
1 Sweden 6%2 Other EU 37%3 Other Europe 8%4 North America 16%5 Latin America 3%6 Asia 28%7 Other 2%
2
2
3 3
44
5 5
6 6

31
The Division serves customers that require specially adapted solutions to enhance the efficiency of their processes or boost their capacity. Sales are mainly conducted through contractors and the Group’s own sales companies and are made directly to customers. Alfa Laval combines
Process Technology Divisionexpertise in its key technologies with solid knowledge about customer processes, and offers package solutions that cover everything from individual products to systems, complete solu-tions and efficient customer service.
Significant events in 2009– Sales fell 6,5 percent to SEK 11,350 million.
– Following a weak start, project-related orders increased during the second half of 2009.
– Several major orders from the nuclear power sector confirmed Alfa Laval’s strong position in the area.
– Alfa Laval received a second carbon capture order during the year. This area is expected to generate considerable interest in the future.
– Despite the weak economic climate, demand was favorable in the Environment segment, where volumes were in line with 2008. Con-
versely, investments in the oil and gas indus-try declined.
– Following a weak start to the year, the Process Industry segment noted a resurgence of investor inclination in the refinery sector. At the same time, investments in new ethanol production in Asia resulted in several large orders for Alfa Laval. Capacity in the petrochemicals industry, on the other hand, was reduced as a direct result of declining demand in the end-markets.
– Life Science reported a highly positive trend for industrial fermentation, particularly for en-zyme production.
– Parts & Service weakened relative to 2008, due to a downturn in demand for spare parts. How-ever, the decline in the service business was only marginal, partly thanks to the opening of new service centers during the year and the con-tinued, stable service requirement in the market.
Sales and operating result Order intake
Customer segment, % Geographic market
Geography
Investments by geographic market, %
Purchases by geographic market, %
North America
3%
Latin America 1%
Western Europe
46%
Central and Eastern Europe
7%
Asia 43%
Geographic distribution of direct labor hours in production, %
02,0004,0006,0008,000
10,00012,00014,000
0908070605
SEK million
8,573
11,391 11,594 11,636
9,945
02,0004,0006,0008,000
10,00012,00014,000
090807060505001,0001,5002,0002,5003,0003,500
SEK million
7,6738,829
11,24212,143
11,350
6991,060
2,312
2,7562,040
1
1
11
7
1 Process Industry 27%2 Energy & Environment 20%3 Food 16%4 Life Science 6%5 Parts & Service 31%
1 Sweden 1%2 Other EU 27%3 Other Europe 9%4 North America 17%5 Latin America 9%6 Asia 33%7 Other 4%
1 North and Latin America 10%2 Asia 20%3 Central and
Eastern Europe 5%4 Western Europe 65%
1 Asia 15%2 Europe 84%3 North and Latin America 1%
2
2
2
2
3
3
3
3
4
4
4
5
5
6

32 Alfa Laval Annual Report 2009 / About Alfa Laval
Purchasing
Manufacturing
Distribution
Operations Division overview
Alfa Laval’s Operations Division is responsible for product-related purchasing, manufacturing and distribution for the entire Group. This centralization contributes to increased efficiency and reduced operating costs. Operations is responsible for the manufacturing of all products for all segments and thereby contributes to ensuring access to the company’s products in all markets.
The purchasing organi - zation continued its successful optimization of the supply structure during the year. The organization comprises three regional offices, located in India, China and Mexico, and three
central offices, based in Sweden and Denmark. This centralization makes it easier to assess the Group’s overall material requirements, since volumes can be consolidated, thereby generating economies of scale. It also provides an overview of how these requirements are distributed, which is advantageous since it facilitates the matching of local production units with suppliers that are
able to make both local and global deliveries on the right terms.
To optimize the Group’s purchasing activities, the organization also regularly reviews its network of suppliers, which involves seeking out and evaluating new suppliers, as well as continuously screening the suppliers gained through acquisitions. In addition, contracts are reviewed on an ongoing basis, a process that contributed to major material- cost savings in 2009. Considerable focus is also devoted to ensuring that suppliers fulfill Alfa Laval’s quality requirements, are able to supply the right specifications at the right time and comply with the company’s Business Principles.
Alfa Laval’s network of suppliers is well established, with 80 percent of the Group’s total purchasing volume originating from about 350
suppliers and about 65 percent (65) occurring within the framework for global contracts. The single most important raw material for Alfa Laval is stainless steel, which accounts for approximately 25 percent of the company’s total purchase volumes. In Europe, the price of stainless steel comprises two components: a base price and an alloy surcharge. The base price increased somewhat during the year, while the price of nickel fluctuated considerably. Nickel is one of the of the Group’s most important metal alloys, followed by molybdenum, which experienced a more stable trend. Copper and aluminum prices also increased somewhat, while the price of titanium fell sharply as a result of declining demand from aircraft manufacturers and the process industry, among other areas.
Alfa Laval’s production is centralized and based on manufactur-ing technology, product group and size, not on application. For example, regardless of their application, large separators are
manufactured in Eskilstuna (Sweden), small separators in Pune (India) and medium-sized separators in Pune and Krakow (Poland).
Alfa Laval has approximately 4,800 (5,500) employees at 28 (27) major manufacturing units. This structure is continuously reviewed to ensure the optimal planning and distribution of production. Particularly careful planning was required in 2009,
since a major capacity adjustment was implemented at the same time as deliveries were to be made to the order stock.
In addition, continued investments were made to further enhance quality at the same time as all employees received training in a new production concept to increase efficiency, in line with Alfa Laval’s multi-year investments in SixSigma. At year-end, 95 percent (80) of the production units were certified. In parallel with these initiatives, efforts to increase ISO 14001 certification continued. At year-end, 95 percent (80) of the total delivery value came from certified facilities.
Alfa Laval’s investments in research and develop - ment also affected Operations, since new products can require anything from training to technical adjustments of production machinery. At the
same time, environmental work remained a key focus area. Among other initiatives, the phasing out of chemicals that are blacklisted by Alfa Laval was completed and additional measures were taken to reduce the Group’s energy consumption and carbon emissions, work which will continue in 2010. The Sustainability Report on page 45 provides examples of the energy-saving measures implemented at Alfa Laval’s production unit in Richmond (US). Different projects are being continuously conducted at all units.
Alfa Laval has three primary distribution centers located in Tumba and Staffanstorp in Sweden and Kolding in Denmark. The company also has regional distribution centers in Indianapolis
(US), Singapore (Singapore), Shanghai (China) and Shonan (Japan). A smaller center was also opened in India during the year. The distribution unit conducts continuous reviews to track demand and improve the supply and delivery reliability of various products and spare parts.
This is a challenging process considering that some Alfa Laval products are still in operation after 30 years or more and may thus require spare parts. Accordingly, parts are classified into three levels in order to streamline inventory management: parts that should always be in inventory for rapid delivery, those not in inventory but able to be purchased and delivered fairly quickly and those seldom requested, for which price and delivery must be established with each order.
The distribution unit also handles all of Alfa Laval’s transports. The goal is to provide rapid and cost-efficient solutions that simultaneously fulfill the company’s target for reduced carbon dioxide emissions. The Group strives to reduce
the environmental impact of its distribution operations. Accordingly, a gradual shift is under way from air transports to land and sea-based solutions. In 2009, approximately 7 percent (8) of distribution occurred by air transport, 31 percent (32) by ship and 62 percent (60) by truck.

33
Operations Division overview
Purchasing offices
Production units
Distribution centers
– US (1)
– Sweden (2)
– Denmark (1)
– China (1)
– Singapore (1)
– Japan (1)
– India (1)
For a number of years, Alfa Laval has had regional purchasing offices in strategic market such as China, India and Mexico.
Corporate purchasing organization
Regional purchasing organizations
Production units
Distribution offices
Alfa Laval has approximately 4,800 (5 500) employees working in production and 28 major manufacturing units:
– US (4)
– Brazil (1)
– Sweden (4)
– Denmark (2)
– UK (1)
– France (3)
– Italy (2)
– Finland (1)
– Poland (1)
– Russia (1)
– China (2)
– India (4)
– Japan (1)
– South Korea (1)

34 Alfa Laval Annual Report 2009 / About Alfa Laval
Equipment Division overview
MARKET SEGMENT OPERATIONS EXAMPLES OF CUSTOMERS
Marine & Diesel
Comfort & Refrigeration
Sanitary
OEM
Fluids & Utility
Parts & Service
Alfa Laval’s products are used for such applications as the cleaning of tanks, treatment of sludge and oily water, fuel and lube oils, engine cooling and production of freshwater. Customers include shipyards, shipowners and manufacturers of diesel engines. About three-fourths of the world’s ocean-going vessels carry Alfa Laval products onboard.
Sales of heat exchangers for use in systems for district heating and cooling and air conditioning of plants, offices and shopping malls. Other major application areas are maintaining the correct temperature in refrigeration and freezer compartments, major freezing plants and ice rinks. Customers range from major multinational companies to small local installation companies.
Alfa Laval’s products are used to produce liquid and viscous foods, pharmaceuticals and hygiene products. Customers are active in the beverage, dairy, food, pharmaceutical and biotechnology industries, all of which have very stringent requirements in terms of hygiene and safety.
Customers in this segment include manufacturers of air-conditioning systems, air compressors, air dryers and gas boilers. Among other products, Alfa Laval sells brazed plate heat exchangers, which are later integrated into customers’ end-products.
Alfa Laval’s plate heat exchangers optimize energy utilization and ensure temperature control in industrial processes. Most industries use various types of expensive fluids. Separators clean these fluids so that they can be recovered and reused, thereby cutting operating expenses and protecting the environment.
Customers are active in all of the Division’s segments, with the exception of OEM. The aftermarket is a priority area and the overall strategy is to further develop and expand the spare parts and service operations.
– Hu Dong– Hyundai– Fincantieri– Wärtsilä– MAN/B&W
– Climespace/GDF Suez– Johnson Controls– Mayekawa– Beijer Ref– Huurre– Francks Kylindustri
The single largest customer is Tetra Pak, a leading supplier of process and packaging systems for the food industry.
– Baxi– Ariston Thermo– IVT/Bosch– Remeha– BDR Thermea
– Metso Paper– Bosch Rexroth– Inductotherm– Spirax Sarco – Cummins
Customers are active in all of the Division’s segments, with the exception of OEM.

35
Equipment Division overview
FORCES DRIVING DEMAND ORDER INTAKE
Marine / Global transport requirements, consolidation in the shipbuilding industry, government initiatives to support local shipyards and environmental legislation.
Diesel / The need for electricity in remote locations, global energy demand, the need for power reserves, for example, for nuclear power plants and wind farms.
Activity level in the construction industry, energy price trends, the need for energy-efficient solutions, shift toward demand for more environmentally friendly cooling media and environmental legislation.
Change in consumption habits as a result of urbanization in growing economies, the development of new medicines, improved standard of living, demographic changes, the need for energy-efficient solutions and expanded food production.
Increased focus on the environment, the need for energy-efficient solutions, government subsidies and energy price trends.
Industrial capacity utilization, raw material and energy price trends, increased focus on the environment and expansion of the electricity supply.
Increased trade, capacity utilization in the global ship fleet, industrial capacity utilization and growth in the installed base.
Share of Division’s order intake
Share of Division’s order intake
Share of Division’s order intake
Share of Division’s order intake
Share of Division’s order intake
Share of Division’s order intake
Change in order intake
Change in order intake
Change in order intake
Change in order intake
Change in order intake
Change in order intake
2008
2008
2008
2008
2008
2008
2007
2007
2007
2007
2007
2007
-
+
-
=
+
+
+
+
+
+
+
+
2009
2009
2009
2009
2009
2009
17%
22%
20%
8%
6%
27%
2
1
1
1
2
1
2
1
2
3
4
5
6
7
34
5
6
7
3
4
5
6
2
34
5
6
7
2
3
4
5
67
3
45
6
7
1 Sweden 0%2 Other EU 22%3 Other Europa 5%4 North America 5%5 Latin America 2%6 Asia 64%7 Other 2%
1 Sweden 8%2 Other EU 44%3 Other Europa 17%4 North America 11%5 Latin America 2%6 Asia 17%7 Other 1%
1 Sweden 7%2 Other EU 34%3 Other Europe 6%4 North America 21%5 Latin America 5%6 Asia 24%7 Other 3%
1 Sweden 12%2 Other EU 58%3 Other Europe 3%4 North America 8%5 Latin America 1%6 Asia 18%7 Other 0%
1 Sweden 3%2 Other EU 40%3 Other Europe 4%4 North America 16%5 Latin America 5%6 Asia 30%7 Other 2%
1 Sweden 7%2 Other EU 39%3 Other Europe 7%4 North America 20%5 Latin America 5%6 Asia 20%7 Other 2%
Geographic distribution
-
-
-
-
-
-

36 Alfa Laval Annual Report 2009 / About Alfa Laval
Process Technology Division overview
MARKET SEGMENT OPERATIONS EXAMPLES OF CUSTOMERS
Process Industry
Energy & Environment
Food Technology
Life Science
Parts & Service
Alfa Laval’s products are used for manufacturing petrochemical products, plastics, polymers, metals, minerals, biofuels, starch, paper and sugar.
In the energy sector, Alfa Laval’s products, modules and systems play a major role in the extraction of oil and gas and in the production of energy in power plants. Alfa Laval is also active in the environmental sector, since the company’s products can help customers fulfill increasingly strict environmental requirements and legislation. In the waste treatment segment, Alfa Laval supplies products that reduce sludge volumes so that they can be managed in a cost-efficient manner in municipal treatment plants throughout the world.
Alfa Laval supplies process solutions for the beverage and food industries. Among other applications, the Group’s solutions are used in the production of beer, wine, juice, fruit concentrates, milk proteins and milk sugars, liquid foods, vegetable proteins and meat and fish proteins.
Customers are active in the pharmaceutical, biotechnology, hygiene and health food product industries. Alfa Laval has developed a series of products and solutions that meet the extremely strict safety and hygiene requirements imposed by these industries.
Customers are active in all of the Division’s segments. The aftermarket is a priority area and the overall strategy is to develop and expand the spare parts and service business. It offers customer value, brings customers closer to Alfa Laval and is less sensitive to variations in the business cycle. By creating continuous customer contacts, it facilitates new sales. Read more on pages 40–41.
– BASF– Bayer– Dow Chemical– Petro Vietnam
– Shell– Total– Petrobras– Statoil– GE– Shanghai Drainage – Major international cities, including the City of Chicago
– Cargill– ADM– Nestlé– Heineken – Anheuser-Busch InBev
– GlaxoSmithKline– Genentech– Lonza

37
Process Technology Division overview
FORCES DRIVING DEMAND ORDER INTAKE
Global market prices for raw materials, such as sugar, ethanol, corn, oil and steel, energy price trends, environmental legislation, the need for energy-efficient solutions, the need for productivity enhancements, demand for fuel and a technological shift.
Energy / Oil and gas prices, a growing need for energy in developing countries, national independence (LNG), development of energy production using renewable fuels, increased focus on nuclear power, the need for energy-efficient solutions.
Environment / New rules and regulations, increased need for freshwater due to a growing population and increased urbanization.
Demographic changes, population growth, improved standard of living, changes in consumption patterns, increased focus on healthy food, subsidies and raw material price trends.
The development of new medicines, improved standard of living, longer life expectancy and economic growth in developing countries.
The general activity level in various industries, the need to upgrade older equipment, an increased need for efficiency and the need for service and spare parts to prevent unplanned stoppages and minimize the time necessary for planned stoppages.
Share of Division’s order intake
Share of Division’s order intake
Share of Division’s order intake
Share of Division’s order intake
Share of Division’s order intake
Change in order intake
2008
2008
2008
2008
2008
2007
2007
2007
2007
2007
Change in order intake
Change in order intake
Change in order intake
Change in order intake
-
+
-
=
+
+
=
+
-
+
2009
2009
2009
2009
2009
16%
6%
31%
27%
20%
-
-
-
-
-
21
2
2
2
1
2
1
3
3
3
3
3
4
4
4
4
4
5
5
5
7
5
5
6
6
7
6
6
7
6
7
7
1 Sweden 1%2 Other EU 16%3 Other Europe 12%4 North America 9%5 Latin America 13%6 Asia 44%7 Other 5%
1 Sweden 0%2 Other EU 37%3 Other Europe 14%4 North America 19%5 Latin America 2%6 Asia 26%7 Other 2%
1 Sweden 0%2 Other EU 24%3 Other Europe 8%4 North America 6%5 Latin America 14%6 Asia 45%7 Other 3%
1 Sweden 2%2 Other EU 31%3 Other Europe 3%4 North America 15%5 Latin America 8%6 Asia 39%7 Other 2%
1 Sweden 2%2 Other EU 31%3 Other Europe 5%4 North America 27%5 Latin America 9%6 Asia 21%7 Other 5%
Geographic distribution

38 Forskning och utveckling

39
NATURAL PROCESS # 3
ANIMAL / Birds
CASE / Demanding buildings
TECHNOLOGY / Heat transfer
Cold feetOne has to wonder whether birds feel the cold in the winter. As it turns out, they have a fantastic heat exchange system.
The secret lies in the birds’ legs, where the creatures’ blood vessels are divided into two fine-mesh nets. The arteries, which guide the blood into the legs, are located close to the veins that carry cold blood back up toward the body.
In other words, this is where the heat ex-change happens: the heat from the blood in the arteries is transferred to the cold blood in the veins, which flows back into the body and keeps the bird warm. A natural process – even if the bird does always have cold feet.
Heating and cooling at the highest levelThe same natural process used by birds to regulate their body temperatures is used to regulate and ensure the perfect indoor climate in a number of buildings throughout the world.
And not just any buildings have implemented this heat exchange technology using products from Alfa Laval: the Paris Opera and the Louvre, Burj Khalifa (also known as Burj Dubai), the world’s tallest building at a height of more than 800 meters, the famous sail-shaped Burj Al Arab, the equally well-known Petronas Twin Towers in Kuala Lumpur, and Sweden’s own Turning Torso in Malmö are just a few examples.
Each building has its own specific requirements that must be taken into consideration. One building may require a cooling system, another a heating system. But what these buildings have in common is their need to establish the right balance between the two. Sometimes with meticulous precision.

40 Alfa Laval Annual Report 2009 / About Alfa Laval
Hundreds of thousands of installed products provide a solid base
Parts & Service
With hundreds of thousands of exchangers, separators and decanters installed worldwide, Alfa Laval requires a well-established organization to manage maintenance and service. The Group’s overall strategy is to continuously enhance this area, which offers favorable profitability and is less susceptible to fluctuations in the economic climate. Frequent customer contacts also create opportunities for new sales.
Since Alfa Laval’s products are often used in the heart of its customers’ processes and perform critical tasks, it is vital to ensure rapid deliveries of spare parts and service. Unplanned stoppages are expensive.
Accordingly, to meet the needs of its customers, it is crucial that Alfa Laval has an in-depth understanding of their processes and broad geographic coverage. Alfa Laval’s aftermarket organization, which is well established in terms of geography, provides the com-pany with a major competitive edge. The local units often have their own product expertise, field service, repairs and maintenance, as well as an in-house sales organization. Alfa Laval’s field service personnel also receive continuous training to enable them to deal with all types of products in all types of industries. In addition to spare parts and service, Parts & Service is also responsible for upgrades to customers’ existing products and retrofits, meaning the installation of replacement equipment, for example, in older vessels and existing diesel power plants.
Varying needs for maintenance and service
Requirements and demand for spare parts vary depending on the type of process in which the product is involved. Take, for example, the following two extreme cases: a plate heat exchanger used to heat a high-rise building and a plate heat exchanger used in a chemical process. The first may function for years without requiring any service, while the latter may need to be cleaned already after a few months.
Other decisive factors are how intensively the customer conducts its processes and the complexity of the product itself. The customer’s individual preferences also play a vital role. Some customers need
to purchase almost everything, while others have their own service personnel and only require technical support. Another factor that impacts demand is whether there is a need to enhance efficiency through investments in upgrades of existing equipment or replacing older equipment with a newer equivalent.
In other words, requirements vary depending on technology, application, type of industry and individual customer preferences and needs. However, to achieve optimal product functionality while maxi-mizing service life, regular preventive maintenance is recommended.
Plate heat exchangersRegular cleaning of a plate heat exchanger maximizes its energy-efficiency and service life. However, the extent of this need is determined by the environment in question. Products used in demanding environments, such as chemical processes, require more frequent service and cleaning than those used in less demanding environments.
SeparatorsSince separators constitute rotating equipment, they require minor servicing after about 1,500 hours in operation. The first major servicing normally occurs once the product has been in operation for 12 months.
DecantersThe general recommendation for decanters is to have them serviced once they have been in operation for one year. A major overhaul should be carried out after two years.
Installed products create growth opportunities for the aftermarket
Alfa Laval’s large installed base of products continues to grow. The company’s geographic spread has also expanded from established markets in Western Europe and the US to an increasing presence in Central and Eastern Europe, Latin America and Asia.
Planning the Group’s operations to ensure that customer needs are met is a challenge, particularly considering that some customers have products that are still in operation after 30 years or more. These customers must also be offered the best possible service and spare parts. Alfa Laval has three main distribution centers located in Tumba and Lund (Sweden) and Kolding (Denmark). The company also has regional distribution centers in the US, Singapore, China and Japan.
Long-term potential Multiple*
Plate heat exchangers x 1–7
Separators x 4
Decanters x 1.5
Pumps and valves x 1–2.5
* The value of the aftermarket relative to new sales.

41
Installed base
Large and mature installed base that requires service and renewal.
A combination of rapidly growing markets and established niche applications.
Smaller newly installed base that is growing.
Geographic potentialAlfa Laval’s installed products create growth potential for the after-market. Today, the aftermarket is largest in Western Europe and the US, where the installed base is older. At the same time, this means that the potential in emerging markets will rise as new sales increase and the installed base ages.
Service centers
Installed base
Maintaining an accurate overview of the installed base is necessary to make a qualitative assessment of the need for spare parts and service. Alfa Laval currently has hundreds of thousands of products installed throughout the world. Since sales of service and spare parts over the total lifetime of a product can be several times higher than the initial investment, these installed products constitute a highly valuable base, thereby providing Alfa Laval with excellent leverage.
Significant events in 2009
– Parts & Service’s order intake in 2009 amounted to SEK 6,106 million (6,232). Its total share of the Group’s order intake was 28 percent (23).
– The service network was further expanded, and five new centers were opened during the year in Tokai (Japan), Istanbul (Turkey), Kalimantan (Indonesia), Vizag (India) and Shenzhen (China).
– A number of service centers were upgraded and/or relocated during the year, including a new service center opened in Lyon (France), which replaced parts of the service center in Fontanil and the entire service operation in Les Claves. The center in Lyon handles heat exchangers, separators and decanters.
– Two major spare parts and service suppliers were acquired. The companies, which had combined sales of SEK 300 million in 2008, provided Alfa Laval with supplementary channels for serv-ice and equipment for the aftermarket.
Order intake, SEK million
Share of Group’s order intake
0
1,000
2,000
3,000
4,000
5,000
6,000
7,000
0908070605
4,219
5,017
5,7396,232
28%
6,106

42 Alfa Laval Annual Report 2009 / About Alfa Laval
Employees
Continued focus on a stimulating work environmentAlfa Laval strives to be an attractive employer. The goal is to create a pleasant work environment that contributes to developing motivated and dedicated employees, which is ultimately im-portant for the company’s continued success. Establishing a positive and pleasant environment requires continuous efforts.
A basic prerequisite is ensuring compliance with all laws and rules. Alfa Laval supplements these with its own more far-reaching policies. However, certain soft factors are equally important in creating a sound work environment. One such factor is the atmosphere conveyed by management. Treating each other with respect and kindness is vital for creating a sense of satisfaction. It is also important that employees are continuously challenged and offered training and further education, and it is vital to ensure that nationality, religion, race and gender do not hinder individual career development, which should instead be based on experience, expertise and commitment.
Diversity inspires innovation
Alfa Laval’s recruitment processes, personnel development and appointment of managers are to be characterized by equal opportunity and diversity. The goal is for all Group employees to feel that they have career paths available to them. In an international company, the ability to successfully utilize cultural differences is a priceless asset. The same applies to gender distribution. Diversity enriches the Group’s operations and provides a greater understanding of the global context in which the company operates. Differences between people help to establish creativity and new perspectives and inspire innovation.
Changing the company’s distribution of nationalities and gender is a priority for Alfa Laval. One way to achieve this goal is to make consistent efforts to identify, develop and retain talented individuals. Although this work requires a long-term commitment, the process was accelerated when the company introduced an open labor market for internal recruiting. All available positions, including managerial positions, are announced on the Group’s intranet, and internal candidates are encouraged to apply. The objective is to broaden the base of applicants to achieve increased mobility and diversity, and ultimately to promote innovative thinking. Already in its first year, this initiative resulted in increased mobility, between countries and positions. Since the concept was launched in 2007, the proportion of positions announced has more than quadrupled. As a result, not only has the company’s gender and nationality distribution been expanded, the initiative has also provided better opportunities to find the right person for the right position.
In 2009, the proportion of women at the managerial level was 17 percent, compared with 15 percent in 2008. The Group’s long-term goal is to increase the proportion of women in managerial positions to reflect the overall proportion of women in the company as a whole – 20 percent in 2009. A total of 28 nationalities are represented at the managerial level and 60 in the Group as a whole.
Further development positive for companies and employees
Taking a proactive approach to skills development is key prerequisite for being an attractive employer. By offering training and establishing an organization that allows for mobility between positions and countries, Alfa Laval attempts to ensure that the expertise developed remains in the company. The company’s training program was reviewed during the year to adapt it in the best possible manner to the needs that exist in the organization. Among other initiatives,
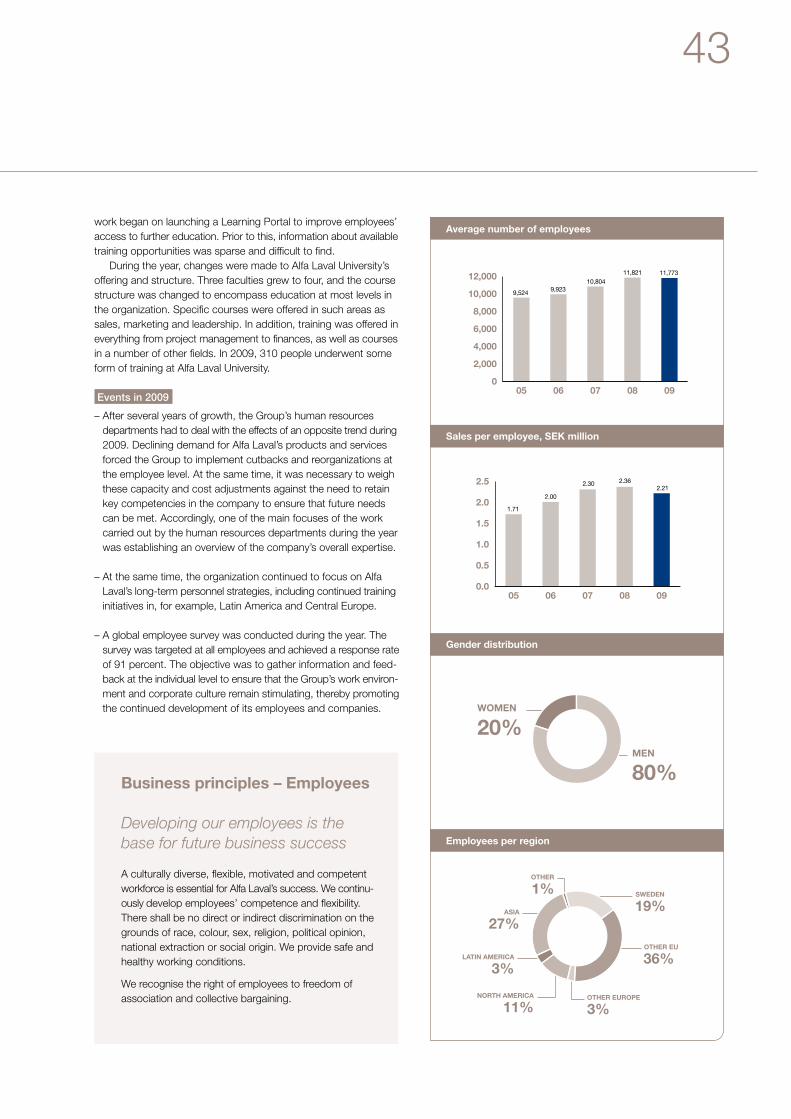
43
work began on launching a Learning Portal to improve employees’ access to further education. Prior to this, information about available training opportunities was sparse and difficult to find.
During the year, changes were made to Alfa Laval University’s offering and structure. Three faculties grew to four, and the course structure was changed to encompass education at most levels in the organization. Specific courses were offered in such areas as sales, marketing and leadership. In addition, training was offered in everything from project management to finances, as well as courses in a number of other fields. In 2009, 310 people underwent some form of training at Alfa Laval University.
Events in 2009
– After several years of growth, the Group’s human resources departments had to deal with the effects of an opposite trend during 2009. Declining demand for Alfa Laval’s products and services forced the Group to implement cutbacks and reorganizations at the employee level. At the same time, it was necessary to weigh these capacity and cost adjustments against the need to retain key competencies in the company to ensure that future needs can be met. Accordingly, one of the main focuses of the work carried out by the human resources departments during the year was establishing an overview of the company’s overall expertise.
– At the same time, the organization continued to focus on Alfa Laval’s long-term personnel strategies, including continued training initiatives in, for example, Latin America and Central Europe.
– A global employee survey was conducted during the year. The survey was targeted at all employees and achieved a response rate of 91 percent. The objective was to gather information and feed-back at the individual level to ensure that the Group’s work environ-ment and corporate culture remain stimulating, thereby promoting the continued development of its employees and companies.
Average number of employees
Sales per employee, SEK million
Gender distribution
Employees per region
Business principles – Employees
Developing our employees is the base for future business success
A culturally diverse, flexible, motivated and competent workforce is essential for Alfa Laval’s success. We continu-ously develop employees’ competence and flexibility. There shall be no direct or indirect discrimination on the grounds of race, colour, sex, religion, political opinion, national extraction or social origin. We provide safe and healthy working conditions.
We recognise the right of employees to freedom of association and collective bargaining.
0
2,000
4,000
6,000
8,000
10,000
12,000
0908070605
0.0
0.5
1.0
1.5
2.0
2.5
0908070605
9,524
1.71
9,923
2.00
10,804
2.30
11,821 11,773
2.362.21
WOMEN
MEN
20%
80%
SWEDEN
19%
OThER
1%
OThER EU
36%
OThER EUROPE
3%NORTh AMERICA
11%
LATIN AMERICA
3%
ASIA
27%

44 Alfa Laval Annual Report 2009 / Sustainability
Sustainability
Sustainability work, now an integral part of everyday business
Alfa Laval has continuously developed its sustainability work since the publication of its Business Principles in 2003. These were based on the United Nations Global Compact and were the result of a consultation process involving Swedish investors, trade-union representatives and employee representatives from the European Works Council, as well as sustainability consultants. The goal was to implement the Business Principles throughout the organization and ensure that work on sustainability became an integral part of business.
Today, Alfa Laval’s operations are also managed in terms of their environmental impact, social responsibility, business ethics and transparency. Sustainability work truly is a fundamental part of the line managers’ duties. As a result, much of the information formerly classified as “sustainability” information is now a normal part of the business and is therefore visible in other sections of the Annual Report. Thus, to avoid repetition, the sustainability section in this year’s Annual Report is brief and mainly focuses on the key initiatives and improvements achieved in 2009 within the focus areas of the Group’s Business Principles.
More detailed information, such as progress reports, new targets, auditing of compliance with the Business Principles, GRI-based cross references and main data, can be found in the sustainability section of the Alfa Laval website: www.alfalaval.com/sustainability. This section is continuously developed to facilitate the evaluation of Alfa Laval’s efforts.
Key initiatives and improvements in 2009
– Energy consumption analyses and reduction targets at the plants resulted in 7 new projects during 2009, bringing the total number to 57. A total of 30 projects were completed. See example on the next page.
– Greenhouse gas emissions from transportation of goods totaled 31 000 tons versus 39 000 in 2008. Approximately half the reduction was due to reduced production volumes. However if we had transported the same amount of goods as in 2008 the environmental impact would still be 10.5 percent lower due to the projects that were completed during the year.
– Lower production volumes and energy-saving projects contributed to reducing the energy consumption in manufacturing and service sites by 10 percent during the year. Alfa Laval’s calculated carbon dioxide emissions from production and service facilities totaled 35,000 tons (33,000). Additional sites included in 2009 together contributed 200 tons. Calculated carbon dioxide emissions didn’t reduce in proportion to the energy savings mainly due to changes in fuel sources used by electricity suppliers.
– The environmental reporting system was extended to a total of 78 sites (71).
– The integration of lifecycle assessments in the new product development process continued. In 2009, 19 (20) new products were assessed using LCA. Of these, 10 were replacements of existing products. The new products have a 9 to 60 percent smaller environmental impact than the products they replaced.
– Alfa Laval’s supplier development process, aimed at improving health, safety and working conditions in developing economies, continued and expanded. Over 200 (126) suppliers in India, China, Mexico and Eastern Europe are now included in this process. Over 150 social inspections were carried out.
– A new Fair Competition Policy was introduced to improve the Group’s knowledge and understanding of anti-trust legislation. Over 90 managing directors and global business managers attended central training sessions. The training will continue to be rolled out in the organization in 2010.
Alfa Laval’s carbon-dioxide emissions in 2009
TRANSPORT
TRAVEL
37%
22%
OWN SITES
41%
TOTAL, TONS
85,000

45
– A new Health and Safety policy was launched and a new reporting system was developed for implementation in 2010.
Sustainability is a line responsibility, but priorities are set by senior management
When the Business Principles were launched in 2003, it was stressed that they must apply to the whole organization. For this to happen, the regular line management had to be responsible for implementing improvements. At the same time, a management structure was developed to decide on group-wide priorities.
Alfa Laval’s Board of Directors reviews results, progress, priorities and targets at least once a year.
Group Management sets annual goals, decides on priorities and allocates resources for all areas covered by the Business Principles, as a regular part of their meetings. They also discuss specific projects regarding social and business ethics in detail.
The Environmental Council is responsible for operational decisions, project establishment, results and progress reviews. It is also responsible for the environmental management system and data reporting processes and tools. It makes recommendations on priorities and targets to Group Management. The Council is run by the head of the Operations Division.
Based on the success of the Environment Council, a Health and Safety Council was set up in 2009. It has the same responsibilities as the Environment Council, but with a focus on Health and Safety, and is managed by the head of Human Resources.
Increased global focus on sustainability is good news for Alfa Laval
Most of Alfa Laval’s product range is essential for saving energy, cleaning water and air and optimizing the yield from foodstuffs – some of the key challenges involved in ensuring the sustainability
Transports have been identified as one of the biggest contributors to Alfa Laval’s total CO2 emissions. This sparked an initiative to launch a project to reduce the proportion of air transport of goods to the facility in Richmond in the US from sites in Denmark and India.
A team at the Richmond facility conducted a pre-study that showed that the main contributor of emissions was air shipments of materials from Kolding in Denmark and Sarole in India to Richmond. In order to maintain short lead times, low inventory costs and favorable flexibility, all of the goods transported from these sites in a single year arrived by airplane. This resulted in 1,085 tons of carbon emissions.
Following the pre-study, a project was initiated to change the means of transport from these two locations. Once the project was fully imple-mented, the aim was for 70 percent of shipments to be made by sea and the remaining 30 percent by air. The goal was to reduce carbon emissions by 70 percent. Although this change would also impact lead times, inventory values and required floor space, the effects would be offset by lower transport costs.
The project’s first important breakthrough was noted in the period from August to October 2009, when the proportion of transports by sea reached 74 percent. The total CO2 emissions for the period were cut by 70 percent and transport costs by 40 percent.
Green operations: Changing transports to the US
of mankind. Since the publication of the Business Principles, the internal focus on environmental issues has been strengthened. As has the drive to ensure that Alfa Laval’s way of doing business does not add to social injustices and corruption.
During the same period, an increased global focus on sustain-ability has resulted in new rules and regulations. These not only support Alfa Laval’s own efforts in the area, but also boost demand for the company’s products.
– Sustainability has become an increasingly important issue for both society in general and corporations. One driving force behind this change has been the growing awareness of the risk posed to human life by climate change. Consequently, stricter environmental legislation encourages existing and future customers to select Alfa Laval’s solutions, which can help reduce energy consumption.
– Concerns regarding climate change are driving targets for the reduction of greenhouse gas emissions in all industrial processes. This challenges Alfa Laval to set demanding targets for its own design, production, logistics and business travel activities. The current target is to reduce CO2 emissions by 15 percent between 2007 and 2011. Allowing for fluctuations in sales volumes, Alfa Laval is deemed to be on target to achieve this goal.
– The search for sustainable energy sources and sustainable means of production has encouraged Alfa Laval to systematically identify, research and develop new “clean-tech” applications. New market opportunities have also emerged for the existing product portfolio to help industries improve their environmental performance.
– Pressure from non-governmental organizations and the media keep labor conditions in developing economies in focus. This pressure is important to help drive Alfa Laval’s own initiatives throughout the supply chain.

46 Alfa Laval Annual Report 2009 / Sustainability
Alfa Laval’s products play a key role in areas that are of vital importance to society, such as energy, the environment and food. Heating, cooling, separating and transporting are basic functions that meet the needs that arise in most industries. Alfa Laval’s equipment can also contribute to reducing energy and water consumption and minimizing carbon dioxide emissions, an increasingly important element of the efforts to reduce the environmental impact caused by humans.
Sustainability – Cases
All human climate footprints can be reduced

47
An Italian olive oil producer started its own olive mill and selected a module from Alfa Laval. The process of transforming olives into oil involves a variety of steps, including cleaning, pressing and separation. It also requires water. Using Alfa Laval’s decanters and separators, water consumption can be reduced by nearly 70 percent. Waste products can also be treated and used as fertilizer.
More olive oil, less water
FOOD
ENERGY
ENVIRONMENT
PureBallast – protecting ocean ecosystems
In 2009, Alfa Laval’s PureBallast product garnered increasing interest. Ballast water, which is used to stabilize ships, has become a major environmental problem that continues to grow. Ballast water carries microorganisms from one part of the world to another, where they have no natural enemies. When the ballast water is then emptied, these microorganisms are thus able to reproduce freely and destroy local ecosystems. In light of this problem, the UN International Maritime Organization (IMO) presented a bill proposing that all ships built from 2012 be subject to ballast cleaning requirements. As of 2016, this will also apply to vessels manufactured prior to 2012. Alfa Laval’s PureBallast, developed in cooperation with Wallenius Water, was the first solution to obtain IMO approval. The technology is patented and based on ultraviolet light that neutralizes the microorganisms, without using chemicals. Approximately 80 systems have been sold in total.
New heat exchanger dramatically reduces emissionsCompabloc, Alfa Laval’s compact, fully welded heat exchanger, has been installed in a Brazilian petrochemical plant that produces cumene, a material used in such applications as the manufacturing of CDs. When the heat exchanger was put into operation, energy consumption declined by 3.4 MW, resulting in a reduction in carbon dioxide emissions totaling 13,800 tons.
A refinery in Canada opted to use a series of Compablocs instead of a traditional technology. With eight compact heat exchangers from Alfa Laval, an energy saving of 14 MW was achieved, compared with using traditional shell-and-tube heat exchangers. In turn, this resulted in a 39,000-ton reduction in carbon emissions annually.
The reduction in emissions in both of the examples above corresponds to the total emissions generated by all cars in Stockholm during nearly a month.

48 Forskning och utveckling
NATURAL PROCESS # 4
ANIMAL / Dromedary
CASE / Oil company
TECHNOLOGY / Heat transfer
A nose for ingenuityMost people are aware that it can get pretty hot in the dessert.
The dromedary is a popular animal and an ex-tremely useful means of transportation in this hot en-vironment. To keep their heads cool, dromedaries use a special cooling system that involves gathering water on the skin of their noses. The water comes from the air that is produced when the dromedary exhales, which is then cooled through the animal’s long, winding nasal passages, enabling water to be formed – and stored on the nose.
This form of nasal heat exchange also protects the dromedary’s brain from becoming overheated. Talk about a nose for ingenuity.
Conserving energy in an energy-intensive production operationThe same natural heat exchange process used by the dromedary to cool its breath is utilized by a major oil company. The difference is that the company applies this process in reverse. And on a larger scale, of course.
The site of the project is a Canadian plant for the production of low-sulfur gasoline, a process that requires considerable energy.
Thanks to the plant’s ability to transfer heat from hot surplus steam to cold water as it comes to a boil, which in turn can be used as energy for production, the company is able to reduce its energy consumption and emissions at the same time as it minimizes its costs for heat transfer.
In 2005, the project received an honorable mention in Canada’s “Natural Resources Energy Efficiency Award Program.”

Financial statements
Board of Directors’ Report 50
Consolidated cash flows 62
Comments to the consolidated cash-flows 63
Consolidated comprehensive income 64
Comments to the consolidated comprehensive income 65
Consolidated financial position 68
Comments on the consolidated financial position 70
Changes in consolidated equity 71
Comments on changes in consolidated equity 73
Parent company cash flows 74
Parent company income 74
Parent company financial position 75
Changes in parent company equity 76
Notes to the financial statements 77
Accounting principles 77
Objectives, policies and processes for managing capital 83
Financial risks 84
Operational risks 87
Notes 90
Proposed disposition of earnings 118
Audit Report 119
Ten-year overview 132
Definitions 134
49B
oard of D
irectors’ Report
Consolidated
cash flow
sC
onsolidated
comprehensive incom
eC
onsolidated
financial positionC
hanges in consolidated equity
Parent com
pany cash flow
sP
arent company
income
Parent com
pany financial position
Changes in parent com
pany equityN
otes to the financial statem
entsO
bjectives, policies and
processes for managing capital
Financial risks
Operational
risksN
otes P
roposed disposition of earnings
Audit
Report

50 Alfa Laval Annual Report 2009 / Financial statements
Board of Directors’ Report
The information in this annual report is such information that Alfa Laval AB (publ) must publish in accordance with the Securities Market Act and/or the Financial Instruments Trading Act. The information was made public by publishing the annual report on Alfa Laval’s website on March 31, 2010 at 8.30 CET and by sending the printed annual report to the shareholders in week 14, 2010 starting at April 6, 2010.
Alfa Laval AB is a public limited liability company. The seat of the Board is in Lund and the company is registered in Sweden under corporate registration number 556587-8054. The visiting address of the head office is Rudeboksvägen 1 in Lund and the postal address is Box 73, 221 00 Lund, Sweden. Alfa Laval’s website is: www.alfalaval.com.
Financial statementsThe following parts of the annual report are financial statements: the Board of Directors’ Report, the ten-year overview, the cash-flow statement, the comprehensive income state-ment, the statement on financial position and the changes in equity for both the consolidated Group and the parent company and the notes. All of these have been audited. The rest of the annual report has been reviewed by the auditors.
Ownership and legal structureAlfa Laval AB (publ) is the parent company of the Alfa Laval Group.
The company had 33,780 (28,078) share-holders on December 31, 2009. The largest owner is Tetra Laval B.V., the Netherlands who owns 18.7 (18.4) percent. The increase in ownership is due to the cancellation of the shares repurchased by the company. Next to the largest owner there are nine institutional investors with ownership in the range of 7.7 to 1.5 percent. These ten largest shareholders own 48.0 (45.9) percent of the shares.
OperationsThe Alfa Laval Group is engaged in the development, production and sales of products and systems based on three main technologies: separation/filtration, heat transfer and fluid handling.
Alfa Laval’s business is divided into the two business divisions ”Equipment” and ”Process Technology” that sell to external
The Board of Directors and the President of Alfa Laval AB (publ) hereby submit their annual report for the year of operation January 1, 2009 to December 31, 2009.
customers and one division “Other” covering procurement, production and logistics as well as corporate overhead and non-core businesses. These three divisions constitute Alfa Laval’s three operating segments.
The business divisions (operating segments) are in turn split into a number of customer segments. The customers to the Equipment division purchase products whereas the customers to the Process Technology division purchase solutions for processing applications. The Equipment division consists of six custo-mer segments: Comfort & Refrigeration, Fluids & Utility Equipment, Marine & Diesel, OEM (Original Equipment Manufacturers), Sanitary Equipment and the aftermarket segment Parts & Service. The Process Technology division consists of five customer segments: Energy & Environment, Food Technology, Life Science, Process Industry and the aftermarket segment Parts & Service.
Material factors of risk and uncertaintyThe main factors of risk and uncertainty facing the Group concern the price development of metals, fluctuations in major currencies and how deep and long lasting the business cycle driven downturn in the demand for the company’s products will be. For additional information, see the sections on financial and operational risks and the section on critical accounting principles, the section on key sources of estimation uncertainty and the section on judgements under accounting principles.
Acquisition of businessesThe full information on the acquisitions is found in Note 17. Below follows a shorter summary of each acquisition.
During 2009On September 1, 2009 Alfa Laval acquired 90 percent of the shares in LHE Co., Ltd in South Korea – a leading heat exchanger company in South Korea. The company targets the compact plate heat exchanger market. LHE will continue to offer its own product range, under the LHE brand, through its own sales network. The company had a turnover in 2009 of SEK 593 million.
On August 14, 2009 Alfa Laval acquired PHE Indústria e Comércio de Equipamentos Ltda in Brazil, a company that services plate heat exchangers in a variety of industries. It
will be integrated into Tranter. The company is consolidated in the Alfa Laval Group from August 1, 2009. Together with the other Latin American business mentioned below the turnover for 2009 was SEK 44 million.
The public offer to purchase an additional 13 percent of Alfa Laval (India) Ltd opened on January 14, 2009 and closed on February 2, 2009. The initial offer of 950 rupees per share was raised to 1,000 rupees per share on January 20, 2009. The result of the offer was that owners of almost 2.2 million shares corresponding to approximately 12 percent of the total number of shares accepted to sell their shares. This means that the ownership in the Indian subsidiary has increased from 76.7 percent to 88.8 percent. The total cost for the acquisition was SEK 376 million.
On February 1, 2009 Alfa Laval acquired HES GmbH Heat Exchanger Systems in Germany, a company with focus on spiral heat exchangers mainly to the process in-dustry. The company will be integrated into Tranter. The company’s net sales for 2009 were SEK 99 million.
On January 16, 2009 Alfa Laval acquired Onnuri Industrial Machinery Co., Ltd, a South Korean system provider to the ship-building and diesel power markets. Onnuri will remain a separate company as it will continue to offer its own systems under the Onnuri brand. Onnuri’s net sales for 2009 were SEK 81 million.
On January 14, 2009 Alfa Laval announ-ced that it had acquired one company and signed an agreement to acquire another, both major providers of parts and service for a variety of products, applications and geographical areas. Both companies will remain separate organisations as they con-tinue to offer their own products and services to the industry, under their own brands. One company is consolidated in the Alfa Laval Group from January 1, 2009 and the other company from January 30, 2009. The combined net sales in 2009 for the two activities were SEK 258 million.
In addition four minor acquisitions have been made during 2009:
On February 4, 2009 Alfa Laval acquired the Polish company Termatrans that has been acting as Tranter’s distributor in Poland. It will be integrated into Tranter. Termatrans’ net sales for 2009 were SEK 18 million.
On February 22, 2009 Alfa Laval acquired

51C
onsolidated
cash flows
Consolidated
com
prehensive income
Consolidated
financial position
Changes in
consolidated equityP
arent company
cash flows
Parent com
pany incom
eP
arent company
financial positionC
hanges in parent com
pany equityN
otes to the financial statem
entsO
bjectives, policies and
processes for managing capital
Financial risks
Operational
risksN
otes P
roposed disposition of earnings
Audit
Report
another minor business in Latin America that also will be integrated in Tranter.
On July 15, 2009 Alfa Laval acquired the assets in the Danish company ISO- MIX A/S. The business has been integrated into the Danish company Alfa Laval Tank Equipment A/S. The turnover for 2009 was SEK 1 million.
On November 9, 2009 Alfa Laval acquired the remaining 9 percent of the Indian com-pany Nitrile India Pvt Ltd, which thereby became a wholly owned subsidiary.
During 2008On August 15, 2008 Alfa Laval acquired the US company Hutchison Hayes Separation, which is a leading provider of separation equipment, parts and services, mainly to the US energy related industries. Hutchison Hayes will operate as a separate organisation and adds a complementary channel for centrifugal separation equipment and service, primarily to the energy related industries in the US. The company had a turnover in 2008 of SEK 139 million.
On July 31, 2008 Alfa Laval acquired the German company Pressko AG, which is specialized in developing and manufacturing fully welded heat exchangers. Pressko AG will be integrated into Tranter, which is a separate organisation within the Alfa Laval Group. Pressko’s net sales in 2008 were SEK 44 million.
On June 13, 2008 Alfa Laval acquired about 44 percent of the Swedish company Ageratec that develops innovative process solutions for the biodiesel industry. On De-cember 29 Alfa Laval increased its owner-ship to about 68 percent and Ageratec be-came a subsidiary. Ageratec’s net sales in 2008 were SEK 58 million.
On June 1, 2008 Alfa Laval acquired the US company Standard Refrigeration, a leading supplier of shell-and-tube heat exchangers for a variety of refrigeration, air-conditioning and industrial applications in the North American market. Standard Refrigeration will be integrated into Alfa Laval in order to capture synergies such as a wider product portfolio combined with an enhanced mar-ket presence. Standard Refrigeration’s net sales in 2008 were SEK 249 million.
On February 11, 2008 Alfa Laval acquired the Danish company Høyer Promix A/S. The company develops, produces and markets agitators mainly for the food and pharma industry. The company has been merged into Alfa Laval Tank Equipment A/S. During 2008 the company had a turnover of SEK 16 million.
In addition two minor acquisitions have been made during 2008:
On September 1, 2008 Alfa Laval acquired the business in the Swedish company P&D’s Plattvärmeväxlarservice AB that performs service on heat exchangers. The company’s net sales for 2008 were SEK 12 million.
On April 1, 2008 Alfa Laval acquired 91 percent of the Indian company Nitrile India Pvt Ltd that manufactures rubberized gas-kets mainly for the food processing industry. The acquisition is part of Alfa Laval’s double branding strategy and the company has thus been renamed to MCD Nitrile India Pvt Ltd. The company has 12 employees and 15-20 temporary employees. The company’s net sales for 2008 were SEK 1 million.
During 2007On December 1, 2007 Alfa Laval finalized the acquisition of the Finnish company Fincoil. The acquisition of Fincoil is in line with Alfa Laval’s strategy to expand the presence in the European air heat exchanger market. The company has 150 employees. Fincoil has a well-established position in the Nordic countries, the Baltic countries and Russia. Approximately 80 percent of the sales are exported. Fincoil has one manufacturing site outside Helsinki in Finland. The intention is to fully integrate Fincoil into Alfa Laval. Fincoil’s net sales for 2007 were SEK 348 million.
On July 2, 2007 Alfa Laval acquired the American company AGC Engineering through an asset deal. The company provides sani-tary plate heat exchanger service and equipment to the dairy and food processing industries. AGC has 65 employees. The acquisition adds a complementary channel for sanitary plate heat exchangers to the dairy and food processing industries mainly in the USA. This applies to new units as well as parts and service. AGC will not be inte-grated into Alfa Laval. The two organizations will go to market independently of each other according to a multi-brand strategy. AGC’s net sales for 2007 were SEK 78 million.
Through a public offer that closed on May 26, 2007 Alfa Laval increased the owner-ship in the Indian subsidiary Alfa Laval (India) Ltd with 12.6 percent to 76.7 percent.
On April 4, 2007 Alfa Laval acquired the Dutch company Helpman. Helpman is a leading company in the European market for air heat exchangers used in the sensitive logistical chain for food, i.e. refrigeration and temperature control to secure the final quality of the products. Helpman has 130 employees within R&D, sales and at two
manufacturing units, in Groningen, the Netherlands and in Sofia, Bulgaria. The in-tention is to fully integrate Helpman into Alfa Laval. Helpman’s net sales for 2007 were SEK 178 million.
On March 16, 2007 Alfa Laval acquired the American company DSO Fluid Handling. The acquisition strengthens Alfa Laval’s position within sanitary processing industries in the US. DSO is a supplier of predominantly parts for pumps and valves and adds a complementary channel for replacement parts. In line with Alfa Laval’s multi-brand strategy, DSO will continue to sell its pro-ducts under its own brand. DSO has 20 employees and is based in Irvington (Newark), New Jersey USA. DSO’s net sales for 2007 were SEK 51 million.
During the beginning of 2007 a transaction was made as a consequence of the acqui-sition of Tranter where SEK 17 million was paid to buy out the agent in Taiwan and thereby achieve full control over Tranter’s company in China.
Sale of real estateDuring 2009 no major sale of properties took place. Two small properties in France are planned for sale. Both of the French properties are empty. One of them has been for sale for several years. None of them is expected to be sold within the next year. This means that no property has been re-classified as current assets held for sale. The situation was the same at the end of 2008. The fair value of the concerned properties exceeds the book value by approximately SEK 8 (2) million.
During 2008 a property in Brazil was sold for SEK 113 million with a realised gain of SEK 102 million. No property was re-classified as current assets held for sale.
During 2007 the property in Tuusula in Finland was sold for SEK 26 million with a realised gain of SEK 25 million. The property in Argentina was sold for SEK 14 million with a realised gain of SEK 11 million. A property in Brussels in Belgium was sold for SEK 27 million with a realised gain of SEK 15 million. Minor sales of land and buildings were made in India for SEK 3 million with a realised gain of SEK 2 million and in France for SEK 2 million with a realised gain of SEK 1 million. In 2007 properties in Brazil and France were also planned for sale. No one of these pro-perties was re-classified as current assets held for sale.
These disposals are reported as compa-rison distortion items in Note 9 to the com-prehensive income statement.
Board of
Directors’ R
eport

52 Alfa Laval Annual Report 2009 / Financial statements
Large ordersLarge orders are orders with a value over EUR 5 million. The volume of large orders is an important indicator of the demand situation and is therefore monitored separately within Alfa Laval. A large volume of large orders normally also means a good load in the factories. During 2009 Alfa Laval has received large orders for SEK 900 (1,135) million. By quarter it has looked like this:
During the first quarter 2009 Alfa Laval received large orders for SEK 140 (390) million:
– Order for plate heat exchangers from a company in the Russian power industry. The order value is about SEK 75 million and delivery is scheduled for 2010.
– Order for heat exchangers from an aluminium production company in India. The order value is about SEK 65 million and final delivery is
scheduled for 2010.
During the second quarter 2009 Alfa Laval received large orders for SEK 105 (210) million:
– An US order for membranes and heat exchangers to concentrate enzymes for production of starch-based ethanol. The order value is about SEK 50 million and delivery is scheduled for 2010.
– Orders for Alfa Laval Packinox heat exchangers from Petrobras’ refineries in Brazil. The order value is about SEK 55 million and delivery is
scheduled for 2011.
During the third quarter 2009 Alfa Laval received large orders for SEK 175 (200) million:
– An order for compact heat exchangers from one of the major refineries in Russia. The order value is about SEK 110 million and delivery is scheduled for 2010.
– An order for spiral heat exchangers from a refinery in Russia. The order value is about SEK
65 million and delivery is scheduled for 2010.
During the fourth quarter 2009 Alfa Laval received large orders for SEK 480 (335) million:
– An order from PetroVietnam Group for equipment and engineering solutions to an ethanol production plant in central Vietnam. The order value is about SEK 100 million. Delivery is scheduled for 2010.
– Another order from PetroVietnam Group for equipment and engineering solutions to an ethanol production plant in northern Vietnam. The order value is about SEK 100 million. Delivery is scheduled for 2010.
– An order for plate heat exchangers and filters for cooling duties in two new nuclear power reactors in China. The order value is about SEK 130 million and delivery is scheduled to be completed by 2011.
0
1,000
2,000
3,000
4,000
5,000
6,000
7,000
8,000
Q409Q309Q209Q109Q408Q308Q208Q108Q407Q307Q207Q1070
5,000
10,000
15,000
20,000
25,000
30,000
+ 3
6%
+ 1
3%
+ 3
0% 0%
+ 9
%
+ 8
%
- 3%
-15%
-32%
- 37
%
- 30
%
- 9%
Orders received
SEK millionsquarter
SEK millions12 months
Order intake per quarter Orders received rolling 12 months value
% = change by quarter compared to corresponding period last year, at constant rates
Orders received amounted to SEK 21,539 (27,464) (27,553) million during 2009. Excluding exchange rate variations, the order intake for the Group was 28.1 percent lower than last year. Adjusted for acquisitions of businesses1), the corresponding figure is a decrease by 30.3 percent.
Order bridge
Consolidated
SEK millions, unless otherwise stated 2009 2008 2007
Order intake last year 27,464 27,553 24,018
Structural change 2.2% 2.6% 1.4%
Currency effects 6.5% 0.1% -3.6%
Organic development -30.3% -3.0% 16.9%
Total -21.6% -0.3% 14.7%
Order intake current year 21,539 27,464 27,553
Excluding exchange rate variations, orders received from the aftermarket “Parts & Service” decreased by 11.1 percent during 2009 compared to last year. Its relative share of the Group’s total orders received was 28.3 (22.7) percent.
1) Acquired businesses are:
LHE Co. Ltd at September 1, 2009,
PHE Indústria e Comércio de Equipamentos Ltda at August 1, 2009,
HES at February 1, 2009,
Onnuri Industrial Machinery at January 16, 2009,
two providers of parts and service at January 14, 2009,
Ageratec at December 29, 2008,
P&D’s Plattvärmeväxlarservice at September 1, 2008,
Hutchison Hayes Separation at August 15, 2008,
Pressko at July 31, 2008,
Standard Refrigeration at June 1, 2008,
Nitrile India at April 1, 2008,
Høyer Promix at February 11, 2008
Orders received

53C
onsolidated
cash flows
Consolidated
com
prehensive income
Consolidated
financial position
Changes in
consolidated equityP
arent company
cash flows
Parent com
pany incom
eP
arent company
financial positionC
hanges in parent com
pany equityN
otes to the financial statem
entsO
bjectives, policies and
processes for managing capital
Financial risks
Operational
risksN
otes P
roposed disposition of earnings
Audit
Report
– An order for Alfa Laval Packinox heat exchangers for an integrated refinery and petrochemical complex in China. The order value is about SEK 90 million and delivery is scheduled for 2010.
– An order for Alfa Laval Packinox heat exchangers from an Algerian refinery. The order value is about SEK 60 million. Delivery is scheduled for 2011.
Order backlog
The order backlog at December 31, 2009 was SEK 11,906 (14,310) (14,730) million. Excluding exchange rate variations and adjusted for acquisitions of businesses the order backlog was 27.7 percent lower than the order backlog at the end of 2008.
Net salesNet sales amounted to SEK 26,039 (27,850) (24,849) million during 2009. Excluding exchange rate variations, the invoicing was 14.4 percent lower than last year. Adjusted for acquisitions of businesses, the corre- sponding figure is a decrease by 17.3 percent.
Operating segments
EquipmEnt DivisionThe Equipment division consists of six customer segments: Comfort & Refrigeration, Fluids & Utility Equipment, Marine & Diesel, OEM (Original Equipment Manufacturers), Sanitary Equipment and the aftermarket segment Parts & Service.
orders received and net sales (all comments are after adjustment for
exchange rate fluctuations)
Orders received decreased by 31.8 percent and net sales decreased by 13.9 percent during 2009 compared to last year. Adjusted for acquisitions of businesses, the corre- sponding figures are a decrease by 34.7 percent and 17.6 percent respectively.
Taking a quarterly view the development for Equipment division during 2009 has been as follows:
The division showed a general decline in the first quarter compared to the same period last year. Lower demand, delays in customers’ decision-making as well as postponed pro-jects all affected the development. The drop was most significant within Marine, which was pressured by a continued slow activity in the ship-building market as well as can-cellations. At the same time, there was a continued good level of infrastructure invest-ments in land-based diesel-generated power. Sanitary and OEM both received some large orders in the quarter, but not enough to reach last year’s levels. Parts & Service was pressured by a decreasing need for upgrades in the marine industry, even though the large installed base provided some support. Lower activity levels in the metal-working industry and construction industry affected customer segments such as Fluids & Utility and
Comfort & Refrigeration respectively. From a geographical perspective, the decline was most pronounced in Asia, mainly due to the development in the marine sector.
Orders dropped in the second quarter compared with the same quarter last year, mainly as a result of the global economic development, which continued to affect all markets and industries. The decline was more pronounced in Marine & Diesel and less in Sanitary and Parts & Service. The latter segment remained resilient, however, not unaffected by the business environment with upgrading investments declining as operators continued to minimize all outgoing cash flow. Order cancellations in the Marine segment were on about the same level as in the first quarter. Compared with the first quarter project orders supported Comfort & Refrigeration and Sanitary, which both outperformed their first-quarter development. At the same time activity remained on a high level among the OEMs that produce heat pumps and among system-builders.
Order intake in the Equipment division declined in the third quarter compared to the corresponding quarter last year. This was due to a continued weak business climate where decisions were often delayed or post-poned. All segments reported a lower order intake with the biggest decline in Marine & Diesel. On the other hand, Marine cancell-ations were on a slightly lower level than in the previous quarter. The Parts & Service segment is also affected by the negative development in the marine market and saw orders drop due to a lower utilisation rate for vessels. For the division as a whole order intake rose slightly compared to the second quarter 2009. All segments were unchanged, except for Marine & Diesel that increased order intake and Comfort & Refrigeration which decreased.
Order intake for the Equipment division declined in the fourth quarter compared to the corresponding quarter last year, mainly due to continued low demand in the marine sector. Compared to the previous quarter the order intake was only slightly lower, suppor-ted by a good development for Sanitary and Fluids & Utility. Sanitary showed a strong development in the fourth quarter compared to both the same period last year and the previous quarter, boosted by a solid demand from the pharmaceutical and personal care
0
3,000
6,000
9,000
12,000
15,000
090807
Order backlog December 31
SEK millions
11,432
11,642
9,637
3,298 2,668
2,269
14,730 14,310
11,906
For delivery during next year
For delivery later than next year
Sales bridge
Consolidated
SEK millions, unless otherwise stated 2009 2008 2007
Net sales last year 27,850 24,849 19,802
Structural change 2.9% 2.5% 3.3%
Currency effects 7.9% 0.6% -3.6%
Organic development -17.3% 9.0% 25.8%
Total -6.5% 12.1% 25.5%
Net sales current year 26,039 27,850 24,849
Board of
Directors’ R
eport

54 Alfa Laval Annual Report 2009 / Financial statements
industries. Meanwhile Fluids & Utility reported a substantial increase from the previous quarter, even as it declined compared to the fourth quarter last year following low capacity utilization in the metal-working sector. Order intake for Comfort & Refrigeration declined in the fourth quarter compared to the same period last year, due to continued low con-struction activity across most regions. Compared to the previous quarter orders were unchanged, partly supported by a strong demand for heat exchanger systems and components for district heating circuits in Russia and China. OEM’s order intake was substantially below the corresponding quarter of 2008, but only slightly lower than the third quarter. The segment noted an in-creased demand for new applications among industrial OEM’s while demand for heat-pumps declined following the removal of certain subsidies. Low contracting levels in the ship-building industry continued to have a nega-tive impact on Marine, as did cancellations. There were exceptions though, as demand grew for products contributing to energy efficiency and environmental improvements in the marine area. Meanwhile the negative financial climate affected investments in diesel power plants. As a whole the Marine & Diesel segment therefore declined compared to both the fourth quarter last year and the previous quarter. Order intake for Parts & Service dropped compared to the fourth quarter last year as a consequence of a drop in demand for marine upgrades and a lower utilization rate throughout industries. Compared to the third quarter order intake grew somewhat as customers’ utilization rates gradually improved.
operating income (excluding comparison distortion items)
Operating income was SEK 2,530 (3,602) (2,866) million in 2009. The decrease in operating income during 2009 compared to last year is mainly explained by a lower gross profit due to decreased margins and volume, partially offset by positive foreign exchange effects and lower costs.
procEss tEchnology DivisionThe Process Technology division consists of five customer segments: Energy & Environ- ment, Food Technology, Life Science, Process Industry and the aftermarket segment Parts & Service.
COMFORT & REFRIGERATION
MARINE & DIESEL
FLUIDS & UTILITY
SANITARY
OEM
PARTS & SERVICE
ENERGY & ENVIRONMENT
PROCESS INDUSTRY
FOOD TECHNOLOGY
LIFE SCIENCE
COMFORT & REFRIGERATION
MARINE & DIESEL
FLUIDS & UTILITY
SANITARY
OEM
PARTS & SERVICE
ENERGY & ENVIRONMENT
COMFORT & REFRIGERATIONPARTS & SERVICE
MARINE & DIESEL
FLUIDS & UTILITY
PROCESS INDUSTRY
ENERGY & ENVIRONMENT
SANITARY
FOOD TECHNOLOGY
OEM
LIFE SCIENCE
Operating segments
Orders received by customer segment 2009
Orders received by customer segment 2008
Orders received by customer segment 2007
PROCESS INDUSTRY
FOOD TECHNOLOGY
LIFE SCIENCE
=
=
=
+
+
+
+
+
+
+
+
++
+
+
+
Equipment
Process Technology
Parts & Service
increase
decrease
unchanged (+/- 3%)
+
=
Compared to last year, at constant rates adjusted for acquisitions and divestments of businesses

55C
onsolidated
cash flows
Consolidated
com
prehensive income
Consolidated
financial position
Changes in
consolidated equityP
arent company
cash flows
Parent com
pany incom
eP
arent company
financial positionC
hanges in parent com
pany equityN
otes to the financial statem
entsO
bjectives, policies and
processes for managing capital
Financial risks
Operational
risksN
otes P
roposed disposition of earnings
Audit
Report
orders received and net sales (all comments are after adjustment for
exchange rate fluctuations)
Orders received decreased by 23.1 percent and net sales decreased by 14.8 percent during 2009 compared to last year. Adjusted for acquisitions of businesses, the corre-sponding figures are a decrease by 24.3 percent and 16.7 percent respectively.
Taking a quarterly view the development for Process Technology division during 2009 has been as follows:
The first quarter showed an overall decline compared to the same quarter last year, when order intake reached record levels for both the project and base business*. The decline was general - only the environment application within Energy & Environment reported an increase. The Parts & Service business was also somewhat lower, but the decline was limited by the increased in-stalled base and service offerings. Project activity was in general lower in the division in the wake of previous quarters’ strong capacity investments, but also because of the financing difficulties associated with the current business climate. Lower project activity primarily affected Food Technology and Process Industry. From a geographical perspective, the decline was smaller in Western Europe and more pronounced in Asia. India was an exception and showed good growth, partly due to some major in-vestments in the metal sector.
There was an overall decline in the second quarter versus the same quarter last year. The base business showed a more mode-rate decline than the average and was on the same level as in the first quarter. Large contracts on the other hand dropped more than the average. The decline was especially pronounced in the Process Industry segment. Oil & gas showed a similar negative trend – a direct reflection of the investment reductions and/or freezes, announced in the respective industries. Environment grew in the quarter due to a continued strong demand for waste-water treatment solutions. Further, Life Science was overall in line with last year, with a strong development in the biotech sector, primarily in the US. Parts & Service declined compared to the same quarter last year, mainly
due to a drop in parts sales. The downturn was partly due to short-term capacity clo-sures at major customers, particularly in the petrochemical and process-related industries. Another negative factor was the halt of preventive maintenance. Comparing the second quarter with the first, even though slightly lower on a total level, there was a strong recovery in Food Technology, with the exception of Brewery. Vegetable Oil Technology had a positive development, with investments returning, partly due to higher commodity prices.
Order intake in the Process Technology division showed an overall decline in the third quarter compared to the same quarter last year. This is mainly due to the market’s overall restrictive approach to major invest-ments, which caused a drop in large orders. The downturn was general for all the seg-ments. Food Technology however, reported only a small decline, helped by the vegetable oil business where activity remained on last year’s levels. Pharma and biotech within Life Science were also only marginally below last year’s levels due to continued activity in the industry in both the U.S. and Asia. Refinery was up year on year, driven by in-vestments in both efficiency and capacity improvements. Still, the Process Industry segment as a whole declined due to the negative development for inorganics, metals, paper and natural resources. Parts & Service showed a limited decline compared to the third quarter last year, affected by capacity closures of major customers. Compared to the second quarter 2009, order intake for the division as a whole increased somewhat, driven by large project orders in the Process Industry segment.
Order intake for the Process Technology division showed a slight contraction in the fourth quarter compared to the correspon-ding period last year. Compared to the third quarter the division’s order intake was up substantially. This was primarily a result of an increase in large projects, especially in Process Industry. A positive development was also noted in the base business. In Process Industry order intake grew as a re-sult of several large bio fuel projects being secured. Metals and paper declined some
compared to the fourth quarter last year, but showed clear growth compared to the third quarter. Petrochemicals were also lower compared to the fourth quarter last year, as was Refinery. The latter was however unchanged from the third quarter as custo-mers continued to invest in new capacity and in energy efficiency improvements. En-vironment did well compared to both the fourth quarter last year and the third quarter 2009 and reported a continued good order intake, especially for waste water applications. At the same time Power showed a significant increase from the third quarter due to orders for the nuclear power industry, although still below the fourth quarter 2008 levels. Energy & Environment as a whole also showed a significant increase compared to the third quarter. However, compared to the fourth quarter last year it declined as a result of continued restrictive investment behaviour primarily in the oil and gas industries. Food Technology declined somewhat compared to the corresponding quarter last year as a result of continued brewery consolidation. This was partly compensated by a strong development for vegetable oil, which bene-fitted from larger investments in particular in Asia. The Parts & Service segment was also slightly lower compared to the fourth quarter last year due to lower activity follo-wing short-term capacity closures at major customers. Compared to the third quarter it still was an improvement.
operating income (excluding comparison distortion items)
Operating income was SEK 2,040 (2,756) (2,312) million in 2009. The decrease in operating income during 2009 compared to last year is foremost explained by a lower gross profit due to decreased margins and volume, partially offset by positive foreign exchange effects and lower costs.
othErOther is covering procurement, production and logistics as well as corporate overhead and non-core businesses.
Operating income was SEK -138 (-395) (-433) million in 2009.
* Base business and base orders refer to orders with an order value of less than EUR 0.5 million.
Board of
Directors’ R
eport

56 Alfa Laval Annual Report 2009 / Financial statements
-23%
-23%-18%
-37%
-27%
-2%
-6% -16%
+11%
+7%
-6%
+19%
+10% +8%
+28%
+51%
+14%
-26%
Orders received 2009
Orders received 2008
Orders received 2007
Information about geographical areas
1
2
34
5
6 7
1
2
34
5
6 7
1
2
34
5
6 7
1 Nordic 10%2 Western Europe 27%3 Central & Eastern Europe 8%4 Asia 31%5 North America 16%6 Latin America 6%7 Other 2%
1 Nordic 10%2 Western Europe 25%3 Central & Eastern Europe 8%4 Asia 34%5 North America 15%6 Latin America 6%7 Other 2%
1 Nordic 10%2 Western Europe 26%3 Central & Eastern Europe 9%4 Asia 31%5 North America 16%6 Latin America 6%7 Other 2%
= Compared to YTD 2008 after adjustment for exchange rate fluctuation
= Compared to YTD 2007 after adjustment for exchange rate fluctuation
= Compared to YTD 2006 after adjustment for exchange rate fluctuation

57C
onsolidated
cash flows
Consolidated
com
prehensive income
Consolidated
financial position
Changes in
consolidated equityP
arent company
cash flows
Parent com
pany incom
eP
arent company
financial positionC
hanges in parent com
pany equityN
otes to the financial statem
entsO
bjectives, policies and
processes for managing capital
Financial risks
Operational
risksN
otes P
roposed disposition of earnings
Audit
Report
All comments are reflecting the quarterly development during the year and are after considering exchange rate variations.
Western Europe including nordicOrders in Western Europe including the Nordic region were substantially lower in the first quarter compared to the same period last year. Order intake was lower for all customer segments, both in the Equipment division and the Process Technology division, with the exception of Energy & Environment. Orders for Parts & Service also declined compared to the same quarter last year. The best sales region was the UK where order intake was flat. All other sales regions reported a decline compared to the first quarter last year.
Order intake dropped considerably in the second quarter, across the region, compared to the same period last year. All segments with the exception of Life Science showed a decline. Compared with the first quarter, order intake for both capital goods and Parts & Service was on a slightly lower level.
In the third quarter orders received were considerably below the same quarter last year, with the exception of France. Most segments reported a decline in the period, except Food Technology and Life Science that grew. The order intake in the quarter represented a slight decline also in relation to the second quarter 2009.
In the fourth quarter orders received were considerably below the corresponding quarter 2008, with the exception of France. All segments reported a decline in the period except Energy & Environment, which grew. Compared to the third quarter 2009 order intake grew substantially in all sales regions except the Adriatic, which showed a decline and Mid Europe, which was unchanged. Both the base business* and orders for Parts & Service had a positive development and grew compared to the previous quarter.
central and Eastern EuropeFewer large orders as well as a lower order intake for the base business led to an over-all weak development in the region in the first quarter. There were however a few exceptions among the customer segments. OEM did well as did Energy & Environment. The latter was boosted by orders in Russia. The order
intake for Parts & Service was flat compared to the same quarter in 2008.
The second quarter showed an overall weak development, with a decline in both large orders and the base business. Orders dropped in most countries. The segments were also generally lower, however Energy & Environment and Food Technology in-creased compared to the corresponding quarter last year. Both segments reported a good order intake in Russia, Turkey and South East Europe.
Order intake in Central and Eastern Europe declined in the third quarter versus the same quarter last year, pressured by lower demand in most countries and segments. Russia defied the trend and reported an increase coming from large orders in the Process Industry segment as well as in Food Tech-nology and Life Science. Compared to the second quarter 2009, order intake rose in the region, explained by the positive deve-lopment in Russia.
Central and Eastern Europe showed signs of recovery with a small increase in orders in the fourth quarter compared to the corresponding period last year. Poland, the Baltic countries as well as Russia sho-wed good development, as did Comfort & Refrigeration and Sanitary among the seg-ments. The region as a whole was down from the third quarter 2009 despite an in-crease in the base business. This was due to some very large orders that were booked in Russia in the previous period.
north AmericaOrders received were substantially lower in the first quarter compared to the same period last year. Order intake in the Equipment division was flat whereas it was very weak in the Process Technology division. Orders for Parts & Service also showed a clear contraction compared to the same quarter last year.
Orders received decreased substantially during the second quarter compared to the same quarter last year. All segments showed a decline with the exception of Comfort & Refrigeration and Life Science. Second quarter order intake in the U.S. was on about the same level as in the first quarter.
Orders received in the region were sub-stantially lower in the third quarter than the corresponding period last year. The decline
was more or less general as only the OEM segment reported an increase. Compared to the second quarter 2009 the order in-take was basically unchanged both overall and for the base business. Parts & Service, however, reported growth compared to the second quarter.
Order intake in the region was substanti-ally lower in the fourth quarter than the cor-responding period last year. This was visible in all segments with the exception of Parts & Service and Energy & Environment which both were unchanged. Compared to the third quarter 2009 order intake grew, mainly boosted by the development for Sanitary, Energy & Environment and Process Industry. The base business remained unchanged from the third quarter.
latin AmericaOrders received in Latin America showed a major downturn in the first quarter and was burdened by the very weak development in Brazil. Mexico, Chile and Ecuador all had a good development, especially within refinery, but they were not able to offset the decline in Brazil.
Order intake in Latin America showed a major decline in the second quarter, driven by lower demand across countries and segments. All countries reported a drop in orders received, except Mexico which saw a strong development due to a good order intake for Refinery in the Process Industry segment. Brazil in general reported a lower order intake, but Marine & Diesel grew compared with the same period last year and the order intake for Refinery was also on a good level. Compared with the first quarter the region reported an unchanged level of order intake.
Order intake in the region as a whole declined in the third quarter compared to the corresponding quarter last year, even if Argentina, Chile and Colombia reported growth. Brazil saw a negative order deve-lopment due to lower demand in the ethanol industry. The refinery business in Mexico performed well. Compared to the second quarter 2009, order intake represented a broad-based growth.
Order intake in Latin America was slightly higher in the fourth quarter compared to both the corresponding quarter last year
* Base business and base orders refer to orders with an order value of less than EUR 0.5 million.
Board of
Directors’ R
eport

58 Alfa Laval Annual Report 2009 / Financial statements
PersonnelThe parent company does not have any employees.
The Group has on average had 11,773 (11,821) (10,804) employees. At the end of December 2009 the Group had 11,390 (12,119) (11,395) employees. The employee turnover rate for 2009 is 13.4 (11.7) (8.1) percent and mainly relates to employees within warehouses and logistical units and manufacturing units.
Alfa Laval has several internal training programmes for employees on different levels and in different functions within the Alfa Laval University framework, for instance the Booster programme for top managers reporting to Group Management, the Chal-lenger programme for potential future ma-nagers, Adept for employees engaged in the sales process and Leading business through Finance @ Alfa Laval – a develop-ment program for financial managers and senior controllers.
Alfa Laval is working to achieve equal career opportunities independent of for in-stance gender or ethnic origin. The latter is not the least important in an international company. Likewise the number of female managers shall increase in order to better reflect the females’ part of the total number of employees. To facilitate this, a mentor programme has started for women with capacity to become future leaders.
The distribution of employees per country and per municipality in Sweden and between males and females can be found in Note 5 in the notes to the financial statements. The specification of salaries, wages, remunera-tions, social costs and pension costs are provided in Note 6 in the notes to the finan-cial statements.
Guidelines for remunerations to executive officersThe guidelines for remunerations to executive officers are established by the Annual General Meeting, see further description in Note 6.
The Annual General Meetings 2008 and 2009 decided to implement step one and two of a cash based long term incentive programme for approximately 75 senior managers in the Group including the Chief Executive Officer and the persons defined as executive officers. The Board of Directors
will propose the Annual General Meeting 2010 to implement step three of the long term incentive programme for the period January 1, 2010 – December 31, 2012. No other changes of these guidelines are proposed by the Board of Directors.
Research and developmentAs the result of an intensive and consistent commitment over many years to research and development, Alfa Laval has achieved a world-leading position within the areas of separation and heat transfer. The product development within fluid handling has resulted in a strong market position for a number of products. In order to strengthen the Group’s position and to support the organic growth, by identifying new applica-tions for existing products as well as developing new products, research and development is always an activity of high priority. Research and development is conducted at approximately twenty facilities around the world.
The costs for research and development have amounted to SEK 654 (718) (643) million, corresponding to 2.5 (2.6) (2.6) percent of net sales. Adjusted for exchange rate varia-tions and acquisitions of businesses, the costs for research and development have decreased by 14.0 percent compared to last year.
Ethics and social responsibilityTwo of Alfa Laval’s four business principles are: ”Respect for human rights is fundamental” and ”High ethical standards guide our conduct”. This means that Alfa Laval respects human rights and the very different social cultures in which the company works and supplies its products and services and that Alfa Laval conducts its business with honesty, integrity and respect for others.
Globalisation gives Alfa Laval new busi-ness opportunities for increased sales as well as lower costs for manufacturing the products. But when part of the supply chain is moved to countries with lower costs the company is often confronted with ethical questions in a more obvious manner. Health, security and working conditions for the employees at the company’s suppliers are some of Alfa Laval’s main topics. When Alfa Laval procures products from quickly growing economies like China and India it is important for the company to secure that
and the previous quarter. The positive de-velopment was noted in Mexico, Argentina, Brazil and Peru, mainly due to growth in Food Technology and Process Industry.
AsiaThe region had an overall weak development in the first quarter compared to the all-time-high order levels recorded in the corresponding period last year. Still, some countries bucked the trend, where for instance India reported increases versus the same period last year. From a customer segment perspective, the decline in order intake was general.
The region experienced an overall drop in order intake in the second quarter com-pared to the corresponding period last year, mainly due to a continued weak development in the marine industry. Still, some segments had a strong development in the period. Both Sanitary and Food Technology perfor-med well in China and South East Asia. Other segments to do well in the Chinese market were Life Science and Refrigeration.
Under continued negative influence from the development in Marine, the region re-ported an overall lower order intake in the third quarter compared to the same quarter last year. At the same time Sanitary showed a good development in South East Asia, China and the Middle East and Energy & Environ-ment benefitted from energy projects in In-dia, Middle East and China. The same pro-jects enabled order intake in the region to rise compared to the second quarter 2009.
The region reported a small improvement in order intake in the fourth quarter compared to the corresponding period last year, with a particularly good development in China, India and South East Asia. The base busi-ness was also up from the corresponding quarter 2008. Sanitary continued to show a good development in most Asian countries. At the same time Food Technology was boosted by vegetable oil related orders in India and South East Asia and Process Industry benefitted from ethanol projects in Vietnam as well as pulp and paper projects in India. Parts & Service reported a decline in the period, mainly due to a drop in demand for marine upgrades. Compared to the third quarter order intake in the region rose some-what driven by large projects. The base business declined slightly influenced by the development in the marine industry.

59C
onsolidated
cash flows
Consolidated
com
prehensive income
Consolidated
financial position
Changes in
consolidated equityP
arent company
cash flows
Parent com
pany incom
eP
arent company
financial positionC
hanges in parent com
pany equityN
otes to the financial statem
entsO
bjectives, policies and
processes for managing capital
Financial risks
Operational
risksN
otes P
roposed disposition of earnings
Audit
Report
0
2,500
5,000
7,500
10,000
12,500
Dec. 31, 2009Dec. 31, 2008Dec. 31, 2007Dec. 31, 2006
0
500
1,000
1,500
2,000
2,500
2004 2005 2006 2007 2008 2009
0
2,000
4,000
6,000
8,000
10,000
12,000
2007 2008 2009
180
1,414
185
1,529
303
1,692
461
1,839
521
1,835
389
1,822
1,594
4,2734,561 4,669 4,066
919390843
3,358
1,814
429951
3,548
1,503
1,0191,018392902
3,347
3,570
2,393
647
2,745
1,025
3,846
2,524
735
3,041
1,224
3,620
2,501
718
3,239
1,247
1,175
1,016388882
3,112
444
1,715
1,996
2,300 2,3562,212
8%
-4%
-10%
-5%
10,804
11,821 11,773
Employees
Average number of employees – by region
Employees – by category
Employees – Productivity development
Nordic
North America
Western Europe
Latin America
Central & Eastern Europe
Other
Asia
Manufacturing, logistics & procurement
Central Sales & Marketing
Management & Administration
Local sales and service
R&D
Acquired
Adjusted EBITA / average number of employees Net sales / average number of employees
Number
Number
SEK thousands
The figure for 2009 has been affected by the fact that it takes some time until the average number of employees decrease as a consequence of the restructuring measures.
The change in percent from 2006 until 2009 for the largest personnel categories is found to the right of the bar chart.
The productivity by employee has developed as follows:
Board of
Directors’ R
eport
The distribution of the number of employees by region is:
The distribution of the number of employees by personnel category is:

60 Alfa Laval Annual Report 2009 / Financial statements
the cost reduction opportunities are not at the expense of those performing the work in each country. Alfa Laval regards it as an obligation to make sure that its suppliers develop quickly if the work, health and se-curity conditions are not acceptable.
Alfa Laval has developed an internal training programme to give sales people and purchase departments knowledge on legal business practice.
EnvironmentOne of Alfa Laval’s four business principles is: ”Optimizing the use of natural resources in the most efficient manner is our business.” The company’s products make a significant contribution to reducing the environmental impact of industrial processes and are used to produce renewable energy.
Since 2004 the Group runs a project to improve the internal environmental mana-gement systems. Today all sites (except re-cent acquisitions) have an environmental management system in place. At the end of 2009 22 (18) (11) production sites with ISO 14001 certification accounted for about 95 (80) (69) percent of the delivery value. Another two sites have ongoing certifications. With these certified more than 95 percent of the delivery value will come from certi-fied sites.
The subsidiary, Alfa Laval Corporate AB, is involved in operational activities that are subject to an obligation to report and com-pulsory licensing according to Swedish en-vironmental legislation. The permits mainly relate to the manufacturing of heat exchan-gers in Lund and Ronneby and the manu-facturing of separators in Tumba and Eskils-tuna. The external environment is affected through limited discharges into the air and water and through waste and noise.
The foreign manufacturing sites within the Alfa Laval Group are engaged in opera-tional activities with a similar effect on the external environment. To what extent this activity is subject to an obligation to report and/or compulsory licensing according to local environmental legislation varies from country to country. Alfa Laval has an over-all intention to operate well within the limits that are set by local legislation.
Asbestos-related lawsuitsThe Alfa Laval Group was as of December 31, 2009, named as a co-defendant in a total of 444 asbestos-related lawsuits with a total of approximately 564 plaintiffs. Alfa Laval strongly believes the claims against the Group are without merit and intends to vigorously contest each lawsuit.
Based on current information and Alfa Laval’s understanding of these lawsuits, Alfa Laval continues to believe that these lawsuits will not have a material adverse effect on the Group’s financial condition or results of operation.
Result for the parent companyThe parent company’s result after financial items was SEK 4,079 (3,133) (2,713) million, out of which dividends from subsidiaries were SEK 3,201 (2,201) (1,208) million, group contributions SEK 878 (844) (1,476) million, net interests SEK 11 (36) (40) million, realised and unrealised exchange rate gains and losses SEK -10 (10) (1) million, considera-tion from external captive SEK 14 (55) (-), costs related to the listing SEK -2 (-3) (-2) million, fees to the Board SEK -5 (-4) (-4) million, costs for annual report and annual general meeting SEK -4 (-3) (-3) million and other administration costs the remaining SEK -4 (-3) (-3) million. Appropriation to tax allocation reserve has been made with SEK -225 (-239) (-378) million. Income taxes amount to SEK -177 (-200) (-318) million. Net income for the year was SEK 3,677 (2,694) (2,017) million.
Unrestricted equity for the parent companyThe unrestricted equity of Alfa Laval AB (publ) was SEK 7,321 (4,593) (3,628) million. The figure for 2008 has been affected by the repurchase of shares by SEK -766 million.
Proposed disposition of earningsThe Board of Directors propose a dividend of SEK 2.50 (2.25) (2.25) per share corre- sponding to SEK 1,055 (949) (973) million and that the remaining income available for distribution in Alfa Laval AB (publ) of SEK 6,266 (3,644) (2,655) million be carried forward, see page 118.
The Board of Directors are of the opinion that the proposed dividend is in line with the requirements that the type and size of operations, the associated risks, the capital needs, liquidity and financial position put on the company.
Disclosure on share related information Paragraph 2a in chapter 6 of the Swedish Annual Accounts Act requires listed companies to disclose certain information relating to the company’s shares in the Board of Directors’ Report. This information is found in the following paragraphs, in the “Changes in consolidated equity” and in Note 6.
Cancellation of repurchased shares and bonus issueOn March 19, 2009 when the notice to the Annual General Meeting was sent the number of repurchased shares was 7,353,950. The Annual General Meeting 2009 decided to cancel these repurchased shares. Cancellation of 7,353,950 shares means that the share capital will decrease with SEK 19 million. At the same time the Annual General Meeting decided to increase the share capital through a bonus issue of the same amount without issuing any shares. In this way the size of the share capital was restored and the company did not have to obtain permission from Bolagsverket or if disputed the local court to cancel the repurchased shares.
At January 1, 2009 the share capital of SEK 1,116,719,930 was divided into 429,393,416 shares. Since then the following changes have taken effect:
Specification of number of shares
Number
Number of shares at January 1, 2009 429,393,416
Cancellation of re-purchased shares -7,353,950
Number of shares at December 31, 2009 422,039,466

61C
onsolidated
cash flows
Consolidated
com
prehensive income
Consolidated
financial position
Changes in
consolidated equityP
arent company
cash flows
Parent com
pany incom
eP
arent company
financial positionC
hanges in parent com
pany equityN
otes to the financial statem
entsO
bjectives, policies and
processes for managing capital
Financial risks
Operational
risksN
otes P
roposed disposition of earnings
Audit
Report
Events after the closing dateTwo acquisitions of businesses have been completed in January 2010. For further information reference is made to the issued press releases.
The statements on financial position and the comprehensive income statements will be adopted at the Annual General Meeting of shareholders on April 26, 2010.
Outlook for the first quarter In the fourth quarter and full year 2009 report issued on February 9, 2010, the President and Chief Executive Officer Lars Renström stated:
“We expect demand during the first quarter 2010 to be on about the same level as during the fourth quarter 2009.”
Earlier published outlook (October 21, 2009):
“We expect demand during the fourth quarter to
be on about the same level as during the third
quarter 2009.”
Date for the next financial reports during 2010 Alfa Laval will publish interim reports during 2010 at the following dates:
Interim report for the first quarter April 26Interim report for the second quarter July 20Interim report for the third quarter October 21
Board of
Directors’ R
eport

62 Alfa Laval Annual Report 2009 / Financial statements
Consolidated cash flows
Consolidated cash flows
SEK millions Note 2009 2008 2007
Cash flow from operating activities
Operating income 4,030 5,736 4,691
Adjustment for depreciation 721 560 608
Adjustment for other non-cash items 37 -879 -73
4,788 5,417 5,226
Taxes paid -1,533 -1,868 -1,130
3,255 3,549 4,096
Changes in working capital:
Increase(-)/decrease(+) of receivables 1,776 87 -1,163
Increase(-)/decrease(+) of inventories 1,439 -192 -1,110
Increase(+)/decrease(-) of liabilities -1,233 264 896
Increase(+)/decrease(-) of provisions 110 354 545
Increase(-)/decrease(+) in working capital 2,092 513 -832
5,347 4,062 3,264
Cash flow from investing activities
Investments in fixed assets (Capex) -451 -747 -556
Divestment of fixed assets 8 140 79
Acquisition of businesses 27 -2,177 -726 -1,199
-2,620 -1,333 -1,676
Cash flow from financing activities
Received interests and dividends 32 219 49
Paid interests -292 -266 -229
Realised financial exchange differences -5 -245 -64
Repurchase of shares - -766 -1,497
Dividends to owners of parent company -949 -963 -698
Dividends to minority owners in subsidiary -6 -20 -27
Increase(-)/decrease(+) of financial assets 213 -380 -13
Increase(+)/decrease(-) of borrowings -1,660 -178 1,188
-2,667 -2,599 -1,291
Cash flow for the period 60 130 297
Cash and bank at the beginning of the period 1,083 856 546
Translation difference in cash and bank -31 97 13
Cash and bank at the end of the period 26 1,112 1,083 856
Free cash flow per share (SEK) * 6.46 6.38 3.60
Capex in relation to sales 1.7% 2.7% 2.2%
Average number of shares ** 422,039,466 427,500,307 440,611,504
* Free cash flow is the sum of cash flows from operating and investing activities.
** Average number of shares has been affected by the repurchase of shares and the 4:1 split.

63B
oard of D
irectors’ Report
Consolidated
com
prehensive income
Consolidated
financial position
Changes in
consolidated equityP
arent company
cash flows
Parent com
pany incom
eP
arent company
financial positionC
hanges in parent com
pany equityN
otes to the financial statem
entsO
bjectives, policies and
processes for managing capital
Financial risks
Operational
risksN
otes P
roposed disposition of earnings
Audit
Report
For further comments on certain individual lines in the cash-flow statement, reference is made to Notes 26 and 27.
Cash flowCash flow from operating and investing activities amounted to SEK 2,727 (2,729) (1,588) million during 2009. Out of this, acquisitions of businesses were SEK -2,177 (-726) (-1,199) million whereas divestments generated cash of SEK 8 (140) (79) million.
Adjustment for other non-cash itemsOther non-cash items are mainly referring to realised gains and losses in connection with sale of assets. These have to be eliminated since the cash impact of divestments of fixed assets and businesses are reported separately under cash flow from investing activities.
Working capitalWorking capital decreased by SEK 2,092 (513) million during 2009 whereas the corresponding figure for 2007 was an increase by SEK 832 million.
InvestmentsInvestments in property, plant and equipment amounted to SEK 451 (747) (556) million during 2009. The investments made for the individual product groups are as follows:
heat exchangersInvestments have been made in machines for manufacturing of new products and in productivity enhancing equipment in Ronneby in Sweden and in Alonte in Italy for brazed heat exchangers. Investments have also been made in China in equipment to increase capacity and widen the product range for
heat exchangers. Major investments in production capacity for welded heat exchangers have been made in both Fontanil and Chalon in France. Investments in air heat exchanger manufacturing equipment have been made in Groningen in the Netherlands and in Vantaa in Finland.
DecantersDuring 2009 no major investments have been made relating to decanters.
high speed separatorsInvestments in equipment for manufacturing of new products have been made in Eskilstuna in Sweden.
Fluid handling productsInvestments have been made in lean manufacturing in Kolding in Denmark for the valves product range.
DepreciationsDepreciation, excluding allocated step-up values, amounted to SEK 391 (304) (265) million during the year.
Acquisitions and disposalsFor a further analysis of the impact on the cash flow by acquisitions and disposals, see Note 27.
Free cash flow per shareThe free cash flow per share is SEK 6.46 (6.38) (3.60).
Comments to the consolidated cash-flows Consolidated
cash flow
s

64 Alfa Laval Annual Report 2009 / Financial statements
Consolidated comprehensive income
Consolidated comprehensive income
SEK millions Note 2009 2008 2007
Net sales 1, 2, 3, 4 26,039 27,850 24,849
Cost of goods sold 10 -16,411 -16,481 -15,340
Gross profit 9,628 11,369 9,509
Sales costs 5, 6, 8, 10 -3,179 -3,194 -2,751
Administration costs 5, 6, 7, 10 -1,132 -1,239 -1,159
Research and development costs 10 -654 -718 -643
Other operating income * 9 442 522 362
Other operating costs * 9, 10 -1,075 -1,004 -627
Operating income 4,030 5,736 4,691
Dividends and fair value adjustments 11 -1 2 2
Interest income and financial exchange rate gains 12 404 397 271
Interest expense and financial exchange rate losses 12 -673 -794 -407
Result after financial items 3,760 5,341 4,557
Taxes on this year’s result 16 -1,017 -1,528 -1,350
Other taxes 16 -6 -6 -27
Net income for the year 2,737 3,807 3,180
Other comprehensive income:
Cash flow hedges 551 -515 -26
Translation difference -392 850 224
Deferred tax on other comprehensive income -175 163 6
Comprehensive income for the year 2,721 4,305 3,384
Net income attributable to:
Equity holders of the parent 2,710 3,774 3,137
Minority interests 27 33 43
Earnings per share (SEK) 6.42 8.83 7.12
Average number of shares ** 422,039,466 427,500,307 440,611,504
Comprehensive income attributable to:
Equity holders of the parent 2,684 4,261 3,328
Minority interests 37 44 56
* The line has been affected by comparison distortion items, see specification in Note 9.
** Average number of shares has been affected by the repurchase of shares and the 4:1 split.

65B
oard of D
irectors’ Report
Consolidated
cash flow
sC
onsolidated
financial positionC
hanges in consolidated equity
Parent com
pany cash flow
sP
arent company
income
Parent com
pany financial position
Changes in parent com
pany equityN
otes to the financial statem
entsO
bjectives, policies and
processes for managing capital
Financial risks
Operational
risksN
otes P
roposed disposition of earnings
Audit
Report
For comments on the individual lines in the comprehensive income statement, reference is made to Notes 1 to 16 and Note 30. For comments on the operating segments, see Note 1.
As a basis for comments on the various main items of the comprehensive income state-ment, please find a comparison between the last three years:
Income analysis
Consolidated
SEK millions 2009 2008 2007
Net sales 26,039 27,850 24,849
Adjusted gross profit * 9,958 11,625 9,852
- in % of net sales 38.2 41.7 39.6
Expenses ** -4,982 -5,161 -4,607
- in % of net sales 19.1 18.5 18.5
Adjusted EBITDA 4,976 6,464 5,245
- in % of net sales 19.1 23.2 21.1
Depreciation -391 -304 -265
Adjusted EBITA 4,585 6,160 4,980
- in % of net sales 17.6 22.1 20.0
Amortisation of step up values -330 -256 -343
Comparison distortion items -225 -168 54
Operating income 4,030 5,736 4,691
* Excluding amortisation of step up values. ** Excluding comparison distortion items.
Comments to the consolidated comprehensive income
Sales and administration expenses amounted to SEK 4,311 (4,433) (3,910) million. Adjusted for exchange rate variations and acquisitions of businesses, sales and administration expenses were 13.6 percent lower than last year.
The costs for research and development have amounted to SEK 654 (718) (643) million, corresponding to 2.5 (2.6) (2.6) percent of net sales. Adjusted for exchange rate variations and acquisitions of businesses, the costs for research and development have decreased by 14.0 percent compared to last year.
The decrease in amortisation of step up values in 2008 was due to the fact that some step up values from year 2000 became fully amortised during early 2008.
The adjusted result after tax and the minority’s share of the result, excluding depreciation of step-up values and the corresponding tax, is SEK 7.00 (9.26) (7.64) per share.
Compared with last year Alfa Laval has been affected during 2009 by exchange rate differences, both through translation differences and through the net exposure when trading in foreign currencies. The ef-fect on adjusted EBITA has been calculated to totally about SEK 166 (-291) (-254) million for the full year 2009 compared with last year. The effect of the exchange rate varia-tions has been limited through exchange rate hedging and through the distribution of the company’s financial debts in relation to its net assets in different currencies.
Consolidated
com
prehensive income

66 Alfa Laval Annual Report 2009 / Financial statements
0
1,000
2,000
3,000
4,000
5,000
6,000
7,000
8,000
9,000
Q409Q309Q209Q109Q408Q308Q208Q108Q407Q307Q207Q10730
32
34
36
38
40
42
44
46
Net sales & adjusted gross profit margin
SEK millions %
Net sales Adjusted gross profit in % of net sales
0
300
600
900
1,200
1,500
1,800
Q409Q309Q209Q109Q408Q308Q208Q108Q407Q307Q207Q1074
8
12
16
20
24
Adjusted EBITA
SEK millions %
Adjusted EBITA Adjusted EBITA in % of net sales
In order to illustrate the quarterly development, the last 12 quarters are shown below for four of the parameters in the income analysis:
The operating income has been affected by comparison distortion items of SEK -225 (-168) (54) million, which are specified below. In the comprehensive income statement these are reported gross as a part of other operating income and other operating costs, see summary in Note 9.
2009 is burdened with SEK -225 million for restructuring measures.
In 2008 a property in Brazil was sold for SEK 113 million with a realised gain of SEK 102 million. The costs for the restruc-turing programme burdened 2008 with SEK -270 million.
During 2007 the property in Tuusula in Finland was sold for SEK 26 million with a realised gain of SEK 25 million. The prop-erty in Argentina was sold for SEK 14 mil-lion with a realised gain of SEK 11 million. A property in Brussels in Belgium was sold for SEK 27 million with a realised gain of SEK 15 million. Minor sales of land and buildings were made in India for SEK 3 mil-lion with a realised gain of SEK 2 million and in France for SEK 2 million with a real-ised gain of SEK 1 million.
The financial net has amounted to SEK -208 (-181) (-179) million, excluding real-ised and unrealised exchange rate losses and gains. The main elements of costs were interest on debt to the banking syndi-cate of SEK -58 (-94) (-65) million, interest on the private placement of SEK -35 (-44) (-40) million and a net of dividends and other interest income and interest costs of SEK -115 (-43) (-74) million.
The net of realised and unrealised ex-change rate differences amounts to SEK -62 (-214) (45) million.

67B
oard of D
irectors’ Report
Consolidated
cash flow
sC
onsolidated
financial positionC
hanges in consolidated equity
Parent com
pany cash flow
sP
arent company
income
Parent com
pany financial position
Changes in parent com
pany equityN
otes to the financial statem
entsO
bjectives, policies and
processes for managing capital
Financial risks
Operational
risksN
otes P
roposed disposition of earnings
Audit
Report
Movement schedule for fair value adjustments of cash flow hedges *
Consolidated
SEK millions 2009 2008 2007
Opening balance -445 70 96
Booked into comprehensive income during the year 571 -406 77
Reversed from comprehensive income due to inefficiency:
booked against cost of goods sold 23 30 -9
Reversed from comprehensive income:
booked against cost of goods sold 2 -144 -93
booked against interest income/interest costs -45 5 -1
Closing balance 106 -445 70
Change booked in comprehensive income during the year 551 -515 -26
* Reported against comprehensive income. Prior to 2009 these cash flow hedges were reported against equity.
Accumulated translation differences *
Consolidated
SEK millions
Year Main explanation to translation differences Change Accumulated
Effect on change by hedging measures
Formation of the Group
2000 The EUR was appreciated by 6 %, which affected the EUR based acquisition loans -94 -94 -312
2001 The USD was appreciated by 10.7 % 97 3 -105
2002 The USD was depreciated by 16.7 % -190 -187 165
2003 The USD was depreciated by 17.5 % -38 -225 140
2004 The USD was depreciated by 9.0 % -103 -328 -14
2005 The USD was appreciated by 20.3 % and the EUR was appreciated by 4.8 % 264 -64 -47
2006 The USD was depreciated by 13.5 % and the EUR was depreciated by 4.0 % -269 -333 40
2007 The USD was depreciated by 5.7 % whereas the EUR was appreciated by 4.7 % 224 -109 9
2008 The USD was appreciated by 20.5 % and the EUR was appreciated by 16.2 % 850 741 -345
2009 The USD was depreciated by 7.5 % and the EUR was depreciated by 6.0 % -392 349 162
* Reported against comprehensive income. Prior to 2009 these translation differences were reported against equity.
Consolidated
com
prehensive income

68 Alfa Laval Annual Report 2009 / Financial statements
Consolidated financial position
ASSETS
SEK millions Note 2009 2008
Non-current assets
Intangible assets 17, 18
Concessions, patents, licenses, trademarks
and similar rights 2,486 1,886
Renting and similar rights 4 4
Goodwill 6,143 5,383
8,633 7,273
Property, plant and equipment 17, 19
Real estate 1,366 1,228
Machinery and other technical installations 1,384 1,227
Equipment, tools and installations 660 672
Construction in progress and advances to suppliers concerning property, plant and equipment 138 419
3,548 3,546
Other non-current assets
Other long-term securities 14, 15, 20 39 18
Pension assets 28 136 140
Deferred tax asset 16 1,367 1,218
1,542 1,376
Total non-current assets 13,723 12,195
Current assets
Inventories 21 4,485 5,972
Current receivables
Accounts receivable 14, 22 4,123 5,706
Other receivables 14, 23 1,982 2,777
Prepaid costs and accrued income 14, 24 148 164
Derivative assets 14, 15 331 591
6,584 9,238
Current deposits
Other current deposits 14, 25 302 544
Cash and bank 14, 26 1,112 1,083
Total current assets 12,483 16,837
TOTAL ASSETS 26,206 29,032
Consolidated financial position

69B
oard of D
irectors’ Report
Consolidated
cash flow
sC
onsolidated
comprehensive incom
eC
hanges in consolidated equity
Parent com
pany cash flow
sP
arent company
income
Parent com
pany financial position
Changes in parent com
pany equityN
otes to the financial statem
entsO
bjectives, policies and
processes for managing capital
Financial risks
Operational
risksN
otes P
roposed disposition of earnings
Audit
Report
Consolidated financial position, continued
EQUITY AND LIABILITIES
SEK millions Note 2009 2008
Equity
Attributable to the equity holders of the parent
Share capital 1,117 1,117
Other contributed capital 2,770 2,770
Other reserves 423 449
Retained earnings 7,803 6,042
12,113 10,378
Attributable to minority interest 13 116 115
Total equity 12,229 10,493
Non-current liabilities
Liabilities to credit institutions 30 832 2,538
Private placement 30 794 856
Provisions for pensions and similar commitments 28 920 990
Provision for deferred tax 16 1,390 1,161
Other provisions 29 439 403
Total non-current liabilities 4,375 5,948
Current liabilities
Liabilities to credit institutions 30 165 247
Advances from customers 2,019 2,444
Accounts payable 1,630 2,449
Notes payable 203 251
Current tax liabilities 929 1,692
Other liabilities 31 1,140 1,087
Other provisions 29 1,926 1,849
Accrued costs and prepaid income 32 1,303 1,363
Derivative liabilities 14, 15 287 1,209
Total current liabilities 9,602 12,591
Total liabilities 13,977 18,539
TOTAL EQUITY AND LIABILITIES 26,206 29,032
PLEDGED ASSETS AND CONTINGENT LIABILITIES
Pledged assets 33 7 8
Contingent liabilities 33 1,757 2,210
Consolidated
financial position

70 Alfa Laval Annual Report 2009 / Financial statements
Comments on the consolidated financial positionFor comments on the individual lines in the statement on financial position, reference is made to Notes 13 to 36. For comments on the operating segments, see Note 1.
Capital employedThe capital employed including goodwill and step-up values amounted to SEK 12,976 (11,144) million at the end of the year.
Return on capital employedThe return on capital employed including goodwill and step-up values amounted to 33.6 (53.8) percent during 2009.
Capital turnover rateThe capital turnover rate calculated on the average capital employed including goodwill and step-up values amounted to 2.0 (2.5) times for the year.
Return on equityThe net income for the year in relation to equity was 24.5 (42.8) percent.
SolidityThe solidity, that is the equity in relation to total assets, was 46.7 (36.1) percent at the end of the year.
Net debtThe net debt was SEK 533 (2,074) million at the end of the year.
Net debt to EBITDANet debt in relation to EBITDA was 0.1 (0.3) times at the end of December.
Debt ratioThe debt ratio, that is the net debt in relation to equity, was 0.04 (0.20) times at the end of December.

71B
oard of D
irectors’ Report
Consolidated
cash flow
sC
onsolidated
comprehensive incom
eC
onsolidated
financial positionP
arent company
cash flows
Parent com
pany incom
eP
arent company
financial positionC
hanges in parent com
pany equityN
otes to the financial statem
entsO
bjectives, policies and
processes for managing capital
Financial risks
Operational
risksN
otes P
roposed disposition of earnings
Audit
Report
Changes in consolidated equity
Attributable to: Equity holders of the parent Minority Total
Other reserves
SEK millionsShare
capital
Other contributed
capitalCash flow
hedgesTranslation differences
Deferred tax
Retained earnings Subtotal
Translation differences
Retained earnings Subtotal
As of December 31, 2006 1,117 2,770 97 -299 -27 3,055 6,713 -34 152 118 6,831
2007
Comprehensive income
Net income – – – – – 3,137 3,137 – 43 43 3,180
Other comprehensive income – – -26 211 6 191 13 – 13 204
Comprehensive income – – -26 211 6 3,137 3,328 13 43 56 3,384
Transactions with shareholders
Repurchase of shares – – – – – -1,497 -1,497 – – – -1,497
Decrease of minority in Alfa Laval
(India) Ltd – – – – – – – – -56 -56 -56
Dividends to owners of parent company – – – – – -698 -698 – – – -698
Dividends to minority owner in subsidiary – – – – – – – – -27 -27 -27
As of December 31, 2007 1,117 2,770 71 -88 -21 3,997 7,846 -21 112 91 7,937
2008
Comprehensive income
Net income – – – – – 3,774 3,774 – 33 33 3,807
Other comprehensive income – – -515 839 163 – 487 11 – 11 498
Comprehensive income – – -515 839 163 3,774 4,261 11 33 44 4,305
Transactions with shareholders
Repurchase of shares – – – – – -766 -766 – – – -766
Cancellation of repurchased shares -43 – – – – 43 – – – – –
Bonus issue of shares 43 – – – – -43 – – – – –
Dividends to owners of parent company – – – – – -963 -963 – – – -963
Dividends to minority owner in subsidiary – – – – – – – – -20 -20 -20
As of December 31, 2008 1,117 2,770 -444 751 142 6,042 10,378 -10 125 115 10,493
2009
Comprehensive income
Net income – – – – – 2,710 2,710 – 27 27 2,737
Other comprehensive income – – 551 -402 -175 – -26 10 – 10 -16
Comprehensive income – – 551 -402 -175 2,710 2,684 10 27 37 2,721
Transactions with shareholders
Cancellation of repurchased shares -19 – – – – 19 – – – – –
Bonus issue of shares 19 – – – – -19 – – – – –
Decrease of minority in Alfa Laval
(India) Ltd – – – – – – – – -65 -65 -65
Minority in acquired company – – – – – – – 35 35 35
Dividends to owners of parent company – – – – – -949 -949 – – – -949
Dividends to minority owner in subsidiary – – – – – – – – -6 -6 -6
As of December 31, 2009 1,117 2,770 107 349 -33 7,803 12,113 0 116 116 12,229
Changes in consolidated equity
Changes in
consolidated equity

72 Alfa Laval Annual Report 2009 / Financial statements
Specification of changes in number of shares and share capital
Year Event DateChange in number
of sharesTotal number of
sharesChange in share
capital *Total share
capital *
2000 Company formation March 27, 2000 10,000,000 10,000,000 0.1 0.1
New issue of shares August 24, 2000 27,496,325 37,496,325 0.3 0.4
2002 Bonus issue of shares May 3, 2002 37,496,325 74,992,650 0.4 1
Bonus issue of shares May 16, 2002 – – 749 750
New issue of shares May 16, 2002 3,712,310 78,704,960 37 787
New issue of shares May 17, 2002 32,967,033 111,671,993 330 1,117
2008 Cancellation of repurchased shares May 27, 2008 -4,323,639 107,348,354 -43
Bonus issue of shares May 27, 2008 – 107,348,354 43 1,117
Split 4:1 June 10, 2008 322,045,062 429,393,416 – 1,117
2009 Cancellation of repurchased shares July 9, 2009 -7,353,950 422,039,466 -19
Bonus issue of shares July 9, 2009 – 422,039,466 19 1,117
* SEK millions

73B
oard of D
irectors’ Report
Consolidated
cash flow
sC
onsolidated
comprehensive incom
eC
onsolidated
financial positionP
arent company
cash flows
Parent com
pany incom
eP
arent company
financial positionC
hanges in parent com
pany equityN
otes to the financial statem
entsO
bjectives, policies and
processes for managing capital
Financial risks
Operational
risksN
otes P
roposed disposition of earnings
Audit
Report
Comments on changes in consolidated equityThe articles of association of Alfa Laval AB state that the share capital should be between SEK 745,000,000 and 2,980,000,000 and that the number of shares should be between 298,000,000 and 1,192,000,000.
On March 19, 2009 when the notice to the Annual General Meeting was sent the number of repurchased shares was 7,353,950. The Annual General Meeting 2009 decided to cancel these repurchased shares. Cancellation of 7,353,950 shares means that the share capital will decrease with SEK 19,125,357. At the same time the Annual General Meeting decided to in-crease the share capital through a bonus issue of the same amount without issuing any shares. In this way the size of the share capital was restored and the com-pany did not have to obtain permission from Bolagsverket or if disputed the local court to cancel the repurchased shares.
At January 1, 2009 the share capital of SEK 1,116,719,930 was divided into 429,393,416 shares. Since then the follow-ing changes have taken effect:
The company has only issued one type of shares and all these have equal rights. There are no restrictions in law or in the articles of association in the negotiability of the shares.
The only shareholder holding more than 10 percent of the shares is Tetra Laval B.V., the Netherlands who owns 18.7 (18.4) per-cent. The increase in ownership is due to the cancellation of the shares repurchased by the company. The employees of the company do not own any shares in the company through company pension trusts.
No restrictions exist in how many votes that each shareholder can represent at a general meeting of shareholders. The com-pany has no knowledge of any agreements between shareholders that would limit the negotiability of their shares.
The articles of association stipulate that members of the Board are elected at the annual general meeting. Election or dis-charge of members of the Board is other-wise regulated by the provisions in the Swedish Companies Act and Code of Cor-porate Governance. According to the
Companies Act changes in the articles of association are decided at general meet-ings of shareholders.
The senior credit facility with the banking syndicate, the bilateral term loan with SHB and the private placement contain condi-tions that give the lenders the opportunity to terminate the loans and declare them due and payable if there is a change of control of the company through a public offering or otherwise.
The possibilities to distribute un-appro-priated profits from foreign subsidiaries are limited in certain countries due to currency regulations and other legislation.
Specification of number of shares
Number
Number of shares at January 1, 2009 429,393,416
Cancellation of re-purchased shares -7,353,950
Number of shares at December 31, 2009 422,039,466
Changes in
consolidated equity

74 Alfa Laval Annual Report 2009 / Financial statements
Parent company cash flows
SEK millions 2009 2008 2007
Cash flow from operating activities
Operating income -1 42 -12
Taxes paid -116 -509 -229
-117 -467 -241
Changes in working capital:
Increase(-)/decrease(+) of receivables -2,799 -1,716 150
Increase(+)/decrease(-) of liabilities -191 199 16
Increase(-)/decrease(+) in working capital -2,990 -1,517 166
-3,107 -1,984 -75
Cash flow from investing activities
Investment in subsidiaries – – –
– – –
Cash flow from financing activities
Financial net, paid 11 36 39
Repurchase of shares - -766 -1,497
Received dividends from subsidiaries 3,201 2,201 1,208
Paid dividends -949 -963 -698
Received group contribution 844 1,476 1,023
3,107 1,984 75
Cash flow for the period – – –
Cash and bank at the beginning of the year – – –
Cash and bank at the end of the period – – –
Parent company income *
SEK millions Note 2009 2008 2007
Administration costs -11 -13 -10
Other operating income 14 55 -
Other operating costs -4 0 -2
Operating income/loss -1 42 -12
Dividends 3,201 2,201 1,208
Group contributions ** 878 844 1,476
Interest income and similar result items 12 23 50 44
Interest expenses and similar result items 12 -22 -4 -3
Result after financial items 4,079 3,133 2,713
Appropriation to tax allocation reserve -225 -239 -378
Income tax -177 -200 -318
Net income for the year 3,677 2,694 2,017
* The statement over parent company income also constitutes its statement over comprehensive income.
** Group contributions to the parent company were 2008 and earlier reported directly to equity, but since they are the equivalent to dividends they are now reported as financial revenue in
the income statement. The comparison figures have been changed correspondingly.
Parent company cash flows and income

75B
oard of D
irectors’ Report
Consolidated
cash flow
sC
onsolidated
comprehensive incom
eC
onsolidated
financial positionC
hanges in consolidated equity
Changes in parent com
pany equityN
otes to the financial statem
entsO
bjectives, policies and
processes for managing capital
Financial risks
Operational
risksN
otes P
roposed disposition of earnings
Audit
Report
Parent company financial position
SEK millions Note 2009 2008
ASSETS
Non-current assets
Financial non-current assets
Shares in group companies 20 4,669 4,669
Current assets
Current receivables
Receivables on group companies 6,298 3,465
Current tax assets 2 248
Other receivables 4 5
6,304 3,718
Cash and bank – –
Total current assets 6,304 3,718
TOTAL ASSETS 10,973 8,387
EQUITY AND LIABILITIES
Equity
Restricted equity
Share capital 1,117 1,117
Statutory reserve 1,270 1,270
2,387 2,387
Unrestricted equity
Profit brought forward 3,644 1,899
Net income for the year 3,677 2,694
7,321 4,593
Total equity 9,708 6,980
Untaxed reserves
Tax allocation reserve, taxation 2005 81 81
Tax allocation reserve, taxation 2006 25 25
Tax allocation reserve, taxation 2007 254 254
Tax allocation reserve, taxation 2008 378 378
Tax allocation reserve, taxation 2009 239 239
Tax allocation reserve, taxation 2010 225 –
1,202 977
Current liabilities
Liabilities to group companies 55 236
Accounts payable 0 1
Current tax liabilities 8 193
Other liabilities 0 0
63 430
TOTAL EQUITY AND LIABILITIES 10,973 8,387
MEMORANDUM ITEMS
Pledged assets and contingent liabilities
PLEDGED ASSETS None None
CONTINGENT LIABILITIES (for subsidiaries)
Performance guarantees 0 1
Other contingent liabilities None 40
Parent company financial position
Parent com
pany cash flow
sP
arent company
income
Parent com
pany financial position

76 Alfa Laval Annual Report 2009 / Financial statements
Changes in parent company equity
Changes in parent company equity
SEK millions Share capital Statutory reserveUnrestricted
equity Total
As of December 31, 2006 1,117 1,270 3,806 6,193
2007
Comprehensive income
Net income – – 2,017 2,017
– – 2,017 2,017
Transactions with shareholders
Repurchase of shares – – -1,497 -1,497
Dividends – – -698 -698
As of December 31, 2007 1,117 1,270 3,628 6,015
2008
Comprehensive income
Net income – – 2,694 2,694
– – 2,694 2,694
Transactions with shareholders
Repurchase of shares – – -766 -766
Cancellation of repurchased shares -43 – 43 –
Bonus issue of shares 43 – -43 –
Dividends – – -963 -963
As of December 31, 2008 1,117 1,270 4,593 6,980
2009
Comprehensive income
Net income – – 3,677 3,677
– – 3,677 3,677
Transactions with shareholders
Cancellation of repurchased shares -19 – 19 –
Bonus issue of shares 19 – -19 –
Dividends – – -949 -949
As of December 31, 2009 1,117 1,270 7,321 9,708
The share capital of SEK 1,116,719,930 (1,116,719,930) is divided among 422,039,466 (429,393,416) shares. Group contributions to the parent company were 2008 and earlier reported directly to equity, but since they are the equivalent to divi-
dends they are now reported as financial revenue in the income statement. The comparison figures have been changed correspondingly.

77B
oard of D
irectors’ Report
Consolidated
cash flow
sC
onsolidated
comprehensive incom
eC
onsolidated
financial positionC
hanges in consolidated equity
Parent com
pany cash flow
sP
arent company
income
Parent com
pany financial position
Objectives, policies and
processes for m
anaging capitalFinancial
risksO
perational risks
Notes
Proposed disposition
of earningsA
udit R
eport
Notes to the financial statements
Accounting principles
Basis of preparationThe consolidated financial statements have been prepared on a historical cost basis, except for certain financial instruments including derivatives that are valued at fair value. The statements are presented in SEK millions, unless otherwise stated.
Statement of complianceAs from January 1, 2005 Alfa Laval applies International Financial Reporting Standards (IFRS) as adopted by the European Union. Furthermore recommendation RFR 1.2 “Supplementary accounting principles for consolidated groups” from the Council for Financial Reporting in Sweden is applied.
The accounting and valuation principles of the parent company comply with the Swedish Annual Accounts Act and the rec-ommendation RFR 2.3 “Accounting for legal entities” issued by the Council for Financial Reporting in Sweden.
Changed/implemented accounting principlesDuring 2009 the updated IAS 1 and the new IFRS 8 have been implemented. The changes in IAS 1 mean that items that previously were reported directly against equity now instead are reported in the comprehensive income statement as a part of other comprehensive income. This refers to the items in equity that are not transactions with shareholders, e.g. cash flow hedges and translation differences and deferred tax related to these. Alfa Laval has chosen to report these items as a part of one statement over comprehen-sive income instead of reporting the result down to net income for the year in one statement and the result below this down to comprehensive income in a separate statement. In addition the titles for the statements have been changed. The implementation of IFRS 8 has meant that the reporting of primary and secondary segment has been replaced by:
– a reporting of operating segments in the way the chief operating decision maker monitors the operations, which may deviate from IFRS and
– information according to IFRS for the company as a whole about products and services as well as geographical areas and information about major customers.
The change from primary segments to operating segments has not meant any major changes in the information, apart from the addition of two reconciliation items between the operating income for the operating segments and the operating income accord-ing to IFRS for the company as a whole.
During 2008 Alfa Laval has implemented IFRIC 14 “The Limit on a Defined Benefit Asset, Minimum Funding Requirements and their Interaction”. It covers the issue of how to assess the limit on the amount of surplus in a defined benefit scheme that can be rec-ognised as an asset and minimum funding requirements under IAS 19 Employee Ben-efits. IFRIC stands for International Financial Reporting Interpretations Committee, which issues interpretations on how other standards should be interpreted.
During 2007 Alfa Laval has implemented paragraph 2a in chapter 6 of the Swedish Annual Accounts Act, IAS 1 paragraphs 124 A-C and IFRS 7.
Paragraph 2a in chapter 6 of the Swedish Annual Accounts Act requires listed com-panies to disclose certain information relating to the company’s shares in the Board of Directors’ Report.
IAS 1 Presentation of Financial Statements has been expanded with paragraphs 124 A-C. These relate to new disclosure require-ments on the company’s objectives, poli-cies and processes for managing capital.
IFRS 7 Financial Instruments: Disclosures replaces large parts of IAS 32 Financial In-struments: Disclosure and Presentation. IAS 32 will in the future only contain rules concerning the presentation of financial in-struments. IFRS 7 contains expanded dis-closure requirements related to the signifi-cance of financial instruments for the company’s financial position and perform-ance and the nature and extent of risks arising from financial instruments.
The application of the new accounting standards has otherwise in effect not re-sulted in any change of accounting princi-ples and therefore not resulted in any effect on income or equity.
Critical accounting principlesIFRS 3 Business Combinations means that goodwill and intangible assets with indefinite useful life are not amortised. They are instead
tested for impairment both annually and when there is an indication. The effect of IFRS 3 can be considerable for the Group if the profitability within the Group or parts of the Group goes down in the future, since this could trigger a substantial impairment write down of the goodwill. Such a write down will affect the net income and thereby the financial position of the Group. The reported goodwill is SEK 6,143 (5,383) million at the end of the year. No intangible assets with indefinite useful life other than goodwill exist.
The Group has defined benefit plans, which are reported according to IAS 19 Employee Benefits. This means that the plan assets are valued at fair value and that the present value of the benefit obligations in the defined benefit plans is decided through yearly actuarial calculations made by independent actuaries. If the value of the plan assets start to decrease at the same time as the actuarial assumptions in-crease the benefit obligations the com-bined effect could result in a substantial deficit. The monetary magnitude comes from the fact that the deficit is the differ-ence between two large numbers. The risk for this happening is however decreased by Alfa Laval applying the 10 percent corridor approach described under “Employee benefits” below and the fact that many of these defined benefit schemes are closed for new participants and replaced by defined contribution schemes.
The Group’s reporting of provisions ac-cording to IAS 37 means that SEK 2,365 (2,252) million is reported as other provisions. This constitutes 9.0 (7.8) percent of the Group’s assets and is important for the assessment of the Group’s financial position, not the least since provisions normally are based on judgements of probability and estimates of costs and risks. If the accounting principles for provision would be changed sometime in the future, this could have a substantial impact on the Group’s financial position.
IAS 39 Financial Instruments: Recognition and Measurement has a considerable effect on the Groups comprehensive income and equity and may have a substantial effect on net income if the used derivatives turns out not to be effective.
Changes in parent com
pany equityN
otes to the financial statem
ents

78 Alfa Laval Annual Report 2009 / Financial statements
Key sources of estimation uncertaintyThe key source of estimation uncertainty is related to the impairment test of goodwill, since the testing is based on certain assumptions concerning future cash-flows, see the section on critical accounting principles above for further details.
JudgementsIn applying the accounting policies Manage - ment has made various judgements, apart from those involving estimations, that can significantly affect the amounts recognised in the financial statements. These judgements mainly relate to:
– classification of financial instruments;
– probability in connection with business risks;
– determination of percentage of completion in work in progress;
– recoverability of accounts receivable;
– obsolescence in inventory; and
– whether a lease entered into with an external lessor is a financial lease or an operational lease.
Advertising costsAdvertising costs are expensed as incurred.
AssociatesThe Group does not own shares in any material companies that fulfil the definition of an associate in IAS 28 Investments in Associates, that is where the ownership is between 20 and 50 percent.
Borrowing costsBorrowing costs are accounted for according to IAS 23 Borrowing Costs, which means that the borrowing costs are charged to the profit and loss in the period to which they relate. This means, among other things, that transaction costs that arise in connection with raising a loan are capitalised and amortised over the maturity of the loan. The capitalised amount is reported net against the raised loan.
Business combinations – consolidation principles The consolidated financial statements have been prepared according to IFRS 3 Business Combinations and IAS 27 Consolidated and Separate Financial Statements.
For the period after August 24, 2000, the consolidated financial statements include the parent company Alfa Laval AB (publ) and the subsidiaries in which it holds more than 50 percent during the period. For the period up to August 24, 2000, the consoli-dated financial statements include the parent company Alfa Laval Holding AB and the subsidiaries in which it holds more than 50 percent during the period.
The statement on consolidated financial position has been prepared in accordance
with the purchase method, which means that the book value of shares in the subsidiaries is eliminated from the reported equity in the subsidiaries at the time of their acquisition. This means that the equity in the subsidiaries at the time of acquisition is not included in the consolidated equity.
The difference between the purchase price paid and the net assets of the acquired companies is allocated to the step-up values related to each type of asset, with any re-mainder accounted for as goodwill.
At acquisitions where there is a goodwill it should be stated what the goodwill is re-lating to. Since goodwill by definition is a residual this is not always that easy. Gener-ally speaking the goodwill is usually relating to estimated synergies in procurement, lo-gistics and corporate overheads. It can also be claimed that the goodwill is relating to the acquired entity’s ability to over time recreate its intangible assets. Since the value of the intangible assets at the time of acquisition only can be calculated on the assets that exist then no value can be at-tached to the patents etc. that the activity manages to create in the future partially as a replacement for the current ones and these are therefore referred to goodwill.
Goodwill and intangible assets with in-definite useful life are not amortised. These assets are instead tested for impairment both annually and when there is an indication. The impairment test is made according to IAS 36 Impairment on assets.
Comparison distortion itemsItems that do not have any link to the normal operations of the Group or that are of a non- recurring nature are classified as comparison distortion items. In the comprehensive income statement these are reported gross as a part of the most concerned lines, but are specified separately in Note 9. A reporting together with other items in the compre-hensive income statement without this separate reporting in a note would have given a comparison distortion effect that would have made it difficult to judge the development of the ordinary operations from an outside viewer. Comparison distortion items affecting operating income are reported as a part of operating income, while compari-son distortion items affecting the result after financial items are reported as a part of the financial net.
Employee benefitsEmployee benefits are reported according to IAS 19 Employee Benefits.
The present value of the benefit obligations in the defined benefit plans is decided through yearly actuarial calculations made by inde-pendent actuaries. The plan assets are valued at fair value. The net plan asset or liability is arrived at in the following way.
+ the present value of the defined benefit obligation at December 31
+ any actuarial gains not recognised
- any actuarial losses not recognised
- any past service costs not yet recognised
- the fair value of the plan assets at December 31
= a net liability if positive / a net asset if negative
If the calculation gives a net asset, the lower of this asset and the sum of any cumulative unrecognised net actuarial losses and past service costs and the present value of refunds or reductions in future contributions is reported as the net plan asset.
If the net cumulative unrecognised actuarial gains and losses at the end of the previous year are outside a 10 percent corridor cal-culated on the greater of the present value of the defined benefit obligation or the fair value of the plan assets, then the excess is recognised over the remaining service period of the employees participating in the plan. This means that any deficits are amortised over time instead of being recognised at once.
The costs for defined contribution plans are reported in Note 6.
The Swedish ITP plan is a multi-employer plan insured by Alecta. It is a defined benefit plan, but since the plan assets and liabilities cannot be allocated on each employer it is reported as a defined contribution plan ac-cording to item 30 in IAS 19. The construc-tion of the plan does not enable Alecta to provide each employer with its share of the assets and liabilities or the information to be disclosed. The cost for the plan is re-ported together with the costs for other defined contribution plans in Note 6. Alecta reported a collective consolidation level at December 31, 2009 of 141 (112) percent. The collective consolidation level is defined as the fair value of Alecta’s plan assets in percent of the insured pension commitments calculated according to Alecta’s actuarial assumptions, which are not in accordance with IAS 19. Such a surplus can be distrib-uted among the employers or the benefici-aries, but there is no agreement concerning this that enables the company to report a receivable on Alecta.
Events after the closing dateEvents after the closing date are reported according to IAS 10 under a separate heading in the Board of Directors’ report.
Financial instrumentsDuring 2005 IAS 39 Financial Instruments: Recognition and Measurement was imple- mented. IAS 39 means that financial derivatives, bonds and non-listed external shares are adjusted to fair value. During 2007 IFRS 7 Financial Instruments: Disclosures

79B
oard of D
irectors’ Report
Consolidated
cash flow
sC
onsolidated
comprehensive incom
eC
onsolidated
financial positionC
hanges in consolidated equity
Parent com
pany cash flow
sP
arent company
income
Parent com
pany financial position
Changes in parent com
pany equityO
bjectives, policies and
processes for managing capital
Financial risks
Operational
risksN
otes P
roposed disposition of earnings
Audit
Report
was implemented. IAS 39 and IFRS 7 formally contain a considerable amount of information that should be presented. According to IFRS 7.B3 the company however should decide how much detail it provides in order not to overburden the financial statements with excessive details.
Financial assets are classified into four different portfolios:
– Financial assets at fair value through profit or loss,
– Held to maturity investments,
– Loans and receivables and
– Available for sale.
The Financial assets at fair value through profit or loss are split on:
– Designated upon initial recognition,
– Held for trading and
– Derivatives used for hedging.
Financial liabilities are classified into two portfolios:
– Financial liabilities at fair value through profit or loss and
– Loans.
The Financial liabilities at fair value through profit or loss are split on:
– Designated upon initial recognition,
– Held for trading and
– Derivatives used for hedging.
The classification into different portfolios has a direct impact on the valuation of the instruments, i.e. if the instrument is valued at fair value or amortised cost. “Loans and receivables”, “Held to maturity investments” and “Loans” are valued at amortised cost, whereas “Financial assets and Financial liabilities at fair value through profit or loss” and “Available for sale” financial assets are valued at fair value. Derivatives are always classified in the portfolios “Financial assets and Financial liabilities at fair value through profit or loss”.
The amortised cost is normally equal to the amount recognised upon initial recognition, less any principal repayments and plus or minus any effective interest adjustments.
Prepaid costs, prepaid income and ad-vances from customers are not defined as financial instruments since they will not result in future cash flows.
The fair values of bonds and non-listed external shares are arrived at using available market prices or best estimates. The fair value adjustment is equal to the difference between the booked value and the fair value. The effect of the measurement at fair value is reported above net income for bonds and non-listed external shares. The fair value adjustment of these instruments is reflected directly on the items bonds and non-listed external
shares in the statement of financial position. The fair values of the Group’s currency
forward contracts, currency options, interest-rate swaps, metal forward contracts and electricity futures are estimated based on dealer quotes, quoted market prices of comparable contracts, adjusted through interpolation where necessary for maturity differences, or if there are no relevant comparable contracts, on pricing models or formulas using current assumptions. The fair value adjustment is arrived at by comparing the conditions of the derivative entered into with the market price for the same instrument at the clos-ing date and with the same maturity date.
Group contributions to parent companyGroup contributions to the parent company were 2008 and earlier reported directly to equity, but since they are the equivalent to dividends they are now reported as financial revenue in the income statement in accordance with UFR 2 issued by the Council for Financial Reporting in Sweden. The comparison figures have been changed correspondingly.
Hedge accountingcash flow hedgesAlfa Laval has implemented documentation requirements to qualify for hedge accounting on derivative financial instruments.
The effect of the fair value adjustment of derivatives is reported as a part of other comprehensive income for the derivatives where hedge accounting is made (according to the cash flow hedging method) and above net income only when the underlying trans-action has been realised. Hedge accounting requires the derivative to be effective within an 80–125 percent range. For the part of an effective derivative that exceeds 100 percent effectiveness the fair value adjustment is reported above net income. For the deriva-tives where hedge accounting is not made the fair value valuation is reported above net income. The fair value adjustment of derivatives is reported separately from the underlying instrument as a separate item called derivative assets/derivative liabilities in the statement of financial position.
hedges of net investments in foreign operationsIn order to finance acquisitions of foreign operations loans are raised in the same currency as the net investment. The loans thereby constitute a hedge of the net investment in each currency. Exchange rate differences relating to these loans are therefore booked to other comprehensive income.
Income TaxesIncome taxes are reported in accordance with IAS 12 Income Taxes.
Current tax is the amount of income taxes payable (recoverable) in respect of the tax-
able profit (tax loss) for a period. Current tax liabilities (receivables) for the current and prior periods are measured at the amount expected to be paid to (recovered from) the tax authorities, using the tax rates (and tax laws) that have been enacted or substantively enacted by the closing date. In essence, this means that current tax is calculated according to the rules that apply in the countries where the profit was generated.
Deferred tax liabilities are the amounts of income taxes payable in future periods in respect of taxable temporary differences. Deferred tax liabilities are recognised for all taxable temporary differences, except for goodwill and certain other items.
Deferred tax assets are the amounts of income taxes recoverable in future periods in respect of: (a) deductible temporary dif-ferences; (b) the carry-forward of unused tax losses; and (c) the carry-forward of unused tax credits. Deferred tax assets are recognised for all deductible temporary differences to the extent that it is probable (>50 percent) that taxable profit will be available against which the deductible temporary difference can be utilised. Deferred tax assets are recognised for the carry-forward of unused tax losses and unused tax credits to the extent that it is probable (>50 percent) that future taxable profit will be available against which the unused tax losses and unused tax credits can be utilised.
Deferred tax assets and liabilities are measured at the tax rates that are expected to apply to the period when the asset is re-alised or the liability is settled, based on tax rates (and tax laws) that have been enacted or substantively enacted by the closing date.
If it is not any longer probable that sufficient taxable profits will be available against which a deferred tax asset can be utilised, then the deferred tax asset is reduced by increasing the valuation allowance accordingly.
InventoriesThe Group’s inventory has been accounted for after elimination of inter-company gains. The inventory has been valued according to the “First-In-First-Out” (FIFO) method at the lowest of cost or net realisable value, taking into account obsolescence.
This means that raw material and pur-chased components normally are valued at the acquisition cost, unless the market price has fallen. Work in progress is valued at the sum of direct material and direct labour costs with a mark-up for the product’s share in capital costs in the manufacturing and other indirect manufacturing costs based on a forecasted assumption on the capacity utilisation in the factory. Finished goods are normally valued at the delivery value (i.e. at cost) from the factory if the delivery is forth-coming. Spare parts that can be in the inven-tory during longer periods of time are normally
Notes to the
financial statements

80 Alfa Laval Annual Report 2009 / Financial statements
valued at net realisable value. Out of the total inventory for spare parts, the valuation at net realisable value constitutes a considerable part.
Joint venturesAlfa Laval owns 50 percent in three different joint ventures: Rolls Laval Heat Exchangers Ltd with Rolls Royce as partner, Alfdex AB with Haldex as partner and AlfaWall AB with Wallenius as partner. These companies are consolidated according to the proportional consolidation method in IAS 31 Interests in Joint Ventures.
LeasingLeasing is accounted for in accordance with IAS 17 Leases.
When Alfa Laval is the lessor, leased assets that are regarded as financial leases are accounted for as a financial receivable from the lessee in the statement on financial po-sition. The leasing fee received from the lessee is accounted for as financial income calcu-lated as interest on the outstanding receiv-able and as amortisation of the receivable.
When Alfa Laval is the lessee, leased as-sets that are regarded as financial leases are accounted for as capitalised assets and a corresponding financial payable to the lessor in the statement on financial position. The leasing fee to the lessor is accounted for as financial cost calculated as interest on the outstanding payable and as amortisation of the payable. Depreciation according to plan is done in the same manner as pur-chased assets.
Leased assets regarded as operational leases are not capitalised. The leasing fees are expensed as incurred.
Long-term construction projectsRevenue for projects is recognised using the percentage of completion method in IAS 11 Construction Contracts. This means that when the outcome of a construction project can be calculated reliably, the revenue and the costs related to the project are recognised in relation of the percentage of completion at the closing date. An estimated loss is recognised immediately. The percent-age of completion for a construction project is normally established through the relation-ship between incurred project costs for work performed at the closing date and the estimated total project costs.
Disclosures shall be made for:
– the amount of recognised project sales revenue,
– the aggregated amount of costs incurred and recognised profits less recognised losses,
– retentions,
– the gross amount due from customers for work in progress,
– advances and
– the gross amount due to customers for work in progress.
The amount of recognised project sales revenue is the amount recognised in the comprehensive income statement as a reflection of the percentage of completion of the projects. It has nothing to do with the volume of progress billing in the period. This figure shows how much of the net invoicing of the Group that originates from project sales.
The aggregated amount of costs incurred and recognised profits less recognised losses shows the total volume of work performed on ongoing projects at the closing date. It has nothing to do with the recognised costs in the comprehensive income statement.
Retentions are amounts of progress billing that are not paid according to the contract until conditions specified in the contract have been satisfied or until defects have been rectified. This has a negative effect on the profitability of the project. Progress billing is amounts billed for work performed on a project whether or not they have been paid by the customer.
The gross amount due from customers for work in progress on plant projects is the net amount of:
1. + costs incurred 2. + recognised profits 3. - recognised losses 4. - progress billing
for each project in progress where the net of the first three items is higher than item 4. The figure shows how much progress billing is lacking behind the work performed.
Advances are amounts received from the customer before the related work is performed and are usually very important for the overall profitability of the project.
The gross amount due to customers for work in progress on plant projects is the net amount of:
1. + costs incurred 2. + recognised profits3. - recognised losses4. - progress billing
for each project in progress where the net of the first three items is smaller than item 4. The figure shows how much progress billing is ahead of the work performed.
Non-current assets (tangible and intangible)Assets have been accounted for at cost, net after deduction of accumulated depreciation according to plan. Depreciation according to plan is based on the assets’ acquisition values and is calculated according to the estimated useful life of the assets.
The following depreciation and amorti-sation periods have been used:
Tangible:
Computer programs, computers 3.3 years
Office equipment 4 years
Vehicles 5 years
Machinery and equipment 7-14 years
Land improvements 20 years
Buildings 25-33 years
Intangible:
Patents and trademarks 10-20 years
Step-up values, technology 7.5 years
Goodwill, strategic 20 years*
Goodwill, other 10 years*
* Not amortised after January 1, 2004
Any additions to the purchase price in connection with investments in non-current assets or acquisitions of businesses are amortised over the same period as the original purchase price. This means that the time when the asset is fully depreciated is identical regardless of when payments are made. This is a reflection of the fact that the estimated useful life of the asset is the same.
Upon sale or scrapping of assets, the results are calculated in relation to the net book value after depreciation according to plan. The result on sales is included in op-erating income.
impairment of assetsWhen there are indications that the value of a tangible asset or an intangible asset with a definite useful life has decreased, there is a valuation made if it must be written down according to IAS 36 Impairment of Assets. If the reported value is higher than the net realisable value, a write down is made that burdens net income. When assets are up for sale, for instance items of real estate, a clear indication of the net realisable value is received that can trigger a write down.
Goodwill and intangible assets with in-definite useful life are not amortised. These assets are instead tested for impairment both annually and when there is an indication. The impairment test is made according to IAS 36 Impairment on assets.
For the impairment testing of goodwill, two of Alfa Laval’s operating segments, the two divisions “Equipment” and “Process Technology” have been identified as the cash-generating units within Alfa Laval. Technically a recently acquired business activity could be followed independently during an initial period, but acquired businesses tend to be integrated into the divisions at a fast rate. This means that the independent traceability is lost fairly soon and then any independent measurement and testing becomes im-practicable. The net present value is based

81B
oard of D
irectors’ Report
Consolidated
cash flow
sC
onsolidated
comprehensive incom
eC
onsolidated
financial positionC
hanges in consolidated equity
Parent com
pany cash flow
sP
arent company
income
Parent com
pany financial position
Changes in parent com
pany equityO
bjectives, policies and
processes for managing capital
Financial risks
Operational
risksN
otes P
roposed disposition of earnings
Audit
Report
on the projected EBITDA figures for the next twenty years, less projected investments and changes in operating capital during the same period. The used discount rate is the pre-tax weighted average cost of capital (WACC). The growth rate for the divisions during the period is the perceived expected average industry growth rate. No terminal value has been calculated since this would render a very large and uncertain value, which could give an erroneous impression that no impairment exists.
Non-current Assets Held for Sale and Discontinued OperationsThe Group is applying IFRS 5 Non-current Assets Held for Sale and Discontinued Operations. IFRS 5 specifies the accounting for assets held for sale and the disclosures to be made for discontinued operations.
Assets held for sale are to be measured at the lower of the carrying amount and fair value, less sales costs. No depreciation of such assets is made. An asset held for sale is an asset whose carrying amount will be recovered basically through a sale rather than through continuing use. It must be available for immediate sale in its current condition. The sale must be highly probable, that is a decision must have been made and an active sales effort must have been initiated. The sale must be expected to be finalised within one year. Non-current assets are reclassified to current assets and presented separately in the statement on financial position.
Other operating income and other operating costsOther operating income relates to for instance commission, royalty and license income. Other operating costs refer mainly to restructuring costs and to royalty costs.
Comparison distortion items that affect the operating income are reported in other operating income and other operating costs.
ProvisionsThe Group is applying IAS 37 Provisions, Contingent Liabilities and Contingent Assets for the reporting of provisions, contingent liabilities and contingent assets.
A provision is recognised when and only when:
– there is a present legal or constructive obligation as a result of past events;
– it is probable that a cost will be incurred in settling the obligation; and
– a reliable estimate can be made of the amount of the obligation.
The amount recognised as a provision is the best estimate of the cost required to settle the present obligation at the closing date.
In measuring the provision:
– risks and uncertainties are taken into account;
– the provisions are discounted, where the effect of the time value of money is material. When discounting is used, the increase of the provision over time is recognised as an interest cost;
– future events, such as changes in law and technology, are taken into account where there is sufficient objective evidence that they will occur; and
– gains from the expected disposal of assets are not taken into account, even if the expected disposal is closely linked to the event giving rise to the provision.
If a reimbursement of some or all of the costs to settle a provision is expected (e.g. through insurance contracts, indemnity clauses or supplier’s warranties), the reimbursement is recognised:
– when and only when, it is virtually certain that the reimbursement will be received if the obligation is settled. The amount recognised for the reimbursement must not exceed the amount of the provision; and
– as a separate asset (gross). In the com- prehensive income statement, however, the income related to the reimbursement is netted against the cost for the provision.
Provisions are reviewed at each closing date and adjusted to reflect the current best estimate. If it is no longer probable that a payment to settle the obligation will be incurred, the provision is reversed.
A provision must only be used for the purpose it was originally recognised for. Provisions are not recognised for future operating losses. An expectation of future operating losses is though an indication that certain assets of the operation may be impaired. If a contract is onerous, the present obligation under the contract is recognised and measured as a provision.
A provision for restructuring costs is rec-ognised only when the general recognition criteria are met. A constructive obligation to restructure arises only when there is:
– a detailed formal plan for the restructuring, identifying at least:
a) the business or part of a business concerned;
b) the principal locations affected;
c) the location, function and approximate number of employees who will be com-pensated for terminating their services;
d) the costs that will be undertaken; and
e) when the plan will be implemented; and
– a valid expectation in those affected that the restructuring will be carried out.
A management or board decision to restructure does not give rise to a constructive obligation at the closing date unless the company has, before the closing date:
– started to implement the restructuring plan ; or
– communicated the restructuring plan to those affected by it in a sufficiently specific manner to raise a valid expectation in them that the restructuring will happen.
When a restructuring involves the sale of an operation, no obligation arises for the sale until the company is committed to the sale, i.e. through a binding sales agreement.
A restructuring provision only includes the direct costs arising from the restructuring, which are those that are both:
– necessarily entailed by the restructuring; and
– not associated with the ongoing activities of the company.
Research and developmentResearch costs are charged to the result in the year in which they are incurred. Develop- ment costs are charged to the result in the year in which they are incurred provided that they do not fulfil the conditions for instead being capitalised according to IAS 38 Intangible Assets.
Revenue recognitionRevenue recognition is made according to IAS 18 Revenue. Revenue from sale of goods is recognised when all of the following conditions have been fulfilled:
– the seller has transferred the significant risks and rewards of ownership of the goods to the buyer;
– the seller retains neither continuing managerial involvement to the degree usually associated with ownership nor effective control over the goods sold;
– the amount of revenue can be measured reliably;
– it is probable that the seller will get paid; and
– the costs incurred or to be incurred related to the transaction can be measured reliably.
The revenue recognition is usually governed by the delivery terms used in the sale. Net sales are referring to sales value less sales taxes, cancellations and discounts. Long-term construction projects are accounted for through the percentage of completion method, see above under “Long-term construction projects”.
To the extent that Alfa Laval also delivers services the three last conditions apply to-gether with:
– the stage of completion at the closing date can be measured reliably.
Notes to the
financial statements

82 Alfa Laval Annual Report 2009 / Financial statements
Sick leave in SwedenThe Swedish Annual Accounts Act requires the sick leave among Swedish employees to be reported split on different specifically defined categories. This is a way to get focus on the contemporary problem of high sick leave rates and if certain employers are having a high or a low sick rate within the company. The specification is found in Note 5.
Transactions in foreign currenciesReceivables and liabilities denominated in foreign currencies have been valued at year-end rates of exchange.
Within the Group, exchange gains and losses on loans denominated in foreign currencies that finance acquisitions of for-eign subsidiaries are transferred to other comprehensive income as foreign currency translation adjustments if the loans act as a hedge to the acquired net assets. There they offset the translation adjustments resulting from the consolidation of the foreign subsidiaries. In the parent company, these exchange differences are reported above net income.
IAS 21 The Effects of Changes in Foreign Exchange Rates covers among other things the existence of functional currencies. Almost all of Alfa Laval’s subsidiaries are affected by changes in foreign exchange rates for their procurement within the Group. They do however usually sell in their local currency and they have more or less all of their non-product related costs and their personnel related costs in their local currency. This means that none of Alfa Laval’s subsidiaries qualify for the use of another functional currency than the local currency, with the following exception. Subsidiaries in highly inflationary countries report their closings in the functional hard currency that is valid in each country, which in all cases is USD. During 2009 Turkey and Venezuela are re-garded as highly inflationary countries.
In the consolidation, the foreign subsidi-aries have been translated using the current method. This means that assets and liabilities are translated at closing exchange rates and income and expenses are translated at the year’s average exchange rate. The translation difference that arises is a result of the fact that net assets in foreign com-panies are translated at one rate at the be-ginning of the year and another at year-end and that the result is translated at average rate. The translation differences are part of other comprehensive income.
Recently issued accounting pronouncementsInternational Accounting Standards Board (IASB) has issued the following new or revised accounting pronouncements, which may be applicable on Alfa Laval and are effective for fiscal years beginning on or after January 1, 2010.
IFRS 3 Business Combinations and IAS 27 Consolidated and Separate Financial Statements have been revised in order to better converge with the rules in US GAAP. The revised version of IFRS 3 and IAS 27 becomes effective for financial years beginning on or after July 1, 2009, which means 2010 for Alfa Laval. The following changes have been made:
– Transaction costs must be reported in the comprehensive income statement instead of as until now be added to the acquisition value, which affects the reported goodwill.
– If the value of an additional purchase price is changed the difference must be reported in the comprehensive income statement instead of as until now adjust the acquisition price, which affects the reported goodwill.
– In business combinations achieved in stages the goodwill must be calculated and valued when the acquirer obtains control over a business. If the acquirer previously has reported an equity interest in the company the accumulated change in value of the holding is to be recognised in the comprehensive income statement at the acquisition date. Until now the goodwill has been calculated and reported at each acquisition date.
– The minority interest can be measured at fair value. This does not exclude that the minority interest still can be measured based on the acquired company’s net assets.
– Changes in holdings in subsidiaries, where the majority owner does not loose its decisive influence, must be reported in equity. This has until now been an unregulated area. This means that these transactions no longer will generate goodwill or lead to any gains or losses.
– If the minority’s share of reported losses is higher than its reported share of the equity, a negative minority share should be reported instead of as until now be charged to the equity attributable to the equity holders of the parent company.
IFRS 9 Financial Instruments: Recognition and Measurement is the first step of a complete revision of the current standard IAS 39. The standard means a reduction of the number of valuation categories for financial assets and contains the main categories reported at cost (amortised cost) and fair value through profit or loss. This first part of the standard will be complimented by rules on impairments, hedge accounting and valuation of liabilities. IFRS 9 becomes effective for financial years beginning on or after January 1, 2013.
In April 2009 IASB issued its second collection of amendments to the current
standards, basically in order to remove in-consistencies and clarify wording. There are separate transition provisions for each amendment, but usually these become ef-fective for financial years beginning on or after January 1, 2010.
International Accounting Standards Board (IASB) has issued the following financial re-porting interpretations developed by the In-ternational Financial Reporting Interpretations Committee (IFRIC), which may be applicable on Alfa Laval and are effective for fiscal years beginning on or after January 1, 2010.
IFRIC 12 Service Concession Arrangements relates to transactions where a private sector entity erects or acquires and maintains/op-erates an asset for a public sector entity. The counterpart, that could be a local community, owns the asset or takes over the asset at the end of the term. IFRIC 12 becomes effective for financial years begin-ning on or after January 1, 2010.
Alfa Laval will evaluate the effects of the application of the new or revised accounting standards or interpretations before each time of application.

83B
oard of D
irectors’ Report
Consolidated
cash flow
sC
onsolidated
comprehensive incom
eC
onsolidated
financial positionC
hanges in consolidated equity
Parent com
pany cash flow
sP
arent company
income
Parent com
pany financial position
Changes in parent com
pany equityN
otes to the financial statem
entsFinancial
risksO
perational risks
Notes
Proposed disposition
of earningsA
udit R
eport N
otes to the financial statem
ents
Objectives, policies and processes for managing capital
Alfa Laval defines its managed capital as the sum of consolidated net debt and equity including minority interests. At the end of 2009 the managed capital was SEK 12,762 (12,567) million.
The Group’s objective when managing capital is to safeguard the Group’s ability to continue as a going concern and provide an adequate return for shareholders and benefits for other stakeholders.
When managing the capital the Group monitors several measures including:
Measures
GoalTarget
standardTarget not set
Outcome Average over last
2009 2008 3 years 5 years 8 years
Invoicing growth per year * >= 5% -6.5% 12.1% 10.5% 14.8% 8.1%
Adjusted EBITA margin * 15% 17.6% 22.1% 19.9% 17.1% 15.1%
Return on capital employed >= 25% 33.6% 53.8% 47.2% 40.0% 33.2%
Debt ratio < 0.75 0.04 0.20 0.18 0.22 0.34
Cash flow from operating activities including investments in fixed assets ** 10% 18.8% 11.9% 13.9% 12.2% 10.9%
Investments ** 2.5% 1.7% 2.7% 2.2% 2.1% 2.1%
Return on equity X 24.5% 42.8% 37.1% 30.5% 23.1%
Solidity X 46.7% 36.1% 39.0% 37.9% 36.2%
Net debt to EBITDA X 0.1 0.3 0.3 0.5 0.8
Interest coverage ratio X 15.2 26.2 21.7 17.3 12.7
Credit rating X BBB+ BBB+
* average over a business cycle ** in % of sales
These measures are connected to each other as communicating vessels. This means that if actions are taken that primarily aim at a certain measure they will also have an impact on other measures to a varying degree. It is therefore important to consider the whole picture.
During 2009 the target for debt ratio has been reduced from less than 1 to less than 0.75. In the longer term the debt ratio should be less than 0.75. As a result of major ac-quisitions the ratio may temporarily exceed 1, but the ratio is then expected to soon de-crease beneath 0.75 due to positive cash flows and results from the acquired activity.
During 2009 the target for cash flow from operating activities has been reduced from 14 percent to 10 percent to reflect that the cash flow from operating activities is charged with tax.
In order to maintain a good capital structure the Group may for instance raise new loans or amortise on existing loans, adjust the
amount of dividends paid to shareholders, return capital to shareholders, repurchase own shares, issue new shares or sell assets.
In order to secure access to external fi-nancing at a reasonable cost having a com- petitive credit rating is important. Alfa Laval’s rating has been issued by Standard & Poors. A sound and efficient capital structure and a good earnings potential give a good credit rating. An efficient capital structure is char-acterised by a competitive weighted cost of capital, which makes it possible to fulfil the operating or strategic needs at a rea-sonable cost.
As examples on the Group’s active work with managing its capital the following can be mentioned:
– the senior credit facility with a banking syndicate from 2005 and the private placement in the US and the bilateral term loan with SHB that both happened in 2006.
– the repurchases of shares made during 2007 and 2008 and the proposal for a new mandate to repurchase shares during 2010.
– the finance contract that Alfa Laval entered into on September 15, 2009 with the European Investment Bank that gives Alfa Laval the option during the following 18 months to call for a loan of up to EUR 130 million corresponding to SEK 1,344 million. The loan then matures after 7 years.
The repurchases of shares should be viewed in light of that the consolidated cash flows from operations are large enough to finance the build up of working capital and the acquisitions of businesses that have been made as well as the dividend to the shareholders.
Objectives, policies and
processes for m
anaging capital

84 Alfa Laval Annual Report 2009 / Financial statements
Financial risks
Financial instrumentsFinancial risks are referring to financial instruments. Alfa Laval has the following instruments: cash and bank, deposits, trade receivables, bank loans, trade payables and a limited number of derivative instruments to hedge primarily currency rates or interests, but also the price of metals and electricity. These include currency forward contracts, currency options, interest-rate swaps, metal forward contracts and electricity futures. See Notes 14 and 15 for more information on these financial instruments.
Financial policyIn order to control and limit the financial risks, the Board of the Group has established a financial policy. The Group has an aversive attitude toward financial risks. This is expressed in the policy. It establishes the distribution of responsibility between the local companies and the central finance function in Alfa Laval Treasury International, what financial risks the Group can accept and how the risks should be limited.
Price riskThere are three different types of price risks: currency risk, interest risk and market risk. See below.
Currency riskDue to the Alfa Laval Group’s international business activities and geographical spread the Group is exposed to currency risks. The exchange rate movements in the major currencies for the Group during the last years are presented below (SEK/foreign currency):
4
6
8
10
12
14
Exchange rate fluctuations
1.00
1.25
1.50
0.00
0.05
0.10
JAN 07
JUN 07
DEC 07
JUN 08
DEC 08
JUN 09
DEC 09
GBP EUR USD DKK NOK
JAN 07
JUN 07
DEC 07
JUN 08
DEC 08
JUN 09
DEC 09
KRW JPY
JAN 07
JUN 07
DEC 07
JUN 08
DEC 08
JUN 09
DEC 09
Currency risk is divided into transaction exposure that relates to exchange rate fluctuations that affects the currency flows that arise due to the business activities and translation exposure that relates to the translation of the subsidiaries’ statements on financial position from local currency to SEK.
transaction exposureDuring 2009 Alfa Laval’s sales to countries outside Sweden amounted to 96.8 (96.5) (96.0) percent of total sales.
Alfa Laval’s local sales companies normally sell in domestic currency to local end cus-tomers and have their local cost base in local currency. Exports from production and lo-gistical centres to other Group companies are invoiced in the exporting companies’ domestic currencies, except for Sweden, Denmark and UK where the exports are denominated in EUR.
The Group is principally exposed to cur-rency risk from potential changes in con-tracted and projected flows of payments and receipts. The objective of foreign ex-change risk management is to reduce the impact of foreign exchange movements on the Group’s income and financial position.
The Group normally has natural risk cov-erage through sales as well as costs in local currencies. The financial policy states that the local companies are responsible for identifying and hedging exchange rate ex-posures on all commercial flows via Alfa Laval Treasury International. Contract based exposures must be fully hedged. In addition, the balance of projected flows the next 12 months must be hedged to at least 50 percent. The remaining part of the projected flows can be partially hedged after conferring with the Group’s central finance function. Alfa Laval Treasury International can add to or reduce the total hedging initiated by the
local companies in the currencies that Alfa Laval has commercial exposure up to but not exceeding 100 percent of one year’s commercial exposure for each currency.
The Group’s net transaction exposure in different currencies before and after derivatives during 2009 has amounted to:
-3,500
-3,000
-2,500
-2,000
-1,500
-1,000
-500
0
500
1,000
1,500
2,000
2,500
3,000
SEKDKKJPYNOKCADEURUSD
Net transaction exposure per currency during 2009
Before derivatives After derivatives
SEK millions
This is a reflection of the fact that a substantial part of the production within the Group is located in Sweden and Denmark with costs denominated in local currencies.
Currency contracts for projected flows are entered into continuously during the year with 12 months maximum duration. For contract based exposures the derivatives follow the duration of the underlying contract. This means that the company experiences the effects from the market currency rate movements with a varying degree of delay.

85B
oard of D
irectors’ Report
Consolidated
cash flow
sC
onsolidated
comprehensive incom
eC
onsolidated
financial positionC
hanges in consolidated equity
Parent com
pany cash flow
sP
arent company
income
Parent com
pany financial position
Changes in parent com
pany equityN
otes to the financial statem
entsO
perational risks
Notes
Proposed disposition
of earningsA
udit R
eport Financial
risksO
bjectives, policies and
processes for managing capital
If the currency rates between SEK and the most important foreign currencies are changed by ±10% it has the following effect on operating income, if no hedging measures are taken:
Effect on operating income by exchange rate fluctuations excluding hedging measures
Consolidated
SEK millions 2009 2008 2007Exchange rate change against SEK + 10% - 10% + 10% - 10% + 10% - 10%USD 283 -283 443 -443 274 -274EUR 118 -118 163 -163 87 -87CAD 32 -32 42 -42 24 -24NOK 27 -27 33 -33 20 -20DKK -105 105 -128 128 -79 79JPY -59 59 -119 119 -60 60Other 45 -45 45 -45 42 -42Total 341 -341 479 -479 308 -308
Outstanding currency forward contracts and currency options for the Group amounted to the following at the end of the year:
Outstanding currency forward contracts and currency options
Consolidated
Millions 2009 2008 2007
Original
currency SEKOriginal
currency SEKOriginal
currency SEKOutflows: EUR -326 -3,365 -360 -3,965 -242 -2,294USD -480 -3,465 -740 -5,775 -656 -4,250KRW -101,412 -626 – – – –CAD -7 -47 -32 -205 -29 -194BRL -10 -42 – – – –DKK – – -93 -137 -398 -505NOK – – – – -12 -14GBP – – -2 -23 -3 -41
Other -61 -115 -82
Total -7,606 -10,220 -7,380Inflows: SEK 7,074 7,074 8,689 8,689 5,937 5,937JPY 3,670 288 11,493 995 18,415 1,056DKK 86 120 – – – –NOK 78 97 70 77 – –GBP 5 55 – – – –SGD 9 48 7 35 18 80INR – – 1,153 186 – –Other 29 19 106
Total 7,711 10,001 7,179
translation exposureWhen the subsidiaries’ statements of financial position in local currency are translated into SEK a translation difference arises that is due to the current year being translated at a different closing rate than last year and that the income statement is translated at the average rate during the year whereas the statement of financial position is translated at the closing rate at December 31.
The translation differences are reported against other comprehensive income. The translation exposure consists of the risk that the translation difference represents in terms of impact on comprehensive income. The risk is largest for the currencies where the Group has the largest net assets and where the exchange rate movements against SEK are largest. The Group’s net assets or liabilities for the major currencies are distributed as follows:
The translation differences are a central responsibility and are managed by distributing the loans on different currencies based on the net assets in each currency and through currency forward contracts. Loans taken in the same currency as there are net assets in the Group, decrease these net assets and thereby decrease the translation exposure.
These hedges of net investments in foreign operations work in the following way. Ex-change gains and losses on loans denomi-nated in foreign currencies that finance ac-quisitions of foreign subsidiaries are reported as a part of other comprehensive income if the loans act as a hedge to the acquired net assets. In other comprehensive income they offset the translation adjustments resulting from the consolidation of the foreign sub-sidiaries. In the Group, net exchange differ-ences of SEK 220 (-468) (13) million relating to debts in foreign currencies have been charged to other comprehensive income as hedges of net investments in foreign oper-ations. The loans that hedge net investments in foreign operations are denominated in EUR and USD since these foreign currencies have the largest impact on the statement of finan-cial position. Since the Group uses part of its cash flows to amortise the loans in order to improve the financial net, the extent of this hedge tends to decrease over time.
-1,000
0
1,000
2,000
3,000
4,000
5,000
Net assets and liabilities by currency
Net assets
Net liabilities
SEK millions
SE
K
EU
R
INR
JPY
DK
K
CN
Y
GB
P
KR
W
BR
L
NO
K
HK
D
CA
D
Oth
er
US
D

86 Alfa Laval Annual Report 2009 / Financial statements
Interest riskBy interest risk is meant how changes in the interest level affect the financial net of the Group and how the value of financial instruments vary due to changes in market interest rates. The Group attempts to manage interest-rate risk by matching fixed interest periods of financial assets and liabilities and through the use of derivative financial instruments such as interest-rate swaps.
The financial policy states that the inter-est rate risk and duration are measured by each main currency. The minimum interest duration for the loans should be 10 months and the maximum interest duration should be 24 months according to the policy.
The senior credit facility and the bilateral term loan accrue interest at floating rate. The proportion of these loans that the Group has chosen to hedge to fixed interest rate is presented in the graph below. The duration of the hedge is 19.2 months.
Calculated on an overall increase of market rates by 100 basis points (1 percentage unit), the interest net of the Group would change according to the bar chart below.
The reason for the positive effect in 2009 and 2008 is the size of cash, bank and current deposits relative to the un-hedged part of total debt.
In total this means that the Group has a comparably low interest risk.
Market riskMarket risk is defined as the risk for changes in the value of a financial instrument due to changed market prices. This applies only to financial instruments that are listed or otherwise traded, which for Alfa Laval concern bonds and other securities and other long- term securities totalling SEK 249 (96) million. The market risk for these is perceived as low.
Cash flow riskCash flow risk is defined as the risk that the size of future cash flows linked to financial instruments is fluctuating. This risk is mostly linked to changed interest and currency rates. To the extent that this is perceived as a problem, different derivative instruments are used to fix rates. See description of exposure and hedging measures under interest risk.
Counterpart risksFinancial instruments that potentially subject the Group to significant concentrations of credit risk consist principally of cash, deposits and derivatives.
The Group maintains cash and bank and short and long-term investments with various financial institutions approved by the Group. These financial institutions are located in major countries throughout the world and the Group’s policy is designed to limit exposures to any one institution. The risk for a counterpart not fulfilling its commitments is limited through the selection of financially solid counterparts and by lim-iting the engagement per counterpart. The Group performs periodic evaluations of the relative credit standing of those financial in-stitutions that are considered in its invest-ment strategy. The Group does not require collateral on these financial instruments.
The Group is exposed to credit risk in the event of non-performance by counterparts to derivative instruments. The Group limits this exposure by diversifying among coun-terparts with high credit ratings and by lim-iting the volume of transactions with each counter party.
In total it is the Group’s opinion that the counterpart risks are limited and that there is no concentration of risk in these financial instruments.
Interest sensitivity analysis versus hedging % of floating rates
SEK millions %
-12-10-8-6-4-2024
090807
Effect on interest costs/income at 1% increase in market rates
Hedging % of floating rates
-12
1
4
01020304050607080
SHB Bi-lateralUS Private Placement
European Investment Bank
201720162015201420132012201120100
1,000
2,000
3,000
4,000
5,000
6,000
7,000
8,000
Local facilities
Maturity structure of Group funding
Non-committed, Utilised Committed Committed & Utilised
Senior facility
SEK millions
Maturityyear
For other financial instruments, the price risk only consists of currency risk and interest risk.
Liquidity risk and refinancing riskLiquidity risk is defined as the risk that the Group would incur increased costs due to lack of liquid funds.
Refinancing risk is defined as the risk that the refinancing of maturing loans becomes difficult or costly. The loans of the Group are mainly long term and only mature when the agreed loan period expires. This means that the Group during the foreseeable future does not need to refinance maturing loans. Since the maturity of the loans is distributed over time the refinancing risk is reduced.
In 2006 Alfa Laval made a private place-ment in the US. The offer was over-subscribed and was closed at USD 110 million with a maturity of 10 years. The loan was raised on April 27, 2006.
In connection with the acquisition of Tranter Alfa Laval signed a bilateral term loan with SHB of EUR 25 million, corresponding to SEK 258 million. The loan matures in December 2013.
Alfa Laval has a senior credit facility with a banking syndicate of EUR 268 million and USD 348 million, corresponding to SEK 5,275 million. At December 31, 2009, SEK 475 million of the facility were utilised. The facility matures in April 2012.
On September 15, 2009 Alfa Laval entered into a finance contract with the European Investment Bank that gives Alfa Laval the option during the following 18 months to call for a loan of up to EUR 130 million cor-responding to SEK 1,344 million. The loan then matures after 7 years. When the loan is raised Alfa Laval can choose either floating or fixed interest rate.
In summary the maturity structure of the loans and the loan facilities is:

87B
oard of D
irectors’ Report
Consolidated
cash flow
sC
onsolidated
comprehensive incom
eC
onsolidated
financial positionC
hanges in consolidated equity
Parent com
pany cash flow
sP
arent company
income
Parent com
pany financial position
Changes in parent com
pany equityN
otes to the financial statem
entsO
bjectives, policies and
processes for managing capital
Financial risks
Operational
risksN
otes P
roposed disposition of earnings
Audit
Report
Financial risks
Operational risks
Costs for bad debts /overdues in % of accounts receivable
SEK millions %
0
20
40
60
80
100
120
0908070
2
4
6
8
10
12
Costs for bad debts in SEK millions
< 30 days
> 30 days but < 90 days
> 90 days
86
117108
Claim costs in SEK millions and in % of sales
SEK millions %
0100200300400500600700
0908070.00.51.01.52.02.53.03.5
Costs for bad claims & warranty in SEK millions
Claims & warranty in % of net sales
657
566
385
Risk for bad debtsThe risk for bad debts is referring to the risk that the customer cannot pay for delivered goods due to financial difficulties. The Group sells to a large number of customers in countries all over the world. That some of these customers from time to time face payment problems or go bankrupt is unfortunately part of reality in an operation of Alfa Laval’s magnitude. All customers except Tetra Laval represent less than 1 percent of net sales and thereby represent a limited risk. Alfa Laval regularly collects credit information on new customers and, if needed, on old customers. Earlier payment habits have an impact on the acceptance of new orders. On markets with political or financial risks, the Group strives to attain credit insurance solutions. Accounts receivable constitutes the single largest financial asset according to Note 14. With reference to the above description it is management’s opinion that there is no material concentration of risk in this financial asset.
The amount of accounts receivable being overdue is an indication of the risk the com-pany runs for ending up in a bad debt situation.
The Group’s costs for bad debts and the overdues in percent of accounts receivable are presented in the following graph.
Risk for claimsThe risk for claims refers to the costs Alfa Laval would incur to rectify faults in products or systems and possible costs for penalties. Alfa Laval strives to minimize these costs through an ISO certified quality assurance. The major risks for claim costs appear in connection with new technical solutions and new applications. The risks are limited through extensive tests at the manufacturing site and at the customer site. The Group’s net claim costs and their relation to net sales are found in the following graph.
Risk connected to technical developmentThis risk refers to the risk that some com- petitor develops a new technical solution that makes Alfa Laval’s products technically obsolete and therefore difficult to sell. Alfa Laval addresses this risk by a deliberate investment in research and development aiming at being in the absolute frontline of technical development.
Economic riskcompetitionThe Group operates in competitive markets. In order to address this competition the Group has for instance:
– organized the operations into divisions based on customer segments in order to get a customer focused market penetration,
– a strategy for acquisition of businesses in order to for instance reinforce the presence on certain markets or widen the Group’s product offering,
– worked with creating a competitive cost level based on its international presence and
– worked with securing the availability of strategic metals and components in order to maintain the ability to deliver.
Business climateIn an overall economic downturn the Group tends to be affected with a delay of 6 to 12 months depending on customer segment. The same applies with an economic upturn. The fact that the Group is operating on a large number of geographical markets and within a wide range of customer segments means a diversification that limits the effects of fluctuations in the business climate. Historically, fluctuations in the business climate have not generated decreases in orders received by more than 10 percent. The current downturn in the business climate has however meant a considerably larger decline in order intake. This is partly due to the fact that the decline happened abruptly from a very high level of demand that was the culmination of a long-lasting boom and that the price level in connection with this peak was inflated by substantial increases in raw material prices.
prices of raw materialThe Group depends on deliveries of stainless steel, carbon steel, copper and titanium etc for the manufacture of products. The prices in some of these markets are volatile and the supply of titanium has occasionally been limited. There are a limited number of possible suppliers of titanium. The risk for severely increased prices or limited supply constitutes serious risks for the operations. The possibilities to pass on higher input prices to an end customer vary from time to time and between different markets depending on the competition. The Group is addressing this risk by securing long-term supply commitments and through fixed prices from the suppliers during six to twelve months. During periods of large price increases the customer price on titanium products has been linked to Alfa Laval’s procurement costs for titanium. In the period 2006 to 2009 the Group has experienced large price fluctuations for many raw materials, but in particular for stainless steel, carbon steel, copper and titanium.
Operational
risks

88 Alfa Laval Annual Report 2009 / Financial statements
Nickel
USD/ton
05,000
10,00015,00020,00025,00030,00035,00040,00045,00050,00055,000
03 04 05 06 07 08 09
Copper
USD/ton
0
1,500
3,000
4,500
6,000
7,500
9,000
03 04 05 06 07 08 09
Aluminium
USD/ton
0
500
1,000
1,500
2,000
2,500
3,000
3,500
03 04 05 06 07 08 09
Sensitivity analysis and metal price hedging
SEK millions %
0306090
120150180210
AluminiumCopperNickel010203040506070
Costs increase if current metal prices increase by 100%, without hedging
Costs increase if current metal prices increase by 100%, with hedging
Hedging 2009
Hedging 2010
The price volatility for the most important metals is presented below:
The Group uses metal futures to secure the price on strategic metals. The graph below shows how much of the purchases of nickel, copper and aluminium that have been hedged during 2009 and how much of the expected purchases during 2010 that were hedged at the end of 2009. The graph also presents to what extent the Group’s costs for these purchases would be affected if the prices would double from the current levels.
Environmental risksThis risk relates to the costs that the Group may incur to reduce emissions according to new or stricter environmental legislation, to restore land at previously or currently owned industrial sites, to arrange more effective waist disposal, to obtain prolonged or new concessions etc. The Group has an ambition to be well within the boundaries that local legislation sets, which should reduce the risks. The operations of the Group are not considered to have a significant environmental impact.
Political riskPolitical risk is the risk that the authorities, in the countries where the Group is operating, by political decisions or administration make continued operations difficult, expensive or impossible for the Group. The Group is mainly operating in countries where the political risk is considered to be negligible or minor. The operations that are performed in countries where the political risk is deemed to be higher are not material.
Risk for and in connection with litigationsThis risk pertains to the costs the Group may incur in managing litigations, costs in connection with settlements and costs for imposed penalties. The Group is involved in a few litigations, mainly with customers. Any estimated loss risks are provided for.
Asbestos-related lawsuitsThe Alfa Laval Group was as of December 31, 2009, named as a co-defendant in a total of 444 asbestos-related lawsuits with a total of approximately 564 plaintiffs. Alfa Laval strongly believes the claims against the Group are without merit and intends to vigorously contest each lawsuit.
Based on current information and Alfa Laval’s understanding of these lawsuits, Alfa Laval continues to believe that these lawsuits will not have a material adverse effect on the Group’s financial condition or results of operation.
Risk for technically related damagesThis risk refers to the costs Alfa Laval may incur in connection with a product delivered by the Group breaking down and causing damages to life and property. The main risk in this context concerns high-speed separators, due to the large forces that are involved when the bowl in the separator spins with a very high number of revolutions. In a breakdown the damages can be extensive. Alfa Laval addresses these risks through extensive testing and an ISO certified quality assurance. The Group has product liability insurance. The number of damages is low and few damages have occurred historically.

89B
oard of D
irectors’ Report
Consolidated
cash flow
sC
onsolidated
comprehensive incom
eC
onsolidated
financial positionC
hanges in consolidated equity
Parent com
pany cash flow
sP
arent company
income
Parent com
pany financial position
Changes in parent com
pany equityN
otes to the financial statem
entsO
bjectives, policies and
processes for managing capital
Financial risks
Notes
Proposed disposition
of earningsA
udit R
eport
Business interruption risksThese risks refer to the risk that single units or functions within the Group can be hit by business interruption due to:
– strikes and other labour market conflicts
– fires, natural catastrophes, etc
– computer access violations, lack of backups etc
– corresponding problems at major sub-suppliers
Alfa Laval has a well developed dialog with the local unions, which reduces the risk for conflicts and strikes where Alfa Laval is directly involved. It is however more difficult to protect the company against conflicts in other parts of the labour market, for instance within transportation.
Alfa Laval is minimizing the following two risks through an active preventive work at each site in line with the developed global policies in each area under supervision of Operations, the Group’s Risk Management function, Real Estate Management, IT and HR.
Problems at major sub-suppliers are minimized by Alfa Laval trying to use several suppliers of input goods that when needed can cover up for a drop in production somewhere else. The wish for long term and competitive delivery agreements how-ever puts restrictions on the level of flexibility that can be achieved. When there is a shortage the total supply may be too limited to allow exchangeability.
HPR stands for “Highly Protected Risk” and is the insurance industry’s highest rating for risk quality. This rating is reserved for those commercial properties where the ex-posure for physical damages is reduced to a minimum considering building construction, operations and local conditions. HPR means that all physical risks in and around the fa-cility are documented and that these are kept with certain limits. Alfa Laval’s produc-tion facility in Lund, which is the Group’s largest and most important facility has been HPR classified. Yet some production facilities are close to HPR classification.
This means that the facility has state of the art fire and machinery protection sys-tems and that the responsible personnel has adequate security routines to make sure that these protection systems are maintained and in function. In addition,
known possible sources of ignition are under strict control to prevent a fire from starting. For an HPR facility the risk for a physical damage is brought to a minimum, which minimises the risk for business interruption that could have extensive consequences for Alfa Laval and its customers.
Insurance risksThese risks refer to the costs that Alfa Laval may incur due to an inadequate insurance coverage for property, business interruption, liability, transport, life and pensions. The Group strives to maintain an insurance coverage that keeps the risk level at an acceptable level for a Group of Alfa Laval’s size and is still cost efficient. As a step in this process Alfa Laval has started an own captive. Earlier a rent-a-captive solution with an external part was used. At the same time a continuous work is going on to minimise the risks in the operations through proactive measures.
Risks connected to credit termsThis risk is referring to the limited freedom of action that can be imposed on the Group through restrictions connected to credit terms in loan agreements. The loan agreement with the banking syndicate does not contain any such restrictions.
Operational
risks

90 Alfa Laval Annual Report 2009 / Financial statements
Note 1. Operating segments
Alfa Laval’s business is divided into the two business divisions ”Equipment” and ”Process Technology” that sell to external customers and one division “Other” covering procurement, production and logistics as well as corporate overhead and non-core businesses. These three divisions constitute Alfa Laval’s three operating segments.
The business divisions (operating segments) are in turn split into a number of customer segments. The customers to the Equipment division purchase products whereas the customers to the Process Technology division purchase solutions for processing applications. The Equipment division consists of six customer segments: Comfort & Refrigeration, Fluids & Utility Equipment, Marine & Diesel, OEM (Original Equipment Manufacturers), Sanitary Equipment and the aftermarket segment Parts & Service. The Process Technology division
Notes
consists of five customer segments: Energy & Environment, Food Technology, Life Science, Process Industry and the aftermarket segment Parts & Service.
The operating segments are only responsible for the result down to and including operating income excluding comparison distortion items and for the operating capital they are managing. This means that financial assets and liabilities, pension assets, provisions for pensions and similar commit-ments and current and deferred tax assets and liabilities are a Corporate responsibility and not an operating segment responsibility. This also means that the financial net and income taxes are a Corporate responsibility and not an operating segment responsibility.
The operating segments are only measured based on their transactions with external parties.
Orders received
Consolidated
SEK millions 2009 2008 2007
Equipment 11,751 15,804 15,896
Process Technology 9,767 11,636 11,594
Other 21 24 63
Total 21,539 27,464 27,553
Order backlog
Consolidated
SEK millions 2009 2008 2007
Equipment 6,399 7,926 7,915
Process Technology 5,486 6,365 6,766
Other 21 19 49
Total 11,906 14,310 14,730
Net sales
Consolidated
SEK millions 2009 2008 2007
Equipment 14,665 15,657 13,586
Process Technology 11,350 12,143 11,242
Other 24 50 21
Total 26,039 27,850 24,849
Operating income
Consolidated
SEK millions 2009 2008 2007
Equipment 2,530 3,602 2,866
Process Technology 2,040 2,756 2,312
Other -138 -395 -433
Subtotal 4,432 5,963 4,745
Comparison distortion items -225 -168 54
Consolidation adjustments * -177 -59 -108
Total 4,030 5,736 4,691
* Difference between management accounts and IFRS
Assets / Liabilities
Consolidated Assets Liabilities
SEK millions 2009 2008 2009 2008
Equipment 9,428 8,808 1,987 1,935
Process Technology 8,289 9,129 4,643 4,854
Other 4,507 6,149 1,866 2,980
Subtotal 22,224 24,086 8,496 9,769
Corporate 3,982 4,946 5,481 8,770
Total 26,206 29,032 13,977 18,539
Corporate refers to items in the statement on financial position that are interest bearing or are related to taxes.
Depreciation
Consolidated
SEK millions 2009 2008 2007
Equipment 200 134 168
Process Technology 153 107 151
Other 368 319 289
Total 721 560 608
Investments
Consolidated
SEK millions 2009 2008 2007
Equipment 91 87 52
Process Technology 113 215 75
Other 247 445 429
Total 451 747 556
The decrease in depreciation in 2008 for Equipment and Process Technology is due to the fact that some step up values from year 2000 became fully amortised in early 2008.

91B
oard of D
irectors’ Report
Consolidated
cash flow
sC
onsolidated
comprehensive incom
eC
onsolidated
financial positionC
hanges in consolidated equity
Parent com
pany cash flow
sP
arent company
income
Parent com
pany financial position
Changes in parent com
pany equityN
otes to the financial statem
entsO
bjectives, policies and
processes for managing capital
Financial risks
Operational
risksN
otes P
roposed disposition of earnings
Audit
Report
Note 2. Information about geographical areas
Countries with more than 10 percent of net sales, assets or investments are reported separately.
Net sales
Consolidated
2009 2008 2007
SEK
millions %SEK
millions %SEK
millions %
To customers in:
Sweden 840 3.2 961 3.5 987 4.0
Other EU 7,941 30.6 9,339 33.6 9,112 36.6
Other Europe 1,829 7.0 2,402 8.6 2,223 8.9
USA 3,736 14.3 3,680 13.2 3,680 14.8
Other North America 575 2.2 711 2.6 420 1.7
Latin America 1,432 5.5 1,711 6.1 1,258 5.1
Africa 259 1.0 229 0.8 177 0.7
China 2,876 11.0 2,935 10.5 2,051 8.3
Other Asia 6,238 24.0 5,467 19.6 4,611 18.6
Oceania 313 1.2 415 1.5 330 1.3
Total 26,039 100.0 27,850 100.0 24,849 100.0
Non-current assets
Consolidated
2009 2008
SEK
millions %SEK
millions %
Sweden 1,725 12.6 1,780 14.6
Other EU 4,745 34.6 4,769 39.1
Other Europe 379 2.8 174 1.4
USA 1,935 14.1 2,258 18.5
Other North America 128 0.9 116 1.0
Latin America 178 1.3 105 0.9
Africa 1 0.0 1 0.0
Asia 3,039 22.1 1,557 12.8
Oceania 90 0.7 77 0.6
Subtotal 12,220 89.0 10,837 88.9
Pension assets 136 1.0 140 1.1
Deferred tax asset 1,367 10.0 1,218 10.0
Total 13,723 100.0 12,195 100.0
Investments
Consolidated
2009 2008 2007
SEK
millions %SEK
millions %SEK
millions %
Sweden 78 17.2 134 17.9 198 35.7
Denmark 27 6.1 41 5.5 73 13.1
France 82 18.1 188 25.2 45 8.0
Italy 61 13.5 47 6.4 39 6.9
Other EU 54 12.0 80 10.6 47 8.6
Other Europe 13 2.8 14 1.9 17 3.1
North America 31 6.9 46 6.2 35 6.3
Latin America 3 0.7 34 4.5 6 1.0
Africa 0 0.0 0 0.1 0 0.0
China 29 6.5 81 10.8 37 6.6
Other Asia 72 16.0 81 10.8 58 10.6
Oceania 1 0.2 1 0.1 1 0.1
Total 451 100.0 747 100.0 556 100.0
Notes
Note 3. Information about products and services
Net sales by product/service
Consolidated
SEK millions 2009 2008 2007
Own products within:
Separation 6,586 6,391 5,558
Heat transfer 13,866 16,023 14,198
Fluid handling 2,427 2,426 2,554
Other 615 349 306
Associated products 1,339 1,553 1,287
Services 1,206 1,108 946
Total 26,039 27,850 24,849
The split of own products within separation, heat transfer and fluid handling is a reflection of the current three main technologies. Other is own products outside these main technologies. Associated products are mainly purchased products that compliment Alfa Laval’s product offering. Services cover all sorts of service, service agreements etc.
Note 4. Information about major customers
Alfa Laval does not have any customer that accounts for 10 percent or more of net sales. Tetra Pak within the Tetra Laval Group is Alfa Laval’s single largest customer with about 3 percent of net sales. See Note 34 for more information.
Note 5. Employees
Average number of employees – total
Consolidated
Number of female employees
Total number of employees
2009 2008 2007 2009 2008 2007
Parent company – – – – – –
Subsidiaries in Sweden (10) 463 485 473 2,216 2,356 2,273
Total in Sweden (10) 463 485 473 2,216 2,356 2,273
Total abroad (108) 1,902 1,906 1,719 9,557 9,465 8,531
Total (118) 2,365 2,391 2,192 11,773 11,821 10,804
The figures in brackets in the text column state how many companies had employ-
ees as well as salaries and remunerations in 2009.
Average number of employees – in Sweden by municipality
Consolidated
2009 2008 2007
Botkyrka 455 471 448
Eskilstuna 215 236 218
Lund 1,037 1,131 1,084
Ronneby 271 322 324
Stockholm 12 14 15
Vänersborg 134 141 138
Other * 92 41 46
Total 2,216 2,356 2,273
* “Other” refers to municipalities with less than 10 employees and also includes
employees at branch offices abroad.

92 Alfa Laval Annual Report 2009 / Financial statements
Average number of employees - by country
Consolidated
Number of female employees
Total number of employees
2009 2008 2007 2009 2008 2007
Argentina 7 7 12 34 45 45
Australia 10 12 13 64 66 65
Belgium 8 8 10 67 69 68
Brazil 40 31 28 145 142 130
Bulgaria 10 10 3 41 26 11
Chile 6 8 5 29 29 28
Colombia 4 4 3 13 13 11
Denmark 321 337 311 1,145 1,224 1,162
Estonia 0 1 1 0 3 3
Philippines 2 2 2 13 14 13
Finland 40 45 46 213 220 90
France 159 156 162 816 882 847
United Arab Emirates 12 15 14 96 91 75
Greece 9 2 - 23 5 0
Hong Kong 5 5 6 28 28 27
India 58 59 41 1,410 1,362 1,265
Indonesia 12 16 10 62 66 62
Iran 2 2 2 14 15 15
Italy 125 115 102 606 607 598
Japan 41 43 37 213 211 198
Canada 19 22 21 80 74 73
China 203 228 193 969 935 801
Korea 80 25 23 209 102 91
Latvia 7 4 4 14 8 8
Lithuania 0 2 2 0 4 4
Malaysia 24 24 22 62 64 61
Mexico 12 9 8 55 38 36
Netherlands 24 29 26 219 226 177
Norway 8 9 10 46 46 45
New Zeeland 3 4 4 21 23 24
Peru 7 9 8 27 30 28
Poland 39 29 27 201 195 173
Portugal 5 5 4 12 12 13
Romania 8 8 7 18 17 14
Russia 114 131 108 292 316 285
Switzerland 5 3 3 18 18 17
Singapore 30 20 20 71 53 49
Slovakia 2 2 2 11 11 10
Spain 25 32 25 92 98 93
UK 54 53 54 296 310 314
Sweden 463 485 473 2,216 2,356 2,273
South Africa 9 11 11 42 44 39
Taiwan 10 13 13 33 35 33
Thailand 18 22 20 59 65 55
Czech Republic 13 15 15 68 75 75
Turkey 8 8 8 39 39 37
Germany 72 76 67 320 261 234
Ukraine 7 6 5 18 21 8
Hungary 5 6 7 16 20 19
USA 206 210 185 1,167 1,150 952
Venezuela 7 6 4 18 21 18
Austria 7 7 5 32 36 32
Total 2,365 2,391 2,192 11,773 11,821 10,804
Sick leave among Swedish employees
Consolidated
Percent 2009 2008 2007
Sick leave in percent of total normal working hours for each category, for:
all employees 2.8 3.6 3.9
all employees during 60 consecutive days or more 1.0 1.4 1.6
female employees 2.6 3.6 5.2
male employees 2.9 3.5 3.6
employees at the age of 29 or younger 2.4 2.8 2.7
employees between 30 and 49 years of age 2.6 2.9 3.3
employees at the age of 50 or more 3.4 5.0 4.9

93B
oard of D
irectors’ Report
Consolidated
cash flow
sC
onsolidated
comprehensive incom
eC
onsolidated
financial positionC
hanges in consolidated equity
Parent com
pany cash flow
sP
arent company
income
Parent com
pany financial position
Changes in parent com
pany equityN
otes to the financial statem
entsO
bjectives, policies and
processes for managing capital
Financial risks
Operational
risksN
otes P
roposed disposition of earnings
Audit
Report
Distribution of men/women among managers
Consolidated
2009 2008 2007
Total number
Male %
Female %
Total number
Male %
Female %
Total number
Male %
Female %
Board members (excluding deputies) 11 72.7 27.3 11 72.7 27.3 11 72.7 27.3
President and other executive officers 10 90.0 10.0 11 100.0 0.0 11 100.0 0.0
Managers in Sweden 302 81.8 18.2 296 82.1 17.9 275 81.5 18.5
Managers outside Sweden 1,086 86.2 13.8 921 86.1 13.9 912 85.3 14.7
Managers total 1,388 85.2 14.8 1,217 85.1 14.9 1,187 84.4 15.6
Employees in Sweden 2,216 79.1 20.9 2,356 79.4 20.6 2,273 79.2 20.8
Employees outside Sweden 9,557 80.1 19.9 9,465 79.9 20.1 8,531 79.8 20.2
Employees total 11,773 79.9 20.1 11,821 79.8 20.2 10,804 79.7 20.3
Note 6. Salaries and remunerations
Salaries and remunerations – total
Consolidated
SEK millions 2009 2008 2007
Board of Directors, Presidents and Vice Presidents 189 173 156
– out of which, variable 26 38 33
Other 4,386 4,008 3,605
Total salaries and remunerations 4,575 4,181 3,761
Social security costs 799 760 699
Pension costs, defined benefit plans 175 141 166
Pension costs, defined contribution plans 330 307 263
Total costs of personnel 5,879 5,389 4,889
The Group’s pension costs and pension liabilities relating to the Board of Directors, presidents and vice presidents amounts to SEK 45 (45) (46) million and SEK 319 (304) (289) million respectively. SEK 153 (169) (170) million of the pension liabilities is covered by the Alfa Laval Pension Fund.
Equity compensation benefits During the period 2007 to 2009 no equity related benefits existed within Alfa Laval.
Variable remunerationsAll employees have either a fixed salary or a fixed base salary. For certain personnel categories the remuneration package also includes a variable element. This relates to personnel categorises where it is customary or part of a market offer to pay a variable part. Variable remunerations are most common in sales related jobs and on higher managerial positions. Normally the variable part constitutes a minor part of the total remuneration package.
Cash based long term incentive programmeThe Annual General Meeting 2008 decided to implement the first step of a cash based long term incentive programme for approximately 75 senior managers in the Group including the Chief Executive Officer and the persons defined as executive officers. The first step covers the period January 1, 2008 – December 31, 2010. The Annual General Meeting 2009 decided to implement the second step for the period January 1, 2009 – December 31, 2011. This means that for 2009 the first and second steps of the plan are running in parallel.
Each of the steps stretches over three years and the awards under each step are divided into three tranches (one for each year). The maximum award for each three year period is 50 percent of the employee’s annual maximum variable remuneration calculated on the base salary at the end of the three year period. This means that if the employee for instance can get up to 15 percent in variable remuneration each step of the long term incentive plan at maximum can result in an additional 7.5 percent of the base salary split into three annual awards of 2.5 percent. The outcome of the plan is linked to the development of earnings per share (EPS) for the Alfa Laval share. The EPS targets for the three tranches within each step are set by the Board of Directors. For each percent up to maximum 20 percent that the EPS exceeds the target EPS, the employee gets 5 percent of one third of the maximum outcome per year. To be entitled to a maximum outcome the EPS value for each year must exceed the target EPS by 20 percent (20 x 5 % x 1/3 x 7.5 % = 2.5 % per year in this case). If the target is exceeded by 10 percent the result in this case would be 10 x 5 % x 1/3 x 7.5 % = 1.25 % per year.
To be eligible for payout the employees must be in service on the award date and the vesting date (except in case of termination of employment due to retirement, death and disability). If the employee resigns or is dismissed before the end of the three year period, the awards will lapse and the employee will not be entitled to any payout. If the employee moves to a position that is not eligible for this plan the tranches that already have been earned are paid out upon the change of position. The awards for the first step are payable in April 2011 whereas the awards for the second step are payable in April 2012. Based on the reported EPS for 2008 and 2009 the first step resulted in a full award for 2008 and no award for 2009 and the second step in a partial award for 2009. Based on estimated base salaries at the future time of payment the award for 2009 was SEK 3 (5) million.
Guidelines for remunerations to executive officersThe remunerations to the Chief Executive Officer/Managing Director and other members of Group Management are decided by the Board of Directors based on proposals from the Remuneration Committee according to the guidelines established by the Annual General Meeting. The principle used when deciding the remunerations to executive officers is that the remu-neration package is mainly based on a fixed monthly salary, with an option for a company car and in addition to that a variable remuneration of up to 40 percent of the salary (managing director up to 60 percent of the salary). The size of the variable remuneration depends on the outcome of a number of financial measurements and the result of special projects, all compared with the objectives that have been established for the year. The Annual General Meetings 2008 and 2009 decided to implement step one and two of a cash based long term incentive programme for approximately 75 senior managers in the Group including the Chief Executive Officer and the persons defined as executive officers. The Board of Directors will propose the Annual General Meeting 2010 to implement step three of the long term incentive programme for the period January 1, 2010 – December 31, 2012. No other changes of these guidelines are proposed by the Board of Directors.
Chief Executive Officer/Managing DirectorThe Chief Executive Officer and Managing Director Lars Renström receives a remuneration of SEK 11,062,649 (10,628,302) (9,497,445), out of which SEK 4,050,000 (3,600,000) (3,000,000) represent the variable part. The variable part refers to what was paid during the year. The remuneration contains the value of company car, taxable daily allowances, holiday pay and payment for vacation taken in cash.
Lars Renström currently has a base salary of SEK 6,750,000 (6,750,000) (6,000,000) per annum. In his remuneration package there is a variable element with an un-guaranteed target of 30 (30) (30) percent of the base salary and with a maximum opportunity of 60 (60) (60) percent. He is covered by the cash based long term incentive programme and based on the estimated base salary at the future time of payment the award for 2009 was SEK 430,234 (714,021). He does not have an agreement on early retirement. The ordinary ITP up to a salary of 30 base amounts is funded in order to achieve full ITP benefits at the age of 62 (60). If Lars Renström continues his work in Alfa Laval after the age of 62 (60) he will not receive any pension during the time he receives salary. On top of the ordinary ITP he has a defined contribution benefit comprising 50 percent of the base salary. If Alfa Laval terminates his employment before the age of 61 (59) he will receive two years’ remuneration, between 61 (59) and 62 (60) he will receive one year’s remuneration and from 62 (60) he will receive 6 months’ remuneration. During the year, Alfa Laval has recorded costs for pension premiums for retirement and survivors’ pension of SEK 4,399,756 (4,656,423) (5,159,182). In addition the company has incurred costs for life insurance, disability insurance and health care in-surance of SEK 499,412 (499,723) (318,140).
Notes

94 Alfa Laval Annual Report 2009 / Financial statements
Other executive officersOther executive officers are the nine members of Group Management in addition to the Chief Executive Officer. Their remunerations were SEK 29 (28) (27) million, out of which the variable part was SEK 7 (6) (5) million. The variable part refers to what was paid during the year. They are also covered by the cash based long term incentive programme and based on estimated base salaries at the future time of payment the award for 2009 was SEK 1 (1) million. During 2009, Alfa Laval has recorded costs for pension premiums for retirement and survivors’ pension of SEK 17 (11) (21) million for them. The high cost in 2007 was related to the shift from defined benefit to defined contribution schemes. In addition the company has incurred costs for life insurance, disability insurance and health care insurance of SEK 1 (1) (1) million.
For these executive officers, early retirement has in a few cases been committed from the age of 62. From 2006 a defined contribution solution for early retirement is offered with a premium of 15 percent of the pensionable salary. Early retirement is offered selectively and only after a specific decision in the Remuneration Committee. For salaries above 30 base amounts a de-fined contribution pension solution with a premium of 30 percent of the pen-sionable salary above 30 base amounts is offered since 2006. The executive officers also have a special family pension that represents a supplement be-tween the old age pension and the family pension according to ITP. In addi-tion, they may exchange salary and variable remunerations for a temporary old age and family pension.
Alfa Laval has made commitments for severance pay to a limited group of senior executives. The commitments are restricted to a maximum amount of two annual salaries. The commitments define the conditions that must be fulfilled in order for them to become valid.
Board of DirectorsFor 2009, the Board of Directors receive a total fixed remuneration of SEK 3,485,000 (3,485,000) (3,050,000), which is distributed among the members elected at the Annual General Meeting that are not employed by the company. These Directors do not receive any variable remuneration.
Remunerations to Board members *
Consolidated
SEK 2009 2008 2007
Fees by function:
Chairman of the Board 900,000 900,000 800,000
Other members of the Board 360,000 360,000 325,000
Supplement to:
Chairman of the Audit Committee 125,000 125,000 100,000
Other members of the Audit Committee 75,000 75,000 50,000
Chairman of the remune-ration committee 50,000 50,000 50,000
Other member of the remuneration committee 50,000 50,000 50,000
Fees by name:
Anders Narvinger Chairman 1,025,000 1,025,000 900,000
Gunilla Berg Member 435,000 435,000 375,000
Björn Hägglund Member 410,000 410,000 325,000
Ulla Litzén Member 360,000 360,000 325,000
Finn Rausing Member 485,000 485,000 425,000
Jörn Rausing Member 410,000 410,000 375,000
Waldemar Schmidt Member 360,000 360,000 325,000
Total 3,485,000 3,485,000 3,050,000
* Elected at the Annual General Meeting and not employed by the company
The reported remunerations refer to the period between two Annual General Meetings.
The Chairman of the Board does not have any agreement on future retire-ment or severance pay with Alfa Laval.
Salaries and remunerations - by country
Consolidated
Board of Directors, Presidents and Vice
Presidents Other employees
SEK millions 2009 2008 2007 2009 2008 2007
Argentina 1 1 1 5 7 5
Australia 4 4 4 28 27 25
Belgium 1 4 5 49 40 42
Brazil 5 4 4 45 39 31
Bulgaria 0 1 0 8 6 1
Chile 0 0 0 9 7 6
Colombia 1 1 1 2 2 2
Denmark 10 9 9 798 726 629
Estonia 0 0 0 0 0 0
Philippines 1 0 0 2 2 1
Finland 3 4 1 98 91 35
France 10 7 6 328 298 264
United Arab Emirates 2 2 6 38 22 12
Greece 0 2 0 11 1 0
Hong Kong 2 1 2 16 15 18
India 2 3 4 109 98 87
Indonesia 1 1 1 8 7 6
Iran 0 0 0 1 2 2
Italy 4 2 2 234 208 196
Japan 11 8 8 116 73 81
Canada 2 2 2 41 39 33
China 6 4 3 107 92 66
Korea 3 1 0 48 32 30
Latvia 1 1 1 3 1 1
Lithuania 0 0 0 0 1 0
Malaysia 1 1 1 13 11 10
Mexico 2 1 1 10 9 9
Netherlands 0 2 1 120 121 100
Norway 2 2 2 33 34 32
New Zeeland 1 1 1 6 6 6
Peru 0 0 0 5 5 5
Poland 3 3 2 28 29 23
Portugal 0 0 0 3 4 4
Romania 3 2 2 2 2 1
Russia 2 2 2 63 73 56
Switzerland 2 2 2 13 12 11
Singapore 2 1 1 26 15 13
Slovakia 0 0 0 3 2 2
Spain 3 2 3 44 45 39
UK 3 2 2 132 133 140
Sweden 37 38 34 1,012 1,011 994
South Africa 3 3 0 12 9 7
Taiwan 1 1 1 7 7 7
Thailand 2 1 1 10 10 8
Czech Republic 0 2 2 16 16 13
Turkey 5 3 2 8 10 10
Germany 12 11 9 129 113 99
Ukraine 0 0 – 4 5 2
Hungary 1 1 1 4 5 5
USA 30 27 23 556 465 419
Venezuela 0 0 0 6 3 2
Austria 4 3 3 17 17 15
Total 189 173 156 4,386 4,008 3,605

95B
oard of D
irectors’ Report
Consolidated
cash flow
sC
onsolidated
comprehensive incom
eC
onsolidated
financial positionC
hanges in consolidated equity
Parent com
pany cash flow
sP
arent company
income
Parent com
pany financial position
Changes in parent com
pany equityN
otes to the financial statem
entsO
bjectives, policies and
processes for managing capital
Financial risks
Operational
risksN
otes P
roposed disposition of earnings
Audit
Report
Note 7. Information on auditors and auditors’ fee
During 2007 quotations were taken in from four of the large international audit firms. After a selection process the Annual General Meeting 2008 decided to re-elect Ernst & Young as the Group’s auditors for the coming four years.
Fees and expense compensation
Consolidated
SEK millions 2009 2008 2007
Audit
Ernst & Young 26 21 21
Other audit firms 2 1 1
Total 28 22 22
Other projects
Ernst & Young 13 9 9
Other audit firms 11 7 9
Total 24 16 18
An audit includes examining the financial statements, assessing the accounting principles used and significant estimates made by management, as well as evaluating the overall financial statement presentation. It also includes an examination in order to give an opinion on the Board’s discharge from liability. All other assignments are defined as other projects.
The increase in other projects is a reflection of the activities in connection with the increased number of acquisitions.
Note 8. Advertising costs
Advertising costs have amounted to SEK 56 (93) (86) million. These refer to costs for advertisements in newspapers and technical press, participation in trade fairs and brochures.
Note 9. Comparison distortion items
Comparison distortion items are reported gross in the comprehensive income statement as a part of other operating income and other operating costs.
Comparison distortion items
Consolidated
SEK millions 2009 2008 2007
Operational
Other operating income 442 420 308
Comparison distortion items – 102 54
Total other operating income 442 522 362
Other operating costs -850 -734 -627
Comparison distortion items -225 -270 –
Total other operating costs -1,075 -1,004 -627
Specification of comparison distortion items
Consolidated
SEK millions 2009 2008 2007
Gain on:
Sale of real estate – 102 54
Cost for:
Restructuring programme -225 -270 –
Net total -225 -168 54
2009 is burdened with SEK -225 million for restructuring measures.In 2008 a property in Brazil was sold for SEK 113 million with a realised
gain of SEK 102. The costs for the restructuring programme burdened 2008 with SEK -270 million.
During 2007 the property in Tuusula in Finland was sold for SEK 26 mil-lion with a realised gain of SEK 25 million. The property in Argentina was sold for SEK 14 million with a realised gain of SEK 11 million. A property in Brussels in Belgium was sold for SEK 27 million with a realised gain of SEK 15 million. Minor sales of land and buildings were made in India for SEK 3 million with a realised gain of SEK 2 million and in France for SEK 2 million with a realised gain of SEK 1 million.
Note 10. Depreciation and amortisation
Split by function
Consolidated
SEK millions 2009 2008 2007
Cost of goods sold -561 -423 -479
Sales -48 -47 -45
Administration -77 -64 -53
Research and development -6 -5 -11
Other income and costs -29 -21 -20
Total -721 -560 -608
Split by type of asset
Consolidated
SEK millions 2009 2008 2007
Patents, trademarks, etc. -234 -161 -249
Machinery and equipment -408 -326 -297
Financial leasing machinery and equipment -4 -2 -3
Buildings and ground installations -71 -70 -58
Financial leasing buildings -4 -1 -1
Total -721 -560 -608
Note 11. Dividends and fair value adjustments of financial instruments
Split by type
Consolidated
SEK millions 2009 2008 2007
Dividends from other -2 4 2
Fair value adjustment of securities 1 -2 0
Total -1 2 2
Notes

96 Alfa Laval Annual Report 2009 / Financial statements
Note 12. Interest income/expense and financial exchange rate gains/losses
Split on type of income/expense or gain/loss
Consolidated
SEK millions 2009 2008 2007
Interest income
Financial leasing – 0 1
Other interest 108 52 46
Exchange rate gains
Unrealised 229 276 190
Realised 67 69 34
Total 404 397 271
Interest expenses
Financial leasing 0 0 -2
Other interest -315 -235 -226
Exchange rate losses
Unrealised -257 -94 -58
Realised -101 -465 -121
Total -673 -794 -407
In the Group, reported net exchange differences of SEK 220 (-468) (13) million relating to debts in foreign currencies have been charged to other comprehensive income. These debts finance the acquisition of shares in foreign subsidiaries and act as a hedge to the acquired net assets. The amount is charged with tax resulting in a net after tax impact on other comprehensive income of SEK 162 (-345) (9) million.
Split on type of income/expense or gain/loss
Parent company
SEK millions 2009 2008 2007
Interest income
External companies 0 – 0
Subsidiaries 11 39 40
Exchange rate gains
Unrealised 12 11 4
Total 23 50 44
Interest costs
External companies -1 0 –
Subsidiaries – -3 –
Exchange rate losses
Unrealised -21 -1 -2
Realised 0 0 -1
Total -22 -4 -3
Note 13. Minority interest
The minority share in subsidiaries’ result and equity relates to six subsidiaries in Bulgaria, France, India, Russia, South Korea and Sweden with minority owners.
Note 14. Classification of financial assets and liabilities
Financial assets
Consolidated
Financial assets at fair value through profit or loss: Loans and receivables
Designated upon initial recognition Held for trading
Derivatives used for hedging
SEK millions 2009 2008 2009 2008 2009 2008 2009 2008
Non-current assets
Other non-current assets
Other long-term securities 39 18 – – – – – –
Current assets
Current receivables
Accounts receivable – – – – – – 4,123 5,706
Notes receivable – – – – – – 379 446
Other receivables – – – – – – 909 978
Accrued income – – – – – – 24 17
Derivative assets – – 75 215 256 376 – –
Current deposits
Deposits with banks – – – – – – 76 452
Bonds and other securities 212 78 – – – – – –
Other deposits – – – – – – 14 14
Cash and bank – – – – – – 1,112 1,083
Total financial assets 251 96 75 215 256 376 6,637 8,696
The Group does not have any financial assets that represent held to maturity investments or that are available for sale.

97B
oard of D
irectors’ Report
Consolidated
cash flow
sC
onsolidated
comprehensive incom
eC
onsolidated
financial positionC
hanges in consolidated equity
Parent com
pany cash flow
sP
arent company
income
Parent com
pany financial position
Changes in parent com
pany equityN
otes to the financial statem
entsO
bjectives, policies and
processes for managing capital
Financial risks
Operational
risksN
otes P
roposed disposition of earnings
Audit
Report
Financial liabilities
Consolidated
Financial liabilities at fair value through profit or loss: Loans
Held for trading
Derivatives used for hedging
SEK millions 2009 2008 2009 2008 2009 2008
Non-current liabilities
Liabilities to credit institutions – – – – 832 2,538
Private placement – – – – 794 856
Current liabilities
Liabilities to credit institu-tions – – – – 165 247
Accounts payable – – – – 1,630 2,449
Notes payable – – – – 203 251
Other liabilities – – – – 985 1,029
Accrued costs – – – – 1,279 1,353
Derivative liabilities 137 388 150 821 – –
Total financial liabilities 137 388 150 821 5,888 8,723
The Group does not have any financial liabilities at fair value through profit and loss designated upon initial recognition.
All of the financial instruments above sum up either to the corresponding item in the statement on financial position or to the item specified in the notes referred to in the statement on financial position. The risks linked to these financial instruments including any concentrations of risk are pre-sented in the sections on risks on pages 84–86.
Result of financial instrumentsThe result of the financial assets designated upon recognition is found in Note 11 as dividends from other.
The result of the financial assets held for trading of SEK 36 (14) (24) million has affected cost of goods sold with SEK 35 (2) (-) million, exchange gains in Note 12 with SEK 1 (12) (24) million and interest income in Note 12 with the remaining SEK - (0) (-) million.
The result of the assets under loans and receivables is presented in Note 12 as other interest income for deposits with banks, other deposits and cash and bank. The other assets under loans and receivables do not generate a result but only a cash-in of the principal amount.
The result of the financial liabilities held for trading of SEK -93 (-170) (-54) million has affected cost of goods sold with SEK -6 (-85) (-5) million, exchange losses in Note 12 with SEK -86 (-84) (-49) million and interest costs in Note 12 with the remaining SEK -1 (-1) (-) million.
The result of the liabilities under loans is presented in Note 12 as other in-terest costs for the liabilities to credit institutions and the private placement. The other liabilities under loans do not generate a result but only a cash-out of the principal amount.
The result of the derivative assets and liabilities used for hedging is reported as part of other comprehensive income in the comprehensive income statement.
Note 15. Fair value adjustments of financial instruments
Fair value adjustment of securities
Consolidated
Acquisition value Fair value Adjustment
SEK millions 2009 2008 2009 2008 2009 2008
Other long-term securities
Shares in external companies 38 18 39 18 1 0
Bonds and other securities
Marketable securities 212 78 212 78 0 0
Total 250 96 251 96 1 0
The fair value adjustments of securities are made above net income and on each concerned line in the statement of financial position.
Fair value adjustment of derivatives
Consolidated
Difference between contracted rate and
current rate
SEK millions Currency pairs 2009 2008
Derivative assets/liabilities
Foreign exchange forward contracts: EUR USD 17 -22
EUR SEK 58 -483
EUR AUD 0 2
EUR CAD 0 24
EUR JPY 3 20
USD CAD -1 15
USD DKK 4 6
USD GBP -2 -1
USD SEK -98 -258
USD JPY 2 128
DKK SEK 22 -45
USD KRW -42 –
Other Other -10 8
Subtotal -47 -606
Currency options 1 -52
Interest Rate Swaps 74 120
Metal forward contacts 11 -77
Electricity futures 5 -3
Total, corresponding to a net derivative asset (+) or liability (-) 44 -618
For currency options, metal forward contracts and electricity futures hedge accounting has not been applied. For foreign exchange forward contracts and interest rate swaps hedge accounting has been applied when the conditions for hedge accounting have been fulfilled.
The fair value adjustment of derivatives is made through other comprehen-sive income if hedge accounting can be applied and the derivatives are ef-fective. In all other cases the fair value adjustment is made above net income. The corresponding entries are made on derivative assets and liabilities and not on the underlying financial instruments in the statement on financial position.
Notes

98 Alfa Laval Annual Report 2009 / Financial statements
Note 16. Current and deferred taxes
Taxes on this year’s result and other taxes
Consolidated
SEK millions 2009 2008 2007
Major components of the Group’s tax costs
Current tax cost -1,237 -1,509 -1,559
Adjustment for current taxes on prior periods -26 -8 29
Deferred tax costs/income on changes in temporary differences 186 -48 143
Deferred tax costs/income on changes in tax rates or new taxes 34 15 16
Tax income from previously unrecognised tax losses or tax credits on temporary differences of prior periods 0 8 0
Deferred tax income from previously unrecognised tax losses or tax credits on temporary differences of prior periods 6 23 20
Deferred tax cost from the write down or reversal of a previous write down of a deferred tax asset 20 -9 1
Other taxes -6 -6 -27
Total tax cost -1,023 -1,534 -1,377
The difference between the tax costs of the group and the tax cost based upon applicable tax rates can be explained as follows:
Tax cost reconciliation
Consolidated
SEK millions 2009 2008 2007
Result before minority interests and tax 3,760 5,341 4,557
Tax according to applicable tax rates -1,095 -1,650 -1,460
Tax effect of:
Non-deductible costs -115 -43 -109
Non-taxable income 180 135 111
Tax losses and tax credits 39 38 79
Other -6 -6 -27
Adjustment for current tax on prior periods -26 -8 29
Total tax costs -1,023 -1,534 -1,377
Other taxes are mainly referring to wealth tax.
Temporary differences exist when there is a difference between the book value and the tax base of assets and liabilities. The Group’s temporary differ-ences have resulted in a deferred tax asset or a deferred tax liability relating to the following assets and liabilities:
Deferred tax assets and liabilities
Consolidated
2009 2008
SEK millions assets liabilities assets liabilities
Relating to:
Intangible non-current assets 15 621 20 376
Tangible non-current assets 69 254 38 278
Inventory 150 16 145 12
Other current assets 11 4 44 6
Financial assets 8 0 0 0
Short term liabilities 1,174 104 1,033 149
Tax losses and tax credits * 27 0 21 0
Other 8 486 0 423
Subtotal 1,462 1,485 1,301 1,244
Possible to net -95 -95 -83 -83
Total deferred taxes 1,367 1,390 1,218 1,161
* The Group has reported a deferred tax asset on unused tax losses and tax grants of SEK 91 (70) million. These unused tax losses and tax grants are essentially not restricted in time.
In the Group there are temporary differences and unused tax losses and tax credits of SEK 709 (777) million that have not resulted in corresponding deferred tax assets, since these are not likely to be used.

99B
oard of D
irectors’ Report
Consolidated
cash flow
sC
onsolidated
comprehensive incom
eC
onsolidated
financial positionC
hanges in consolidated equity
Parent com
pany cash flow
sP
arent company
income
Parent com
pany financial position
Changes in parent com
pany equityN
otes to the financial statem
entsO
bjectives, policies and
processes for managing capital
Financial risks
Operational
risksN
otes P
roposed disposition of earnings
Audit
Report
Note 17. Goodwill and step-up values
The allocation of step up values to tangible and intangible assets and the residual goodwill in effect means that all acquisitions are valued at market. In order to separate out this valuation effect Alfa Laval focuses on EBITA, where any amortisation of step up values is excluded. The development of these step up values and any goodwill is shown in the table below. It shows each acquisition separately. Any later adjustments to the allocations are referred to the original year of the acquisition. The figures for the allocations, realisations and amortisation are based on the prevailing rates at the time the transactions took place and any change in exchange rates until December 31, 2009 is shown as a translation difference. The corresponding presentation by asset type is found in Notes 18 and 19.
Movement schedule
Consolidated
SEK millionsOpening
balance 2009 Acquired RealisedPlanned
amortisationTranslation difference
Closing balance 2009
Buildings 380 – – -22 -14 344
Land and land improvements -54 – – – 6 -48
Machinery 103 – – -60 -3 40
Equipment 185 – – -32 1 154
Patent and trademarks 1,584 1,097 – -216 -50 2,415
Subtotal step-up values 2,198 1,097 – -330 -60 2,905
Goodwill 5,383 976 – – -216 6,143
Total 7,581 2,073 – -330 -276 9,048
The Group has not recorded any impairment losses related to neither goodwill nor any other step up values in 2009 or prior years. There is no deferred tax liability calculated on the goodwill. The deferred tax liability on the other step-up values is SEK 632 (464) million.For assets sold, net gains or losses are recognised on the costs basis including any related step-up value.
Notes
The nominal tax rate has changed in the following countries during 2007 to 2009.
Tax rates by country
Consolidated
Percent 2009 2008 2007
Belgium 34 34 33
Bulgaria 10 10 15
Colombia 33 33 35
Philippines 30 35 35
Indonesia 28 30 30
Italy 31 31 37
Canada 32 34 34
China 20 18 15
Malaysia 25 26 28
Mexico 30 28 28
New Zealand 30 30 33
Pakistan 35 35 39
Russia 20 20 24
Singapore 17 18 18
Spain 30 30 33
Sweden 26 28 28
South Africa 28 28 29
South Korea 22 24 25
Taiwan 20 25 25
Czech Republic 20 21 24
Germany 29 35 35
Hungary 16 16 20
With the exception of mainly China this confirms the international downward trend in corporate taxation.
The Group’s normal effective tax rate is approximately 30 (31) (32) per-cent based on taxable result, and it is calculated as a weighted average based on each subsidiary’s part of the result before tax.

100 Alfa Laval Annual Report 2009 / Financial statements
Acquisition of businesses since 2000
Consolidated
SEK millions
Year/Businesses Buildings
Land and land
improve-ments Machinery Equipment Inventory
Patent and trademarks Other
Total step-up values Goodwill Total
2000
Alfa Laval Holding 1,058 -228 548 452 340 461 1,392 4,023 3,683 7,706
2002
Danish Separation Systems – – – – – – – – 118 118
2003
Toftejorg 1 – – – – – – 1 35 36
bioKinetics – – – – – 28 – 28 84 112
2005
Packinox – – – – 7 296 – 303 265 568
2006
Tranter 17 – – – 6 445 – 468 530 998
2007
AGC Engineering – – – – – 12 – 12 20 32
Helpman 9 8 – – – 36 – 53 4 57
Public offer Alfa Laval (India) – – – – – – – – 441 441
DSO Fluid Handling – – – – – 39 – 39 42 81
Fincoil – – – – – 233 – 233 241 474
2008
Høyer Promix A/S – – – – – – – – 16 16
Nitrile India Pvt Ltd – – – – – – – – 6 6
Standard Refrigeration – – – – 5 166 – 171 152 323
Pressko AG – – – – 1 – – 1 69 70
Hutchison Hayes Separation – – – – 1 144 – 145 46 191
P&D’s Plattvärmeväxlarservice – – – – – – – – 10 10
Ageratec – – – – – – – – 44 44
2009
Two providers of parts & service – – – – – 291 – 291 189 480
Onnuri Industrial Machinery – – – – – 79 – 79 48 127
HES Heat Exchanger Systems – – – – – 83 – 83 59 142
Public offer Alfa Laval (India) – – – – – – – – 311 311
Termatrans – – – – – 7 – 7 6 13
Tranter acquisitions in Latin America – – – – – 20 – 20 16 36
ISO Mix – – – – – 22 – 22 – 22
LHE – – – – – 595 – 595 347 942
Accumulated during the period
Realised -524 122 13 -24 -360 -23 -112 -908 -85 -993
Planned amortisation -231 – -532 -281 – -621 -1,272 -2,937 -612 -3,549
Translation difference 14 50 11 7 – 102 -8 176 58 234
Closing balance 344 -48 40 154 – 2,415 – 2,905 6,143 9,048
The acquisition of the Alfa Laval Holding AB group in connection with the acquisition by Industri Kapital of the Alfa Laval Group from Tetra Laval on August 24, 2000 is shown on the first row.
“Other” relates to step up values from 2000 for “Technology” SEK 1,280 million that has been fully amortised, for “Research and development” SEK 54 million and “Capital gain (Industrial Flow)” SEK 42 million that have been fully realised and for “Construction in process” SEK 16 million that has been transferred to “Machinery”.
Acquisition of businesses
During 2009On September 1, 2009 Alfa Laval acquired 90 percent of the shares in LHE Co., Ltd in South Korea – a leading heat exchanger company in South Korea. The company targets the compact plate heat exchanger market. LHE will continue to offer its own product range, under the LHE brand, through its own sales network. The purchase price is SEK 1,084 million, out of which SEK 1,014 million has been paid in cash and the rest is retained for a period of 1–2 years. The costs directly linked to the acquisition (fees to lawyers, due diligence and assisting counsel) come in addition to this and have amounted to SEK 2 million. The impact on the cash flow was thus SEK -1,016 million. Out of the difference between the purchase price paid and the net assets acquired SEK 297 million was allocated to patents and
un-patented know-how and SEK 298 million was allocated to the LHE trademark, while the residual SEK 347 million was allocated to goodwill. The goodwill is relating to estimated synergies in procurement, logistics and corporate overheads and LHE’s ability to over time recreate its intangible assets. The value of the goodwill is still preliminary. The step up value for patents and un-patented know-how as well as the step up value for the trademark are amortised over 10 years. LHE’s net sales and adjusted EBITA for 2009 from the date of the acquisition are SEK 235 million and SEK 89 million respectively. If LHE had been acquired at January 1, 2009 the corresponding figures would have been SEK 593 million and SEK 168 million respectively. At the end of 2009 the number of employees was 180.
On August 14, 2009 Alfa Laval acquired PHE Indústria e Comércio de Equipamentos Ltda in Brazil, a company that services plate heat exchangers in a variety of industries. It will be integrated into Tranter. The company is consolidated in the Alfa Laval Group from August 1, 2009. In addition, on February 22, 2009 Alfa Laval acquired another minor business in Latin America that also will be integrated in Tranter. These businesses are presented together. The purchase price is SEK 64 million, out of which SEK 55 million has been paid in cash and the rest is retained for a period of 1–2 years. The costs di-rectly linked to the acquisition (fees to lawyers, due diligence and assisting counsel) come in addition to this and have amounted to SEK 0 million. The impact on the cash flow was thus SEK -55 million. Out of the difference be-tween the purchase price paid and the net assets acquired SEK 20 million

101B
oard of D
irectors’ Report
Consolidated
cash flow
sC
onsolidated
comprehensive incom
eC
onsolidated
financial positionC
hanges in consolidated equity
Parent com
pany cash flow
sP
arent company
income
Parent com
pany financial position
Changes in parent com
pany equityN
otes to the financial statem
entsO
bjectives, policies and
processes for managing capital
Financial risks
Operational
risksN
otes P
roposed disposition of earnings
Audit
Report
was allocated to trademark, while the residual SEK 16 million was allocated to goodwill. The goodwill is relating to estimated synergies in procurement, logistics and corporate overheads and the companies’ ability to over time recreate their intangible assets. The value of the goodwill is still preliminary. The step up value for the trademark is amortised over 20 years. The companies’ net sales and adjusted EBITA for 2009 from the date of the acquisition are SEK 25 million and SEK 7 million respectively. If the companies had been acquired at January 1, 2009 the corresponding figures would have been SEK 44 million and SEK 15 million respectively. At the end of 2009 the number of employees was 45.
The public offer to purchase an additional 13 percent of Alfa Laval (India) Ltd opened on January 14, 2009 and closed on February 2, 2009. The initial offer of 950 rupees per share was raised to 1,000 rupees per share on January 20, 2009. The result of the offer was that owners of almost 2.2 million shares corresponding to approximately 12 percent of the total number of shares accepted to sell their shares. This means that the ownership in the Indian subsidiary has increased from 76.7 percent to 88.8 percent.
The total cost for the acquisition was SEK 367 million. The costs directly linked to the acquisition of the shares (fees to bankers, lawyers and assisting counsel) came in addition to this and amounted to SEK 9 million. The impact on the cash flow was thus SEK -376 million. Out of the difference between the purchase price paid and the net assets acquired of SEK 311 million all was allocated to goodwill. The goodwill is relating to estimated synergies in procurement, logistics and corporate overheads. The acquisition only had an impact on the minority’s part of the consolidated net income and equity.
On February 1, 2009 Alfa Laval acquired HES GmbH Heat Exchanger Systems in Germany, a company with focus on spiral heat exchangers mainly to the process industry. The company will be integrated into Tranter. The purchase price is SEK 108 million, out of which SEK 86 million has been paid in cash and the rest is retained for a period of 1-3 years. The costs directly linked to the acquisition (fees to lawyers, due diligence and assisting counsel) come in addition to this and have amounted to SEK 4 million. The impact on the cash flow was thus SEK -90 million. Out of the difference between the purchase price paid and the net assets acquired SEK 83 million was allocated to patents and un-patented know-how, while the residual SEK 59 million was allocated to goodwill. The goodwill is relating to estimated synergies in pro-curement, logistics and corporate overheads and HES’s ability to over time recreate its intangible assets. The value of the goodwill is still preliminary. The step up value for patents and un-patented know-how is amortised over 10 years. HES’s net sales and adjusted EBITA for 2009 from the date of the acquisition are SEK 90 million and SEK 22 million respectively. If HES had been acquired at January 1, 2009 the corresponding figures would have been SEK 99 million and SEK 20 million respectively. At the end of 2009 the number of employees was 47.
On January 16, 2009 Alfa Laval acquired Onnuri Industrial Machinery Co., Ltd, a South Korean system provider to the shipbuilding and diesel power markets. Onnuri will remain a separate company as it will continue to offer its own systems under the Onnuri brand. The company is consolidated in the Alfa Laval Group from January 1, 2009. The purchase price is SEK 131 million, out of which SEK 105 million has been paid in cash and the rest is retained for a period of 2 years. The costs directly linked to the acquisition (fees to lawyers, due diligence and assisting counsel) come in addition to this and have amounted to SEK 2 million. The impact on the cash flow was thus SEK -107 million. Out of the difference between the purchase price paid and the net assets acquired SEK 40 million was allocated to patents and un-patented know-how and SEK 39 million was allocated to the Onnuri trademark, while the residual SEK 48 million was allocated to goodwill. The goodwill is relating to estimated synergies in procurement, logistics and cor-porate overheads and Onnuri’s ability to over time recreate its intangible assets. The value of the goodwill is still preliminary. The step up value for patents and un-patented know-how as well as the step up value for the trademark are amortised over 10 years. Onnuri’s net sales and adjusted EBITA for 2009 from the date of the acquisition are SEK 81 million and SEK 23 million re-spectively. The figures for the full year 2009 are identical. At the end of 2009 the number of employees was 42.
On January 14, 2009 Alfa Laval announced that it had acquired one company and signed an agreement to acquire another, both major providers of parts and service for a variety of products, applications and geographical areas. Both companies will remain separate organisations as they continue to offer their own products and services to the industry, under their own brands. One company is consolidated in the Alfa Laval Group from January 1, 2009 and the other company from January 30, 2009. These businesses are presented together. The purchase price is SEK 526 million, out of which SEK 503 million has been paid in cash and the rest is retained for a period of 1–2 years. The costs directly linked to the acquisition (fees to lawyers, due diligence and assisting counsel) come in addition to this and have amounted to SEK 6 million. After deducting acquired cash and bank the im-pact on the cash flow was thus SEK -503 million. Out of the difference be-tween the purchase price paid and the net assets acquired SEK 291 million was allocated to trademarks, while the residual SEK 189 million was allocated to goodwill. The goodwill is relating to estimated synergies in procurement, logistics and corporate overheads and the companies’ ability to over time
recreate their intangible assets. The value of the goodwill is still preliminary. The step up value for the trademarks is amortised over 10 years. The companies’ net sales and adjusted EBITA for 2009 from the date of the acquisition are SEK 245 million and SEK 34 million respectively. If both companies had been acquired at January 1, 2009 the corresponding figures would have been SEK 258 million and SEK 34 million respectively. At the end of 2009 the number of employees was 133.
In addition yet three minor acquisitions have been made during 2009:On February 4, 2009 Alfa Laval acquired the Polish company Termatrans
that has been acting as Tranter’s distributor in Poland. It will be integrated into Tranter. The purchase price is SEK 20 million, out of which SEK 17 million has been paid in cash and the rest is retained for a period of 1–2 years. The costs directly linked to the acquisition (fees to lawyers, due diligence and assisting counsel) come in addition to this and have amounted to SEK 1 million. The impact on the cash flow was thus SEK -18 million. Out of the difference between the purchase price paid and the net assets acquired SEK 7 million was allocated to the Termatrans trademark, while the residual SEK 6 million was allocated to goodwill. The goodwill is relating to estimated synergies in procurement, logistics and corporate overheads and Termatrans’ ability to over time recreate its intangible assets. The value of the goodwill is still preliminary. The step up value for the trademark is amortised over 10 years. Termatrans’ net sales and adjusted EBITA for 2009 from the date of the acquisition are SEK 12 million and SEK 5 million respectively. If Termatrans had been acquired at January 1, 2009 the corresponding figures would have been SEK 18 million and SEK 5 million respectively. At the end of 2009 the number of employees was 16.
On July 15, 2009 Alfa Laval acquired the assets in the Danish company ISO-MIX A/S. The business has been integrated into the Danish company Alfa Laval Tank Equipment A/S. The purchase price is SEK 34 million, out of which SEK 9 million has been paid in cash and the rest is retained for a period of 1–6 years. The costs directly linked to the acquisition (fees to lawyers, due diligence and assisting counsel) come in addition to this and have amounted to SEK 0 million. The impact on the cash flow was thus SEK -9 million. Out of the difference between the purchase price paid and the net assets acquired SEK 22 million was allocated to patents and un-patented know-how. The step up value for patents and un-patented know-how is amortised over 10 years. The net sales and adjusted EBITA of the business for 2009 from the date of the acquisition are SEK 1 million and SEK -3 million respectively. If the business had been acquired at January 1, 2009 the corresponding figures would have been the same. At the end of 2009 the number of employ-ees was 4.
On November 9, 2009 Alfa Laval acquired the remaining 9 percent of the Indian company MCD Nitrile India Pvt Ltd, which thereby became a wholly owned subsidiary. The purchase price is SEK 1 million. This has not affected the original goodwill. The impact on the cash flow was SEK -1 million.
Payment of retained parts of the purchase price from previous acquisitions constitutes the remaining part of the cash flow related to acquisition of businesses.
During 2008On August 15, 2008 Alfa Laval acquired the US company Hutchison Hayes Separation, which is a leading provider of separation equipment, parts and services, mainly to the US energy related industries. Hutchison Hayes will operate as a separate organisation and adds a complementary channel for centrifugal separation equipment and service, primarily to the energy related industries in the US. The purchase price is SEK 227 million, out of which all has been paid in cash. The costs directly linked to the acquisition (fees to lawyers, due diligence and assisting counsel) come in addition to this and have amounted to SEK 3 million. The impact on the cash flow was thus SEK -230 million. Out of the difference between the purchase price paid and the net assets acquired SEK 95 million was allocated to patents and un-patented know-how, SEK 49 million was allocated to the Hutchison Hayes Separation trademark and SEK 1 million to accrued gross margin in work in progress, while the residual SEK 46 million was allocated to goodwill. The good-will is relating to estimated synergies in procurement, logistics and corporate overheads and Hutchison Hayes Separation’s ability to over time recreate its intangible assets. The value of the goodwill has been finalised in 2009. The step up value for patents and un-patented know-how as well as the step up value for the trademark are amortised over 10 years. The step up for accrued gross margin in work in progress was expensed during 2008. Hutchison Hayes Separation’s net sales and adjusted EBITA for 2008 from the date of the acquisition are SEK 66 million and SEK 10 million respectively. If Hutchison Hayes Separation had been acquired at January 1, 2008 the corresponding figures would have been SEK 139 million and SEK 26 million respectively.
On July 31, 2008 Alfa Laval acquired the German company Pressko AG, which is specialized in developing and manufacturing fully welded heat ex-changers. Pressko AG will be integrated into Tranter, which is a separate or-ganisation within the Alfa Laval Group. The purchase price is SEK 80 million, out of which SEK 68 million has been paid in cash and the rest is retained for a period of 1–2 years. The costs directly linked to the acquisition (fees to lawyers, due diligence and assisting counsel) come in addition to this and have amounted to SEK 4 million. The impact on the cash flow was thus SEK -72 million. Out of the difference between the purchase price paid and
Notes

102 Alfa Laval Annual Report 2009 / Financial statements
the net assets acquired SEK 1 million was allocated to accrued gross margin in work in progress, while the residual SEK 69 million was allocated to goodwill. The goodwill is relating to estimated synergies in procurement, logistics and corporate overheads. The value of the goodwill has been finalised in 2009. The step up for accrued gross margin in work in progress was expensed during 2008. Pressko’s net sales and adjusted EBITA for 2008 from the date of the acquisition are SEK 18 million and SEK 5 million respectively. If Pressko had been acquired at January 1, 2008 the corresponding figures would have been SEK 44 million and SEK 7 million respectively.
On June 13, 2008 Alfa Laval acquired about 44 percent of the Swedish company Ageratec that develops innovative process solutions for the biodiesel industry. On December 29 Alfa Laval increased its ownership to about 68 percent and Ageratec became a subsidiary. The purchase price is SEK 50 million in cash. The costs directly linked to the acquisition (fees to lawyers, due diligence and assisting counsel) come in addition to this and have amounted to SEK 1 million. After deducting acquired cash and bank the im-pact on the cash flow was SEK -39 million. Out of the difference between the purchase price paid and the net assets acquired of SEK 44 million all was allocated to goodwill. The goodwill is relating to estimated synergies in procurement, logistics and corporate overheads and Ageratec’s ability to over time recreate its intangible assets. The value of the goodwill has been fi-nalised in 2009. Ageratec’s net sales and adjusted EBITA for 2008 from the date of the original acquisition when the company became an associated company until it became a subsidiary are SEK 46 million and SEK -8 million respectively. Ageratec’s net sales and adjusted EBITA for 2008 from the date when the company became a subsidiary are SEK 0 million and SEK 0 million respectively. If Ageratec had been acquired at January 1, 2008 the correspond-ing figures would have been SEK 58 million and SEK -18 million respectively.
On June 1, 2008 Alfa Laval acquired the US company Standard Refriger-ation, a leading supplier of shell-and-tube heat exchangers for a variety of refrigeration, air-conditioning and industrial applications in the North American market. Standard Refrigeration will be integrated into Alfa Laval in order to capture synergies such as a wider product portfolio combined with an en-hanced market presence. The purchase price is SEK 369 million, out of which SEK 351 million has been paid in cash and the rest is retained for a period of 18 months. The costs directly linked to the acquisition (fees to lawyers, due diligence and assisting counsel) come in addition to this and have amounted to SEK 4 million. After deducting acquired cash and bank the impact on the cash flow was SEK -350 million. Out of the difference between the purchase price paid and the net assets acquired SEK 166 million was allocated to patents and un-patented know-how and SEK 5 million to accrued gross margin in work in progress, while the residual SEK 152 million was allocated to goodwill. The goodwill is relating to estimated synergies in procurement, logistics and corporate overheads and Standard Refrigeration’s ability to over time recreate its intangible assets. The value of the goodwill has been finalised in 2009. The step up value for patents and un-patented know-how is amortised over 10 years. The step up for accrued gross margin in work in progress was expensed during 2008. Standard Refrigeration’s net sales and adjusted EBITA for 2008 from the date of the acquisition are SEK 140 million and SEK 34 million respectively. If Standard Refrigeration had been acquired at January 1, 2008 the corresponding figures would have been SEK 249 million and SEK 51 million respectively.
On February 11, 2008 Alfa Laval acquired the Danish company Høyer Promix A/S. The company develops, produces and markets agitators mainly for the food and pharma industry. The company has been merged into Alfa Laval Tank Equipment A/S. The purchase price is SEK 19 million in cash. The costs directly linked to the acquisition (fees to lawyers, due diligence and assisting counsel) come in addition to this and have amounted to SEK 0 million. After deducting acquired cash and bank the impact on the cash flow was SEK -19 million. Out of the difference between the purchase price paid and the net assets acquired of SEK 16 million all was allocated to goodwill. The goodwill is relating to estimated synergies in procurement, logistics and corporate overheads. The value of the goodwill has been finalised in 2009. The company’s net sales and adjusted EBITA for 2008 from the date of the acquisition are SEK 14 million and SEK 3 million respectively. If the company had been acquired at January 1, 2008 the corresponding figures would have been SEK 16 million and SEK 3 million respectively.
In addition two minor acquisitions have been made during 2008:On September 1, 2008 Alfa Laval acquired the business in the Swedish
company P&D’s Plattvärmeväxlarservice AB that performs service on heat exchangers. The purchase price is SEK 10 million, out of which 3 million has been paid in cash and the rest is retained for a period of 1–2 years. The costs directly linked to the acquisition (fees to lawyers, due diligence and assisting counsel) come in addition to this and have amounted to SEK 0 million. The impact on the cash flow was thus SEK -3 million. Out of the difference between the purchase price paid and the net assets acquired of SEK 10 million all has been allocated to goodwill. The goodwill is relating to estimated synergies in procurement, logistics and corporate overheads. The value of the goodwill has been finalised in 2009. The company’s net sales and adjusted EBITA for 2008 from the date of the acquisition are SEK 3 million and SEK 1 million respectively. If the company had been acquired at January 1,
2008 the corresponding figures would have been SEK 12 million and SEK 4 million respectively.
On April 1, 2008 Alfa Laval acquired 91 percent of the Indian company Nitrile India Pvt Ltd that manufactures rubberized gaskets mainly for the food processing industry. The acquisition is part of Alfa Laval’s double branding strategy and the company has thus been renamed to MCD Nitrile India Pvt Ltd. The company has 12 employees and 15-20 temporary employees. The purchase price is SEK 7 million in cash. The costs directly linked to the ac-quisition (fees to lawyers, due diligence and assisting counsel) come in addi-tion to this and have amounted to SEK 0 million. The impact on the cash flow was SEK -7 million. Out of the difference between the purchase price paid and the net assets acquired of SEK 6 million all was allocated to good-will. The goodwill is relating to estimated synergies in procurement, logistics and corporate overheads. The value of the goodwill has been finalised in 2009. The company’s net sales and adjusted EBITA for 2008 from the date of the acquisition are SEK 1 million and SEK 0 million respectively. If Nitrile India Pvt Ltd had been acquired at January 1, 2008 the corresponding figures would have been SEK 1 million and SEK 0 million respectively.
During 2007On December 1, 2007 Alfa Laval finalized the acquisition of the Finnish company Fincoil. The acquisition of Fincoil is in line with Alfa Laval’s strategy to expand the presence in the European air heat exchanger market. The company has 150 employees. Fincoil has a well-established position in the Nordic countries, the Baltic countries and Russia. Approximately 80 percent of the sales are exported. Fincoil has one manufacturing site outside Helsinki in Finland. The intention is to fully integrate Fincoil into Alfa Laval. The purchase price was SEK 474 million in cash. The costs directly linked to the acquisition (fees to lawyers, due diligence and assisting counsel) came in addition to this and amounted to SEK 5 million. After deducting acquired cash and bank the impact on the cash flow was SEK -470 million. Out of the difference between the purchase price paid and the net assets acquired SEK 233 million was allocated to patents and un-patented know-how, while the residual SEK 228 million was allocated to goodwill. The goodwill is relating to estimated synergies in procurement, logistics and corporate overheads and Fincoil’s ability to over time recreate its intangible assets. The value of the goodwill has been finalised in 2008, which meant an increase from SEK 228 million to SEK 241 million. The step up value for patents and un-patented know-how is amortised over 10 years. Fincoil’s net sales and adjusted EBITA for 2007 from the date of the acquisition were SEK 26 million and SEK 2 million respectively. If Fincoil had been acquired at January 1, 2007 the correspond-ing figures would have been SEK 348 million and SEK 43 million respectively.
On July 2, 2007 Alfa Laval acquired the American company AGC Engi-neering through an asset deal. The company provides sanitary plate heat exchanger service and equipment to the dairy and food processing industries. AGC has 65 employees. The acquisition adds a complementary channel for sanitary plate heat exchangers to the dairy and food processing industries mainly in the USA. This applies to new units as well as parts and service. AGC will not be integrated into Alfa Laval. The two organizations will go to market independently of each other according to a multi-brand strategy. The purchase price was SEK 42 million in cash. The costs directly linked to the acquisition (fees to lawyers, due diligence and assisting counsel) came in addition to this and amounted to SEK 0 million. After deducting acquired cash and bank the impact on the cash flow was SEK -42 million. Out of the difference between the purchase price paid and the net assets acquired SEK 12 million was allocated to the AGC trademark, while the residual SEK 9 million was allocated to goodwill. The goodwill is relating to estimated synergies in procurement, logistics and corporate overheads and AGC’s ability to over time recreate its intangible assets. The value of the goodwill has been finalised in 2008, which meant an increase from SEK 9 million to SEK 20 million. The step up value for the trademark is amortised over 10 years. AGC’s net sales and adjusted EBITA for 2007 from the date of the ac-quisition were SEK 39 million and SEK 4 million respectively. If AGC had been acquired at January 1, 2007 the corresponding figures would have been SEK 78 million and SEK 8 million respectively.
Through a public offer that closed on May 26, 2007 Alfa Laval increased the ownership in the Indian subsidiary Alfa Laval (India) Ltd with 12.6 percent to 76.7 percent. The total cost for the acquisition was SEK 486 million. The costs directly linked to the acquisition of the shares (fees to bankers, lawyers and assisting counsel) came in addition to this and amounted to SEK 11 million. The impact on the cash flow was SEK -497 million. Out of the difference be-tween the purchase price paid and the net assets acquired of SEK 441 million all was allocated to goodwill. The goodwill is relating to estimated synergies in procurement, logistics and corporate overheads. The acquisition only had an impact on the minority’s part of the consolidated net income and equity.
On April 4, 2007 Alfa Laval acquired the Dutch company Helpman. Help-man is a leading company in the European market for air heat exchangers used in the sensitive logistical chain for food, i.e. refrigeration and temperature control to secure the final quality of the products. Helpman has 130 employees within R&D, sales and at two manufacturing units, in Groningen, the Netherlands and in Sofia, Bulgaria. The intention is to fully integrate Helpman into Alfa Laval.

103B
oard of D
irectors’ Report
Consolidated
cash flow
sC
onsolidated
comprehensive incom
eC
onsolidated
financial positionC
hanges in consolidated equity
Parent com
pany cash flow
sP
arent company
income
Parent com
pany financial position
Changes in parent com
pany equityN
otes to the financial statem
entsO
bjectives, policies and
processes for managing capital
Financial risks
Operational
risksN
otes P
roposed disposition of earnings
Audit
Report
The purchase price was SEK 136 million, out of which SEK 113 million was paid in cash and the rest is retained for a period of 1–2 years. The costs directly linked to the acquisition (fees to lawyers, due diligence and assisting coun-sel) came in addition to this and amounted to SEK 4 million. After deducting acquired cash and bank the impact on the cash flow was SEK -111 million. Out of the difference between the purchase price paid and the net assets acquired SEK 5 million was allocated to properties and SEK 36 million was allocated to patents and un-patented know-how, while the residual SEK 11 million was allocated to goodwill. The goodwill is relating to estimated syner-gies in procurement, logistics and corporate overheads and Helpman’s abil-ity to over time recreate its intangible assets. The purchase price allocation has been finalised in 2008 which means that the step up value for properties increased from SEK 5 million to SEK 9 million, that SEK 8 million was allocated to step up value in land and that the value of the goodwill was decreased from SEK 11 million to SEK 4 million. The step up value for properties is de-preciated over 33 years, the step up value for land is not depreciated and the step up value for patents and un-patented know-how is amortised over 10 years. Helpman’s net sales and adjusted EBITA for 2007 from the date of the acquisition were SEK 136 million and SEK 5 million respectively. If Helpman had been acquired at January 1, 2007 the corresponding figures would have been SEK 178 million and SEK 6 million respectively.
On March 16, 2007 Alfa Laval acquired the American company DSO Fluid Handling. The acquisition strengthens Alfa Laval’s position within sani-tary processing industries in the US. DSO is a supplier of predominantly parts for pumps and valves and adds a complementary channel for replace-ment parts. In line with Alfa Laval’s multi-brand strategy, DSO will continue to sell its products under its own brand. DSO has 20 employees and is based in Irvington (Newark), New Jersey USA. The purchase price was SEK 74 million, out of which SEK 62 million was paid in cash and the rest is re-tained for a period of 1-2 years. The costs directly linked to the acquisition (fees to lawyers, due diligence and assisting counsel) came in addition to this and amounted to SEK 1 million. After deducting acquired cash and bank the impact on the cash flow was SEK -62 million. Out of the difference between the purchase price paid and the net assets acquired SEK 39 mil-lion was allocated to the DSO trademark, while the residual SEK 29 million was allocated to goodwill. The goodwill is relating to estimated synergies in procurement, logistics and corporate overheads and DSO’s ability to over time recreate its intangible assets. The value of the goodwill has been final-ised in 2008, which meant an increase from SEK 29 million to SEK 42 mil-lion. The step up value for the trademark is amortised over 10 years. DSO’s net sales and adjusted EBITA for 2007 from the date of the acquisition were SEK 39 million and SEK 12 million respectively. If DSO had been acquired at January 1, 2007 the corresponding figures would have been SEK 51 million and SEK 16 million respectively.
During the beginning of 2007 a transaction was made as a consequence of the acquisition of Tranter where SEK 17 million was paid to buy out the agent in Taiwan and thereby achieve full control over Tranter’s company in China. This transaction is seen as a part of the acquisition of Tranter and has influenced the final purchase price allocation for this acquisition.
Impairment testingAn impairment test has been performed at the end of 2009 indicating that there is not any need to write down the goodwill.
Two of Alfa Laval’s operating segments, the two divisions “Equipment” and “Process Technology” have been identified as the cash-generating units within Alfa Laval. Technically a recently acquired business activity could be followed independently during an initial period, but acquired businesses are normally integrated into the divisions at a fast rate. This means that the inde-pendent traceability is lost fairly soon and then any independent measure-ment and testing becomes impracticable. Although Tranter is operating as a separate sales channel it is subject to a considerable co-ordination related to purchasing and some support functions.
The net present value is based on the projected EBITDA figures for the next twenty years, less projected investments and changes in operating capital during the same period. This projection for the coming 20 years is based on the following components:
– The projection for 2010 is based on the Groups normal 12 month revolving ”Forecast” reporting. This is based on a very large number of rather detailed assumptions throughout the organisation concerning the business cycle, volume growth, market initiatives, product mix, currency rates, cost development, cost structure, R&D etc.
– The projection for the years 2011 and 2012 is based on Management’s general assumptions concerning the business cycle, volume growth, market initiatives, product mix, currency rates, cost development, cost structure, R&D etc.
– The projection for the years 2013 to 2029 is based on the perceived expected average industry growth rate.
The reason why a longer period than 5 years has been used for the calculation of the net present value is that Management considers 5 years to
be a too short period for an operation where applying going concern thinking can be justified.
The assumptions used for the projections reflect past experiences or in-formation from external sources.
The used discount rate is the pre-tax weighted average cost of capital (WACC) of 10.93 (9.35) (10.74) percent.
Alfa Laval does not have any intangible assets with indefinite useful lives other than goodwill.
The two cash-generating units have been allocated the following amounts of goodwill:
Goodwill
Consolidated
SEK millions 2009 2008
Equipment 3,529 2,987
Process Technology 2,614 2,396
Total 6,143 5,383
Note 18. Intangible non-current assets
Concessions, patents, licenses, trademarks and similar rights
Consolidated
SEK millions 2009 2008
Accumulated acquisition values
Opening balance 3,897 3,125
Purchases 11 8
Acquisition of businesses 31 234
Sales/disposals – -227
Reclassifications -207 0
Step-up values, patents and trademarks 1,097 373
Translation difference -168 384
Closing balance 4,661 3,897
Accumulated amortisation
Opening balance -2,011 -1,854
Acquisition of businesses -16 0
Sales/disposals – 227
Reclassifications -12 –
Amortisation of step-up value, patent & trademarks -216 -119
Amortisation of step-up value, technology 0 -30
Amortisation for the year -17 -11
Translation difference 97 -224
Closing balance -2,175 -2,011
Closing balance, net book value 2,486 1,886
Goodwill
Consolidated
SEK millions 2009 2008
Accumulated acquisition values
Opening balance 6,002 5,008
Goodwill in connection with acquisition of businesses 976 373
Translation difference -241 621
Closing balance 6,737 6,002
Accumulated amortisation
Opening balance -619 -549
Translation difference 25 -70
Closing balance -594 -619
Closing balance, net book value 6,143 5,383
Notes

104 Alfa Laval Annual Report 2009 / Financial statements
Renting rights and similar rights
Consolidated
SEK millions 2009 2008
Accumulated acquisition values
Opening balance 7 6
Purchases 2 0
Translation difference -1 1
Closing balance 8 7
Accumulated amortisation
Opening balance -3 -2
Amortisation for the year -1 -1
Translation difference 0 0
Closing balance -4 -3
Closing balance, net book value 4 4
Note 19. Property, plant and equipment
Real estate
Consolidated
SEK millions 2009 2008
Accumulated acquisition values
Opening balance 2,022 1,733
Purchases 62 78
Acquisition of businesses 103 25
Sales/disposal -5 -58
Reclassifications -153 30
Step-up values, real estate – 12
Realisation of step-up values due to sale – -34
Translation difference 83 236
Closing balance 2,112 2,022
Accumulated depreciation
Opening balance -857 -723
Sales/disposals 2 25
Acquisition of businesses -7 4
Reclassifications 55 -4
Realisation of step-up values due to sale – 12
Depreciation of step-up value -22 -22
Depreciation for the year -49 -48
Translation difference -11 -101
Closing balance -889 -857
Accumulated revaluations, net
Opening balance, 5 5
Depreciation for the year on revaluations 0 0
Translation difference 1 0
Closing balance 6 5
Closing balance, net book value 1,229 1,170
The tax assessment value of the Swedish real estate at December 31, 2009 amounted to SEK 185 (183) million, out of which SEK 45 (46) million referred to land and land improvements and SEK 140 (137) million to buildings. The book values of the Swedish real estate amounted to SEK 148 (154) million, out of which land and land improvements were SEK 30 (31) million and buildings SEK 118 (123) million.
Non-current assets held for saleWithin Alfa Laval these assets are normally relating to real estate. Two small properties in France are planned for sale. Both of the French properties are empty. One of them has been for sale for several years. None of them is expected to be sold within the next year. This means that no property has been re-classified as current assets held for sale. The situation was the same at the end of 2008.
Machinery and other technical installations
Consolidated
SEK millions 2009 2008
Accumulated acquisition values
Opening balance 3,689 3,035
Purchases 259 307
Acquisition of businesses 151 66
Sales/disposal -93 -117
Reclassifications 131 106
Translation difference -146 292
Closing balance 3,991 3,689
Accumulated depreciation
Opening balance -2,462 -2,129
Sales/disposals 84 102
Acquisition of businesses -79 -9
Reclassifications 131 -3
Depreciation of step-up value -60 -56
Depreciation for the year -211 -148
Translation difference -37 -219
Closing balance -2,634 -2,462
Closing balance, net book value 1,357 1,227
Equipment, tools and installations
Consolidated
SEK millions 2009 2008
Accumulated acquisition values
Opening balance 2,226 1,969
Purchases 94 174
Acquisition of businesses 39 66
Sales/disposal -76 -134
Reclassifications 39 -7
Translation difference -70 158
Closing balance 2,252 2,226
Accumulated depreciation
Opening balance -1,561 -1,416
Sales/disposals 69 130
Acquisition of businesses -23 -1
Reclassifications 2 4
Depreciation of step-up value -32 -29
Depreciation for the year -105 -93
Translation difference 54 -156
Closing balance -1,596 -1,561
Closing balance, net book value 656 665

105B
oard of D
irectors’ Report
Consolidated
cash flow
sC
onsolidated
comprehensive incom
eC
onsolidated
financial positionC
hanges in consolidated equity
Parent com
pany cash flow
sP
arent company
income
Parent com
pany financial position
Changes in parent com
pany equityN
otes to the financial statem
entsO
bjectives, policies and
processes for managing capital
Financial risks
Operational
risksN
otes P
roposed disposition of earnings
Audit
Report
Construction in progress and advances to suppliers concerning property, plant and equipment
Consolidated
SEK millions 2009 2008
Accumulated acquisition values
Opening balance 419 313
Purchases 23 180
Acquisition of businesses 14 –
Sales/disposal – -1
Reclassifications -298 -131
Translation difference -20 58
Closing balance 138 419
Closing balance, net book value 138 419
Leased real estate
Consolidated
SEK millions 2009 2008
Accumulated acquisition values
Opening balance 61 33
Purchases 88 20
Translation difference -4 8
Closing balance 145 61
Accumulated depreciation
Opening balance -3 -2
Depreciation for the year -4 -1
Translation difference -1 0
Closing balance -8 -3
Closing balance, net book value 137 58
Leased machinery
Consolidated
SEK millions 2009 2008
Accumulated acquisition values
Opening balance 10 8
Purchases 29 –
Translation difference 0 2
Closing balance 39 10
Accumulated depreciation
Opening balance -10 -8
Depreciation for the year -2 –
Translation difference 0 -2
Closing balance -12 -10
Closing balance, net book value 27 0
Leased equipment, tools and installations
Consolidated
SEK millions 2009 2008
Accumulated acquisition values
Opening balance 12 11
Purchases – 2
Acquisition of businesses – 1
Sales/disposal -2 -2
Translation difference -1 0
Closing balance 9 12
Accumulated depreciation
Opening balance -5 -5
Sales/disposals 1 2
Acquisition of businesses – -1
Reclassifications – 1
Depreciation for the year -2 -2
Translation difference 1 0
Closing balance -5 -5
Closing balance, net book value 4 7
Leased real estate, machinery and equipment relate to fixed assets which are leased and where the leasing agreement has been considered to be a financial lease. These financial leases are capitalised in the statement on financial position.
Note 20. Other non-current assets
Shares in subsidiaries and other companies
Consolidated Parent company
SEK millions 2009 2008 2009 2008
Shares in subsidiaries – – 4,669 4,669
Shares in other companies 39 18 – –
Total 39 18 4,669 4,669
The below specification of shares contains some simplifications, for instance in connection with ownership in multiple layers or when the ownership is split on several owners or at cross-holdings. This is in order not to unnecessarily burden the presentation. A complete specification of shares can be ordered by contacting Alfa Laval’s head office in Lund or via Bolagsverket.
Notes

106 Alfa Laval Annual Report 2009 / Financial statements
Specification of shares in subsidiaries
Company nameRegistration
number DomicileNumber
of sharesShare of
capital %Book value
SEK millions
Alfa Laval Holding AB 556587-8062 Lund, Sweden 8,191,000 100 4,461
Alfa Laval NV Maarssen, Netherlands 887,753 100 –
Alfa Laval Inc Newmarket, Canada 1,000,000 67 –
Alfa Laval S.A. DE C.V. Tlalnepantla, Mexico 45,057,057 100 –
Alfa Laval S.A. San Isidro, Argentina 1,223,967 95 –
Alfa Laval Ltda Sao Paulo, Brazil 21,129,068 100 –
Roston do Brasil Ltda Sao Paulo, Brazil 5,249 100 –
Alfa Laval S.A.C.I. Santiago, Chile 2,735 100 –
Alfa Laval S.A. Bogota, Colombia 12,195 100 –
Alfa Laval S.A. Lima, Peru 4,346,832 100 –
Alfa Laval Venezolana S.A. Caracas, Venezuela 10,000 100 –
Alfa Laval Oilfield C.A. Caracas, Venezuela 203 81 –
Alfa Laval Taiwan Ltd Taipei, Taiwan 1,499,994 100 –
Alfa Laval (China) Ltd Hong Kong, China 79,999 100 –
Alfa Laval (Jiangyin) Manufacturing Co Ltd Jiang Yin, China 100 –
Alfa Laval Flow Equipment (Kunshan) Co Ltd Jiangsu, China 75 –
Alfa Laval Flow Equipment (Kunshan) Co Ltd Jiangsu, China 25 –
Alfa Laval (Shanghai) Technologies Co Ltd Shanghai, China 100 –
Wuxi MCD Gasket Co Ltd Jiang Yin, China 100 –
Tranter Heat Exchangers (Beijing) Co Ltd Beijing, China 100 –
Alfa Laval Iran Ltd Teheran, Iran 2,199 100 –
Alfa Laval Industry (PVT) Ltd Lahore, Pakistan 119,110 100 –
Alfa Laval Philippines Inc Makati, Philippines 72,000 100 –
Alfa Laval Singapore Pte Ltd Singapore 5,000,000 100 –
Alfa Laval (Thailand) Ltd Bangkok, Thailand 792,000 100 –
Alfa Laval Middle East Ltd Nicosia, Cyprus 40,000 100 –
Alfa Laval Benelux NV/SA Brussels, Belgium 98,284 100 –
Alfa Laval Ltd Sofia, Bulgaria 100 100 –
Alfa Laval Slovakia S.R.O. Bratislava, Slovakia 1 –
Alfa Laval Spol S.R.O. Prague, Czech Republic 20 –
Alfa Laval HES S.R.O. Prague, Czech Republic 5 –
Alfa Laval Nordic OY Espoo, Finland 20,000 100 –
Alfa Laval Vantaa OY Vantaa, Finland 7,000 100 –
Alfa Laval Nederland B.V. Maarssen, Netherlands 10,000 100 –
Alfa Laval Benelux B.V. Maarssen, Netherlands 20,000 100 –
Alfa Laval Merco B.V. Hoofddorp, Netherlands 1,750 100 –
Helpman Capital BV Breda, Netherlands 35,578 100 –
Helpman Holding BV Naarden, Netherlands 80 100 –
Alfa Laval Sofia OOD Sofia, Bulgaria 450 90 –
Alfa Laval Groningen B.V. Groningen, Netherlands 15,885 100 –
Alfa Laval Holding A/S Oslo, Norway 520,000 100 –
PHE Holding AB 556306-2404 Lund, Sweden 2,500 100 –
Tranter Heat Exchangers Canada Inc Edmonton, Canada 100 100 –
Tranter Latin America S.A. de C.V. Queretaro, Mexico 49,999 100 –
Tranter Indùstria de Máquinas e Equipamentos Ltda Sao Paulo, Brazil 100 –
PHE Indústria e Comércio de Equipamentos Ltda Jundiai, Brazil 100 –
MCD Nitrile India Pvt Ltd Falta, India 2,432 9 –
Tranter India Pvt Ltd Poona, India 3,009,999 100 –
Alfa Laval Korea Ltd Seoul, South Korea 36,400 10 –
Alfa Laval Korea Holding Company Ltd Chungnam, South Korea 13,318,600 100 –
Alfa Laval Korea Ltd Seoul, South Korea 327,600 90 –
Onnuri Industrial Machinery Co. Ltd Masan, South Korea 100,000 100 –
LHE Co. Ltd Gim Hae, South Korea 4,104,000 90 –
LHE Incheon Co. Ltd Incheon, South Korea 400,000 100 –
Tranter Heat Exchangers Middle East (Cyprus) Ltd Nicosia, Cyprus 20,000 100 –
Tranter International AB 556559-1764 Vänersborg, Sweden 100,000 100 –
Ageratec AB 556662-3988 Norrköping, Sweden 1,963 72 –
Breezewind AB 556773-6532 Lund, Sweden 1,000 100 –
Alfa Laval Nordic AB 556243-2061 Tumba, Sweden 1,000 100 –
Alfa Laval Corporate AB 556007-7785 Lund, Sweden 13,920,000 100 –
Alfa Laval S.A. San Isidro, Argentina 64,419 5 –
Alfa Laval (India) Ltd Poona, India 16,120,281 89 –
Tranter India Pvt Ltd Poona, India 1 0 –
PT Alfa Laval Indonesia Jakarta, Indonesia 1,000 100 –
Alfa Laval (Malaysia) Sdn Bhd Shah Alam, Malaysia 10,000 100 –
Alfa Laval Kolding A/S Kolding, Denmark 100,000 100 –
Alfa Laval Nordic A/S Rödovre, Denmark 1 100 –
Alfa Laval Copenhagen A/S Söborg, Denmark 1 100 –
Alfa Laval Nakskov A/S Nakskov, Denmark 242,713 100 –
Alfa Laval Tank Equipment A/S Ishoej, Denmark 61 100 –

107B
oard of D
irectors’ Report
Consolidated
cash flow
sC
onsolidated
comprehensive incom
eC
onsolidated
financial positionC
hanges in consolidated equity
Parent com
pany cash flow
sP
arent company
income
Parent com
pany financial position
Changes in parent com
pany equityN
otes to the financial statem
entsO
bjectives, policies and
processes for managing capital
Financial risks
Operational
risksN
otes P
roposed disposition of earnings
Audit
Report
Specification of shares in subsidiaries
Company nameRegistration
number DomicileNumber
of sharesShare of
capital %Book value
SEK millions
Alfa Laval Nordic A/S Oslo, Norway 10,000 100 –
Termatrans Sp.z.o.o. Pruszków, Poland 2,000 100 –
AlfaWall AB 556723-6715 Botkyrka, Sweden 500 50 –
Alfa Laval Oilfield C.A. Caracas, Venezuela 47 19 –
Alfa Laval Treasury International AB 556432-2484 Lund, Sweden 50,000 100 –
Alfa Laval Europe AB 556128-7847 Lund, Sweden 500 100 –
Alfa Laval Lund AB 556016-8642 Lund, Sweden 100 100 –
Alfa Laval International Engineering AB 556039-8934 Lund, Sweden 4,500 100 –
Alfa Laval Tumba AB 556021-3893 Tumba, Sweden 1,000 100 –
Alfa Laval Dis Ticaret Ltd Sti Istanbul, Turkey 27,001,755 99 –
Alfa Laval SIA Riga, Latvia 125 100 –
Alfa Laval UAB Ltd Vilnius, Lithuania 2,009 100 –
Alfa Laval Australia Pty Ltd Homebush, Australia 2,088,076 100 –
Tranter Heat Exchanger Pty Ltd Sydney, Australia 600,000 100 –
Alfa Laval New Zeeland Pty Ltd Hamilton, New Zeeland 1,000 100 –
Alfa Laval Holding BV Maarssen, Netherlands 60,035,631 100 –
Alfa Laval (Pty) Ltd Isando, South Africa 2,000 100 –
Alfa Laval Slovakia S.R.O. Bratislava, Slovakia 99 –
Alfa Laval Spol S.R.O. Prague, Czech Republic 80 –
Alfa Laval HES S.R.O. Prague, Czech Republic 95 –
Alfa Laval France SAS Les Clayes, France 2,000,000 100 –
Alfa Laval SAS Les Clayes, France 560,000 92 –
Alfa Laval Moatti SAS Les Clayes, France 24,000 100 –
Alfa Laval Spiral SAS Nevers, France 79,999 100 –
MCD SAS Guny, France 71,300 100 –
Alfa Laval Vicarb SAS Grenoble, France 200,000 100 –
Canada Inc Newmarket, Canada 480,000 100 –
Alfa Laval Inc Newmarket, Canada 481,600 33 –
SCI du Companil Grenoble, France 32,165 100 –
Alfa Laval HES SA Lentilly, France 150,000 100 –
Alfa Laval SAS Les Clayes, France 46,700 8 –
Packinox SA Paris, France 178,010 100 –
Ziepack SA Paris, France 37,701 51 –
Tranter SAS Paris, France 100 –
Alfa Laval Holding GmbH Glinde, Germany 1 100 –
Alfa Laval Mid Europe GmbH Wiener Neudorf, Austria 100 –
Tranter Warmetauscher GmbH Guntramsdorf, Austria 100 –
Alfa Laval Mid Europe GmbH Glinde, Germany 1 100 –
Tranter GmbH Hildesheim, Germany 100 –
Tranter Pressko GmbH Artern, Germany 60,000 100 –
Tranter HES GmbH Schopfheim, Germany 2,500 100 –
Alfa Laval Mid Europe AG Dietlikon, Switzerland 647 100 –
Alfa Laval AEBE Holargos, Greece 807,000 100 –
Alfa Laval Kft Budapest, Hungary 1 100 –
Tranter Kft Budapest, Hungary 100 –
Alfa Laval SpA Monza, Italy 1,992,276 99 –
Tranter S.r.l. Monza, Italy 100 –
Alfa Laval Polska Sp.z.o.o. Warsaw, Poland 7,600 100 –
Cetetherm Polska Sp.z.o.o. Warsaw, Poland 5,109 100 –
Wytwornia Separator Krakow Sp.z.o.o. Krakow, Poland 80,080 100 –
Alfa Laval (Portugal) Ltd Linda-A-Velha, Portugal 1 –
Alfa Laval SRL Bucharest, Romania 38,566 100 –
Alfa Laval Iberia SA Madrid, Spain 99,999 100 –
Alfa Laval (Portugal) Ltd Linda-A-Velha, Portugal 1 99 –
Alfa Laval Holdings Ltd Camberley, UK 14,053,262 100 –
Alfa Laval 2000 Camberley, UK 28,106 100 –
Alfa Laval Ltd Camberley, UK 11,700,000 100 –
Alfa Laval Finance Co Ltd Camberley, UK 856,000 100 –
Rolls Laval Heat Exchangers Ltd Wolverhampton, UK 5,000 50 –
Tranter Ltd Doncaster, UK 10,000 100 –
Alfa Laval Dis Ticaret Ltd Sti Istanbul, Turkey 1 1 –
Notes

108 Alfa Laval Annual Report 2009 / Financial statements
Specification of shares in subsidiaries
Company nameRegistration
number DomicileNumber
of sharesShare of
capital %Book value
SEK millions
Alfa Laval USA Inc Richmond, Virginia, USA 1,000 100 –
Alfa Laval US Holding Inc Richmond, Virginia, USA 180 100 –
Alfa Laval Inc Richmond, Virginia, USA 44,000 100 –
Alfa Laval US Treasury Inc Richmond, Virginia, USA 1,000 100 –
DSO Fluid Handling Inc Irvington, New Jersey, USA 100 100 –
AGC Heat Transfer Inc Bristow, Virginia, USA 1,000 100 –
Tranter Inc. Wichita Falls, Texas, USA 1,000 100 –
MCD Gaskets Inc Richmond, Virginia, USA 100 100 –
Alfa Laval Autorad Inc Melrose Park, Illinois, USA 51 100 –
Hutchison Hayes Separation Inc Houston, Texas, USA 1,000 100 –
AO Alfa Laval Potok Koroljov, Russia 31,077,504 100 –
Alfa Laval Försäkrings AB 516406-0682 Lund, Sweden 50,000 100 –
Alfdex AB 556647-7278 Botkyrka, Sweden 500 50 –
Alfa Laval Support Services Pvt Ltd Poona, India 9,999 100 –
MCD Nitrile India Pvt Ltd Falta, India 24,593 91 –
Alfa Laval Ukraine Kiev, Ukraine 100 –
Alfa Laval SpA Monza, Italy 20,124 1 –
Alfa Laval KK Tokyo, Japan 1,200,000 100 208
Alfa Techno Service KK Kanagawa, Japan 200 100 –
Total 4,669
Specification of shares in other companies
Company name Domicile Number of shares Share of capital % Book value SEK thousands
Alfa Laval KKChugairo Japan 5,250 100Orugano Japan 769 37ADEKA Japan 15,354 981
LHE Co. Ltd.Viser South Korea 15,400 39 18,050KME South Korea 10,700 29.97 5,536Kenus South Korea 12.50 570
Alfa Laval Philippines IncPhilippine Long Distance Telephone Philippines 820 13
Alfa Laval Nordic OYAs Oy Koivulantie 7A Finland 1 320Suomen Talotekniikka KK Finland 10 31Helsinki Halli Finland 4 145
Alfa Laval Vantaa OYLänsi-Vantaan Tenniskeskus Finland 4 0Mikkelin Puhelin Oyj Finland 5 41
Alfa Laval France SASSEMACLA France 10 10
Alfa Laval HES SAThermothec France 9,130 0
Alfa Laval Benelux BVBordewes Netherlands 1 155
Helpman Holding BVHelpman Sofia OOD Bulgaria 500 49 11,659
Alfa Laval NVDalian Haven Automation Co Ltd China 102 42.5 920
Alfa Laval Nordic A/SStorebrand Norway 7,629 425
Alfa Laval Corporate ABEuropean Development CapitalCorporation (EDCC) N.V. Curacao 36,129 0Multiprogress Hungary 100 3.18 0Kurose Chemical Equipment Ltd Japan 180,000 11.25 0Poljopriveda former Yugoslavia 0Tecnica Argo-Industrial S.A. Mexico 490 49 0Adela Investment Co S.A. (preference) Luxembourg 1,911 0.30 0Adela Investment Co S.A. Luxembourg 1,911 0.30 0Mas Dairies Ltd Pakistan 125,000 5 0
Total 38,993

109B
oard of D
irectors’ Report
Consolidated
cash flow
sC
onsolidated
comprehensive incom
eC
onsolidated
financial positionC
hanges in consolidated equity
Parent com
pany cash flow
sP
arent company
income
Parent com
pany financial position
Changes in parent com
pany equityN
otes to the financial statem
entsO
bjectives, policies and
processes for managing capital
Financial risks
Operational
risksN
otes P
roposed disposition of earnings
Audit
Report
Note 21. Inventories
Type of inventory
Consolidated
SEK millions 2009 2008
Raw materials and consumables 1,800 2,358
Work in progress 1,373 1,564
Finished goods & goods for resale, new sales 891 1,382
Finished goods & goods for resale, spare parts 363 596
Advance payments to suppliers 58 72
Total 4,485 5,972
The provision for obsolescence amounts to and has changed as follows:
Obsolescence
Consolidated
SEK millions January 1Translation difference Acquired
New provisions and increase of existing
provisionsAmounts
used
Unused amounts reversed December 31
Year:
2008 537 47 9 339 -66 -45 821
2009 821 -20 – 440 -90 -46 1,105
The Group’s inventories have been accounted for after deduction for inter-company gains in inventory due to internal sales within the Group. The inter-com-pany profit reserve at the end of 2009 amounts to SEK 402 (480) million.
Note 22. Accounts receivable
Accounts receivable with a maturity exceeding one year of SEK 208 (171) million have not been accounted for as non-current assets as they are not intended for permanent use.
Accounts receivable are reported net of provisions for bad debts. The provision for bad debts amounts to and has changed as follows:
Bad Debts
Consolidated
SEK millions January 1Translation difference Acquired
New provisions and increase of existing
provisionsAmounts
used
Unused amounts reversed
Change due to discounting
December 31
Year:
2008 283 26 8 139 -141 -22 0 293
2009 293 -10 3 172 -51 -64 0 343
The amount of accounts receivable being overdue is an indication of the risk the company runs for ending up in bad debts. The percentage is in relation to the total amount of accounts receivable.
Accounts receivable – overdue
Consolidated
SEK millions 2009 % 2008 %
Overdue:
Maximum 30 days 433 10.5 663 11.6
More than 30 days but maximum 90 days 219 5.3 309 5.4
More than 90 days 390 9.5 331 5.8
Total 1,042 25.3 1,303 22.8
Notes

110 Alfa Laval Annual Report 2009 / Financial statements
Note 23. Other short-term receivables
Split on type and maturity
Consolidated
SEK millions 2009 2008
Notes receivable 379 446
Current tax asset 694 1,351
Financial leasing receivables 0 2
Other receivables 909 978
Total 1,982 2,777
Of which, not due within one year:
Notes receivable 2 5
Other receivables 49 47
Total 51 52
Note 24. Prepaid expenses and accrued income
Split on type
Consolidated
SEK millions 2009 2008
Prepaid expenses 124 147
Accrued income 24 17
Total 148 164
Note 25. Other current deposits
Split on type and maturity
Consolidated
SEK millions 2009 2008
Deposits with banks 76 452
Bonds and other securities 212 78
Other deposits 14 14
Total 302 544
Of which, not due within one year:
Deposits with banks 30 30
Other deposits 8 6
Total 38 36
Note 26. Cash and bank
The item cash and bank in the statement on financial position and in the cash-flow statement is mainly relating to bank deposits. Cash and bank includes a bank deposit in the publicly listed subsidiary Alfa Laval (India) Ltd of about SEK 59 (54) million. The company is not a wholly owned subsidiary of the Alfa Laval Group. It is owned to 88.8 (76.7) percent.
Note 27. Impact on cash-flow due to acquisition and sale of businesses
AcquisitionsFor a more detailed description of the acquisitions during the period 2009-2007, please see Note 17 or the section on acquisition of businesses in the Board of Directors’ report.
The total value of the acquired assets and liabilities is presented in the below tables, which also shows the cash flow impact of the acquisitions. All ac-quired assets and liabilities were reported according to IFRS at the time of the acquisition. With the exception of the acquisition of LHE in 2009 the many mi-nor acquisitions during 2009, 2008 and 2007 are reported together since a split per acquisition would have been too fragmented and rather would have bur-dened the presentation than increased clarity.
Acquisitions 2009
Consolidated
LHE Others Total
SEK millions Book valueAdjustment to
fair valueAdjusted fair
value Book valueAdjustment to
fair valueAdjusted fair
valueAdjusted fair
value
Property, plant and equipment 126 – 126 58 – 58 184
Intangible assets 6 595 601 15 502 517 1,118
Inventory 132 – 132 120 – 120 252
Accounts receivable 128 – 128 51 – 51 179
Other receivables 1 – 1 72 – 72 73
Liquid assets – – – 6 – 6 6
Accounts payable -43 – -43 -31 – -31 -74
Advance payments and other liabilities -55 – -55 -34 – -34 -89
Tax liabilities -9 – -9 -1 – -1 -10
Deferred tax – -142 -142 – -119 -119 -261
Acquired net assets 286 453 739 256 383 639 1,378
Goodwill 347 629 976
Purchase price -1,084 -1,246 -2,330
Costs directly linked to the acquisitions -2 -22 -24
Retained part of purchase price 70 101 171
Liquid assets in the acquired businesses – 6 6
Effect on the Group’s liquid assets -1,016 -1,161 -2,177

111B
oard of D
irectors’ Report
Consolidated
cash flow
sC
onsolidated
comprehensive incom
eC
onsolidated
financial positionC
hanges in consolidated equity
Parent com
pany cash flow
sP
arent company
income
Parent com
pany financial position
Changes in parent com
pany equityN
otes to the financial statem
entsO
bjectives, policies and
processes for managing capital
Financial risks
Operational
risksN
otes P
roposed disposition of earnings
Audit
Report
Acquisitions 2008
Consolidated
SEK millionsBook value
Adjustment to fair value
Adjusted fair value
Property, plant and equipment 69 – 69
Intangible assets 12 310 322
Inventory 95 7 102
Accounts receivable 69 – 69
Other receivables 9 – 9
Liquid assets 17 – 17
Other provisions -19 – -19
Accounts payable -24 – -24
Advance payments and other liabilities -97 – -97
Tax liabilities -11 – -11
Acquired net assets 120 317 437
Goodwill 343
Purchase price -768
Costs directly linked to the acquisitions -12
Retained part of purchase price 37
Liquid assets in the acquired businesses 17
Effect on the Group’s liquid assets -726
Notes
Acquisitions 2007
Consolidated
SEK millionsBook value
Adjustment to fair value
Adjusted fair value
Property, plant and equipment 61 5 66
Intangible assets 2 320 322
Inventory 99 – 99
Accounts receivable 134 – 134
Other receivables 77 – 77
Liquid assets 16 – 16
Other provisions -2 – -2
Accounts payable -61 – -61
Advance payments and other liabilities -23 – -23
Deferred tax – -75 -75
Acquired net assets 303 250 553
Goodwill 697
Purchase price -1,229
Costs directly linked to the acquisitions -21
Retained part of purchase price 35
Liquid assets in the acquired businesses 16
Effect on the Group’s liquid assets -1,199
Note 28. Defined benefit obligations
The Group has defined benefit commitments to employees and former employees and their survivors. The benefits are referring to old age pension, survivor’s pension, disability pension, health care and severance pay.
The defined benefit plans are in place in Austria, Belgium, Canada, France, Germany, India, Indonesia, Italy, Japan, Mexico, the Netherlands, Norway, Philippines, South Africa, Sweden, Taiwan, the United Kingdom and the United States. Most plans have been closed for new participants and replaced by defined contribution plans for new employees. The amounts reported as reclassified are referring to plans that have been reclassified between defined benefit plans and defined contribution plans under IAS 19.The following table presents how the net defined benefit liability is arrived at out of the present values of the different defined benefit plans, less the unrecognised actuarial losses, the unrecognised past service costs and the fair value of the plan assets.
If the net cumulative unrecognised actuarial gains and losses at the end of the previous year are outside a 10 percent corridor calculated on the greater of the present value of the defined benefit obligation or the fair value of the plan assets, then the excess is recognised over the remaining service period of the employees participating in the plan.
Net defined benefit liability
Consolidated
SEK millions 2009 2008 2007
Present value of defined benefit obligation, unfunded -934 -1,141 -889
Present value of defined benefit obligation, funded -2,838 -2,429 -2,607
Present value of defined benefit obligation at year end -3,772 -3,570 -3,496
Unrecognised actuarial losses 814 745 430
Unrecognised past service cost 8 1 7
Fair value of plan assets 2,166 1,974 2,288
Defined benefit liability -784 -850 -771
Less amount disallowed 0 0 0
(-) liability/(+) asset at December 31 -784 -850 -771

112 Alfa Laval Annual Report 2009 / Financial statements
The net plan cost for the defined benefit plans describes the different cost elements of the plans and the expected return on the plan assets. The net plan cost is reported in the comprehensive income statement on the lines where personnel costs are reported. The interest cost and the expected return are not part of the financial net, but instead just a way to categorize the components of the net plan cost.
Net plan cost
Consolidated
SEK millions 2009 2008 2007
Current service cost -37 -40 -45
Interest cost -193 -196 -178
Expected return on plan assets 124 162 141
Recognised actuarial losses -41 -24 -12
Recognised past service cost 0 0 0
Effect of any curtailments or settlements -21 23 26
(-) cost/(+) income -168 -75 -68
The following table presents how the present value of the defined benefit liability has changed during the year and lists the different components of the change.
Present value of defined benefit liability
Consolidated
SEK millions 2009 2008 2007
Present value of defined benefit liability at January 1 -3,570 -3,496 -4,154
Translation difference 123 -184 114
Current service cost -37 -40 -45
Interest cost -193 -196 -178
Employee contributions -6 -5 -5
Current year change in actuarial losses -270 129 548
Recognised past service cost 0 0 0
Effect of any curtailments or settlements -21 23 26
Benefit payments 202 199 198
(-) liability at December 31 -3,772 -3,570 -3,496
The following table presents how the fair value of the plan assets has developed during the year and lists the components of the change.
Fair value of plan assets
Consolidated
SEK millions 2009 2008 2007
Fair value of plan assets at January 1 1,974 2,288 2,280
Translation difference -46 47 -62
Employer contributions 186 152 203
Employee contributions 6 5 5
Actual return on plan assets 248 -319 60
Benefit payments -202 -199 -198
(+) asset at December 31 2,166 1,974 2,288
The table below presents how the net defined benefit liability has changed and the factors affecting the change.
Net defined benefit liability/asset
Consolidated
SEK millions 2009 2008 2007
Defined benefit liability/asset at January 1 -850 -771 -886
Reclassification / prior year adjustments – – -32
Translation difference 51 -128 17
Net plan cost -168 -75 -68
Employer contributions 186 152 203
Change in unrecognised actuarial gains/losses -3 -4 -24
Change in unrecognised past service cost 0 -24 16
Change in disallowed asset amount 0 0 3
(-) liability/(+) asset at December 31 -784 -850 -771

113B
oard of D
irectors’ Report
Consolidated
cash flow
sC
onsolidated
comprehensive incom
eC
onsolidated
financial positionC
hanges in consolidated equity
Parent com
pany cash flow
sP
arent company
income
Parent com
pany financial position
Changes in parent com
pany equityN
otes to the financial statem
entsO
bjectives, policies and
processes for managing capital
Financial risks
Operational
risksN
otes P
roposed disposition of earnings
Audit
Report
The gross plan assets and gross defined benefit liabilities of each plan are to be reported as a net amount. The following table shows how the net asset and the net liability are calculated.
Gross defined benefit liability/asset
Consolidated
SEK millions 2009 2008 2007
Assets
Fair value of plan assets 2,166 1,974 2,288
Less amount disallowed 0 0 0
2,166 1,974 2,288
Netting -2,030 -1,834 -2,182
Assets in statement on financial position 136 140 106
Liabilities
Present value of defined benefit obligation at year end -3,772 -3,570 -3,496
Unrecognised actuarial gains (less losses) 814 745 430
Unrecognised past service costs 8 1 7
-2,950 -2,824 -3,059
Netting 2,030 1,834 2,182
Provision in statement on financial position -920 -990 -877
The more significant average actuarial assumptions that have been used at the year-end are:
Actuarial assumptions
Consolidated
Percent 2009 2008 2007
Discount rate 6 6 5
Expected return on investment 9 9 6
Expected wage increase 4 4 4
Change in health care costs 8 9 9
Change of index for future increase of remunerations 4 4 4
Changes in the health care costs have a significant impact on the costs and the level of the obligations for defined benefit obligations. If the health care costs change by one percent, it gives the following profit and loss effect calculated on the conditions as of the end of the year:
Effects of change in health care costs
Consolidated
SEK millions 2009 2008
Change 1% increase 1% decrease 1% increase 1% decrease
Effect on:
Current service costs and interest costs -2 2 -7 6
Present value of the defined benefit obligation -47 41 -96 78
Notes

114 Alfa Laval Annual Report 2009 / Financial statements
The following table presents how the defined benefit pension schemes are distributed on different countries.
Regional split
Consolidated
SEK millions, unless otherwise statedUnited States
United Kingdom
Nether- lands Germany Norway Italy Belgium Other Total
Net defined benefit liability
Present value of the defined benefit obligation, unfunded -510 – -7 -172 – -55 – -190 -934
Present value of the defined benefit obligation, funded -901 -1,410 -216 – -108 – -74 -129 -2,838
Present value of the defined benefit obligation at year end -1,411 -1,410 -223 -172 -108 -55 -74 -319 -3,772
Unrecognised actuarial losses 355 370 37 11 34 0 16 -9 814
Unrecognised past service cost – – – – – – 0 8 8
Fair value of plan assets 665 1,047 216 – 88 – 52 98 2,166
Defined benefit liability -391 7 30 -161 14 -55 -6 -222 -784
Less amount disallowed 0 0 0 0 0 0 0 0 0
(-) liability/(+) asset -391 7 30 -161 14 -55 -6 -222 -784
Net plan cost -54 -36 -8 -13 -9 -2 -13 -33 -168
Sensitivity analysis
Increase in the present value of the defined obligations at Dec 31 at a decrease by 1 percent of the discount rate -105 -184 -32 -21 -21 -5 -7 -47 -422
Increase in the plan cost due to this * -7 -2 -4 -1 -5 -1 -1 -17 -38
Increase in the present value of the defined obligations at Dec 31 at a increase by 1 percent in medical costs -46 – – – – – – -1 -47
Increase in the plan cost due to this * -2 – – – – – – – -2
Increase in plan cost in 2010 if the plan assets decrease in value by 10 percent in 2009 * -9 -7 -1 – -1 – -1 -7 -26
Cost for actuarial services -2 0 0 0 -1 0 0 -1 -4
Number of participants in the plans at December 31
Current employees (active members) 633 205 139 25 33 – 59 2,408 3,502
Current employees (only vested value for closed plans) – – – – – 478 – 18 496
Former employees that are yet not pensioners 504 642 177 46 – – 25 4 1,398
Pensioners 1,957 525 57 323 43 – – 89 2,994
Total 3,094 1,372 373 394 76 478 84 2,519 8,390
Remaining service period
Average remaining service period for active members (years) 15 11 11 5 12 – 11 16 15
* all other things being equal

115B
oard of D
irectors’ Report
Consolidated
cash flow
sC
onsolidated
comprehensive incom
eC
onsolidated
financial positionC
hanges in consolidated equity
Parent com
pany cash flow
sP
arent company
income
Parent com
pany financial position
Changes in parent com
pany equityN
otes to the financial statem
entsO
bjectives, policies and
processes for managing capital
Financial risks
Operational
risksN
otes P
roposed disposition of earnings
Audit
Report
Note 29. Other provisions
Movement schedule
Consolidated
SEK millions January 1Translation difference Acquired
New provisions and increase of
existing provisionsAmounts
used
Unused amounts reversed December 31
2008
Claims & warranty 1,102 60 3 640 -468 -74 1,263
Deferred costs 159 21 – 99 -46 -35 198
Restructuring 98 0 – 255 -57 0 296
Onerous contracts 140 2 16 28 -56 – 130
Litigations 136 -1 – 45 -33 0 147
Other 175 19 – 183 -145 -14 218
Total 1,810 101 19 1,250 -805 -123 2,252
Of which:
current 1,401 1,849
non-current 409 403
2009
Claims & warranty 1,263 -25 – 521 -363 -136 1,260
Deferred costs 198 -11 – 128 -47 -27 241
Restructuring 296 -2 – 294 -185 -37 366
Onerous contracts 130 -2 – 38 -72 -1 93
Litigations 147 3 – 48 -21 -1 176
Other 218 -9 – 141 -99 -22 229
Total 2,252 -46 – 1,170 -787 -224 2,365
Of which:
current 1,849 1,926
non-current 403 439
Unused amounts reversed refer to, among other items, changed classifications and reversals of provisions made in prior years that have not been used.Each type of provision entails everything from a few up to a large number of different items. It is therefore not practicable or particularly meaningful to
specify the provisions item by item. As indicated above a clear majority of the provisions will result in disbursements within the next year. Claims & warranty refers to claims from customers according to the conditions in issued warranties. The claims concern technical problems with the
delivered goods or that promised performance has not been achieved. Deferred costs are partly costs that are known but not yet debited at the time of invoicing, partly costs that are unknown but expected at the time of
invoicing. The provision for deferred costs is charged to costs of goods sold in order to get a correct phasing of the gross margin. Provisions for restructuring are usually relating to closure of plants or closure or move of production lines, businesses, functions etc or reduction of the number of
employees in connection with a downturn in the business climate. The provisions for restructuring are affecting approximately 480 (920) employees.The provision for onerous contracts is relating to orders where a negative gross margin is expected. Provisions are made as soon as a final loss on the
order can be expected. This can in exceptional cases happen already at the time when the order is taken. Normally this provision is relating to larger and complex orders where the final margin is more uncertain.
The provision for litigations refers to ongoing or expected legal disputes. The provision covers expected legal costs and expected amounts for damages or settlements.Other refers to miscellaneous provisions that do not fall within any of the above categories.
Note 30. Borrowings and net debt
Net debt
Consolidated
SEK millions 2009 2008
Credit institutions 997 2,785
Private placement 794 856
Capitalised financial leases 154 58
Interest-bearing pension liabilities 2 2
Total debt 1,947 3,701
Cash, bank and current deposits -1,414 -1,627
Net debt 533 2,074
Cash, bank and current deposits include bank and other deposits in the publicly listed subsidiary Alfa Laval (India) Ltd of SEK 250 (111) million. The company is not a wholly owned subsidiary of the Alfa Laval Group. It is owned to 88.8 (76.7) percent.
The loans from credit institutions and the private placement are distributed among currencies as follows:
Notes
Maturity of loans by currency
Consolidated
Current Non-current
SEK millions 2009 2008 2009 2008
Currency:
CAD 10 11 – –
CNY 53 38 – –
DKK – – 16 8
EUR 49 73 747 1,723
INR 3 80 49 8
PLN – 7 – –
SEK 12 – – 310
USD 26 33 814 1,345
Other 12 5 – –
Total 165 247 1,626 3,394
Of which, not due within five years: 794 859
The maturity structure of the loans is presented in the bar chart in the section “Liquidity risk and refinancing risk” under Financial risks.

116 Alfa Laval Annual Report 2009 / Financial statements
Loan from credit institutionsAlfa Laval has a senior credit facility with a banking syndicate of EUR 268 million and USD 348 million, corresponding to SEK 5,275 million. At December 31, 2009, SEK 475 million of the facility were utilised. The facility matures in April 2012.
The average interest and currency duration including derivatives is 7.3 (11.4) months at the end of 2009. The interest is based on applicable IBOR plus a mark up based on the relation between net debt and EBITDA as described below.
Net debt/EBITDA Mark-up
2.50 - 2.75 0.40%
2.00 - 2.50 0.325%
< 2.00 0.25%
At year end the mark up is 25 (25) (25) basis points. The syndicated loan is linked to three financial covenants that must be
fulfilled throughout the life of the loan. These covenants refer to the relation-ship between net debt and EBITDA, the interest coverage ratio and the debt ratio. If the covenants are not fulfilled, the banking syndicate is entitled to demand immediate repayment of the loans, provided that the breach is not temporary. Alfa Laval has fulfilled the covenants with a good margin ever since the loans were raised in April 2005.
In connection with the acquisition of Tranter Alfa Laval signed a bilateral term loan with SHB of EUR 25 million, corresponding to SEK 258 million. The loan matures in December 2013.
The senior credit facility and the bilateral term loan accrue interest at floating rate. At the end of 2009 the loans are accruing interest in the range of 0.48 % - 1.37 % (2.49 % - 4.68 %) (4.82 % - 5.33 %). The average inter-est rate at the end of 2009 was 2.82 (3.92) (4.79) percent. The Group has chosen to hedge 63 (63) (39) percent of the loans to fixed interest rate, with a duration of 19.2 months.
The transaction costs in connection with raising the loans have been cap-italised and are being amortised over the maturity of the loans. At the end of the year the capitalised amount was SEK 0 (3) million. The current year’s cost for the fee amortisation is SEK -3 (-8) (-7) million.
Private placementIn 2006 Alfa Laval made a private placement in the US. The offer was over- subscribed and was closed at USD 110 million with a maturity of 10 years. The interest was based on US Treasury bills plus a mark-up of 95 basis points, which gave a fixed interest of 5.75 percent. The loan was raised on April 27, 2006.
The transaction costs in connection with raising the loan have been capi-talised and are being amortised over the maturity of the loan. At the end of the year the capitalised amount was SEK 2 (3). The current year’s cost for the fee amortisation is SEK -0 (-0) (-0) million.
Note 31. Other current liabilities
Split by type
Consolidated
SEK millions 2009 2008
Financial lessee payable 154 58
Other non-interest bearing liabilities 986 1,029
Total 1,140 1,087
Note 32. Accrued costs and prepaid income
Split by type and maturity
Consolidated
SEK millions 2009 2008
Accruals for social security 255 285
Reserve for severance pay 123 152
Accrued interest expenses 9 19
Other accrued expenses 892 897
Prepaid income 24 10
Total 1,303 1,363
Of which, not due within one year:
Accruals for social security 25 27
Reserve for severance pay 87 92
Other accrued expenses 57 20
Total 169 139
Note 33. Pledged assets and contingent liabilities
Split by type
Consolidated
SEK millions 2009 2008
Pledged assets
Other pledges and similar commitments 7 8
Total 7 8
Contingent liabilities
Discounted bills 79 84
Performance guarantees 1,342 1,434
Other contingent liabilities 336 692
Total 1,757 2,210
As of December 31, 2009 the Group had sold receivables with recourse totalling SEK 79 (84) million. These are disclosed as discounted bills above.
Other contingent liabilities are among other items referring to bid guaran-tees, payment guarantees to suppliers and retention money guarantees.
Note 34. Transactions with related party
Tetra Pak within the Tetra Laval Group is Alfa Laval’s single largest customer with 3.4 (3.7) (4.3) percent of net sales. In June 1999, Tetra Pak entered into a purchasing agreement with Alfa Laval that governs the distribution, research and development, market sales and information, use of trademarks and intellectual property. The following areas shall be agreed upon from time to time between representatives of the parties: products that are subject to the agreement, prices and discounts of such products, geographical markets and product areas where Tetra Pak is Alfa Laval’s preferred distributor, the right of Tetra Pak to affix its trademarks to Alfa Laval products, sales goals for Tetra Pak in defined geographical markets, products and technologies that are the focus of joint research and development and the ownership rights of the research and development result and use of market and sales information. The agreement aims at the applications within liquid food where Tetra Pak has a natural market presence through the deliveries of packaging equipment and packaging material.
The agreement was prolonged by two years from December 31, 2008. It has a 12 month period of notice. The prices Tetra Pak receives are not lower than the prices Alfa Laval would obtain when selling to a comparable third party. The prices are fixed on a calendar year basis.
Until March 31, 2009 Alfa Laval purchased facility management services relating to the real estate in Lund in Sweden from Tetra Pak Business Support AB for SEK 1 (4) (4) million. Alfa Laval rents premises to DeLaval in Russia and until 2008 Alfa Laval also rented premises to DeLaval in Germany and Tetra Pak in Russia. The total rent income for this amounts to SEK 8 (12) (14) million.
The Board of Directors for Alfa Laval AB has two representatives from Tetra Laval – Jörn Rausing and Finn Rausing.
At year-end, Alfa Laval has the following balance items against companies within the Tetra Laval group (Tetra Pak and DeLaval).

117B
oard of D
irectors’ Report
Consolidated
cash flow
sC
onsolidated
comprehensive incom
eC
onsolidated
financial positionC
hanges in consolidated equity
Parent com
pany cash flow
sP
arent company
income
Parent com
pany financial position
Changes in parent com
pany equityN
otes to the financial statem
entsO
bjectives, policies and
processes for managing capital
Financial risks
Operational
risksN
otes P
roposed disposition of earnings
Audit
Report
Receivables on/payables to related parties
Consolidated
SEK millions 2009 2008
Receivables:
Accounts receivable 61 43
Other receivables 77 97
Liabilities:
Accounts payable 1 3
Other liabilities 4 5
Alfa Laval has had the following transactions with companies within the Tetra Laval group (Tetra Pak and DeLaval).
Income/costs from related parties
Consolidated
SEK millions 2009 2008 2007
Net sales 889 1,017 1,080
Other operating income 8 12 14
Other operating costs -1 -4 -4
Note 35. Work in progress on plant projects
Impact of percentage of completion method
Consolidated
SEK millions 2009 2008 2007
Result items
Amount of recognised project sales revenue 486 496 438
Work performed on ongoing projects
Aggregate amount of costs incurred and recognised profits (less recognised losses) 767 942 880
Assets
Retentions 54 50 64
Gross amount due from customers for work in progress 14 6 8
Liabilities
Advances received 294 354 168
Gross amount due to customers for work in progress 56 34 31
Notes
Note 36. Leasing
Alfa Laval has entered into non-cancellable operating leases mainly relating to premises and finance lease agreements regarding machinery and equipment with leasing periods of 1-20 years. The leasing fees for non-cancellable operating leases for premises were SEK 380 (352) (317) million. During the year, the Group has entered into finance leases with a capitalised value of SEK 117 (22) million. See Note 19 for information on the capitalised value of finance leases.
The future minimum leasing fees concerning non-cancellable operating leases, distributed on maturity dates, amount to:
Future minimum leasing fees for operating leases
Consolidated
SEK millions 2009 2008 2007
Maturity in year:
2008 N/A N/A 195
2009 N/A 228 168
2010 236 200 146
2011 196 176 124
2012 149 140 104
2013 133 123 N/A
2014 118 N/A N/A
Later 162 208 216
Total 994 1,075 953
The future minimum leasing fees concerning financial leasing agreements and their net present value, distributed on maturity dates, amount to:
Financial leases
Consolidated
Future minimum leasing fees for financial leases
Present value of financial leases
SEK millions 2009 2008 2007 2009 2008 2007
Maturity in year:
2008 N/A N/A 4 N/A N/A 3
2009 N/A 7 4 N/A 7 3
2010 27 7 3 26 6 3
2011 21 6 2 20 5 2
2012 18 5 2 17 4 2
2013 16 5 N/A 15 4 N/A
2014 15 N/A N/A 14 N/A N/A
Later 58 29 19 49 20 13
Total 155 59 34 141 46 26

118 Alfa Laval Annual Report 2009 / Financial statements
The unrestricted equity in Alfa Laval AB (publ) is SEK:
Profit brought forward 3,643,824,202
Net income 2009 3,677,184,690
7,321,008,892
The Board of Directors propose a dividend of SEK 2.50 (2.25) per share corresponding to SEK 1,055,098,665 (949,588,799) and that the remaining income of SEK 6,265,910,227 (3,643,824,202) be carried forward.
True and fair viewThe undersigned certify that the annual report for the Group and the Parent company has been prepared in accordance with International Financial Reporting Standards (IFRS), as adopted for use in the European Union, and generally accepted accounting principles respectively, and gives a true and fair view of the financial positions and results of the Group and the Parent company, and that the Board of Directors’ report gives a fair review of the development of the operations, financial positions and results of the Group and the Parent company and describes substantial risks and uncertainties that the Group companies face.
Lund, March 4, 2010
Anders Narvinger Gunilla Berg Björn Hägglund
Chairman Director Director
Arne Kastö * Ulla Litzén Jan Nilsson
Employee representative Director Employee representative
Susanna Holmqvist Norrby Finn Rausing Jörn Rausing
Employee representative Director Director
Waldemar Schmidt Lars Renström
Director Managing Director
Our Auditors’ Report concerning this Annual Report has been issued on March 4, 2010.
Kerstin Mouchard Staffan Landén
Authorised Public Accountant Authorised Public Accountant
* Arne Kastö has made a reservation against the increase of the dividend.
Proposed disposition of earnings

119B
oard of D
irectors’ Report
Consolidated
cash flow
sC
onsolidated
comprehensive incom
eC
onsolidated
financial positionC
hanges in consolidated equity
Parent com
pany cash flow
sP
arent company
income
Parent com
pany financial position
Changes in parent com
pany equityN
otes to the financial statem
entsO
bjectives, policies and
processes for managing capital
Financial risks
Operational
risksN
otes N
otes A
udit R
eport P
roposed disposition of earnings
We have audited the annual accounts, the consolidated accounts, the accounting re-cords and the administration of the board of directors and the managing director of Alfa Laval AB (publ) for the year 2009. The annual accounts and the consolidated ac-counts of the company are included in the printed version of this document on pages 49–119. The board of directors and the ma-naging director are responsible for these accounts and the administration of the com-pany as well as for the application of the Annual Accounts Act when preparing the annual accounts and the application of in-ternational financial reporting standards IFRSs as adopted by the EU and the Annual Accounts Act when preparing the consoli-dated accounts. Our responsibility is to express an opinion on the annual accounts, the consolidated accounts and the adminis-tration based on our audit.
We conducted our audit in accordance with generally accepted auditing standards in Sweden. Those standards require that we plan and perform the audit to obtain reaso-nable assurance that the annual accounts and the consolidated accounts are free of
Audit ReportTo the annual meeting of the shareholders of Alfa Laval AB (publ).Corporate identity number 556587-8054
material misstatement. An audit includes examining, on a test basis, evidence sup-porting the amounts and disclosures in the accounts. An audit also includes assessing the accounting principles used and their application by the board of directors and the managing director and significant esti-mates made by the board of directors and the managing director when preparing the annual accounts and consolidated accounts as well as evaluating the overall presentation of information in the annual accounts and the consolidated accounts. As a basis for our opinion concerning discharge from lia-bility, we examined significant decisions, actions taken and circumstances of the company in order to be able to determine the liability, if any, to the company of any board member or the managing director. We also examined whether any board member or the managing director has, in any other way, acted in contravention of the Companies Act, the Annual Accounts Act or the Articles of Association. We be-lieve that our audit provides a reasonable basis for our opinion set out below.
The annual accounts have been prepared
in accordance with the Annual Accounts Act and give a true and fair view of the company’s financial position and results of operations in accordance with generally accepted accounting principles in Sweden. The consolidated accounts have been pre-pared in accordance with the international financial reporting standards IFRSs as adopted by the EU and the Annual Accounts Act and give a true and fair view of the group´s financial position and results of operations. The statutory administration report is con-sistent with the other parts of the annual accounts and the consolidated accounts.
We recommend to the annual meeting of shareholders that the income statements and balance sheets of the parent company and the statements of comprehensive in-come and financial position for the group be adopted, that the profit of the parent company be dealt with in accordance with the proposal in the administration report and that the members of the board of directors and the managing director be discharged from liability for the financial year.
Lund, March 4, 2010
Kerstin Mouchard
Authorized Public Accountant
Staffan Landén
Authorized Public Accountant

NATURAL PROCESS # 5
ANIMAL / Tunicate
CASE / Treatment plant
TECHNOLOGY / Separation/filtration
A true connoisseurThe tunicate’s method of utilizing the nutritional value offered by the ocean is as simple as it is brilliant.
The basic problem is that the tunicate’s pantry is some-what disorganized and its food must therefore be filtered. Fortunately, the tunicate is designed in such a way that it is able to process this food without any problem.
The tunicate has two openings. The in-current siphon is equipped with valves that prevent overly large particles from entering. Small waving hairs create a constant flow of water that is filtered through a type of perforated sack. A small groove contains mucus-forming cells that help to process the tunicate’s food. The water is then expelled through the creature’s out-current siphon.
Only the most orderly meal will do for this connoisseur.
Wastewater treatment meets HollywoodThe same natural process used by the tunicate to sep-arate water from sludge is used by a wastewater treat-ment plant in California.
This plant uses separation technology – decanters from Alfa Laval – to clean the wastewater produced by two million people in the San Diego area. The result? Clean water, solid sludge that is used in construction work and methane gas from the process that is used to supply energy in the plant itself, with any surplus energy being delivered to the local energy company.
No wonder the plant is known as an industry leader when it comes to innovative thinking. The area has also served as the location for two film productions.
Talk about a unique treatment plant.

121
Corporate Governance Report 2009
Corporate governance Report 121
Introduction by the Board Chairman 122
Corporate governance in Alfa Laval 122
Articles of Association 123
Annual General Meeting 123
Resolutions passed at the 2009 Annual General Meeting 123
Nominating Committee for the 2009 Annual General Meeting 123
Nominating Committee for the 2010 Annual General Meeting 124
The Board of Directors 124
The Board’s responsibilities 124
The Board’s formal work plan 124
Board Chairman 124
Independent Board members 124
Board work during 2009 124
Audit Committee 124
Remuneration Committee 125
Evaluation of the Board’s work 125
Remuneration to the Board 125
Group Management 125
Remuneration, pensions and severance pay/termination of employment 125
Financial reporting 126
Policy documents 126
Internal controls 126
Internal audit 126
Risk management 126
Audits and auditors 126
Remuneration of auditors 126
Board of Directors’ report on internal control for 2009 fiscal year 127
Board of Directors and Auditors 128
Group Management 130
Financial information 135
Annual General Meeting 2010 135

122 Alfa Laval Annual Report 2009 / Corporate Governance
Corporate Governance Report
Internal and external confidence in a company’s Board of Directors and management is crucial. Naturally, this confidence can be secured in several ways. One way is to demonstrate that the company’s actions are character-ized by sound ethical behavior and that governance and control are carried out with the owners’ interests in mind. Achieving these goals requires transparency, which in turn enables the company’s shareholders, the market and the general public to assess the Board and management’s handling of the responsibilities assigned to them.
Accordingly, Alfa Laval – which strives for the highest quality and greatest transparency with regard to management, governance and control, in both its daily operations and the work of the Board – has presented detailed information regarding the governance of the company for several years. As in previous years, this year’s Corporate Governance Report, the sixth published by the company, is based on the Swedish Code of Corporate Governance and has been examined by the company’s auditors.
As a result of the financial crisis, market conditions have been difficult to assess, a trend that also character-ized the work of the Board of Directors in 2009. While Alfa Laval’s strategic direction remains firm, the company’s operations must be adapted to the prevailing market situation. In this respect, maintaining the highest possible governance and control is a crucial prerequisite for improving competitiveness and continued value growth.
Lund, Sweden, March 2010 Anders Narvinger ChairmanoftheBoard
Corporate governance to be characterized by clarity and transparency
Corporate governance in Alfa LavalAlfa Laval AB is a public company listed on the NASDAQ OMX Exchange Stockholm. Alfa Laval had 33,780 shareholders as of December 31, 2009 and the registered office of the Board of Directors is in Lund, Sweden. Accordingly, Alfa Laval’s corporate governance is based on the Swedish Companies Act, the exchange rules of the NASDAQ OMX Exchange Stockholm and the Swedish Code of Corporate Governance.
The Annual General Meeting, Alfa Laval’s highest decision-making body, annually appoints the members and Chairman of the Board of Directors, among others, based on proposals from the Nominating Committee. The Board, whose responsibilities are regu-lated by legislation and regulations, as well as its own formal work plan, is responsible for
the company’s long-term goals and strategy.The President manages the company’s
operations and draws his closest support from a management group and from the manage-ments of the divisions, to which responsibility and authority are delegated. Alfa Laval has developed and implemented a number of business principles and fundamental values to support the sound governance of the organi-zation and ensure that the company’s conduct complies with all applicable ethical guidelines. These principles and values are described on Alfa Laval’s website: www.alfalaval.com.
The company’s external auditors review the company, including the Annual Report. They also make a statement concerning the discharge of the Board from liability. The
internal audit involves an examination of a broad range of procedures and issues. The Corporate Governance Report, in accordance with the Swedish Code of Corporate Governance, provides a detailed description of how Alfa Laval’s different units for corporate governance act and interact.
Alfa Laval has applied the Swedish Code of Corporate Governance since 2005, with the exception of the appointment of Board member Finn Rausing as Chairman of the Nominating Committee. The reason for this deviation from the Code is that the Nominating Committee considers Finn Rausing to be suited to effectively lead the Nominating Committee’s work to achieve the best result for the company’s shareholders.

123
Articles of Association
In accordance with Alfa Laval’s Articles of Association, the registered name of the company is Alfa Laval AB. The registered office of the Board of Directors of the company shall be in Lund Municipality in Sweden. The company’s share capital shall amount to not less than SEK 745,000,000 and not more than SEK 2,980,000,000. The number of shares shall be not less than 298,000,000 and not more than 1,192,000,000. The fiscal year is the calendar year. The objective of the company’s operations is to, directly or through subsidiaries and joint-venture companies in and outside Sweden, develop, manufacture and sell equipment and installations, primarily in the areas of separation, heat transfer and flow technology, and to adminis-ter fixed and movable property, and other related operations. Alfa Laval’s Board of Directors shall comprise not fewer than four and not more than ten members, with not more than four deputy members. The number of auditors shall be not less than one and not more than two, with not more than two deputies. Authorized public accountants or registered public accounting firms are appointed as auditors and, when applicable, deputy auditors. In addition to these statutes, the Articles of Association also include provisions regarding routines for the Annual General Meetings. The Articles of Association are available in their entirety on Alfa Laval’s website: www.alfalaval.com.
Alfa Laval’s currently prevailing Articles of Association were adopted at the Annual General Meeting on April 22, 2008.
Annual General Meeting
The Annual General Meeting (AGM) is the Alfa Laval Group’s highest decision-making body. According to Alfa Laval’s Articles of Association, the Annual General Meeting shall be held annually within six months of the close of the fiscal year in either Lund or Stockholm. Normally, the AGM takes place at the end of April or beginning of May in Lund. The AGM for the 2008 fiscal year was held in Lund on April 20, 2009.
Board Chairman Anders Narvinger was elected as the Meeting Chairman. Following the President’s report, the Board Chairman spoke about the Board’s activities and the work of the Remuneration Committee. Finn Rausing, Chairman of the Board’s Audit Committee, reported on the work of the Audit Committee.
Jörn Rausing, Chairman of the Nominating Committee and representative of Tetra Laval, reported on the work of the Nominating Committee. All the persons nominated to the Alfa Laval Board were present at the Meeting. The company’s two auditors were present.
Resolutions passed at the 2009 Annual General Meeting
The most important resolutions passed at the 2009 Annual General Meeting were as follows:
– The AGM adopted the income statement and balance sheet and resolved that the Board of Directors and President be dis-charged from liability. The AGM also decided in favor of utilizing the company’s profits in accordance with the Board’s proposal, meaning that a dividend of SEK 2.25 per share be paid for 2008.
– The AGM decided in accordance with the Nominating Committee’s proposal that the number of Board members shall be eight and that no deputies shall be appointed.
– The AGM decided in accordance with the Nominating Committee’s proposal that the fees paid to the Board from the close of the 2009 AGM to the close of the following AGM shall amount to SEK 3,485,000.
– The AGM decided that remuneration to the auditors shall be paid in accordance with agreement.
– In accordance with the Nominating Committee’s proposal, the following Board members were reelected: Anders Narvinger, Gunilla Berg, Björn Hägglund, Ulla Litzén, Finn Rausing, Jörn Rausing, Lars Renström and Waldemar Schmidt. The AGM decided to elect Anders Narvinger as Chairman of the Board.
– The AGM resolved to adopt the proposal of the Board concerning principles for remunera-tion to, and other employment conditions for, company management.
– In accordance with the proposal of the Nominating Committee, the AGM adopted criteria for appointing the Chairman and members of the Nominating Committee for the period up to and including the 2010 AGM. This means that the Nominating Committee shall comprise not more than five members and that the majority of the members may not be Board members. The Chairman of the Board shall contact representatives of the largest share holders at the end of the third quarter and ask them each to appoint a member to the Nominating Committee. In addition, the Nominating Committee may decide that the Chairman of the Board and additional Board members shall be included in the Nominating Committee. If one of the five largest shareholders waives its right to appoint a member to the Nominating Committee, the next largest shareholder in terms of size shall be given the opportunity to appoint a member. If several shareholders waive their right to appoint a member to the Nominating Committee, only the eight largest shareholders must be given the opportunity to
do so, unless further appointments are required to ensure that the Nominating Committee comprises not fewer than three members. If a member resigns from the Nominating Committee before the work of the Committee is completed, the shareholder that appointed said member shall be entitled to appoint a re-placement. The Chairman of the Nominating Committee shall be an owner representative who is able to simultaneously serve as a Board member. However, the Chairman of the Board shall not serve as Chairman of the Nominating Committee. The composition of the Nominating Committee shall be published not later than six months prior to the AGM. Should an owner represented on the Nominating Committee significantly reduce its shareholding and no longer qualify for a seat on the Nominating Committee, and providing that the Nominating Committee decides to do so, the represent-ative of the owner shall be dismissed and another of the company’s largest owners shall be offered the opportunity to appoint a member.
– The AGM decided to reduce the company’s share capital by SEK 19,125,358 through the cancellation of all 7,353,950 shares re-purchased by the company. The AGM also decided that the reduction amount shall be reserved in funds to be used in accordance with decisions by the AGM.
– The AGM decided to increase the company’s share capital by SEK 19,125,358 through a bonus issue without the issue of new shares, by a transfer from unrestricted equity.
– The AGM decided in accordance with the proposal of the Board to amend Section 8 of the Articles of Association. This amendment pertained to the manner in which the company shall issue notices of its Annual General Meetings. However, the decision was condi-tional on an amendment to the rules regarding the issuance of notification of annual general meetings in the Swedish Companies Act taking effect, which would entail that the proposed wording of Section 8 would comply with the Companies Act. Since the proposed amendment to the Companies Act has not yet taken effect, the Articles of Association remain unchanged.
Nominating Committee for the 2009 Annual General Meeting
The Nominating Committee for the 2009 AGM comprised Jörn Rausing (appointed by Tetra Laval), Lars-Åke Bokenberger (appointed by AMF Pension), Jan Andersson (appointed by Swedbank Robur Funds), Lars Öhrstedt (ap-pointed by AFA Försäkring), Bo Selling (appointed by Alecta) and Board Chairman Anders Narvinger. Jörn Rausing served as Chairman.

124 Alfa Laval Annual Report 2009 / Corporate Governance
Nominating Committee for the 2010 Annual General Meeting
In accordance with a resolution passed at Alfa Laval AB’s AGM on April 20, 2009, the largest shareholders in Alfa Laval appointed the following members to the Nominating Committee for the AGM to be held on April 26, 2010: Finn Rausing (appointed by Tetra Laval), Lars-Åke Bokenberger (appointed by AMF Pension), Jan Andersson (appointed by Swedbank Robur Funds), Bo Selling (appointed by Alecta) and Peter Rönström (appointed by Lannebo Funds).
The Chairman of the Nominating Committee is Finn Rausing. The Nominating Committee appointed Board Chairman Anders Narvinger to be a member of the Nominating Committee and its secretary. Shareholders wishing to submit proposals to the Nominating Committee prior to the AGM may contact Alfa Laval’s Board Chairman Anders Narvinger, or one of the owner representatives. Contact may also take place directly via e-mail at [email protected].
The Board of Directors
The Board consists of eight members elected by the AGM, and no deputy members.
The members are elected annually for the period until the conclusion of the next AGM. In addition, each trade-union organization appoints three employee representatives and three deputy employee representatives. Salaried employees in the company are invited to Board meetings as presenters and experts. The company’s Chief Financial Officer partici-pates in all meetings. Alfa Laval’s Chief Legal Counsel serves as Board Secretary. The work of the Board is regulated by an annually updated formal work plan that sets the Board’s internal division of labor and meeting agenda. There is a special set of instructions for the President that, among other matters, describes the financial reports to be presented to the Board to enable the latter to properly assess the financial situation on an ongoing basis. For further information about the Board’s members, see pages 128–129.
The Board’s responsibilities
According to the Swedish Companies Act and the Board’s formal work plan, the Board is
responsible for preparing and evaluating Alfa Laval’s overall long-term strategies and objectives, adopting budgets and business plans, checking and approving financial state-ments, adopting key guidelines, making deci-sions on issues relating to acquisitions and divestments of operations and deciding on major investments and significant changes in Alfa Laval’s organization and operations.
The Board (through its Audit Committee) also procures auditing services and maintains ongoing contact with the company’s auditors. The Board appoints the President and defines the instructions the President must follow. The Board (through the Remuneration Committee) also determines salaries and remuneration to the President and members of executive management.
The Board’s formal work plan
The Board’s formal work plan is determined annually in a statutory meeting following the AGM. The formal work plan describes the Board’s work assignments and the division of responsibility between the Board and the President. The formal work plan also stipulates that the Board shall have a Remuneration Committee and an Audit Committee, and defines the role of the Board Chairman. The company’s President prepares an agenda for each meeting in consultation with the Board Chairman. Board members who wish to discuss a particular matter must inform the Board Chairman well in advance, so that the requisite information or documentation on which to base decisions can be prepared. Notices of meetings, with the meeting agenda and the requisite information or documentation on which to base decisions, shall reach the Board members not later than one week prior to the date of the meeting. Minutes from Board meetings shall be numbered, and all Board members shall receive copies. The original shall be stored in a safe manner by the company. This is the responsibility of the company President. Matters discussed by the Board are by definition confidential, and every Board member is subject to a duty of confidentiality regarding matters that could harm the company.
Board Chairman
The Board Chairman directs the work in a manner that ensures compliance with the Swedish Companies Act.
The Chairman is also responsible for ensuring that the Board’s work is well organized and efficiently conducted, so that the Board fulfills its tasks. In dialog with the company’s President, the Chairman monitors operational developments and is responsible for ensuring that the other members receive, on an ongoing basis, informa-tion necessary for Board work to be performed in the most effective manner. The Chairman is responsible for evaluating the Board’s work and participates in evaluation and development mat-ters with respect to the Group’s senior executives.
The Chairman represents the company in ownership issues.
Independent Board members
All members of the Alfa Laval Board elected by the AGM are considered to be independent of the company, except Lars Renström, who is President and CEO of the company. All members are also considered independent of the compa-ny’s major shareholders, except Finn Rausing and Jörn Rausing, who due to their relation to Tetra Laval, are not considered to be independ-ent in relation to the company’s major share-holders. On December 31, 2009, Tetra Laval owned 18.7 percent of the shares in the com-pany. Board members have a duty to devote the necessary time and attention to their Board work and to possess the knowledge required to further the interests of the company and its shareholders in the best possible manner.
Board work during 2009
Ten Board meetings were held during 2009, of which seven were regularly scheduled meetings.
The general duration of meetings was four hours. Board meetings are generally held in Lund or Stockholm. No circular meetings were held and five meetings were held by phone. The normal agenda items for Board meetings include earnings results, order trends, invest-ments, acquisitions and shareholder develop-ments. In addition to the normal agenda items, the Board meetings held during 2009 addressed the following matters:
– changes to market conditions
– the company’s ongoing strategic direction
– review and revision of the company’s financial objectives
– cost adjustments
– acquisition decisions
– asbestos-related lawsuits
– audit planning
– overall funding
– Alfa Laval’s business principles
– environmental considerations
– staffing
Board decisions are made based on open discussions led by the Chairman.
Audit Committee
Alfa Laval has had a special Audit Committee since 2006. Members of the Audit Committee
Composition of the Nominating Committee for the 2010 Annual General Meeting
Name Representing Shareholding in Alfa Laval 1), %
Finn Rausing, Chairman Tetra Laval 18.71
Bo Selling Alecta 7.59
Lars-Åke Bokenberger AMF Pension 6,60
Jan Andersson Swedbank Robur Funds 6.09
Peter Rönström Lannebo Funds 2.42
Anders Narvinger Board Chairman
Total 41.41
1) As of September 30, 2009

125
are appointed annually within the Board. Following the conclusion of the 2009 AGM, the committee comprised Finn Rausing (Chairman), Gunilla Berg and Anders Narvinger. Alfa Laval’s General Counsel is the Committee Secretary.
During 2009, the Audit Committee held three meetings averaging approximately three hours in length. Minutes are kept at all meetings of the Audit Committee and are distributed to the Board members.
The Audit Committee has the right to make decisions regarding the focus of the internal audit and the formulation of guidelines for financial reporting and follow-up. The Audit Committee also makes decisions, in consultation with the external auditors, regarding the focus of the external audit. The Audit Committee’s work also includes continually monitoring the effectiveness of internal controls. The Audit Committee’s duties also involve evaluation and discussion of significant issues in the areas of accounting and financial reporting.
The Audit Committee examines the proce-dures for reporting and financial controls, the auditors’ work, their qualifications and their independence. Its supervision also encompasses other key matters related to financial reporting. The Audit Committee assists management in identifying and evaluating the primary opera-tional risks and ensures that management directs its efforts to addressing these matters.
Remuneration Committee
Alfa Laval’s Remuneration Committee is ap-pointed on an annual basis within the Board. Following the conclusion of the 2009 AGM, the Committee comprised Anders Narvinger (Chairman), Jörn Rausing and Björn Hägglund. The Remuneration Committee held three meetings during 2009, at which all members were in attendance. In addition, the Committee acts in conjunction with recruitment and is in-volved when other conditions of employment relating to the President or other members of Group Management require discussion. Minutes are kept at all meetings of the Remuneration Committee and the contents are distributed to the Board members. The Remuneration Committee’s assignment is to prepare the guidelines for remuneration to senior executives to be resolved on by the Annual General Meeting. It submits proposals to the Board of Directors regarding salary and employment terms and conditions for the President. In addition, the Committee handles matters for the Board regarding salary and employment terms and conditions for senior executives who report directly to the President.
Evaluation of the Board’s work
The Board Chairman ensures that the work of the Board is evaluated annually. This evaluation occurs through open discussions and interviews between the Board Chairman and individual Board members. The evaluation of the Board’s
work focuses on the forms in which the work is carried out, the work climate and the availability of and the need for special Board expertise. The purposes of the evaluation include assisting the Nominating Committee in its task of nomi-nating Board members and proposing remu-neration levels.
Remuneration to the Board
Remuneration to the Board members elected at the AGM is determined by the AGM based on the proposals submitted by the Nominating Committee. Supplements are paid to the Chair-man of the Audit Committee and to members of the Audit Committee and the Remuneration Committee. No Board member is entitled to pension payments from the company, except Lars Renström, who is CEO. The table below summarizes the remuneration received by all Board members from Alfa Laval for the period from the 2009 AGM until the 2010 AGM.
Group Management
Alfa Laval’s executive management comprises ten persons led by President Lars Renström, who is also CEO of the Alfa Laval Group. The President directs the daily operations and is responsible for ensuring that the Board receives information and the necessary decision-making
foundation. The President is also responsible for ensuring that the company’s accounting complies with applicable laws and provisions. Alfa Laval’s management group consists of the CEO and those individuals who, on the CEO’s recommendation, have been appointed by the Board. For further information about Group Management, see pages 130–131. The persons in the management group are responsible both for their own areas of operation and, collectively, for the Group as a whole. The management group held six minuted meetings during 2009. In addition to minuted meetings of the manage-ment group, quarterly reviews of operations are held with the heads of divisions and geo-graphical regions. These deal with the business situation, earnings, earnings projections for the next 12 months and specific questions for the various components of operations.
Remuneration, pensions and severance pay/termination of employment
The principles of remuneration to the President and other members of senior management are decided by the AGM. For additional information regarding Group management’s remuneration, pensions and severance pay, see pages 93 and 94.
Remuneration to the Board
Name Board Remuneration Committee Audit Committee
Anders Narvinger 900 000 50 000 75 000
Gunilla Berg 360 000 0 75 000
Björn Hägglund 360 000 50 000 0
Ulla Litzén 360 000 0 0
Finn Rausing 360 000 0 125 000
Jörn Rausing 360 000 50 000 0
Lars Renström 0 0 0
Waldemar Schmidt 360 000 0 0
Total 3 060 000 150 000 275 000
Attendance at Board meetings and committee meetings
Name Board Remuneration Committee Audit Committee
Elected at AGM Anders Narvinger 10 3 3
Gunilla Berg 10 – 3
Björn Hägglund 10 3 –
Ulla Litzén 8 – –
Finn Rausing 10 – 3
Jörn Rausing 9 3 –
Lars Renström 10 – –
Waldemar Schmidt 9 – –
Employee representatives Arne Kastö 10 – –
Jan Nilsson 10 – –
Susanna Norrby 9 – –
Number of meetings 10 3 3
Chairman
Remuneration is fixed. No variable portion exists. No remuneration is paid to elected Board members who are employees of the company.

126 Alfa Laval Annual Report 2009 / Corporate Governance
Financial reporting
The Board oversees financial reporting through instructions to the President. The Audit Committee prepares all of the financial reports issued by the company, while the Board as a whole addresses the company’s quarterly reports and year-end report. The Audit Committee also handles quarterly risk reporting and information about risk assessments, legal disputes and any irregularities that may occur.
Policy documents
As governance instruments, the Board has decided on a number of policy documents, which are to be used in the daily work of the company. Examples of such documents include the Board’s formal work plan, the President’s instructions, reporting instructions, business principles, investment policy, financial policy and communications policy. The Board annually checks that these instructions and policies remain relevant and up to date.
Due to the size of the company and the complexity of its operations, Alfa Laval’s feedback function for corporate governance was further strengthened in 2009 through the introduction of new procedures for the Group’s senior executives. The objective is to further empha-size the importance of and ensure the full implementation of Alfa Laval’s internal instruc-tions and rules, and to increase transparency, thereby enabling the company’s external and internal auditors to assess the operations.
Internal controls
The Board is responsible for the company’s internal controls, the overall purpose of which is to protect shareholders’ investments and the company’s assets. The Board as a whole received reports from the company’s external auditors at three Board meetings during 2009. In addition, the Board’s Audit Committee received reports from the company’s external auditors on three occasions. On one occasion, the Board received a report from the company’s external auditors without the President or any other representative of executive management being present.
For further information about internal controls, see the Board’s report on internal controls provided in the Corporate Governance Report (see page 127). It describes the control environ-ment, risk assessment, control activities, informa-tion and communication, and the supervision of the internal control system.
Internal audit
The internal audit consists of two auditors sup-plemented by internal specialist company re-sources and auditors from KPMG’s organization for internal auditing. During 2009, 32 internal audits were carried out. The audits encompassed a broad spectrum of functions and areas of in-quiry. The scope was determined by the Board and involved examining, for example:
– Efficiency in the current units.
– The processes that ensure that the princi-ples for best practice are applied and that the controls that have been systematically built in are relevant.
– The existence of systems to ensure that financial transactions are implemented, archived and reported in an accurate and lawful manner.
– Compliance with the systems, guidelines, policies and processes established for the Group’s business operations.
– Opportunities to improve management control, the company’s profitability and the organization may be identified during audits.
The internal audit team reports the results of the audits performed to the Audit Committee. On these occasions, the planning parameters for the next six to eight months are also established. The internal audit team also distributes reports from individual audits to the Group Management members concerned. To ensure that the internal audits result in specific measures, a procedure for continuous follow-up of agreed measures has been established. This procedure is based on agreements regarding time schedules and responsibility for individual measures.
Risk management
Alfa Laval’s risk management processes are explained in the risk management section on pages 84–89 of the Annual Report.
Audits and auditors
The 2008 AGM elected the company’s auditors for a period of four years. Authorized Public Accountants Kerstin Mouchard and Staffan Landén are the company’s auditors. Authorized Public Accountants Håkan Olsson and Thomas Swenson are the company’s deputy auditors. All are Authorized Public Accountants with Ernst & Young AB.
Kerstin Mouchard, born in 1952, has been an auditor for Alfa Laval since 2004. Staffan
Landén, born in 1963, has been an auditor for Alfa Laval since 2008. Håkan Olsson, born in 1961, has been a deputy auditor for Alfa Laval since 2000. Thomas Swenson, born in 1957, has been a deputy auditor for Alfa Laval since 2004. In Alfa Laval’s judgment, none of these auditors has any relationship to Alfa Laval, or a company close to Alfa Laval, that could affect their independent status in relation to the company. All of the auditors also possess the requisite competence to be able to execute their assignment as auditors for Alfa Laval.
Remuneration of auditors (see Note 7 on page 95)
An audit assignment involves examining the Annual Report, evaluating the accounting prin-ciples employed, making significant judgments concerning corporate management, evaluating the general presentation in the Annual Report and conducting an overall review of the interim report for the third quarter. It also involves a review on which to base a decision on discharging the Board from liability. Any other tasks performed are defined as other assignments.
As an extension of our auditing assignment, which has now been completed as a result of our Audit Report dated March 4, 2010, we have reviewed the Corporate Governance Report (pages 121–126) for Alfa Laval AB for 2009 at the request of the Board of Directors. Based on our review, nothing has come to our attention that causes us to believe that the Corporate Governance Report does not comply with the guidelines contained in the Swedish Code of Corporate Governance.
Lund, March 4, 2010
Kerstin Mouchard Staffan LandénAuthorized Authorized
PublicAccountant PublicAccountant
Governance and control

127
Control environment
Effective work by the Board forms the foundation for sound internal control. The Board has established clearly defined processes and priorities for its work and the Board’s committees. An important part of the Board’s work is to formulate and approve fundamental rules and guidelines. These include a finance policy, business principles, rules for investment decisions, financial reporting requirements and a communications policy. These rules and guidelines are intended to create the foundation for sound internal control. They are revised and updated continuously as the need arises. The Board has also ensured that the organizational structure is logical and transparent, with clearly defined roles, responsibilities and processes that facilitate effective management of operational risks and enable the company to fulfill its goals. The responsibility structure includes evaluations by the Board of business performance and results through a purpose-adapted package of reports that contains results, forecasts and analyses of important key factors. The Audit Committee holds meetings with the internal audit team, the external auditors and various specialists in senior management and support functions. The Board receives reports on these meetings. The Audit Committee’s work also includes continually monitoring the effectiveness of internal controls. The Audit Committee’s duties also involve evaluation and discussion of significant issues in the areas of accounting and financial reporting. Group Management maintains and manages the system of internal controls needed to manage significant risks in the ongoing business operations. This work includes ensuring that there are appropriate rules and guidelines for such areas as HR matters, staffing and skills development. Management’s responsibility also includes a commitment to making active efforts to ensure that all employees understand the requirement for, and the individual’s role in, maintaining effective internal control.
Risk assessment
The framework for the ongoing business oper-ations and follow-up includes procedures for risk assessment and thus also for ensuring the production of accurate financial reporting. These procedures include, for example, the following areas:
– Risk assessments related to strategic planning, forecasts and acquisition activities that are intended to identify events in the market or business operations that could, for example, lead to changes in valuations of assets and currency exchange-rate effects on earnings.
– Processes to track changes in accounting regulations that ensure that these changes are implemented correctly in the financial reporting.
Control structures
The control structures have been designed to manage risks that the Board and management consider to be significant to the business operations, internal control and financial reporting. The control structures consist, firstly, of an organization with clearly defined roles that support an effective, and from an internal control perspective, appropriate division of responsibility, and secondly, specific control activities that are intended to discover or prevent the risk of errors in the reports. Examples of control activities include clearly defined decision-making processes and priorities for important decisions (for example, investments, agreements, acquisitions and divestments), earnings analyses and other forms of analytical follow-up, reconciliations, inventory-taking and automatic controls in the key IT systems related to financial reporting.
Information and communication
The company’s main control documents in terms of regulations, guidelines and manuals, to the extent they are related to financial reporting, are updated continuously and communicated, for example, via the intranet, memorandums and internal meetings. The
effectiveness of this communication is monitored continuously to ensure reception of the infor-mation. There are also formal and informal information channels that enable employees to communicate important information to relevant recipients and ultimately, if necessary, to the Board of Directors.
A clearly defined policy has been formulated for communication with external parties, including guidelines for modes of communication. The policy is intended to ensure accurate and com-plete compliance by all persons responsible for the dissemination of information.
Follow-up
The internal control process is mainly monitored by three entities outside the line organization: the Audit Committee, external audit and inter-nal audit. The Audit Committee established the principles that apply for the company with respect to accounting and financial reporting, and monitors compliance with these regulations.
The Audit Committee meets with the external auditors regularly to secure information about the focus and scope of the audit and to discuss results and coordination of the external and internal audits. The Audit Committee also establishes the direction, extent and time schedules for the internal audit team’s work. The internal audit team reports the results of its audits to the Audit Committee at the latter’s meetings. The results of the audit reviews are also reported continuously to Group Management so that any necessary measures may be taken.
The scope of the internal audit includes operational efficiency, compliance with regula-tions and guidelines and the quality of financial reporting from the subsidiaries.
The report not only comprises a description of how internal control is organized but also an opinion on how well it functions.
Board of Directors’ report on internal control for 2009 fiscal year The Board’s description of the internal control
Lund, March 2010TheBoardofDirectors

128 Alfa Laval Annual Report 2009 / Corporate Governance
Elected by the Annual General Meeting
Anders NarvingerChairman since 2003.Born: 1948.President of Teknikföretagen and formerly President and CEO of ABB Sweden.Education: BSc. Eng from the Faculty of Engineering at Lund University, BSc. Econ from Uppsala University.Chairman of Trelleborg AB and Coor Service Manage-ment AB.Board member of Volvo Car Corporation, JM AB and Pernod Ricard SA.Independent of company and major shareholders.Number of shares in Alfa Laval: 40,000* (40,000**).
Ulla LitzénBoard member since 2006.Born: 1956.Former positions include President of W Capital Manage-ment and various executive positions at Investor.Education: BSc. Econ from the Stockholm School of Economics, MBA from the Massachusetts Institute of Technology.Board member of, among others, Atlas Copco AB, Boli-den AB, NCC AB, Rezidor Hotel Group AB and SKF AB.Independent of company and major shareholders.Number of shares in Alfa Laval: 15,600* (15,600**).
Lars RenströmBoard member since 2005.Born: 1951.President and CEO of Alfa Laval.Education: BSc. Eng, BSc. Econ.Board member of ASSA ABLOY AB and TeliaSonera AB.Independent of major shareholders.Number of shares in Alfa Laval: 40,400* (40,400**).
Gunilla BergBoard member since 2004.Born: 1960.Former positions include Executive Vice President and CFO of the SAS Group and Executive Vice President and CFO of the KF Group.Education: BSc. Econ from the Stockholm School of Economics.Board member of L E Lundbergföretagen AB and DnB NOR ASA.Independent of company and major shareholders.Number of shares in Alfa Laval: 1,000*** (0**).
Finn RausingBoard member since 2000.Born: 1955.Education: B.L., MBA from Insead.Chairman of R.R. Institute of Applied Economics AB.Board member of Tetra Laval Group, De Laval Holding AB and Swede Ship Marine AB.Independent of company.
Waldemar SchmidtBoard member since 2000.Born: 1940.Former President and CEO of ISS Group.Education: BSc. Eng.Chairman of Superfos Industries A/S and Thrane & Thrane A/S.Board member of Kwintet AB and Majid Al Futtaim Group LLC, Dubai.Independent of company and major shareholders.Number of shares in Alfa Laval: 60,000* (60,000**).
Björn HägglundBoard member since 2005.Born: 1945.Former positions include Deputy CEO of Stora Enso.Education: PhD (For.)Board Chairman of the Swedish Industrial Institute for Economics and Social Research, SweTree Technologies and the World Wide Fund for Nature, Sweden.Board member of, among others, Bergvik Skog AB, the Knut and Alice Wallenberg Foundation, Mistra and AB Karl Hedin.Independent of company and major shareholders.Number of shares in Alfa Laval: 12,000* (12,000**).
Jörn RausingBoard member since 2000.Born: 1960.Head of Mergers and Acquisitions (M&A) in the Tetra Laval Group.Education: BSc. Econ.Board member of the Tetra Laval Group, Ocado Ltd. and De Laval Holding AB.Independent of company.
Board of Directors and Auditors
* Holdings as of December 31, 2009.** Holdings as of December 31, 2008.*** Acquisition carried out after the 2009 year-end report.

129
Employee representatives
Deputy employee representatives
Auditors Deputy auditors
Arne KastöEmployee representative since 2000.Born: 1948.Employed by Alfa Laval since 1980.Employee representative for the Swedish Union of Clerical and Technical Employees in Industry (Unionen).
Jan NilssonEmployee representative since 2000.Born: 1952.Employed by Alfa Laval since 1974.Employee representative for the Swedish Metal Workers’ Union (IF Metall).
Susanna NorrbyEmployee representative since 2003.Born: 1967.Employed by Alfa Laval since 1992.Employee representative for the Swedish Association of Graduate Engineers (CF).Number of shares in Alfa Laval: 5,000* (5,000**).
Henrik NielsenDeputy member since 2008.Born: 1968.Employed by Alfa Laval since 2005.Deputy employee representative for the Swedish Metal Workers’ Union (IF Metall).
Maria FröbergDeputy member since 2005.Born: 1973.Employed by Alfa Laval since 2001.Deputy employee representative for the Swedish Union of Clerical and Technical Employees in Industry (Unionen).
Stefan SandellDeputy member since 2005.Born: 1971.Employed by Alfa Laval since 1989.Deputy employee representative for the Swedish Organization for Managers (Ledarna).
Håkan OlssonAuthorized Public Accountant, Ernst & Young AB, Malmö.Born: 1961.Deputy auditor for Alfa Laval since 2000.
Thomas SwensonAuthorized Public Accountant, Ernst & Young AB, Malmö.Born: 1957.Deputy auditor for Alfa Laval since 2004.
Kerstin MouchardAuthorized Public Accountant, Ernst & Young AB, Malmö. Born: 1952. Auditor for Alfa Laval since 2004. Elected auditor at 2004 Annual General Meeting. Kerstin Mouchard has long experience in auditing exchange-listed and internationally active companies. Among other assignments, she is auditor for Cardo AB, Profilgruppen AB, Strålfors AB and a number of companies in the Lantmännen Group.
Staffan LandénAuthorized Public Accountant, Ernst & Young AB, Gothenburg. Born: 1963. Auditor for Alfa Laval since 2008. Elected auditor at 2008 Annual General Meeting. Staffan Landén has years of experience in auditing exchange-listed and internationally active companies. Among other assignments, he is auditor for Capio AB, Papyrus AB, Academedia AB and Bure Equity AB.
* Holdings as of December 31, 2009.** Holdings as of December 31, 2008.

130 Alfa Laval Annual Report 2009 / Corporate Governance
Group Management
Lars RenströmPresident and CEO.Born: 1951.CEO since October 1, 2004.Former positions include President and CEO of Seko Tools AB, Division Manager at Ericsson AB and Atlas Copco AB.Board member of ASSA ABLOY AB and TeliaSonera AB.Education: BSc. Eng, BSc. Econ.Number of shares in Alfa Laval: 40,400* (40,400**).
Svante KarlssonPresident, Process Technology Division.Born: 1955.Employed by Alfa Laval since 1984.Former President of the Equipment division, head of the Thermal business area and President of Marine & Power.Education: BSc. Econ.Number of shares in Alfa Laval: 82,744* (82,744**).
Thomas ThuressonChief Financial Officer.Born: 1957.Employed by Alfa Laval since 1988.CFO since 1995. Former assignments include Controller of the Flow business area and Group Controller of the Alfa Laval Group.Board member of PartnerTech AB.Education: BSc. Econ.Number of shares in Alfa Laval: 140,800* (140,800**).
Susanne Pahlén ÅklundhPresident, Equipment Division.Born: 1960.Employed by Alfa Laval since 1983.President of the Equipment Division since 2009.Previously responsible for Mid Europe, Nordic and the Process Industry segment.Education: MSc. Eng.Number of shares in Alfa Laval: 756*.
Göran MathiassonPresident, Operations DivisionBorn: 1953.Employed by Alfa Laval since 1979.President of the Operations Division since April 2003. Previously in charge of Alfa Laval Manufacturing and Thermal Technology, including research and development, production development, system development and purchasing.Education: BSc. Eng.Number of shares in Alfa Laval: 6,588* (6,588**).
Peter LeiflandExecutive Vice President in charge of the Western Europe and North America Region.Born: 1954.Employed by Alfa Laval since 1985.Peter Leifland has been a regional manager since 1999. For-merly President of Alfa Laval International Engineering AB.Board member of Cision AB.Education: B.L., lic.spec. IMD (PED).Number of shares in Alfa Laval: 480,000* (480,000**).

131
Lars HenrikssonExecutive Vice President in charge of the Central and Eastern Europe and Latin America Region.Born: 1950.Employed by Alfa Laval since 1977.Responsible for the Central and Eastern Europe and Latin America Region since September 1, 2004. Prior to this, he was President of Alfa Laval Inc. in Canada and held executive positions in Alfa Laval in Sweden, Spain and Brazil.Education: BSc. Eng.Number of shares in Alfa Laval: 24,000* (24,000**).
Peter TorstenssonSenior Vice President, Corporate Communications.Born: 1955.Employed by Alfa Laval since 1999.Senior Vice President, Corporate Communications since 1999. Formerly President of Borstahusen Informationsdesign.Number of shares in Alfa Laval: 76,000* (76,000**).
Ray FieldExecutive Vice President in charge of the Asia, Oceania and Middle East Region.Born: 1954.Employed by Alfa Laval since 1985.Responsible for the Asia, Oceania and Middle East Region since September 1, 2004. Prior to this, he served as President of Alfa Laval China for slightly more than ten years.Education: BSc. Eng.Number of shares in Alfa Laval: 54,588* (54,588**).
Peter BailliereSenior Vice President, Human Resources.Born: 1963.Employed by Alfa Laval since 2007.Senior Vice President, Human Resources, since July 1, 2007.Many years of experience with Volvo Cars, most recently as head of Group Human Resources.Education: Master of Sociology.
* Holdings as of December 31, 2009.** Holdings as of December 31, 2008.
Resigned from Group Management on July 1, 2009.
Ulf GranstrandSenior Adviser.Born: 1947.Employed by Alfa Laval since 1975.Former positions include President of the Process Technology Division.

132 Alfa Laval Annual Report 2009
Ten-year overview
Ten-year overview
Consolidated
SEK millions, unless otherwise stated 2009 2008 2007 2006 2005 2004 * 2003 ** 2002 2001
Pro forma 2000
Profit and loss
Net sales 26,039 27,850 24,849 19,802 16,330 14,986 13,909 14,595 15,830 15,012
Comparison distortion items -225 -168 54 -120 -73 37 6 -29 5 130
Operating income 4,030 5,736 4,691 2,552 1,377 1,438 1,138 1,220 1,231 810
Financial net -270 -395 -134 -177 -278 -177 -321 -848 -1,189 -1,107
Result after financial items 3,760 5,341 4,557 2,375 1,099 1,261 817 372 42 -297
Minority share in income -41 -34 -32 -48
Taxes -1,023 -1,534 -1,377 -650 -171 -421 -130 -218 26 -60
Net income for the year 2,737 3,807 3,180 1,725 928 840 646 120 36 -405
Financial position
Goodwill 6,143 5,383 4,459 3,706 3,531 2,978 3,099 3,369 3,373 3,314
Other intangible assets 2,490 1,890 1,275 1,191 1,067 924 1,101 1,334 1,641 1,805
Property, plant and equipment 3,548 3,546 2,824 2,514 2,553 2,480 2,756 3,083 3,599 4,112
Financial long-term assets 1,542 1,376 1,128 784 676 601 671 752 1,102 1,094
Inventories 4,485 5,972 5,086 3,793 3,091 2,453 2,218 2,279 2,624 2,882
Current receivables 6,584 9,238 7,420 5,987 4,467 3,976 3,631 3,590 4,334 4,353
Current deposits 302 544 190 229 342 257 659 414 293 596
Cash and bank 1,112 1,083 856 546 479 415 555 606 666 635
TOTAL ASSETS 26,206 29,032 23,238 18,750 16,206 14,084 14,690 15,427 17,632 18,791
Equity 12,229 10,493 7,937 6,831 5,811 5,269 4,897 4,512 1,445 1,312
Minority interest 104 108 132 170
Provisions for pensions etc. 920 990 877 941 903 789 755 721 775 658
Provisions for taxes 1,390 1,161 1,090 949 767 760 817 990 1,144 1,413
Other provisions 2,365 2,252 1,810 1,281 957 948 891 989 1,063 1,179
Non-current liabilities 1,626 3,394 3,068 2,006 2,702 2,307 3,492 4,234 8,321 8,899
Current liabilities 7,676 10,742 8,456 6,742 5,066 4,011 3,734 3,873 4,752 5,160
TOTAL EQUITY & LIABILITIES 26,206 29,032 23,238 18,750 16,206 14,084 14,690 15,427 17,632 18,791
* Restated to IFRS. ** 2003 and earlier in accordance with Swedish GAAP *** The figures for prior years until 2002 have been recalculated due do the 4:1 split.
Changes in accounting standardsA reader of the ten-year overview should observe that accounting standards have changed re peatedly over this period of time.
All listed companies within the European Union were obliged to change to IFRS as of January 1, 2005. International Financial Reporting Standards (IFRS) are issued by the International Accounting Standards Board (IASB).
Already in 2000 Alfa Laval started to implement the International Accounting Standards (IAS) issued by IASB and translated and adapted to Swedish legislation by the Financial Accounting Standards Council in Sweden. Alfa Laval was a first time ap-plicant under IFRS 1 in 2005. IFRS 1 covered the transitional provisions for the implementation of IFRS.
The adoption to IFRS was however already in place since Alfa Laval had implemented all rele-vant IAS standards, except IAS 39. This state-ment was implemented as of January 1, 2005.
Due to IFRS 1 the comparison figures for 2004 have been restated according to IFRS. Since there were only some minor differences between the Swedish recommendations and IAS, this has not by itself triggered any changes in accounting policies, equity or comparison peri-ods. IAS 39 means that financial derivatives, bonds and non-listed external shares are ad-justed to fair value. IAS 39 represented a change in accounting policies that was reflected in the consolidated equity at January 1, 2005.
Since all IAS rules except IAS 39 were close
to prior Swedish GAAP in terms of valuation and accountancy, the transfer to IFRS only affected the following areas. As of January 1, 2005 the goodwill was not amortised any longer but in-stead tested for impairment. Minority interests were earlier reported under a separate heading next to equity, but are now reported as a sepa-rate item within equity. Provisions were split in short term and long term. Since IAS 39 was im-plemented first in 2005 it only had an effect on the opening balance for 2005 and not in the in-come statement for 2004. The effect was relating to fair value adjustments of financial derivatives, bonds and non-listed external shares.

Ten-year overview
Consolidated
SEK millions, unless otherwise stated 2009 2008 2007 2006 2005 2004 * 2003 ** 2002 2001
Pro forma 2000
Key ratios
Orders received 21,539 27,464 27,553 24,018 18,516 15,740 14,145 14,675 15,894 15,374
Order backlog at year end 11,906 14,310 14,730 12,359 7,497 4,763 4,021 4,340 4,314 4,063
EBITA 4,360 5,992 5,034 2,891 1,692 1,732 1,633 1,726 1,743 1,290
EBITDA 4,751 6,296 5,299 3,153 1,957 1,993 1,926 2,058 2,144 1,756
EBITA-margin % 16.7% 21.5% 20.3% 14.6% 10.4% 11.6% 11.7% 11.8% 11.0% 8.6%
EBITDA-margin % 18.2% 22.6% 21.3% 15.9% 12.0% 13.3% 13.8% 14.1% 13.5% 11.7%
Adjusted EBITA 4,585 6,160 4,980 3,010 1,765 1,695 1,627 1,755 1,738 1,160
Adjusted EBITDA 4,976 6,464 5,245 3,273 2,030 1,956 1,920 2,087 2,138 1,626
Adjusted EBITA-margin % 17.6% 22.1% 20.0% 15.2% 10.8% 11.3% 11.7% 12.0% 11.0% 7.7%
Adjusted EBITDA-margin % 19.1% 23.2% 21.1% 16.5% 12.4% 13.1% 13.8% 14.3% 13.5% 10.8%
Profit margin % 14.4% 19.2% 18.3% 12.0% 6.7% 8.4% 5.9% 2.5% 0.3% -2.0%
Excl. Goodwill and step-up values
Capital turnover rate, times 5.2 5.6 6.4 6.3 5.5 5.3 5.0 4.4 4.1 3.4
Capital employed 5,052 4,973 3,863 3,137 2,958 2,822 2,807 3,283 3,901 4,385
Return on capital employed % 86.3% 120.5% 130.3% 92.2% 57.2% 61.4% 58.2% 52.6% 44.7% 29.4%
Incl. Goodwill and step-up values
Capital turnover rate, times 2.0 2.5 2.7 2.5 2.2 2.0 1.8 1.7 1.7 1.9
Capital employed 12,976 11,144 9,289 8,062 7,470 7,317 7,667 8,565 9,401 8,011
Return on capital employed % 33.6% 53.8% 54.2% 35.9% 22.7% 23.7% 21.3% 20.2% 18.5% 16.1%
Return on equity % 24.5% 42.8% 44.1% 25.3% 16.0% 15.9% 13.2% 2.7% 2.5% -30.8%
Solidity % 46.7% 36.1% 34.2% 36.4% 35.9% 37.4% 33.3% 29.2% 8.2% 7.0%
Net debt 533 2,074 2,397 1,478 2,013 1,884 2,401 3,499 7,778 8,422
Net debt to EBITDA, times 0.1 0.3 0.5 0.5 1.0 0.9 1.2 1.7 3.6 4.8
Debt ratio, times 0.04 0.20 0.30 0.22 0.35 0.36 0.49 0.78 5.38 6.42
Interest coverage ratio, times 15.2 26.2 23.7 14.4 6.9 7.4 5.0 3.0 1.9 1.6
Cash flow from:
operating activities 5,347 4,062 3,264 2,619 1,617 1,203 1,654 1,924 1,999 1,630
investing activities -2,620 -1,333 -1,676 -1,578 -665 36 -457 -548 115 -8,284
financing activities -2,667 -2,599 -1,291 -935 -973 -1,353 -1,167 -1,320 -2,095 6,618
Investments 451 747 556 373 324 388 259 277 275 312
Average number of employees 11,773 11,821 10,804 9,923 9,524 9,400 9,194 9,292 9,693 11,001
Earnings per share, SEK *** 6.42 8.83 7.12 3.78 1.98 1.78 1.45 0.35 0.96 -10.79
Free cash flow per share, SEK *** 6.46 6.38 3.60 2.33 2.13 2.78 2.68 4.03 56.37 -177.45
* Restated to IFRS. ** 2003 and earlier in accordance with Swedish GAAP *** The figures for prior years until 2002 have been recalculated due do the 4:1 split.
Alfa Laval AB (publ)PO Box 73SE-221 00 LundSwedenCorporate registrationnumber: 556587-8054
Visiting address:Rudeboksvägen 1Phone: + 46 46 36 65 00Website: www.alfalaval.com
Production: Alfa Laval AB / Bysted AB / Articles on pages 12 and 28: Carolina Johansson
Photo: Kennet Ruona, Colourbox, Shutterstock / Prepress and printing: JMS Mediasystem

Net salesRevenues from goods sold and services performed that are part of the ordinary operations of the Group, after deduction for given discounts, value added tax and other tax directly linked to the sales.
Comparison distortion itemsItems that do not have any link to the normal operations of the Group or that are of a non-recurring nature, where a reporting together with other items in the comprehensive income statement would have given a comparison distortion effect that would have made it difficult to judge the development of the ordinary operations for an outside viewer.
Orders receivedIncoming orders during the year, calculated in the same way as net sales. The orders received give an indication of the current demand for the Group's products and services, that with a varying delay appear in net sales.
Order backlog at year-endIncoming orders that not yet have been invoiced. The order backlog at the end of the year is equal to the sum of the order backlog at the beginning of the year plus the orders received during the year less the net sales for the year. It gives an indication of how the net sales can be expected to develop in the future.
EBITA“Earnings Before Interest, Taxes and Amortisation” or operating income before amortisation of step-up values. This measure of result is fully comparable over time independent of the financing costs and the amortisation of step-up values that from time to time burden the Group.
EBITDA“Earnings Before Interest, Taxes, Depreciation and Amortisation” or operating income before depreciation and amortisation of step-up values. This measure of result is fully comparable over time independent of the financing costs and the amortisation of step-up values that from time to time burden the Group.
EBITA-margin %Operating income before amortisation of step-up values (EBITA) in relation to net sales, expressed in percent.
EBITDA-margin %Operating income before depreciation and amortisation of step-up values (EBITDA) in relation to net sales, expressed in percent.
Adjusted EBITASame as EBITA, but adjusted for comparison distortion items.
Adjusted EBITDASame as EBITDA, but adjusted for comparison distortion items.
Adjusted EBITA-margin %Same as EBITA-margin, but adjusted for comparison distortion items.
Adjusted EBITDA-margin %Same as EBITDA-margin, but adjusted for comparison distortion items.
Profit margin %Result after financial items in relation to net sales, expressed in percent.
Capital turnover rate, timesNet sales in relation to average capital employed, expressed as a multiple of capital employed. Shown excluding and including goodwill and step-up values and the corresponding deferred tax liability.
Capital employedTotal assets less liquid funds, capitalised financing costs, other long-term securities, accrued interest income, operating liabilities and other non-interest bearing liabilities, including tax and deferred tax, but excluding accrued interest costs. Shown excluding and including goodwill and step-up values and the corresponding deferred tax liability. Shows the capital that is used in the operations. The capital employed for the Group differs from the net capital for the segments concerning taxes, deferred taxes and pensions.
Return on capital employed %EBITA in relation to average capital employed, expressed in percent. Shown excluding and including goodwill and step-up values and the corresponding deferred tax liability.
Return on equity %Net income for the year in relation to equity, expressed in percent.
Solidity %Equity in relation to total assets, expressed in percent.
Net debtInterest-bearing liabilities including interest-bearing pension liabilities and capitalised finance leases less liquid funds.
Net debt to EBITDA, timesNet debt in relation to EBITDA is one of the covenants of Alfa Laval’s syndicated loan and an important key figure when reviewing the proposed dividend.
Debt ratio, timesNet debt in relation to equity, expressed as a multiple of the equity.
Interest coverage ratio, timesEBITDA plus financial net increased by interest costs in relation to interest costs. Expressed as a multiple of interest costs. Gives an expression for the Group's ability to pay interest. The reason EBITDA is used as the starting point is that this forms the starting point for a cash flow perspective on the ability to pay interest. Financial items classified as comparison distorting are excluded from the calculation.
Cash flow from operating activitiesShows the Group's cash flow from operating activities, that is the cash flow generated in the daily operational activities.
Cash flow from investing activitiesShows the Group's cash flow from investing activities, i.e. the cash flow generated by mainly the Group's divestments and acquisitions of businesses and divestments of real estate.
Cash flow from financing activitiesShows the Group's cash flow from financing activi-ties, that is mainly the cash flow impact of the Group's loans in terms of interest payments and amortisation.
InvestmentsInvestments represent an important component in the cash flow for the Group. The level of investments during a couple of years gives a picture of the capacity build up in the Group.
Average number of employeesThe costs that are related to the number of employees represent a large part of the total costs for the Group. The development of the average number of employees over time in relation to the development of the net sales therefore gives an indication of the cost rationalisation that is taking place.
Earnings per share, SEKNet income for the year attributable to the equity holders of the parent divided by the average number of shares.
Free cash flow per share, SEKThe sum of cash flows from operating and investing activities for the year divided by the average number of shares. This represents the cash flow available for interest payments, amortisation and dividends to investors.
Definitions

Annual General Meeting 2010The Annual General Meeting of Alfa Laval AB (publ) will be held on Monday, April 26, 2010 at 4:00 p.m. at Färs & Frosta Sparbank Arena, Klostergården’s sports area, Stattenavägen, in Lund. Light refreshments will be served after the Meeting.
Meeting program1:30 p.m. Bus departs from Färs & Frosta Sparbank Arena for Alfa Laval’s
production unit for heat exchangers in Lund3:30 p.m. Registration starts4:00 p.m. Start of Meeting
Notification of participationShareholders who wish to participate in the Meeting and be entitled to vote must be entered in the share register maintained by Euroclear Sweden AB not later than Tuesday, April 20, 2010, and register their intention to participate, along with any assistants, not later than Tuesday, April 20, 2010 at 12:00 noon.
Shareholders whose shares are held in trust must temporarily re-register their shares in their own names not later than April 20, 2010. Shareholders must inform the trustee about this at least two working days before the deadline.
Financial information
Alfa Laval uses a number of channels to provide information about the company’s operations and financial development. Information published in the form of annual reports, quarterly reports and press releases is presented on an ongoing basis on the company’s website at www.alfalaval.com/investors. Presentation material from capital markets days, press conferences and analyst meetings can also be downloaded from the website.
Annual reports are sent to those shareholders who have notified the company that they wish to receive a copy. Annual reports can also be ordered at www.alfalaval.com or by calling +46 (0)40-36 65 00. Alfa Laval arranges press conferences and analyst meetings following publication of the company’s quarterly reports.
In addition, representatives of company management meet with analysts, investors and journalists on an ongoing basis to ensure that these parties have correct and current information. Pursuant to the company’s agreement with the Stockholm Stock Exchange (NASDAQ OMX Stockholm), information that could
have an effect on the share price that is not yet publicly known is never disclosed in conjunction with these types of meetings or contacts.
Alfa Laval also arranges a so-called capital markets day each year, at which representatives from the financial market are offered more in-depth information regarding the company’s operations.
Alfa Laval employs a so-called silence period of three weeks. This means that the President and Chief Financial Officer do not meet or speak to representatives of the financial market during the three weeks prior to a quarterly report.
In accordance with the company’s Articles of Association, notice of the Annual General Meeting is inserted as an announcement in Dagens Nyheter and The Swedish Official Gazette at the earliest six and at the latest four weeks prior to the Meeting. The information below concerning the Meeting does not constitute legal notice. As a service to existing shareholders, information about the Annual General Meeting is sent to them by mail.
Financial information during 2010Alfa Laval will release financial information during 2010 on the following dates:
First-quarter report April 26Annual General Meeting in Lund April 26Second-quarter report July 20Third-quarter report October 22
Shareholder information
Gabriella GrotteInvestor Relations ManagerTel: +46 (0)46-36 74 82Mobile: +46 (0)709-78 74 82E-mail: [email protected] or [email protected]
Analysts tracking Alfa LavalABG Sundal CollierErik [email protected]+46 (0)8-566 286 64
BAS-MLBen Maslen [email protected] +44 20 7996 4783
CarnegieJoakim Hö[email protected]+46 (0)8-5886 8966
CazenoveGlen [email protected]+44 20 7155 5000
CheuvreuxPatrik Sjö[email protected]+46 (0)8-723 51 15
Credit Suisse Andre [email protected]+44 207 888 0350
Danske BankAnders [email protected] +46 (0)8-5688 0570
Deutsche BankJohan [email protected]+46 (0)8-463 55 18
DnB NORErik Bergöö[email protected]+47 22 94 88 43
Evli BankMagnus Axé[email protected]+46 (0)8-407 80 38
HQ Bank Andreas Koski [email protected] +46 (0)8-696 18 13
Handelsbanken Capital MarketsPeder Frölé[email protected]+46 (0)8-701 1251
Jefferies International John [email protected]+44 (0)20 7029 8682
JP MorganAndreas P. [email protected]+44 207 325 4853
Morgan StanleyKas [email protected]+44 20 7425 6235
Nordea BankAnn-Sofie [email protected]+46 (0)8-534 914 52
RBSTeea [email protected]+44 (0)20 7678 1261
SEB EnskildaAnders [email protected]+46 (0)8-52 22 96 39
Standard and Poor's Equity ResearchHeenal [email protected]+44 (0)20 7176 3641
SwedbankMats [email protected]+46 (0)8-5859 1262
UBS Sven [email protected]+49 69 1369 8278
ÅlandsbankenAnders [email protected]+46 (0)8-791 46 15
ÖhmansOscar [email protected]+46 (0)8-402 50 65
Notification of participation shall be made to:– Alfa Laval AB, Group Staff Legal, Box 73, SE-221 00 Lund, Sweden– E-mail: [email protected]– Fax: +46 (0)46-36 71 87– Website: www.alfalaval.com– Telephone: +46 (0)46-36 74 00 or +46 (0)46-36 65 00.
Shareholders must state their name, personal ID number and telephone number on the notice of participation. If participation is by proxy, a power of attorney or authorization must be submitted to the company prior to the Meeting.
DividendThe Board of Directors and the President propose to the Annual General Meeting that a dividend of SEK 2.50 per share be paid. The proposed record date for this dividend is Thursday, April 29, 2010. If the meeting approves the proposal, the dividend is expected to be distributed on Tuesday, May 4, 2010. However, the record date and dividend payment date may be postponed due to the technical procedures required for executing the payment.
Tour of production facility in LundPrior to the Annual General Meeting, participants will have an opportunity to view the production of plate heat exchangers at the plant in Lund. The tour begins with assembly at Färs & Frosta Sparbank Arena, Klostergården’s sports area, Stattenavägen in Lund not later than 1:30 p.m. Buses will be provided for transportation to the plant and back to the Meeting site. Registration for the tour must be made in conjunction with registration for participation in the Annual General Meeting. Please note that the number of participants is limited.

CC00189EN 1003
Alfa Laval in brief
Alfa Laval is a leading global provider of spe-cialized products and engineered solutions. The company’s equipment, systems and services are dedicated to helping customers to optimize the performance of their processes. Time and time again. Alfa Laval helps customers to heat, cool, separate and transport products such as oil, water, chemicals, beverages, foodstuffs, starch and pharmaceuticals. Alfa Laval’s worldwide organization works closely with customers in 100 countries to help optimize their processes.
More information on the Internet
Alfa Laval’s website is continuously updated with new information, including contact details for all countries. Visit the investor pages for a digital version of the 2009 Annual Report.
Read more at www.alfalaval.com and www.alfalaval.com/investors
Related Documents