DC-AAPOR & Washington Statistical Society 2018 Summer Preview/Review Conference Final Program July 16, 2018 Bureau of Labor Statistics Conference Center 2 Massachusetts Avenue, NE, Washington DC Thank you to our conference sponsors! Platinum Sponsors Gold Sponsors Silver Sponsors

Welcome message from author
This document is posted to help you gain knowledge. Please leave a comment to let me know what you think about it! Share it to your friends and learn new things together.
Transcript

DC-AAPOR & Washington Statistical Society
2018 Summer Preview/Review Conference
Final Program
July 16, 2018
Bureau of Labor Statistics Conference Center
2 Massachusetts Avenue, NE, Washington DC
Thank you to our conference sponsors!
Platinum Sponsors
Gold Sponsors
Silver Sponsors

PROGRAM
8:30-9:00 Registration
9:00-9:15 Welcoming & Opening Remarks
9:15-10:45 Session 1A: Adaptive Designs and Hard to Reach Populations
Session 1B: Survey Burden, Confidentiality and Privacy
Session Chair: Wendy Martinez, Bureau of Labor Statistics Recruiting Hard-to-Reach Respondents with Complex Characteristics for Qualitative Interviews – Casey Tesfaye, Research Support Services Methodological Considerations for Interviewing Teens – Meredith Massey, National Center for Health Statistics Adaptive Designs in Practice – Gonzalo Rivero, Westat That Wasn’t Part of the Plan! Reducing Effort Through Stopping Rules to Place CAPI Cases on Hold and Work Plans to Set Them Free – Ryan Hubbard, Westat
Session Chair: Heather Ridolfo, USDA National Agricultural Statistics Service Using Card-Sorting Strategies to Examine Persuasive and Confidentiality Messaging in Surveys of Businesses – Aryn Hernandez, U.S. Census Bureau Hackers, Phish, and Breaches: Qualitative Census Bureau Research on Respondent Perceptions of Privacy and Data Security – Aleia Fobia, U.S. Census Bureau Evaluating Perceived Burden of Household Survey Respondents – Daniel Yang, Bureau of Labor Statistics Survey Features and Respondent Characteristics that Contribute to Objective and Subjective Measures of Burden – Robin Kaplan, Bureau of Labor Statistics
10:45-11:10 Coffee Break
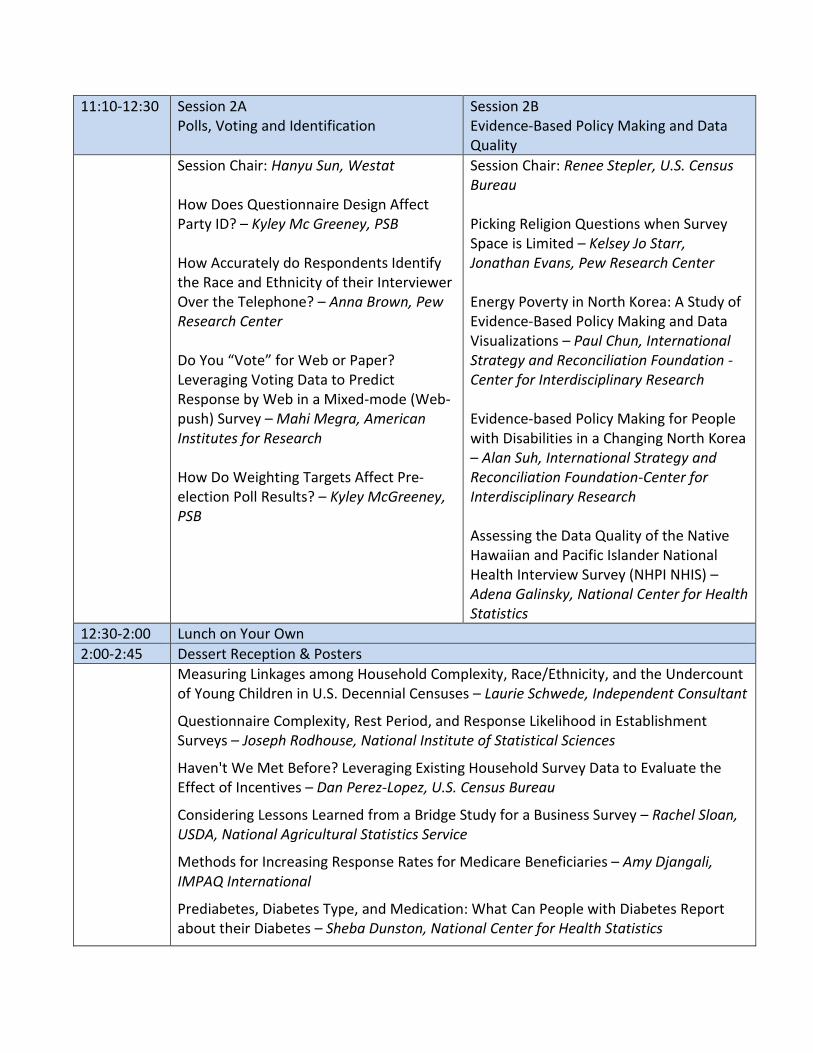
11:10-12:30 Session 2A Polls, Voting and Identification
Session 2B Evidence-Based Policy Making and Data Quality
Session Chair: Hanyu Sun, Westat How Does Questionnaire Design Affect Party ID? – Kyley Mc Greeney, PSB How Accurately do Respondents Identify the Race and Ethnicity of their Interviewer Over the Telephone? – Anna Brown, Pew Research Center Do You “Vote” for Web or Paper? Leveraging Voting Data to Predict Response by Web in a Mixed-mode (Web-push) Survey – Mahi Megra, American Institutes for Research How Do Weighting Targets Affect Pre-election Poll Results? – Kyley McGreeney, PSB
Session Chair: Renee Stepler, U.S. Census Bureau Picking Religion Questions when Survey Space is Limited – Kelsey Jo Starr, Jonathan Evans, Pew Research Center Energy Poverty in North Korea: A Study of Evidence-Based Policy Making and Data Visualizations – Paul Chun, International Strategy and Reconciliation Foundation - Center for Interdisciplinary Research Evidence-based Policy Making for People with Disabilities in a Changing North Korea – Alan Suh, International Strategy and Reconciliation Foundation-Center for Interdisciplinary Research Assessing the Data Quality of the Native Hawaiian and Pacific Islander National Health Interview Survey (NHPI NHIS) – Adena Galinsky, National Center for Health Statistics
12:30-2:00 Lunch on Your Own
2:00-2:45 Dessert Reception & Posters
Measuring Linkages among Household Complexity, Race/Ethnicity, and the Undercount of Young Children in U.S. Decennial Censuses – Laurie Schwede, Independent Consultant
Questionnaire Complexity, Rest Period, and Response Likelihood in Establishment Surveys – Joseph Rodhouse, National Institute of Statistical Sciences
Haven't We Met Before? Leveraging Existing Household Survey Data to Evaluate the Effect of Incentives – Dan Perez-Lopez, U.S. Census Bureau
Considering Lessons Learned from a Bridge Study for a Business Survey – Rachel Sloan, USDA, National Agricultural Statistics Service
Methods for Increasing Response Rates for Medicare Beneficiaries – Amy Djangali, IMPAQ International
Prediabetes, Diabetes Type, and Medication: What Can People with Diabetes Report about their Diabetes – Sheba Dunston, National Center for Health Statistics
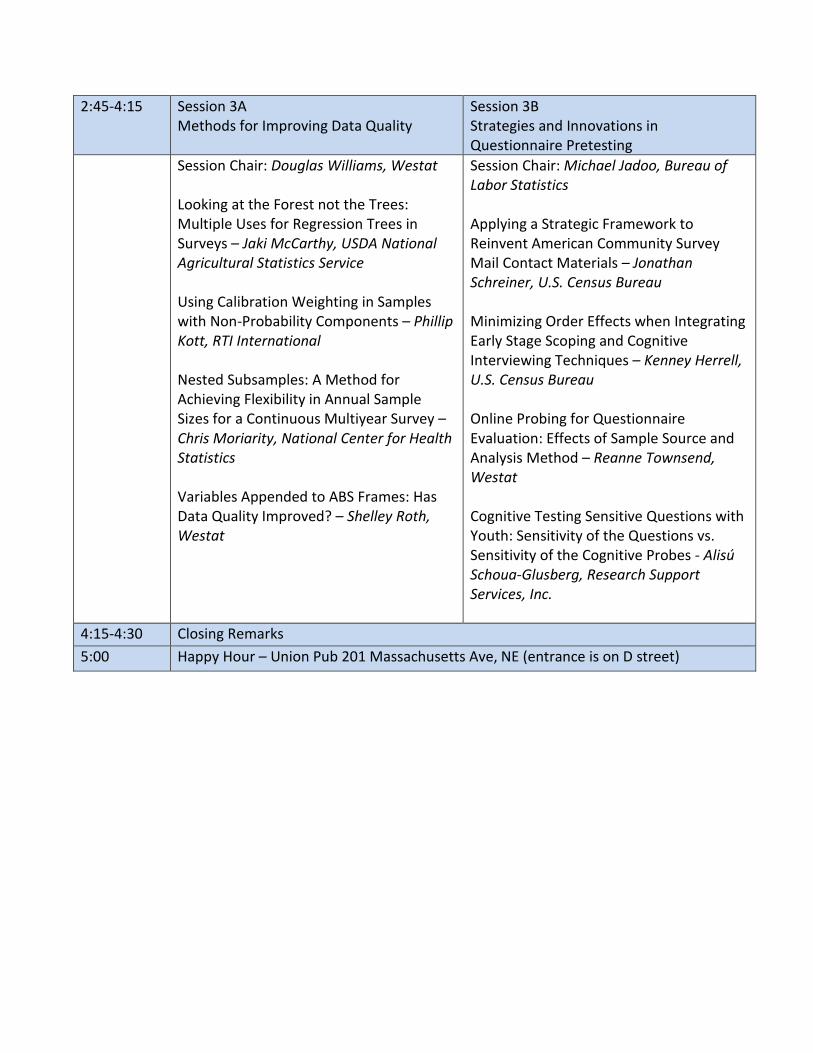
2:45-4:15 Session 3A Methods for Improving Data Quality
Session 3B Strategies and Innovations in Questionnaire Pretesting
Session Chair: Douglas Williams, Westat Looking at the Forest not the Trees: Multiple Uses for Regression Trees in Surveys – Jaki McCarthy, USDA National Agricultural Statistics Service Using Calibration Weighting in Samples with Non-Probability Components – Phillip Kott, RTI International Nested Subsamples: A Method for Achieving Flexibility in Annual Sample Sizes for a Continuous Multiyear Survey – Chris Moriarity, National Center for Health Statistics Variables Appended to ABS Frames: Has Data Quality Improved? – Shelley Roth, Westat
Session Chair: Michael Jadoo, Bureau of Labor Statistics Applying a Strategic Framework to Reinvent American Community Survey Mail Contact Materials – Jonathan Schreiner, U.S. Census Bureau Minimizing Order Effects when Integrating Early Stage Scoping and Cognitive Interviewing Techniques – Kenney Herrell, U.S. Census Bureau Online Probing for Questionnaire Evaluation: Effects of Sample Source and Analysis Method – Reanne Townsend, Westat Cognitive Testing Sensitive Questions with Youth: Sensitivity of the Questions vs. Sensitivity of the Cognitive Probes - Alisú Schoua-Glusberg, Research Support Services, Inc.
4:15-4:30 Closing Remarks
5:00 Happy Hour – Union Pub 201 Massachusetts Ave, NE (entrance is on D street)
ABSTRACTS – CONCURRENT SESSIONS
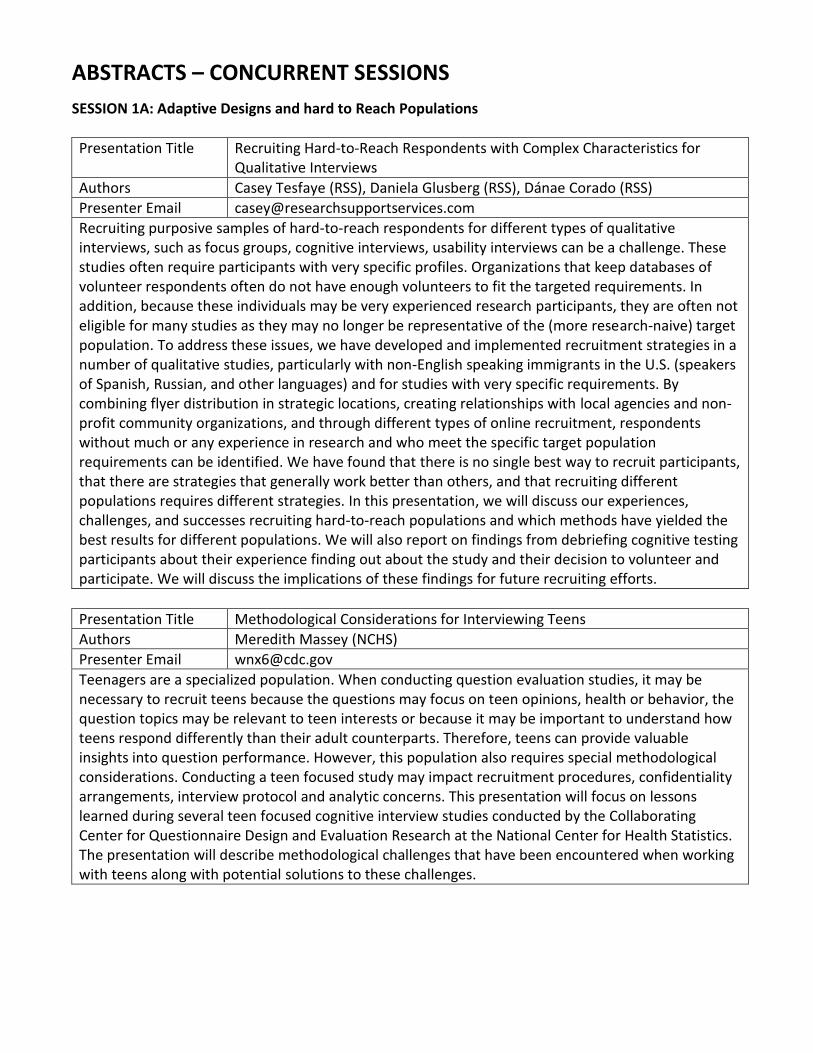
SESSION 1A: Adaptive Designs and hard to Reach Populations
Presentation Title Recruiting Hard-to-Reach Respondents with Complex Characteristics for Qualitative Interviews
Authors Casey Tesfaye (RSS), Daniela Glusberg (RSS), Dánae Corado (RSS)
Presenter Email [email protected]
Recruiting purposive samples of hard-to-reach respondents for different types of qualitative interviews, such as focus groups, cognitive interviews, usability interviews can be a challenge. These studies often require participants with very specific profiles. Organizations that keep databases of volunteer respondents often do not have enough volunteers to fit the targeted requirements. In addition, because these individuals may be very experienced research participants, they are often not eligible for many studies as they may no longer be representative of the (more research-naive) target population. To address these issues, we have developed and implemented recruitment strategies in a number of qualitative studies, particularly with non-English speaking immigrants in the U.S. (speakers of Spanish, Russian, and other languages) and for studies with very specific requirements. By combining flyer distribution in strategic locations, creating relationships with local agencies and non-profit community organizations, and through different types of online recruitment, respondents without much or any experience in research and who meet the specific target population requirements can be identified. We have found that there is no single best way to recruit participants, that there are strategies that generally work better than others, and that recruiting different populations requires different strategies. In this presentation, we will discuss our experiences, challenges, and successes recruiting hard-to-reach populations and which methods have yielded the best results for different populations. We will also report on findings from debriefing cognitive testing participants about their experience finding out about the study and their decision to volunteer and participate. We will discuss the implications of these findings for future recruiting efforts.
Presentation Title Methodological Considerations for Interviewing Teens
Authors Meredith Massey (NCHS)
Presenter Email [email protected]
Teenagers are a specialized population. When conducting question evaluation studies, it may be necessary to recruit teens because the questions may focus on teen opinions, health or behavior, the question topics may be relevant to teen interests or because it may be important to understand how teens respond differently than their adult counterparts. Therefore, teens can provide valuable insights into question performance. However, this population also requires special methodological considerations. Conducting a teen focused study may impact recruitment procedures, confidentiality arrangements, interview protocol and analytic concerns. This presentation will focus on lessons learned during several teen focused cognitive interview studies conducted by the Collaborating Center for Questionnaire Design and Evaluation Research at the National Center for Health Statistics. The presentation will describe methodological challenges that have been encountered when working with teens along with potential solutions to these challenges.

Presentation Title Adaptive Designs in Practice
Authors Gonzalo Rivero, Roger Tourangeau, Brad Edwards, and Tammy Cook (Westat)
Presenter Email [email protected]
Responsive designs for data collection are one of the most promising theoretical developments that tackle the falling response rates of probability surveys. Adapting the sample composition during the fielding period to incorporate available information about the observed cooperation from the selected sample is expected to increase efficiency and reduce the operational cost of data collection in relation to a fixed design. However, while appealing in theory, responsive designs pose a number of challenges for their practical implementation in face-to-face surveys. Firstly, the predicted propensity to respond of each case must be balanced with the expected sample composition in order to minimize biases from differential cooperation rates among subgroups. Second, the suggested plan of cases each interviewer is expected to work has to account for the geographical location of the respondents to ensure that our recommendations are feasible. Finally, instructions must be communicated in a timely way and also accounting for the potential resistance of interviewers to follow instructions based on predictions set by the home office. In this paper we discuss the experience of Westat in the design, development, implementation and testing of a full responsive design model for the PATH Reliability study. We focus on the analytical components of the design, with a particular emphasis on the predictive models for response propensity, the optimal routing model to help interviewers plan the day, and put special emphasis on the set of experiments that we deployed to measure interviewer compliance through alternative presentations of the instructions and the total effect on operational costs of alternative sample collection designs.
Presentation Title That Wasn’t Part of the Plan! Reducing Effort Through Stopping Rules to Place CAPI Cases on Hold and Work Plans to Set Them Free
Authors Ryan Hubbard (Westat)
Presenter Email [email protected]
CAPI studies rely on interviewers to make well-placed in-person attempts to secure completed interviews while containing costs. Unlike a long history of telephone studies, there are not well established stopping rules built most CAPI systems. When rules are set, they often trap viable cases or they are set to extremes that allow for cases to be severely overworked. A system implemented this year on a large-scale national longitudinal study automatically places cases into an on-hold status, removing them from interviewer laptops, based either on their low propensity for completion or based on a threshold of in-person attempts. This process occurs daily, notifying the field when a case has been placed on hold. These cases may be returned to the field for further work only after a supervisor develops a detailed work plan for the case that is approved by a field manager. Some cases remain on hold because the supervisor agrees the case should not be worked, but many case are reintroduced to the field and successfully completed with a well-regulated amount of additional effort. The field management staff has come to accept these procedures as they help them identify at risk cases, and it gives them the latitude to decide which of these cases has the best chance of success and should continue to be worked. The overall effect has been a reduction of roughly 1.2 attempts per case, roughly 20% reduction of effort. Analysis indicates no significant effect on key estimates or response rate, and the approach is flexible enough to apply differing criteria to cases in different groups, such as cases in a locating status or soft refusals in addition to standard cases. Field management ownership of the process has allowed for great success while avoiding the push-back normally associated with the imposition of limits in the field.

SESSION 1B: Survey Burden, Confidentiality and Privacy
Presentation Title Using Card-Sorting Strategies to Examine Persuasive and Confidentiality Messaging in Surveys of Businesses
Authors Aryn Hernandez, Krysten Mesner, Diane Willimack (US Census Bureau)
Presenter Email [email protected]
The U.S. Census Bureau’s economic surveys rely on sample businesses’ participation in order to produce accurate and reliable statistics about the status of the U.S. economy. While many of the Census Bureau’s business surveys are mandatory, we prefer to persuade response rather than threaten legal consequences of nonresponse. This requires effective persuasive communication with businesses and their communities. This need for effective survey communication with businesses is heightened in an all-electronic collection environment. Without a paper questionnaire or interviewer intervention, letters become the primary means of making contact, both initially and for nonresponse follow-up. Research has demonstrated that business respondents pay limited attention to much of the content of the letters they receive from statistical organizations, usually focusing on login instructions, mandatory notices, and due dates. Nevertheless, U.S. Federal statistical agencies are legally required to provide respondents with specific information about response burden, confidentiality, privacy, and cybersecurity associated with survey participation. In addition, research indicates that survey participation among business respondents may be motivated by information about how their data are used. Census Bureau researchers recently conducted testing of various messages with business respondents. In this paper, we describe strategies and methodologies we used to test statements informing respondents about privacy policies and data use. Of particular interest is our use of a card-sorting strategy to gauge business respondents’ knowledge of our use of their reported data, identify persuasive appeals that resonate, and, in the end, sequence proposed letter content to be most compelling from their perspective. Paired with traditional cognitive methods and statistical analysis of message rankings, the card-sort revealed useful, sometimes surprising, results.

Presentation Title Hackers, Phish, and Breaches: Qualitative Census Bureau Research on Respondent Perceptions of Privacy and Data Security
Authors Aleia Fobia, Jennifer Childs (US Census Bureau)
Presenter Email [email protected]
Since 2012, the Census Bureau has conducted ongoing research designed to investigate respondent perceptions of privacy and confidentiality messages. In this presentation, we draw on multiple sources of qualitative data collected over a six-year time period. Specifically, beginning in 2012, English focus groups were conducted in more than five states and designed to measure privacy and confidentiality concerns as a follow-up to yearly Census Tests. Second, cognitive interview projects included testing privacy and confidentiality messaging both online and in-person from 2015 to 2018. This breadth of qualitative data allows insight into respondent perceptions of their data security and fears and concerns about their privacy over time. As the decade has progressed, the salience of issues of data security and privacy of personal information has fluctuated. This presentation highlights these fluctuations and how respondents interpret such changes in relation to government data collection and the Census in particular. Respondent concerns tend to coalesce around the government having too much data, fears about hacking, and loss of control of their information. High profile data breaches, whether of public or private data, are prominent reminders to respondents about data security and hacking. These concerns are heightened when respondents are asked about responding to the Census online, despite evidence of the pervasive belief that most data are already publicly available. Reminders about Title 13 protections and the data items that the decennial census collects tend to reassure respondents. However, fears about data security seem to have intensified in the most recent qualitative data collected in the wake of high profile data breaches of personal, sensitive information and a general climate of distrust in media and government. This presentation will discuss possible implications for the 2020 Census.
Presentation Title Evaluating Perceived Burden of Household Survey Respondents
Authors Daniel Yang (Bureau of Labor Statistics)
Presenter Email [email protected]
Survey modifications could potentially impact respondent burden. A measure of respondent’s burden would allow us to track how burden is affected by the survey changes over time. There is a tradeoff between respondent’s burden and their behavior toward the survey. Increased burden could potentially lead to respondents’ non-response in subsequent waves or less accurate answers to questions, which could in turn introduce bias affecting overall data quality. Burden measurement would allow us to monitor changes in burden response following modifications to the survey, to evaluate the association between burden response and other survey measures of interest, and to develop interventions that reduce respondents’ perception of burden which in turn would reduce burden-induced biases and improve data quality. Using the data from the 2012 Consumer Expenditure Surveys (CE) Quarterly Interview, in which respondents were asked ten questions on perceived burden at the end of the final wave of the interviews, we developed a procedure to implement multivariate techniques to construct a composite burden score for survey respondents. We investigated the performance of a single burden question compared to a composite burden index using indirect indicators of data quality such as the number of don’t knows and refusals. This process would allow CE to assess whether it is sufficient to measure burden in a single question for data quality analyses, and to monitor the effects of survey changes on respondent burden over time. We also explored CE respondent burden proxy indicators by using the nonparametric recursive partitioning method which adjusts for complex sampling design.

Presentation Title Survey features and respondent characteristics that contribute to objective and subjective measures of burden
Authors Robin Kaplan, Scott Fricker, (Bureau of Labor Statistics)
Presenter Email [email protected]
Respondent burden can have a negative impact on data quality, responses rates, and other important survey outcomes. However, burden is sometimes defined as the amount of time it takes to complete a survey (objective burden), versus respondents’ appraisals of how burdensome a survey is (subjective burden), which can have multiple dimensions. Few studies have measured both types of burden in a single survey to determine whether certain survey features (e.g., detailed questions, question order) and respondent characteristics (e.g., engagement with the survey) contribute to each – the goal of the present study. Participants (N=1,003) completed an online survey about how they spend their time. They completed a time diary where they entered all of their activities from the previous 24-hour period – a task requiring attention to detail and memory. Then participants completed items that measured how engaged they were with the survey (e.g., “I found it difficult to stay focused on the survey”). Finally, they rated how burdensome, effortful, difficult, and sensitive they found the survey (presented in random order). We found that time spent on the time diary predicted subjective burden, but not the total time spent completing the survey. Ratings of how effortful and sensitive participants found the survey, and feeling as though the survey was too long, were associated with increased subjective burden. In contrast, level of interest and being more engaged with the survey was associated with decreased subjective burden. Objective burden was associated with time spent on the time diary and how difficult participants found the survey. We found little to no differences in subjective burden ratings based on the order in which the items about effort, difficulty, and sensitivity were presented. We discuss the implications of these findings for furthering our understanding of survey features and respondent characteristics that may influence both objective and subjective burden and data quality outcomes.

SESSION 2A: Polls, Voting and Identification
Presentation Title How Does Questionnaire Design Affect Party ID?
Authors Kyley McGeeney, Jennifer Miller-Gonzalez, Haley Tran (PSB)
Presenter Email [email protected]
What impact, if any, do question order and survey context have on self-reported party identification? Previous studies have examined how party ID may change depending on when in the survey it is asked (order effect). Other studies have looked at how the topic of the survey affects respondents’ self-reported party ID (context effect). However, none have look at the interaction between question position and survey topic nor have they done so in a web survey. To answer this question PSB conducted an experiment using a 2x2 factorial design in an online monthly tracking study. Respondents were recruited to either a political or a non-political survey, and within each, they were randomly asked party ID at the beginning or at the end of the survey. We examine the effect of position and survey topic on the distribution of party ID.
Presentation Title How accurately do respondents identify the race and ethnicity of their interviewer over the telephone?
Authors Anna Brown (Pew Research)
Presenter Email [email protected]
While many studies have found that an interviewer’s race or ethnicity can influence responses to race-related questions, both face-to-face and on the telephone, few researchers have studied how respondents actually perceive their interviewer’s race or ethnicity over the phone. A 2016 Pew Research Center telephone survey found that respondents often misidentified their interviewer’s race or ethnicity. The survey, which focused on the topic of race relations, racial equality and discrimination, included a question at the end of the survey: “You may not have thought about this … but if you had to guess, would you say I am white, black, Hispanic, Asian or some other race? Just your best guess is fine.” About half of respondents overall (49%) guessed a race or ethnicity that didn’t match the interviewer’s self-identified race or ethnicity, while 40% guessed “correctly” and 11% said they could not make a guess or refused to answer. Respondents were particularly likely to guess incorrectly if their interviewer was not white. Given the relatively high likelihood of a respondent misidentifying their interviewer’s race or ethnicity over the telephone, establishing an interviewer’s perceived race or ethnicity may be more relevant than an interviewer’s self-identified race or ethnicity when it comes to investigating the interviewer race effect. In this survey, perceived interviewer race had an impact on some potentially sensitive race-related questions, but not others.
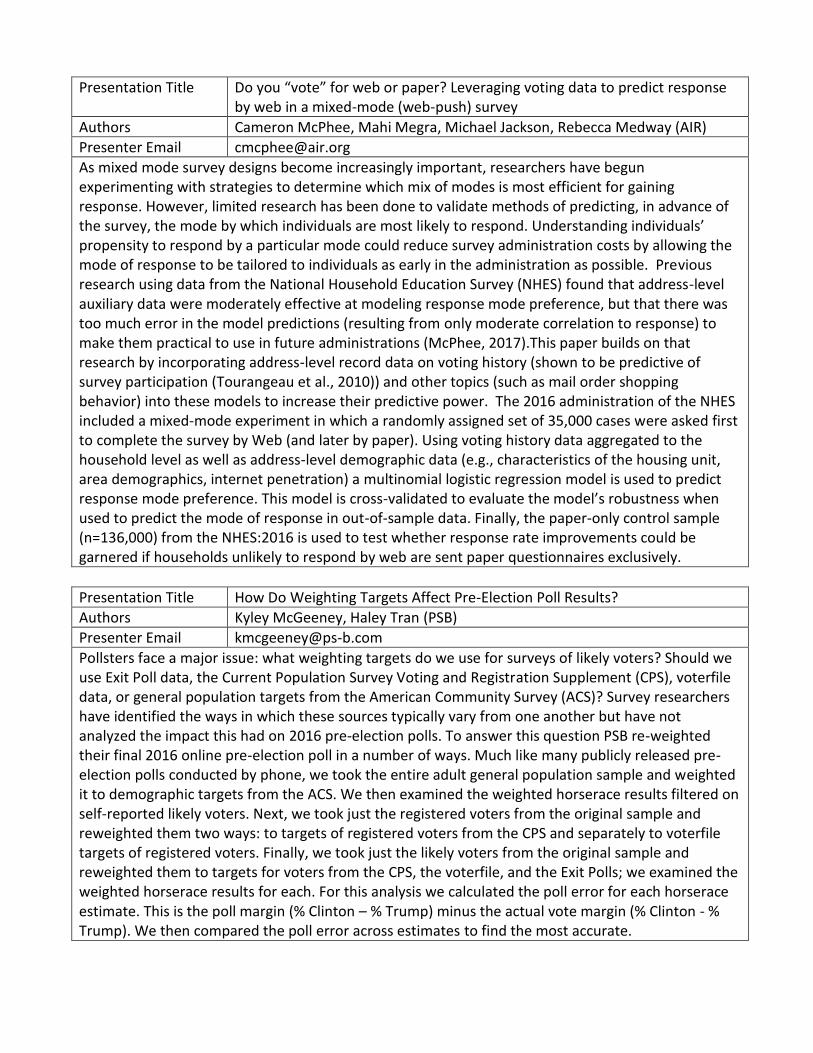
Presentation Title Do you “vote” for web or paper? Leveraging voting data to predict response by web in a mixed-mode (web-push) survey
Authors Cameron McPhee, Mahi Megra, Michael Jackson, Rebecca Medway (AIR)
Presenter Email [email protected]
As mixed mode survey designs become increasingly important, researchers have begun experimenting with strategies to determine which mix of modes is most efficient for gaining response. However, limited research has been done to validate methods of predicting, in advance of the survey, the mode by which individuals are most likely to respond. Understanding individuals’ propensity to respond by a particular mode could reduce survey administration costs by allowing the mode of response to be tailored to individuals as early in the administration as possible. Previous research using data from the National Household Education Survey (NHES) found that address-level auxiliary data were moderately effective at modeling response mode preference, but that there was too much error in the model predictions (resulting from only moderate correlation to response) to make them practical to use in future administrations (McPhee, 2017).This paper builds on that research by incorporating address-level record data on voting history (shown to be predictive of survey participation (Tourangeau et al., 2010)) and other topics (such as mail order shopping behavior) into these models to increase their predictive power. The 2016 administration of the NHES included a mixed-mode experiment in which a randomly assigned set of 35,000 cases were asked first to complete the survey by Web (and later by paper). Using voting history data aggregated to the household level as well as address-level demographic data (e.g., characteristics of the housing unit, area demographics, internet penetration) a multinomial logistic regression model is used to predict response mode preference. This model is cross-validated to evaluate the model’s robustness when used to predict the mode of response in out-of-sample data. Finally, the paper-only control sample (n=136,000) from the NHES:2016 is used to test whether response rate improvements could be garnered if households unlikely to respond by web are sent paper questionnaires exclusively.
Presentation Title How Do Weighting Targets Affect Pre-Election Poll Results?
Authors Kyley McGeeney, Haley Tran (PSB)
Presenter Email [email protected]
Pollsters face a major issue: what weighting targets do we use for surveys of likely voters? Should we use Exit Poll data, the Current Population Survey Voting and Registration Supplement (CPS), voterfile data, or general population targets from the American Community Survey (ACS)? Survey researchers have identified the ways in which these sources typically vary from one another but have not analyzed the impact this had on 2016 pre-election polls. To answer this question PSB re-weighted their final 2016 online pre-election poll in a number of ways. Much like many publicly released pre-election polls conducted by phone, we took the entire adult general population sample and weighted it to demographic targets from the ACS. We then examined the weighted horserace results filtered on self-reported likely voters. Next, we took just the registered voters from the original sample and reweighted them two ways: to targets of registered voters from the CPS and separately to voterfile targets of registered voters. Finally, we took just the likely voters from the original sample and reweighted them to targets for voters from the CPS, the voterfile, and the Exit Polls; we examined the weighted horserace results for each. For this analysis we calculated the poll error for each horserace estimate. This is the poll margin (% Clinton – % Trump) minus the actual vote margin (% Clinton - % Trump). We then compared the poll error across estimates to find the most accurate.

SESSION 2B: Evidence-Based Policy Making and Data Quality
Presentation Title Picking religion questions when survey space is limited
Authors Kelsey Jo Starr, Jonathan Evans, Neha Sahgal, Scott Gardner, Ariana Salazar (Pew Research Center)
Presenter Email [email protected]
It is commonly understood that religious affiliation, beliefs and practices correlate with social issues, including attitudes toward gay marriage and abortion. As such, those conducting surveys on non-religion topics often want to include questions on religion for reporting purposes or for use as statistical controls when attempting to explain social, political or economic attitudes. However, there is often limited space to devote to religion questions in such a context. This presentation outlines the best religion questions to include for use as statistical controls, especially if overall space is limited. Data from a large-scale US survey and 5 international surveys are included.
Presentation Title Energy Poverty in North Korea: A Study of Evidence-Based Policy Making and Data Visualizations
Authors Paul Chun (International Strategy and Reconciliation Foundation - Center for Interdisciplinary Research), Giang Nguyen (University of Iowa), Helene Cho (University of Pennsylvania), Asaph Young Chun (US Census Bureau)
Presenter Email [email protected]
The purpose of the paper is to demonstrate the power of evidence-based policy making in developing countries by combining multiples sources of data, leveraging data analytics, and conducting data visualization. As a case study, we investigate fundamentals of energy supplies and demands in the Democratic People’s Republic of Korea (DPRK, also known as, North Korea) and provide information useful to policymakers with a goal to assess energy needs and solutions tailored to the North Korean population. DPRK has been extensively relying on hydroelectric power and consumable energy such as coal and wood. The former has been quite unstable due to the outdated infrastructure of hydroelectric plants that is not amenable to drastic changes in weather like drought and floods. The latter has its limit to fill the energy needs of the population in DPRK due to limited resources. This paper examines energy poverty in DPRK with that of other countries to inform the process of energy policy making in DPRK and provides evidence-based policy implications to neighboring countries and the United Nations.
Presentation Title Evidence-based Policy Making for People with Disabilities in a Changing North Korea
Authors Alan Suh (International Strategy and Reconciliation Foundation-Center for Interdisciplinary Research), Allison Conners (University of Toronto), Helene Cho (University of Pennsylvania), Asaph Young Chun (US Census Bureau)
Presenter Email [email protected]
The recent meeting between Chairman Kim Jong Un and President Donald Trump has led to The Democratic People’s Republic of Korea (DPRK, or known as North Korea) being on the spotlights once again. However, in comparison to the extensive media coverage and public discussion that the DPRK leaders and government receive, there are seldom reliable data about the health and daily experiences of 25 million ordinary people in DPRK known as a hermit kingdom. Mending this gap between DPRK and the rest of the world will take time, with the first steps being empirical studies conducted on the Korean people. While the most recent North Korean census was conducted in 2008, and a nutritional survey in 2012, little work has been done to analyze the data and its implications for informing evidence-based policy at the local, national and international levels. This paper takes a rare step in taking North Korea out of the vacuum of public discourse by investigating disabilities in a regional and global context and including the disabled people of DPRK in an informed analysis. We analyzed the data from the 2008 DPRK Population Census to examine reported prevalence and incidence of disabilities and linked the census data to the 2012 DPRK Nutrition Survey to explore correlates of disabilities among people of the DPRK. Research findings are informed by extensive data visualizations that provide insights behind mere numbers. We discuss the challenges of defining and quantifying disability, data discrepancies between self-reported health and the informed estimates, and the lack of reliable data in developing countries. Despite these drawbacks, we find it is in the best interests of health researchers, survey practitioners and policy makers to provide empirical data about the disabled people in DPRK and examine their characteristics with those in neighboring countries where the comparable data are available. Our paper sets a precedent for further empirical survey research and informed policy discussion on the disabled people in the DPRK.
Presentation Title Assessing the Data Quality of the Native Hawaiian and Pacific Islander National Health Interview Survey (NHPI NHIS)
Authors Adena Galinsky, Carla E. Zelaya, Catherine Simile, Patricia M. Barnes (NCHS)
Presenter Email [email protected]
The Native Hawaiian and Pacific Islander National Health Interview Survey (NHPI NHIS) was the first federal survey designed exclusively to measure the health of the NHPI population of the United States. This groundbreaking survey could be a model for other federal surveys of rare and hard-to-survey populations –assuming the quality of the resulting dataset was adequate. This paper assesses some aspects of the quality of the 2014 NHPI NHIS data, by examining if and how estimates of NHPI population characteristics calculated using the survey’s data differ significantly from estimates of the same characteristics calculated using data from two other sources: the sampling frame for the 2014 NHPI NHIS (a single recent year of the U.S. Census Bureau’s American Community Survey) and the annual NHIS for combined years 2010–2014. Estimates of 13 of the 18 demographic characteristics examined were similar. The NHPI NHIS estimate of the percentage of the NHPI population with the marital status “separated” was higher, and the percentage that was Hispanic was lower, relative to corresponding estimates from the other two data sources. The percentages of NHPI households that were rented, had only one NHPI resident, and had at least one Hispanic resident, were lower. Three of the 24 NHPI NHIS population health estimates differed from the same estimates calculated using the 2010–2014 NHIS data, but they mirrored trends in the broader population between 2010 and 2014. Finally, the magnitude and direction of estimates of associations derived from logistic regression models, which used sex and age to predict health outcomes, were comparable across models estimated using the 2014 NHPI NHIS data and, separately, the 2010-2014 NHIS data. We discuss the implications of our results for users of the NHPI NHIS dataset as well as for those planning surveys of rare and hard-to-survey populations.

POSTER SESSION
Poster Title Measuring Linkages among Household Complexity, Race/Ethnicity, and the Undercount of Young Children in U.S. Decennial Censuses
Authors Laurie Schwede (Independent Consultant), Eric Jensen (US Census Bureau), Deborah Griffin (Independent Consultant)
Presenter Email [email protected]
The age cohort with the highest undercount rate in the 2010 Census was young children ages 0 to 4, with higher rates for non-Hispanic Black and Hispanic young children. In what types of households were children missed? Can we use complex households to identify and target at-risk households in the 2020 Census? We document 2010 Census linkages among complex households, race/ethnicity, and the young child undercount and offer suggestions to improve 2020 Census coverage. Data are from 3 sources: the 2000 and 2010 Censuses and the 2010 Coverage Followup (CFU). Complex households with young children increased faster than complex households overall from 2000 to 2010 with wide variation by race/ethnicity. New CFU analysis documents that complex households with young children had higher likelihoods than noncomplex households of positive responses to census undercount probes and higher actual add rates for young children. Disaggregation showed clear race/ethnic variation. Just three complex household types accounted for 61% of all CFU young child adds in 2010 Census: households with other nonrelatives; those with "other relatives"; and multigenerational households. Just these 3 types also accounted for the majority of young child adds within each of the race alone/Hispanic groups. The authors suggest that for the 2020 Census, tracts with high proportions of these three complex household types be targeted for special outreach, enumeration, follow up and evaluation to improve the accuracy of the young child count.
Poster Title Questionnaire Complexity, Rest Period, and Response Likelihood in Establishment Surveys
Authors Joseph Rodhouse (National Institute of Statistical Sciences), Tyler Wilson, Heather Ridolfo (National Agricultural Statistics Service)
Presenter Email [email protected]
Research has demonstrated that response burden has negative impacts on survey response overall. However, recent evidence from household surveys has shown that people sampled in more than one survey are more likely to respond to the next survey they get if the previous survey was more difficult to complete, regardless of the length of the rest period in between the two surveys. These nascent findings are surprising, and since the mechanisms influencing response in household and establishment surveys are different in important ways, an examination of this phenomenon in the establishment survey realm is warranted. To do this, six data sets from the U.S. Department of Agriculture’s National Agricultural Statistics Service are used: the 2013 and 2014 Agricultural Resource Management Surveys (phase III), the 2014 and 2015 March Agricultural Surveys, and the 2014 and 2015 June Acreage and Production Surveys. Overall, this research finds sampled establishments have significantly higher odds of responding to a subsequent survey if a survey with a complex questionnaire precedes it. These results, along with recent similar findings in household surveys, are counter to conventional wisdom on response burden, and suggest that more research is needed to better understand survey-to-survey response effects.

Poster Title Haven't We Met Before? Leveraging Existing Household Survey Data to Evaluate the Effect of Incentives
Authors Dan Perez-Lopez, Andy Welton (US Census Bureau)
Presenter Email [email protected]
Household survey response rates have been consistently falling for the last twenty years and considerably so over the last ten years. While non-response doesn’t bias all items similarly, it does lower the overall credibility of the survey as a whole. The redesigned 2014 Survey of Income and Program Participation included an incentive experiment where sampled households were randomly assigned a $0, $20, or $40 incentive. The incentives proved modestly successful at increasing response rates. However, incentives do not possess uniform efficacy across subgroups and may not necessarily decrease non-response bias. Unfortunately, survey frames do not include demographic information and practitioners rarely know the characteristics of non-responding households. In this poster we examine the feasibility of linking the 2014 Survey of Income and Program Participation sampling frame to the Master Demographic File pilot project at the Census Bureau in order to identify the demographics of all sampled households (including non-respondents). In our research we find that although we cannot match all sample units to other data sources, we can gain insight into the efficacy of incentives across subgroups. However, a response propensity model developed using respondents and nonrespondents did not show a difference in the share of complete interviews from low-propensity households between the different incentive conditions.
Poster Title Considering Lessons Learned from a Bridge Study for a Business Survey
Authors Rachel E. Sloan, Kenneth M. Pick, Robyn Sirkis, Pamela D. McGovern (National Agricultural Statistics Service)
Presenter Email [email protected]
Bridge studies, where a sub-sample uses a new set of procedures, allow questionnaires to be tested in a production environment to possibly obtain statistically significant results and understand how changes to questionnaires may impact the data series (Love 2014). While researchers often suggest conducting bridge studies, they cannot always do them due to the difficulty of maintaining the data series (Pascale 2016). In 2017, the National Agricultural Statistical Service (NASS) conducted a bridge study using a new version of the Agricultural Labor Survey Computer Assisted Telephone Interviewing (CATI) questionnaire for a sub-sample of respondents during data collection. The Agricultural Labor Survey is a biannual business survey sent to farms and ranches within the United States, with each iteration of the survey collecting information for two one-week reference periods. Cognitive testing conducted for the primary method of data collection, CATI, revealed that respondents had difficulty categorizing their workers according to one of the Standard Occupation Codes (SOC) used in the survey. Many of these businesses attempted to report employees under multiple categories to reflect the employees’ multiple roles, not understanding that each worker was to only be reported under one category. This finding, among others, served as an impetus to develop a new CATI questionnaire for the survey. In this new questionnaire, worker categories were renamed to better reflect the category and reordered to mitigate question order effects found during cognitive testing. Instructions and transitions were also added to improve questionnaire flow. To test the efficacy of this questionnaire, NASS fielded it during production with a sub-sample of respondents to understand how it would impact survey estimates while still maintaining the Agricultural Labor data series. This presentation describes the results and lessons learned from conducting this bridge study which may inform and benefit other survey organizations planning bridge studies.

Poster Title Methods for increasing response rates for Medicare beneficiaries
Authors Amy Djangali, Jacob Joseph-David (IMPAQ), Frost Hubbard (IMPAQ/Westat)
Presenter Email [email protected]
Over the last two decades, literature on Medicare beneficiaries has consistently found that non-Whites, 18-44 year olds, and those who are less healthy are less likely to respond to surveys than other beneficiaries. Since its inception in 2016, The Kidney Disease Quality of Life Survey (KDQOL) has used a sequential mixed mode design (mail with telephone follow-up) to collect quality of life data from end-stage renal disease (ESRD) Medicare beneficiaries. The 2016 survey response rates were lower for the same groups of ESRD beneficiaries that we identified in the literature. In 2017, the IMPAQ survey team implemented several protocol changes in an attempt to increase response among these low responding groups. The overall response rate increased significantly. In this presentation we provide the results of protocol changes we implemented to better target low responding groups. Spanish Language targeting: This includes the creation of a predictive model to identify respondents who were most likely to speak Spanish and provided English and Spanish materials in the same envelope. Mode preference: by analyzing 2016 data, we identified groups that were less likely respond to the mail survey and those who would require additional telephone follow-up efforts (i.e. African Americans, Hispanics, and 18-54 year olds), we began telephone follow-up with these groups two weeks earlier than previous survey administrations. The overall impact of these changes resulted in a 5% response rate increase over the previous year’s results with larger response rate gains for African Americans (5%), Hispanics (10%), and younger respondents (6%).
Poster Title Prediabetes, Diabetes Type, and Medication: What Can People with Diabetes Report about their Diabetes
Authors Sheba K. Dunston, Sarah Lessem (NCHS)
Presenter Email [email protected]
National estimates of many health behaviors, conditions, and diagnosed diseases come from self-reported information from population-level surveys such as the National Health Interview Survey (NHIS). These estimates are used to inform policy and understand relationships between various health conditions and population demographics. If respondents misunderstand survey questions, do not know the answers to them, or cannot place their experiences into one of the response categories, the population level estimates may be flawed. This study uses data from 45 cognitive interviews conducted in 2015 by the National Center for Health Statistics to examine how respondents interpret questions about diabetes and instances where they give responses to survey questions that differ from what they say about their experiences with diabetes during cognitive interviews. Type 1 and type 2 diabetes are very different conditions, with different causes, treatments, and courses. Prediabetes is a state of elevated blood sugar which has not yet reached the clinical level that defines diabetes. Insulin is a medication taken through shots or pumps. Insulin is required by people with type 1 diabetes and is sometimes used by people with type 2 diabetes. Three key areas of confusion emerged. First, some respondents did not know the difference between prediabetes and diabetes. Several thought of diabetes as a continuum with prediabetes being a precursor to type 1 diabetes and type 2, 3, or 4 the last stage. Second, many respondents had false or incomplete ideas about the difference between Type 1 and Type 2 diabetes. Third, a few respondents were unclear about insulin, believing there was a pill form of insulin or that there were no non-insulin treatments for diabetes.

SESSION 3A: Methods for Improving Data Quality
Presentation Title Looking at the Forest not the Trees: Multiple Uses for Regression Trees in Surveys
Authors Jaki McCarthy (USDA/NASS)
Presenter Email [email protected]
Classification and regression trees have been widely used in surveys to generate nonresponse survey weights. Classification trees can be used as an alternative to logistic regression models or designating weighting classes and have some significant advantages other those approaches. However, survey methodologists may be able to find other creative applications of classification trees in surveys. In NASS, for example, we have used classification trees to model response propensities and identify sample units more likely to refuse and more likely to be noncontacts. Instead of using these trees for nonresponse weighting, they have been used in adaptive design strategies to proactively alter data collection protocols, devoting more or differential resources to those with higher/lower response propensities. Classification trees have also been used to explore measurement errors. Applied this way, trees can identify groups of records more likely to commit these errors. The characteristics of these records helped guide selection of respondents for subsequent cognitive interviews. Classification trees can be useful in many ways for survey methodologists. This paper will discuss how they have been applied by NASS and other potential applications. In addition, the advantages they have over other approaches will also be discussed. Survey organizations can look beyond a single tree to a potential forest of uses.
Presentation Title Using Calibration Weighting in Samples with Non-Probability Components
Authors Phillip Kott, Jamie Ridenhour (RTI International)
Presenter Email [email protected]
We use two web-and-mail surveys on US attitudes about the use of marijuana to demonstrate how a web-recruited cohort of adults can be integrated into an address-based sample of adults using a calibration-weighting procedure in the software language SUDAAN 11®. Delete-a-group jackknife weights for the integrated sample are then developed so that analysis of the combined set of respondents could be conducted and hypotheses derived from the data could be tested. We discuss the application of this approach first to a previous survey of Oregon residents and then to the nationwide survey.
Presentation Title Nested Subsamples: a Method For Achieving Flexibility in Annual Sample Sizes For a Continuous Multiyear Survey
Authors Chris Moriarity, Van Parsons (National Center for Health Statistics)
Presenter Email [email protected]
A new requirement for the most recent National Health Interview Survey (NHIS) sample redesign, implemented in 2016, was annual sample size flexibility. The new sample design accomplished this requirement by selecting a large initial sample, and then assigning sequential identifiers within the large sample. A given annual sample is obtained by including sample parts associated with the sequential identifiers, in order, until the desired annual sample size is obtained. We describe the research undertaken to implement this flexibility, including what was done after the discovery that one part of the sequential identifier assignment process needed to be redone.

Presentation Title Variables Appended to ABS Frames: Has Data Quality Improved?
Authors Shelley Roth, Andrew Caporaso, Jill DeMatteis (Westat)
Presenter Email [email protected]
As response rates to household surveys continue to fall and conducting surveys via telephone, both landline and cell, presents ever-growing complications of data collection efforts and coverage, using address based sampling (ABS) to conduct household surveys via mail and telephone or web has become current state-of-the-art methodology. Increased use of ABS by survey researchers in recent years has led to a desire for increased quality of data available on ABS frames. The goals of this research are to evaluate data quality of demographic variables provided on recent ABS frames from one vendor, and to examine their potential usefulness for sample design, including oversampling. Given the continued decline in response rates and general lack of available information for sampled households that fail to respond to surveys, we will also examine the potential of some ABS frame data to be used for weighting adjustments for nonresponse. Quality of frame data will be evaluated by examining the completeness of these items as well as their concordance with data reported by respondents to a recent large ABS household survey with a rich set of analysis variables, collected using mail to invite participants to complete the survey on the web. Using frame data for sample design purposes or for nonresponse adjustments to the survey weights will each be evaluated based on the results of our assessment of the quality of the frame data.

SESSION 3B: Strategies and Innovations in Questionnaire Pretesting
Presentation Title Applying a Strategic Framework to Reinvent American Community Survey Mail Contact Materials
Authors Jonathan Schreiner, Broderick Oliver (US Census Bureau)
Presenter Email [email protected]
One challenge facing survey designers is how to respond to decreasing survey response rates. Improving messaging in mail contact materials is one potential way to reverse this trend. While research has addressed how to communicate individual messages in a way that encourages people to respond to a survey, less is known about how to sequence those messages across multiple mail contacts. The U.S. Census Bureau recently developed a strategic framework to guide the development of messaging across multiple mail contacts for the American Community Survey (ACS). The research in this presentation is the first step toward testing that framework. This presentation highlights over two decades of Census research and experimental testing that has led to numerous changes to ACS mail materials and improvements in ACS self-response rates. We also provide results from an evaluation of current ACS mail contact materials and messaging in the context of the strategic framework. The analysis shows that current ACS materials have improved over time, but messaging is repetitive and not purposefully organized across mailings. To conclude, we provide recommendations for how to reinvent existing materials and messages to conform to the guidance provided by the strategic framework.
Presentation Title Minimizing Order Effects when Integrating Early Stage Scoping and Cognitive Interviewing Techniques
Authors Kenny Herrell, Kristin Stettler (US Census Bureau)
Presenter Email [email protected]
Early Stage Scoping (ESS) interviews can help to learn how respondents understand the survey's key concepts, before the questions are written (Stettler and Featherston, 2010). Though similar in some ways to cognitive interviews, ESS interviews have a broader focus and touch on topics like record keeping, terminology, respondent identity, and other aspects of the business' organizational knowledge and practices, without the pretext of draft survey questions. Herrell et al. (2017) integrated ESS techniques into cognitive interviews pretesting an organizational survey, when initial cognitive interviews revealed that the concepts needed further exploration. In this paper, we address issues with integrating ESS and cognitive interviewing techniques while pretesting a series of questions on the use of robotics in manufacturing. Although survey sponsors provided draft questions, we recognized little research had been done on the underlying concept of robotics use in manufacturing. To address this, we created an interview protocol with two parts: one part covers ESS questions, and the other focuses on cognitive interview questions. When developing this protocol, we encountered issues that made it difficult to determine whether ESS questions or cognitive interview questions should come first: Would discussing robotics in broader ESS terms first influence how respondents perceive draft survey questions during the cognitive interview portion? Would starting with the cognitive interview process influence how respondents perceive the broader topics covered in the ESS portion? Are there varying degrees of influence in either scenario, or does one scenario have less impact than the other? To investigate potential order effects with integrating these two methodologies, we conducted half of the pretest interviews using ESS questions first, and in the other half, cognitive interview questions came first. This paper compares findings to identify and evaluate the impact of any order effects, and offers recommendations on structuring pretest interviews to minimize order effects.
Presentation Title Online probing for questionnaire evaluation: Effects of sample source and analysis method
Authors Reanne Townsend, Rosalynn Yang, Kristin Chen, Gonzalo Rivero, & Terisa Davis (Westat), Gordon Willis, Stephanie Fowler, & Richard Moser (NIH)
Presenter Email [email protected]
Widespread access to the internet has enabled new potential methods for testing questionnaire items. One promising method is Online Probing (or Web Probing), which administers open-ended probe questions within an internet survey to assess targeted questionnaire items. Recent work in this area has emphasized the value of Online Probing as a complimentary testing technique, rather than a replacement for in-person cognitive interviewing (see Edgar & Scanlon 2017; Meitinger & Behr 2016). A few studies have experimented with Online Probing procedures to determine whether features such as text box size and probe location affect data quality (e.g. Behr, Bandilla, Kaczmirek & Braun 2014; Fowler et al 2017). However many questions remain about how other features of Online Probing study design may influence results. This study examines the effect of two different design decisions on the results and conclusions from an Online Probing study. We use responses to an Online Probe about perceived cancer risk, which was administered retrospectively to approximately 3,000 respondents following an abbreviated version of the Health Information National Trends Survey (HINTS) instrument. First, we investigate how the sample method used to recruit respondents affects the amount and quality of information that respondents provide. We compare responses from three different sample sources: 1) GfK KnowledgePanel, a probability-based web panel, 2) YouGov, a nonprobability web panel using demographic quotas, and 3) Amazon’s Mechanical Turk, using no demographic quotas. Second, we examine how different analytical techniques affect both thematic patterns and substantive conclusions drawn from Online Probing responses. Responses are analyzed using two approaches: 1) a traditional, “by hand” approach, using codes assigned by two researchers, and 2) a machine learning approach, using unsupervised keyword extraction. These analyses will help identify design decisions that may affect data quality and substantive conclusions derived from the use of Online Probing for questionnaire evaluation.

Presentation Title Cognitive Testing Sensitive Questions with Youth: Sensitivity of the Questions vs. Sensitivity of the Cognitive Probes
Authors Alisú Schoua-Glusberg, Jessie Engel, Daniela Glusberg, (Research Support Services Inc. Inc.) Christine Lindquist, Nakisa Asefnia (RTI International)
Presenter Email [email protected]
While established methodology for cognitive interviewing can be broadly applied in general, some research may require revised or adapted methodology to achieve study goals. “Cognitive interviewing is a valuable tool for improving the quality of survey responses when the respondents are children… Nevertheless, there are likely to be problems if researchers want to solicit children’s attitudes to sensitive topics.” (Ogan et al. 2012) Between 2015 and 2017, we conducted four rounds of cognitive testing of questions on school climate to be added to school surveys in the U.S. The questions were designed to measure student perceptions of school climate related to sexual misconduct at school and outside of school. Cognitive testing of the questions was conducted among a purposive sample of middle and high school students between the ages of 10 and 18. Questions were of a sensitive nature dealing with issues such as sexual harassment and sexual assault among students, as well as school resources for students in such situations. The main purpose of the cognitive testing was to make sure that the proposed survey questions were clear and uniformly interpreted by potential respondents. Our findings showed that, while students in general expressed that the actual questions did not make them uncomfortable, interviewers reported that many respondents appeared uncomfortable when responding to cognitive probes asking them to elaborate on their interpretation of the questions. This research indicated that the cognitive process for determining how well questions are understood can introduce some complicated variables when testing sensitive questions, particularly with children. This presentation will discuss our findings and their implications for future design of cognitive testing guides when dealing with potentially sensitive topics, particularly for young respondents.
Related Documents