Jacqueline Jansen [email protected] Information Builders DB2 Web Query: Creating Dashboards with HTML Composer and InfoAssist

Welcome message from author
This document is posted to help you gain knowledge. Please leave a comment to let me know what you think about it! Share it to your friends and learn new things together.
Transcript
Jacqueline [email protected] Builders
DB2 Web Query:Creating Dashboards with HTML
Composer and InfoAssist

Dashboard Creation Agenda
HTML Composer Add push buttons, hyperlinks, images and
reports– Can be used to build an HTML launch page
Add multiple, chained parameters Create a complete dashboard
– Add pre-existing reports and graphs– Create multiple tabs
Create a Rich Internet Application (RIA) to create an interactive Web page experience inside a browser
InfoAssist Compound Documents Coordinated Fields Active Report regular and cascaded controls InfoMini

Recorded Webcast
Step by step demonstration of creating a tabbed dashboard
ibm.com/systems/i/db2/webquery=>DB2 Web Query Webinar Series

Creating a new HTML page
HTML Composer is part of Developer Workbench
Navigate to the folder where the HTML page is to be stored and right click on the folder name
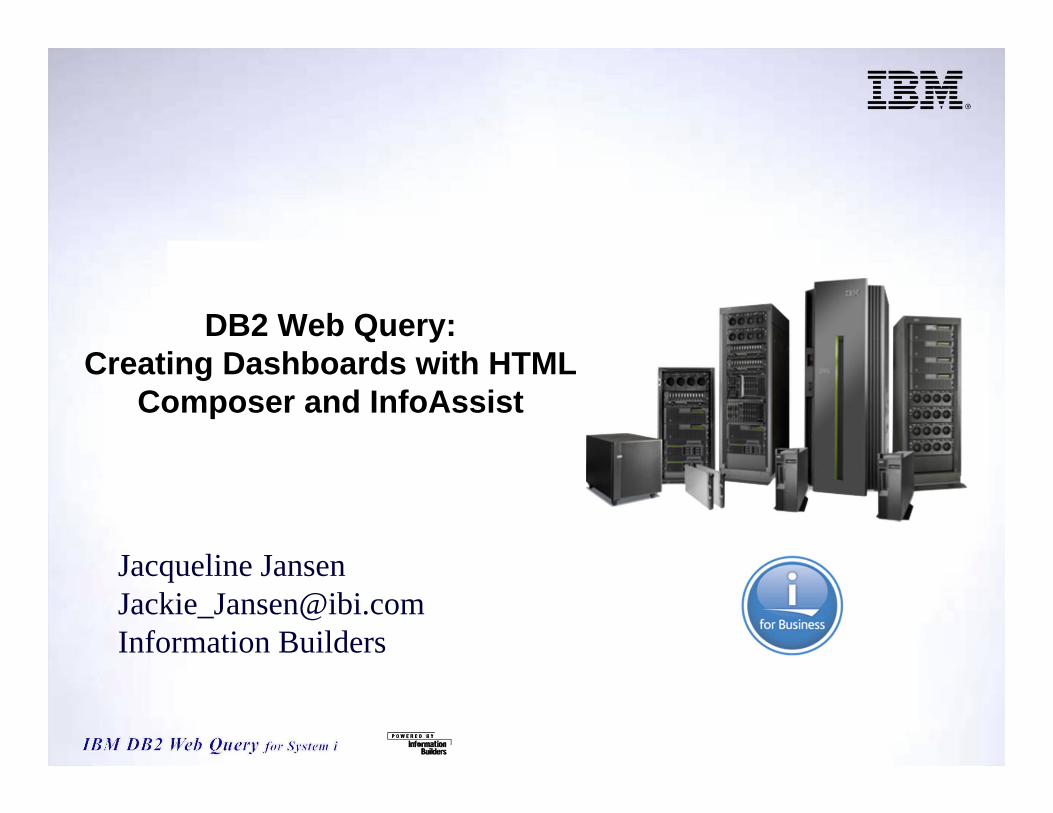
Tabs: Optional Inserting Initial Tab
Adding Tabs
Auto Arranging tabs
Moving existing graphs/reports into a tab body– Use the ALT key when you drag and drop
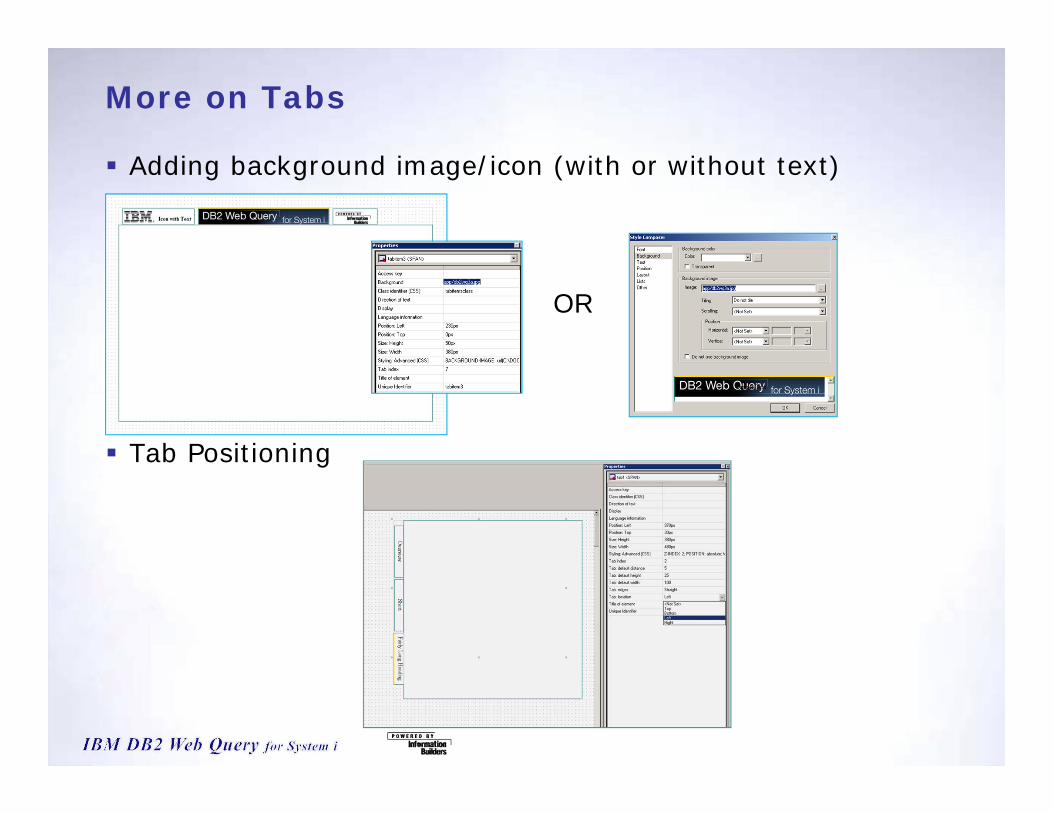
More on Tabs
Adding background image/icon (with or without text)
Tab Positioning
OR
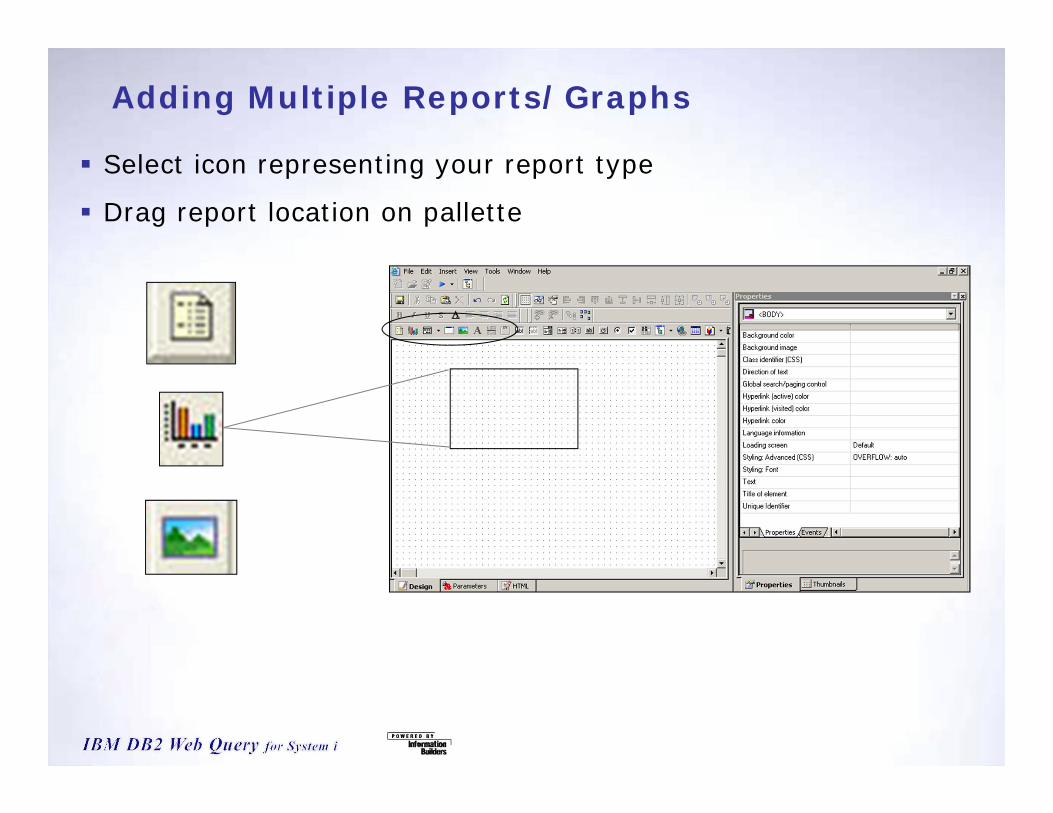
Adding Multiple Reports/Graphs
Select icon representing your report type
Drag report location on pallette
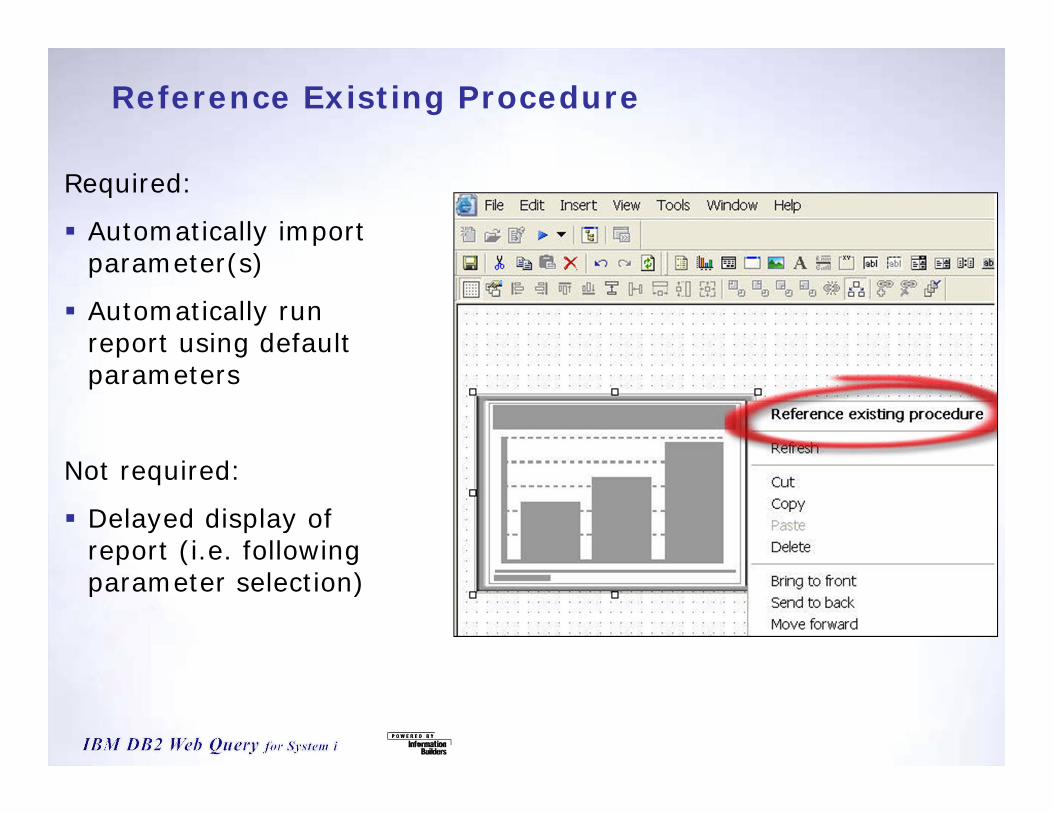
Reference Existing Procedure
Required:
Automatically import parameter(s)
Automatically run report using default parameters
Not required:
Delayed display of report (i.e. following parameter selection)
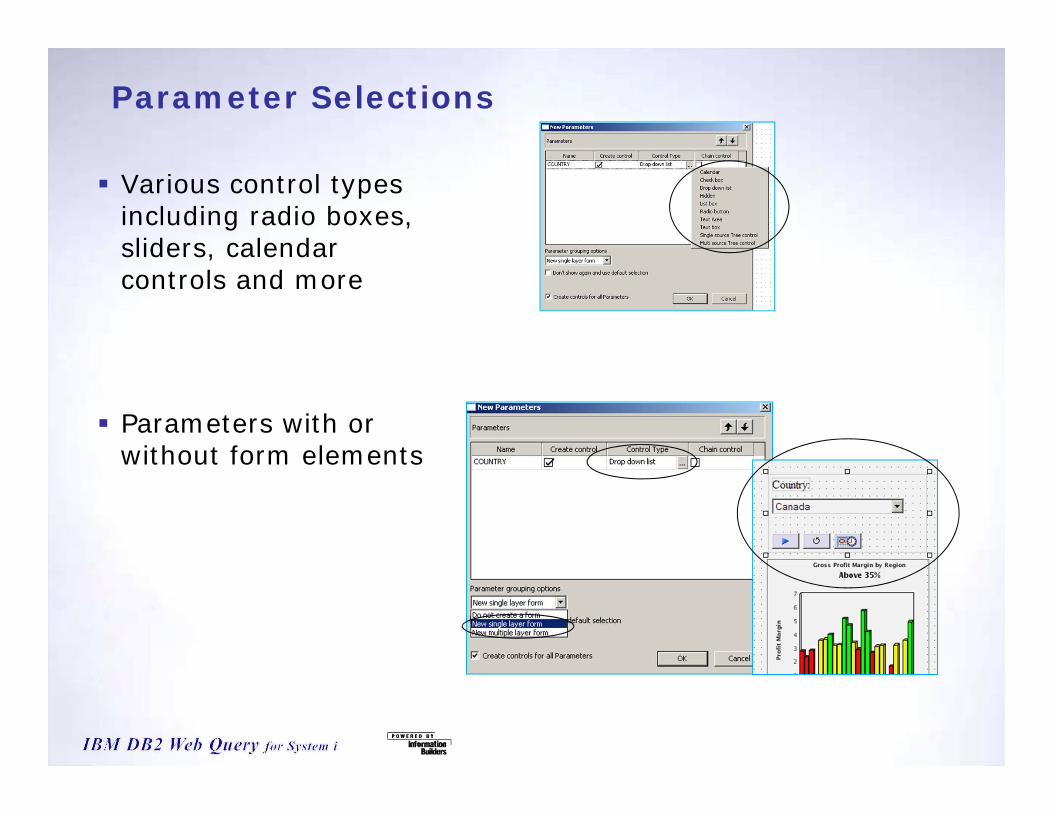
Parameter Selections
Various control types including radio boxes, sliders, calendar controls and more
Parameters with or without form elements
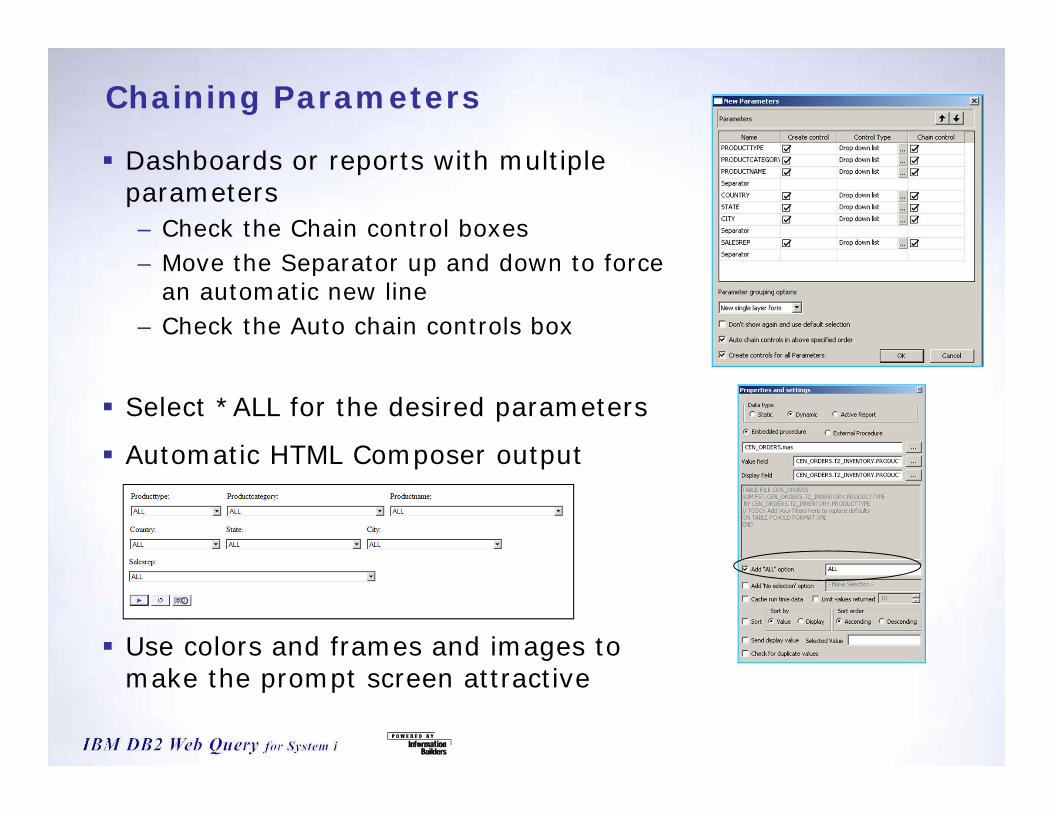
Chaining Parameters
Dashboards or reports with multiple parameters– Check the Chain control boxes– Move the Separator up and down to force
an automatic new line– Check the Auto chain controls box
Select *ALL for the desired parameters
Automatic HTML Composer output
Use colors and frames and images to make the prompt screen attractive
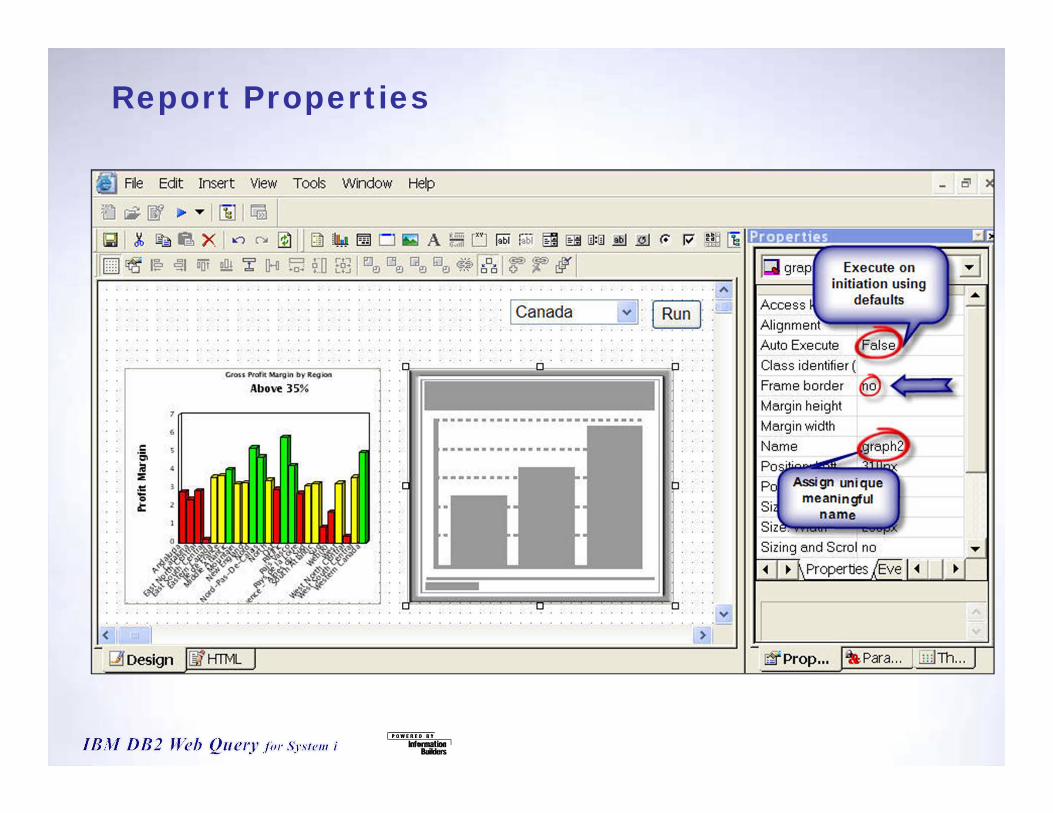
Report Properties
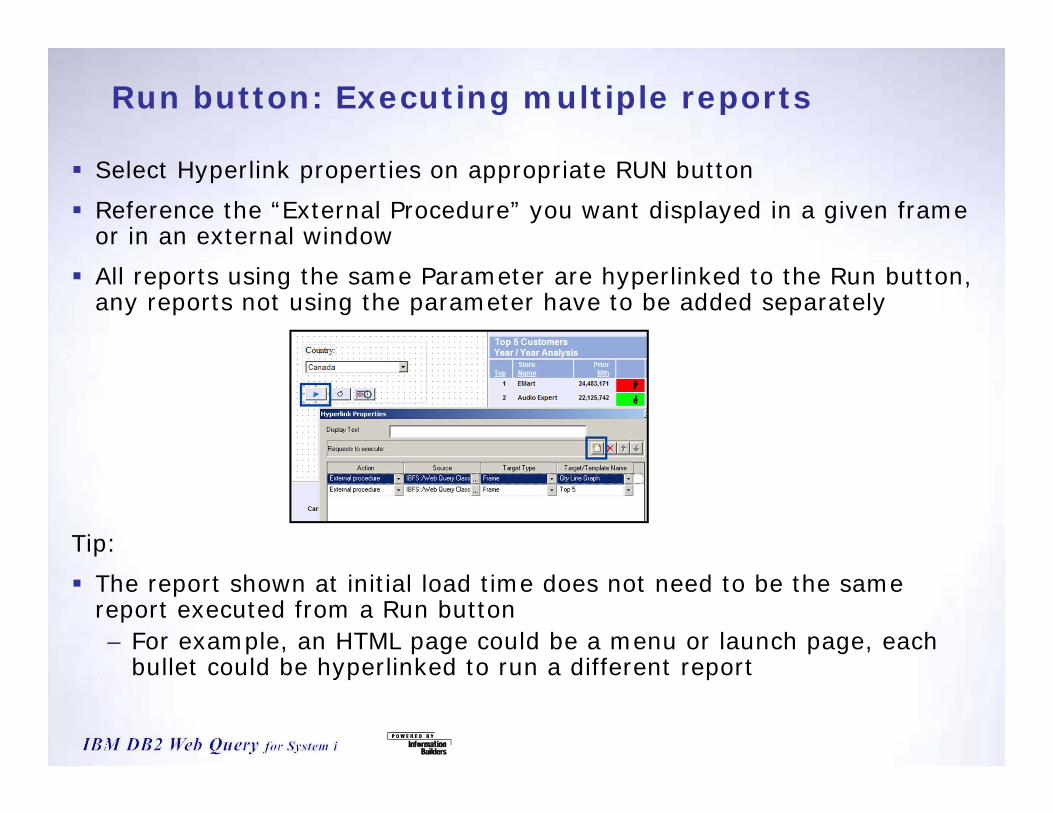
Run button: Executing multiple reports
Select Hyperlink properties on appropriate RUN button Reference the “External Procedure” you want displayed in a given frame
or in an external window All reports using the same Parameter are hyperlinked to the Run button,
any reports not using the parameter have to be added separately
Tip: The report shown at initial load time does not need to be the same
report executed from a Run button– For example, an HTML page could be a menu or launch page, each
bullet could be hyperlinked to run a different report
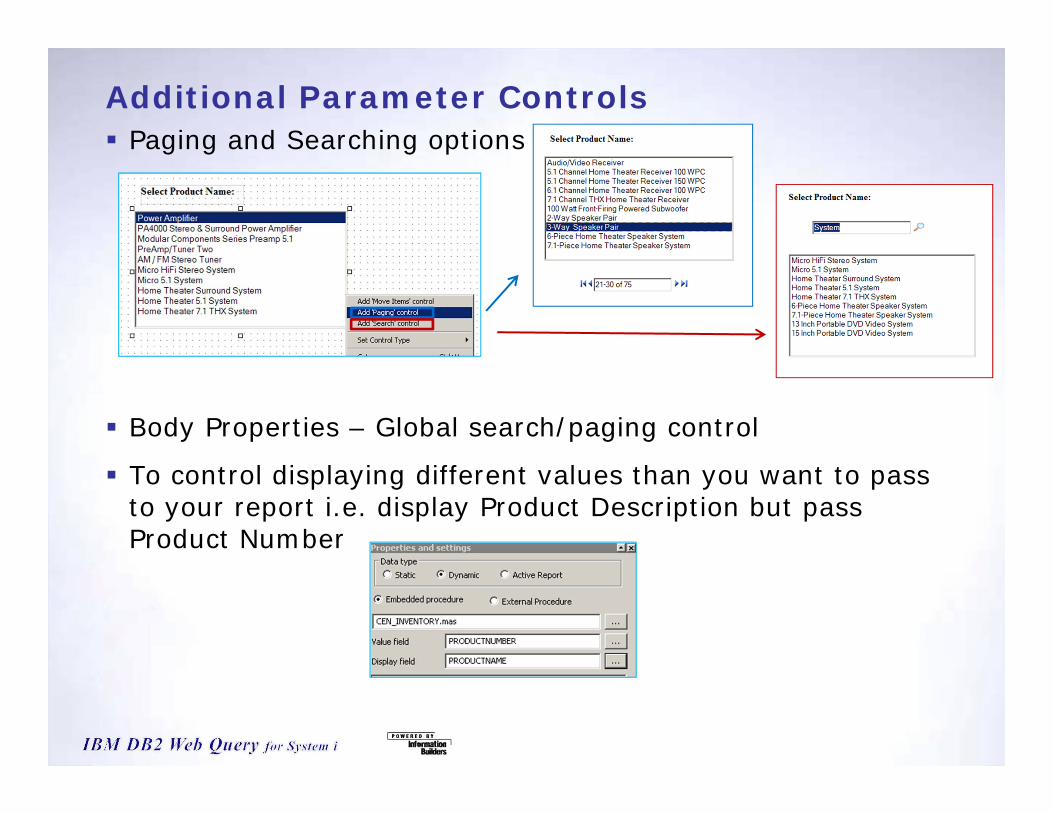
Additional Parameter Controls Paging and Searching options
Body Properties – Global search/paging control
To control displaying different values than you want to pass to your report i.e. display Product Description but pass Product Number
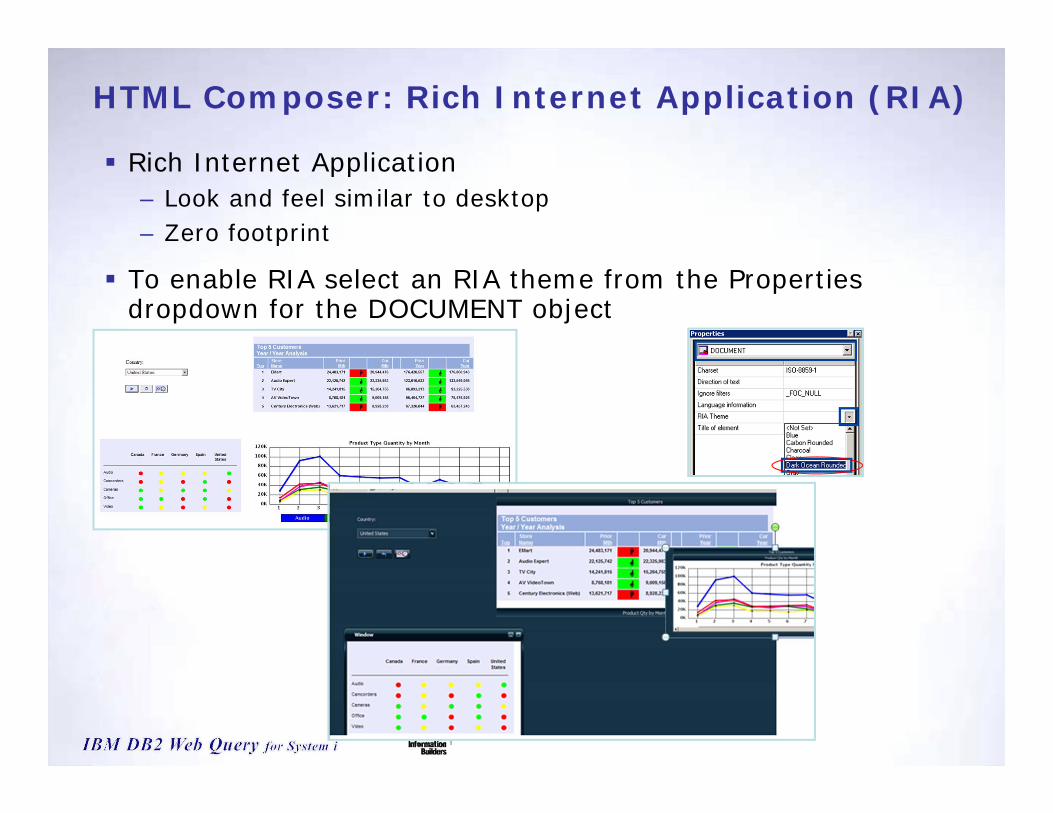
HTML Composer: Rich Internet Application (RIA)
Rich Internet Application– Look and feel similar to desktop– Zero footprint
To enable RIA select an RIA theme from the Properties dropdown for the DOCUMENT object
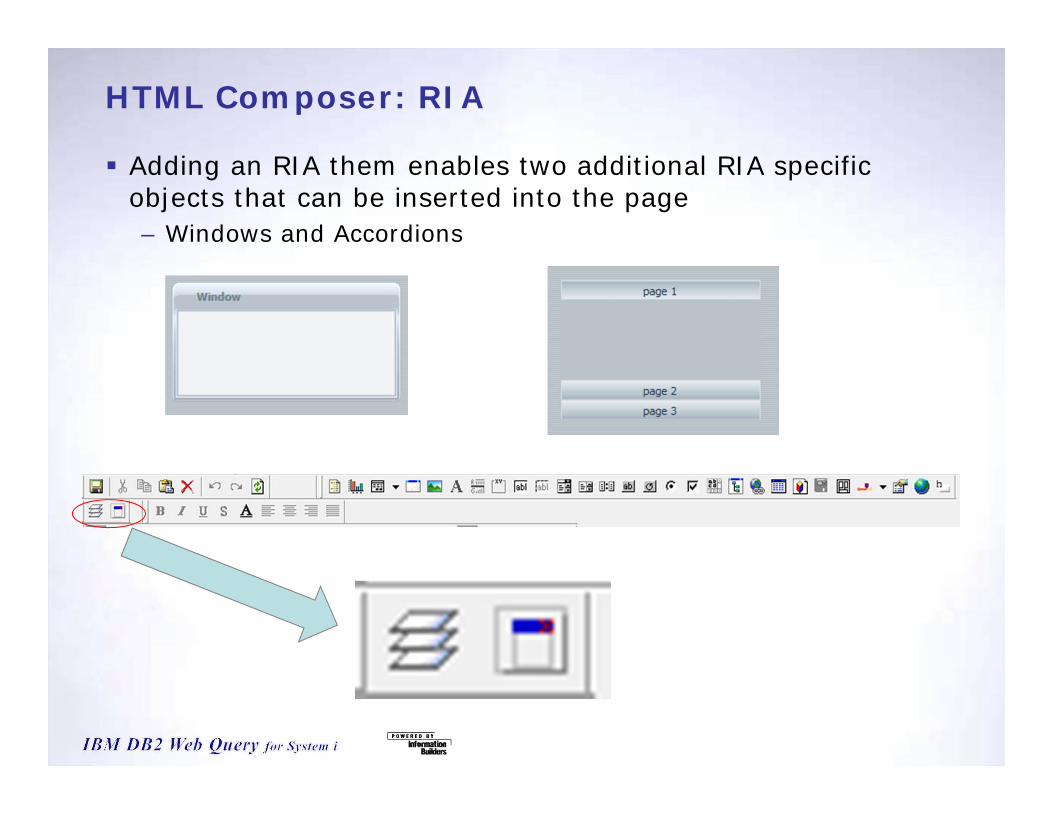
HTML Composer: RIA
Adding an RIA them enables two additional RIA specific objects that can be inserted into the page– Windows and Accordions
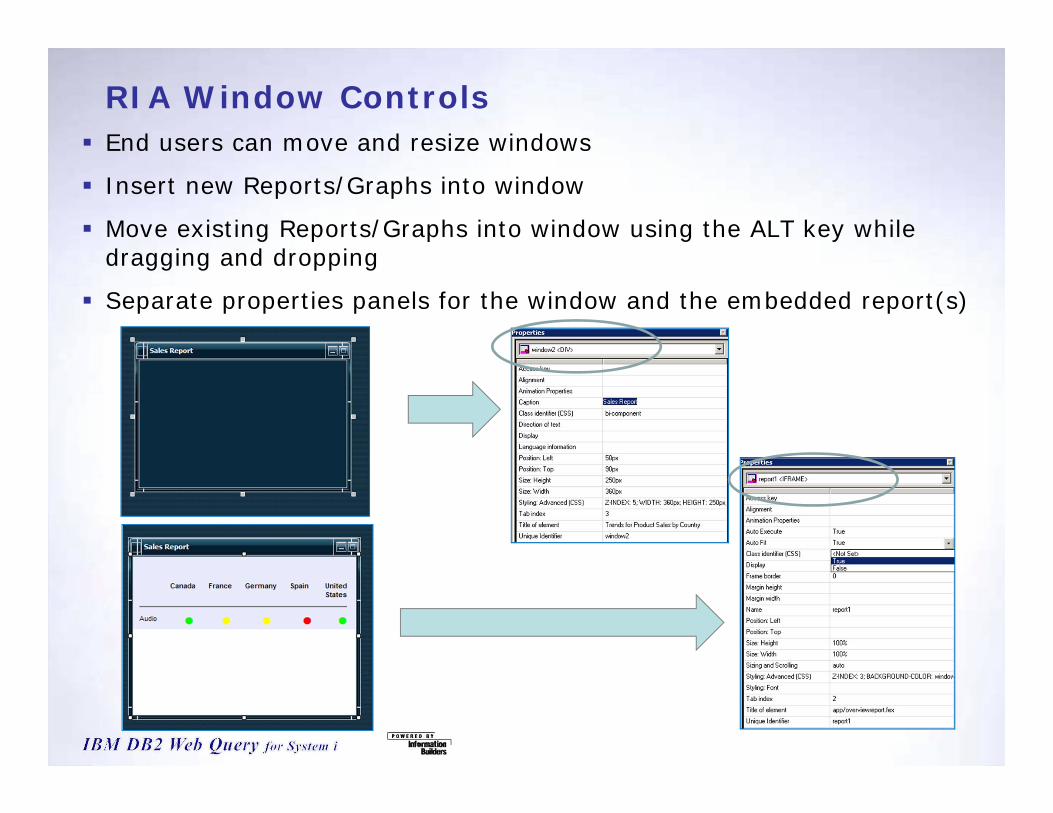
RIA Window Controls End users can move and resize windows
Insert new Reports/Graphs into window
Move existing Reports/Graphs into window using the ALT key while dragging and dropping
Separate properties panels for the window and the embedded report(s)
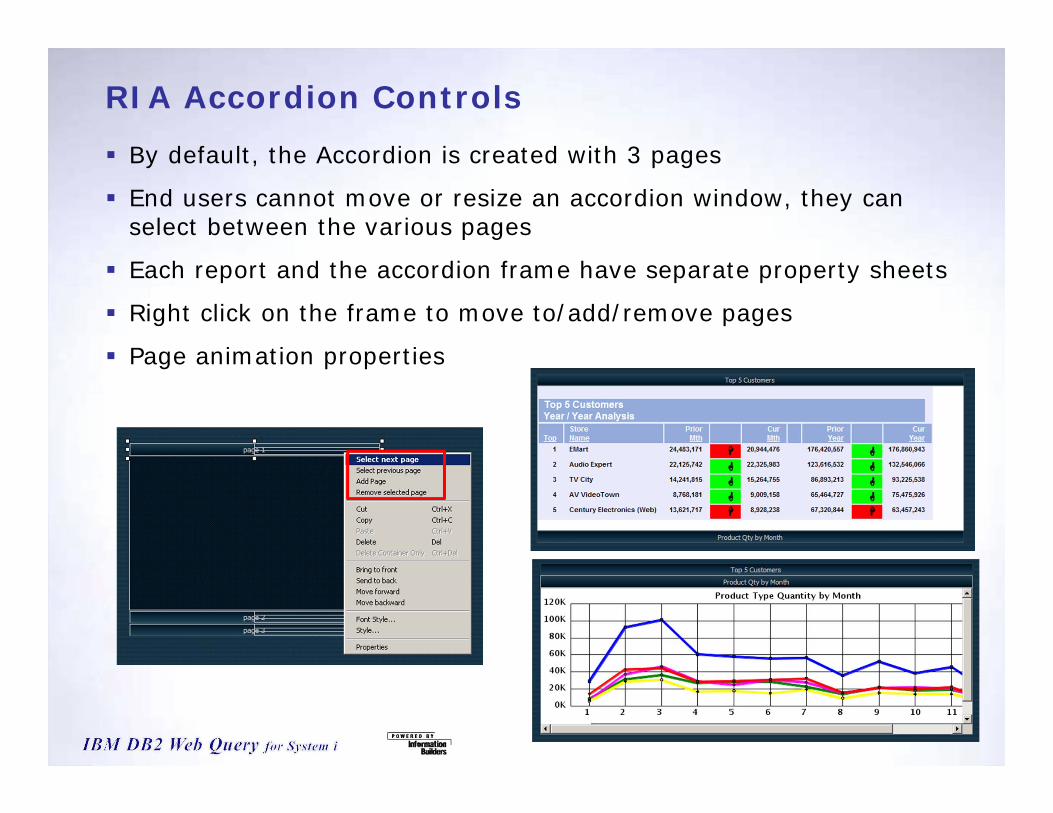
RIA Accordion Controls
By default, the Accordion is created with 3 pages
End users cannot move or resize an accordion window, they can select between the various pages
Each report and the accordion frame have separate property sheets
Right click on the frame to move to/add/remove pages
Page animation properties
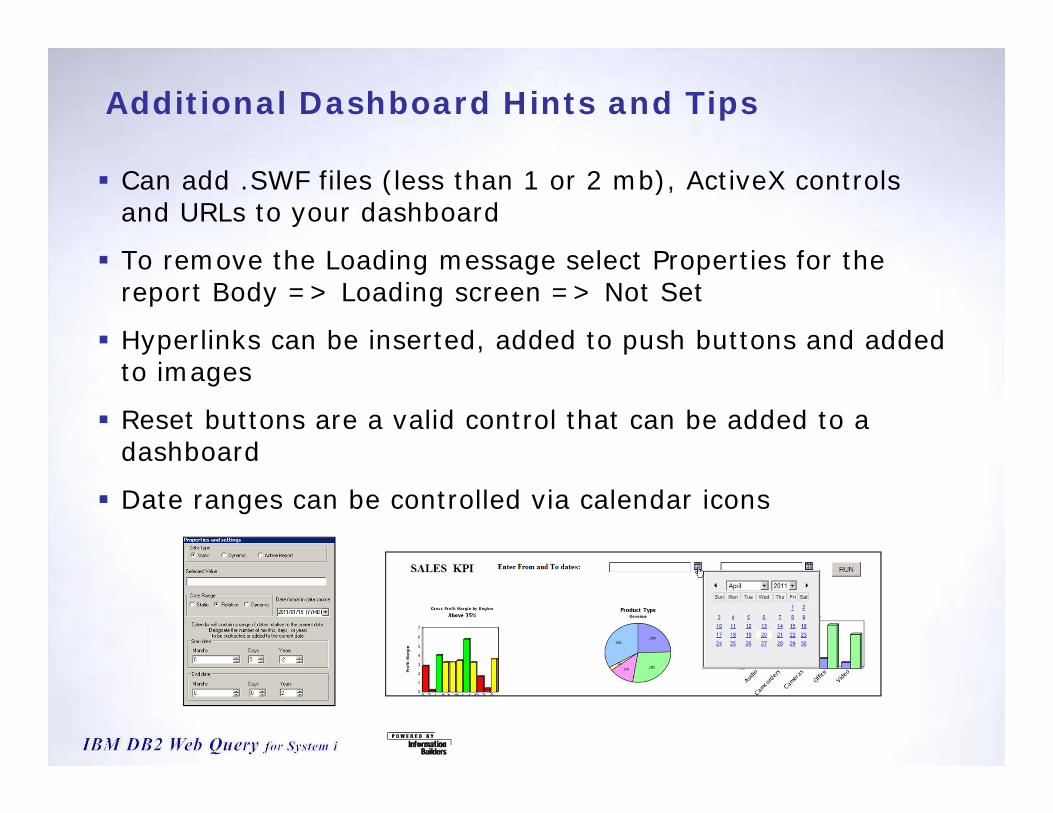
Additional Dashboard Hints and Tips
Can add .SWF files (less than 1 or 2 mb), ActiveX controls and URLs to your dashboard
To remove the Loading message select Properties for the report Body => Loading screen => Not Set
Hyperlinks can be inserted, added to push buttons and added to images
Reset buttons are a valid control that can be added to a dashboard
Date ranges can be controlled via calendar icons
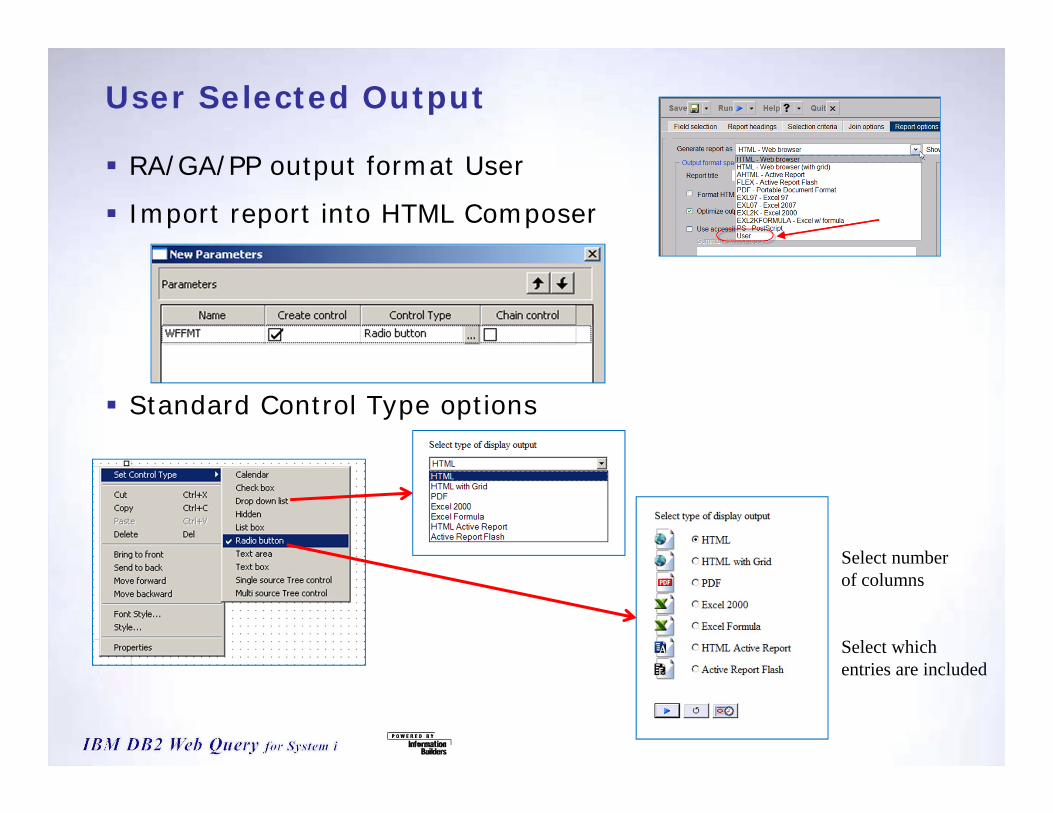
User Selected Output
RA/GA/PP output format User
Import report into HTML Composer
Standard Control Type options
Select numberof columns
Select whichentries are included

InfoAssist Compound Documents
Dashboard features– Compound document
including multiple reports and graphs
– Coordinated fields– Active Dashboard
parameters– Cascading parameters– InfoMini

InfoAssist: Coordinated field Assign field from any report as a coordinated field
– Applied to all reports on the page
Results differ based on output format– Non Active formats (HTML, PDF)
• One page for each coordinated value– Active formats (Active Reports, Active Flash, Active PDF)
• Single page with a drop down filter that filters all reports on the page

InfoAssist: Active Dashboard Prompts
When document output format is changed to an Active format additional controls appear on the insert ribbon
When an Active Dashboard control is used then the output formats are restricted to Active formats only
Insert an Active Control and then drag and drop a column from one of the reports into the control
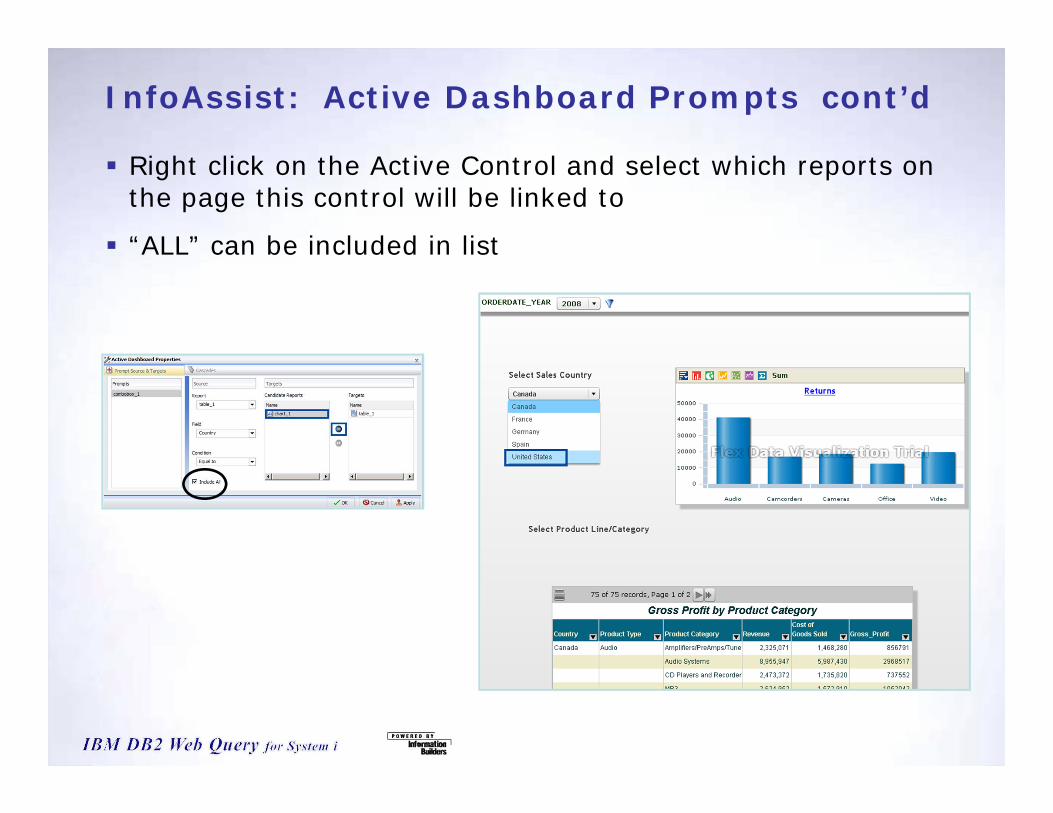
InfoAssist: Active Dashboard Prompts cont’d
Right click on the Active Control and select which reports on the page this control will be linked to
“ALL” can be included in list
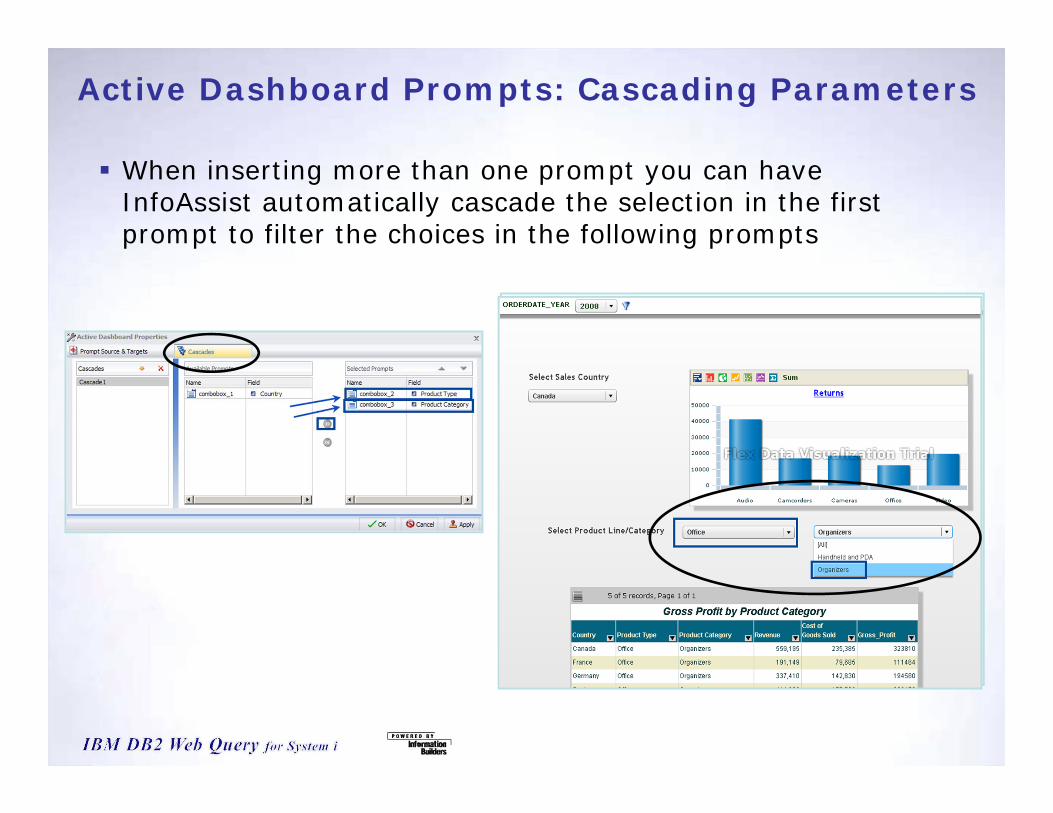
Active Dashboard Prompts: Cascading Parameters
When inserting more than one prompt you can have InfoAssist automatically cascade the selection in the first prompt to filter the choices in the following prompts
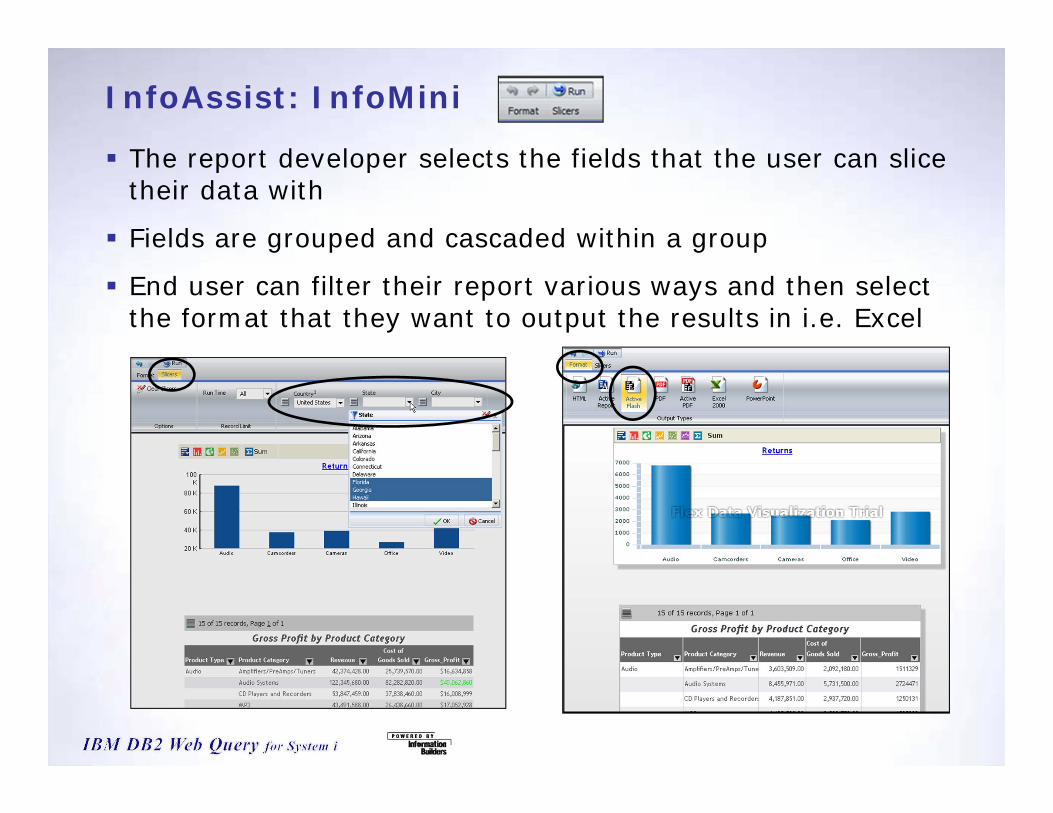
InfoAssist: InfoMini
The report developer selects the fields that the user can slice their data with
Fields are grouped and cascaded within a group
End user can filter their report various ways and then select the format that they want to output the results in i.e. Excel

Recorded Webcast
Step by step demonstration of creating a tabbed dashboard Extra
– Overview of Creating a Highly Parameterized Report
ibm.com/systems/i/db2/webquery=>DB2 Web Query Webinar Series
Questions?
Anyone? Anyone? Anyone? Anyone?
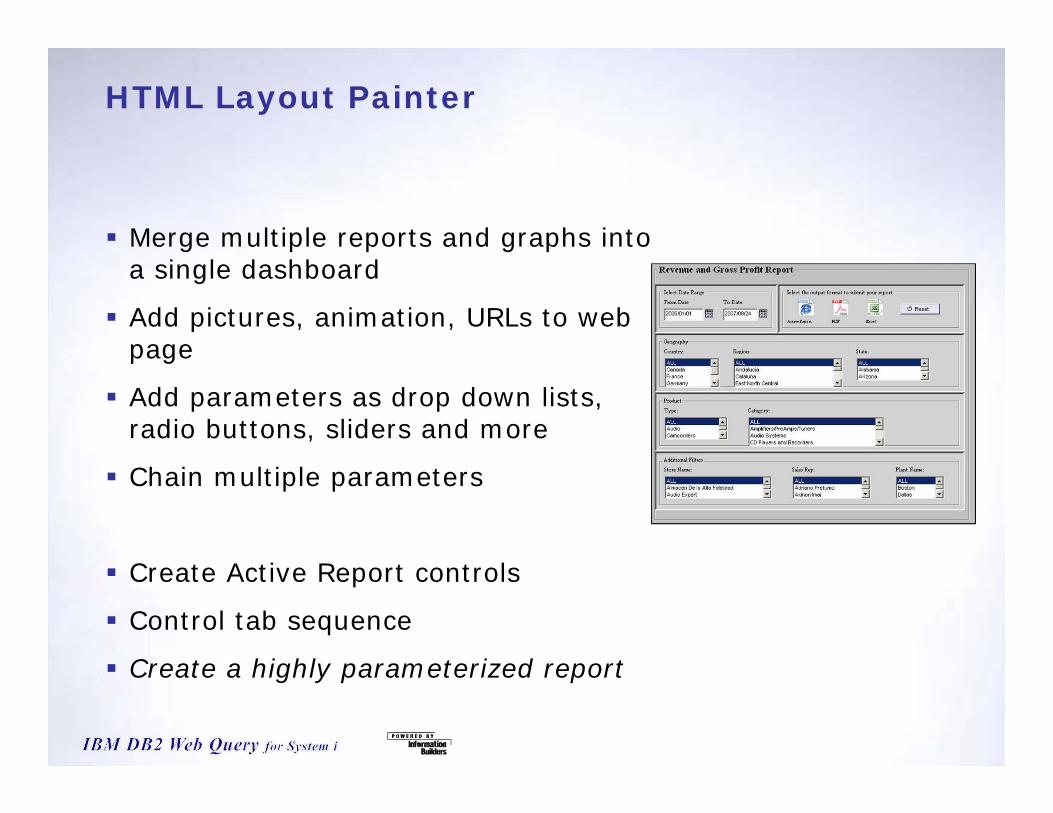
HTML Layout Painter
Merge multiple reports and graphs into a single dashboard
Add pictures, animation, URLs to web page
Add parameters as drop down lists, radio buttons, sliders and more
Chain multiple parameters
Create Active Report controls
Control tab sequence
Create a highly parameterized report
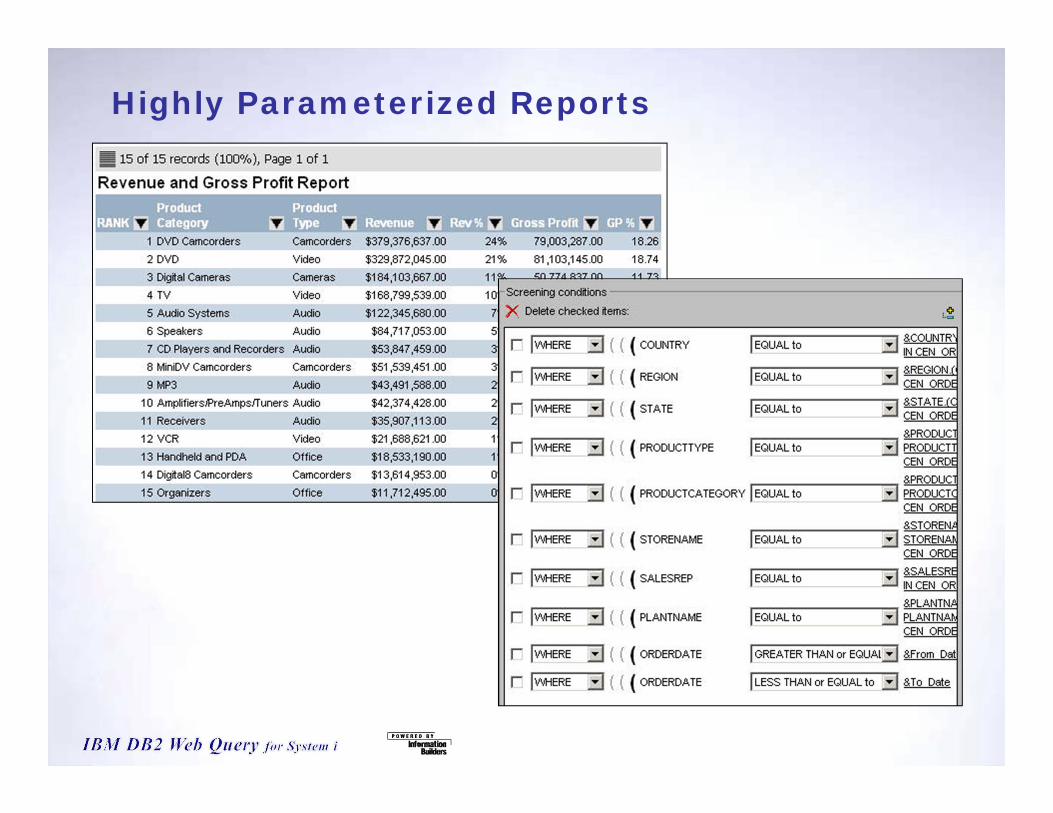
Highly Parameterized Reports
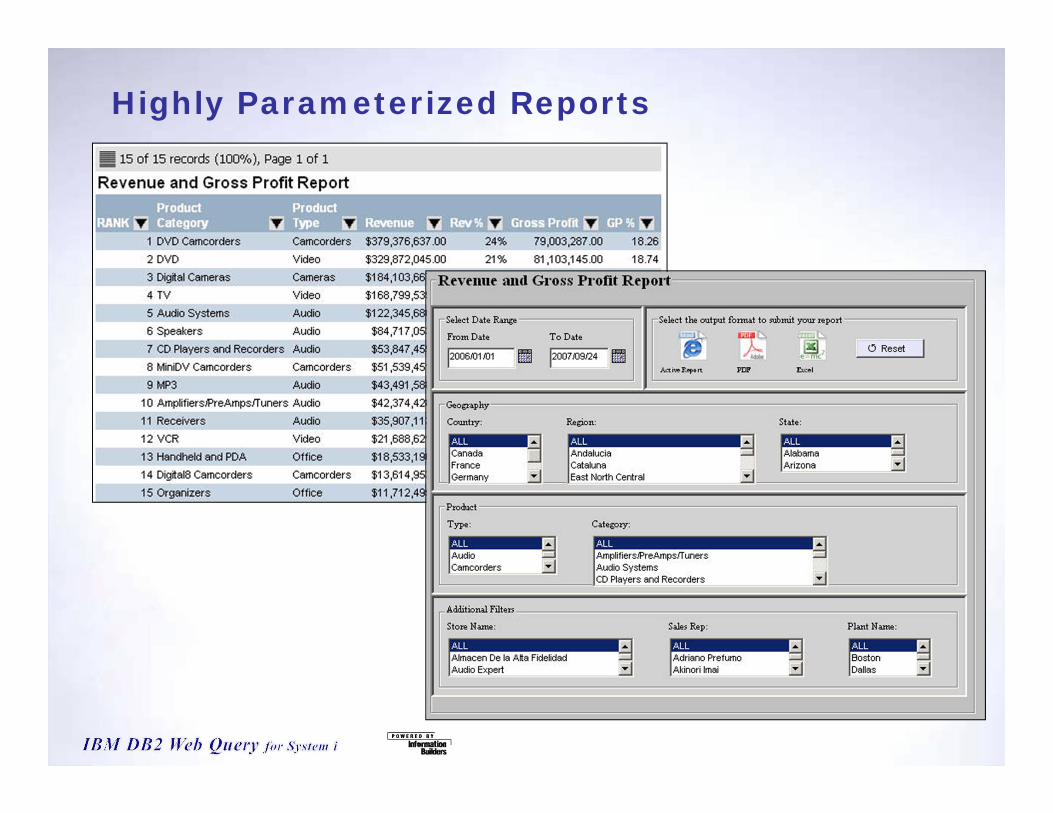
Highly Parameterized Reports
Highly Parameterized Reports
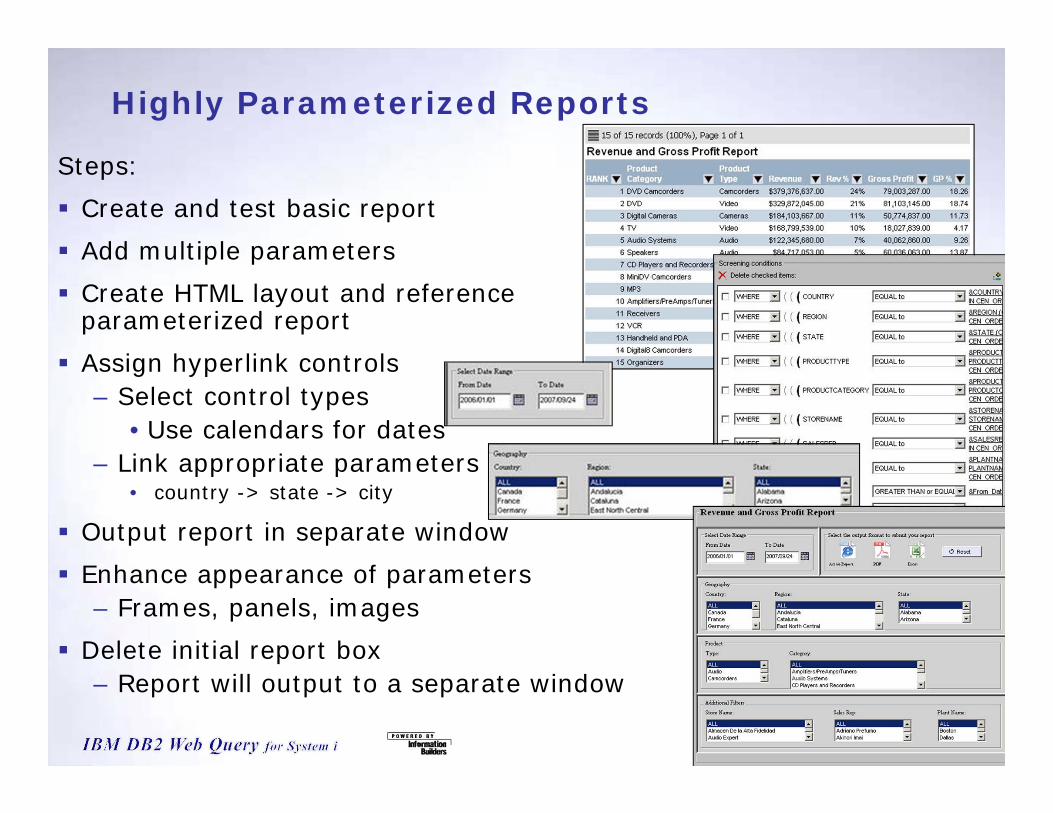
Steps: Create and test basic report Add multiple parameters Create HTML layout and reference
parameterized report Assign hyperlink controls
– Select control types•Use calendars for dates
– Link appropriate parameters• country -> state -> city
Output report in separate window Enhance appearance of parameters
– Frames, panels, images Delete initial report box
– Report will output to a separate window
Related Documents