Dow.com 2014 In v estor Forum Andrew N. Liveris Chairman & Chief Executive Officer November 12, 2014

Welcome message from author
This document is posted to help you gain knowledge. Please leave a comment to let me know what you think about it! Share it to your friends and learn new things together.
Transcript
8/10/2019 Day1 2014InvestorForum Final
http://slidepdf.com/reader/full/day1-2014investorforum-final 1/30
8/10/2019 Day1 2014InvestorForum Final
http://slidepdf.com/reader/full/day1-2014investorforum-final 2/30
Some of our comments today include statements about our expectationfuture. Those expectations involve risks and uncertainties. Dow cannot gthe accuracy of any forecasts or estimates, and we do not plan to update
forward-looking statements if our expectations change. If you would likeinformation on the risks involved in forward-looking statements, please Annual Report and our SEC filings. In addition, some of our comments renon-GAAP financial measures. Where available, presentation of and recoto the most directly comparable GAAP financial measures and other assodisclosures are provided on the Internet at www.dow.com/investors.
SEC Disclosure Rules
™Trademark of The Dow Chemical Company or an affiliated company of Dow.“EBITDA” is defined as earnings (i.e., “Net Income”) before interest, income taxes, depreciation and amortization.“Adjusted EBITDA” is defined as EBITDA excluding the impact of Certain items.“Adjusted EBITDA margin” is defined as “Adjusted EBITDA” as a percentage of reported net sales.“Adjusted EPS” is defined as earnings per share excluding the impact of Certain items.“Net Debt” equals total debt (“Notes payable” plus “Long-term debt due within one year” plus “Long-Term Debt”) minus “Cash and cash equivalents.”“Net Debt to Total Capitalization” ratio is defined as “Net Debt” divided by “Net Capital.” “Net Capital” is defined as “Total Equity” + “Redeemable Noncontrolling “Net Debt to EBITDA” is defined as “Net Debt” divided by “Adjusted EBITDA.”“TTM” is defined as trailing twelve months.“Total Capital” is defined as total assets minus non-interest bearing liabilities.“Adjusted Return on Capital” is defined as TTM “Adjusted Net Operating Profit After Tax” divided by average “Total Capital.”“Adjusted Sales” for joint ventures is defined as sales for joint ventures less sales to Dow and/or other Dow joint ventures.“Net Debt” for joint ventures excludes debt owed to Dow and/or other Dow joint ventures.“Total Shareholder Return” is defined as stock price appreciation plus dividends paid.
8/10/2019 Day1 2014InvestorForum Final
http://slidepdf.com/reader/full/day1-2014investorforum-final 3/30
Key Takeaways
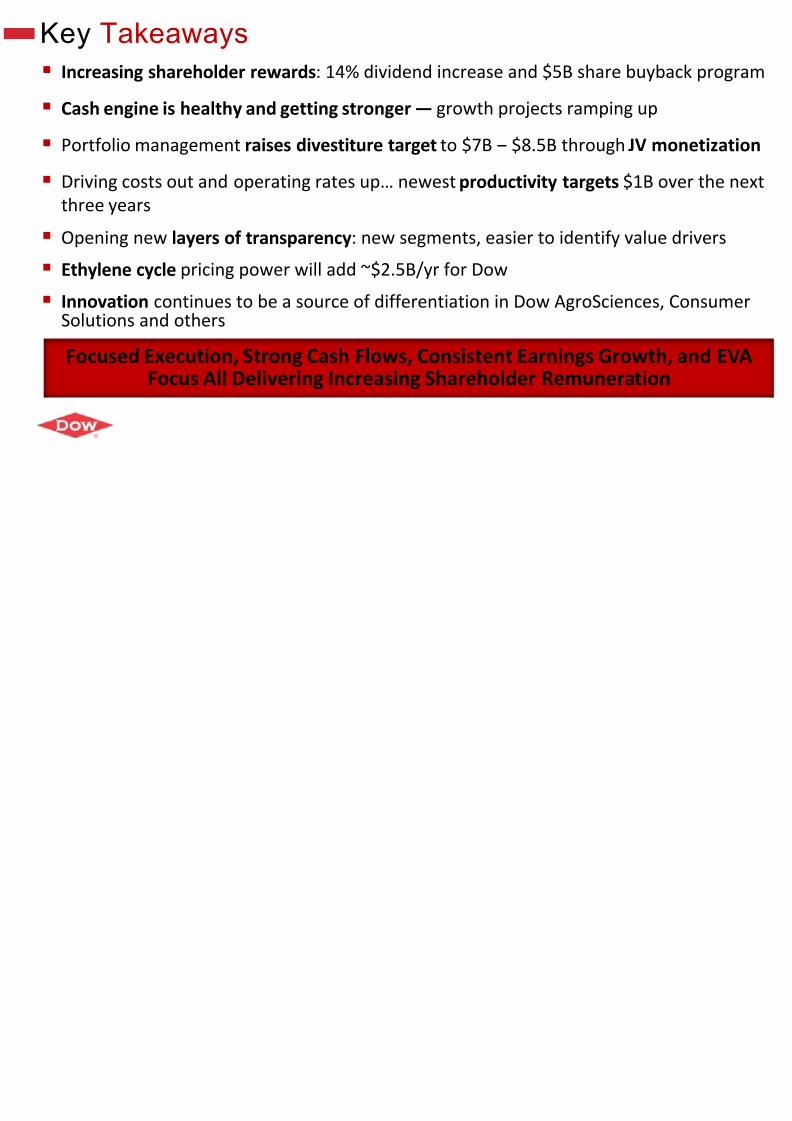
Increasing shareholder rewards: 14% dividend increase and $5B share b
Cash engine is healthy and getting stronger — growth projects ramping
Portfolio management raises divestiture target to $7B ‒ $8.5B through J
Driving costs out and operating rates up… newest productivity targets $
three years
Opening new layers of transparency: new segments, easier to identify v
Ethylene cycle pricing power will add ~$2.5B/yr for Dow
Innovation continues to be a source of differentiation in Dow AgroScienSolutions and others
Focused Execution, Strong Cash Flows, Consistent Earnings GroFocus All Delivering Increasing Shareholder Remunera
8/10/2019 Day1 2014InvestorForum Final
http://slidepdf.com/reader/full/day1-2014investorforum-final 4/30
Our Agenda
Delivering Results Through Focused Execution
Consistent Strategy to Enhance Value, Drive R
Our Priorities Going Forward
8/10/2019 Day1 2014InvestorForum Final
http://slidepdf.com/reader/full/day1-2014investorforum-final 5/30
0
1
2
3
4
5
6
7
8
9
10
$ B
10%
11%
12%
13%
14%
15%
16%
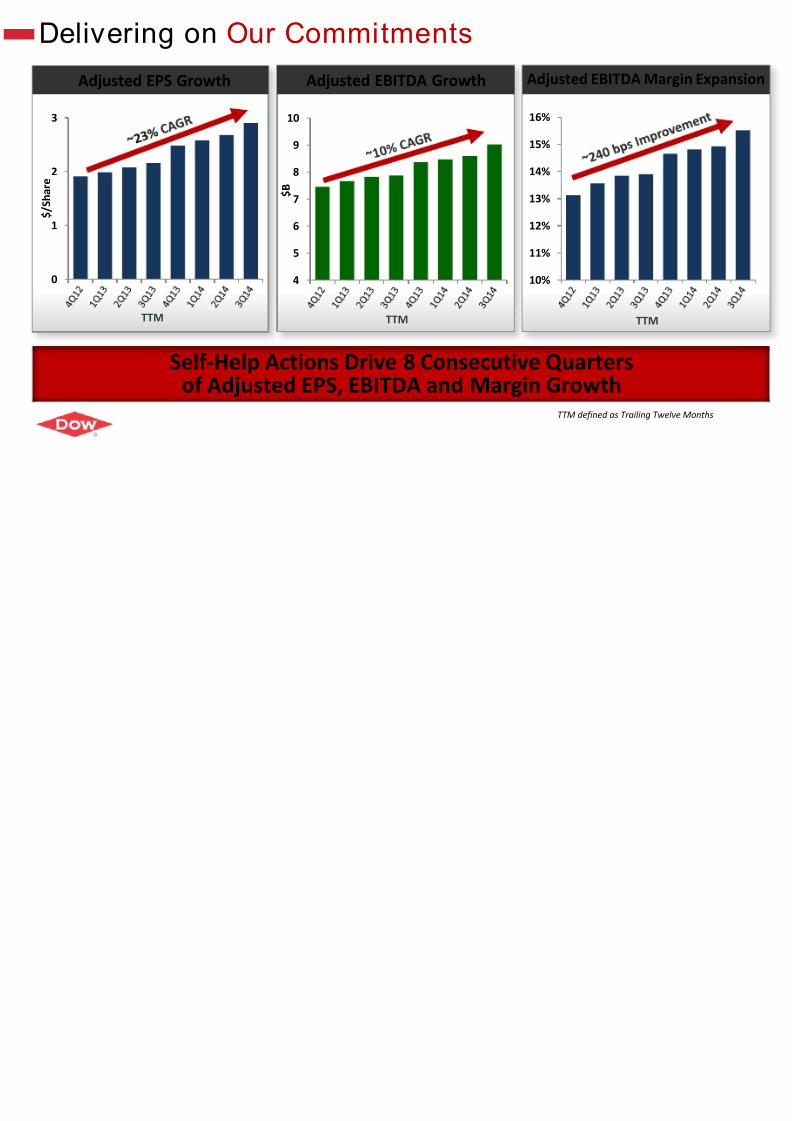
Delivering on Our Commitments
Self-Help Actions Drive 8 Consecutive Quartersof Adjusted EPS, EBITDA and Margin Growth
Adjusted EPS Growth
TTM TTM
Adjusted EBITDA Growth Adjusted EBITD
TTM defined as Tra
$ / S h a r e
8/10/2019 Day1 2014InvestorForum Final
http://slidepdf.com/reader/full/day1-2014investorforum-final 6/30
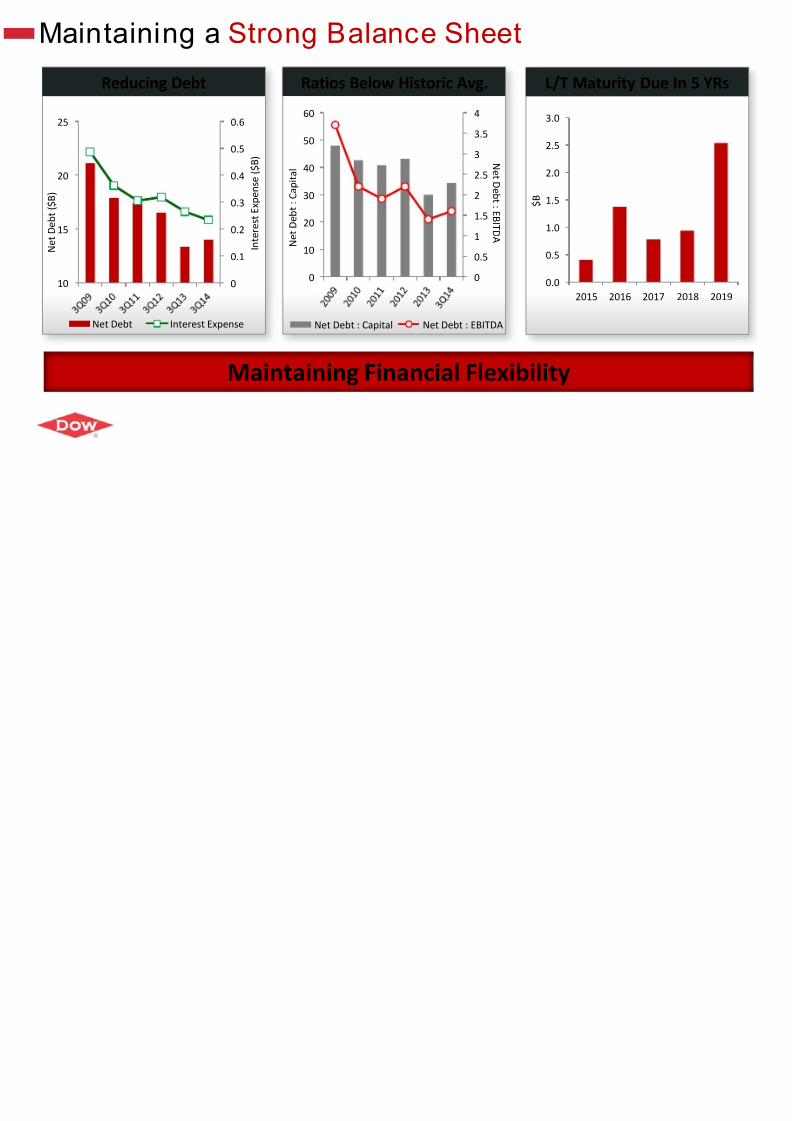
Maintaining a Strong Balance Sheet
0
0.1
0.2
0.3
0.4
0.5
0.6
10
15
20
25
I n t e r e s t E x p e n s e ( $ B )
N e t D e b t ( $ B )
Net Debt Interest Expense
Maintaining Financial Flexibility
Reducing Debt L/T MaturityRatios Below Historic Avg.
0
0.5
1
1.5
2
2.5
33.5
4
0
10
20
30
40
50
60
N e t D e b t : E B I T D A N
e t D e b t : C a p i t a l
Net Debt : Capital Net Debt : EBITDA
0.0
0.5
1.0
1.5
2.0
2.5
3.0
2015 2016
$ B
8/10/2019 Day1 2014InvestorForum Final
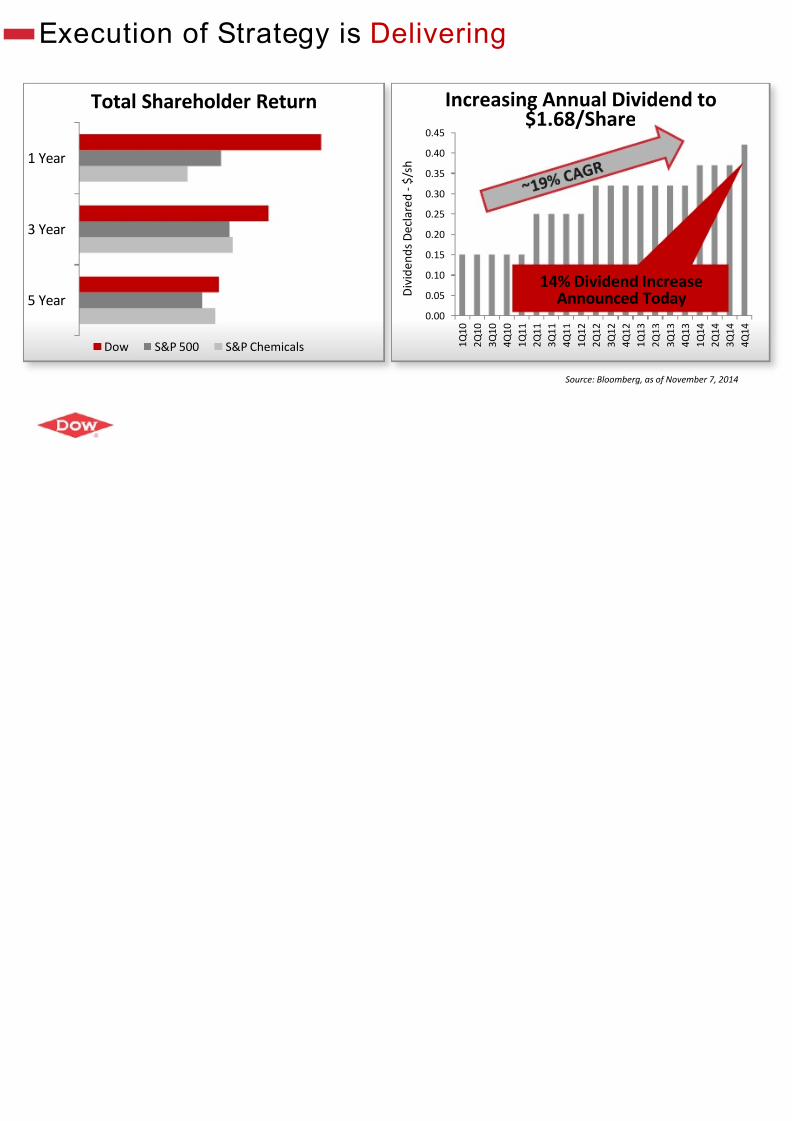
http://slidepdf.com/reader/full/day1-2014investorforum-final 7/30
5 Year
3 Year
1 Year
Dow S&P 500 S&P Chemicals
Execution of Strategy is Delivering
0.00
0.05
0.10
0.15
0.20
0.25
0.30
0.35
0.40
0.45
1 Q 1 0
2 Q 1 0
3 Q 1 0
4 Q 1 0
1 Q 1 1
2 Q 1 1
3 Q 1 1
4 Q 1 1
1 Q 1 2
2 Q 1 2
3 Q 1 2
4 Q 1 2
D i v i d e n d s D e c l a r e d - $ / s h
Increasing Annual Di$1.68/Share
Total Shareholder Return
14% DividenAnnounce
Source: Bloombe
8/10/2019 Day1 2014InvestorForum Final
http://slidepdf.com/reader/full/day1-2014investorforum-final 8/30
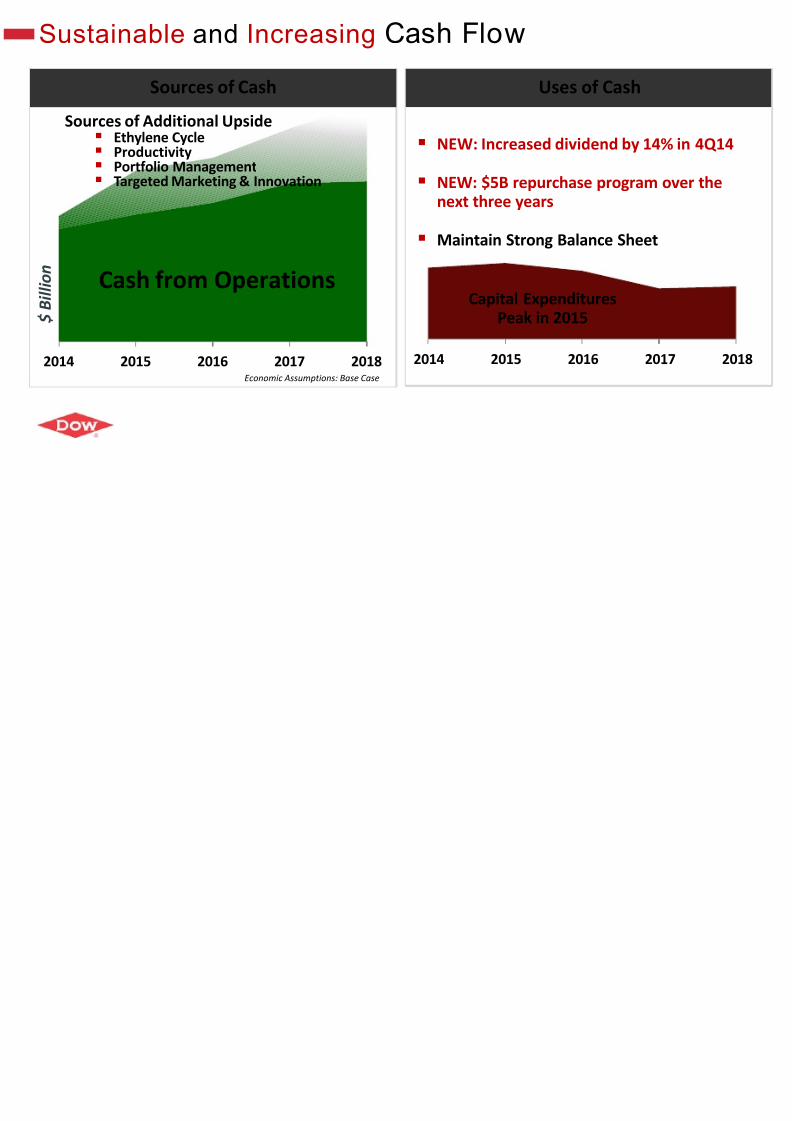
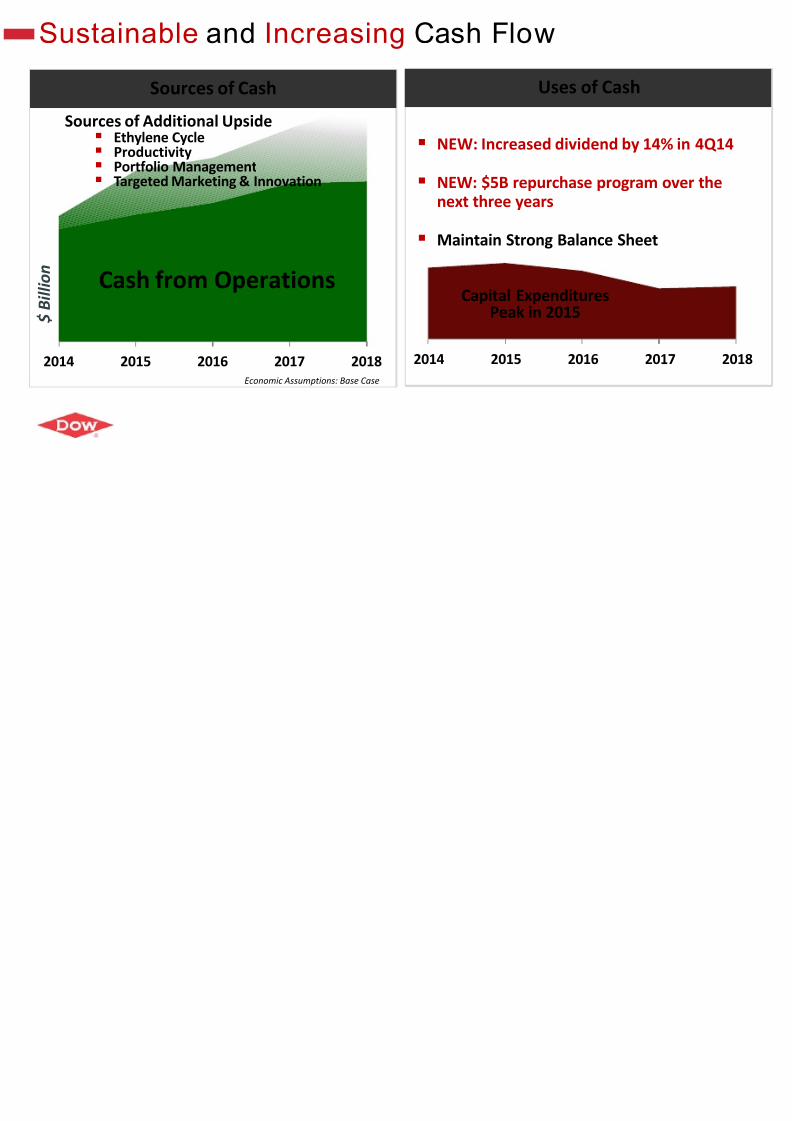
Sustainable and Increasing Cash Flow
2014 2015 2016
NEW: Increased dividend b
NEW: $5B repurchase prognext three years
Maintain Strong Balance Sh
2014 2015 2016 2017 2018
$
B i l l i o
n
Economic Assumptions: Base Case
Sources of Cash
Cash from Operations
Uses of Cas
Capital ExpendituresPeak in 2015
Sources of Additional Upside
Ethylene Cycle Productivity Portfolio Management Targeted Marketing & Innovation
8/10/2019 Day1 2014InvestorForum Final
http://slidepdf.com/reader/full/day1-2014investorforum-final 9/30
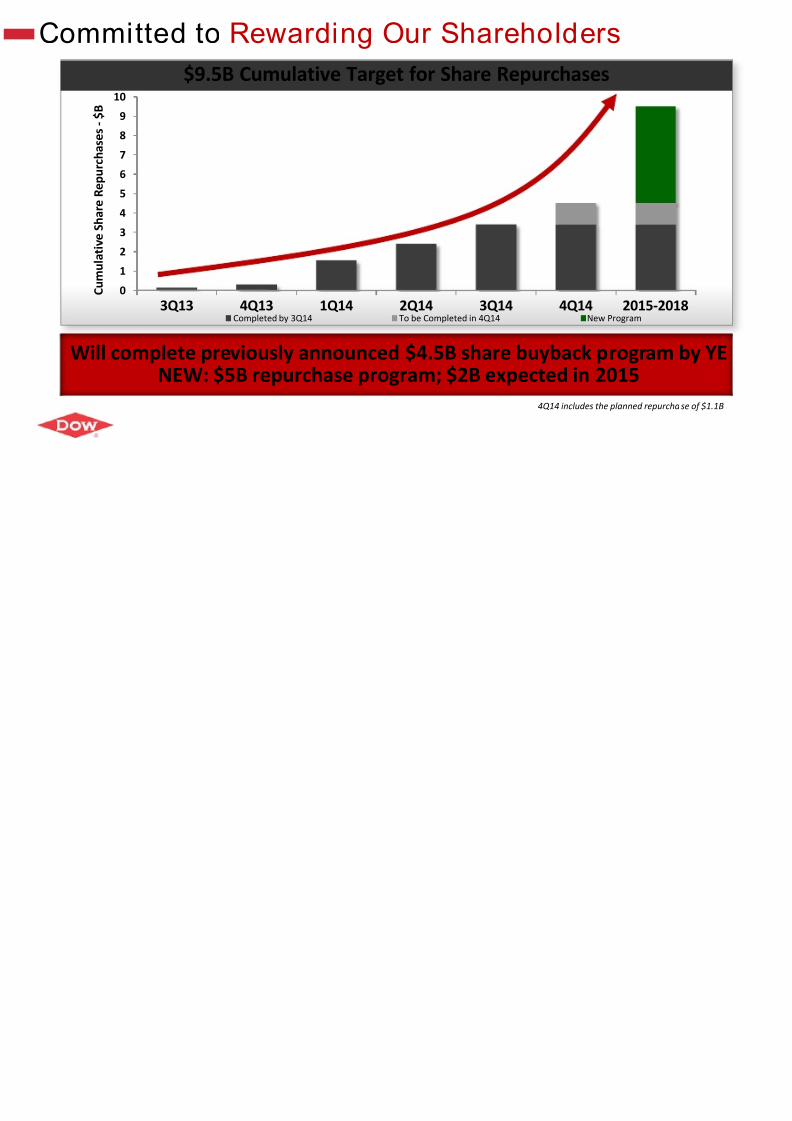
0
1
2
3
4
5
6
78
9
10
3Q13 4Q13 1Q14 2Q14 3Q14 4Q14 2 C u m
u l a t i v e S h a r e R e p u r c h a s e
s - $ B
Completed by 3Q14 To be Completed in 4Q14 New Progr
Committed to Rewarding Our Shareholders
Will complete previously announced $4.5B share buyback progNEW: $5B repurchase program; $2B expected in 201
4Q14 includes the plann
$9.5B Cumulative Target for Share Repurchases

8/10/2019 Day1 2014InvestorForum Final
http://slidepdf.com/reader/full/day1-2014investorforum-final 10/30
Our Agenda
Delivering Results through Focused Execution
Consistent Strategy to Enhance Value, Drive R
Our Priorities Going Forward
8/10/2019 Day1 2014InvestorForum Final
http://slidepdf.com/reader/full/day1-2014investorforum-final 11/30
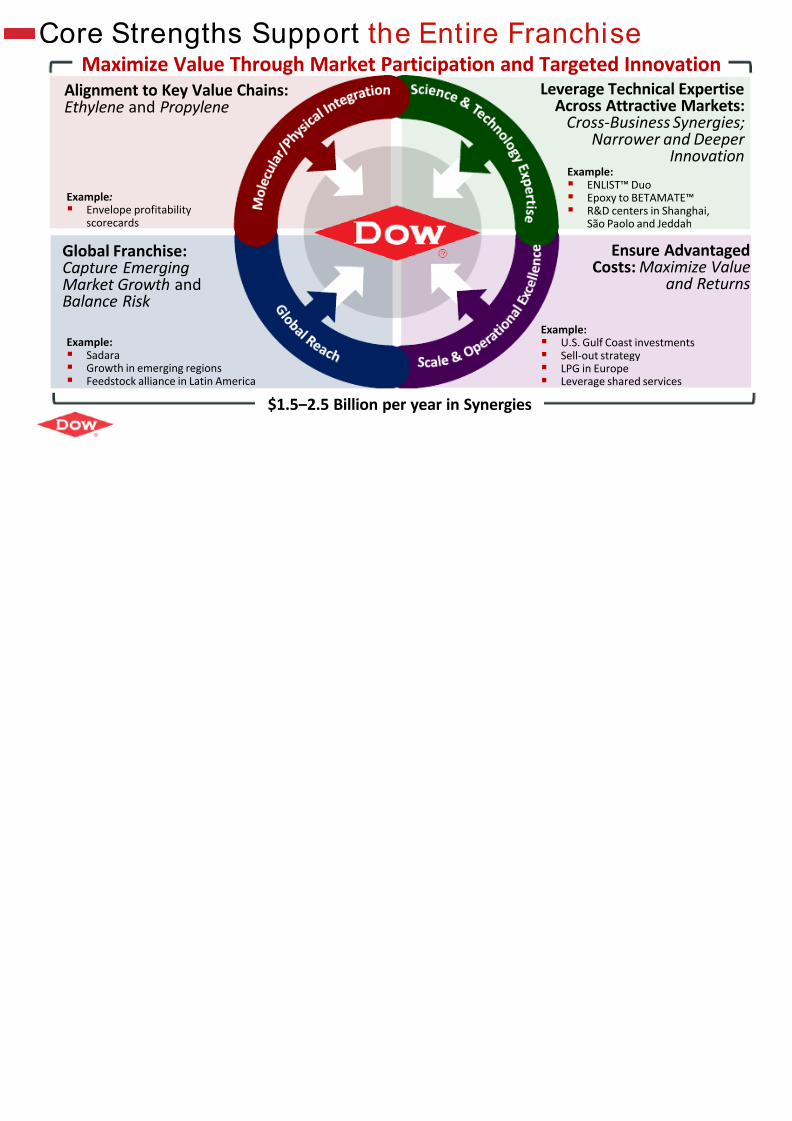
Core Strengths Support the Entire Franchise
INTEGRATION
Alignment to Key Value Chains:Ethylene and Propylene
Leverage TecAcross Attr
Cross-Bus
Narro
Global Franchise:Capture EmergingMarket Growth andBalance Risk
EnsCosts
Example: Envelope profitability
scorecards
Example: Sadara Growth in emerging regions Feedstock alliance in Latin America
Example: ENLIST™ Epoxy to R&D cent
São Paolo
Example: U.S. Gulf Coast Sell-out strate LPG in Europe Leverage share
$1.5‒2.5 Billion per year in Synergies
Maximize Value Through Market Participation and Targeted I
8/10/2019 Day1 2014InvestorForum Final
http://slidepdf.com/reader/full/day1-2014investorforum-final 12/30
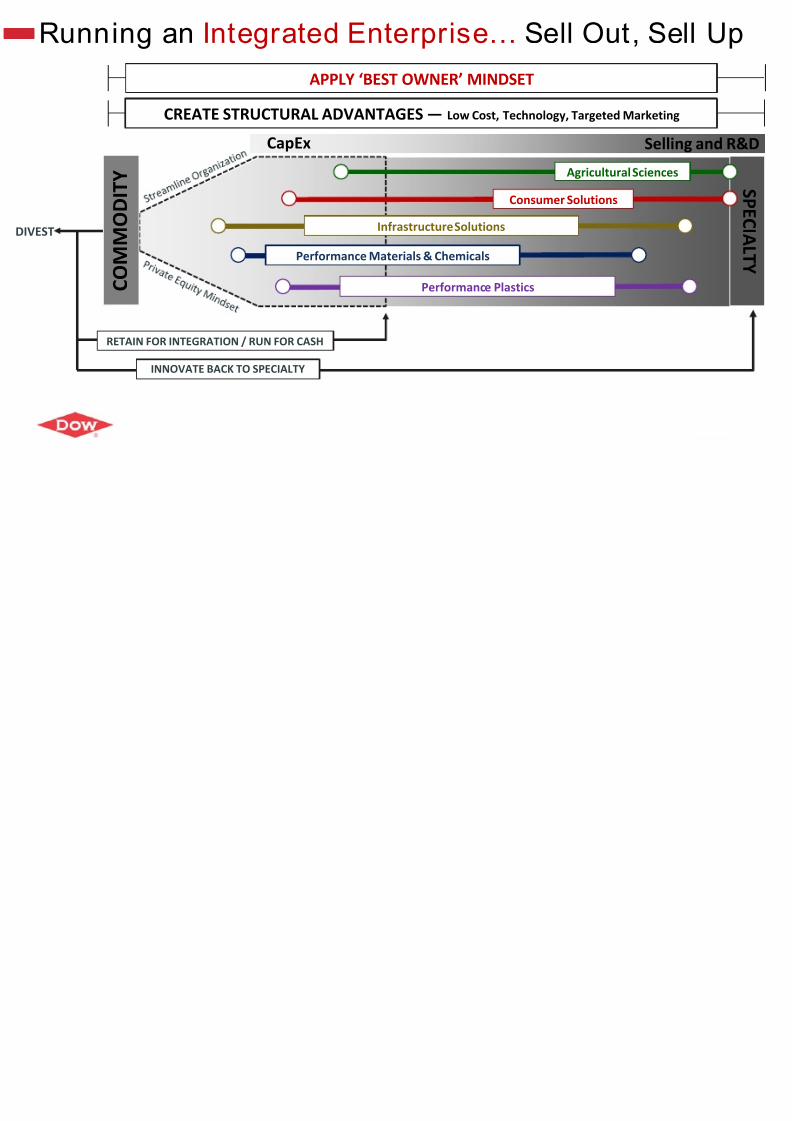
Running an Integrated Enterprise… Sell Out
DIVEST
RETAIN FOR INTEGRATION / RUN FOR CASH
CREATE STRUCTURAL ADVANTAGES — Low Cost, Technology, Targeted M
APPLY ‘BEST OWNER’ MINDSET
C O
M M O D I T Y
CapEx
Agricultural
Consumer Solutions
Infrastructure Solutions
Performance Materials & Chemicals
Performance Plastics
INNOVATE BACK TO SPECIALTY
8/10/2019 Day1 2014InvestorForum Final
http://slidepdf.com/reader/full/day1-2014investorforum-final 13/30
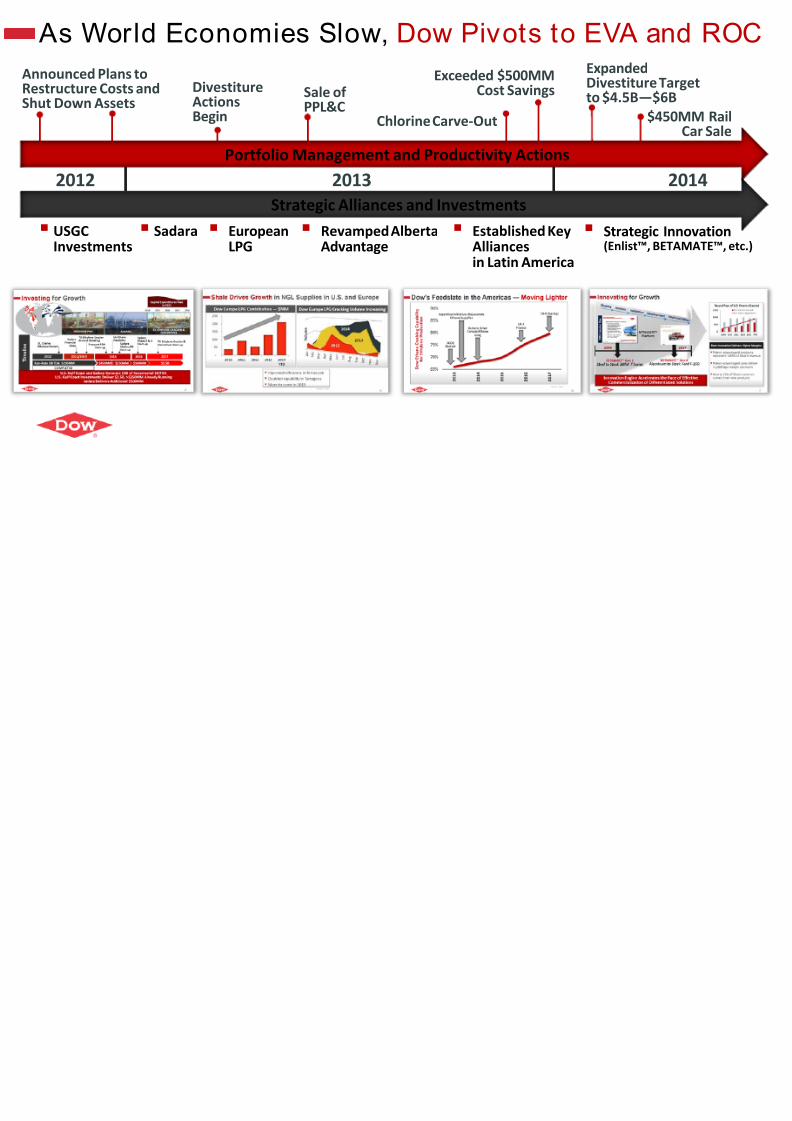
As World Economies Slow, Dow Pivots to EVA
2012 2013
Announced Plans toRestructure Costs andShut Down Assets
Chlorine Carve-Out
Exceeded $500MMCost SavingsDivestiture
ActionsBegin
ExpandDivestito $4.5
Strategic Alliances and Investments
Portfolio Management and Productivity Actions
Established KeyAlliancesin Latin America
Revamped AlbertaAdvantage
EuropeanLPG
Sadara
Sale ofPPL&C
USGCInvestments
Strat(Enlis
Portfolio Management and Productivity Actions
8/10/2019 Day1 2014InvestorForum Final
http://slidepdf.com/reader/full/day1-2014investorforum-final 14/30
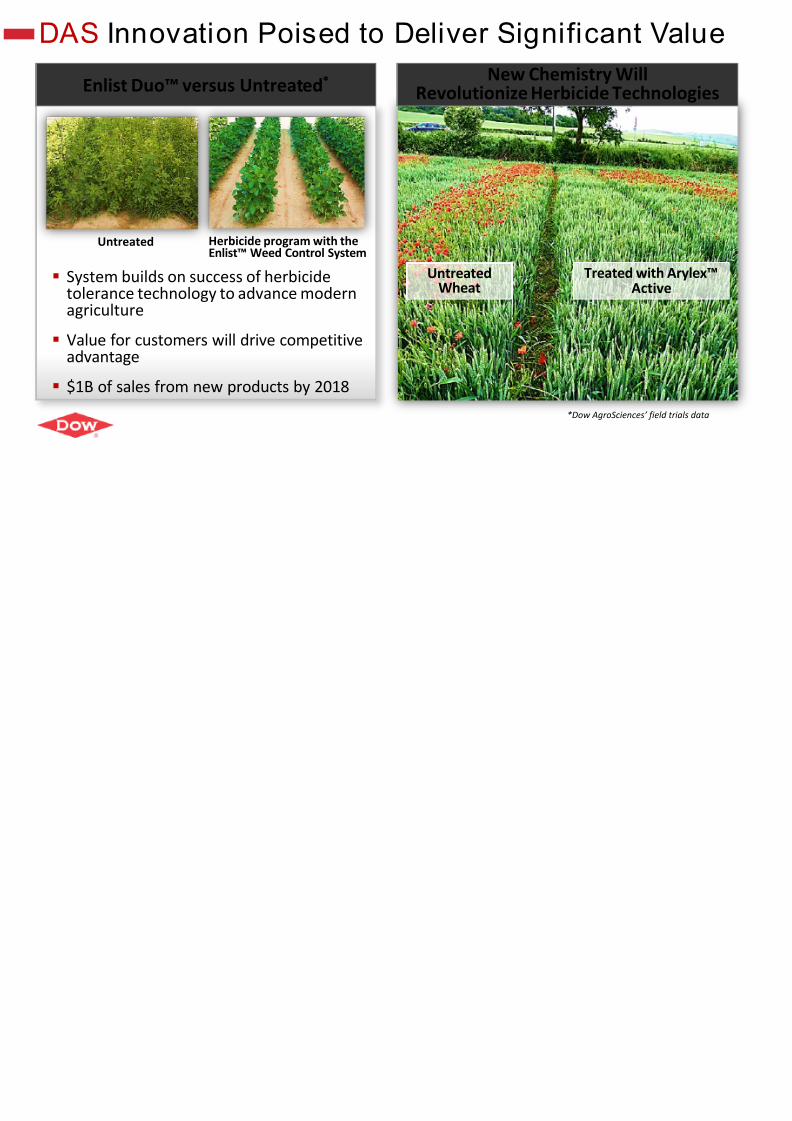
DAS Innovation Poised to Deliver Significan
UntreatedWheat
New Chemistry WRevolutionize Herbicide Te
Untreated Herbicide program with theEnlist™ Weed Control System
Enlist Duo™ versus Untreated*
Treated System builds on success of herbicidetolerance technology to advance modernagriculture
Value for customers will drive competitiveadvantage
$1B of sales from new products by 2018
*Dow AgroScien
8/10/2019 Day1 2014InvestorForum Final
http://slidepdf.com/reader/full/day1-2014investorforum-final 15/30
2014 201
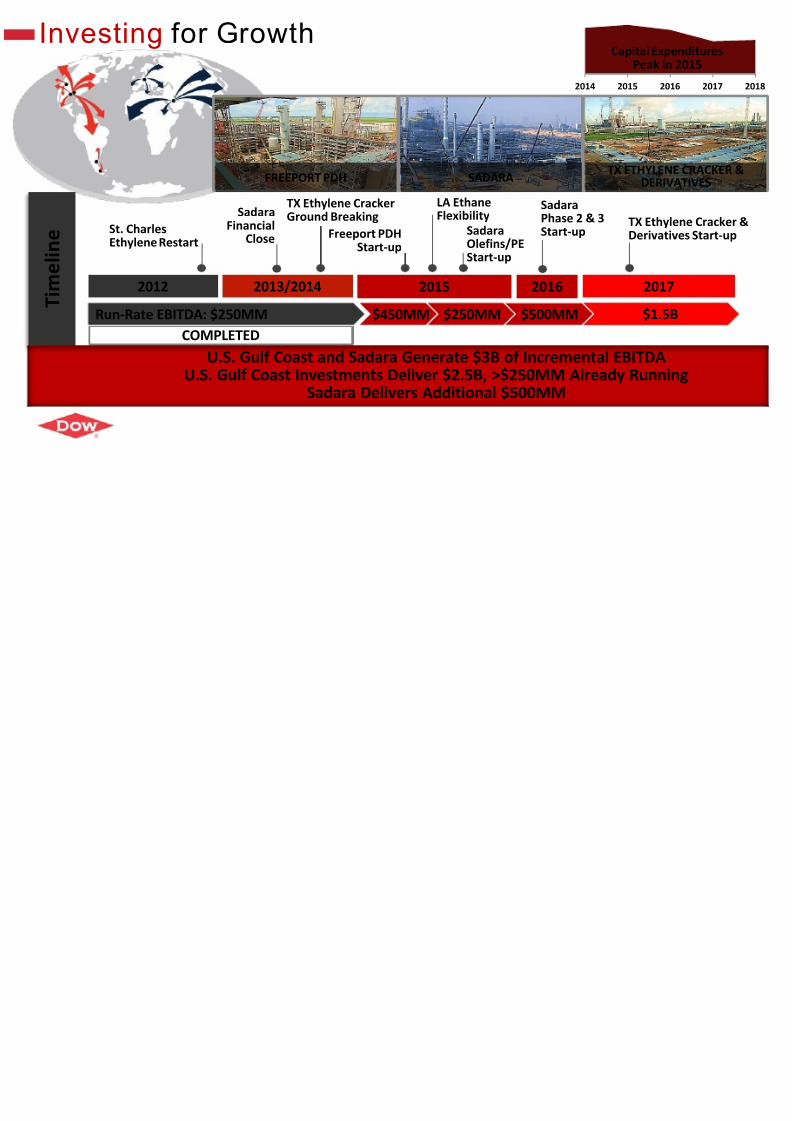
Investing for Growth
T i m
e l i n e
COMPLETED
2012 2013/2014 2015
St. CharlesEthylene Restart
Freeport PDHStart-up
TX Ethylene CrackerGround Breaking
SadaraOlefins/PEStart-up
LA EthaneFlexibility
TD
Run-Rate EBITDA: $250MM $450MM $250MM $500MM
SadaraFinancial
Close
2016
SadaraPhase 2 & 3Start-up
SADARAFREEPORT PDHTX E
U.S. Gulf Coast and Sadara Generate $3B of Incremental EBU.S. Gulf Coast Investments Deliver $2.5B, >$250MM Already
Sadara Delivers Additional $500MM
Cap

8/10/2019 Day1 2014InvestorForum Final
http://slidepdf.com/reader/full/day1-2014investorforum-final 16/30
Our Agenda
Delivering Results Through Focused Execution
Consistent Strategy to Enhance Value, Drive R
Our Priorities Going Forward
8/10/2019 Day1 2014InvestorForum Final
http://slidepdf.com/reader/full/day1-2014investorforum-final 17/30
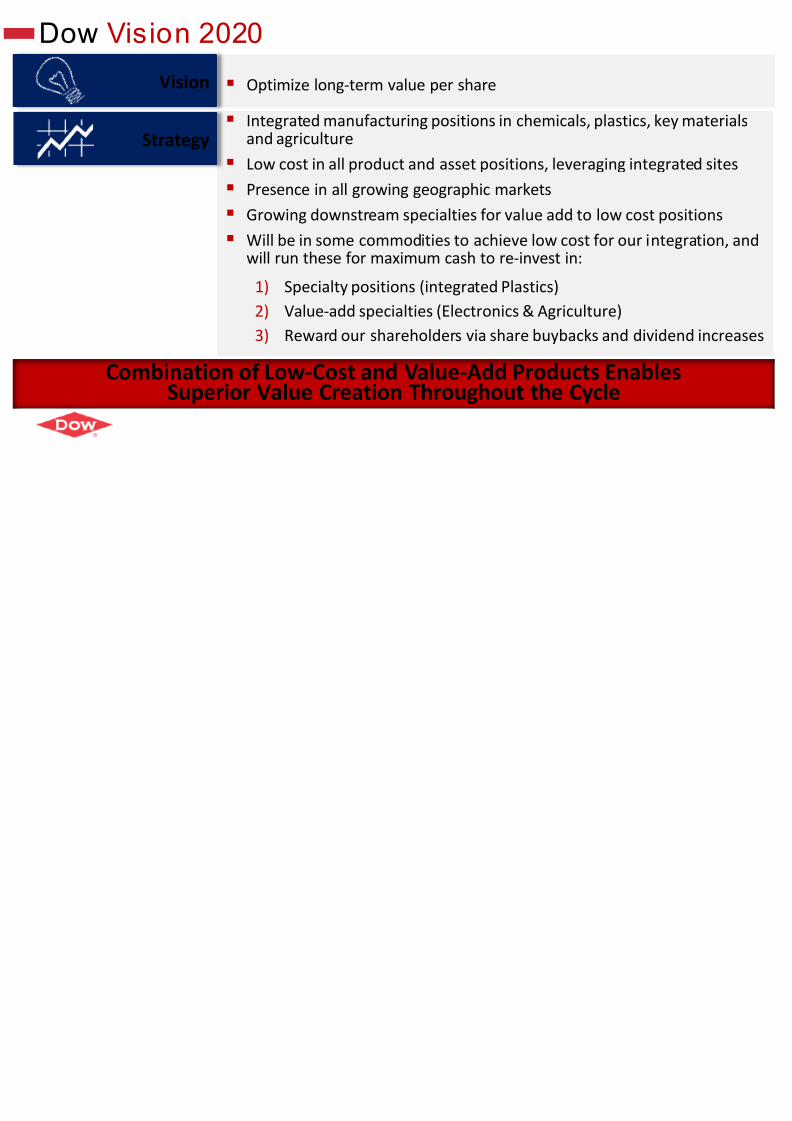
Dow Vision 2020
Optimize long-term value per share
Strategy
Vision
Integrated manufacturing positions in chemicals, plasti
and agriculture Low cost in all product and asset positions, leveraging
Presence in all growing geographic markets
Growing downstream specialties for value add to low c
Will be in some commodities to achieve low cost for ouwill run these for maximum cash to re-invest in:
1) Specialty positions (integrated Plastics)
2) Value-add specialties (Electronics & Agriculture)
3) Reward our shareholders via share buybacks and
Combination of Low-Cost and Value-Add Products EnSuperior Value Creation Throughout the Cycle
8/10/2019 Day1 2014InvestorForum Final
http://slidepdf.com/reader/full/day1-2014investorforum-final 18/30
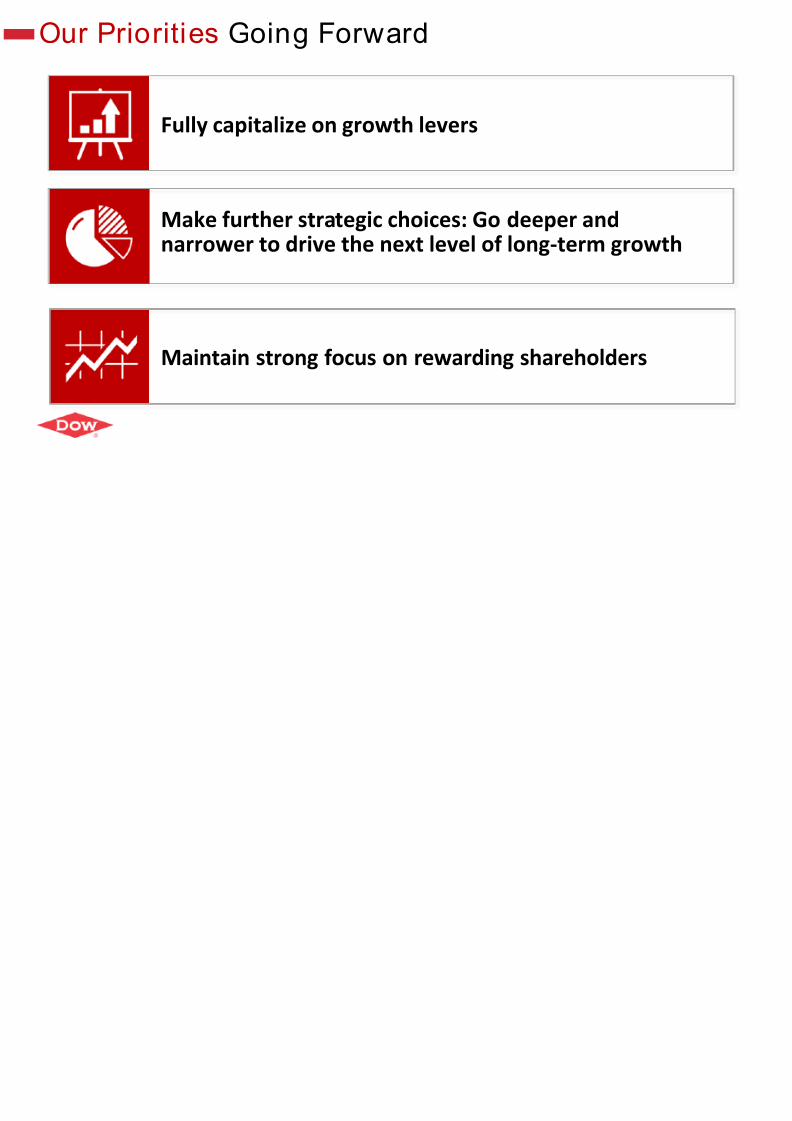
Our Priorities Going Forward
Maintain strong focus on rewarding shareholde
Fully capitalize on growth levers
Make further strategic choices: Go deeper andnarrower to drive the next level of long-term gr
8/10/2019 Day1 2014InvestorForum Final
http://slidepdf.com/reader/full/day1-2014investorforum-final 19/30
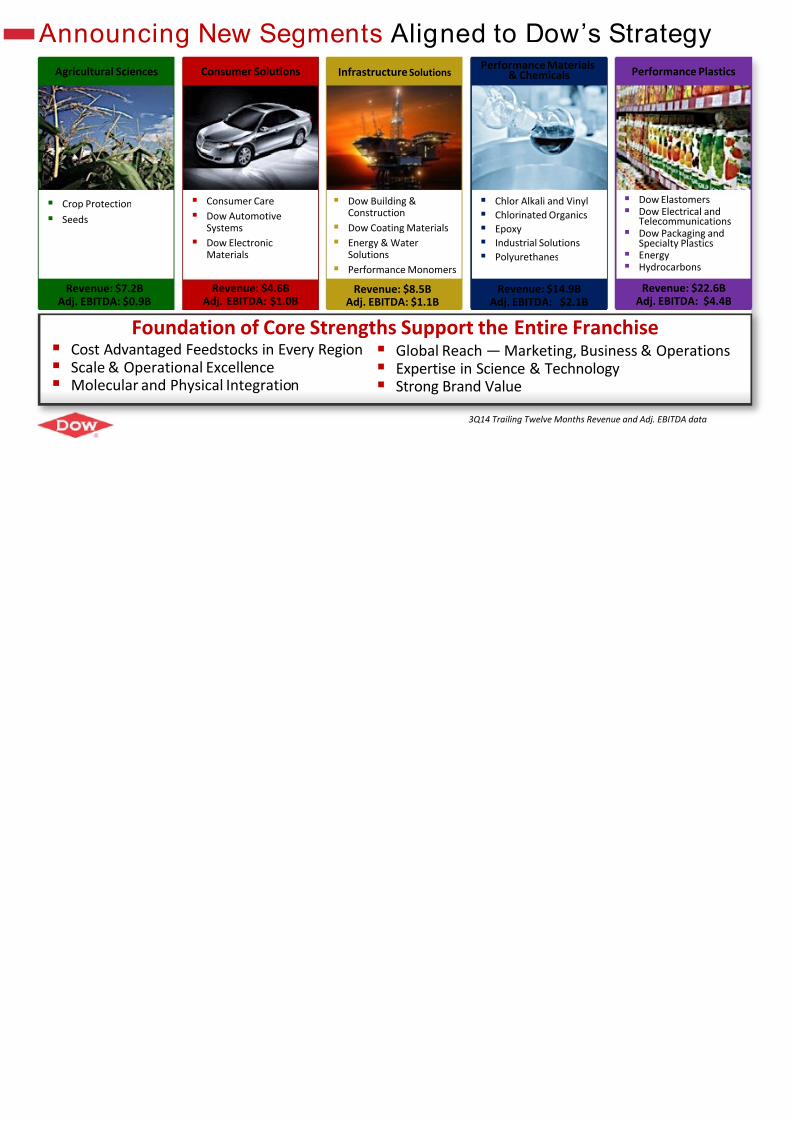
Announcing New Segments Aligned to Dow’s St
Foundation of Core Strengths Support the Entire Franch Cost Advantaged Feedstocks in Every Region Scale & Operational Excellence Molecular and Physical Integration
Global Reach ― Marketing, Busines Expertise in Science & Technology Strong Brand Value
Performance Materials& ChemicalsAgricultural Sciences Consumer Solutions Infrastructure Solutions
Revenue: $14.9BAdj. EBITDA: $2.1B
Revenue: $4.6BAdj. EBITDA: $1.0B
3Q14 Trailing Twelve Months Revenue an
Chlor Alkali and Vinyl
Chlorinated Organics
Epoxy
Industrial Solutions
Polyurethanes
Crop Protection
Seeds
Consumer Care
Dow AutomotiveSystems
Dow ElectronicMaterials
Dow Building &Construction
Dow Coating Materials
Energy & WaterSolutions
Performance Monomers
Revenue: $7.2BAdj. EBITDA: $0.9B
Revenue: $8.5BAdj. EBITDA: $1.1B
G
8/10/2019 Day1 2014InvestorForum Final
http://slidepdf.com/reader/full/day1-2014investorforum-final 20/30
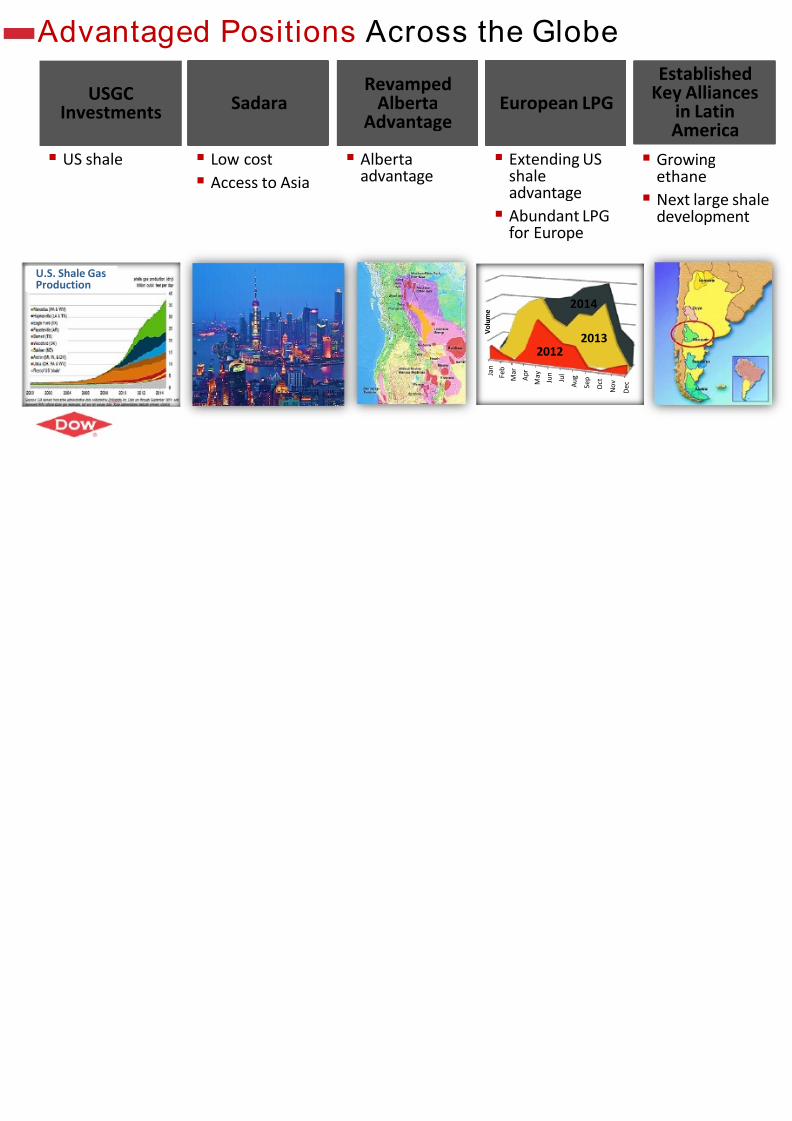
Advantaged Positions Across the Globe
USGCInvestments
US shale Low cost
Access to Asia
Albertaadvantage
Sadara European LPGRevamped
AlbertaAdvantage
Extending USshaleadvantage
Abundant LPGfor Europe
J a n
F e b
M a r
A p r
M a y
J u n
J u l
A u g
S e p
O c t
N o v
D e c
V o l u m e
20122013
2014
U.S. Shale GasProduction
8/10/2019 Day1 2014InvestorForum Final
http://slidepdf.com/reader/full/day1-2014investorforum-final 21/30
0
5
10
15
20
25
30
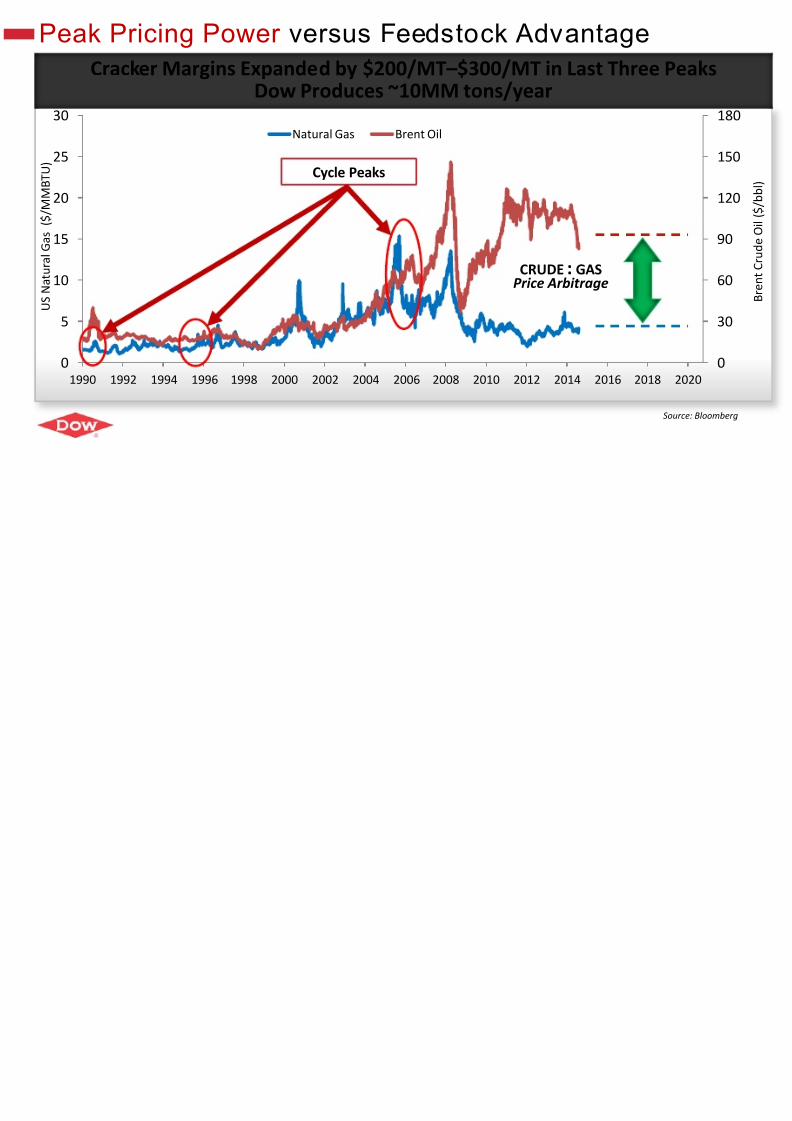
1990 1992 1994 1996 1998 2000 2002 2004 2006 2008 2010 2012 2014 2016
Natural Gas Brent Oil
Peak Pricing Power versus Feedstock Advantag
Cracker Margins Expanded by $200/MT–$300/MT in Last ThDow Produces ~10MM tons/year
U S N a
t u r a l G a s ( $ / M M B T U )
CRUDE : GAS
Price Arbitrage
Cycle Peaks
8/10/2019 Day1 2014InvestorForum Final
http://slidepdf.com/reader/full/day1-2014investorforum-final 22/30
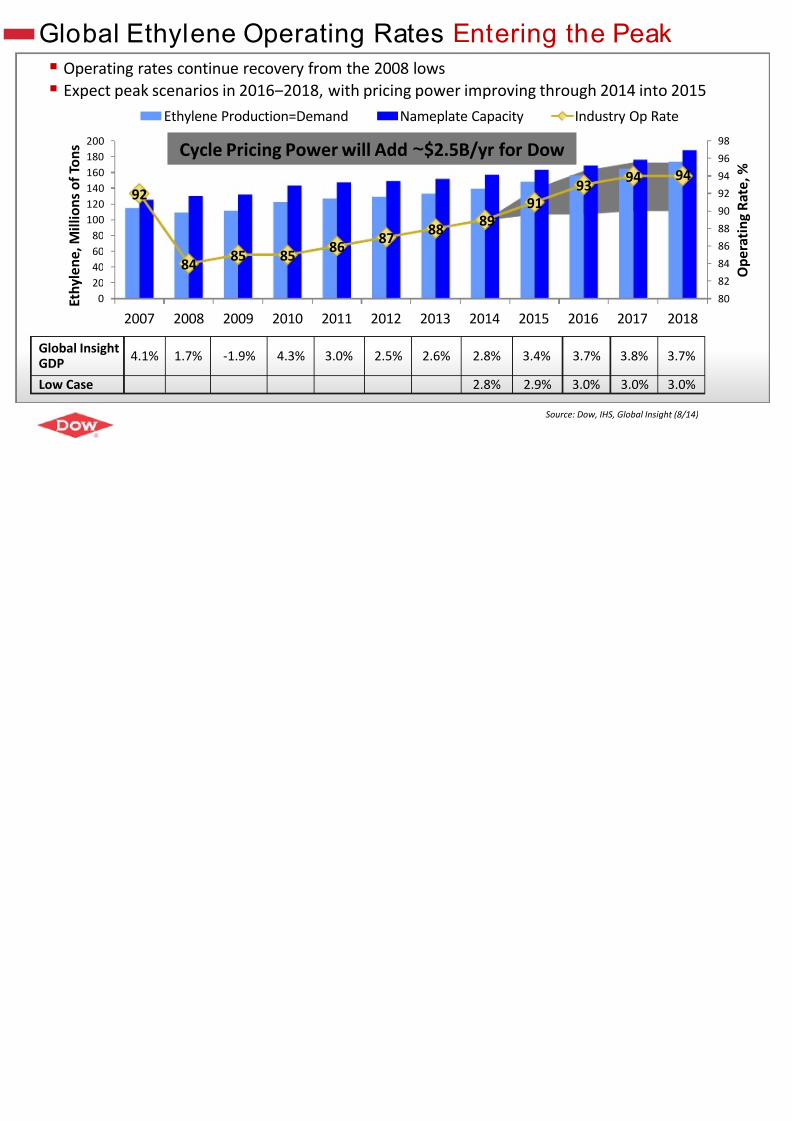
Global Ethylene Operating Rates Entering the P
Source: Dow, IHS, Glo
Operating rates continue recovery from the 2008 lows
Expect peak scenarios in 2016‒2018, with pricing power improving through 2014
92
8485 85
8687
8889
9193
9
020
40
60
80
100
120
140
160
180 200
2007 2008 2009 2010 2011 2012 2013 2014 2015 2016 20 E t h y
l e n e , M i l l i o n s o f T o n s
Ethylene Production=Demand Nameplate Capacity Industry
Global InsightGDP
4.1% 1.7% -1.9% 4.3% 3.0% 2.5% 2.6% 2.8% 3.4% 3.7% 3.
Low Case 2.8% 2.9% 3.0% 3.
Cycle Pricing Power will Add ~$2.5B/yr for Dow
O P i iti G i F d
8/10/2019 Day1 2014InvestorForum Final
http://slidepdf.com/reader/full/day1-2014investorforum-final 23/30
Our Priorities Going Forward
Maintain strong focus on rewarding shareholde
Fully capitalize on growth levers
Make further strategic choices: Go deeper andnarrower to drive the next level of long-term gr
C t t P d ti it F
8/10/2019 Day1 2014InvestorForum Final
http://slidepdf.com/reader/full/day1-2014investorforum-final 24/30
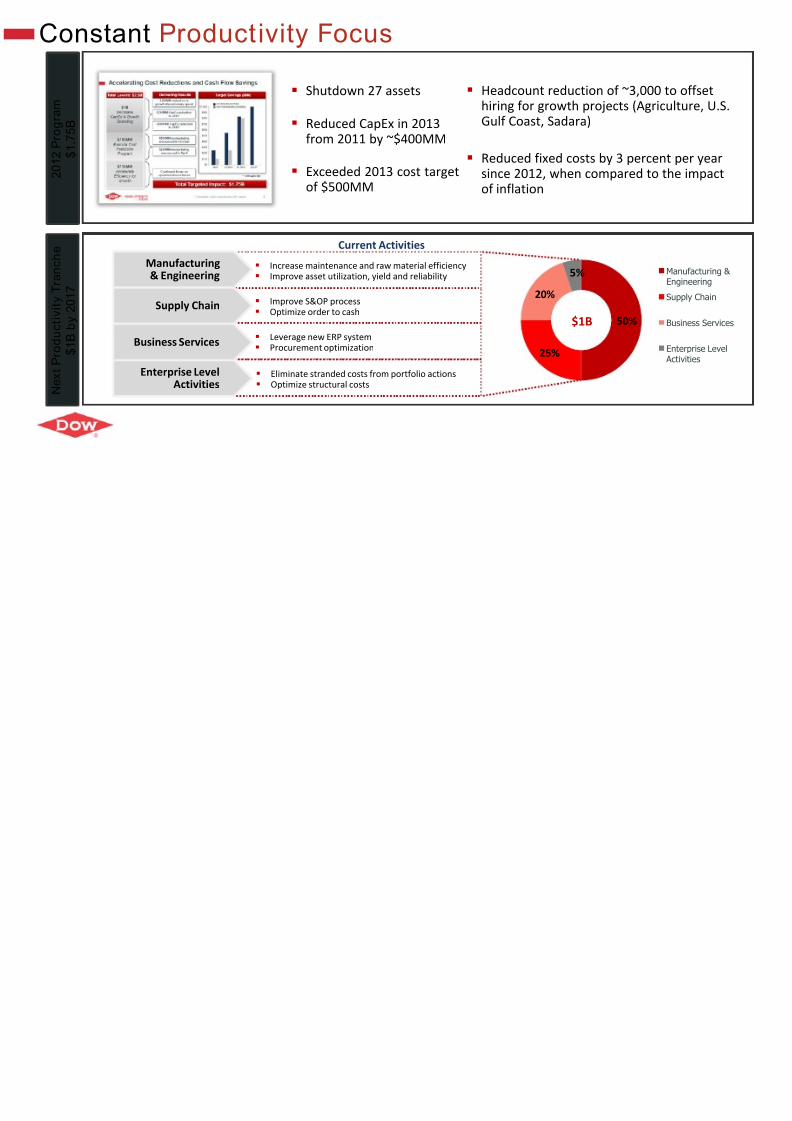
50%
25%
20%
5%
Improve S&OP process Optimize order to cash
Eliminate stranded costs from portfolio actions Optimize structural costs
Leverage new ERP system Procurement optimization
Current Activities
Manufacturing& Engineering
Supply Chain
Enterprise LevelActivities
Business Services
$1B
Increase maintenance and raw material efficiency Improve asset utilization, yield and reliability
N e x t P r o d u c t i v i t y T r a n c h e
$ 1 B
b y 2 0 1 7
Shutdown 27 assets
Reduced CapEx in 2013
from 2011 by ~$400MM
Exceeded 2013 cost targetof $500MM
2 0 1 2 P
r o g r a m
$ 1 . 7
5 B
Headcount reduction of ~hiring for growth projects Gulf Coast, Sadara)
Reduced fixed costs by 3 psince 2012, when compareof inflation
Constant Productivity Focus
J i t V t P tf l i A ti
8/10/2019 Day1 2014InvestorForum Final
http://slidepdf.com/reader/full/day1-2014investorforum-final 25/30
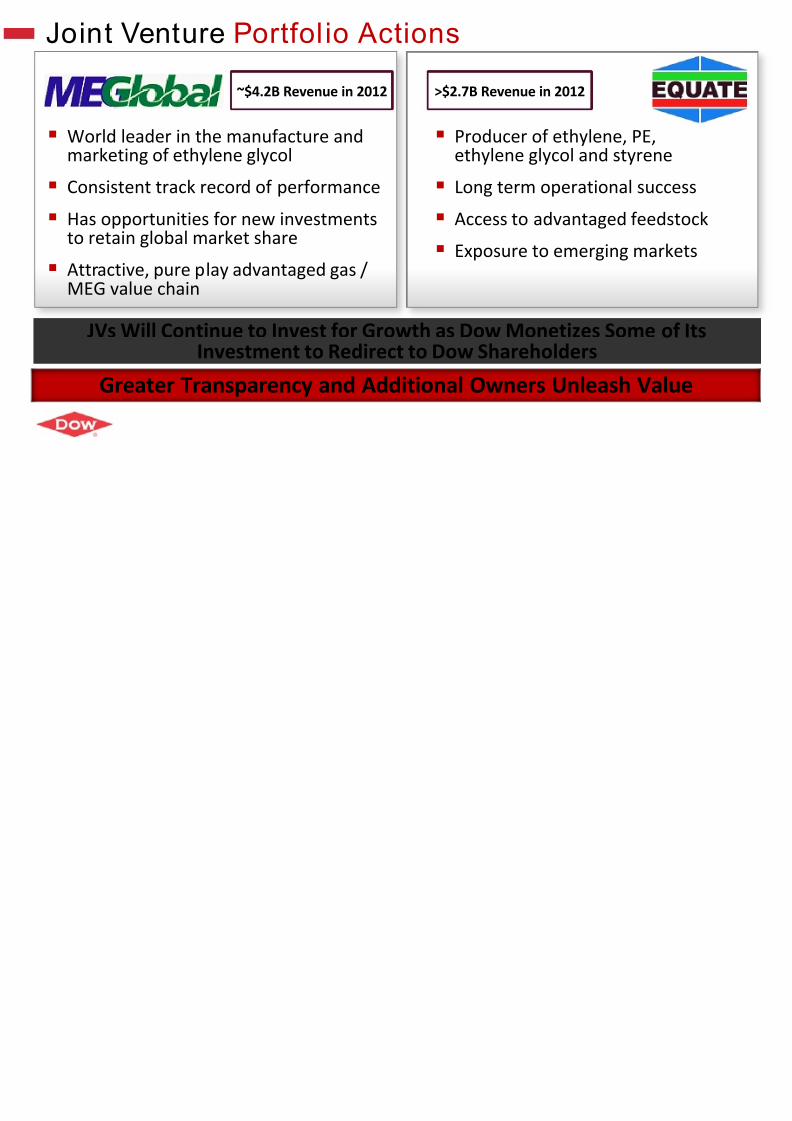
Joint Venture Portfol io Actions
World leader in the manufacture andmarketing of ethylene glycol
Consistent track record of performance
Has opportunities for new investmentsto retain global market share
Attractive, pure play advantaged gas /MEG value chain
~$4.2B Revenue in 2012
JVs Will Continue to Invest for Growth as Dow Monetizes SomInvestment to Redirect to Dow Shareholders
>$2.7B Revenue in 2012
Greater Transparency and Additional Owners Unleash
Producer of ethylene, ethylene glycol and sty
Long term operational
Access to advantaged
Exposure to emerging
O i P ti P tf li M t
8/10/2019 Day1 2014InvestorForum Final
http://slidepdf.com/reader/full/day1-2014investorforum-final 26/30
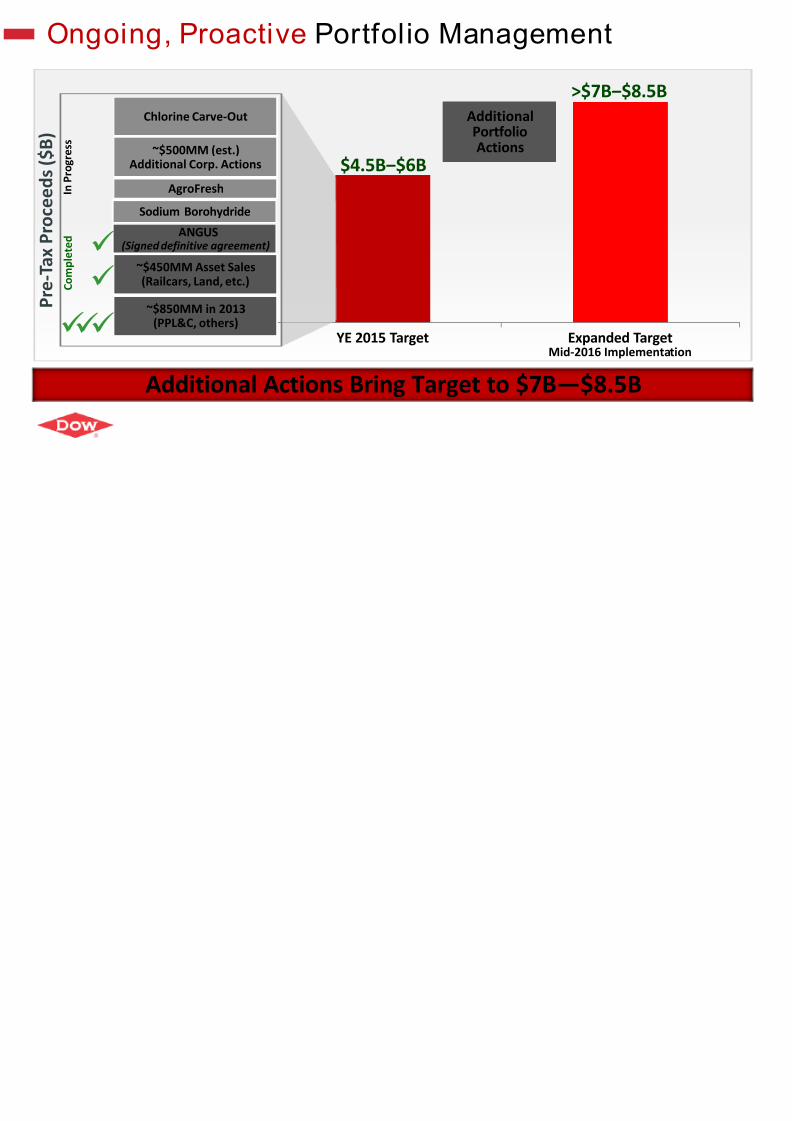
Ongoing, Proactive Portfolio Management
YE 2015 Target Expanded
~$850MM in 2013(PPL&C, others)
Chlorine Carve-Out
~$450MM Asset Sales
(Railcars, Land, etc.)
AgroFresh
~$500MM (est.)Additional Corp. Actions $4.5B‒$6B
P r e - T a x P r o c e e d s ( $ B
)
C o
m p l e t e d
I n P r o g r e s s
AdditionalPortfolio
Actions
>$7B‒$
Additional Actions Bring Target to $7B―$8.5B
Mid-2016 Imple
Sodium Borohydride
ANGUS
(Signed definitive agreement)
O r Priorities Going For ard

8/10/2019 Day1 2014InvestorForum Final
http://slidepdf.com/reader/full/day1-2014investorforum-final 27/30
Our Priorities Going Forward
Fully capitalize on growth levers
Make further strategic choices: Go deeper and nar
drive the next level of long-term growth
Maintain strong focus on rewarding shareholders
Sustainable and Increasing Cash Flow
8/10/2019 Day1 2014InvestorForum Final
http://slidepdf.com/reader/full/day1-2014investorforum-final 28/30
2014 2015 2016 2017 2018 2014 2015 2016
NEW: Increased dividend b
NEW: $5B repurchase prognext three years
Maintain Strong Balance Sh
$
B i l l i o n
Economic Assumptions: Base Case
Sources of Cash
Cash from Operations
Uses of Cas
Capital ExpendituresPeak in 2015
Sources of Additional Upside Ethylene Cycle
Productivity Portfolio Management Targeted Marketing & Innovation
Sustainable and Increasing Cash Flow
We Are an Integrated Chemical Company that Is Del
8/10/2019 Day1 2014InvestorForum Final
http://slidepdf.com/reader/full/day1-2014investorforum-final 29/30
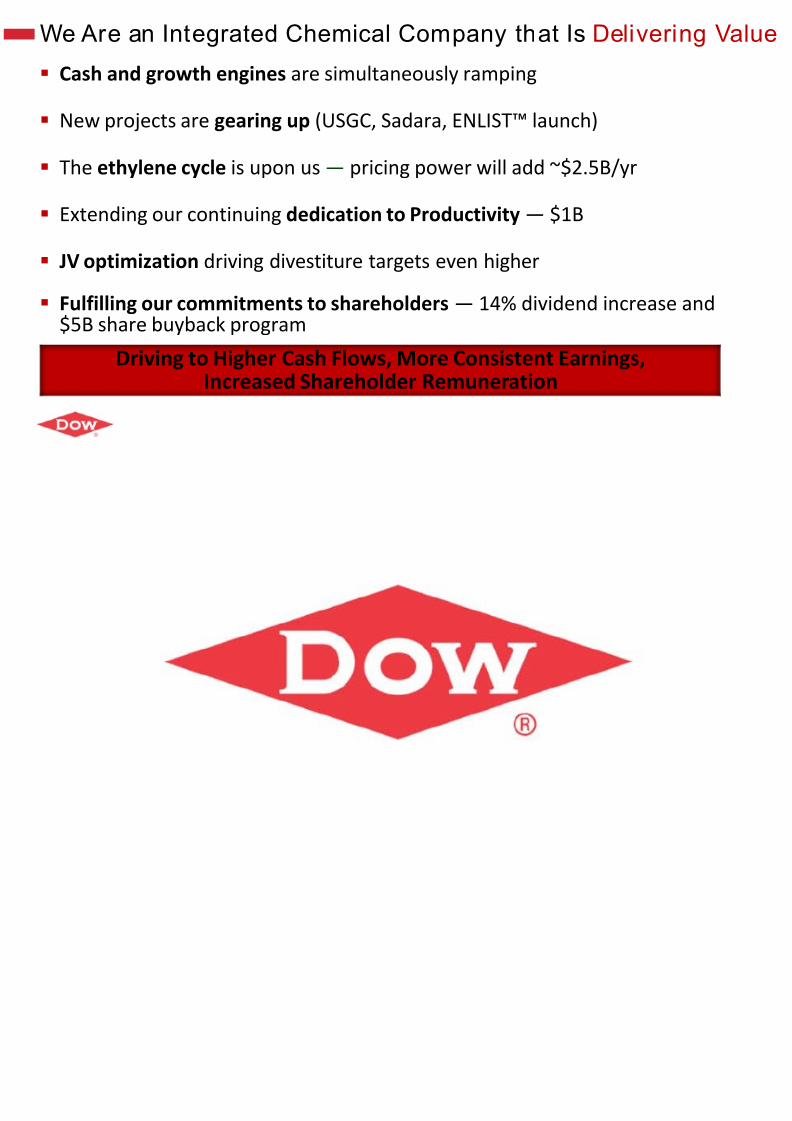
We Are an Integrated Chemical Company that Is Del
Cash and growth engines are simultaneously ramping
New projects are gearing up (USGC, Sadara, ENLIST™ launch)
The ethylene cycle is upon us — pricing power will add ~$2.5B/y
Extending our continuing dedication to Productivity ― $1B
JV optimization driving divestiture targets even higher
Fulfilling our commitments to shareholders ― 14% dividend inc$5B share buyback program
Driving to Higher Cash Flows, More Consistent EarningIncreased Shareholder Remuneration

8/10/2019 Day1 2014InvestorForum Final
http://slidepdf.com/reader/full/day1-2014investorforum-final 30/30
Related Documents