University of Natural Resources and Life Sciences, Vienna Department of Sustainable Agricultural Systems Division of Livestock Sciences Genome-wide association analysis for 305- day milk production traits in dairy cattle FUYONG LI Supervisor Dr. Ir. Marleen H.P.W. Visker Dr. Ir. Henk Bovenhuis Co - Supervisor Dr. Patrik Waldmann Vienna, June 2012

Welcome message from author
This document is posted to help you gain knowledge. Please leave a comment to let me know what you think about it! Share it to your friends and learn new things together.
Transcript
University of Natural Resources and Life Sciences, Vienna Department of Sustainable Agricultural Systems Division of Livestock Sciences
Genome-wide association analysis for 305-day milk production traits in dairy cattle
FUYONG LI
Supervisor Dr. Ir. Marleen H.P.W. Visker
Dr. Ir. Henk Bovenhuis
Co - Supervisor Dr. Patrik Waldmann
Vienna, June 2012
European Master in Animal Breeding and Genetics
Genome-wide association analysis for 305-day milk production traits in dairy cattle
FUYONG LI 860617515030
THESIS ANIMAL BREEDING AND GENETICS (ABG-80430)
July, 2012
Wageningen University Animal Breeding and Genetics Group SUPERVISORS Dr. Ir. Marleen H.P.W. Visker Dr. Ir. Henk Bovenhuis Dr. Patrik Waldmann
Genome-wide association analysis for 305-day milk production traits in dairy cattle
Contents
ABSTRACT.............................................................................................. 1
INTRODUCTION ..................................................................................... 2
MATERIALS AND METHODS .................................................................... 2
Phenotypes........................................................................................... 2
Genotypes ............................................................................................ 3
Genome-wide association study ............................................................... 4
RESULTS ................................................................................................ 5
305D-MY .............................................................................................. 7
305D-PY............................................................................................... 7
305D-FY............................................................................................... 7
DISCUSSION .......................................................................................... 8
Heritability.......................................................................................... 10
Statistic Model and Threshold ................................................................ 10
Major QTL for 305D-MY and 305D-FY...................................................... 11
QTL for 305D-PY.................................................................................. 12
QTL for multiple studied traits ............................................................... 13
Variance explained by SNPs .................................................................. 13
Further suggestions ............................................................................. 14
CONCLUSIONS ..................................................................................... 14
REFERENCES ........................................................................................ 15
1
ABSTRACT Our objective was to perform the genome-wide association study (GWAS) for 305-day milk production traits, including milk yield (305D-MY), protein yield (305D-PY) and fat yield (305D-FY) for the first 2 lactations of Dutch Holstein-Friesian cows, using 50K single nucleotide polymorphism (SNP) genotypes. Totally, 1659 cows were genotyped resulting in 44668 effective SNPs in lactation 1 (LA1) and 1333 cows were genotyped resulting in 44054 effective SNPs in lactation 2 (LA2). The single SNP association analyses were conducted in the animal model, and all relationships between individuals in the pedigree were taken into account. 232 SNPs in LA1 and 125 SNPs in LA2 were identified as being significantly (false discovery rate < 0.05) associated with 305-day milk production traits. For 305D-MY, 128 SNPs distributed on Bos taurus autosome (BTA) 2, 4, 5, 6, 9, 10, 14, 15, 16, 21, and 28 were significant in LA1; and 49 SNPs distributed on BTA 4, 6, 7, 10, 11, 14, 22, and 25 were significant in LA2. For 305D-PY, 4 SNPs distributed on BTA 3 and 16 were significant in LA1; and 2 SNPs distributed on BTA 1 and 11 were significant in LA2. For 305D-FY, 159 SNPs distributed on BTA 2, 3, 4, 5, 8, 9, 12, 14 and 28 were significant in LA1; and 117 SNPs distributed on BTA 1, 2, 4, 10, 11, and 14 were significant in LA2. The majority of detected significant associations (231/232 in LA1 and 125/125 in LA2) were located within known quantitative trait loci (QTL) for the traits of interest; 1 SNP on BTA 2 (at 12.80 Mbp) that does not appear to be located within a known QTL region for MY, was identified as being significantly associated with 305D-MY, suggesting that this region is a new and unique QTL for 305D-MY in the Dutch dairy population. Region 2a, region 9, region 10b, region 11, region 14, 5 single SNPs and 2 unmapped SNPs showed significant associations with 2 studied traits; region 6, region 14 and 2 unmapped SNPs showed significant associations in both LA1 and LA2. Region 14 was the major genome region for 305D-MY and 305D-FY in both 2 lactations. Regions for 305D-PY had relatively small effects and we did not find regions with major effects on 305D-PY. The proportion of genetic variance explained by the SNP showing the strongest association per region ranged from 2.46% for 305D-MY in LA1 on BTA 9 to 33.50% for 305D-FY in LA2 on BTA14. The proportion of phenotypic variance explained by the SNP showing the strongest association per region ranged from 0.66% for 305D-MY in LA1 on BTA 9 to 5.98% for 305D-FY in LA2 on BTA14. Above all, the results of this study revealed genome regions for 305D-MY, 305D-PY and 305D-FY in the Dutch dairy cattle population, and the QTL identified in this study should be further studied to identify the causal mutations and candidate genes underlying the QTL.
2
INTRODUCTION Milk provides a wide range of nutrients for infant mammals, including protein, fat, carbohydrates, vitamins, minerals. In addition to being a natural source of nutrition for infant mammals, milk and dairy products are major components of the human diet in many parts of the world. Milk production performance can be improved through genetic selection, optimal feeding and management practices. Previous studies have confirmed that a certain proportion of variation in milk production traits in dairy cattle such as milk yield (MY), protein yield (PY) and fat yield (FY) is due to genetic variation (19-41%) [1-3]. Hence, genetic selection can be an effective way to improve these traits. PY and FY are the main basis of dairy farmers’ payment in the Netherlands, so traditionally farmers, breeders, AI station and Breeding companies always center on MY, PY and FY by use of phenotypic selection. With the development of molecular biotechnology, selection by molecular information (marker or gene-assisted selection) has become an available choice to further improve milk production traits. Molecular information can also be used to enhance the understanding of the biological background of milk production traits, by detection of genome regions and genes responsible for genetic variation in these traits. Previous linkage studies have reported quantitative trait locus (QTL) for MY, PY and FY on all Bos taurus autosomes (BTA) [4-10]. However, confidence intervals of these QTL were generally large; thus identifying candidate genes is complicated based on these results. The genome-wide association study (GWAS) uses higher-density single nucleotide polymorphism (SNP) markers, which can not only reduce the confidence intervals and provides more accurate estimates of QTL locations, but also has higher power to detect new QTL compared to the linkage study. Some genome-wide association analyses for milk production traits and composition traits have been conducted in Dutch dairy cows (based on test-day milk samples) [12, 13] and other dairy populations (based on test-day milk sample and full-lactation records) [4, 11, 14-16]. But according to the information we have, no GWAS for full-lactation (305-day) milk production traits has been done in the Dutch Holstein-Friesian population. Compared to test-day samples, 305-day records are expected to provide more accurate results, because 305-day phenotypes are based on multiple test-day milk records and more reliable in practice. What is more, GWAS for 305D milk production traits plus previous GWAS results for milk composition traits in the same population [12, 13] can show the overview of chromosome regions affecting both milk production and composition in Dutch dairy cattle. This research mainly focused on the genome-wide association for 305-day (305D) milk production traits using 50K SNPs, aiming to locate the genome regions associated with 305D-MY, 305D-PY and 305D-FY in Dutch Holstein-Friesian cows, which could complement preceding association studies for milk composition traits in the same population, and build a foundation on identifying candidate genes and genetic variants underlying these studied traits. MATERIALS AND METHODS Phenotypes
Being part of the Dutch Milk Genomics Initiative, 305-day milk production records (including 305D-MY, 305D-PY, and 305D-FY) were available for 1842 first-lactation (LA1) Dutch Holstein-Friesian cows from 393 farms; 1454 out of those cows from 350 farms were also recorded during the second lactation (LA2). In both lactations, at least three cows were selected per farm throughout the Netherlands. The pedigree information of these cows was
3
provided by CRV (Cooperative cattle improvement organization, Arnhem, the Netherlands). More details about the population in this study were described by Schopen et al. [1]. Genotypes
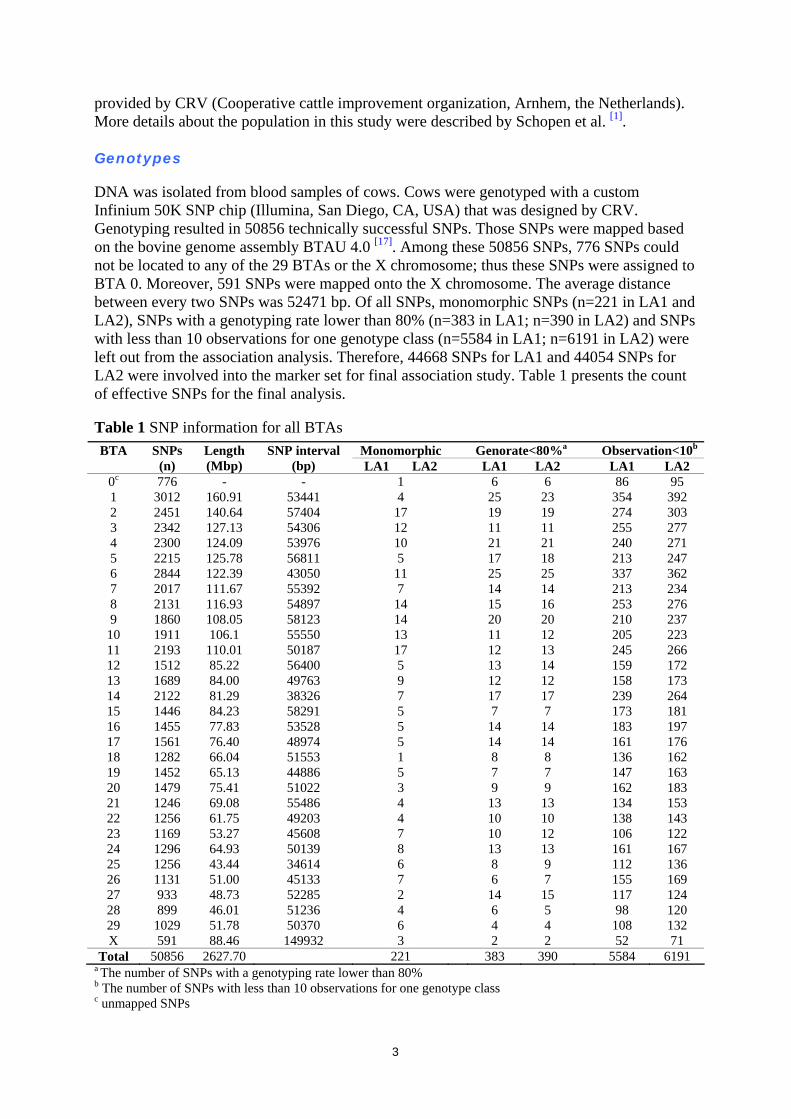
DNA was isolated from blood samples of cows. Cows were genotyped with a custom Infinium 50K SNP chip (Illumina, San Diego, CA, USA) that was designed by CRV. Genotyping resulted in 50856 technically successful SNPs. Those SNPs were mapped based on the bovine genome assembly BTAU 4.0 [17]. Among these 50856 SNPs, 776 SNPs could not be located to any of the 29 BTAs or the X chromosome; thus these SNPs were assigned to BTA 0. Moreover, 591 SNPs were mapped onto the X chromosome. The average distance between every two SNPs was 52471 bp. Of all SNPs, monomorphic SNPs (n=221 in LA1 and LA2), SNPs with a genotyping rate lower than 80% (n=383 in LA1; n=390 in LA2) and SNPs with less than 10 observations for one genotype class (n=5584 in LA1; n=6191 in LA2) were left out from the association analysis. Therefore, 44668 SNPs for LA1 and 44054 SNPs for LA2 were involved into the marker set for final association study. Table 1 presents the count of effective SNPs for the final analysis. Table 1 SNP information for all BTAs
a The number of SNPs with a genotyping rate lower than 80% b The number of SNPs with less than 10 observations for one genotype class c unmapped SNPs
Monomorphic Genorate<80%a Observation<10b BTA SNPs (n)
Length (Mbp)
SNP interval (bp) LA1 LA2 LA1 LA2 LA1 LA2
0c 776 - - 1 6 6 86 95 1 3012 160.91 53441 4 25 23 354 392 2 2451 140.64 57404 17 19 19 274 303 3 2342 127.13 54306 12 11 11 255 277 4 2300 124.09 53976 10 21 21 240 271 5 2215 125.78 56811 5 17 18 213 247 6 2844 122.39 43050 11 25 25 337 362 7 2017 111.67 55392 7 14 14 213 234 8 2131 116.93 54897 14 15 16 253 276 9 1860 108.05 58123 14 20 20 210 237
10 1911 106.1 55550 13 11 12 205 223 11 2193 110.01 50187 17 12 13 245 266 12 1512 85.22 56400 5 13 14 159 172 13 1689 84.00 49763 9 12 12 158 173 14 2122 81.29 38326 7 17 17 239 264 15 1446 84.23 58291 5 7 7 173 181 16 1455 77.83 53528 5 14 14 183 197 17 1561 76.40 48974 5 14 14 161 176 18 1282 66.04 51553 1 8 8 136 162 19 1452 65.13 44886 5 7 7 147 163 20 1479 75.41 51022 3 9 9 162 183 21 1246 69.08 55486 4 13 13 134 153 22 1256 61.75 49203 4 10 10 138 143 23 1169 53.27 45608 7 10 12 106 122 24 1296 64.93 50139 8 13 13 161 167 25 1256 43.44 34614 6 8 9 112 136 26 1131 51.00 45133 7 6 7 155 169 27 933 48.73 52285 2 14 15 117 124 28 899 46.01 51236 4 6 5 98 120 29 1029 51.78 50370 6 4 4 108 132 X 591 88.46 149932 3 2 2 52 71
Total 50856 2627.70 221 383 390 5584 6191
4
Genome-wide association study
Totally 1659 cows in LA1 and 1333 cows in LA2 having both phenotype and genotype records, formed the datasets used in the genome-wide association study. The single SNP association analyses were performed in ASReml [18] using the following animal model: yjklmno = μ + b1*caj + b2*caj
2 + seasonk +scodel + Go + animalm + herdn+ ejklmno where y was the phenotype; μ was the overall mean; ca was a covariate describing the effect of age at calving; season was the fixed effect with 4 classes for calving season (June-Aug, Sept-Nov, Dec-Feb, and Mar-May); scode was the fixed effect explaining differences in genetic level between proven bull daughters, young bull daughters and other bull daughters; G was the fixed effect of SNP; animal was the random additive genetic effect of individual, distributed as N(0,Aσa
2), with the additive genetic relationship matrix A and the additive genetic variance σa
2; herd was the random herd effect distributed as N(0, Iσherd2 ), with
identity matrix I and herd variance σherd2 and e was the random residual effect, distributed as
N(0, Iσe2), with identity matrix I and residual variance σe
2. This model accounted for all relationships among individuals. Analyses for 305D-MY, 305D-PY and 305D-FY were done separately for LA1 and LA2; thus ca and season were different for LA1 and LA2. Significance thresholds were obtained by calculating the genome-wide false discovery rate (FDR) in the R package “qvalue”, according to the method given by Storey and Tibshirani [19]. The genome-wide FDR was calculated based on the P-values from the animal model for each trait per lactation. SNPs with FDR < 0.05 were considered to be significantly associated with the trait. A significantly associated region was defined as described by Bouwman et al. [13]: starting with the first significant SNP on a BTA and followed by an additional significant SNP that occurred within 10 Mbp, extending as long as another significant SNP for at least one of the traits in at least one of the lactations occurred within 10 Mbp from the previous one and ending at the last significant SNP that was not followed by another significant SNP within the next 10 Mbp. 10 Mbp distance between significant SNPs was chosen to avoid many small regions on one BTA with each containing a small number of significant SNPs. The variance explained by an SNP was calculated from the estimated genotype effects from the animal model and the observed genotype frequencies. The result was expressed as the percentage of the additive genetic variance (VarG) and the percentage of phenotypic variance (VarP). The VarG and VarP of the most significant SNP per region, as well as the single and unmapped significant SNPs for each trait are reported. In addition to the association analyses, variance components of 305D-MY, 305D-PY and 305D-FY in both lactations were estimated with the animal model but without the fixed effect of SNP (G).
5
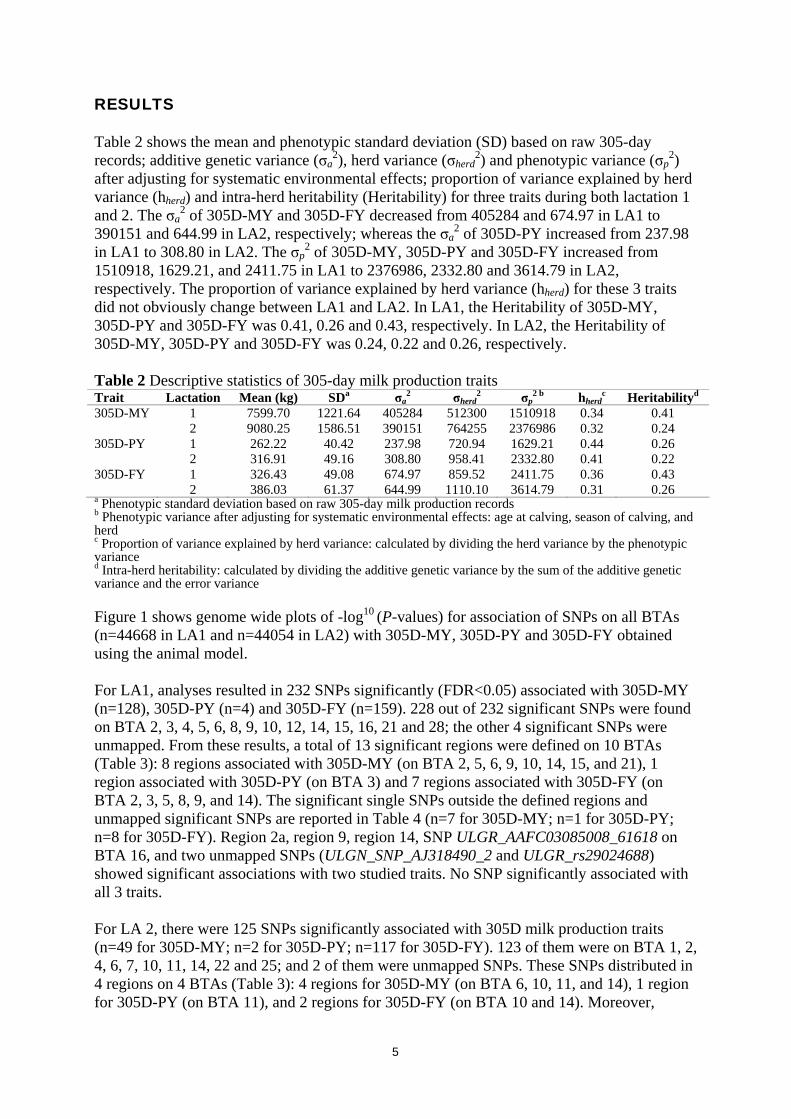
RESULTS Table 2 shows the mean and phenotypic standard deviation (SD) based on raw 305-day records; additive genetic variance (σa
2), herd variance (σherd2) and phenotypic variance (σp
2) after adjusting for systematic environmental effects; proportion of variance explained by herd variance (hherd) and intra-herd heritability (Heritability) for three traits during both lactation 1 and 2. The σa
2 of 305D-MY and 305D-FY decreased from 405284 and 674.97 in LA1 to 390151 and 644.99 in LA2, respectively; whereas the σa
2 of 305D-PY increased from 237.98 in LA1 to 308.80 in LA2. The σp
2 of 305D-MY, 305D-PY and 305D-FY increased from 1510918, 1629.21, and 2411.75 in LA1 to 2376986, 2332.80 and 3614.79 in LA2, respectively. The proportion of variance explained by herd variance (hherd) for these 3 traits did not obviously change between LA1 and LA2. In LA1, the Heritability of 305D-MY, 305D-PY and 305D-FY was 0.41, 0.26 and 0.43, respectively. In LA2, the Heritability of 305D-MY, 305D-PY and 305D-FY was 0.24, 0.22 and 0.26, respectively. Table 2 Descriptive statistics of 305-day milk production traits Trait Lactation Mean (kg) SDa σa
2 σherd2 σp
2 b hherdc Heritabilityd
305D-MY 1 7599.70 1221.64 405284 512300 1510918 0.34 0.41 2 9080.25 1586.51 390151 764255 2376986 0.32 0.24 305D-PY 1 262.22 40.42 237.98 720.94 1629.21 0.44 0.26 2 316.91 49.16 308.80 958.41 2332.80 0.41 0.22 305D-FY 1 326.43 49.08 674.97 859.52 2411.75 0.36 0.43
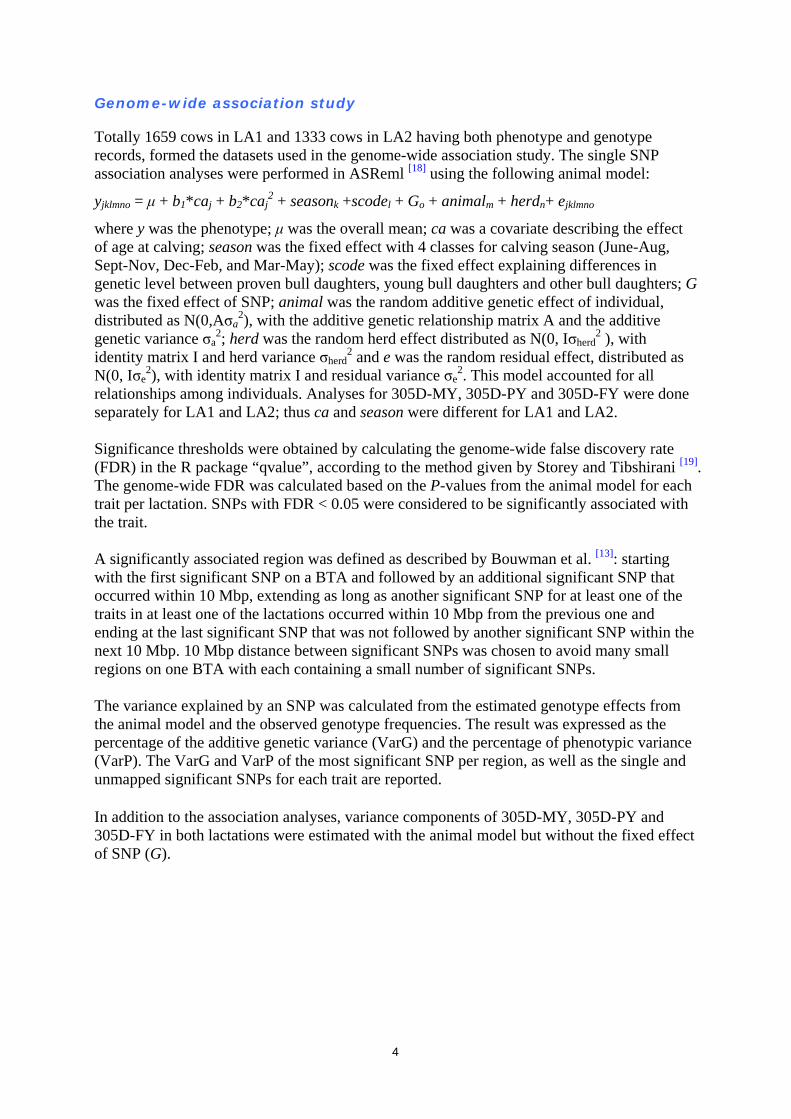
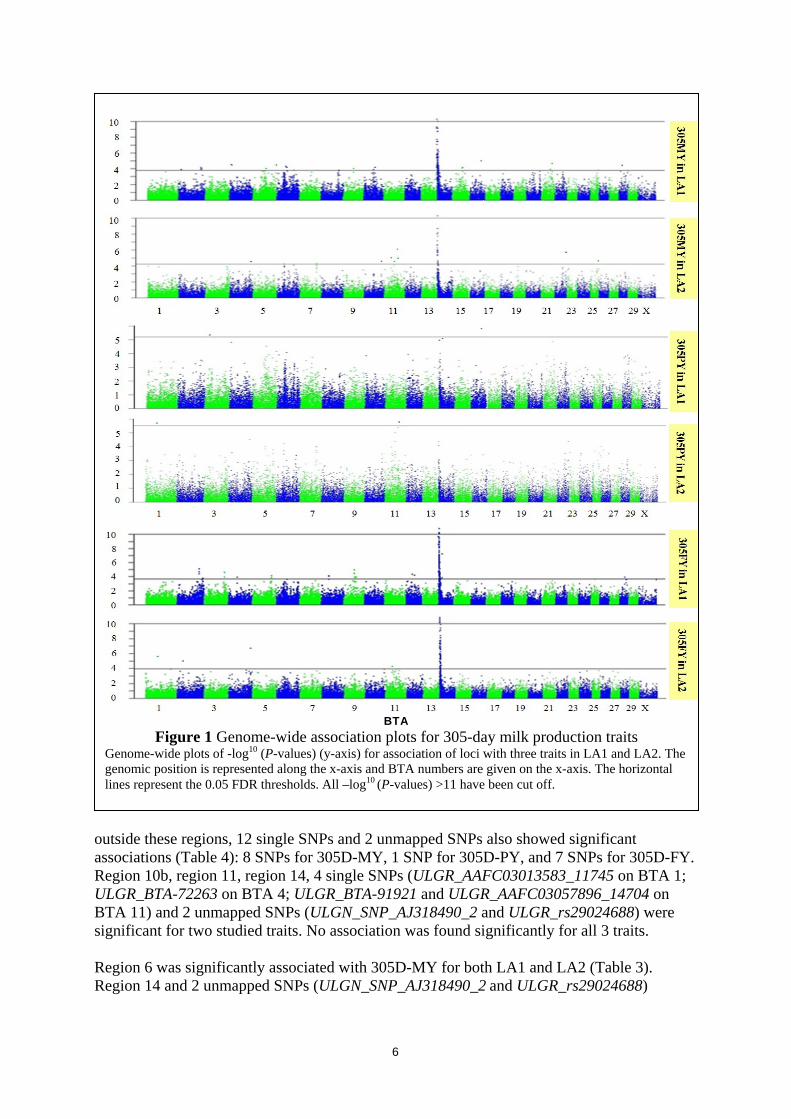
2 386.03 61.37 644.99 1110.10 3614.79 0.31 0.26 a Phenotypic standard deviation based on raw 305-day milk production records b Phenotypic variance after adjusting for systematic environmental effects: age at calving, season of calving, and herd c Proportion of variance explained by herd variance: calculated by dividing the herd variance by the phenotypic variance d Intra-herd heritability: calculated by dividing the additive genetic variance by the sum of the additive genetic variance and the error variance Figure 1 shows genome wide plots of -log10 (P-values) for association of SNPs on all BTAs (n=44668 in LA1 and n=44054 in LA2) with 305D-MY, 305D-PY and 305D-FY obtained using the animal model. For LA1, analyses resulted in 232 SNPs significantly (FDR<0.05) associated with 305D-MY (n=128), 305D-PY (n=4) and 305D-FY (n=159). 228 out of 232 significant SNPs were found on BTA 2, 3, 4, 5, 6, 8, 9, 10, 12, 14, 15, 16, 21 and 28; the other 4 significant SNPs were unmapped. From these results, a total of 13 significant regions were defined on 10 BTAs (Table 3): 8 regions associated with 305D-MY (on BTA 2, 5, 6, 9, 10, 14, 15, and 21), 1 region associated with 305D-PY (on BTA 3) and 7 regions associated with 305D-FY (on BTA 2, 3, 5, 8, 9, and 14). The significant single SNPs outside the defined regions and unmapped significant SNPs are reported in Table 4 (n=7 for 305D-MY; n=1 for 305D-PY; n=8 for 305D-FY). Region 2a, region 9, region 14, SNP ULGR_AAFC03085008_61618 on BTA 16, and two unmapped SNPs (ULGN_SNP_AJ318490_2 and ULGR_rs29024688) showed significant associations with two studied traits. No SNP significantly associated with all 3 traits. For LA 2, there were 125 SNPs significantly associated with 305D milk production traits (n=49 for 305D-MY; n=2 for 305D-PY; n=117 for 305D-FY). 123 of them were on BTA 1, 2, 4, 6, 7, 10, 11, 14, 22 and 25; and 2 of them were unmapped SNPs. These SNPs distributed in 4 regions on 4 BTAs (Table 3): 4 regions for 305D-MY (on BTA 6, 10, 11, and 14), 1 region for 305D-PY (on BTA 11), and 2 regions for 305D-FY (on BTA 10 and 14). Moreover,
6
outside these regions, 12 single SNPs and 2 unmapped SNPs also showed significant associations (Table 4): 8 SNPs for 305D-MY, 1 SNP for 305D-PY, and 7 SNPs for 305D-FY. Region 10b, region 11, region 14, 4 single SNPs (ULGR_AAFC03013583_11745 on BTA 1; ULGR_BTA-72263 on BTA 4; ULGR_BTA-91921 and ULGR_AAFC03057896_14704 on BTA 11) and 2 unmapped SNPs (ULGN_SNP_AJ318490_2 and ULGR_rs29024688) were significant for two studied traits. No association was found significantly for all 3 traits. Region 6 was significantly associated with 305D-MY for both LA1 and LA2 (Table 3). Region 14 and 2 unmapped SNPs (ULGN_SNP_AJ318490_2 and ULGR_rs29024688)
BTA Figure 1 Genome-wide association plots for 305-day milk production traits
Genome-wide plots of -log10 (P-values) (y-axis) for association of loci with three traits in LA1 and LA2. The genomic position is represented along the x-axis and BTA numbers are given on the x-axis. The horizontal lines represent the 0.05 FDR thresholds. All –log10 (P-values) >11 have been cut off.
7
showed significant associations with both 305D-MY and 305D-FY in both LA1 and LA2 (Table 3 and Table 4). 305D-MY
For LA1, 8 regions (2a, 5a, 6, 9, 10a, 14, 15, and 21), 5 single SNPs (on BTA 2, 4, 5, 16, and 28), and 2 unmapped SNPs were significantly associated with 305D-MY. The most significant SNP (FDR=3.00E-14) was ULGR_SNP_AJ318490_1c in region 14, which explained 14.64% additive genetic variance and 3.93% phenotypic variance. For LA2, 4 regions (6, 10b, 11, and 14), 6 single SNPs (on BTA 4, 7, 11, 22 and 25) and 2 unmapped SNPs showed significant association for 305D-MY. The most significant SNP (FDR=7.00E-12) was the unmapped SNP ULGN_SNP_AJ318490_2, which accounted for 28.24% additive genetic variance and 4.64% phenotypic variance. Region 6, region 14 and 2 unmapped SNPs (ULGN_SNP_AJ318490_2 and ULGR_rs29024688) were significantly associated with 305D-MY for both LA1 and LA2. 305D-PY
For LA1, region 3a (25.58-25.59 Mbp on BTA 3) and 1 single SNP (ULGR_AAFC03085008_61618 located at 54.85 Mbp on BTA 16) showed significant associations with 305D-PY. The most significant SNP (FDR=0.049) for 305D-PY was ULGR_AAFC03085008_61618 which contributed 6.92% additive genetic variance and 1.01% phenotypic variance. For LA2, region 11 and 1 single SNP (ULGR_AAFC03013583_11745 on BTA 1) were significantly associated with 305D-PY. ULGR_AAFC03091727_8560 (FDR=0.041; located at 71.03 Mbp on BTA 11) was the most significant SNP; its VarG and VarP were 11.50% and 1.52%, respectively. SNPs significantly associated with 305D-PY in LA1 were not significant in LA2, and SNPs significantly associated with 305D-PY in LA2 were not significant in LA1. When we relaxed the significant threshold, 14 suggestive (0.05≤FDR≤0.20) SNPs presented associations with 305D-PY in LA1; but no SNP was suggestively associated with 305D-PY in LA2 (Table 5). These 14 suggestive SNPs for LA1 305D-PY were distributed on BTA 4, 5, 6, 14, 21; 4 of them were unmapped. Among these 14 SNPs, there were 3 in region 5a, 1 in region 6, 3 in region 14, and 1 in region 21; these 4 regions and 1 of the 4 unmapped SNP (ULGN_SNP_AJ318490_2) were also significantly associated with the other studied traits. 305D-FY
For LA1, 7 genome regions (2a, 2b, 3b, 5b, 8, 9, and 14), 4 single SNPs (on BTA 4, 12, 28) and 4 unmapped SNPs were significantly associated with 305D-FY. The most significant (FDR=1.97E-24) SNP was ULGR_SNP_AJ318490_1c in region 14, which accounted for 20.81% additive genetic variance and 5.82% phenotypic variance. For LA2, region 10b, region 14, 5 single SNPs (on BTA 1, 2, 4, and 11) and 2 unmapped SNPs significantly associated with 305D-FY. ULGR_SNP_AJ318490_1b in region 14 was the
8
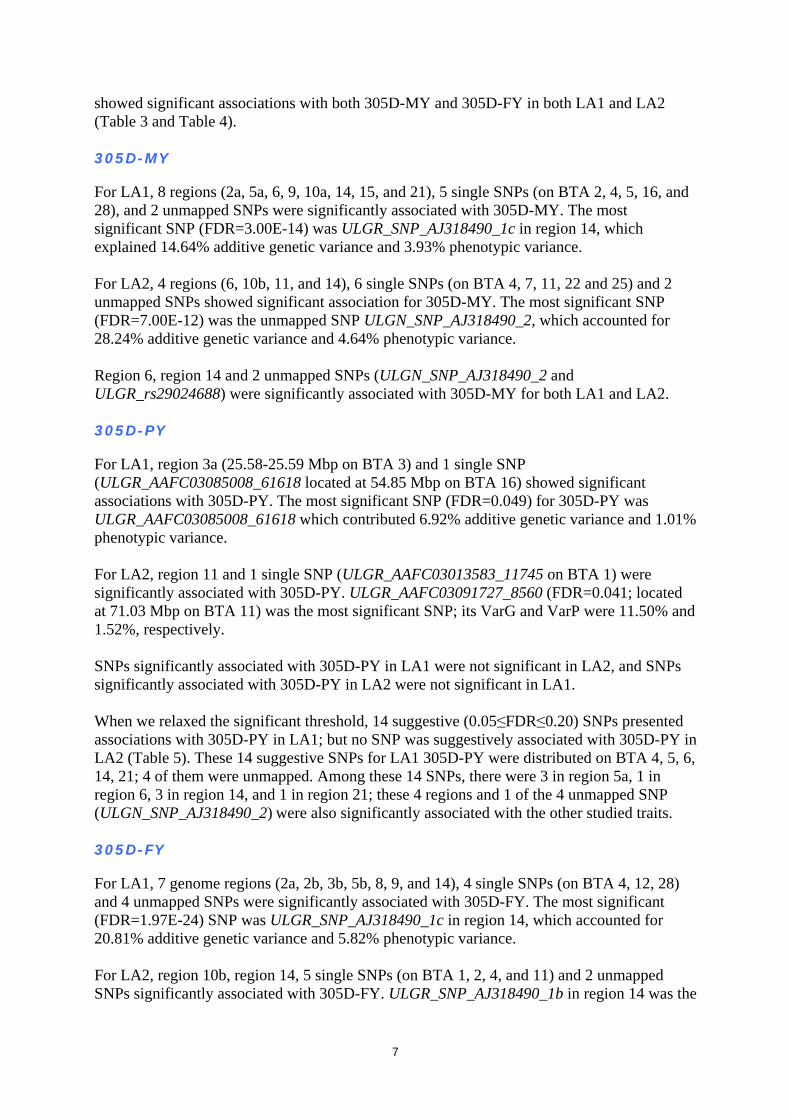
most significant SNP with FDR=2.97E-16, explaining 33.50% additive genetic variance and 5.98% phenotypic variance. Region 14 and 2 unmapped SNPs (ULGN_SNP_AJ318490_2 and ULGR_rs29024688) were significantly associated with 305D-FY for both LA1 and LA2. The most significant SNPs for LA1 and LA2 were ULGR_SNP_AJ318490_1c and ULGR_SNP_AJ318490_1b, respectively, both corresponding to the DGAT1 K232A polymorphism. Table 3 Regions significantly (FDR<0.05) associated with 305D milk production traits
Regiona Start (Mbp)
End (Mbp)
LAb Trait Significant SNPs in region (n)
SNP namec FDR P-value VarG (%)d
VarP (%)e
2a 113.93 118.51 1 MY 3 ULGR_BTA-97822 0.030 6.75E-05 3.27 0.88 1 FY 4 ULGR_AAFC03114487_3884 0.003 7.77E-06 3.84 1.07 2b 134.97 134.97 1 FY 3 ULGR_BTA-49807 0.045 1.69E-04 2.73 0.76 3a 25.58 25.59 1 PY 3 ULGR_rs29015902 0.049 4.70E-06 6.78 0.99 3b 107.92 107.95 1 FY 2 ULGR_BTA-68961 0.010 2.64E-05 3.78 1.06 5a 69.15 69.15 1 MY 3 ULGR_AAFC03025995_27104 0.037 9.63E-05 3.35 0.90 5b 101.07 101.09 1 FY 2 ULGR_rs29016908 0.024 7.45E-05 3.11 0.87 6 39.00 49.61 1 MY 2 ULGR_BTA-76105 0.026 5.32E-05 3.59 0.96 2 MY 1 ULGR_BTC-070716 0.049 5.67E-05 7.25 1.19 8 37.27 37.27 1 FY 2 ULGR_AAFC03067781_117652 0.025 7.83E-05 2.72 0.76 9 52.38 65.02 1 MY 1 Hapmap49336-BTA-83713 0.038 1.01E-04 2.46 0.66 1 FY 5 ULGR_BTA-83950 0.005 1.09E-05 2.92 0.82 10a 50.80 58.91 1 MY 2 ULGR_BTA-89332 0.030 7.09E-05 3.35 0.90 10b 92.40 97.64 2 MY 1 ULGR_BTA-79353 0.028 2.53E-05 8.04 1.32 2 FY 1 BTB-01147244 0.045 1.23E-04 5.28 0.94 11 70.32 71.03 2 MY 2 BFGL-NGS-116693 0.002 8.23E-07 10.66 1.75 2 PY 1 ULGR_AAFC03091727_8560 0.041 1.62E-06 11.50 1.52 14 0.05 17.81 1 MY 106 ULGR_SNP_AJ318490_1c 3.00E-14 1.36E-18 14.64 3.93 1 FY 137 ULGR_SNP_AJ318490_1c 1.97E-24 1.01E-28 20.81 5.82 2 MY 37 ULGR_SNP_AJ318490_1c 7.00E-12 3.33E-16 27.64 4.54 2 FY 109 ULGR_SNP_AJ318490_1b 2.97E-16 6.93E-21 33.50 5.98 15 51.52 53.25 1 MY 2 ULGR_AAFC03051145_8303 0.030 7.09E-05 3.30 0.88 21 46.52 54.12 1 MY 2 BTB-01046504 0.015 2.26E-05 3.27 0.88
a A region starts at the first significant SNP and proceeds if the next significant SNP is positioned within the next 10 Mbp on the same chromosome, ending at the position of the last significant SNP matching this requirement. The number of the region stands for the BTA number plus an a and b indicating different regions within a BTA. b LA=Lactation c This is the name of the most significantly associated SNP for each trait in a given region. d Percentage of total additive genetic variance explained by the most significant SNP associated with the trait per region. e Percentage of total phenotypic variance explained by the most significant SNP associated with the trait per region. DISCUSSION 232 SNPs in LA1 and 125 SNPs in LA2 showed significant (FDR < 0.05) associations with one or two traits in our study. Because reported QTL locations from linkage studies were based on genetic distances in units of Morgan (or centiMorgan) rather than the physical distances (Mb or kb) as described in this study, we were not able to exactly translate the bovine genetic distances into physical distances. Hence, we considered that 1 cM roughly equals 1 Mbp to compare our results with results from linkage studies, and the ruler for cM and Mbp defined by Ogorevc et al. was also used as a reference [20]. The majority of these significant associations (231/232 in LA1 and 125/125 in LA2) for 305D-MY, 305D-PY and 305D-FY were located in known QTL regions those for MY, PY and FY, respectively. This demonstrates that our materials and methods are effective for performing GWAS. Our results are not only a foundation to re-estimate the accurate location of QTL regions previously
9
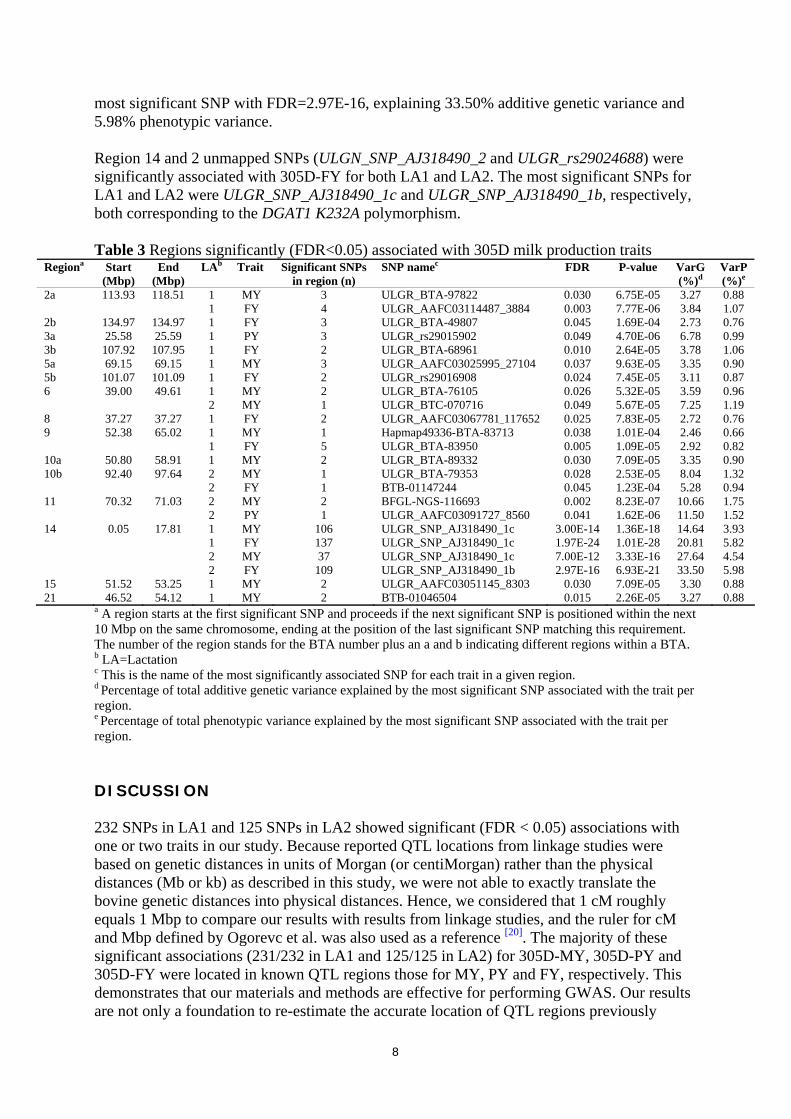
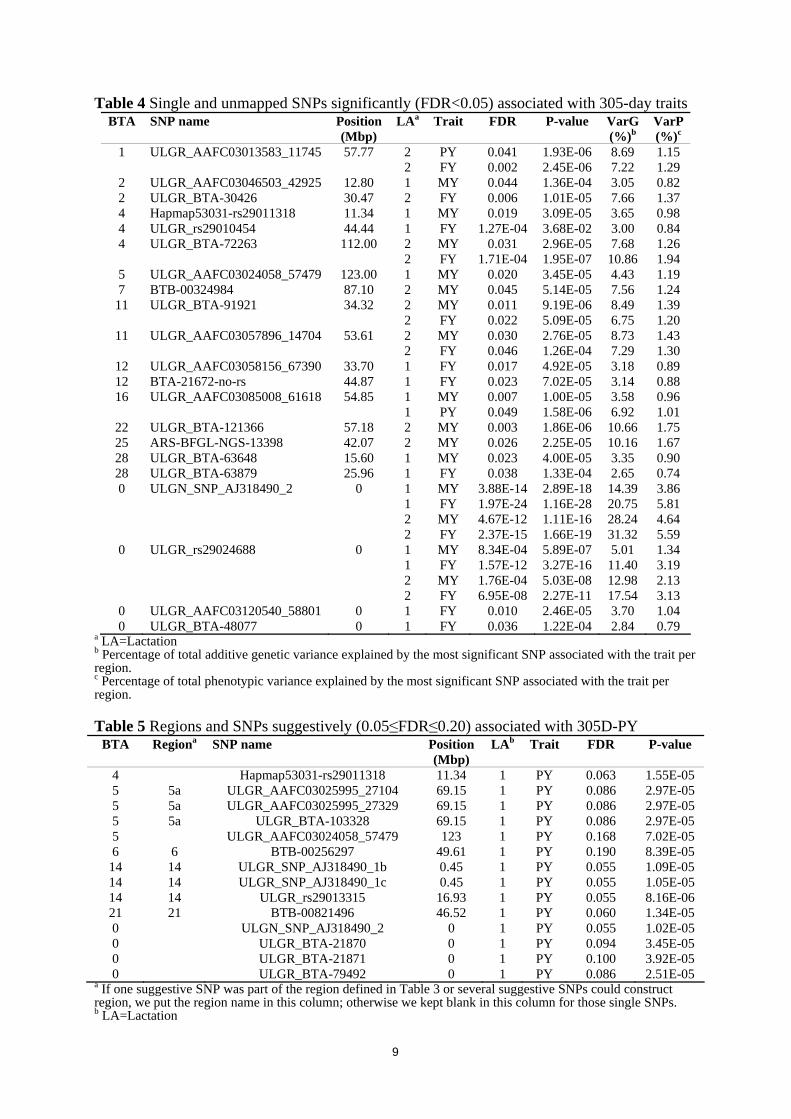
Table 4 Single and unmapped SNPs significantly (FDR<0.05) associated with 305-day traits BTA SNP name Position
(Mbp) LAa Trait FDR P-value VarG
(%)b VarP (%)c
1 ULGR_AAFC03013583_11745 57.77 2 PY 0.041 1.93E-06 8.69 1.15 2 FY 0.002 2.45E-06 7.22 1.29
2 ULGR_AAFC03046503_42925 12.80 1 MY 0.044 1.36E-04 3.05 0.82 2 ULGR_BTA-30426 30.47 2 FY 0.006 1.01E-05 7.66 1.37 4 Hapmap53031-rs29011318 11.34 1 MY 0.019 3.09E-05 3.65 0.98 4 ULGR_rs29010454 44.44 1 FY 1.27E-04 3.68E-02 3.00 0.84 4 ULGR_BTA-72263 112.00 2 MY 0.031 2.96E-05 7.68 1.26 2 FY 1.71E-04 1.95E-07 10.86 1.94
5 ULGR_AAFC03024058_57479 123.00 1 MY 0.020 3.45E-05 4.43 1.19 7 BTB-00324984 87.10 2 MY 0.045 5.14E-05 7.56 1.24
11 ULGR_BTA-91921 34.32 2 MY 0.011 9.19E-06 8.49 1.39 2 FY 0.022 5.09E-05 6.75 1.20
11 ULGR_AAFC03057896_14704 53.61 2 MY 0.030 2.76E-05 8.73 1.43 2 FY 0.046 1.26E-04 7.29 1.30
12 ULGR_AAFC03058156_67390 33.70 1 FY 0.017 4.92E-05 3.18 0.89 12 BTA-21672-no-rs 44.87 1 FY 0.023 7.02E-05 3.14 0.88 16 ULGR_AAFC03085008_61618 54.85 1 MY 0.007 1.00E-05 3.58 0.96
1 PY 0.049 1.58E-06 6.92 1.01 22 ULGR_BTA-121366 57.18 2 MY 0.003 1.86E-06 10.66 1.75 25 ARS-BFGL-NGS-13398 42.07 2 MY 0.026 2.25E-05 10.16 1.67 28 ULGR_BTA-63648 15.60 1 MY 0.023 4.00E-05 3.35 0.90 28 ULGR_BTA-63879 25.96 1 FY 0.038 1.33E-04 2.65 0.74 0 ULGN_SNP_AJ318490_2 0 1 MY 3.88E-14 2.89E-18 14.39 3.86 1 FY 1.97E-24 1.16E-28 20.75 5.81 2 MY 4.67E-12 1.11E-16 28.24 4.64 2 FY 2.37E-15 1.66E-19 31.32 5.59
0 ULGR_rs29024688 0 1 MY 8.34E-04 5.89E-07 5.01 1.34 1 FY 1.57E-12 3.27E-16 11.40 3.19 2 MY 1.76E-04 5.03E-08 12.98 2.13 2 FY 6.95E-08 2.27E-11 17.54 3.13
0 ULGR_AAFC03120540_58801 0 1 FY 0.010 2.46E-05 3.70 1.04 0 ULGR_BTA-48077 0 1 FY 0.036 1.22E-04 2.84 0.79
a LA=Lactation b Percentage of total additive genetic variance explained by the most significant SNP associated with the trait per region. c Percentage of total phenotypic variance explained by the most significant SNP associated with the trait per region. Table 5 Regions and SNPs suggestively (0.05≤FDR≤0.20) associated with 305D-PY
BTA Regiona SNP name Position (Mbp)
LAb Trait FDR P-value
4 Hapmap53031-rs29011318 11.34 1 PY 0.063 1.55E-05 5 5a ULGR_AAFC03025995_27104 69.15 1 PY 0.086 2.97E-05 5 5a ULGR_AAFC03025995_27329 69.15 1 PY 0.086 2.97E-05 5 5a ULGR_BTA-103328 69.15 1 PY 0.086 2.97E-05 5 ULGR_AAFC03024058_57479 123 1 PY 0.168 7.02E-05 6 6 BTB-00256297 49.61 1 PY 0.190 8.39E-05
14 14 ULGR_SNP_AJ318490_1b 0.45 1 PY 0.055 1.09E-05 14 14 ULGR_SNP_AJ318490_1c 0.45 1 PY 0.055 1.05E-05 14 14 ULGR_rs29013315 16.93 1 PY 0.055 8.16E-06 21 21 BTB-00821496 46.52 1 PY 0.060 1.34E-05 0 ULGN_SNP_AJ318490_2 0 1 PY 0.055 1.02E-05 0 ULGR_BTA-21870 0 1 PY 0.094 3.45E-05 0 ULGR_BTA-21871 0 1 PY 0.100 3.92E-05 0 ULGR_BTA-79492 0 1 PY 0.086 2.51E-05
a If one suggestive SNP was part of the region defined in Table 3 or several suggestive SNPs could construct region, we put the region name in this column; otherwise we kept blank in this column for those single SNPs. b LA=Lactation
10
detected in linkage studies [4-10], but also a convincing confirmation for prior association studies [4, 11-16]. One SNP on BTA 2 (at 12.80 Mbp) that does not appear to be located within a known QTL region for MY, was identified as being significantly associated with 305D-MY, suggesting that this region is a new QTL for 305D-MY in the Dutch dairy population. Furthermore, several detected significant regions were only reported by previous association studies but not revealed by the linkage study. For example, the region around 54.85 Mbp on BTA 16 was only found significantly associated with PY in previous association study [4] but was not in the linkage study. This illustrates the increased power of the association study compared with the linkage study. Heritability
In this study, the heritability (h2) of 305D-MY, 305D-PY and 305D-FY was estimated based on full-lactation (305-day) milk production records. For these 3 studied traits, the heritability in LA1 (0.41 for 305D-MY, 0.26 for 305D-PY and 0.43 for 305D-FY) was higher than the heritability in LA2 (0.24, 0.22 and 0.26). Phenotypic variance (σp
2) and herd variance (σherd2)
of these 3 traits, as well as the additive genetic variance (σa2) of 305D-PY increased from
LA1 to LA2, but σa2 of 305D-MY and 305D-FY did not apparently change between 2
lactations. Therefore, the difference of h2 between LA1 and LA2 was relatively small for 305D-PY but larger for 305D-MY and 305D-FY; the proportion of variance explained by herd variance (hherd) in LA1 was similar as in LA2 for these 3 traits. In absolute sense, the σa
2 of 305D-MY and 305D-FY did not decline obviously, even increased for 305D-PY from LA1 to LA2. However, in relative sense, the lower h2 of traits in LA2 than in LA1 indicates that genetic factors are more important in LA1 than in LA2. Our results show that the herd effect (arises from differences in feeding and management between herds) was important for milk production traits; especially for 305D-PY in both lactations, as well as for 305D-MY and 305D-FY in lactation 2, herd effect is even more important than genetic factors. The heritability of these three traits in both lactations are similar to values found in previous studies: Schopen et al. estimated the h2 for MY, FY and PY was 0.41, 0.24 and 0.39, respectively, based on first lactation test-day samples of the same animals as in the present study [1]; Kadarmideen et al. reported the h2 was 0.28, 0.19 and 0.21 according to the 305-day records from multiple lactations [2]; Bastiaansen et al. presented the h2 for the first lactation 305D-MY, 305D-PY and 305D-FY was 0.25, 0.26 and 0.28, respectively [3]. Statistic Model and Threshold
This study, to our knowledge, is the first to perform the genome-wide association study for 305-day milk production traits using the animal model (mixed model) for every SNP from 50K SNP in Dutch dairy cows. Using the animal model and accounting for all relationships between individuals in the pedigree is the most appropriate analysis for association study, since it can avoid inflated test statistic [21]. Daetwyler et al., Kolbehdari et al., Jiang et al. and Meredith et al. all performed association studies using the mixed model for milk production traits, accounting for the pedigree information among individuals in Canadian, Chinese and Ireland dairy populations [4, 11, 15, 16]. However, in Dutch Holstein-Friesian cows, Schopen et al. conducted the genome-wide association analysis for milk protein traits based on first lactation test-day samples using two steps: the first step using a general linear model and the second step using an animal model [12]. Significant SNPs from the first step were further analyzed in the animal model, and –log10 (P-value) ≥3 was the significant threshold in the second step [12]. They did not detect significant SNPs associated with PY using this 2 steps analysis method [12]. Later on, Bastiaansen et al. detected SNPs showing significant associations with 305D-PY in Dutch and 3 other European dairy populations but just using a linear model [3]. In the
11
present study, 50K SNPs were all analyzed using the animal model and the FDR was calculated according to the P-value from the animal model. The significant and suggestive threshold was defined as FDR<0.05 and 0.05≤FDR≤0.2, respectively. Compared to previous genome-wide association studies in the same population by Bastiaansen et al. and Schopen et al. [3, 12], the statistic model and significant threshold used in this study is more highly accurate and stringent. Considering that we indeed detected SNPs significantly associated with 305D-PY in the present study and our threshold is more stringent than the threshold defined by Schopen et al. in the same population [12], we infer that using test-day milk samples rather than 305D-records is the main reason that Schopen et al. did not to find significant SNPs for PY in the Dutch dairy cows. Major QTL for 305D-MY and 305D-FY
There were 5 major regions associated with both 305D-MY and 305D-FY in the same lactation, or associated with one of these 2 traits in both lactations: region 2a, 6, 9, 10b, and 14. These 5 major regions that we detected associated with 305D-MY and 305D-FY are in agreement with previous studies; in other words, we confirmed earlier findings. Region 2a (113.93-118.51 Mbp on BTA2) was significant for 305D-MY and 305D-FY in LA1, which overlapped the significant region for MY and FY (113.83-126.62 Mbp) detected by Meredith et al. [16]. Region 6 (39.00-49.61 Mbp on BTA6) showed significant associations with 305D-MY for both lactations, which was close to the known 420-kb region between the genes ABCG2 and LAP3 (36.96-38.60 Mbp, containing six genes: ABCG2, PKD2, SPP1, MEPE, IBSP and LAP3) [22]; Khatkar et al. reviewed this known QTL significantly associated with MY and FY [10]. In addition to this 420-kb QTL, region 6 harbors PPARGC1A gene (at 44.8 Mbp) as well, and PPARGC1A has already been detected associated with MY [23]. These suggest that those 7 genes are candidate genes for the association of region 6, but we regards that PPARGC1A is more likely to be a candidate gene for the region 6 then the other 6 genes, since the location of PPARGC1A is in the middle of region 6 while the 420-kb region is outside region 6. Region 9 (52.38-65.02 Mbp on BTA 9) significantly associated with 305D-MY and 305D-FY in LA1; this region covered the significant SNPs reported by Daetwyler et al. and Kolbehdari et al., and was overlapping with the region (54.32-77.93 Mbp on BTA 9) detected by Meredith et al. [4, 11, 16]. Region 10b (92.40-97.64 Mbp on BTA10) showed significant association with 305D-MY and 305D-FY in LA2; this region was in the same location of the QTL reviewed by Ogorevc et al. [20] and embedded into the region (90.23-103.83 Mbp on BTA 10) reported by Meredith et al. [16]. Region 14 has been widely reported as a QTL for MY and FY [4-6, 14-16]. In our study, ULGR_SNP_AJ318490_1c and ULGR_SNP_AJ318490_1b were the 2 SNPs showing the strongest associations with these 2 traits for both lactations in region 14. They were the 2 SNPs responsible for the DGAT1 K232A polymorphism, which has already been accepted as a major gene affecting MY and FY [24]. 2 unmapped SNPs ULGN_SNP_AJ318490_2 and ULGR_rs29024688 showed significant associations with 305D-MY and 305D-FY in both lactations. After comparing the sequence of ULGN_SNP_AJ318490_2 against the sequence of DGAT1, Bouwman et al. confirmed this SNP located in DGAT1 and was in high LD (r2 = 0.99) with the DGAT1 K232A SNPs [13]. Bos_taurus_UMD_3.1 showed the location of ULGR_rs29024688 was at 3.30Mbp on BTA14, so this SNP was also in region 14. In addition to the well-known DGAT1 gene, the CYP11B1 gene also located in region 14 and it was recently reported significantly associated MY by Kaupe et al. [25]. In addition to our detected regions, Khatkar et al. reviewed a QTL for MY (87 ± 7.9 cM) on BTA 6 [10]; this region is also shown in Figure 1, but does not exceed the FDR threshold due
12
to the quite stringent threshold in this study. Khatkar et al. [10] and Ogorevc et al. [20] both reviewed a QTL for MY (38 ± 8.2 cM) on BTA 20; even though we did not detect significant SNPs for 305D-MY on BTA 20, we still can observe a peak for 305D-MY in the middle of the BTA 20 especially in LA1, corresponding to that known QTL. For FY, there is a widely studied QTL (42-51 cM) on BTA 3 but we did not find significant association for 305D-FY in this region in our study; also the peak of this region is not sharp in Figure 1. QTL for 305D-PY
Nowadays payment of dairy farmers is mainly based on PY in the Netherlands, so farmers, animal breeders, AI station and Breeding companies are paying increasing attention to improve PY through genetic way. Schopen et al. performed the genome-wide association study for PY based on first lactation test-day samples in the Dutch dairy population and they did not detect significant QTL for PY [12]. Nevertheless many previous studies [5-11, 14-16, 22-32] indeed revealed QTL for PY not only based on 305D records, but also based on test-day samples. These studies used data from multiple lactations, which are more reliable than only using data from single lactation. In addition, the heritability of PY in the Dutch Holstein-Friesian population was 0.25 based on test-day samples [1] and 0.22-0.26 based on the 305-day records. All these suggest that there should be QTL for PY in Dutch Holstein-Friesian cows. In this study, we identified 2 significant (FDR<0.05) regions, 2 significant single SNPs, 4 suggestive (0.05≤FDR≤0.2) regions, 6 suggestive single SNPs (4 of them were unmapped) associated with 305D-PY. Significant (n=6) and suggestive (n=14) SNPs were sll located in known QTL regions for 305D-PY, meaning that we confirmed earlier found QTL for PY, meantime we provided more accurate estimates of those QTL locations. Unlike MY and FY, the largest associations were not focused on BTA 14 but were instead distributed across numerous BTAs, which was in agreement with the GWAS results for PY in Canadian and Ireland population [11, 16]. Significant regions or SNPs: ULGR_AAFC03013583_11745 (at 57.77 Mbp on BTA 1) showed significant association with 305D-PY in LA2. Kolbehdari et al. reported 2 significant SNPs (located at 51.61 and 63.33Mbp on BTA 1) for PY [11] and the location of ULGR_AAFC03013583_11745 was between those 2 previously reported SNPs. Region 3a (25.58-25.59 Mbp on BTA 3) was significant associated with 305D-PY in LA1. On BTA3, Cohen-Zinder et al. suggested that RAP1A (31.74-31.76 Mbp on BTA3) was a candidate gene for PY [26], which was close to region 3a. Thus we also suppose that RAP1A is a candidate gene for PY of region 3a. Region 11 (70.32-71.03 Mbp on BTA 11) was significantly associated with 305D-PY in LA2, reducing the size of the known QTL region (66-72 cm BTA 11) detected by Daetwyler et al. [4]. SNP ULGR_AAFC03085008_61618 (54.85 Mbp on BTA 16) showed significant association with 305D-PY in LA1, which is perhaps the causal region for the known QTL for PY (59-68 cm on BTA 16) detected by Daetwyler et al. [4]. Even though Region 11 and SNP ULGR_AAFC03085008_61618 showed significant associations with 305D-PY through association analysis [4], these 2 regions have never been detected in linkage study. Suggestive regions or SNPs: SNP Hapmap53031-rs29011318 (at 11.34 Mbp on BTA4) showed suggestive association with PY in LA1, which was adjacent to 2 significant SNP for PY (1.83 and 8.95 Mbp on BTA 4) reported by Kolbehdari et al. [11] and Meredith et al. [16] respectively. This region (1.83-11.34 Mbp on BTA 4) has not been reported in linkage study, but only revealed in association studies. Region 5a (69.15 Mbp on BTA 5) showed suggestive association with 305D-PY in LA1, and it was close to the significant SNP for PY (at 64.83 Mbp on BTA 5) that was examined by Jiang et al. [15]. SNP ULGR_AAFC03024058_57479 (at 123Mbp on BTA 5) was in the region where Meredith et al. also found 2 SNPs (at 123.13 and 123.38 Mbp on BTA 5) significantly associated with PY [16], suggesting the region around 123.13 Mbp on BTA was important
13
QTL for PY. SNP BTB-00256297 (at 49.61 Mbp on BTA6) in region 6 was suggestively associated with 305D-PY in LA1, which was in the QTL region (46-70 cM) defined in Norwegian cattle [33]. We regard that region 6 might be the most important region inside this large QTL. Suggestive region 14 (0.05-17.81Mbp on BTA14) and unmapped SNP ULGN_SNP_AJ318490_2 (actually located in DGAT1) had already been reported as the significant QTL for PY in previous studies [4, 15, 16], harboring 2 candidate genes DGAT1 and CYP11B1 [24, 25]. Region 21 (46.52-54.12 Mbp on BTA 21) was suggestive for 305D-PY in LA1, which support the known region for PY (52.39-54.29 Mbp on BTA 21) reported by Kolbehdari et al. [11]. Meanwhile, our results suggest that in addition to the narrow region detected by Kolbehdari et al., critical genes or genetic variants for PY are also possible in the other locations of region 21 [11]. Because the SNP marker density used in our study is much higher than in previous study conducted by Kolbehdari et al. [11], we suppose that our results are more convincing. For those unmapped suggestive SNPs (ULGR_BTA-21870, ULGR_BTA-21871 and ULGR_BTA-79492), Bos_taurus_UMD_3.1 showed the location of them was at 61.17 Mbp on BTA 7, 61.17 Mbp on BTA7 and 61.14 Mbp on BTA 7, respectively; Meredith et al. [16] also detected significant SNPs for PY (63.14-68.92 Mbp on BTA7) close to these 3 suggestive SNPs. These indicate that the region between 61.14 and 68.92 Mbp on BTA harbors candidate gene for PY. In addition to those regions and SNPs discussed above, Khatkar et al. [10] and Ogorevc et al. [20] both mentioned a QTL for PY at 46-70 cM on BTA 20, and association study results from Meredith et al. [16] also supported this QTL. But our present study and many other association studies [4, 11, 12, 14, 15] did not find SNPs associated with 305D-PY around this region. QTL for multiple studied traits
Region 2a, region 9, region 10b, region 14, 3 single SNPs (on BTA 4 and 11) and 2 unmapped SNPs (SNP ULGN_SNP_AJ318490_2 and SNP ULGR_rs29024688) were significantly associated with both 305D-MY and 305D-FY. Region 11 and 1 single SNP on BTA 16 showed significant associations with both 305D-MY and 305D-PY. 1 single SNP on BTA1 was significantly associated with both 305D-PY and 305D-FY. Even though we did not detect any SNP significantly associated with all 3 traits, region 14 showed significant associations with both 305D-MY and 305D-PY, and also was suggestively associated with 305D-PY.This could be explained by pleiotropic effects of these SNPs on multiple milk production traits, which agrees with the high genetic correlations among these 3 studied traits reported in prior studies [2, 16, 34]. This indicates that certain regions of the genome may affect various different milk production traits and this should be taken into consideration when selecting animals for a particular breeding goal. Variance explained by SNPs
Region 14 explained the largest portion of the total additive genetic variation of 305D-MY (14.64% in LA1; 27.64% in LA2) and 305D-FY (20.81% in LA1; 33.50% in LA2) in both lactations. These variations are mainly caused by DGAT1. For 305D-PY, associations were considerably less numerous and less significant compared with 305D-MY and 305D-FY; no region had obviously larger effects than other regions. For 305D-PY, the sum of the total additive genetic explained by the most significant SNP per region, single and unmapped significant SNPs (VarG) was only 13.7% in LA1 and 20.19% in LA2. This finding suggests that 305D-PY is affected by many genes; these genes have small effects and there is no major gene for 305D-PY in this population. Each of the genes explained certain proportion of additive genetic variation, but most of them with undetectable small effect and only minority
14
of them exceeded our strict threshold. This could also explain that Schopen. et al did not find QTL for PY in the same population based on test-day samples [12]. Furthermore, except SNPs in region 14, the VarG and VarP of SNPs in LA2 were generally higher than in LA1 for all these 3 traits. This indicates that the effect of individual SNP in LA2 is higher than in LA1. It is possible that genes for milk synthesis have shifty expression levels in different lactations, and also possible that there are different genes regulating milk synthesis in different lactations. We are not able to interpret this finding only using Breeding and Genetics knowledge; physiological and molecular biology information is also necessary. With respect to animal breeding, this finding points out that different genetic markers should be utilized in different lactations and these differences ought to be considered in animal selection. Further suggestions
In this study, we performed the single SNP GWAS that is a preferable method for large scales genome-wise association analysis. But compared to multiple SNP analysis (haplotype-based methods), there are a number of drawbacks associated with this single SNP GWAS [35]. Especially, single SNP GWAS does not consider the linkage disequilibrium (LD) between SNPs. For example, supposing we calculated the sum of the total additive genetic explained by the most significant SNP per region, single and unmapped significant SNPs (VarG) for 305D-FY in LA2 based on Table 3 and Table 4, this value is greater than 100% and that’s impossible in practice. The reason of this trick is that there are correlations between significant SNPs but we did not take this into account; thus the VarG of one significant SNP also contained part of variation that has been explained by other linked significant SNPs. Therefore, multiple SNP analysis should be considered to overcome the shortages of single SNP GWAS in future. Meanwhile, we performed GWAS for each of these three 305-day milk production traits separately, but these three traits are correlated and share common genetic factors as we found. To take correlations into account, the multiple traits analysis should be a possible way, since multivariate analyses have been reported as a screening tool when multiple phenotypes are available, without extra costs of statistical power and false-positive rate [36]. We performed our association analysis for LA1 and LA2 separately, but analyzing both lactations simultaneously should also be considered in further research. CONCLUSIONS 232 SNPs in LA1 and 125 SNPs in LA2 on 19 BTAs were detected significantly associated with 305-day milk production traits. The majority of these significant associations (231/232 in LA1 and 125/125 in LA2) for 305D-MY, 305D-PY and 305D-FY overlapped known QTL regions for MY, PY and FY respectively, which can help to further refine large QTL regions and discover underlying causal mutation for these traits. 1 SNP on BTA 2 (at 12.80 Mbp) that does not appear to be located within a known QTL region for MY, was identified as being significantly associated with 305D-MY, which may be a novel and unique QTL in the Dutch Holstein-Friesian population. All these QTL regions detected in our study can build the foundation towards identifying candidate genes and genetic variants underlying these 305-day milk production traits.
15
REFERENCES 1. Schopen, G. C. B., Heck, J. M. L., Bovenhuis, H., Visker, M. H. P. W., Van Valenberg, H. J. F., &
Van Arendonk, J. A. M. (2009). Genetic parameters for major milk proteins in Dutch Holstein-Friesians. Journal of Dairy Science, 92(3), 1182-1191.
2. Kadarmideen, H. N., Thompson, R., Coffey, M. P., & Kossaibati, M. A. (2003). Genetic parameters and evaluations from single- and multiple-trait analysis of dairy cow fertility and milk production. Livestock Production Science, 81(2-3), 183-195.
3. Bastiaansen, J. W. M., Wijga, S., Parland, S. M., Wall, E., Strandberg, E., Haas, Y. D., Lunden, A., & Bovenhuis, H.. Genome Wide Associations of SNP markers with deviations in Fat to Protein Ratio and 305 day Production of Milk, Fat, Protein and Lactose in primiparous Holstein Cows. Personal Communication.
4. Daetwyler, H. D., Schenkel, F. S., Sargolzaei, M., & Robinson, J. A. B. (2008). A genome scan to detect quantitative trait loci for economically important traits in holstein cattle using two methods and a dense single nucleotide polymorphism map. Journal of Dairy Science, 91(8), 3225-3236.
5. Ashwell, M. S., Heyen, D. W., Sonstegard, T. S., Van Tassell, C. P., Da, Y., VanRaden, P. M., . . . Lewin, H. A. (2004). Detection of quantitative trait loci affecting milk production, health, and reproductive traits in holstein cattle. Journal of Dairy Science, 87(2), 468-475.
6. Kučerová, J., Lund, M. S., Sørensen, P., Sahana, G., Guldbrandtsen, B., Nielsen, V. H., . . . Bendixen, C. (2006). Multitrait quantitative trait loci mapping for milk production traits in danish holstein cattle. Journal of Dairy Science, 89(6), 2245-2256.
7. Olsen, H. G., Gomez-Raya, L., Våge, D. I., Olsaker, I., Klungland, H., Svendsen, M., . . . Lien, S. (2002). A genome scan for quantitative trait loci affecting milk production in norwegian dairy cattle. Journal of Dairy Science, 85(11), 3124-3130.
8. Bennewitz, J., Reinsch, N., Grohs, C., Levéziel, H., Malafosse, A., Thomsen, H., . . . Kalm, E. (2003). Combined analysis of data from two granddaughter designs: A simple strategy for QTL confirmation and increasing experimental power in dairy cattle. Genetics Selection Evolution, 35(3), 319-338.
9. Plante, Y., Gibson, J. P., Nadesalingam, J., Mehrabani-Yeganeh, H., Lefebvre, S., Vandervoort, G., & Jansen, G. B. (2001). Detection of quantitative trait loci affecting milk production traits on 10 chromosomes in holstein cattle. Journal of Dairy Science, 84(6), 1516-1524.
10. Khatkar, M. S., Thomson, P. C., Tammen, I., & Raadsma, H. W. (2004). Quantitative trait loci mapping in dairy cattle: Review and meta-analysis. Genetics Selection Evolution,36(2), 163-190.
11. Kolbehdari, D., Wang, Z., Grant, J. R., Murdoch, B., Prasad, A., Xiu, Z., . . . Moore, S. S. (2009). A whole genome scan to map QTL for milk production traits and somatic cell score in canadian holstein bulls. Journal of Animal Breeding and Genetics, 126(3), 216-227.
12. Schopen, G. C. B., Visker, M. H. P. W., Koks, P. D., Mullaart, E., van Arendonk, J. A. M., & Bovenhuis, H. (2011). Whole-genome association study for milk protein composition in dairy cattle. Journal of Dairy Science, 94(6), 3148-3158.
13. Bouwman, A. C., Bovenhuis, H., Visker, M. H. P. W., & van Arendonk, J. A. M. (2011). Genome-wide association of milk fatty acids in dutch dairy cattle. BMC Genetics.
14. Mai, M. D., Sahana, G., Christiansen, F. B., & Guldbrandtsen, B. (2010). A genome-wide association study for milk production traits in danish jersey cattle using a 50K single nucleotide polymorphism chip. Journal of Animal Science, 88(11), 3522-3528.
15. Jiang, L., Liu, J., Sun, D., Ma, P., Ding, X., Yu, Y., & Zhang, Q. (2010). Genome wide association studies for milk production traits in chinese holstein population. PLoS ONE, 5(10)
16
16. Meredith, B. K., Kearney, F. J., Finlay, E. K., Bradley, D. G., Fahey, A. G., Berry, D.P., & Lynn, D. J. (2012). Genome-wide associations for milk production and somatic cell score in Holstein-Friesian cattle in Ireland. BMC Genetics.
17. Liu, Y., Qin, X., Song, X. -. H., Jiang, H., Shen, Y., Durbin, K. J., . . . Gibbs, R. A. (2009). Bos taurus genome assembly. BMC Genomics.
18. Gilmour, A. R., Gogel, B. J., Cullis, B. R., Welham, S. J., & Thompson, R. (2002). ASReml User Guide. Release 1.0. VSN International Ltd., Hemel Hempstead, UK.
19. Storey, J.D., & Tibshirani, R.: Statistical significance for genomewide studies. PNAS 2003, 100:9440-9445.
20. Ogorevc, J., Kunej, T., Razpet, A., & Dovc, P. (2009). Database of cattle candidate genes and genetic markers for milk production and mastitis. Animal Genetics, 40(6), 832-851.
21. Yu, J., G. Pressoir, W. H. Briggs, I. V. Bi, M. Yamasaki, J. F. Doeb- ley, M. D. McMullen, B. S. Gaut, D. M. Nielsen, J. B. Holland, S. Kresovich, & E. S. Buckler. (2006). A unified mixed-model method for association mapping that accounts for multiple levels of relat- edness. Nat. Genet. 38, 203–208.
22. Olsen, H. G., Lien, S., Gautier, M., Nilsen, H., Roseth, A., Berg, P. R., . . . Meuwissen, T. H. E. (2005). Mapping of a milk production quantitative trait locus to a 420-kb region on bovine chromosome 6. Genetics, 169(1), 275-283.
23. Khatib, H., Zaitoun, I., Wiebelhaus-Finger, J., Chang, Y. M., & Rosa, G. J. M. (2007). The association of bovine PPARGC1A and OPN genes with milk composition in two independent holstein cattle populations. Journal of Dairy Science, 90(6), 2966-2970.
24. Grisart, B., Coppieters, W., Farnir, F., Karim, L., Ford, C., Berzi, P., . . . Snell, R. (2002). Positional candidate cloning of a QTL in dairy cattle: Identification of a missense mutation in the bovine DGAT1 gene with major effect on milk yield and composition. Genome Research, 12(2), 222-231.
25. Kaupe, B., Brandt, H., Prinzenberg, E. -., & Erhardt, G. (2007). Joint analysis of the influence of CYP11B1 and DGAT1 genetic variation on milk production, somatic cell score, conformation, reproduction, and productive lifespan in german holstein cattle. Journal of Animal Science, 85(1), 11-21.
26. Cohen-Zinder, M., Donthu, R., Larkin, D. M., Kumar, C. G., Rodriguez-Zas, S. L., Andropolis, K. E., . . . Lewin, H. A. (2011). Multisite haplotype on cattle chromosome 3 is associated with quantitative trait locus effects on lactation traits. Physiological Genomics, 43(21), 1185-1197.
27. Cole, J. B., Wiggans, G. R., Ma, L., Sonstegard, T. S., Jr, T. J. L. . . . Da, Y. (2011). Genome-wide association analysis of thirty one production, health, reproduction and body conformation traits in contemporary U.S. Holstein cows. BMC Genomics
28. Sheehy, P. A., Riley, L. G., Raadsma, H. W., Williamson, P., & Wynn, P. C. (2009). A functional genomics approach to evaluate candidate genes located in a QTL interval for milk production traits on BTA6. Animal Genetics, 40(4), 492-498.
29. Gautier, M., Barcelona, R. R., Fritz, S., Grohs, C., Druet, T., Boichard, D., . . . Meuwissen, T. H. E. (2006). Fine mapping and physical characterization of two linked quantitative trait loci affecting milk fat yield in dairy cattle on BTA26. Genetics, 172(1), 425-436.
30. Jiang, Z., De, S., Garcia, M.D., Griffin, K.B., Wu, X.-L., Xiao, Q., Michal, J.J., Sharma, B.S. & Jansen, G.B. (2005). An independent confirmation of a quantitative trait locus for milk yield and composition traits on bovine chromosome 26. Journal of Animal Breeding and Genetics, 122, 281–284.
31. Weikard, R., Kühn, C., Goldammer, T., Freyer, G., & Schwerin, M. (2005). The bovine PPARGC1A gene: Molecular characterization and association of an SNP with variation of milk fat synthesis. Physiological Genomics, 21, 1-13.
17
32. Fisher, P. J. & Spelman, R. J. (2004), Verification of selective DNA pooling methodology through identification and estimation of the DGAT1 effect. Animal Genetics, 35, 201–205.
33. Olsen, H. G., Gomez-Raya, L., Våge, D. I., Olsaker, I., Klungland, H., Svendsen, M., . . . Lien, S. (2002). A genome scan for quantitative trait loci affecting milk production in norwegian dairy cattle. Journal of Dairy Science, 85(11), 3124-3130.
34. van Binsbergen, R., Veerkamp, R. F., & Calus, M. P. L. (2012). Makeup of the genetic correlation between milk production traits using genome-wide single nucleotide polymorphism information. Journal of Dairy Science, 95(4), 2132-2143.
35. Schopen, G. C. B. (2010) Wageningen University Doctoral Dissertation: Genetic analysis of protein composition of bovine milk.
36. Liu, J., Pei, Y., Papasian, C. J., & Deng, H. -. (2009). Bivariate association analyses for the mixture of continuous and binary traits with the use of extended generalized estimating equations. Genetic Epidemiology, 33(3), 217-227.
Related Documents