Day-length is central to maintaining consistent seasonal diversity in marine bacterioplankton Jack A. Gilbert 1 , Paul Somerfield 1 , Ben Temperton 1 , Sue Huse 3 , Ian Joint 1 , Dawn Field 2 1 Plymouth Marine Laboratory, Prospect Place, Plymouth, PL1 3DH, UK 2 NERC Centre for Ecology and Hydrology, CEH Oxford, Mansfield Road, Oxford, OX1 3SR, UK 3 Josephine Bay Paul Centre for Comparative Molecular Biology and Evolution, Marine Biological Laboratory, Woods Hole, Massachusetts, USA Marine bacterial diversity is vast, but seasonal variation in diversity is poorly understood. Here we present the longest bacterial diversity time series consisting of monthly (72) samples from the western English Channel over a 6 year period (2003-2008) using 747,494 16SrDNA-V6 amplicon-pyrosequences. Although there were characteristic cycles for each phylum, the overall community cycle was remarkably stable year after year. The majority of taxa were not abundant, although on occasion these rare bacteria could dominate the assemblage. Bacterial diversity peaked at the winter solstice and showed remarkable synchronicity with day-length, which had the best explanatory power 1 Nature Precedings : hdl:10101/npre.2010.4406.1 : Posted 1 May 2010

Welcome message from author
This document is posted to help you gain knowledge. Please leave a comment to let me know what you think about it! Share it to your friends and learn new things together.
Transcript

Day-length is central to maintaining consistent seasonal diversity in marine
bacterioplankton
Jack A. Gilbert1, Paul Somerfield1, Ben Temperton1, Sue Huse3, Ian Joint1, Dawn Field2
1Plymouth Marine Laboratory, Prospect Place, Plymouth, PL1 3DH, UK
2NERC Centre for Ecology and Hydrology, CEH Oxford, Mansfield Road, Oxford, OX1 3SR,
UK
3Josephine Bay Paul Centre for Comparative Molecular Biology and Evolution, Marine
Biological Laboratory, Woods Hole, Massachusetts, USA
Marine bacterial diversity is vast, but seasonal variation in diversity is poorly
understood. Here we present the longest bacterial diversity time series consisting of
monthly (72) samples from the western English Channel over a 6 year period (2003-2008)
using 747,494 16SrDNA-V6 amplicon-pyrosequences. Although there were characteristic
cycles for each phylum, the overall community cycle was remarkably stable year after
year. The majority of taxa were not abundant, although on occasion these rare bacteria
could dominate the assemblage. Bacterial diversity peaked at the winter solstice and
showed remarkable synchronicity with day-length, which had the best explanatory power
1
Nat
ure
Pre
cedi
ngs
: hdl
:101
01/n
pre.
2010
.440
6.1
: Pos
ted
1 M
ay 2
010

compared to a combination of other variables (including temperature and nutrient
concentrations). Day-length has not previously been recognised as a major force in
structuring microbial communities.
Environmental factors driving the structure and function of microbial community are
still poorly understood. Previous efforts to unravel the factors that exert the most significant
influence have focused on showing the relative importance of temperature and nutrient
concentration in structuring communities (Gilbert et al., 2009; Fuhrman, 2009; Fuhrman et al.,
2006; Morris et al., 2005; Kirchman et al., 1995; Cullen, 1991). This is because temperature
controls enzyme kinetics (Nedwell and Rutter, 1994) and nutrients drive niche structure
through resource partitioning (Church, 2009). Likewise, the global biogeographic distribution
of bacteria has recently been shown to follow a latitudinal gradient (primarily driven by
temperature) as for other taxa (Fuhrman et al., 2008).
To date, however, despite growing evidence that many phyla of bacteria respond to
sunlight (Moran and Zepp, 2000; Béjà et al., 2000; Mopper and Kieber, 2002; Swalbach et al.,
2005; Gómez-Consarnau et al., 2007), the role of day-length as a driver of microbial diversity
has not been directly considered. Both temperature and nutrient availability lag behind
availability of light energy, therefore our hypothesis is that day-length might be a primary
factor determining the seasonality of marine bacterial communities. While many areas of the
2
Nat
ure
Pre
cedi
ngs
: hdl
:101
01/n
pre.
2010
.440
6.1
: Pos
ted
1 M
ay 2
010

earth have equal day lengths year-round (around the Equator), more northern or southern
latitudes have significant differences between day length between the winter (Dec 20 or 21)
and summer (June 20 or 21) solstice, which may drive patterns in microbial diversity.
The Western English Channel provides an ideal model system in which to test for an
effect of day-length on bacterial communities. The L4 long-term monitoring site is a coastal
water observatory with more than 100 years of data (Southward et al., 2005; Smyth et al.,
2009) which exhibits extremely short residence times (>2 months) and hence is being near
constantly flushed (Siddorn et al., 2003) which could have an impact on the stability of
microbial communities. At latitude of 50.258N (4.2178W), L4 has a winter solstice day length
of almost eight hours and a summer solstice day-length of just over 16 hours, giving a
maximum difference between winter and summer seasons of eight hours.
We tested whether this difference in day-length explained patterns in the diversity of
the L4 bacterial community by generating an additional five years of molecular data to
complement our 2007 study of the L4 site (Gilbert et al, 2009). We again determined bacterial
diversity using 16S rDNA V6 tag pyrosequencing (Sogin et al., 2006). In addition to day-
length, we examined the role of a broad range of biotic and abiotic parameters, including the
concentrations of ammonia, nitrate + nitrite, phosphate, silicate, total organic carbon and total
organic nitrogen, salinity, chlorophyll, and temperature in determining bacterial diversity. We
also explored the difference in temporal abundance between dominant and rare taxa. Here we
report the result of this analysis of 72 time points taken over six years of sampling at the L4
3
Nat
ure
Pre
cedi
ngs
: hdl
:101
01/n
pre.
2010
.440
6.1
: Pos
ted
1 M
ay 2
010

site (2003-2009; Table S1) and show that day-length is a primary driver of the structure of this
marine community and additionally rare bacteria can exhibit irregular blooms of considerable
abundance.
Diversity is high, peaks at the winter solstice every year and samples are grouped by season.
Overall, 747,496 16S rDNA V6 sequences were identified, including those previously
published for the year 2007 (Gilbert et al, 2009). Combined these tags comprised 65,059
unique operational taxonomic units (OTUs) for the complete time-series study. However, due
to concerns regarding overestimation of diversity using pyrosequencing (Quince et al., 2009),
we further clustering these sequences using a 2% single-linkage pre-clustering methodology
followed by an average-linkage clustering based on pair-wise alignments (Huse et al., 2010),
resulting in 8794 OTUs. Sequences in the full data set ranged from 4101 to 32,826, with an
average of 10,381 per time point. It was therefore necessary to correct for sample-size
dependence and allow direct comparison of samples of equal size by randomly re-sampling
sequences at each time point to generate subsets of sequences equivalent to the smallest
number of sequences for anyone time point (4101) (Gilbert et al., 2009). This resulted in a
final data set of 4204 taxa-clusters (295,272 sequences), 2554 of which were singletons (60%).
The high proportion of singletons that remain following this reduction process is indicative that
a large proportion of the community remains under-sampled, indicating considerable diversity.
This is confirmed by rarefaction curves that do not approach plateau for any single sample or
4
Nat
ure
Pre
cedi
ngs
: hdl
:101
01/n
pre.
2010
.440
6.1
: Pos
ted
1 M
ay 2
010

for all samples when pooled (Fig S1). Only 12 (0.2 %) of these re-sampled OTU clusters were
found at all 72 time points, but these lineages comprised ~45 % of all sequences. The most
abundant organism, as seen for the 2007 data at the same station (Gilbert et al, 2009), was a
strain of the SAR11 clade bacterium Pelagibacter ubique, which comprised 17.4 % of the
entire dataset and was the most abundant organism annually.
Richness (S, or number of species) is quite constant across the time-series within a
defined range and showing a distinct cyclical patterns of peaks in winter and troughs in
summer (Fig 1). The mean S per time point is 286, with an average minimum of 194 around
the summer solstice (June) and maximum of 352 around the winter solstice (December). This
is further confirmed by permutation-based analysis of variance (of S) for all taxa, and also a
range of phyla (Table 1). This shows that S is more similar at similar times of year across the
time series, and that differences between seasons and among years are both highly significant,
but seasonal differences tend to be greater than interannual ones (greater pseudo-F values
although fewer d.f.). This lack of significant interaction terms suggests that the seasonal cycle
is consistent across years.
Nonparametric ordination by multidimensional scaling (NMDS) of resemblances
among samples (Fig. 2) clearly shows the seasonal nature of variation in the communities, with
a clear separation of winter and summer samples and samples from spring and autumn
occupying intermediate, but different, positions.
5
Nat
ure
Pre
cedi
ngs
: hdl
:101
01/n
pre.
2010
.440
6.1
: Pos
ted
1 M
ay 2
010

The dominant microbiota exhibit seasonally structured abundance. Overall the trends in
microbial diversity were driven by changes in the community composition of the dominant
community. The repeatable seasonality of the two most dominant taxa in recorded in this
study, SAR11 and Roseobacteriales, are indicative of this (Fig 3). Although the abundance of
these groups still demonstrated variability, both had distinct seasonal trends, with SAR11 (Fig
3A) showing greater abundance in the winter, with a smaller peak in abundance during
June/July. Roseobacteriales however demonstrated a much more seasonally separated cycle
with first a spring, then a larger summer peak in abundance, followed by a considerably lower
abundance during the winter of each year (Fig 3B). During 2006 and 2007 SAR11 appeared to
show a reduction in the seasonal variability, resulting in a visbale decrease in annual
abundance; this interannual variability will need to be explored with the continuation of the
sampling in subsequent years to determine the potential causative factors.
Rare microbiota can exhibit irregular blooms of considerable abundance. Upon investigation
of notable outlying data points in the NMDS plot (Fig 2) we discovered that the distant
relationship of these samples was due to blooms of otherwise extremely rare taxa. In figure 2,
point A is dominated by a bloom of the gammaproteobacterial genus Vibrio (Fig 4A), which
constituted ~54% of the community during August 2003, yet for the rest of the time series they
6
Nat
ure
Pre
cedi
ngs
: hdl
:101
01/n
pre.
2010
.440
6.1
: Pos
ted
1 M
ay 2
010

were found at extremely low abundance (0 – 2% of monthly abundance). Interestingly, the
presence of these bacteria is correlated with a spike in the abundance (to 1.2 % of total
eukaryotic plankton abundance from a background of 0.002 – 0.2 % of total) of the diatom,
Chaetoceros compressus. This single instance of increased abundance of a specific bacterial
genera and a diatom species could support the seed-bank hypothesis, whereby environmental
conditions facilitating the bloom of these taxa. Environmental conditions where relatively
unusual on this date, with the highest total organic nitrogen and carbon concentrations and
second highest chlorophyll A concentration measured between 2003 and 2008 (Table S1),
which is indicative of a C. compressus diatom bloom which may have supported or indeed of
been supported by the Vibrio. Also a verrucomicrobium Opitutus showed extraordinary
abundance in spring 2004 and summer 2006 (Fig 4B), but was virtually absent at all other time
points. However, for these blooms it was not possible to identify correlating eukaryotic
plankton abundance or environmental conditions, suggesting that we did not measure the
variable which caused this organism to bloom. It is extremely unlikely that these increases in
abundance would occur if these taxa were artefactual, hence removal of sequences from
analyses because they are observed singletons is likely not an accurate measure of their
validity. Blooms of specific microbial species could result in potential human and
environmental health risks, especially for the Vibrio bloom. Understanding the environmental
factors which promote these irregular blooms is therefore a priority for health regulation
7
Nat
ure
Pre
cedi
ngs
: hdl
:101
01/n
pre.
2010
.440
6.1
: Pos
ted
1 M
ay 2
010

agencies. In fact elucidating this relationship could help to improve predictive models for the
occurrence of Harmful Algal Blooms (HABs). This study is an excellent example of how time-
series can be used to validate singletons as real organisms, and is indicative of the importance
of exploring the whole planktonic community to understand ecosystem dynamics.
Observed winter peaks in diversity and seasonality are driven by day-length. Distance-based
linear modelling (Table 2) shows that for all groups of OTUs there is a strong seasonal cycle
in community structure centred on day-length (a cos derived term peaking at the winter solstice
– DX1). Adding a second seasonal term centred on the spring equinox (sin derived term –
DX2) improves the models significantly (δAIC> -2). The further addition of a linear time
trend (D) marginally improves the fit of the resulting models for most groups except
Cyanobacteria.
Of all the explanatory variables available the only one that shows a significant trend
throughout the time-series is soluble reactive phosphate (SRP) which has tended to decrease
slightly (Table S3). Detrending SRP and regressing each explanatory variable on the solstice
term (DX1) and the equinox term (DX2) (Table S4) shows that for the majority of them the
major component of variation is explained by the cos-derived solstice term (i.e. day-length),
and they peak close to one or other of the solstices. Variables that were exclusively tracking
day-length (sin-derived equinox term was not significant) were photo-active radiation (PAR),
8
Nat
ure
Pre
cedi
ngs
: hdl
:101
01/n
pre.
2010
.440
6.1
: Pos
ted
1 M
ay 2
010
mixed-layer depth (MLD), chlorophyll concentration, silicate concentration, and total organic
carbon and nitrogen concentration (TOC and TON). Nitrite and nitrate concentration (NOx),
and soluble reactive phosphate concentration (SRP), have annual cycles which do not follow
day-length, but day-length is still the main component describing their annual cycle. The
monthly North Atlantic Oscillation (NAO) peaks nearly half-way between the solstice and the
equinox, and temperature peaks closest to the equinox. There is no evidence for a trend or
seasonal cycle in salinity. A PCA of these variables (Fig. S2A) shows the seasonal cyclicity in
environmental variables at L4.
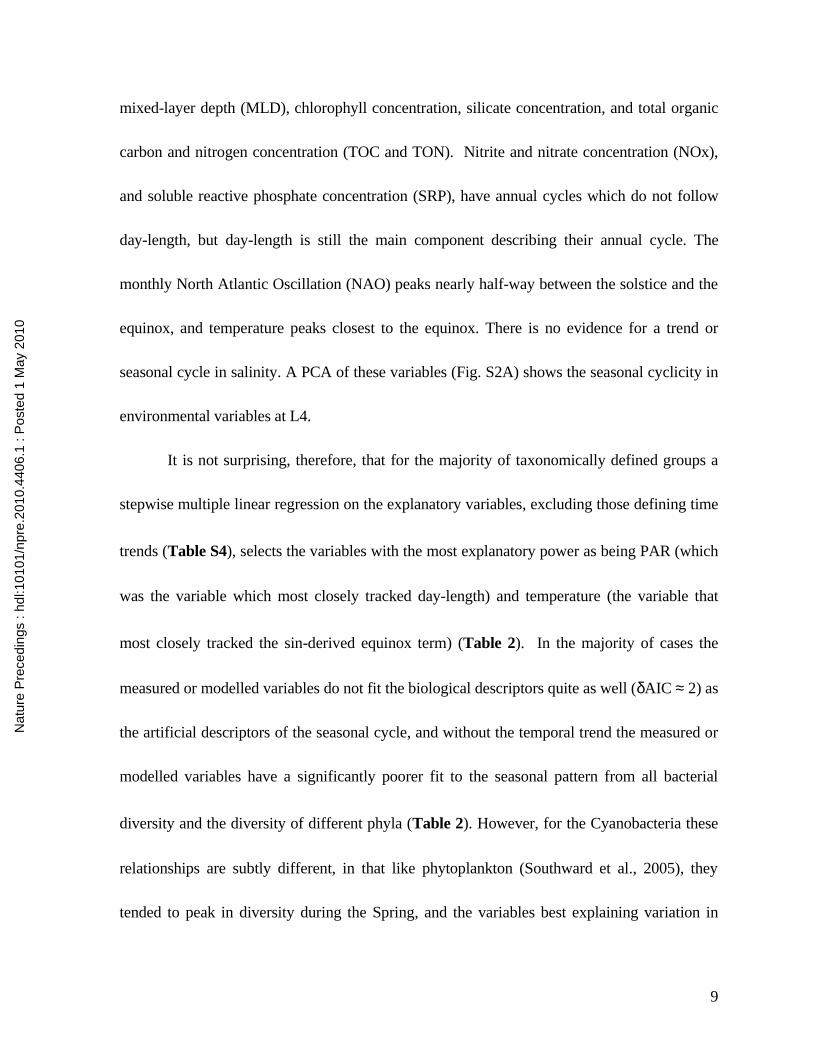
It is not surprising, therefore, that for the majority of taxonomically defined groups a
stepwise multiple linear regression on the explanatory variables, excluding those defining time
trends (Table S4), selects the variables with the most explanatory power as being PAR (which
was the variable which most closely tracked day-length) and temperature (the variable that
most closely tracked the sin-derived equinox term) (Table 2). In the majority of cases the
measured or modelled variables do not fit the biological descriptors quite as well (δAIC ≈ 2) as
the artificial descriptors of the seasonal cycle, and without the temporal trend the measured or
modelled variables have a significantly poorer fit to the seasonal pattern from all bacterial
diversity and the diversity of different phyla (Table 2). However, for the Cyanobacteria these
relationships are subtly different, in that like phytoplankton (Southward et al., 2005), they
tended to peak in diversity during the Spring, and the variables best explaining variation in
9
Nat
ure
Pre
cedi
ngs
: hdl
:101
01/n
pre.
2010
.440
6.1
: Pos
ted
1 M
ay 2
010

cyanobacterial community structure are temperature, then PAR, and then NOx (Table 2). As
this group are photosynthetic, they tend to respond to the spring conditions, relatively high
nutrients (compared to summer) and increasing light availability (compared to winter), and
bloom in abundance; hence this trend is entirely expected.
The fact that all relationships in the multivariate space are all highly significant (Table
2) it can be difficult to determine their relative importance. The univariate measures selected
to describe changes in the assemblage, richness (S) and Simpsons index (1- ’ ) , both have
significant time trends. For S, this is quadratic in nature (Table 2), essentially describing an
increase in numbers during the earlier years (2003 and 2004) which then slows and stops (Fig
1); while 1- ’ shows a weak but significant increasing trend throughout the series.
Regressing both measures (following transformation) on the explanatory variables (Table S4)
shows that the annual cycle in S (Fig 1) closely tracks the winter solstice. The combination of
the solstice term and serial day describes 66.3 % of the variance in numbers of OTUs. There is
a reasonable match between variation in S and environmental conditions (Fig. S2B), with the
best fit being a combination of PAR, nitrate and nitrite and salinity, and this describes nearly as
much of the variance (63.6 %) as the solstice term and serial day combined. This model,
however, was a significantly less good fit to the data than the simple solstice term curve with
an associated serial day trend. Detrending S, as expected, leaves a variable which is closely
fitted by the solstice term alone. Again the closest fit among the explanatory variables is a
10
Nat
ure
Pre
cedi
ngs
: hdl
:101
01/n
pre.
2010
.440
6.1
: Pos
ted
1 M
ay 2
010
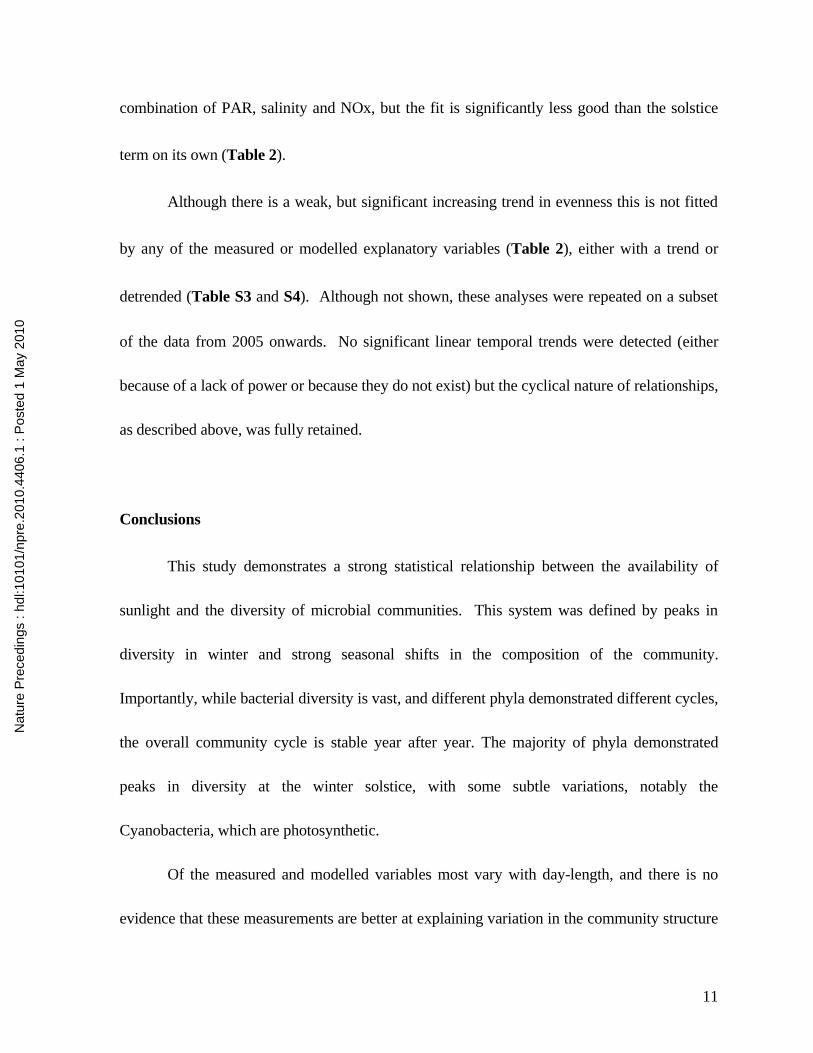
combination of PAR, salinity and NOx, but the fit is significantly less good than the solstice
term on its own (Table 2).
Although there is a weak, but significant increasing trend in evenness this is not fitted
by any of the measured or modelled explanatory variables (Table 2), either with a trend or
detrended (Table S3 and S4). Although not shown, these analyses were repeated on a subset
of the data from 2005 onwards. No significant linear temporal trends were detected (either
because of a lack of power or because they do not exist) but the cyclical nature of relationships,
as described above, was fully retained.
Conclusions
This study demonstrates a strong statistical relationship between the availability of
sunlight and the diversity of microbial communities. This system was defined by peaks in
diversity in winter and strong seasonal shifts in the composition of the community.
Importantly, while bacterial diversity is vast, and different phyla demonstrated different cycles,
the overall community cycle is stable year after year. The majority of phyla demonstrated
peaks in diversity at the winter solstice, with some subtle variations, notably the
Cyanobacteria, which are photosynthetic.
Of the measured and modelled variables most vary with day-length, and there is no
evidence that these measurements are better at explaining variation in the community structure
11
Nat
ure
Pre
cedi
ngs
: hdl
:101
01/n
pre.
2010
.440
6.1
: Pos
ted
1 M
ay 2
010
than a simple model based on a seasonal cycle tracking day-length. Reasons for this are
probably two-fold. Firstly, bacteria may track this seasonal cycle based on day-length because
other variables such as temperature and nutrient concentrations do. However, the community
is unlikely to be responding to any of these other variables directly; other options that were not
measured during this study are dissolved organic carbon (DOC) concentrations and photo-
chemical reactions [Moran and Zepp, 1997]. In the winter, when DOC is lowest many
different types of bacteria compete to obtain it, and in the summer, fewer species do well and
so diversity decreases. A recent study on the impact of DOC on communities (Mou et al. 2008)
demonstrated the potential importance of this on the community dynamic. Secondly, the
observed bacterial taxa present on any particular day are the result of the combined responses
of many taxa to events over the preceding days or weeks (fast division rates) and are therefore
integrating the environmental ‘climate’, the net effect of many variables changing seasonally,
rather than the environmental ‘weather’, the effects of individual variables operating on the
exact day of measurement.
In conclusion, this is the first reported evidence that it is day-length that has the most
significant impact on microbial diversity in a well-studied marine habitat. We speculate that
this may constitute a general “rule” (e.g. Species-Area: Horner-Devine et al., 2004; Bell et al.,
2005; Latitudinal: Fuhrman et al., 2008) that should be tested further using uniform studies of
microbial communities across a different latitudes and times of year. While there is some year
on year variation, which is occasionally driven by blooms of rare taxa, it is the seasonal cycle
12
Nat
ure
Pre
cedi
ngs
: hdl
:101
01/n
pre.
2010
.440
6.1
: Pos
ted
1 M
ay 2
010

that dominates; so that for all their astonishing variability bacteria seem to show an
extraordinarily consistent seasonal cycle.
Acknowledgements
We would like to thank Dr K R Clark for providing extensive expertise in statistical modelling,
and Margaret Hughes for providing the pyrosequencing technical support. All sequencing data
and environmental metadata can be found in the INSDC SRA under ERP000118
(http://www.ebi.ac.uk/ena/data/view/ERP000118).
References
Bell T, Ager D, Song JI, Newman JA, Thompson IP, Lilley AK, van der Gast CJ. 2005.
Larger islands house more bacterial taxa. Science 308 (5730)
Horner-Devine MC, Lage M, Hughes JB, Bohannan BJ. 2004. A taxa-area relationship for
bacteria. Nature. 432(7018):750-3.
Moran, M.A. and Zepp, R.G., 1997. Role of photoreactions in the formation of biologically
labile compounds from dissolved organic matter. Limnology and Oceanography, 42(6): 1307-
1316.
13
Nat
ure
Pre
cedi
ngs
: hdl
:101
01/n
pre.
2010
.440
6.1
: Pos
ted
1 M
ay 2
010

Gilbert JA, Field D, Swift P, Newbold L, Oliver A, Smyth T, Somerfield P, Huse S, Joint I.
2009. Seasonal succession of microbial communities in the Western English Channel using
16S rDNA-tag pyrosequencing. Env. Microb. 11(12), 3132–3139
Fuhrman, J. A. (2009). Microbial community structure and its functional implications.
Nature. Vol. 459, pp. 193-199.
Fuhrman et al. 2006. Annually reoccuring bacterial communities are predictable from
ocean conditions. PNAS. 103:13104-13109.
Morris RM, Vergin KL, Cho JC, Rappe MS, Carlson CA, Giovannoni SJ. 2005. Temporal
and spatial response of bacterioplankton lineages to annual convective overturn at the Bemuda
Atlantic Time-series Study site. Limnol. Oceanogr. 50: 1687-1696.
Kirchman DL, Rich, JH, Barber RT. 1995. Biomass and biomass production of
getertrophic bacteria along 140°W in the Euitorial Pacific: Effect of temperature on the
microbial loop. Deep-Sea Res. II. 42:603-619.
Cullen JJ. 1991. hypotheses to explain high-nutrient conditions in the open sea. Limnol.
Oceanogr. 36: 1578-1599.
Nedwell DB and Rutter M. 1994. Influence of temperature on growth rate and competition
between two psychrotolerant Antarctic Bacteria – low temperature diminishes affinity for
substrate uptake. Appl. Environ. Microbiol. 60:1984-1992.
14
Nat
ure
Pre
cedi
ngs
: hdl
:101
01/n
pre.
2010
.440
6.1
: Pos
ted
1 M
ay 2
010

Church MJ. 2009. Resource Control of Bacterial dynamics in the sea. In: Microbial
Ecology of the Oceans, 2nd edition. Ed. David L. Kirchman. Wiley.
Fuhrman JA, Steele JA, Hewson I, Schwalbach MS, Brown MV, Green JL, Brown JH.
2008. A latitudinal diversity gradient in planmktonic marine bacteria. PNAS. 105 (22) 7774-
7778.
Moran MA and Zepp RG. 2000. UV radiation effects on microbes and microbial processes.
IN D. L. Kirchmann (ed.) Microbial ecology of the Oceans. 1st Edition. Wiley-Liss, pp 201-
227.
Beja O, Aravind L, Koonin EV, Suzuki MT, Hadd A, Nguyen LP, Jovanovich S, Gates
CM, Feldman RA, Spudich JL, Spudich EN, DeLong EF. 2000. Bacterial RhodopsinL
Evidence for a new type of phototrophy in the sea. Science 289: 1902-1906.
Mopper K and Keiber DJ. 2002. Photochemistry and the cycling of carbon, sulphur,
nitrogen and phosphorus. In D.A Hansell and C.A. Carlson (eds.) Biogeochemistry of Marine
Dissolved Organic Matter. Academic Press. Pp 455-508.
Schwalbach MS, Brown M, Fuhrman JA (2005) Impact of light on marine
bacterioplankton community structure. Aquat Microb Ecol 39:235–245
Gomez-Consarnau L, Gonzalez JM, Coll0Llado M, Gourdon P, Pascher T, Neutze R,
Pedros-Alio C, Pinhassi J. 2007. Light stimulates growth of proteorhodopsin-containing
marine Flavobacteria. Nature 445: 210-213.
15
Nat
ure
Pre
cedi
ngs
: hdl
:101
01/n
pre.
2010
.440
6.1
: Pos
ted
1 M
ay 2
010

Siddorn JR, Allen JI and Uncles RJ. 2003. Heat, salt and tracer transport in the Plymouth
Sound coastal region: a 3-D modelling study. J. Mar. Biol. Ass. U.K. (2003), 83: 673-682
Smyth TJ, Fishwick JR, Al-Moosawi L, Cummings DG, Harris C, Kitidis V, Rees A,
Martinez-Vincente V, Woodward EMS. 2009. A broad spatio-temporal view of the western
English Channel observatory. JOURNAL OF PLANKTON RESEARCH; Vol 0: PAGES 1–17
Sogin, M.L., Morrison, H.G., Huber, J.A., Mark Welch, D., Huse, S.M. et al. (2006)
Microbial diversity in the deep sea and the underexplored "rare biosphere". Proc Natl Acad Sci
USA 103: 12115-20.
Southward, A.J., Langmead, O., Hardman-Mountford, N.J., Aiken, J., Boalch, G.T. et al.
(2005) Long-term oceanographic and ecological research in the Western English Channel. Adv
Mar Biol. 47: 1-105.
16
Nat
ure
Pre
cedi
ngs
: hdl
:101
01/n
pre.
2010
.440
6.1
: Pos
ted
1 M
ay 2
010

Table 1 Permutation-based analysis of variance tests of differences among seasons and years
for different taxonomic groupings, using Bray-Curtis similarities calculated from Log(N+1)-transformed abundances.
Source df SS MS Pseudo-F pAll Season 3 25984 8661.2 6.84 0.001
Year 5 13742 2748.4 2.17 0.001Season × Year 15 18644 1243 0.98 0.592Residual 48 60771 1266.1 Total 71 121000
α Proteobacteria
Season 3 24068 8022.8 7.26 0.001
Year 5 12904 2580.9 2.34 0.001Season × Year 15 15895 1059.6 0.96 0.721Residual 48 53052 1105.3 Total 71 107000
Bacterioidetes Season 3 25034 8344.6 6.38 0.001Year 5 10595 2119 1.62 0.002Season × Year 15 19966 1331.1 1.02 0.392
Residual 48 62768 1307.7 Total 71 120000
Cyanobacteria Season 3 15728 5242.6 4.51 0.001Year 5 10740 2148 1.85 0.002Season × Year 15 23665 1577.6 1.36 0.015Residual 48 55768 1161.8 Total 71 105000
Other phyla Season 3 36883 12294 5.38 0.001Year 5 27020 5403.9 2.37 0.001Season × Year 15 34248 2283.2 1.00 0.480
Residual 48 110000 2283.3 Total 71 20000
17
Nat
ure
Pre
cedi
ngs
: hdl
:101
01/n
pre.
2010
.440
6.1
: Pos
ted
1 M
ay 2
010

Table 2. Summary of results from stepwise distance-based linear modeling of inter-sample
similarities (or distances for single variables) variables on temporal variables (serial day = D, solstice term = DX1, equinox term = DX2) and measured or modeled variables. S – species richness or number of operational taxonomic units. 1- ' is the Simpsons dominance coefficient, 1-(1-
a') refers to the indicative eveness of the community.
Variables AIC SS(trace) Pseudo-F p R2 Variables AIC SS(trace) Pseudo-F
p R2
All +DX1 523.7 22332 15.9 0.001 +PAR 525.4 19978 13.9 0.001+DX2 520.2 7225 5.5 0.001 +Temp. 522.2 7043 5.2 0.001 22.4+D 518.8 4147 3.2 0.001 28.0
Alphaproteobacteria +DX1 513.9 21499 17.5 0.001 +PAR 515.9 19165 15.2 0.001+DX2 510.2 6520 5.7 0.001 +Temp. 512.5 6374 5.4 0.001 23.8+D 508.7 3840 3.5 0.001 29.7
Bacterioidetes +DX1 526.6 17501 12.0 0.001 +PAR 528.0 15526 10.4 0.001+DX2 522.6 8144 6.0 0.001 +Temp. 524.4 7836 5.6 0.001 19.5+D 521.7 3785 2.9 0.001 24.6
Cyanobacteria +DX1 523.3 7515 5.4 0.001 +Temp. 523.1 7853 5.6 0.001+DX2 520.9 5800 4.4 0.001 12.7 +PAR 520.4 6159 4.7 0.001
+Log(NOx) 520.1 2804 2.2 0.019 15.0
All Others +DX1 566.7 30576 12.0 0.001 +PAR 567.3 29049 11.3 0.001+DX2 564.3 10552 4.3 0.001 +Temp. 565.1 10109 4.1 0.001 18.8+D 562. 7 8233 3.5 0.001 23.6
Log (S) +DX1 -203.4 5.72 99.1 0.001 +PAR -195.7
5.26 82.0 0.001
+D -216.3 0.75 15.8 0.001 66.3 +Log(NOx) -199.0
0.32 5.2 0.024
+-Log(35.5-Sal)
-202.4
0.30 5.3 0.020
+Log(Sil) -203.6
0.17 3.0 0.078
+Log(TOC) -204.7
0.16 3.0 0.101 63.6
Detrended Log (S) +DX1 -225.9 5.33 126.2 0.001 64.3 +PAR -219.0
5.04 108.5 0.001
+-Log(35.5-Sal)
-225.2
0.35 8.3 0.006
+Log(NOx) -228.8
0.22 5.6 0.033
+NAO -229.0
0.08 2.0 0.157 68.6
-Log(1-(1- ')) +D -128.8 2.90 18.3 0.001 +Temp. -116.1
0.76 4.0 0.045
+DX2 -130.0 0.49 3.2 0.085 24.5 +-Log(35.5-Sal)
-116.2
0.38 2.0 0.151 0.08
Detrended -Log(1-(1- '))
+DX2 -132.0 0.49 3.2 0.064 0.04 +Temp. -133.6
0.72 4.9 0.026
+-Log(35.5-Sal)
-133.8
0.31 2.1 0.134
+Log(Sil) -134. 0.30 2.1 0.155
18
Nat
ure
Pre
cedi
ngs
: hdl
:101
01/n
pre.
2010
.440
6.1
: Pos
ted
1 M
ay 2
010

0+Log(TON) -134.
80.38 2.7 0.111 0.16
19
Nat
ure
Pre
cedi
ngs
: hdl
:101
01/n
pre.
2010
.440
6.1
: Pos
ted
1 M
ay 2
010

4.5
5
5.5
6
6.5
0 200 400 600 800 1000 1200 1400 1600 1800 2000 2200
D
Log (S)
Figure 1 – The log of species richness (S) for each time point as a serial day between Jan 1st
2003 and December 31st 2008.
20
Nat
ure
Pre
cedi
ngs
: hdl
:101
01/n
pre.
2010
.440
6.1
: Pos
ted
1 M
ay 2
010

All taxaSeason
WinterSpringSummerAutumn
2D Stress: 0.14
Figure 2 – Non-parametric multi-dimensional scaling (NMDS) ordination of the relative
abundance of clustered operational taxonomic units (OTUs) for all 72 time points
ordered by season. Considerable outliers to the general trend are labelled (A) which
resulted from a Vibrio bloom (Fig 4A), and (B) and (C) which result from two separate
Opitutus blooms (Fig 4B).
A
BC
21
Nat
ure
Pre
cedi
ngs
: hdl
:101
01/n
pre.
2010
.440
6.1
: Pos
ted
1 M
ay 2
010

Figure 3 – Dominant bacterial taxa, (A) SAR11 and (B) Roseobacteriales, abundance
across the 72 time points. All data was randomly resampled by lowest sample abundance,
so that each sample has the same sequencing effort.
A
0
200
400
600
800
1000
1200
1400
1600
1800
Jan
Apr Jul
OctJa
nApr Ju
lOct
Jan
Apr Jul
OctJa
nApr Ju
lOct
Jan
Apr Jul
OctJa
nApr Ju
lOct
Month
Abu
ndan
ce
2003 2004 2005 2006 2007 2008
22
Nat
ure
Pre
cedi
ngs
: hdl
:101
01/n
pre.
2010
.440
6.1
: Pos
ted
1 M
ay 2
010

B
0
200
400
600
800
1000
1200
1400
1600
1800
Jan
Apr Jul
OctJa
nApr Ju
lOct
Jan
Apr Jul
OctJa
nApr Ju
lOct
Jan
Apr Jul
OctJa
nApr Ju
lOct
Month
Abu
ndan
ce2003 2004 2005 2006 2007 2008
23
Nat
ure
Pre
cedi
ngs
: hdl
:101
01/n
pre.
2010
.440
6.1
: Pos
ted
1 M
ay 2
010

Figure 4 – Rare bacterial taxa, (A) Vibrio and (B) Opitutus, abundance across the 72 time
points. All data base don randomly resampled abundance, so that each sample has the
same sequencing effort.
A
0
500
1000
1500
2000
2500
Jan
Apr Jul
OctJa
nApr Ju
lOct
Jan
Apr Jul
OctJa
nApr Ju
lOct
Jan
Apr Jul
OctJa
nApr Ju
lOct
Month
Abu
ndan
ce
2003 2004 2005 2006 2007 2008
24
Nat
ure
Pre
cedi
ngs
: hdl
:101
01/n
pre.
2010
.440
6.1
: Pos
ted
1 M
ay 2
010

B
0
100
200
300
400
500
600
Jan
Apr Jul
OctJa
nApr Ju
lOct
Jan
Apr Jul
OctJa
nApr Ju
lOct
Jan
Apr Jul
OctJa
nApr Ju
lOct
Month
Abu
ndan
ce2003 2004 2005 2006 2007 2008
25
Nat
ure
Pre
cedi
ngs
: hdl
:101
01/n
pre.
2010
.440
6.1
: Pos
ted
1 M
ay 2
010

Supplementary Methods
Sampling
Seawater samples were collected on 72 occasions from January 2003-December 2008 from the
L4 sampling site (50° 15.00' N, 4° 13.02') of the Western Channel Observatory
(http://www.westernchannelobservatory.org.uk; Table S1). Nineteen environmental variables
were obtained from the WCO database, available on the website; these included surface
temperature, salinity, water density, silicate concentration, nitrate + nitrite concentration,
chlorophyll concentration, total organic nitrogen (TON) concentration, ammonium
concentration, soluble reactive phosphorus (SRP) concentration, total organic carbon (TOC)
concentration, photo-active radiation (PAR), phytoplankton and zooplankton taxa abundances,
etc. Other variables measured were flow cytometric determination of bacterial abundance,
microscope counts of cryptophyte, picoeukaryote, nanoeukaryote, coccolithophore and small
dinoflagellate abundance. All methods for determining these variables are available on the
WCO website (http://www.westernchannelobservatory.org.uk/all_parameters.html).
DNA extraction, 16S rDNA V6 amplification and Pyrosequencing
Nucleic acid was extracted from 5 L seawater, collected from the surface and filtered
immediately through a 0.22 µm Sterivex cartridge (Millipore), which was stored at -80 °C.
26
Nat
ure
Pre
cedi
ngs
: hdl
:101
01/n
pre.
2010
.440
6.1
: Pos
ted
1 M
ay 2
010

DNA was isolated from each sample (Neufeld et al., 2007) and then stored at -20 °C. DNA was
used as a template for V6-region 16S rRNA amplification using the method of Huber et al.
(2007) in sets of twelve. Each amplicon in set of twelve was labeled with a unique multiplex
identifier (MID) sequence (Table S2). Subsequently, amplicon product pools for each year
were pyrosequenced on ½ of a 454 pico-titre plate using the GS-flx platform. All sequences
have been submitted to the NCBI short reads archive under
SRA009436, and registered with the GOLD database (Gm00104). All data submitted are
MIENS compliant (Field et al., 2008; Yilmez et al., 2010).
Processing of sequences to generate OTUs and assign taxa
Re-sampling of the 72 samples to identical sequencing depth was done by randomly selecting
reads in fasta format using Daisy_chopper v1.0
(http://www.genomics.ceh.ac.uk/GeneSwytch/Tools.html; Gilbert et al., 2009). All sequences
were pre-processed using the method of Huse et al (2010). All data was then handled through
the Visualization and Analysis of Microbial Population Structure project (VAMPS) website
(http://vamps.mbl.edu/index.php). The VAMPS workflow was used to create a profile of the
unique sequences, their taxonomic assignment and their abundance in each sample. OTUs in
the normalized dataset were annotated with the GAST process (Sogin et al., 2006) and is freely
available through the VAMPS website (http://vamps.mbl.edu/index.php).
27
Nat
ure
Pre
cedi
ngs
: hdl
:101
01/n
pre.
2010
.440
6.1
: Pos
ted
1 M
ay 2
010

Statistics
Changes in community structure through time were analysed using nonparametric multivariate
methods (Clarke, 1993) implemented in Primer v 6 (Clarke and Gorley, 2006). Resampled
abundances of OTUs (however defined) and subsets of OTUs (Proteobacteria, Bacterioidetes,
Cyanobacteria, all other phyla combined) were Log(N+1)-transformed, to downweight
contributions to intersample resemblances from the few most numerically abundant OTUs.
Intersample resemblances (Clarke, Somerfield and Chapman, 2006) were calculated using the
Bray-Curtis similarity measure (Somerfield 2008) and the resemblance matrices ordinated
using nonmetric multidimensional scaling (MDS). To examine the relative effects of seasonal
and interannual variability samples were grouped into seasons (Winter: December, January,
February; Spring: March, April, May; Summer: June, July, August; Autumn: September,
October, November) and changes in community structure were analysed with 2-way
permutation-based analysis of variance (Anderson, Gorley and Clarke, 2008; McArdle and
Anderson, 2001) using Season and Year as factors, type III (partial) sums of squares and 999
permutations of residuals under a reduced model.
Two univariate measures of community structure, the number of different OTUs (S)
and Simpson’s evenness index 1-λ’ (Somerfield 2009), were calculated for each sample.
28
Nat
ure
Pre
cedi
ngs
: hdl
:101
01/n
pre.
2010
.440
6.1
: Pos
ted
1 M
ay 2
010

Variation in these indices, and environmental variables, were analysed using multiple linear
regression (MLR) to determine temporal patterns. Temporal trends and the form of seasonal
cycles were determined by regression on Serial Day (D), the number of days from 01/01/2003,
a term representing a seasonal cycle mirroring day-length, peaking in midwinter (DX1 = cos(2
π(d/365)), where d is the number of days from the 20th December, the shortest day in the
previous year) and a further orthogonal term to determine the nature of cycles with peaks at
other times of the year (DX2 = sin(2π(d/365))). Univariate measures were further regressed on
a range of (sometimes transformed) explanatory variables using stepwise MLR. The relative
goodness of fit of different regression models was assessed using the Akaike Information
Criterion (AIC). When necessary, single variables were transformed to normalise residuals.
Changes in community structure were also analysed using stepwise distance-based linear
modelling of variation among Bray-Curtis similarities. Analyses were performed using
MINITAB v. 13 and the distance-based linear modelling (DistLM) module within
PERMANOVA+ v. 1 add-in for PRIMER v. 6 (Anderson, Gorley and Clarke, 2008; McArdle
and Anderson, 2001). Inter-seasonal and inter-annual variability among environmental
variables were further analysed using correlation-based principal components analysis (PCA).
29
Nat
ure
Pre
cedi
ngs
: hdl
:101
01/n
pre.
2010
.440
6.1
: Pos
ted
1 M
ay 2
010

Supplementary Figures and Tables
Table S1 – Sampling dates, and environmental conditions for each date. Data is MIENS
compliant.
Refer to attached excel document.
Table S2 – Primer sequences used for analysis, including A and B 454 adapter sequence and
MID sequence.
Refer to attached excel document
Table S3. Results from linear regressions on serial day (D) and D2 for those variables in
which a significant trend was detected.
Response α 1 (D) 2 (D2) R2 F 2,69 p F D p F D2 pLog(S) 5.2 7×10⁻⁴ -2×10⁻⁷ 15.1 6.12 0.001 8.3 0.001 3.98 0.0
5-Log(1-(1-’ ) )
2.3 6×10⁻⁴ 1×10⁻⁷ 21.9 9.50 0.001 18.2 0.001 0.78 ns
Log(SRP) -1.1 -2×10⁻⁴ -1×10⁻⁷ 11.4 4.36 0.020 8.5 0.001 0.17 ns
Table S4. Results from multiple linear regression on solstice term (DX1) and equinox term
(DX2), having detrended (*) variables in which there was a significant linear or quadratic trend.
Response α 1
DX12
DX2R2 F2,69 p F
DX1p F
DX2p
PAR 24.3 -22.0 -1.00 84.9 194.5 0.001 388.3 0.001 0.9 nsLog(NOx) 0.31 2.57 0.61 71.8 87.9 0.001 164.9 0.001 10.5 0.001MLD 19.3 6.41 2.20 23.1 10.3 0.001 18.3 0.001 2.4 nsNAO -0.15 0.61 0.55 15.0 6.1 0.001 6.3 0.001 5.8 0.001Log(Chl) 0.10 -0.32 -0.10 12.1 4.74 0.012 8.53 0.001 0.9 ns-Log(35.5-Sal) 0.86 -0.07 -0.05 1.3 0.47 0.628 0.6 ns 0.3 nsLog(Sil) 0.85 1.16 0.11 44.9 28.1 0.001 55.6 0.001 0.5 nsTemp 12.7 -1.56 -3.36 89.4 290.5 0.001 79.4 0.001 502.4 0.001Log(SRP)* 0.13 0.83 0.39 44.3 27.5 0.001 44 0.001 10.9 0.001Log(TOC) 5.49 -0.28 -0.10 23.0 10.3 0.001 18.1 0.001 2.6 nsLog(TON) 3.38 -0.31 -0.05 25.3 11.7 0.001 22.7 0.001 0.6 ns
Log(S)* 0.06 0.40 0.03 64.6 63.1 0.001 125.4 0.6 ns
30
Nat
ure
Pre
cedi
ngs
: hdl
:101
01/n
pre.
2010
.440
6.1
: Pos
ted
1 M
ay 2
010

-Log(1-(1-’ ) )*
0.0 -0.02 -0.12 4.5 1.6 0.206 0.03 ns 3.42 ns
31
Nat
ure
Pre
cedi
ngs
: hdl
:101
01/n
pre.
2010
.440
6.1
: Pos
ted
1 M
ay 2
010

Figure S1 – Species accumulation curve for all data from the original dataset of s of
747,494 sequences (S unique), original resampled dataset of 295,272 sequences (S unique
resampled), the conservative clustered dataset (S clustered) and the resampled
conservative clustered dataset of sequences (S clustered resampled).
0
10000
20000
30000
40000
50000
60000
70000
0 12 24 36 48 60 72
Months
OT
Us
S clusteredS clustered resampledS uniqueS unique resampled
32
Nat
ure
Pre
cedi
ngs
: hdl
:101
01/n
pre.
2010
.440
6.1
: Pos
ted
1 M
ay 2
010

Figure S2– (A) Principle Component Analysis (PCA) of environmental variables and (B)
bubble plot of variation in S with time point.
33
Nat
ure
Pre
cedi
ngs
: hdl
:101
01/n
pre.
2010
.440
6.1
: Pos
ted
1 M
ay 2
010

-4 -2 0 2 4 6PC1
-4
-2
0
2
4P
C2
SeasonWinterSpringSummerAutumn
Serial Day
DX1
DX2
Mixed Layer Depth_1
Em-2d-1 (PAR)NAO
Temperature (ºC)
Log(Chlorophyll A (µg/L))
Log(NO2 + NO3 (µmol L-1))Log(Silicate (µmol L-1))
Log(Total Organic Carbon)Log(Total Organic Nitrogen)
-log(35.5-Sal)
Res(log(SRP|D))
-4 -2 0 2 4 6PC1
-4
-2
0
2
4
PC2
S
180
420
660
900
A
B
34
Nat
ure
Pre
cedi
ngs
: hdl
:101
01/n
pre.
2010
.440
6.1
: Pos
ted
1 M
ay 2
010
Related Documents