February 2013 Dawson Creek Timber Supply Area Old Growth Management Areas Footprint Analysis and Future Development Assessment Final Research Report Prepared for: Prepared by: Teresa Raabis, RPF (Boreal Enterprises)

Welcome message from author
This document is posted to help you gain knowledge. Please leave a comment to let me know what you think about it! Share it to your friends and learn new things together.
Transcript

February 2013
Dawson Creek Timber Supply Area Old Growth Management Areas
Footprint Analysis and Future Development Assessment
Final Research Report
Prepared for:
Prepared by: Teresa Raabis, RPF (Boreal Enterprises)

Dawson Creek Timber Supply Area Old Growth Management Areas Assessment Project
2 Research Report - July 2012
ACKNOWLEDGEMENTS This research project is based upon work jointly funded by the Science and Community Environmental Knowledge Fund (SCEK) and a group of six industry partners. This study was initiated, directed and administered by Encana Corporation with generous support by a diverse group of industry partners who provided technical advice, data and financial support critical to the success of the project. The project team extends a thank you to the following organizations:
• Apache Corporation; • Canadian Natural Resources Limited; • ConocoPhillips Canada; • Encana Corporation; • Science and Community Environmental Knowledge (SCEK) Fund; • Shell Canada; and • Talisman Energy Inc..
The majority of the effort involved in completing the GIS footprinting analysis and writing of this report was by Teresa Raabis at Boreal Enterprises. Thank you to Teresa for her background knowledge on the topic and efficiency with completing the GIS work, as this allowed the Project to include in scope all 151 OGMAs in the Dawson Creek TSA with petroleum and natural gas tenure.
Dawson Creek Timber Supply Area Old Growth Management Areas Assessment Project
3 Research Report - July 2012
Disclaimer This report presents the results of a research project on Old Growth Management Areas (OGMAs) in the Dawson Creek Timber Supply Area in north eastern British Columbia. Implications of OGMAs on the oil and gas sector are analyzed and discussed. The report is provided as delivered by the researcher and the findings and considerations do not necessarily reflect the views or policies of the project funders, project team members, oil and gas industry and/or British Columbia Government, Ministries or Regulatory Agencies.

Dawson Creek Timber Supply Area Old Growth Management Areas Assessment Project
4 Research Report - July 2012
Executive Summary Written by: Jennifer Hedayat, P.Eng., Encana Corporation Old Growth Management Areas (OGMAs) are a tool used to identify areas of forest that will be managed to ensure retention and recruitment of these important areas for biological diversity. Spatial OGMAs were designated under the Forest and Range Practices Act (FRPA) in 2009 for the Dawson Creek Timber Supply Area (TSA) in Northeastern British Columbia. These OGMAs are currently established under Section 93.4 of the British Columbia (BC) Land Act and only legally apply to parties that are required to prepare a Forest Stewardship Plan. However, with the introduction of the Oil and Gas Activities Act (OGAA) Environmental Protection Management Regulation (EPMR) in October 2010, there is an option for government to establish OGMAs that will apply to the oil and gas industry. A key observation from the project is that the land use time frames and requirements are quite different between the forestry and oil and gas sectors. Thus, the current model for OGMA retention as a result of forestry activity may not be directly applicable to that from oil and gas activity. The management direction for OGMAs once they are established under OGAA states: “…operating areas not be located within an old growth management area unless it will not have a material adverse effect on the old seral stage forest representation within that area” The current OGMA modification process captured under FRPA allows for “minor intrusions” into OGMAs, defined as follows: “Provided the disturbance to the gross OGMA area does not exceed:
a) 10% in OGMAs less than 50 hectares; or b) 5% or 40 hectares, whichever is less, in OGMAs of 50 hectares or greater”
This research project endeavoured to understand how the oil and gas industry will have, or not have, a material adverse effect on old seral forest representation within an OGMA. This was achieved through the use of Geographic Information System (GIS) expertise and existing data available via several sources (including the BC Oil and Gas Commission [OGC] and recent aerial photography) to determine the current footprint already present in the OGMAs and the impacts of this footprint to old seral forest representation. Furthermore, the “carry-forward” footprint, the disturbance which occurs during the time gap between the aerial photography date and the current date, was determined using OGC spatial data. Footprint features were defined as any man-made disturbances wherein the natural vegetation has been removed and it is anticipated that the areas will not revert to a vegetated state naturally; these areas are typically devoid of trees and shrubs and show exposed soil or low grass cover (e.g. well sites, facilities, pipelines). There are 240 OGMAs in the Dawson Creek TSA, 151 of which have oil and gas tenure and were thus included in the GIS analysis for this research project. For each of the 151 OGMAs, two manually digitized maps were created using the aerial photography to show: 1) the extent of current and carry forward footprint within the OGMA and 2) the seral stage age class and land base constraints within the OGMA. The results of the analysis indicated that the total footprint (both the total anthropogenic footprint as well as the footprint attributed to oil and gas development only) do not significantly reduce the OGMA area on a landscape level. The total footprint represents only 1.11% of the total OGMA
Dawson Creek Timber Supply Area Old Growth Management Areas Assessment Project
5 Research Report - July 2012
area, and the footprint attributed strictly to oil and gas development impacts only 0.35% of the total OGMA area. When the current FRPA minor intrusion threshold was applied to the current footprint as a basis of analysis, it was found that 57% of the OGMAs have a FRPA minor intrusion threshold of less than 40ha, and 28% of the OGMAs have a total footprint that is close to or exceeds the minor intrusion threshold. 5% of the OGMAs have an oil and gas footprint that is close to or exceeds the minor intrusion threshold. This is important as these OGMAs would likely trigger amendment process if the FRPA minor intrusion threshold were to be used as a basis for the OGMAs established under OGAA. Therefore, on a landscape level the oil and gas industry currently has a very minimal impact to the OGMAs in the Dawson Creek TSA. The research project also included an analysis of the considerations that will require future discussion between Industry, OGC and BC Forest, Land and Natural Resources Operations (FNLRO) when reviewing the establishment of OGMAs under OGAA. The questions addressed include, but are not limited to, the definition of “material adverse effect” and “minor intrusion threshold”, the process used for ongoing tracking of footprint features and the amendment process. Suggestions for areas of further review and analysis as the discussion regarding OGMAs progresses into a policy dialogue context are included with each question. The results of this research project will support industry in understanding what the current impact of oil and gas development is on OGMAs and will provide the necessary background for OGC, FLNRO and Industry to engage in productive discussions regarding the management of OGMAs. The Project Team suggests that these discussions occur in a second phase of the Project.
Dawson Creek Timber Supply Area Old Growth Management Areas Assessment Project
6 Research Report - July 2012
Table of Contents
1.0 Introduction ...................................................................................................................... 9
a) Project Rationale: ....................................................................................................... 9 b) Project Objectives: ................................................................................................... 10 c) Project Description & Deliverables: ........................................................................ 10
i) Footprint Analyses: ...................................................................................... 10 ii) Old Forest Determination: ............................................................................ 11 iii) Constrained Areas: ....................................................................................... 11 iv) Recommendations for Establishment and Management: .......................... 11
d) Project Outcomes and Benefits: .............................................................................. 11
2.0 OGMA Background ........................................................................................................ 12
a) Biodiversity Values: ................................................................................................. 12 b) FRPA OGMAs: .......................................................................................................... 13
i) Minor Intrusions ............................................................................................ 13 ii) Amendment Review Process ....................................................................... 13 iii) Amendments ................................................................................................. 13
c) Broad Management Intent: ....................................................................................... 14
3.0 Old Forest Determination............................................................................................... 15
a) Crown Forested Land Base (CFLB) Definition: ...................................................... 15 b) Timber Harvesting Land Base (THLB) Definition: .................................................. 15 c) Non-Crown Forested Land Base (Non-CFLB) Definition: ...................................... 16 d) Seral Stage Definition: ............................................................................................. 16 e) Seral Stage (Age Class) Table ................................................................................. 17 f) Seral Stage (Age Class) Maps ................................................................................. 17
Figure 1 - Age Class & Land Base Constraints Sample Map ................................................ 18
4.0 Current Footprint Identification ..................................................................................... 19
a) Current Footprint Determination Rationale ............................................................ 19 i) Footprint Definition: ...................................................................................... 19 ii) Non-Footprint Definition: .............................................................................. 20
b) Current Footprint Determination Process: ............................................................. 20 i) Data Accuracy and Subjective Nature of Manual Digitization: .................. 21 ii) Time Gap Created by Manual Digitization: .................................................. 21
c) Carry Forward Footprint Determination: ................................................................. 22 d) Current and Carry Forward Footprint Sample Map ................................................ 22 e) Spatial Data Implications ......................................................................................... 24
i) Imagery Used for Footprint Determination .................................................. 24 ii) OGC Data – Footprint Reference Data ......................................................... 24 iii) Crown Tenures Data – Reference Data ........................................................ 27 iv) TRIM Data – Reference Data ......................................................................... 28
5.0 Current State of Footprint in OGMAs ............................................................................ 29
Dawson Creek Timber Supply Area Old Growth Management Areas Assessment Project
7 Research Report - July 2012
6.0 Footprint Development Scenarios ................................................................................ 34
a) Scenario Assumptions: ............................................................................................ 34 b) Scenario Footprint Data Sources: ........................................................................... 34
i) OGC Data ....................................................................................................... 34 ii) Crown Tenures Data ..................................................................................... 35 iii) TRIM Data ...................................................................................................... 35 iv) Manual Digitization ....................................................................................... 35
c) Belcourt 04 Footprint Development Scenario Details: ........................................... 35 i) Minor Intrusion Threshold Definition: ......................................................... 35 ii) Yearly Statistics: ........................................................................................... 35 iii) Results: .......................................................................................................... 36 iv) Discussion:.................................................................................................... 36
d) One Island 11: Footprint Development Scenario Details ....................................... 38 i) Minor Intrusion Threshold Definition: ......................................................... 38 ii) Yearly Statistics: ........................................................................................... 38 iii) Results: .......................................................................................................... 38 iv) Discussion:.................................................................................................... 39
e) Septimus 03: Footprint Development Scenario Details ......................................... 41 i) Minor Intrusion Threshold Definition: ......................................................... 41 ii) Yearly Statistics ............................................................................................ 41 iii) Results: .......................................................................................................... 42 iv) Discussion:.................................................................................................... 42
7.0 Results of Analysis ........................................................................................................ 44
a) General Overview of OGMA Areas .......................................................................... 44 b) Overview of All Industrial Impacts to OGMAs ........................................................ 45 c) Overview of OGC Impacts to OGMAs ...................................................................... 47 d) Evaluation of FRPA Minor Intrusion Clause ........................................................... 49 e) Evaluation of FRPA Amendment Process .............................................................. 53 f) OGMA Boundaries and Constrained Areas ............................................................ 54
i) Non-Spatially Constrained Areas ................................................................. 54 ii) Spatially Constrained Areas ......................................................................... 54
8.0 Recommendations for Establishment and Management ................................................ 57
a) Legal Background ....................................................................................................... 57 b) OGAA Establishment .................................................................................................. 59 c) Material Adverse Effect ............................................................................................... 61 d) OGMA Post-Establishment Tracking Process .......................................................... 63 e) OGMA Amendment Process ....................................................................................... 64
9.0 Review of Key Findings .................................................................................................... 66
a) Footprint Impacts on OGMA Area ........................................................................... 66 b) Current Footprint Impacts on OGMA Age Class .................................................... 66 c) FRPA Minor Intrusion Threshold Review ................................................................ 68 d) FRPA Amendment Process Review ........................................................................ 68 e) OGMA Constrained Areas Review ........................................................................... 68
Dawson Creek Timber Supply Area Old Growth Management Areas Assessment Project
8 Research Report - July 2012
10.0 Appendices ....................................................................................................................... 69
Appendix I - Project Team ........................................................................................... 69 Appendix II - Seral Stage (Age Class) Summary Table ............................................... 70 Appendix III - Data Sources and Locations .................................................................. 74 Appendix IV - General Footprint Comments by OGMA ................................................ 77 Appendix V - OGC Spatial Data Footprint Area by Individual OGMA ........................ 82 Appendix VI - OGAA Environmental Protection and Management Regulations ........ 85 Appendix VII - OGAA EPMR Guide ................................................................................. 86 Appendix VIII - CEPS Bulletin 40 ..................................................................................... 87 Appendix IX - Glossary of Acronyms ............................................................................ 88 Appendix X - Current Footprint & Carry Forward Footprint Maps ............................. 89 Appendix XI - Age Class & Land Base Constraints Maps ........................................... 90
List of Figures Figure 1 - Age Class & Land Base Constraints Sample Map...................................................... 18 Figure 2 - Current & Carry Forward Footprint Sample Map ........................................................ 23 Figure 3 - OGC Location Differences ......................................................................................... 25 Figure 4 - OGC Approved vs Built Differences ........................................................................... 26 Figure 5 - Crown Tenure Location Differences ........................................................................... 27 Figure 6 - TRIM vs Current State Differences ............................................................................ 28 Figure 7 - Belcourt 04 Footprint Development Scenario Map ..................................................... 37 Figure 8 - One Island 11 Footprint Development Scenario Map ................................................. 40 Figure 9 - Septimus 03 Footprint Development Scenario Map ................................................... 43 Figure 10 - Count of OGMAs by Area Category ......................................................................... 44 Figure 11 - Total Footprint as a Percentage of Total OGMA Area .............................................. 45 Figure 12 –Age Class Distribution Impacted by Current Footprint .............................................. 46 Figure 13 - OGMA Subsurface Petroleum Tenures & OGC Footprint Summary ......................... 47 Figure 14 - Total OGC Footprint as a Percentage of Total OGMA Area ..................................... 48 Figure 15 – Current Footprint by FRPA Minor Intrusion Threshold % Category .......................... 50 Figure 16- Total OGC Footprint by Minor Intrusion Threshold % Category ................................. 51 Figure 17 - OGC Footprint Pre-FRPA by Minor Intrusion Threshold % Category ....................... 51 Figure 18 - OGC Footprint Percentage Post-FRPA Establishment by Area Category ................ 52 Figure 19 - Total Footprint as a Percentage of FRPA Minor Intrusion Threshold ........................ 53 Figure 20 - Constrained & Non-Constrained Areas as a Percentage of Total OGMA Area ......... 55 Figure 21 - Age Class & Land Base Constraints Sample Map .................................................... 56 List of Tables Table 1 – Seral Stage Summary ................................................................................................ 16 Table 2 - OGMA Footprint Area Summary ................................................................................. 30 Table 3 – Summary of Current Footprint Impacts to Age Class Distribution ............................... 46 Table 4 – OGC Footprint Summary ............................................................................................ 48 Table 5 – Total Footprint Summary by Minor Intrusion Threshold Category ............................... 49 Table 6 – OGC Footprint Summary by FRPA Minor Intrusion Threshold Category .................... 50 Table 7 - Summary of Total Footprint and OGC Footprint .......................................................... 66 Table 8 – Summary of Current Footprint Impacts to Age Class Distribution ............................... 67 Table 9 – Summary of Constrained Areas .................................................................................. 68
Dawson Creek Timber Supply Area Old Growth Management Areas Assessment Project
9 Research Report - July 2012
1.0 Introduction
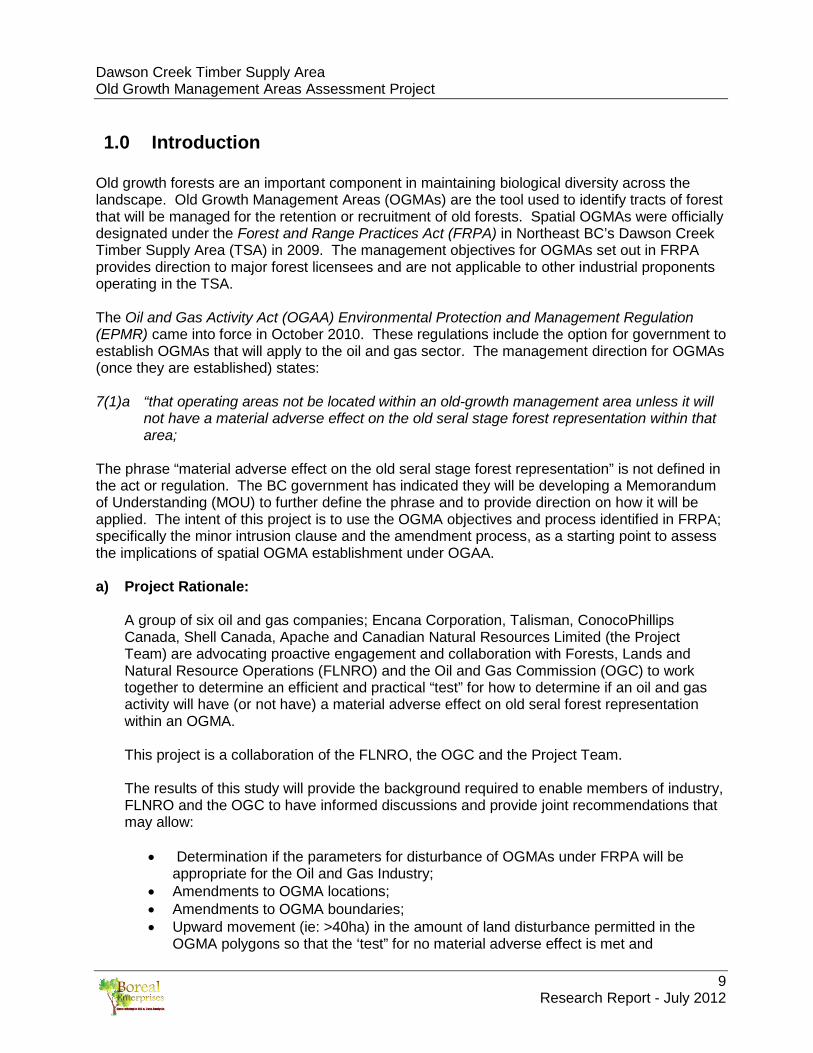
Old growth forests are an important component in maintaining biological diversity across the landscape. Old Growth Management Areas (OGMAs) are the tool used to identify tracts of forest that will be managed for the retention or recruitment of old forests. Spatial OGMAs were officially designated under the Forest and Range Practices Act (FRPA) in Northeast BC’s Dawson Creek Timber Supply Area (TSA) in 2009. The management objectives for OGMAs set out in FRPA provides direction to major forest licensees and are not applicable to other industrial proponents operating in the TSA. The Oil and Gas Activity Act (OGAA) Environmental Protection and Management Regulation (EPMR) came into force in October 2010. These regulations include the option for government to establish OGMAs that will apply to the oil and gas sector. The management direction for OGMAs (once they are established) states: 7(1)a “that operating areas not be located within an old-growth management area unless it will
not have a material adverse effect on the old seral stage forest representation within that area;
The phrase “material adverse effect on the old seral stage forest representation” is not defined in the act or regulation. The BC government has indicated they will be developing a Memorandum of Understanding (MOU) to further define the phrase and to provide direction on how it will be applied. The intent of this project is to use the OGMA objectives and process identified in FRPA; specifically the minor intrusion clause and the amendment process, as a starting point to assess the implications of spatial OGMA establishment under OGAA. a) Project Rationale:
A group of six oil and gas companies; Encana Corporation, Talisman, ConocoPhillips Canada, Shell Canada, Apache and Canadian Natural Resources Limited (the Project Team) are advocating proactive engagement and collaboration with Forests, Lands and Natural Resource Operations (FLNRO) and the Oil and Gas Commission (OGC) to work together to determine an efficient and practical “test” for how to determine if an oil and gas activity will have (or not have) a material adverse effect on old seral forest representation within an OGMA. This project is a collaboration of the FLNRO, the OGC and the Project Team. The results of this study will provide the background required to enable members of industry, FLNRO and the OGC to have informed discussions and provide joint recommendations that may allow:
• Determination if the parameters for disturbance of OGMAs under FRPA will be appropriate for the Oil and Gas Industry;
• Amendments to OGMA locations; • Amendments to OGMA boundaries; • Upward movement (ie: >40ha) in the amount of land disturbance permitted in the
OGMA polygons so that the ‘test” for no material adverse effect is met and
Dawson Creek Timber Supply Area Old Growth Management Areas Assessment Project
10 Research Report - July 2012
responsible oil and gas activities may proceed in OGMAs while managing/mitigating impacts to old seral forest representation.
b) Project Objectives:
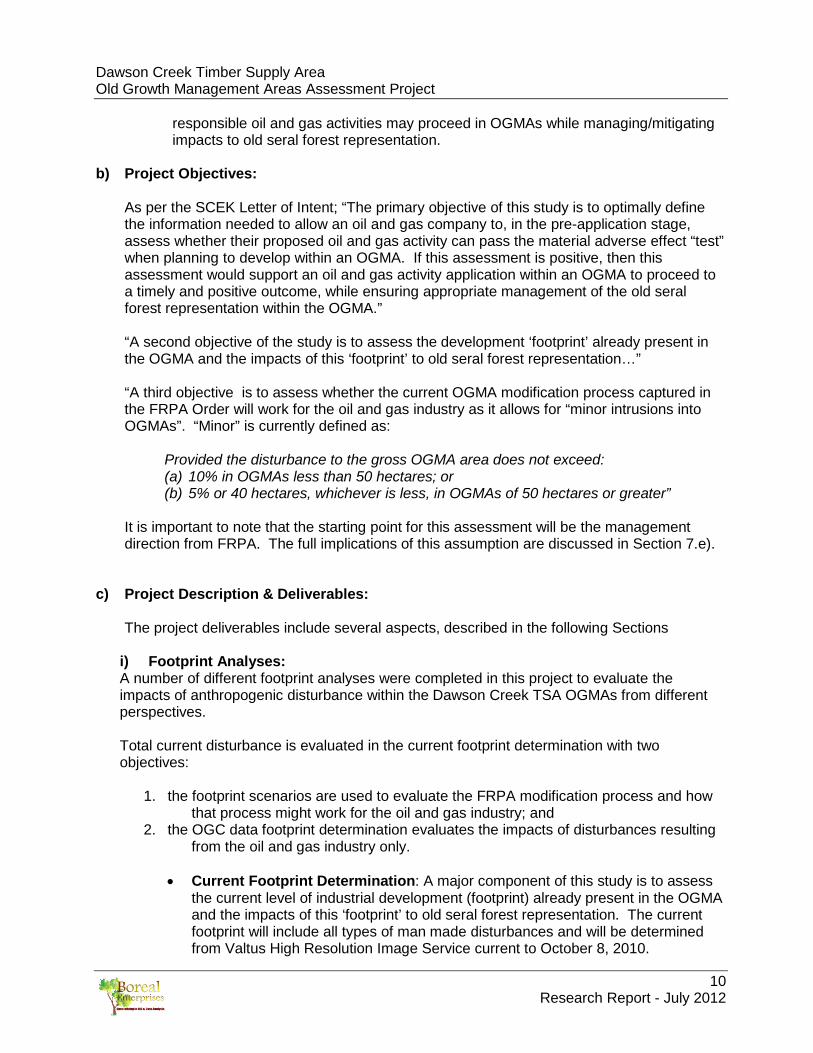
As per the SCEK Letter of Intent; “The primary objective of this study is to optimally define the information needed to allow an oil and gas company to, in the pre-application stage, assess whether their proposed oil and gas activity can pass the material adverse effect “test” when planning to develop within an OGMA. If this assessment is positive, then this assessment would support an oil and gas activity application within an OGMA to proceed to a timely and positive outcome, while ensuring appropriate management of the old seral forest representation within the OGMA.” “A second objective of the study is to assess the development ‘footprint’ already present in the OGMA and the impacts of this ‘footprint’ to old seral forest representation…” “A third objective is to assess whether the current OGMA modification process captured in the FRPA Order will work for the oil and gas industry as it allows for “minor intrusions into OGMAs”. “Minor” is currently defined as:
Provided the disturbance to the gross OGMA area does not exceed: (a) 10% in OGMAs less than 50 hectares; or (b) 5% or 40 hectares, whichever is less, in OGMAs of 50 hectares or greater”
It is important to note that the starting point for this assessment will be the management direction from FRPA. The full implications of this assumption are discussed in Section 7.e).
c) Project Description & Deliverables:
The project deliverables include several aspects, described in the following Sections
i) Footprint Analyses: A number of different footprint analyses were completed in this project to evaluate the impacts of anthropogenic disturbance within the Dawson Creek TSA OGMAs from different perspectives. Total current disturbance is evaluated in the current footprint determination with two objectives:
1. the footprint scenarios are used to evaluate the FRPA modification process and how that process might work for the oil and gas industry; and
2. the OGC data footprint determination evaluates the impacts of disturbances resulting from the oil and gas industry only.
• Current Footprint Determination: A major component of this study is to assess
the current level of industrial development (footprint) already present in the OGMA and the impacts of this ‘footprint’ to old seral forest representation. The current footprint will include all types of man made disturbances and will be determined from Valtus High Resolution Image Service current to October 8, 2010.

Dawson Creek Timber Supply Area Old Growth Management Areas Assessment Project
11 Research Report - July 2012
• Footprint Scenarios: An additional component is to assess whether the current OGMA modification process captured in the FRPA Order will be appropriate for the oil and gas industry. The existing order allows for “minor intrusions” into OGMAs and identifies an amendment process to address future revisions and industrial developments greater than that permitted under a minor intrusion. The footprint scenario assessment will be conducted on three test case OGMAs to evaluate industrial disturbance over time and its relation to the FRPA “minor intrusion”.
• OGC Data Footprint Determination: In addition to evaluating the entire industrial
footprint, the specific impacts of oil and gas development already present in the OGMA and the impacts of this disturbance to old seral forest representation will also be evaluated.
ii) Old Forest Determination:
• Areas within the OGMA that do not contribute to the old seral stage forest representation target (Non Crown Forested Land Base or Non-CFLB); and
• Breakdown of seral stage within the OGMAs. iii) Constrained Areas:
• Areas within the OGMA that are constrained by other requirements such as OGAA EPMR riparian areas, designated Wildlife Habitat Areas (WHAs), Ungulate Winter Ranges (UWRs) or other wildlife features.
iv) Recommendations for Establishment and Management:
• Legal Background; • OGAA Establishment; • Material Adverse Effects; • OGMA Post-Establishment Tracking Process; and • OGMA Amendment Process.
d) Project Outcomes and Benefits:
Outcomes from this project will assist:
• Industry in meeting the material adverse effect test when they must develop oil and gas resources within a designated OGMA;
• Industry in demonstrating that responsible development of energy resources can address and incorporate management of important environmental values;
• The BC government in development of the MOU on the management of OGMAs; and
• FLNRO in establishing OGMAs in optimal locations so biological diversity values are managed on the landscape while allowing for the least conflict with government’s objectives to allow for responsible development of energy resources.

Dawson Creek Timber Supply Area Old Growth Management Areas Assessment Project
12 Research Report - July 2012
2.0 OGMA Background a) Biodiversity Values:
OGMAs are established to ensure the maintenance of the biological diversity of British Columbia’s forests. Biological diversity (biodiversity) is the array of all plants animals and other living organisms found in all dynamic ecosystems. This includes the evolutionary and functional processes that link all organisms as well as the genetic diversity found within each species. In order to adequately evaluate the implications of establishing OGMAs under OGAA, it is important to review the originating concepts and intent of old forest management under FRPA. In the 1990’s, retention of old forests within all forested landscapes was recognized as important for maintaining biodiversity. The basic principle being that all landscapes (ecosystems) have some level of old forests and the more a managed forest resembles the forests that were established as a result of natural processes, the more likely that all native species and ecological processes will be maintained. In the Forest Practices Code era of the late 1990’s, old growth management direction was provided through the Biodiversity Guidebook (1995) and the Landscape Unit Planning Guide (1999). These guidebooks were based on the best available scientific evidence and informed professional judgement. There was recognition that the direction in these guidebooks had limitations and as scientific understanding and social values change over time there would be a need to revisit the management direction of the past. In 2002, Craig DeLong, a Ministry of Forests and Range (MOFR) ecosystem ecologist, developed a paper entitled “Natural Disturbance Units of the Prince George Forest Region: Guidance for Sustainable Forest Management”. This document is a synthesis of the most current scientific information and regional professional judgement and is based on the concept of the natural range of variability. The Natural Disturbance Unit (NDU) guidance uses the updated local research and separates areas based on differences in disturbance processes, stand development, and temporal and spatial landscape patterns. It is recognized that “old growth characteristics” such as large diameter trees, snags, coarse woody debris and complex canopy structure are the crucial stand components that are trying to be maintained on the landscape. Recent studies have found that mapped forest age class is generally well correlated with functionally important old forest characteristics (DeLong 2002). Based on this information and expertise from local professional foresters, the age for “old” forests in the Dawson Creek TSA was determined to be 140 years in the conifer dominated foothills and mountains. Within Boreal Plains NDU, the analysis further splits the area into conifer forests (stands with 80% or greater confer component), deciduous forests (stands with 80% or greater deciduous component) and mixed wood forests (stands with greater than 20% but less than 80% conifer). The intent of this objective is to ensure the retention of representative levels of old forest throughout all of the diverse ecosystems found in the lower elevation plains. The age criteria for old in this NDU is 140 years for conifer, 100 years for deciduous and 120 for mixed wood stands.
Dawson Creek Timber Supply Area Old Growth Management Areas Assessment Project
13 Research Report - July 2012
DeLong identifies two strategies for OGMA replacement that are appropriate for the Dawson Creek TSA. In the foothills and mountains a strategy of irregularly dispersed large semi-permanent reserves is recommended. The more uneven-aged forests in these reporting units are less susceptible to stand replacement events and therefore have a higher likelihood of maintaining old forest structure over long periods of time. Replacement may be necessary but not on a continuous basis as in the rotating reserve strategy. In the lower foothills and boreal plains where the natural disturbance cycle is <150 years, a system of rotating reserves is recommended. These reserves would be scheduled to be cut when reserve areas of relatively equal size have been identified that can take their place. The intent would be to always have some large reserves of forest that are old but not so old as to be unnatural and highly susceptible to stand replacement from forest insect or disease outbreaks.
b) FRPA OGMAs:
OGMAs are currently established under section 93.4 of the Land Act and only legally apply to parties that are required to prepare a Forest Stewardship Plan. In 2009 the government completed a multi-year process to create an Order that establishes 240 OGMAs covering approximately 250,000 ha in the Dawson Creek TSA. The objectives in the order are to retain all timber with an allowance for minor intrusions as well as an identified amendment review process.
i) Minor Intrusions
The legal order allows for some flexibility to address operational issues; up to 10% in OGMAs less than 50 ha or 5% or 40 ha, whichever is less, in OGMAs of 50 ha or greater. The intent of the flexibility is to allow for minor adjustments to the OGMA boundaries to minimize operational impacts to the forest industry while maintaining the biological integrity of the OGMA. The District Manager can approve minor intrusions for FRPA regulated disturbances, however, any FRPA regulated disturbance greater than the minor intrusion threshold requires an amendment before the activity can occur.
ii) Amendment Review Process
An amendment review process has been developed to address the rotating reserve concept for boreal forests. This internal government process will review all industrial activities that occur within OGMAs. Minor intrusions and amendment proposals are compiled and reviewed on an annual basis to reduce the frequency of changes to the legal order and associated maps. The review process determines which, if any, OGMAs will move to a formal amendment process to address current or proposed industrial activity.
iii) Amendments The amendment of legally established FRPA OGMAs will entail complete consideration of all possible options, ranging from removal of industrial footprint only to relocation of the entire OGMA. The formal amendment process will involve all industrial tenure holders affected by the current and/or proposed OGMA. Amendments will also go through a full First Nations consultation process and review by stakeholders and the public.
Dawson Creek Timber Supply Area Old Growth Management Areas Assessment Project
14 Research Report - July 2012
Note: In some circumstances OGMAs were placed in areas where previously identified cultural, social or environmental values were preventing or constraining forest harvesting. In these OGMAs, minor intrusion or amendment may not be suitable due to the underlying identified values.
c) Broad Management Intent:
• Old growth management is a landscape level biodiversity objective and while operational impacts to specific OGMAs are an important consideration they also need to be assessed in light of their significance on the landscape level;
• In order to maintain the biodiversity across the landscape the portions of the forested
land base being managed as old forest needs to recognized by all tenure holders (eg: forestry, oil & gas, Land Act tenures);
• Any spatial OGMAs require consistent management direction for all tenure holders; • The OGMA management direction differs significantly from parks and protected areas;
and • Spatial OGMAs are intended to be managed as “rotating reserves”. As the old forest
component becomes decadent and dies off the spatial OGMAs will be replaced with more viable old stands.
Dawson Creek Timber Supply Area Old Growth Management Areas Assessment Project
15 Research Report - July 2012
3.0 Old Forest Determination The focus of developing Old Growth Management Areas in the Dawson Creek TSA, was to capture a representation of the old seral stage forests across the landscape. With the potential establishment of OGMAs under OGAA, the EPMR regulations state: 7(1)a “that operating areas not be located within an old-growth management area unless it will
not have a material adverse effect on the old seral stage forest representation within that area;
However, the phrase “material adverse effect on the old seral stage forest representation” is not defined in the act or regulation. In order to effectively define the seral stage forest within the OGMAs, one must first understand how the seral stage forest was determined under FRPA. In order to do this, it is important to comprehend the concepts for CFLB, THLB and Non-CFLB and how they are related to one another. a) Crown Forested Land Base (CFLB) Definition:
For the establishment of OGMAs under FRPA, the crown forested land base (CFLB) was spatially determined as any area outside of the following features:
Parks & Protected Areas; Indian Reserves; Private Land; Federal Land; Municipal Land; Tree Farm Licence Areas (TFL); and Woodlots.
The CFLB does not consider the viability of the land to produce a merchantable forest, only that it contains forest attributes and resides on crown land. The viability of the land base in regards to merchantable timber is obtained from the Timber Harvesting Land Base (THLB).
b) Timber Harvesting Land Base (THLB) Definition:
For the purposes of determining the old growth targets for the OGMAs under FRPA, the CFLB was further separated by the four contributing classes of THLB: Contributing, Partially Contributing, Non-Contributing and Excluded. The first three classes are considered to currently support or have the potential to support a harvestable stand of trees. These three classes combined are considered the CFLB that is counted towards the old growth management targets, and subsequently the CFLB within the OGMAs. The Excluded land is typically associated with wetlands, watercourses, non-treed alpine and areas that are generally believed to never be productive from a timber supply perspective. The excluded portion of THLB is considered the Non-CFLB in the OGMAs.

Dawson Creek Timber Supply Area Old Growth Management Areas Assessment Project
16 Research Report - July 2012
c) Non-Crown Forested Land Base (Non-CFLB) Definition:
The Non-CFLB within the OGMAs is the component of excluded land that is derived from the THLB. Any area within the Non-CFLB was not considered towards the old growth management targets when established under FRPA. However, this Non-CFLB was not removed from the OGMA boundaries in order to reduce very irregular boundaries and to eliminate doughnut shaped polygons.
d) Seral Stage Definition:
There are now two main components associated with the OGMAs: CFLB area and Non-CFLB area. Only the CFLB area contributes towards the old growth targets and it is this area that is further categorized into seral stages or age classes. Different tree species mature at different rates and as a result reach an “old” status at different ages. For determining old within OGMAs, three dominant stand types were identified and corresponding ages for old were determined. Conifer leading forests (stands with 80% or greater conifer component), deciduous leading forests (stands with 80% or greater deciduous component) and mixedwood forests (stands with greater than 20% but less than 80% conifer). Table 1 outlines the seral stages by stand type.
Table 1 – Seral Stage Summary
Stand Type Seral Stage (Age Class) Old Near Old Recruitment
Conifer Leading Stands >140 years 120-140 years <120 years Deciduous Leading Stands >100 years 80-100 years <80 years
Mixedwood Stands >120 years 100-120 years <100 years
Even though the OGMAs consist of forests containing all three seral stages, under FRPA, the “old seral stage forest representation” is considered as the total CFLB within the OGMA regardless of its age class. Furthermore, the entire CFLB area within the OGMA goes towards the old growth management target. While the younger age classes currently contain fewer old growth attributes than their old counterparts, over time, as they age, they will continually increase the number and quality of old growth attributes. This concept ties back to the natural range of variability within forest stands and for managing recruitment areas for long term old growth objectives. It is for this reason that these areas were considered towards the old growth target under FRPA For the purposes of evaluating oil and gas industrial disturbance in the OGMAs, only management by age class regardless of stand type has been addressed in this study. It should also be noted that the age class data used in the development of the FRPA OGMAs and included in this report, may be of a dated nature because of it’s original source and/or natural changes that may have occurred since establishment.

Dawson Creek Timber Supply Area Old Growth Management Areas Assessment Project
17 Research Report - July 2012
e) Seral Stage (Age Class) Table
A total of 151 OGMAs were evaluated in this section and a summary table outlining the seral stage (age class) by OGMA was developed. The table outlining all 151 OGMAs is found in Appendix II.
This table also includes spatial land base constraints (riparian areas and Wildlife Habitat Areas) that are associated with each OGMA. The implications and management of these constraints can be found in the Environmental Protection and Management Regulation Guide. Refer to Appendix VII for a complete copy of the guide.
f) Seral Stage (Age Class) Maps
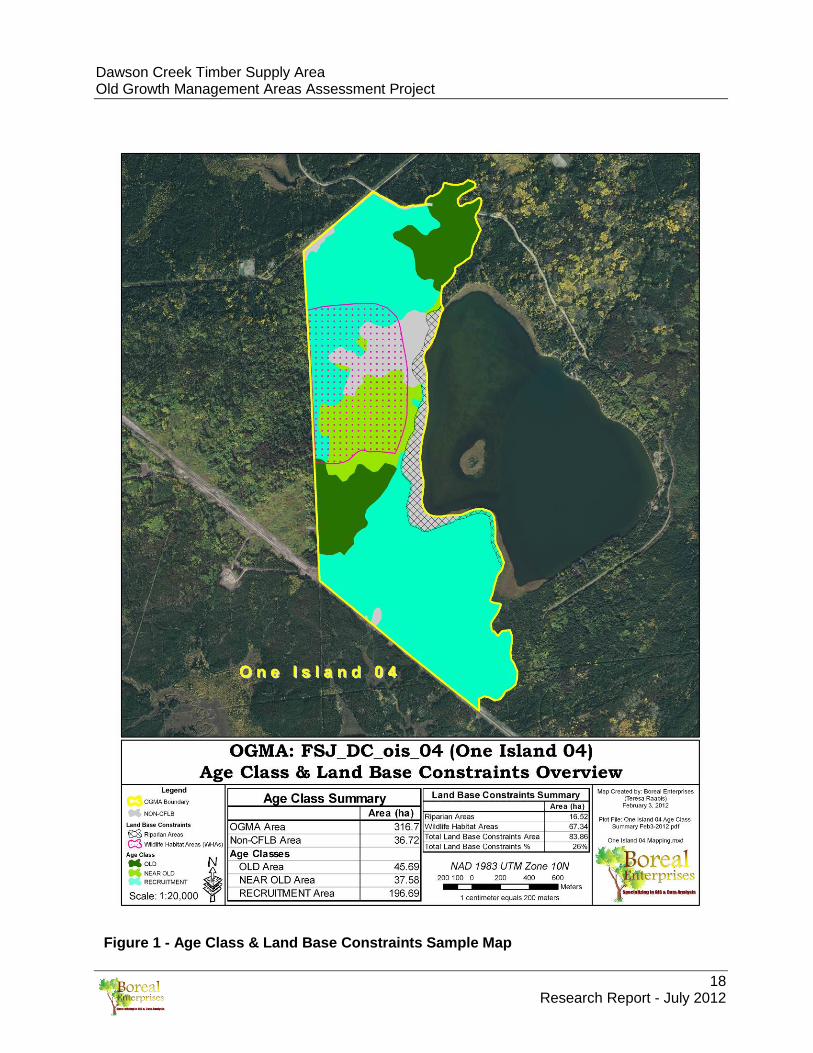
In order to adequately manage the industrial impacts to the “old seral stage forests” within the OGMAs, it is important to know where the seral stage age classes and the non-CFLB are spatially located. In order to aid in this management, individual maps by OGMA have been produced outlining the seral stage, the non-CFLB and the spatial land base constraints. The maps represent the age classes that were available during the development of the FRPA OGMAs. Actual ground conditions may be different due to natural disturbances and/or the availability of more current age class values. Figure 1 represents a sample of the age class and land base constraints map that have been developed for each OGMA reviewed in this report. The full complement of maps can be found in Appendix XI.
Dawson Creek Timber Supply Area Old Growth Management Areas Assessment Project
18 Research Report - July 2012
Figure 1 - Age Class & Land Base Constraints Sample Map
Dawson Creek Timber Supply Area Old Growth Management Areas Assessment Project
19 Research Report - July 2012
4.0 Current Footprint Identification A full assessment of industrial footprint was not completed prior to the establishment of the OGMAs under FRPA due time and data constraints. OGMAs were established with the knowledge that there was industrial development that had removed some forest cover from the land base but these impacts were considered to be minor on a landscape level. Current footprint now needs to be identified in order to set the base case for the assessment of industrial developments since OGMA establishment. a) Current Footprint Determination Rationale
When the project was first initiated, it was believed that the most effective process for determining the footprint within in the OGMAs was to use multiple sources of spatial data and fill in any gaps with manual digitization. However, significant limitations to the spatial data were identified (refer to Section 4.0 e) for specifics). As a result, the current footprint has been determined solely by manually digitizing from the most current high resolution imagery available and using the collected spatial data as a reference only. The following outlines the rational for which features were considered footprint and which features were considered non-footprint.
i) Footprint Definition: Footprint features are considered to be any man made disturbances wherein the natural vegetation has been removed and it is anticipated that the areas will not revert to a vegetated state naturally. These areas are typically devoid of trees and shrubs and show exposed soil or low grass cover. Footprint Features include: • Roads and Bridges; • Right of Way Landings; • Pipelines; • Wellsites; • Facilities; • Extra Work Areas ; and • Areas Cleared for Agricultural or Range Purposes.
Given that some area based authorizations issued under a specific enactment are not subject to the EPMR, it is important to note that not all of the features in the above-mentioned list would likely be considered as part of the total disturbance or footprint within an OGMA. For example, road disturbances are subject to Land Act authorizations, and thus not subject to the EPMR and ultimately, the definition of total disturbance within an OGMA. However, for the purpose of this Project, all footprint features were included in order to determine the potential “worse case” scenario and use a baseline for other OGMAs reviewed. It is not intended to be an actual representation of footprint development as considered by FRPA, or potentially OGAA, but rather a way to evaluate the potential development over time and understand how this development might be managed if OGMAs had the same legal requirement under EPMR as they currently do under FRPA. Furthermore, this approach is much more conservative in nature as it does assess all of
Dawson Creek Timber Supply Area Old Growth Management Areas Assessment Project
20 Research Report - July 2012
the anthropogenic footprint in an OGMA to-date; thus once the disturbances subject to EPMR are applied, the actual footprint would be less than that illustrated in this Project.
ii) Non-Footprint Definition: Non-Footprint features are considered to be man made disturbances that have had a low impact to the natural vegetative cover or that are showing significant signs of reverting to a natural vegetated state. While the natural vegetation has been removed on non-footprint features, it is expected that the areas will re-vegetate naturally. Non-Footprint Features include: • Seismic Lines; • Trails; • Helipads; • Any Footprint features that exhibit considerable reversion to a natural re-vegetated
state; and • Any Footprint features that have been rehabilitated to a natural vegetated state
(i.e.: trees planted).
In the past, seismic lines were constructed in such a way as to produce significant footprint – they may have been completely cleared of vegetation up to eight meters wide and in some cases the forest floor could also be considerably disturbed. However, current seismic line construction practices greatly reduce the impact of the footprint to the landscape. The current direction in Section 18(1) of the EPMR (see Appendix VI) removes small amounts of forest cover, which in turn will have minimal impact to the old growth objectives on a landscape level. As well, the soil and ground cover is typically not adversely impacted, enabling these areas to readily revert to a natural state. Therefore, based on the evolution of oil and gas seismic practices over recent years, and the use of Low Impact Seismic in many areas, \, for the purposes of this Project, seismic lines are not considered footprint regardless of when they were constructed. While a current and complete footprint is required in order to evaluate the impacts to old seral forests and to determine a potential amended OGMA area prior to their establishment under OGAA, it also must be accepted that the determination of the current footprint is limited by the date of the imagery used. Any footprint that occurs between the current date and the date of the imagery will be classed as carry forward footprint and may contribute to a future minor intrusion.
b) Current Footprint Determination Process:
The most current high resolution imagery available was identified and used as the basis for manually digitizing the footprint. Three different imagery sources were used in this project:
• The majority of the OGMAs used imagery provided by Encana and was obtained from Valtus High Resolution Image Service. This high resolution imagery is current to October 8, 2010;
• The second source of imagery was provided by Apache under their license with Spatial Energy. This imagery is current to 2009; and

Dawson Creek Timber Supply Area Old Growth Management Areas Assessment Project
21 Research Report - July 2012
• The third source of imagery was purchased by the partners from Valtus and is Spot-5 Satellite imagery current to 2010.
Acquired spatial data from OGC, Crown Tenures and TRIM (Terrestrial Resource Information Management), are referenced and used to help determine footprint, non-footprint and natural disturbance areas. Refer to Appendix III for specifics on the referenced data sets.
i) Data Accuracy and Subjective Nature of Manual Digitization:
When determining footprint by manual digitization, decisions around what is footprint and what is non-footprint is somewhat of a subjective process. While most of the footprint will be very obvious, there are also those areas that may be considered footprint by one person and not by another. It is also possible to miss footprint or to categorize natural openings as industrial footprint. While it is believed that this process will produce the most acceptable results, a certain amount of inherent error must be accepted. To help mitigate the errors, the following procedures were employed: • Acquire the most current highest resolution imagery available for that OGMA and
digitize at a large scale; • Use acquired spatial data (OGC, Crown Tenures & TRIM) as a resource to help
identify potential footprint and to help make decisions. For example, show TRIM water to help reduce the possibility of mistaking an open wetland for industrial footprint;
• The obvious industrial footprint features will include large scale roads, pipelines, wellsites, facilities and open clearings devoid of trees or natural vegetation. See Section 4.0 a) i) for more detail on footprint features; and
• Non-footprint features include seismic lines and trails which are typically evident in the referenced spatial data. Generally speaking, any linear feature that appears to be significantly reverting to a natural state will not be considered footprint. See Section 4.0 a) ii) for additional detail. Because there are varying levels of natural state reversion, this type of disturbance is the most subjective of whether or not the linear feature will be included in the footprint and will be the main source of differences and/or errors.
Refer to Appendix IV for a table containing general comments regarding the footprint on each OGMA.
ii) Time Gap Created by Manual Digitization:
Since it is not possible to obtain imagery for the exact day that the footprint is being determined, there will be a certain amount of disturbance that may not be captured under this method. This project is a snapshot in time using the most recent imagery available. Any footprint that occurs after the image date (or in this time gap) will be classed as carry forward footprint and will potentially contribute towards a future minor intrusion threshold.

Dawson Creek Timber Supply Area Old Growth Management Areas Assessment Project
22 Research Report - July 2012
c) Carry Forward Footprint Determination:
The carry forward footprint is any disturbance that occurs during the time gap between the current date and the date of the imagery used. This footprint is difficult to accurately determine due to the limitations of the spatial data (refer to Section 4.0 e) for details). However, it is essential to estimate (as accurately as possible) this footprint in order to make informed decisions around future industrial activities.
This spatial data would include applications that have been approved through the OGC that may or may not have been constructed, but would not appear as disturbance on the imagery as the image was taken prior to approval/construction. The OGC spatial data must be used to determine the carry forward footprint since it is the only readily available data that contains a date that can be queried. The date of the imagery is identified (if using more than one photo, the date of the most current photo is used) and the approval date field in the OGC data is queried for all polygons that occur after this date. Since the OGC data contains overlapping polygons, it is necessary that once the carry forward polygons are identified, that the overlaps in the data are removed to eliminate double counting any footprint. Once the carry forward footprint is established, the area is considered against the minor intrusion threshold for that OGMA.
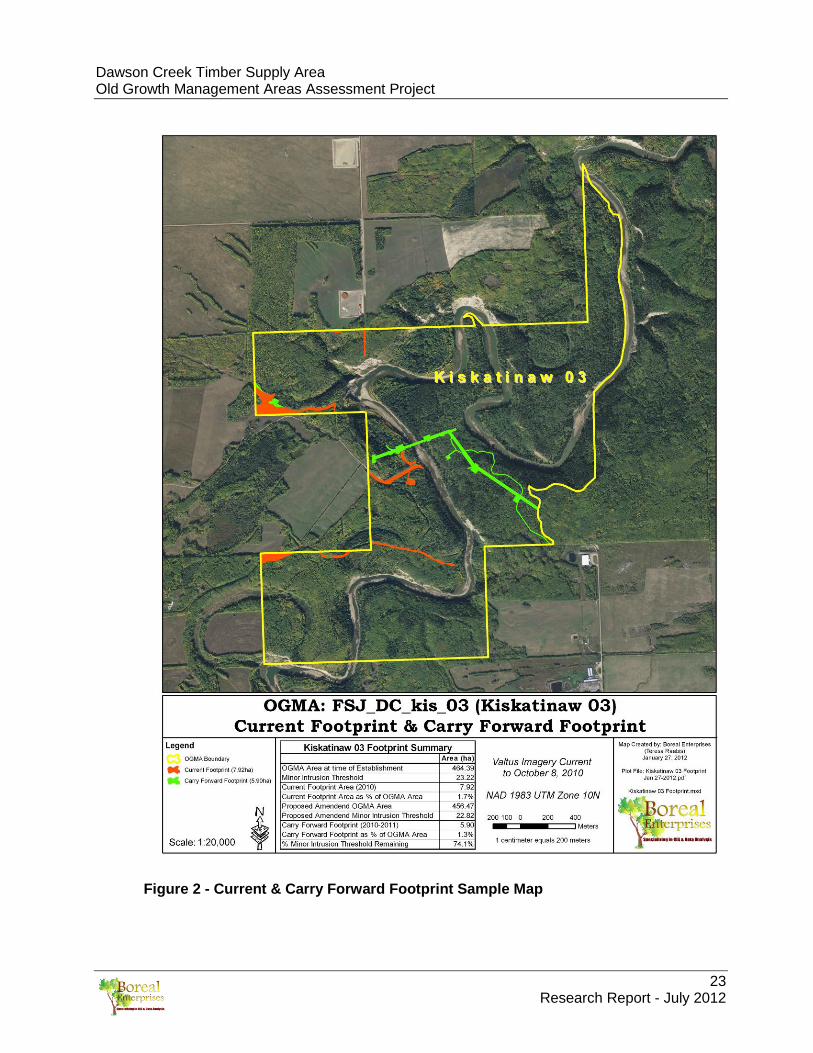
d) Current and Carry Forward Footprint Sample Map
Figure 2 represents a sample of the current and carry forward map that have been developed for each OGMA reviewed in this report. A complete complement of Current and Carry Forward Footprint maps can be found in Appendix X.
Dawson Creek Timber Supply Area Old Growth Management Areas Assessment Project
23 Research Report - July 2012
Figure 2 - Current & Carry Forward Footprint Sample Map

Dawson Creek Timber Supply Area Old Growth Management Areas Assessment Project
24 Research Report - July 2012
e) Spatial Data Implications This section outlines the different data sources that were available for this project, how the data sources were used in determining current footprint and the strengths and weakness of each data type.
i) Imagery Used for Footprint Determination
This section briefly outlines the different imagery used in this project. For more detailed information on the imagery please refer to Appendix III. • Valtus High Resolution Image Service
EnCana has access to purchased high resolution Imagery from Valtus Imagery Services. This data (VISTA British Columbia UTM 10 0.4m 2010) is current to October 8, 2010 and is accurate to 0.4m. This imagery covers (or partially covers) 120 OGMAs out of the 151 OGMAs that overlap with oil and gas tenures. There are six OGMAs that are adjacent to the BC Alberta border and in these cases, 2009 Valtus high resolution imagery (VISTA Alberta UTM 11 0.4m 2009) may be used in conjunction with the 2010 imagery.
• Spatial Energy High Resolution Imagery Apache, under their license agreement with Spatial Energy was able to provide additional high resolution imagery current to 2009. This imagery was monochromatic and the color ramp was adjusted to increase the contrast on the produced maps. This imagery covers (or partially covers) 17 OGMAs out of the 151 OGMAs that overlap with oil and gas tenures.
• Valtus Spot-5 Satellite Imagery
Spot-5 Satellite imagery was purchased by the partners from Valtus and is current to 2010. This imagery has a lower resolution of 2.5m but was still sufficient to determine the current footprint. The OGMA boundary plus a 100m buffer was used as the area when obtaining this final imagery. This imagery covers 17 OGMAs out of the 151 OGMAs that overlap with oil and gas tenures.
• GeoBase Low Resolution Imagery In a few instances, cloud cover on the high resolution imagery obscured the footprint. In these cases, low resolution orthro rectified imagery from GeoBase was used to confirm the footprint location. Notes on which OGMAs this imagery was used is included in Appendix IV. This imagery has a 10m resolution and is current from 2005-2010.
ii) OGC Data – Footprint Reference Data
The OGC spatial data is used only as a reference when digitizing the historical footprint. While the data is updated on a daily basis and includes data current since 2005, it only contains areas that were approved for development. Upon review of this spatial data to the high resolution imagery, it is evident that in some cases not all areas approved for development were built, and that some features are built in slightly different locations.
Dawson Creek Timber Supply Area Old Growth Management Areas Assessment Project
25 Research Report - July 2012
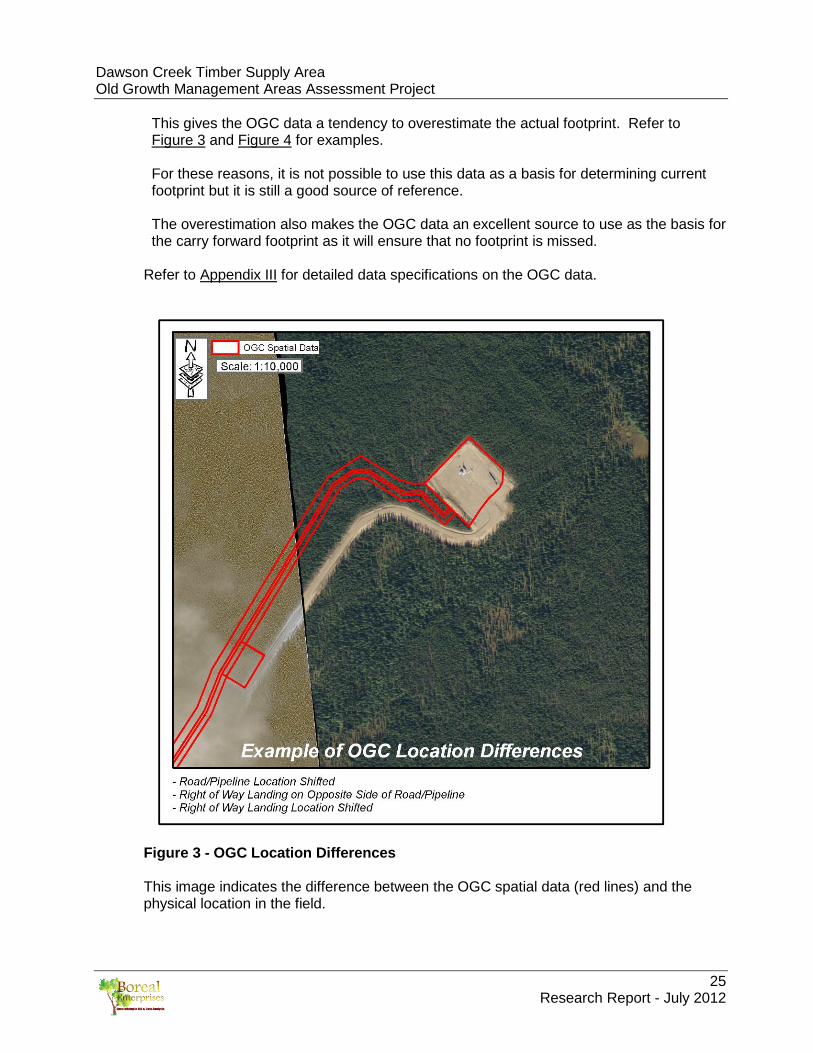
This gives the OGC data a tendency to overestimate the actual footprint. Refer to Figure 3 and Figure 4 for examples.
For these reasons, it is not possible to use this data as a basis for determining current footprint but it is still a good source of reference. The overestimation also makes the OGC data an excellent source to use as the basis for the carry forward footprint as it will ensure that no footprint is missed.
Refer to Appendix III for detailed data specifications on the OGC data.
Figure 3 - OGC Location Differences
This image indicates the difference between the OGC spatial data (red lines) and the physical location in the field.

Dawson Creek Timber Supply Area Old Growth Management Areas Assessment Project
26 Research Report - July 2012
Figure 4 - OGC Approved vs. Built Differences This image shows where a pipeline was directionally drilled under the watercourse. There is no footprint across this section, but the OGC data includes the area for approval purposes.
Dawson Creek Timber Supply Area Old Growth Management Areas Assessment Project
27 Research Report - July 2012
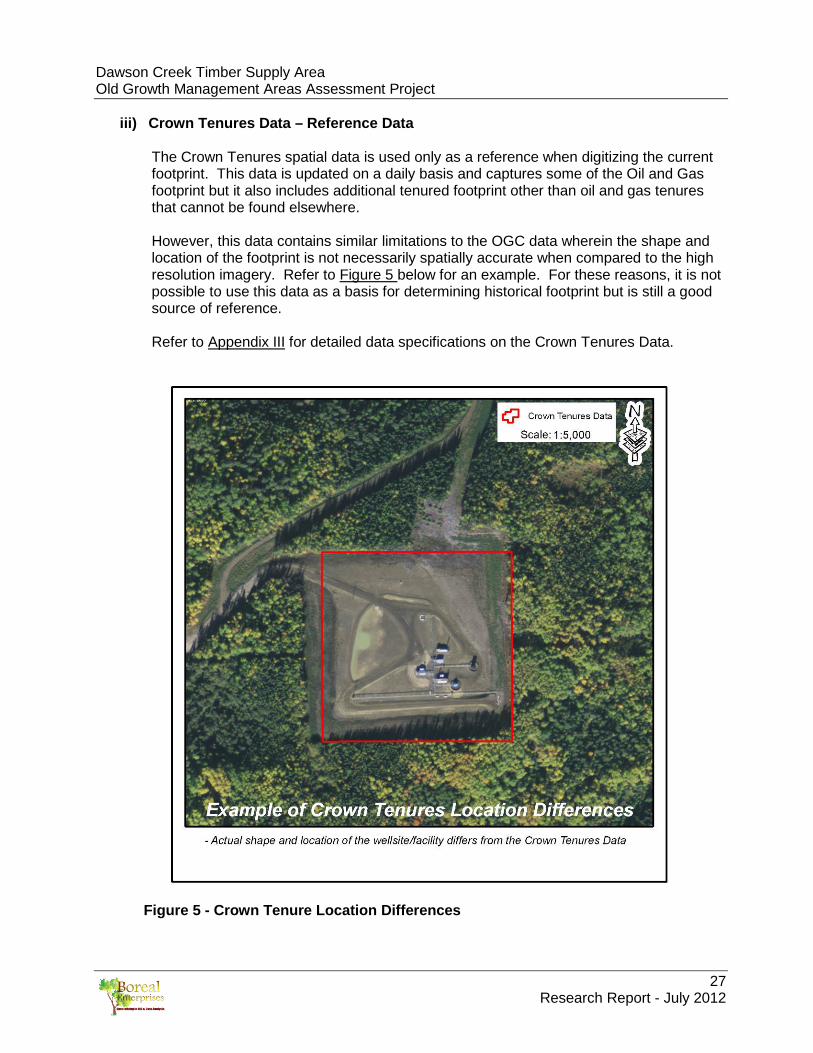
iii) Crown Tenures Data – Reference Data
The Crown Tenures spatial data is used only as a reference when digitizing the current footprint. This data is updated on a daily basis and captures some of the Oil and Gas footprint but it also includes additional tenured footprint other than oil and gas tenures that cannot be found elsewhere. However, this data contains similar limitations to the OGC data wherein the shape and location of the footprint is not necessarily spatially accurate when compared to the high resolution imagery. Refer to Figure 5 below for an example. For these reasons, it is not possible to use this data as a basis for determining historical footprint but is still a good source of reference. Refer to Appendix III for detailed data specifications on the Crown Tenures Data.
Figure 5 - Crown Tenure Location Differences
Dawson Creek Timber Supply Area Old Growth Management Areas Assessment Project
28 Research Report - July 2012
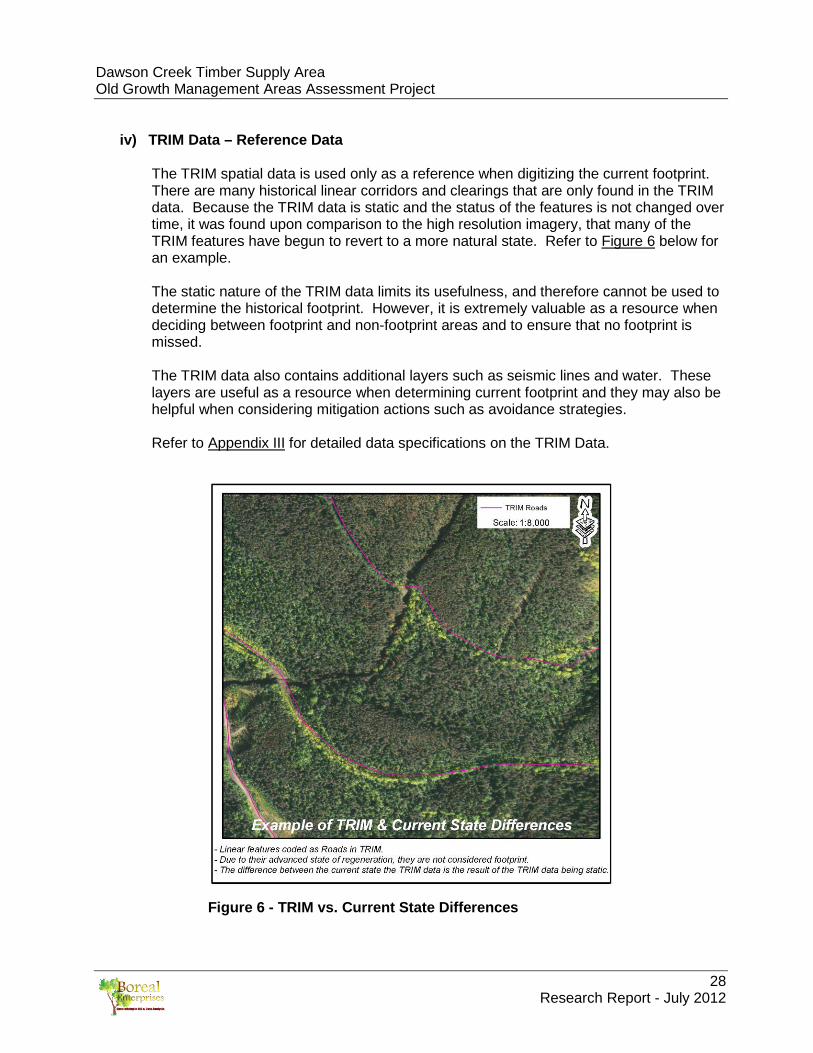
iv) TRIM Data – Reference Data
The TRIM spatial data is used only as a reference when digitizing the current footprint. There are many historical linear corridors and clearings that are only found in the TRIM data. Because the TRIM data is static and the status of the features is not changed over time, it was found upon comparison to the high resolution imagery, that many of the TRIM features have begun to revert to a more natural state. Refer to Figure 6 below for an example. The static nature of the TRIM data limits its usefulness, and therefore cannot be used to determine the historical footprint. However, it is extremely valuable as a resource when deciding between footprint and non-footprint areas and to ensure that no footprint is missed. The TRIM data also contains additional layers such as seismic lines and water. These layers are useful as a resource when determining current footprint and they may also be helpful when considering mitigation actions such as avoidance strategies. Refer to Appendix III for detailed data specifications on the TRIM Data.
Figure 6 - TRIM vs. Current State Differences
Dawson Creek Timber Supply Area Old Growth Management Areas Assessment Project
29 Research Report - July 2012
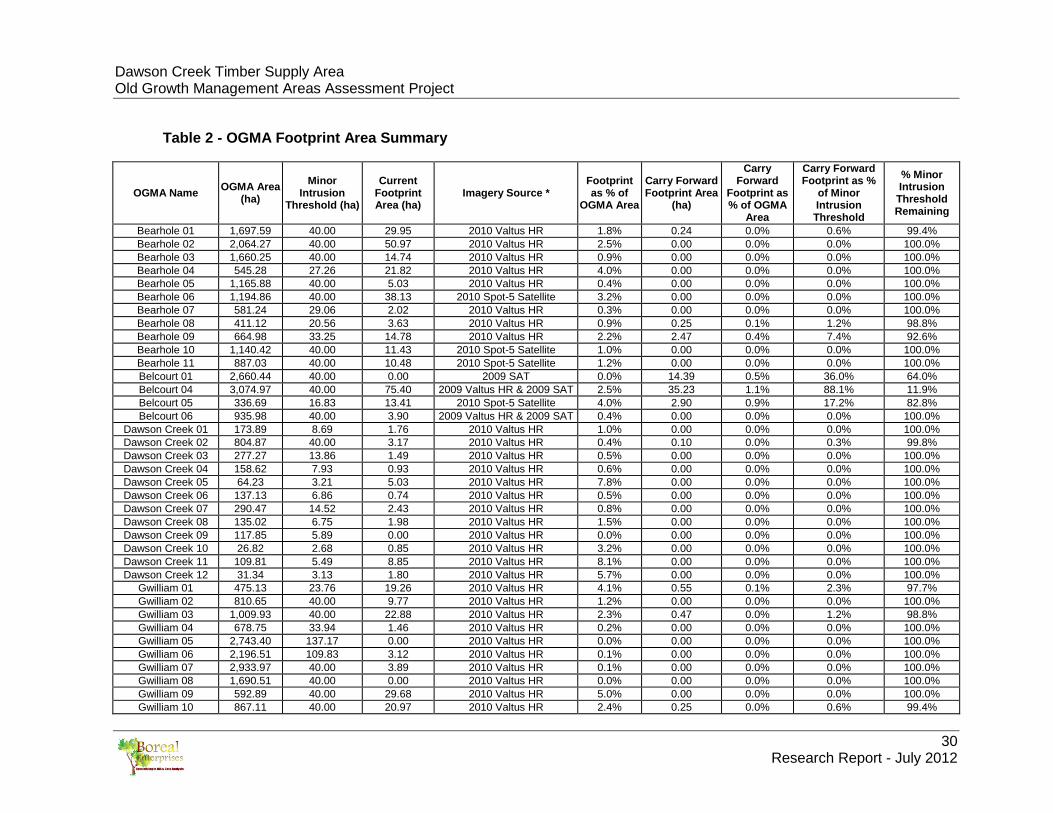
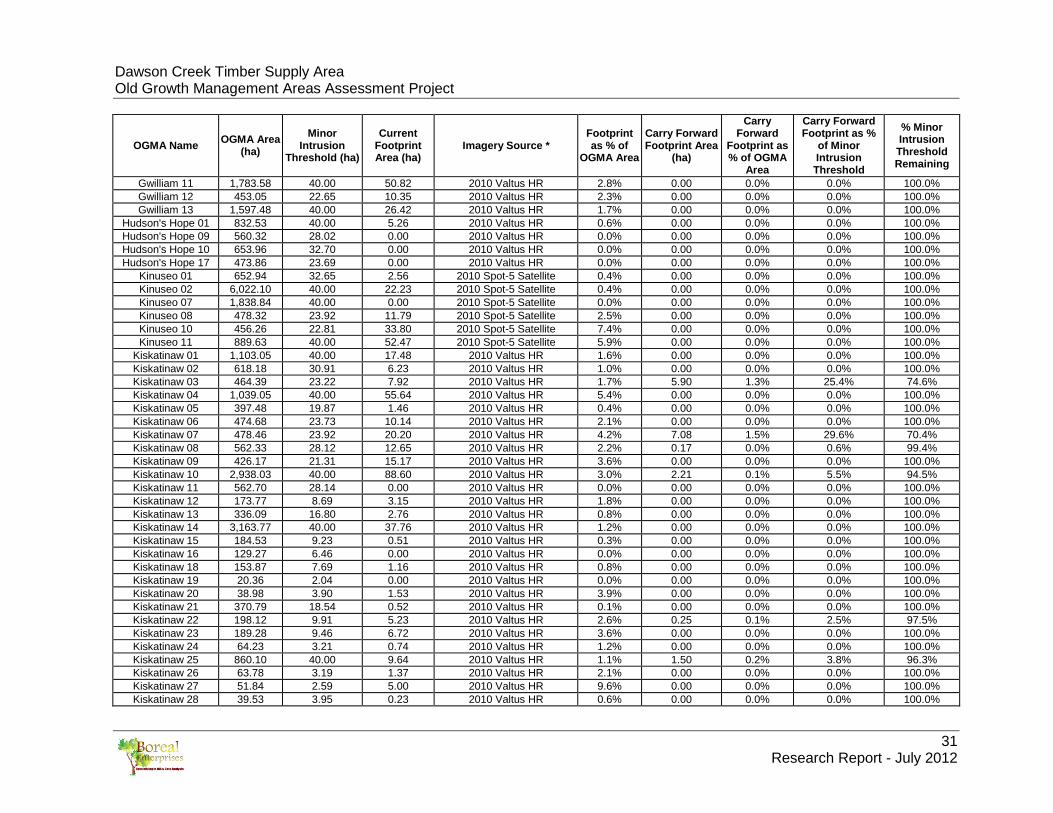
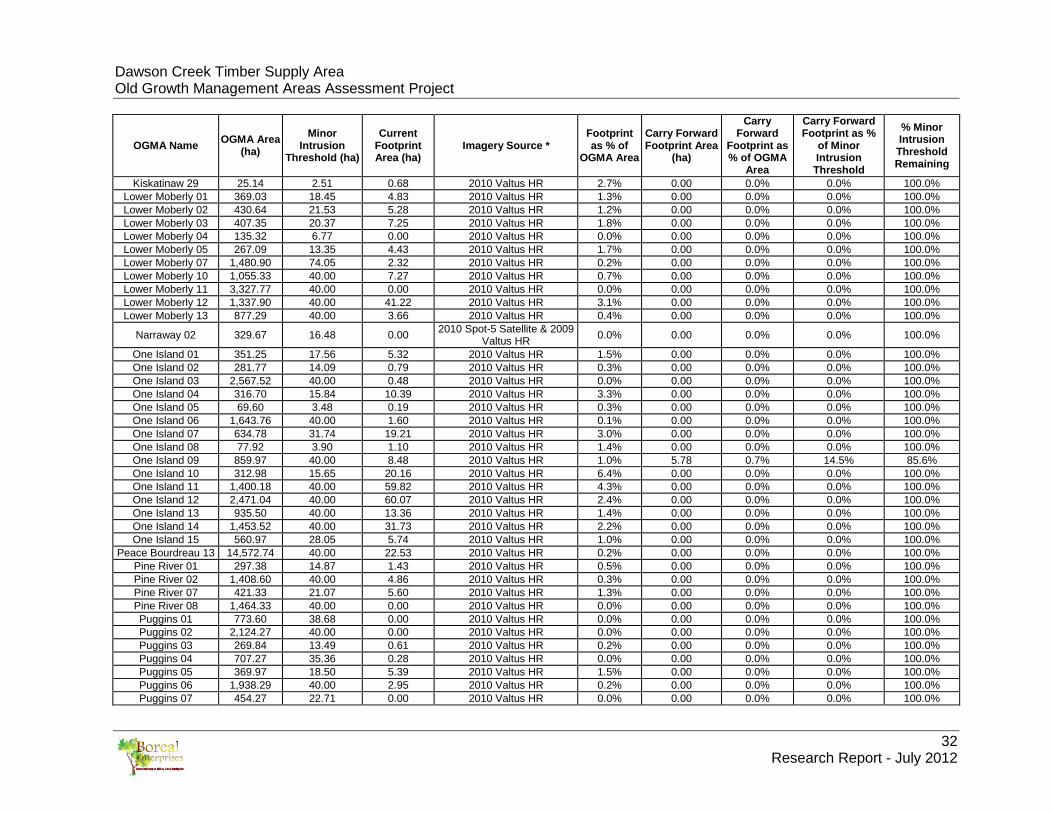
5.0 Current State of Footprint in OGMAs Table 2 summarizes the current footprint and the carry forward footprint on the 151 OGMAs evaluated in this project to date. For clarification purposes descriptions of the column contents are included:
• OGMA Area (ha) – Original OGMA area established under FRPA; Minor Intrusion Threshold (ha) – As per FRPA, the maximum allowable
disturbance within an OGMA prior to an amendment being required. Refer to Section 1.0 b);
Current Footprint Area (ha) – Current existing industrial disturbance established by manually digitizing from high resolution imagery. Refer to Section 4.0 b);
Imagery Source* - the year and the source of the imagery used to determine the current existing industrial disturbance. Refer to Section 4.0 e) i);
Footprint as a % of OGMA Area – The current footprint area represented as a percentage of the OGMA area;
Carry Forward Footprint Area (ha) – The total OGC footprint approved after the Year of Imagery used to determine the Current Footprint Area. Refer to Section 4.0 c);
Carry Forward Footprint as % of OGMA Area – The carry forward footprint area represented as a percentage of OGMA area;
Carry Forward Footprint as % of Minor Intrusion Threshold – The carry forward footprint area represented as a percentage of the minor intrusion threshold; and
% Minor Intrusion Threshold Remaining – the percentage of minor intrusion threshold still available for development after the carry forward footprint is considered.
Dawson Creek Timber Supply Area Old Growth Management Areas Assessment Project
30 Research Report - July 2012
Table 2 - OGMA Footprint Area Summary
OGMA Name OGMA Area (ha)
Minor Intrusion
Threshold (ha)
Current Footprint Area (ha)
Imagery Source * Footprint as % of
OGMA Area
Carry Forward Footprint Area
(ha)
Carry Forward
Footprint as % of OGMA
Area
Carry Forward Footprint as %
of Minor Intrusion Threshold
% Minor Intrusion Threshold Remaining
Bearhole 01 1,697.59 40.00 29.95 2010 Valtus HR 1.8% 0.24 0.0% 0.6% 99.4% Bearhole 02 2,064.27 40.00 50.97 2010 Valtus HR 2.5% 0.00 0.0% 0.0% 100.0% Bearhole 03 1,660.25 40.00 14.74 2010 Valtus HR 0.9% 0.00 0.0% 0.0% 100.0% Bearhole 04 545.28 27.26 21.82 2010 Valtus HR 4.0% 0.00 0.0% 0.0% 100.0% Bearhole 05 1,165.88 40.00 5.03 2010 Valtus HR 0.4% 0.00 0.0% 0.0% 100.0% Bearhole 06 1,194.86 40.00 38.13 2010 Spot-5 Satellite 3.2% 0.00 0.0% 0.0% 100.0% Bearhole 07 581.24 29.06 2.02 2010 Valtus HR 0.3% 0.00 0.0% 0.0% 100.0% Bearhole 08 411.12 20.56 3.63 2010 Valtus HR 0.9% 0.25 0.1% 1.2% 98.8% Bearhole 09 664.98 33.25 14.78 2010 Valtus HR 2.2% 2.47 0.4% 7.4% 92.6% Bearhole 10 1,140.42 40.00 11.43 2010 Spot-5 Satellite 1.0% 0.00 0.0% 0.0% 100.0% Bearhole 11 887.03 40.00 10.48 2010 Spot-5 Satellite 1.2% 0.00 0.0% 0.0% 100.0% Belcourt 01 2,660.44 40.00 0.00 2009 SAT 0.0% 14.39 0.5% 36.0% 64.0% Belcourt 04 3,074.97 40.00 75.40 2009 Valtus HR & 2009 SAT 2.5% 35.23 1.1% 88.1% 11.9% Belcourt 05 336.69 16.83 13.41 2010 Spot-5 Satellite 4.0% 2.90 0.9% 17.2% 82.8% Belcourt 06 935.98 40.00 3.90 2009 Valtus HR & 2009 SAT 0.4% 0.00 0.0% 0.0% 100.0%
Dawson Creek 01 173.89 8.69 1.76 2010 Valtus HR 1.0% 0.00 0.0% 0.0% 100.0% Dawson Creek 02 804.87 40.00 3.17 2010 Valtus HR 0.4% 0.10 0.0% 0.3% 99.8% Dawson Creek 03 277.27 13.86 1.49 2010 Valtus HR 0.5% 0.00 0.0% 0.0% 100.0% Dawson Creek 04 158.62 7.93 0.93 2010 Valtus HR 0.6% 0.00 0.0% 0.0% 100.0% Dawson Creek 05 64.23 3.21 5.03 2010 Valtus HR 7.8% 0.00 0.0% 0.0% 100.0% Dawson Creek 06 137.13 6.86 0.74 2010 Valtus HR 0.5% 0.00 0.0% 0.0% 100.0% Dawson Creek 07 290.47 14.52 2.43 2010 Valtus HR 0.8% 0.00 0.0% 0.0% 100.0% Dawson Creek 08 135.02 6.75 1.98 2010 Valtus HR 1.5% 0.00 0.0% 0.0% 100.0% Dawson Creek 09 117.85 5.89 0.00 2010 Valtus HR 0.0% 0.00 0.0% 0.0% 100.0% Dawson Creek 10 26.82 2.68 0.85 2010 Valtus HR 3.2% 0.00 0.0% 0.0% 100.0% Dawson Creek 11 109.81 5.49 8.85 2010 Valtus HR 8.1% 0.00 0.0% 0.0% 100.0% Dawson Creek 12 31.34 3.13 1.80 2010 Valtus HR 5.7% 0.00 0.0% 0.0% 100.0%
Gwilliam 01 475.13 23.76 19.26 2010 Valtus HR 4.1% 0.55 0.1% 2.3% 97.7% Gwilliam 02 810.65 40.00 9.77 2010 Valtus HR 1.2% 0.00 0.0% 0.0% 100.0% Gwilliam 03 1,009.93 40.00 22.88 2010 Valtus HR 2.3% 0.47 0.0% 1.2% 98.8% Gwilliam 04 678.75 33.94 1.46 2010 Valtus HR 0.2% 0.00 0.0% 0.0% 100.0% Gwilliam 05 2,743.40 137.17 0.00 2010 Valtus HR 0.0% 0.00 0.0% 0.0% 100.0% Gwilliam 06 2,196.51 109.83 3.12 2010 Valtus HR 0.1% 0.00 0.0% 0.0% 100.0% Gwilliam 07 2,933.97 40.00 3.89 2010 Valtus HR 0.1% 0.00 0.0% 0.0% 100.0% Gwilliam 08 1,690.51 40.00 0.00 2010 Valtus HR 0.0% 0.00 0.0% 0.0% 100.0% Gwilliam 09 592.89 40.00 29.68 2010 Valtus HR 5.0% 0.00 0.0% 0.0% 100.0% Gwilliam 10 867.11 40.00 20.97 2010 Valtus HR 2.4% 0.25 0.0% 0.6% 99.4%
Dawson Creek Timber Supply Area Old Growth Management Areas Assessment Project
31 Research Report - July 2012
OGMA Name OGMA Area (ha)
Minor Intrusion
Threshold (ha)
Current Footprint Area (ha)
Imagery Source * Footprint as % of
OGMA Area
Carry Forward Footprint Area
(ha)
Carry Forward
Footprint as % of OGMA
Area
Carry Forward Footprint as %
of Minor Intrusion Threshold
% Minor Intrusion Threshold Remaining
Gwilliam 11 1,783.58 40.00 50.82 2010 Valtus HR 2.8% 0.00 0.0% 0.0% 100.0% Gwilliam 12 453.05 22.65 10.35 2010 Valtus HR 2.3% 0.00 0.0% 0.0% 100.0% Gwilliam 13 1,597.48 40.00 26.42 2010 Valtus HR 1.7% 0.00 0.0% 0.0% 100.0%
Hudson's Hope 01 832.53 40.00 5.26 2010 Valtus HR 0.6% 0.00 0.0% 0.0% 100.0% Hudson's Hope 09 560.32 28.02 0.00 2010 Valtus HR 0.0% 0.00 0.0% 0.0% 100.0% Hudson's Hope 10 653.96 32.70 0.00 2010 Valtus HR 0.0% 0.00 0.0% 0.0% 100.0% Hudson's Hope 17 473.86 23.69 0.00 2010 Valtus HR 0.0% 0.00 0.0% 0.0% 100.0%
Kinuseo 01 652.94 32.65 2.56 2010 Spot-5 Satellite 0.4% 0.00 0.0% 0.0% 100.0% Kinuseo 02 6,022.10 40.00 22.23 2010 Spot-5 Satellite 0.4% 0.00 0.0% 0.0% 100.0% Kinuseo 07 1,838.84 40.00 0.00 2010 Spot-5 Satellite 0.0% 0.00 0.0% 0.0% 100.0% Kinuseo 08 478.32 23.92 11.79 2010 Spot-5 Satellite 2.5% 0.00 0.0% 0.0% 100.0% Kinuseo 10 456.26 22.81 33.80 2010 Spot-5 Satellite 7.4% 0.00 0.0% 0.0% 100.0% Kinuseo 11 889.63 40.00 52.47 2010 Spot-5 Satellite 5.9% 0.00 0.0% 0.0% 100.0%
Kiskatinaw 01 1,103.05 40.00 17.48 2010 Valtus HR 1.6% 0.00 0.0% 0.0% 100.0% Kiskatinaw 02 618.18 30.91 6.23 2010 Valtus HR 1.0% 0.00 0.0% 0.0% 100.0% Kiskatinaw 03 464.39 23.22 7.92 2010 Valtus HR 1.7% 5.90 1.3% 25.4% 74.6% Kiskatinaw 04 1,039.05 40.00 55.64 2010 Valtus HR 5.4% 0.00 0.0% 0.0% 100.0% Kiskatinaw 05 397.48 19.87 1.46 2010 Valtus HR 0.4% 0.00 0.0% 0.0% 100.0% Kiskatinaw 06 474.68 23.73 10.14 2010 Valtus HR 2.1% 0.00 0.0% 0.0% 100.0% Kiskatinaw 07 478.46 23.92 20.20 2010 Valtus HR 4.2% 7.08 1.5% 29.6% 70.4% Kiskatinaw 08 562.33 28.12 12.65 2010 Valtus HR 2.2% 0.17 0.0% 0.6% 99.4% Kiskatinaw 09 426.17 21.31 15.17 2010 Valtus HR 3.6% 0.00 0.0% 0.0% 100.0% Kiskatinaw 10 2,938.03 40.00 88.60 2010 Valtus HR 3.0% 2.21 0.1% 5.5% 94.5% Kiskatinaw 11 562.70 28.14 0.00 2010 Valtus HR 0.0% 0.00 0.0% 0.0% 100.0% Kiskatinaw 12 173.77 8.69 3.15 2010 Valtus HR 1.8% 0.00 0.0% 0.0% 100.0% Kiskatinaw 13 336.09 16.80 2.76 2010 Valtus HR 0.8% 0.00 0.0% 0.0% 100.0% Kiskatinaw 14 3,163.77 40.00 37.76 2010 Valtus HR 1.2% 0.00 0.0% 0.0% 100.0% Kiskatinaw 15 184.53 9.23 0.51 2010 Valtus HR 0.3% 0.00 0.0% 0.0% 100.0% Kiskatinaw 16 129.27 6.46 0.00 2010 Valtus HR 0.0% 0.00 0.0% 0.0% 100.0% Kiskatinaw 18 153.87 7.69 1.16 2010 Valtus HR 0.8% 0.00 0.0% 0.0% 100.0% Kiskatinaw 19 20.36 2.04 0.00 2010 Valtus HR 0.0% 0.00 0.0% 0.0% 100.0% Kiskatinaw 20 38.98 3.90 1.53 2010 Valtus HR 3.9% 0.00 0.0% 0.0% 100.0% Kiskatinaw 21 370.79 18.54 0.52 2010 Valtus HR 0.1% 0.00 0.0% 0.0% 100.0% Kiskatinaw 22 198.12 9.91 5.23 2010 Valtus HR 2.6% 0.25 0.1% 2.5% 97.5% Kiskatinaw 23 189.28 9.46 6.72 2010 Valtus HR 3.6% 0.00 0.0% 0.0% 100.0% Kiskatinaw 24 64.23 3.21 0.74 2010 Valtus HR 1.2% 0.00 0.0% 0.0% 100.0% Kiskatinaw 25 860.10 40.00 9.64 2010 Valtus HR 1.1% 1.50 0.2% 3.8% 96.3% Kiskatinaw 26 63.78 3.19 1.37 2010 Valtus HR 2.1% 0.00 0.0% 0.0% 100.0% Kiskatinaw 27 51.84 2.59 5.00 2010 Valtus HR 9.6% 0.00 0.0% 0.0% 100.0% Kiskatinaw 28 39.53 3.95 0.23 2010 Valtus HR 0.6% 0.00 0.0% 0.0% 100.0%
Dawson Creek Timber Supply Area Old Growth Management Areas Assessment Project
32 Research Report - July 2012
OGMA Name OGMA Area (ha)
Minor Intrusion
Threshold (ha)
Current Footprint Area (ha)
Imagery Source * Footprint as % of
OGMA Area
Carry Forward Footprint Area
(ha)
Carry Forward
Footprint as % of OGMA
Area
Carry Forward Footprint as %
of Minor Intrusion Threshold
% Minor Intrusion Threshold Remaining
Kiskatinaw 29 25.14 2.51 0.68 2010 Valtus HR 2.7% 0.00 0.0% 0.0% 100.0% Lower Moberly 01 369.03 18.45 4.83 2010 Valtus HR 1.3% 0.00 0.0% 0.0% 100.0% Lower Moberly 02 430.64 21.53 5.28 2010 Valtus HR 1.2% 0.00 0.0% 0.0% 100.0% Lower Moberly 03 407.35 20.37 7.25 2010 Valtus HR 1.8% 0.00 0.0% 0.0% 100.0% Lower Moberly 04 135.32 6.77 0.00 2010 Valtus HR 0.0% 0.00 0.0% 0.0% 100.0% Lower Moberly 05 267.09 13.35 4.43 2010 Valtus HR 1.7% 0.00 0.0% 0.0% 100.0% Lower Moberly 07 1,480.90 74.05 2.32 2010 Valtus HR 0.2% 0.00 0.0% 0.0% 100.0% Lower Moberly 10 1,055.33 40.00 7.27 2010 Valtus HR 0.7% 0.00 0.0% 0.0% 100.0% Lower Moberly 11 3,327.77 40.00 0.00 2010 Valtus HR 0.0% 0.00 0.0% 0.0% 100.0% Lower Moberly 12 1,337.90 40.00 41.22 2010 Valtus HR 3.1% 0.00 0.0% 0.0% 100.0% Lower Moberly 13 877.29 40.00 3.66 2010 Valtus HR 0.4% 0.00 0.0% 0.0% 100.0%
Narraway 02 329.67 16.48 0.00 2010 Spot-5 Satellite & 2009 Valtus HR 0.0% 0.00 0.0% 0.0% 100.0%
One Island 01 351.25 17.56 5.32 2010 Valtus HR 1.5% 0.00 0.0% 0.0% 100.0% One Island 02 281.77 14.09 0.79 2010 Valtus HR 0.3% 0.00 0.0% 0.0% 100.0% One Island 03 2,567.52 40.00 0.48 2010 Valtus HR 0.0% 0.00 0.0% 0.0% 100.0% One Island 04 316.70 15.84 10.39 2010 Valtus HR 3.3% 0.00 0.0% 0.0% 100.0% One Island 05 69.60 3.48 0.19 2010 Valtus HR 0.3% 0.00 0.0% 0.0% 100.0% One Island 06 1,643.76 40.00 1.60 2010 Valtus HR 0.1% 0.00 0.0% 0.0% 100.0% One Island 07 634.78 31.74 19.21 2010 Valtus HR 3.0% 0.00 0.0% 0.0% 100.0% One Island 08 77.92 3.90 1.10 2010 Valtus HR 1.4% 0.00 0.0% 0.0% 100.0% One Island 09 859.97 40.00 8.48 2010 Valtus HR 1.0% 5.78 0.7% 14.5% 85.6% One Island 10 312.98 15.65 20.16 2010 Valtus HR 6.4% 0.00 0.0% 0.0% 100.0% One Island 11 1,400.18 40.00 59.82 2010 Valtus HR 4.3% 0.00 0.0% 0.0% 100.0% One Island 12 2,471.04 40.00 60.07 2010 Valtus HR 2.4% 0.00 0.0% 0.0% 100.0% One Island 13 935.50 40.00 13.36 2010 Valtus HR 1.4% 0.00 0.0% 0.0% 100.0% One Island 14 1,453.52 40.00 31.73 2010 Valtus HR 2.2% 0.00 0.0% 0.0% 100.0% One Island 15 560.97 28.05 5.74 2010 Valtus HR 1.0% 0.00 0.0% 0.0% 100.0%
Peace Bourdreau 13 14,572.74 40.00 22.53 2010 Valtus HR 0.2% 0.00 0.0% 0.0% 100.0% Pine River 01 297.38 14.87 1.43 2010 Valtus HR 0.5% 0.00 0.0% 0.0% 100.0% Pine River 02 1,408.60 40.00 4.86 2010 Valtus HR 0.3% 0.00 0.0% 0.0% 100.0% Pine River 07 421.33 21.07 5.60 2010 Valtus HR 1.3% 0.00 0.0% 0.0% 100.0% Pine River 08 1,464.33 40.00 0.00 2010 Valtus HR 0.0% 0.00 0.0% 0.0% 100.0% Puggins 01 773.60 38.68 0.00 2010 Valtus HR 0.0% 0.00 0.0% 0.0% 100.0% Puggins 02 2,124.27 40.00 0.00 2010 Valtus HR 0.0% 0.00 0.0% 0.0% 100.0% Puggins 03 269.84 13.49 0.61 2010 Valtus HR 0.2% 0.00 0.0% 0.0% 100.0% Puggins 04 707.27 35.36 0.28 2010 Valtus HR 0.0% 0.00 0.0% 0.0% 100.0% Puggins 05 369.97 18.50 5.39 2010 Valtus HR 1.5% 0.00 0.0% 0.0% 100.0% Puggins 06 1,938.29 40.00 2.95 2010 Valtus HR 0.2% 0.00 0.0% 0.0% 100.0% Puggins 07 454.27 22.71 0.00 2010 Valtus HR 0.0% 0.00 0.0% 0.0% 100.0%

Dawson Creek Timber Supply Area Old Growth Management Areas Assessment Project
33 Research Report - July 2012
OGMA Name OGMA Area (ha)
Minor Intrusion
Threshold (ha)
Current Footprint Area (ha)
Imagery Source * Footprint as % of
OGMA Area
Carry Forward Footprint Area
(ha)
Carry Forward
Footprint as % of OGMA
Area
Carry Forward Footprint as %
of Minor Intrusion Threshold
% Minor Intrusion Threshold Remaining
Puggins 08 188.58 9.43 0.00 2010 Valtus HR 0.0% 0.00 0.0% 0.0% 100.0% Puggins 09 248.45 12.42 0.58 2010 Valtus HR 0.2% 0.00 0.0% 0.0% 100.0% Puggins 10 702.06 35.10 3.84 2010 Valtus HR 0.5% 0.00 0.0% 0.0% 100.0% Puggins 12 355.83 17.79 0.00 2010 Valtus HR 0.0% 0.00 0.0% 0.0% 100.0%
Redwillow 01 197.02 9.85 4.95 2010 Valtus HR 2.5% 0.45 0.2% 4.6% 95.4% Redwillow 02 204.07 10.20 2.69 2010 Valtus HR 1.3% 0.00 0.0% 0.0% 100.0% Redwillow 03 287.47 14.37 2.58 2010 Valtus HR 0.9% 0.00 0.0% 0.0% 100.0% Redwillow 04 1,054.72 40.00 12.12 2010 Spot-5 Satellite 1.1% 0.00 0.0% 0.0% 100.0% Redwillow 05 3,758.79 40.00 7.65 2010 Spot-5 Satellite 0.2% 0.00 0.0% 0.0% 100.0% Redwillow 06 1,999.25 40.00 18.52 2009 Valtus HR & 2009 SAT 0.9% 0.00 0.0% 0.0% 100.0% Redwillow 07 533.13 26.66 4.61 2009 Valtus HR & 2009 SAT 0.9% 0.00 0.0% 0.0% 100.0% Redwillow 08 2,486.69 40.00 0.00 2009 SAT 0.0% 0.00 0.0% 0.0% 100.0% Redwillow 09 1,396.85 40.00 22.99 2010 Spot-5 Satellite 1.6% 0.00 0.0% 0.0% 100.0% Redwillow 10 774.33 38.72 24.00 2010 Spot-5 Satellite 3.1% 0.00 0.0% 0.0% 100.0% Septimus 02 401.78 20.09 1.10 2010 Valtus HR 0.3% 0.00 0.0% 0.0% 100.0% Septimus 03 1,590.12 40.00 51.66 2010 Valtus HR 3.2% 8.80 0.6% 22.0% 78.0% Septimus 04 1,777.92 40.00 0.33 2010 Valtus HR 0.0% 6.59 0.4% 16.5% 83.5%
Upper Moberly 11 355.43 17.77 0.00 2010 Valtus HR 0.0% 0.00 0.0% 0.0% 100.0% Upper Moberly 14 70.59 3.53 0.00 2010 Valtus HR 0.0% 0.00 0.0% 0.0% 100.0% Upper Moberly 19 1,880.77 40.00 28.74 2010 Valtus HR 1.5% 0.00 0.0% 0.0% 100.0% Upper Moberly 27 4,437.72 40.00 14.00 2010 Valtus HR 0.3% 0.00 0.0% 0.0% 100.0% Upper Moberly 29 138.38 6.92 0.00 2010 Valtus HR 0.0% 0.00 0.0% 0.0% 100.0% Upper Sukunka 10 719.12 35.96 0.37 2010 Valtus HR 0.1% 0.00 0.0% 0.0% 100.0%
Wapiti 01 317.41 15.87 1.88 2009 SAT 0.6% 0.00 0.0% 0.0% 100.0% Wapiti 02 275.49 13.77 3.84 2009 SAT 1.4% 0.00 0.0% 0.0% 100.0% Wapiti 03 2,474.39 40.00 0.46 2009 Valtus HR & 2009 SAT 0.0% 0.28 0.0% 0.7% 99.3% Wapiti 04 1,089.35 40.00 6.25 2009 SAT 0.6% 0.00 0.0% 0.0% 100.0% Wapiti 05 3,668.02 40.00 1.64 2009 Valtus HR & 2009 SAT 0.0% 0.00 0.0% 0.0% 100.0% Wapiti 06 1,446.43 40.00 69.46 2010 Spot-5 Satellite 4.8% 0.00 0.0% 0.0% 100.0% Wapiti 07 929.96 40.00 9.72 2009 SAT 1.0% 0.00 0.0% 0.0% 100.0% Wapiti 08 1,999.84 40.00 1.38 2009 SAT 0.1% 0.76 0.0% 1.9% 98.1%
Wapiti 09 1,223.99 40.00 0.00 2009 SAT & 2010 Spot-5 Satellite 0.0% 0.00 0.0% 0.0% 100.0%
Wapiti 10 1,348.27 40.00 13.35 2009 SAT 1.0% 5.20 0.4% 13.0% 87.0% Wapiti 11 1,573.20 40.00 23.75 2009 Valtus HR & 2009 SAT 1.5% 0.00 0.0% 0.0% 100.0% Wapiti 12 1,531.57 40.00 4.46 2009 SAT 0.3% 8.32 0.5% 20.8% 79.2%
159,362.66
1,659.21 1.041% 110.14 0.069%
* HR = High Resolution Imagery Used * SAT = Satellite Imagery Used

Dawson Creek Timber Supply Area Old Growth Management Areas Assessment Project
34 Research Report - July 2012
6.0 Footprint Development Scenarios These footprint development scenarios are a hypothetical assessment of the possible implications of applying the existing FRPA direction to oil and gas developments. The OGMAs selected are not indicative of typical development within OGMAs; they were selected due to the significant levels of historic and/or ongoing development. Furthermore, the scenarios are not intended to be an accurate representation of how footprint may actually be assessed by OGC and/or as subject to the EPMR, but rather an illustration of the potential “worst case scenario” of development within the OGMAs. The development scenarios were completed on three test OGMAs: Belcourt 04, One Island 11 and Septimus 03. The same process was used for all three OGMAs to analyze cumulative industrial footprint over time and to evaluate the viability of the current OGMA requirements around material adverse affect and minor intrusion thresholds. The yearly disturbance and the total cumulative disturbance resulting from this process is for representation purposes only and may or may not reflect the actual footprint and/or year of development.
a) Scenario Assumptions: • OGMA modification process around minor intrusion threshold as per the
FRPA Order: Provided the disturbance to the gross OGMA area does not exceed:
(a) 10% in OGMAs less than 50 hectares; or (b) 5% or 40 hectares, whichever is less, in OGMAs of 50 hectares or greater
• No industrial development on OGMA at time of OGMA establishment; • OGMA establishment year is Year 0 (zero) of the scenario; • All spatial footprint used is considered correct and complete; • Year of disturbance is derived from the approval date in the OGC spatial data
and it is assumed that the disturbance occurs in the same year it was approved;
• For polygons that were derived from data other than the OGC spatial data, the year of disturbance was manually assigned based on adjacent footprint polygons;
• There is no footprint overlap within each year or between years; and • When the minor intrusion threshold is exceeded, it is assumed that the OGMA
is amended to remove the footprint and a new OGMA area is established in order to reset the minor intrusion threshold to zero. Refer to Section 2.0 b)ii) and Section 2.0 b)iii) for background on the FRPA amendment process.
b) Scenario Footprint Data Sources:
i) OGC Data In order to assign a timeline to the footprint, the OGC data was used since it was the only spatial data to contain a date (approval date). Polygons from pipelines, ancillary, wellsites and facilities were the used and categorized into yearly disturbance based on the approval date year.
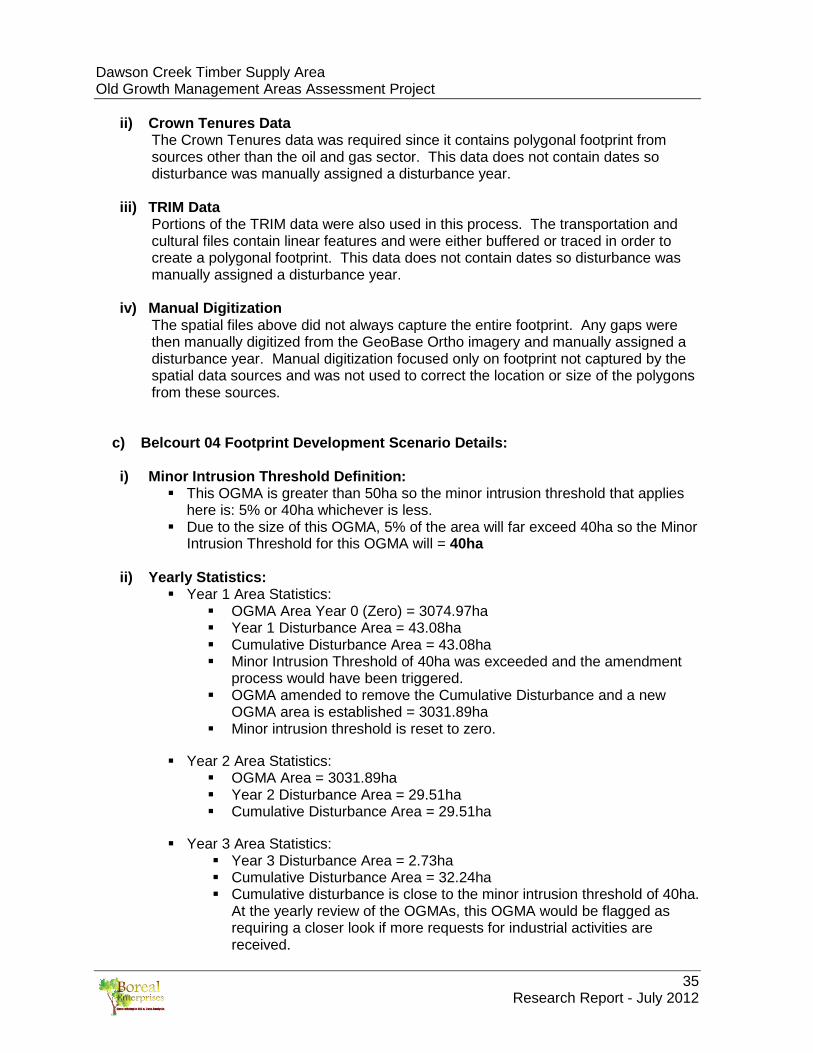
Dawson Creek Timber Supply Area Old Growth Management Areas Assessment Project
35 Research Report - July 2012
ii) Crown Tenures Data The Crown Tenures data was required since it contains polygonal footprint from sources other than the oil and gas sector. This data does not contain dates so disturbance was manually assigned a disturbance year.
iii) TRIM Data
Portions of the TRIM data were also used in this process. The transportation and cultural files contain linear features and were either buffered or traced in order to create a polygonal footprint. This data does not contain dates so disturbance was manually assigned a disturbance year.
iv) Manual Digitization
The spatial files above did not always capture the entire footprint. Any gaps were then manually digitized from the GeoBase Ortho imagery and manually assigned a disturbance year. Manual digitization focused only on footprint not captured by the spatial data sources and was not used to correct the location or size of the polygons from these sources.
c) Belcourt 04 Footprint Development Scenario Details:
i) Minor Intrusion Threshold Definition: This OGMA is greater than 50ha so the minor intrusion threshold that applies
here is: 5% or 40ha whichever is less. Due to the size of this OGMA, 5% of the area will far exceed 40ha so the Minor
Intrusion Threshold for this OGMA will = 40ha
ii) Yearly Statistics: Year 1 Area Statistics:
OGMA Area Year 0 (Zero) = 3074.97ha Year 1 Disturbance Area = 43.08ha Cumulative Disturbance Area = 43.08ha Minor Intrusion Threshold of 40ha was exceeded and the amendment
process would have been triggered. OGMA amended to remove the Cumulative Disturbance and a new
OGMA area is established = 3031.89ha Minor intrusion threshold is reset to zero.
Year 2 Area Statistics:
OGMA Area = 3031.89ha Year 2 Disturbance Area = 29.51ha Cumulative Disturbance Area = 29.51ha
Year 3 Area Statistics:
Year 3 Disturbance Area = 2.73ha Cumulative Disturbance Area = 32.24ha Cumulative disturbance is close to the minor intrusion threshold of 40ha.
At the yearly review of the OGMAs, this OGMA would be flagged as requiring a closer look if more requests for industrial activities are received.

Dawson Creek Timber Supply Area Old Growth Management Areas Assessment Project
36 Research Report - July 2012
Year 4 Area Statistics:
Year 4 Disturbance Area = 30.90ha Cumulative Disturbance Area = 63.14ha Minor Intrusion Threshold of 40ha was exceeded and the amendment
process would have been triggered. OGMA amended to remove the Cumulative Disturbance and a new
OGMA are is established = 2968.75ha Minor intrusion threshold is reset to zero.
Year 5 Area Statistics: OGMA Area = 2968.75ha Year 5 Disturbance Area = 2.36ha Cumulative Disturbance Area = 2.36ha
iii) Results:
Total cumulative disturbance area over 5 years = 108.15ha The cumulative industrial footprint area in Year 2 is close to the Minor Intrusion
Threshold and would have flagged this OGMA during the yearly review process as requiring a closer look if more requests for industrial activities are received.
Minor Intrusion Threshold would have been exceeded twice in this scenario, in Year 1 and again in Year 4. As a result, the amendment process would have been required twice over a 5 year period.
iv) Discussion: In this scenario the level of development in year one and year four would have
triggered an amendment review. The current FRPA review process allows for several options in the amendment process; including deletion of the footprint area, as per this scenario. Major amendments to the OGMA polygon and/or relocation of the OGMA are other possible options. In all cases all industrial tenure holders would have opportunity for input and review prior to final amendments.
Due to the high level of industrial footprint in this OGMA and the fragmentation of the OGMA, it is likely that the first amendment process in year 1 would have suggested a boundary change rather than a simple footprint removal.
Major amendments are discussed further in Section 7.0 e) and in Section 2.0 b)iii).
Figure 7 depicts the footprint progression by year and summarizes some of the yearly statistics.
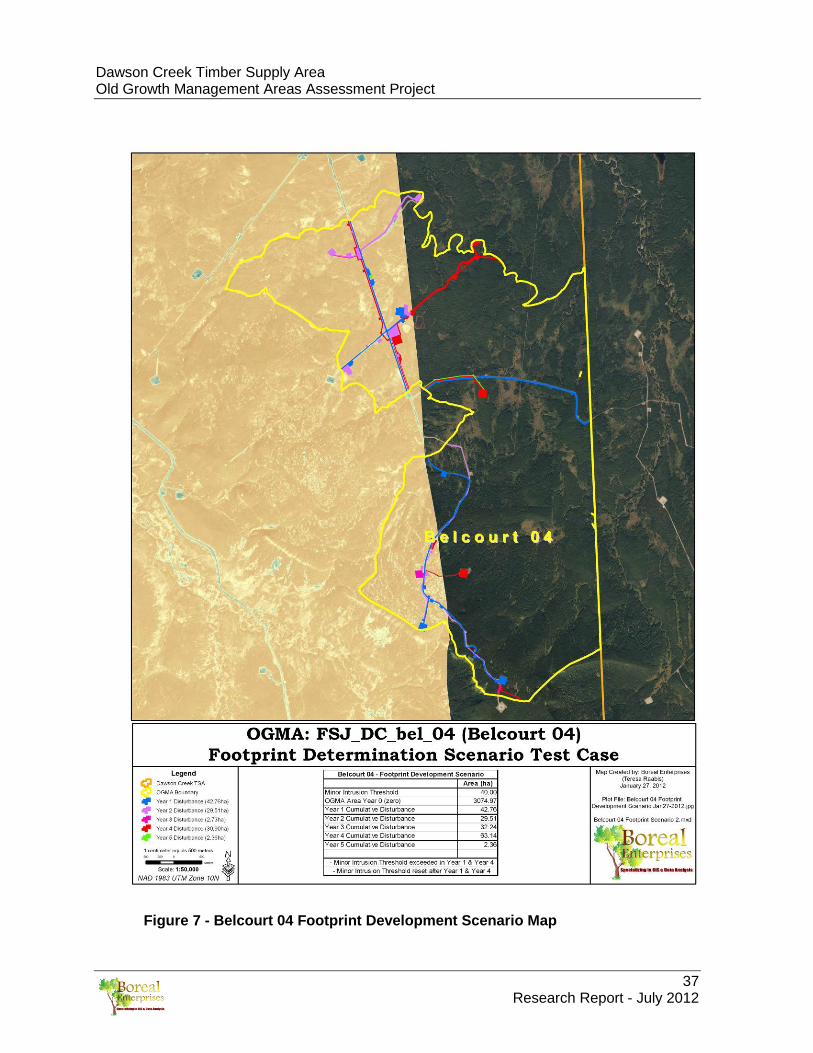
Dawson Creek Timber Supply Area Old Growth Management Areas Assessment Project
37 Research Report - July 2012
Figure 7 - Belcourt 04 Footprint Development Scenario Map
Dawson Creek Timber Supply Area Old Growth Management Areas Assessment Project
38 Research Report - July 2012
d) One Island 11: Footprint Development Scenario Details
i) Minor Intrusion Threshold Definition:
This OGMA is greater than 50ha so the minor intrusion clause that applies here is: 5% or 40ha whichever is less.
Due to the size of this OGMA, 5% of the area exceeds 40ha so the Minor Intrusion Threshold for this OGMA will = 40ha.
ii) Yearly Statistics:
Year 1 Area Statistics: OGMA Area Year 0 (Zero) = 1400.18ha Year 1 Disturbance Area = 10.65ha Cumulative Disturbance Area = 10.65ha
Year 2 Area Statistics:
Year 2 Disturbance Area = 21.53ha Cumulative Disturbance Area = 32.18ha Cumulative disturbance is close to the minor intrusion threshold of 40ha.
At the yearly review of the OGMAs, this OGMA would be flagged as requiring a closer look if more requests for industrial activities are received.
Year 3 Area Statistics:
Year 3 Disturbance Area = 25.91ha Cumulative Disturbance Area = 58.09ha Minor Intrusion Threshold of 40ha was exceeded and the amendment
process would have been triggered. OGMA amended to remove the Cumulative Disturbance and a new
OGMA are is established = 1342.09ha Minor intrusion threshold is reset to zero.
iii) Results:
Total cumulative disturbance area over 3 years = 58.09ha The cumulative industrial footprint area in Year 2 is close to the Minor Intrusion
Threshold and would have flagged this OGMA during the yearly review process as requiring a closer look if more requests for industrial activities are received.
Minor Intrusion Threshold would have been exceeded in Year 3 of this scenario. As a result, the amendment process would have been required once over a 3 year period.
Dawson Creek Timber Supply Area Old Growth Management Areas Assessment Project
39 Research Report - July 2012
iv) Discussion: In this scenario the level of development in year three would have triggered an
amendment review. The current FRPA review process allows for several options in the amendment process; including deletion of the footprint area, as per this scenario. Major amendments to the OGMA polygon and/or relocation of the OGMA are other possible options. In all cases all industrial tenure holders would have opportunity for input and review prior to final amendments.
Due to the high level of industrial footprint in this OGMA and the fragmentation of the OGMA, it is likely that the amendment process in year 3 would have suggested a boundary change rather than a simple footprint removal.
Major amendments are discussed further in Section 7.0 e) and in Section 2.0 b)iii).
Figure 8 depicts the footprint progression by year and summarizes some of the yearly statistics.

Dawson Creek Timber Supply Area Old Growth Management Areas Assessment Project
40 Research Report - July 2012
Figure 8 - One Island 11 Footprint Development Scenario Map
Dawson Creek Timber Supply Area Old Growth Management Areas Assessment Project
41 Research Report - July 2012
e) Septimus 03: Footprint Development Scenario Details
i) Minor Intrusion Threshold Definition:
This OGMA is greater than 50ha so the minor intrusion clause that applies here is: 5% or 40ha whichever is less.
Due to the size of this OGMA, 5% of the area will far exceed 40ha so the Minor Intrusion Threshold for this OGMA will = 40ha.
ii) Yearly Statistics
Year 1 Area Statistics: OGMA Area Year 0 (Zero) = 1590.12ha Year 1 Disturbance Area = 12.97ha Cumulative Disturbance Area = 12.97ha
Year 2 Area Statistics:
Year 2 Disturbance Area = 13.44ha Cumulative Disturbance Area = 26.41ha
Year 3 Area Statistics:
Year 3 Disturbance Area = 5.72ha Cumulative Disturbance Impact Area = 32.13ha Cumulative disturbance is close to the minor intrusion threshold of 40ha.
At the yearly review of the OGMAs, this OGMA would be flagged as requiring a closer look if more requests for industrial activities are received.
Year 4 Area Statistics:
Year 4 Disturbance Area = 20.44ha Cumulative Disturbance Area = 52.57ha Minor Intrusion Threshold of 40ha was exceeded and the amendment
process would have been triggered. OGMA amended to remove the Cumulative Disturbance and a new
OGMA area is established = 1537.55ha Minor intrusion threshold reset to zero.
Year 5 Area Statistics:
Year 5 Disturbance Area = 6.71ha Cumulative Disturbance Area = 6.71ha
Year 6 Area Statistics:
Year 6 Disturbance Area = 6.90ha Cumulative Disturbance Area = 13.61ha
Dawson Creek Timber Supply Area Old Growth Management Areas Assessment Project
42 Research Report - July 2012
iii) Results: Total cumulative disturbance area over 6 years = 66.18ha The cumulative disturbance area in year 3 is close to the Minor Intrusion
Threshold and would have flagged this OGMA during the yearly review process.
Minor Intrusion Threshold would have been exceeded in Year 4 of this scenario. As a result, the amendment process would have been required once over a 6 year period.
iv) Discussion:
In this scenario the level of development in year four would have triggered an amendment review. The current FRPA review process allows for several options in the amendment process; including deletion of the footprint area, as per this scenario. Major amendments to the OGMA polygon and/or relocation of the OGMA are other possible options. In all cases all industrial tenure holders would have opportunity for input and review prior to final amendments.
Due to the high level of industrial footprint in this OGMA and the fragmentation of the OGMA, it is likely that the amendment process in year 4 would have suggested a boundary change rather than a simple footprint removal.
Major amendments are discussed further in Section 7.0 e) and in Section 2.0 b)iii).
Figure 9 depicts the footprint progression by year and summarizes some of the yearly statistics.
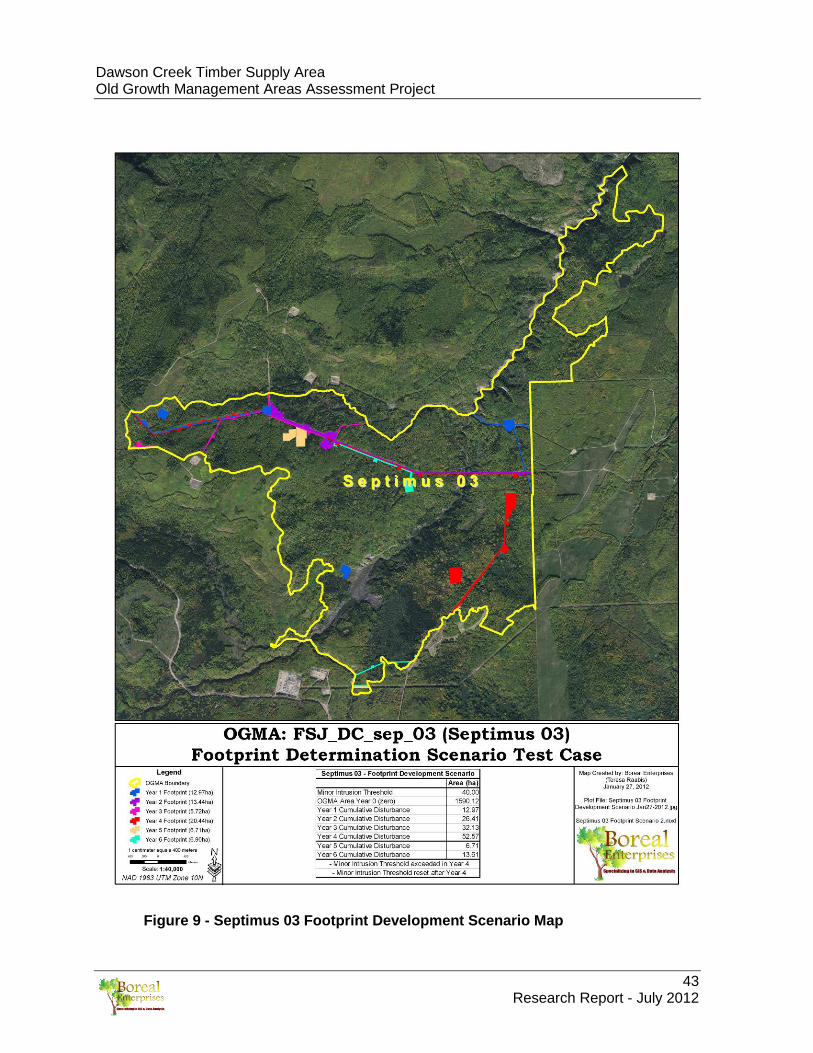
Dawson Creek Timber Supply Area Old Growth Management Areas Assessment Project
43 Research Report - July 2012
Figure 9 - Septimus 03 Footprint Development Scenario Map
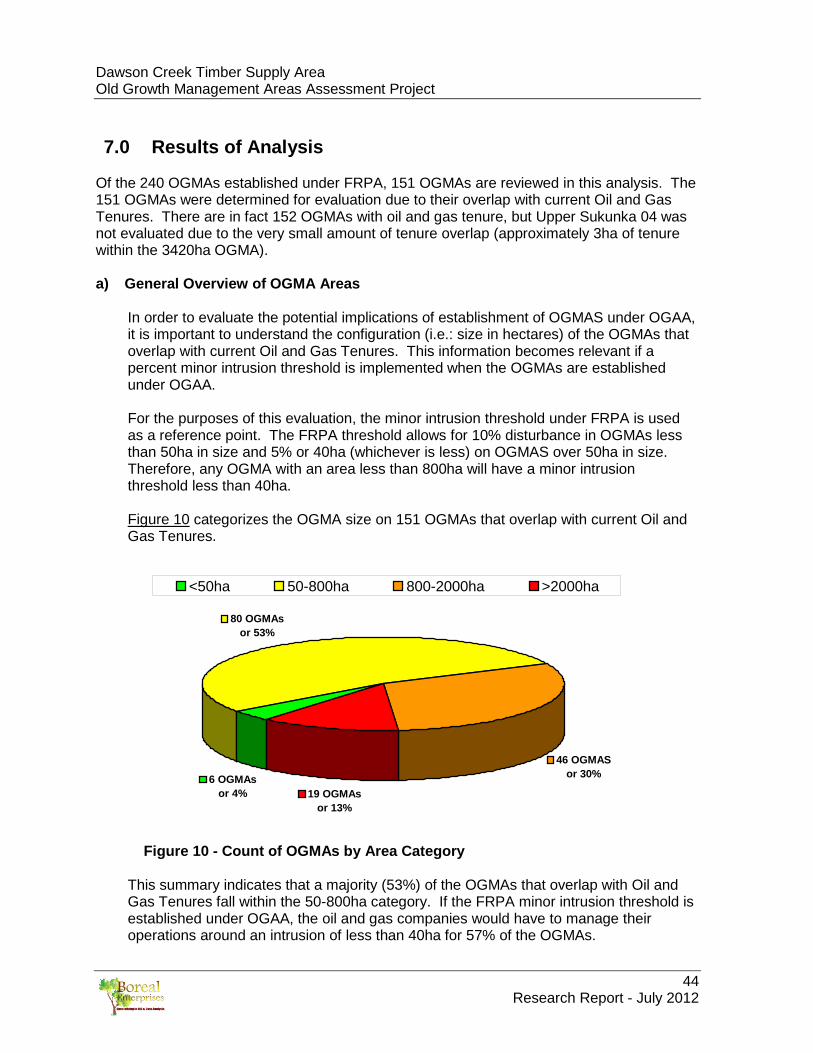
Dawson Creek Timber Supply Area Old Growth Management Areas Assessment Project
44 Research Report - July 2012
7.0 Results of Analysis
Of the 240 OGMAs established under FRPA, 151 OGMAs are reviewed in this analysis. The 151 OGMAs were determined for evaluation due to their overlap with current Oil and Gas Tenures. There are in fact 152 OGMAs with oil and gas tenure, but Upper Sukunka 04 was not evaluated due to the very small amount of tenure overlap (approximately 3ha of tenure within the 3420ha OGMA). a) General Overview of OGMA Areas
In order to evaluate the potential implications of establishment of OGMAS under OGAA, it is important to understand the configuration (i.e.: size in hectares) of the OGMAs that overlap with current Oil and Gas Tenures. This information becomes relevant if a percent minor intrusion threshold is implemented when the OGMAs are established under OGAA. For the purposes of this evaluation, the minor intrusion threshold under FRPA is used as a reference point. The FRPA threshold allows for 10% disturbance in OGMAs less than 50ha in size and 5% or 40ha (whichever is less) on OGMAS over 50ha in size. Therefore, any OGMA with an area less than 800ha will have a minor intrusion threshold less than 40ha. Figure 10 categorizes the OGMA size on 151 OGMAs that overlap with current Oil and Gas Tenures.
46 OGMASor 30%
19 OGMAsor 13%
6 OGMAsor 4%
80 OGMAsor 53%
<50ha 50-800ha 800-2000ha >2000ha
Figure 10 - Count of OGMAs by Area Category
This summary indicates that a majority (53%) of the OGMAs that overlap with Oil and Gas Tenures fall within the 50-800ha category. If the FRPA minor intrusion threshold is established under OGAA, the oil and gas companies would have to manage their operations around an intrusion of less than 40ha for 57% of the OGMAs.
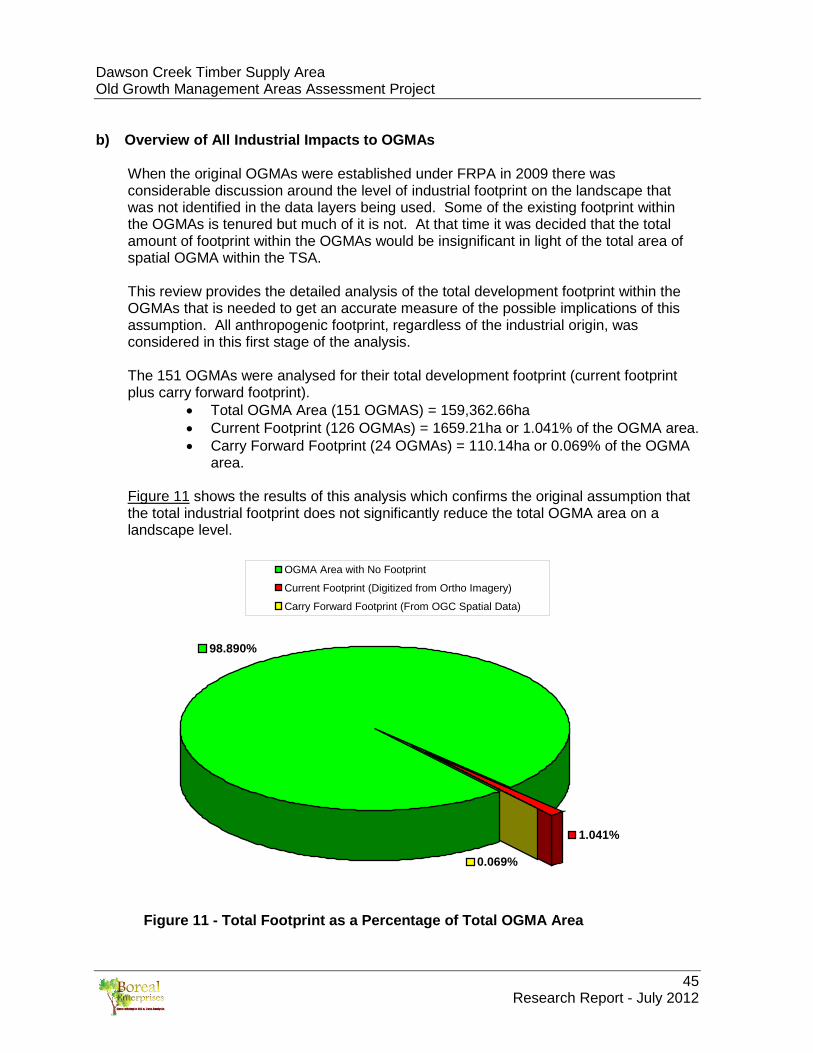
Dawson Creek Timber Supply Area Old Growth Management Areas Assessment Project
45 Research Report - July 2012
b) Overview of All Industrial Impacts to OGMAs
When the original OGMAs were established under FRPA in 2009 there was considerable discussion around the level of industrial footprint on the landscape that was not identified in the data layers being used. Some of the existing footprint within the OGMAs is tenured but much of it is not. At that time it was decided that the total amount of footprint within the OGMAs would be insignificant in light of the total area of spatial OGMA within the TSA. This review provides the detailed analysis of the total development footprint within the OGMAs that is needed to get an accurate measure of the possible implications of this assumption. All anthropogenic footprint, regardless of the industrial origin, was considered in this first stage of the analysis. The 151 OGMAs were analysed for their total development footprint (current footprint plus carry forward footprint).
• Total OGMA Area (151 OGMAS) = 159,362.66ha • Current Footprint (126 OGMAs) = 1659.21ha or 1.041% of the OGMA area. • Carry Forward Footprint (24 OGMAs) = 110.14ha or 0.069% of the OGMA
area.
Figure 11 shows the results of this analysis which confirms the original assumption that the total industrial footprint does not significantly reduce the total OGMA area on a landscape level.
1.041%
0.069%
98.890%
OGMA Area with No Footprint
Current Footprint (Digitized from Ortho Imagery)
Carry Forward Footprint (From OGC Spatial Data)
Figure 11 - Total Footprint as a Percentage of Total OGMA Area
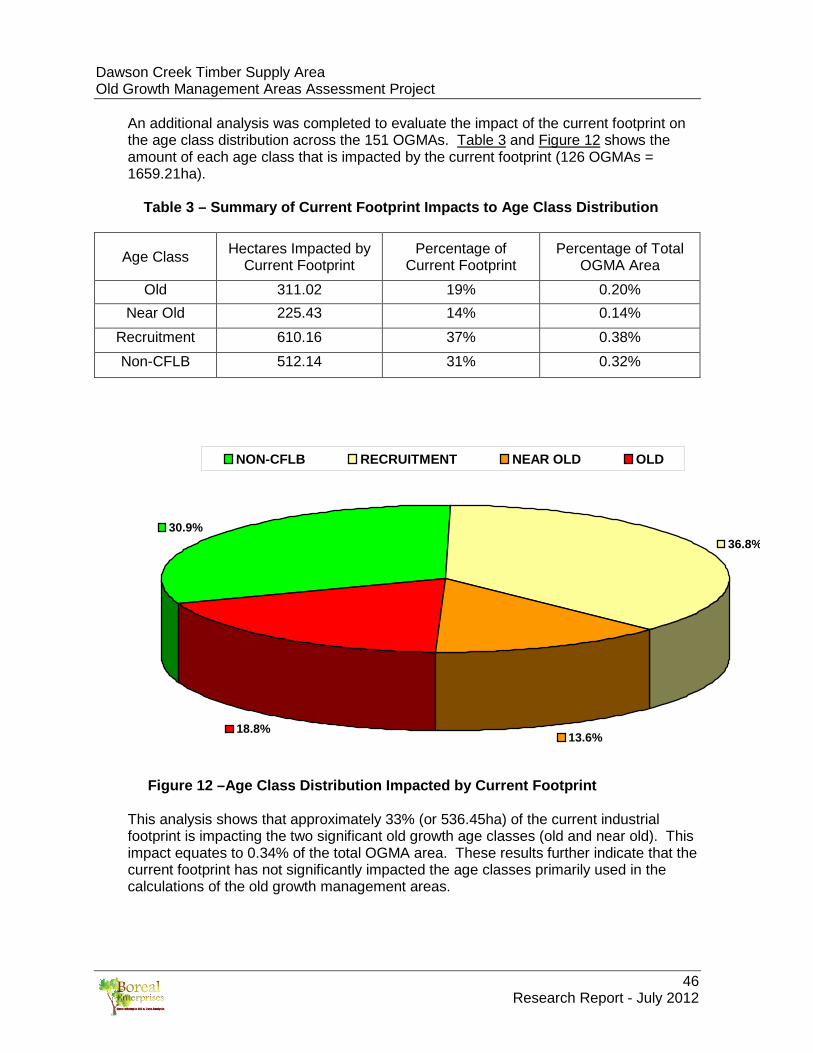
Dawson Creek Timber Supply Area Old Growth Management Areas Assessment Project
46 Research Report - July 2012
An additional analysis was completed to evaluate the impact of the current footprint on the age class distribution across the 151 OGMAs. Table 3 and Figure 12 shows the amount of each age class that is impacted by the current footprint (126 OGMAs = 1659.21ha).
Table 3 – Summary of Current Footprint Impacts to Age Class Distribution
Age Class Hectares Impacted by Current Footprint
Percentage of Current Footprint
Percentage of Total OGMA Area
Old 311.02 19% 0.20% Near Old 225.43 14% 0.14%
Recruitment 610.16 37% 0.38% Non-CFLB 512.14 31% 0.32%
30.9%36.8%
13.6%18.8%
NON-CFLB RECRUITMENT NEAR OLD OLD
Figure 12 –Age Class Distribution Impacted by Current Footprint This analysis shows that approximately 33% (or 536.45ha) of the current industrial footprint is impacting the two significant old growth age classes (old and near old). This impact equates to 0.34% of the total OGMA area. These results further indicate that the current footprint has not significantly impacted the age classes primarily used in the calculations of the old growth management areas.
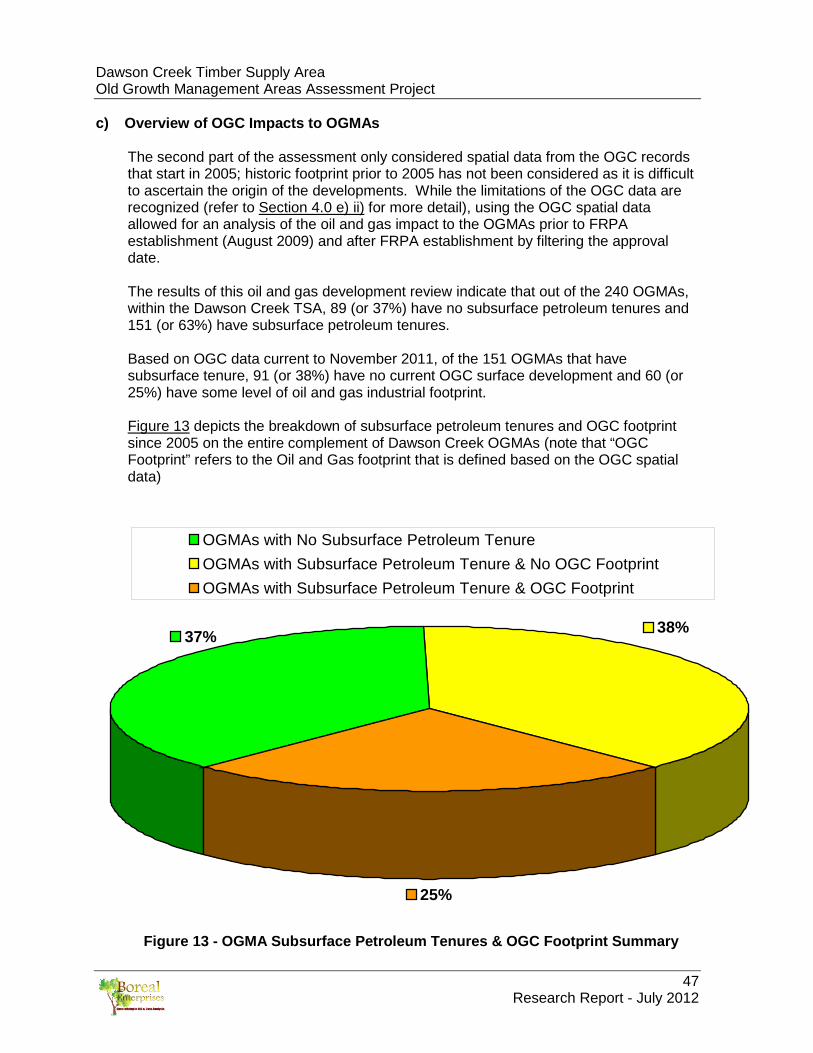
Dawson Creek Timber Supply Area Old Growth Management Areas Assessment Project
47 Research Report - July 2012
c) Overview of OGC Impacts to OGMAs
The second part of the assessment only considered spatial data from the OGC records that start in 2005; historic footprint prior to 2005 has not been considered as it is difficult to ascertain the origin of the developments. While the limitations of the OGC data are recognized (refer to Section 4.0 e) ii) for more detail), using the OGC spatial data allowed for an analysis of the oil and gas impact to the OGMAs prior to FRPA establishment (August 2009) and after FRPA establishment by filtering the approval date. The results of this oil and gas development review indicate that out of the 240 OGMAs, within the Dawson Creek TSA, 89 (or 37%) have no subsurface petroleum tenures and 151 (or 63%) have subsurface petroleum tenures. Based on OGC data current to November 2011, of the 151 OGMAs that have subsurface tenure, 91 (or 38%) have no current OGC surface development and 60 (or 25%) have some level of oil and gas industrial footprint. Figure 13 depicts the breakdown of subsurface petroleum tenures and OGC footprint since 2005 on the entire complement of Dawson Creek OGMAs (note that “OGC Footprint” refers to the Oil and Gas footprint that is defined based on the OGC spatial data)
25%
38%37%
OGMAs with No Subsurface Petroleum TenureOGMAs with Subsurface Petroleum Tenure & No OGC FootprintOGMAs with Subsurface Petroleum Tenure & OGC Footprint
Figure 13 - OGMA Subsurface Petroleum Tenures & OGC Footprint Summary
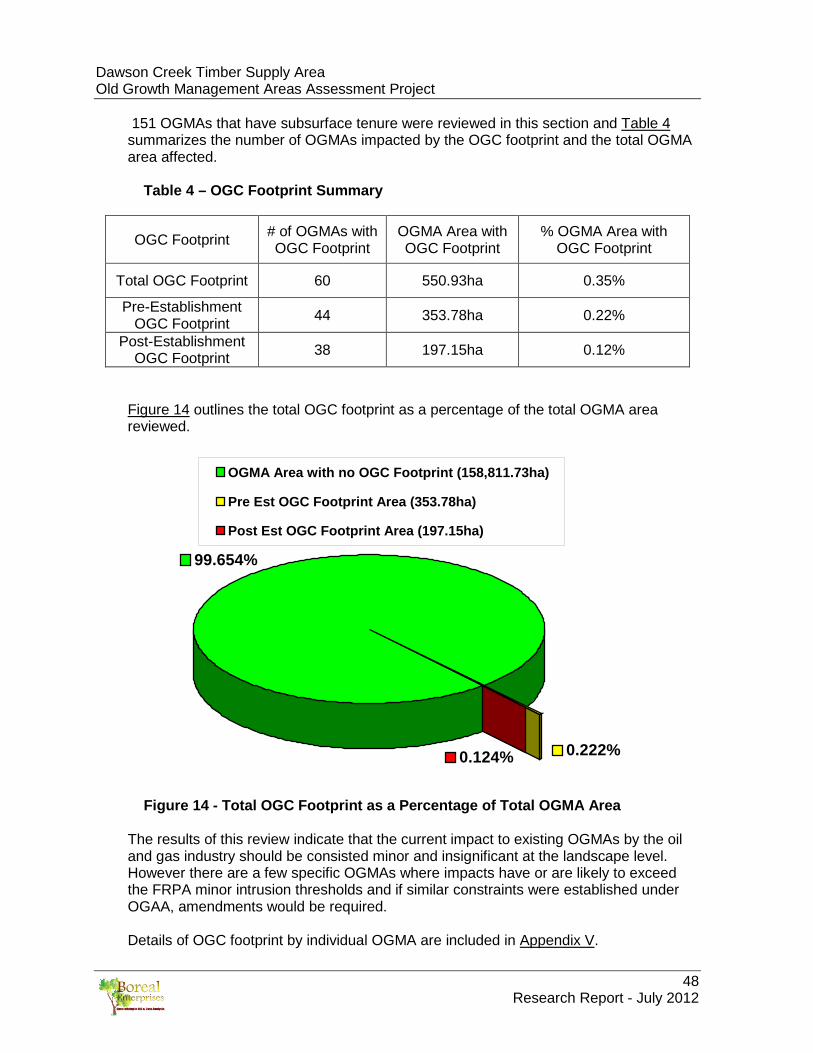
Dawson Creek Timber Supply Area Old Growth Management Areas Assessment Project
48 Research Report - July 2012
151 OGMAs that have subsurface tenure were reviewed in this section and Table 4 summarizes the number of OGMAs impacted by the OGC footprint and the total OGMA area affected.
Table 4 – OGC Footprint Summary
OGC Footprint # of OGMAs with OGC Footprint
OGMA Area with OGC Footprint
% OGMA Area with OGC Footprint
Total OGC Footprint 60 550.93ha 0.35%
Pre-Establishment OGC Footprint 44 353.78ha 0.22%
Post-Establishment OGC Footprint 38 197.15ha 0.12%
Figure 14 outlines the total OGC footprint as a percentage of the total OGMA area reviewed.
99.654%
0.124% 0.222%
OGMA Area with no OGC Footprint (158,811.73ha)
Pre Est OGC Footprint Area (353.78ha)
Post Est OGC Footprint Area (197.15ha)
Figure 14 - Total OGC Footprint as a Percentage of Total OGMA Area
The results of this review indicate that the current impact to existing OGMAs by the oil and gas industry should be consisted minor and insignificant at the landscape level. However there are a few specific OGMAs where impacts have or are likely to exceed the FRPA minor intrusion thresholds and if similar constraints were established under OGAA, amendments would be required. Details of OGC footprint by individual OGMA are included in Appendix V.

Dawson Creek Timber Supply Area Old Growth Management Areas Assessment Project
49 Research Report - July 2012
d) Evaluation of FRPA Minor Intrusion Clause
In the FRPA order there is a minor intrusion clause that allows for some level of industrial development within an OGMA without triggering an amendment process. The intent of this objective was to recognize the significance of minor intrusions in light of the landscape level objective of approximately 250,000 ha of spatial OGMA. To further assess the implications of establishing OGMAs for the oil and gas industry, the minor intrusion clause in the FPRA OGMA objectives was examined as a starting point for evaluation. The FRPA objectives allow for disturbance provided:
..the disturbance to the gross OGMA area does not exceed:
(c) 10% in OGMAs less than 50 hectares; or (d) 5% or 40 hectares, whichever is less, in OGMAs of 50 hectares or greater.
This section will review the current footprint and the OGC footprint on the 151 OGMAs that overlap with the current oil and gas tenures in relation to the FRPA minor intrusion threshold. In both instances the footprint is summarized into four percentage categories based on the FRPA minor intrusion threshold.
Current & Carry Footprint Review: As discussed previously, the current footprint was determined by manually digitizing the disturbance from high resolution ortho imagery. The footprint determined in this fashion includes all anthropogenic disturbance including oil and gas activities. The carry forward footprint was determined using the OGC data current from 2005 to November 2011. Table 4 summarizes the number of OGMAs that contain current and carry forward footprint by the four minor intrusion threshold categories. The summary shows that a majority of the footprint is less than 50% of the FRPA minor intrusion threshold.
Table 5 – Total Footprint Summary by Minor Intrusion Threshold Category
Percent Minor Intrusion Threshold
Category
# of OGMAs with Current Footprint
# of OGMAs with Carry Forward Footprint
# of OGMAs with Total Footprint
0-50% 110 150 108 50-75% 18 0 19
75-100% 7 1 7 >100% 16 0 17
Figure 15 shows that a majority (approximately 73%) of the current footprint by OGMA is well below the FRPA minor intrusion threshold. However, it also shows that the remaining 27% of the OGMAs are close to or exceeding the FRPA minor intrusion threshold.
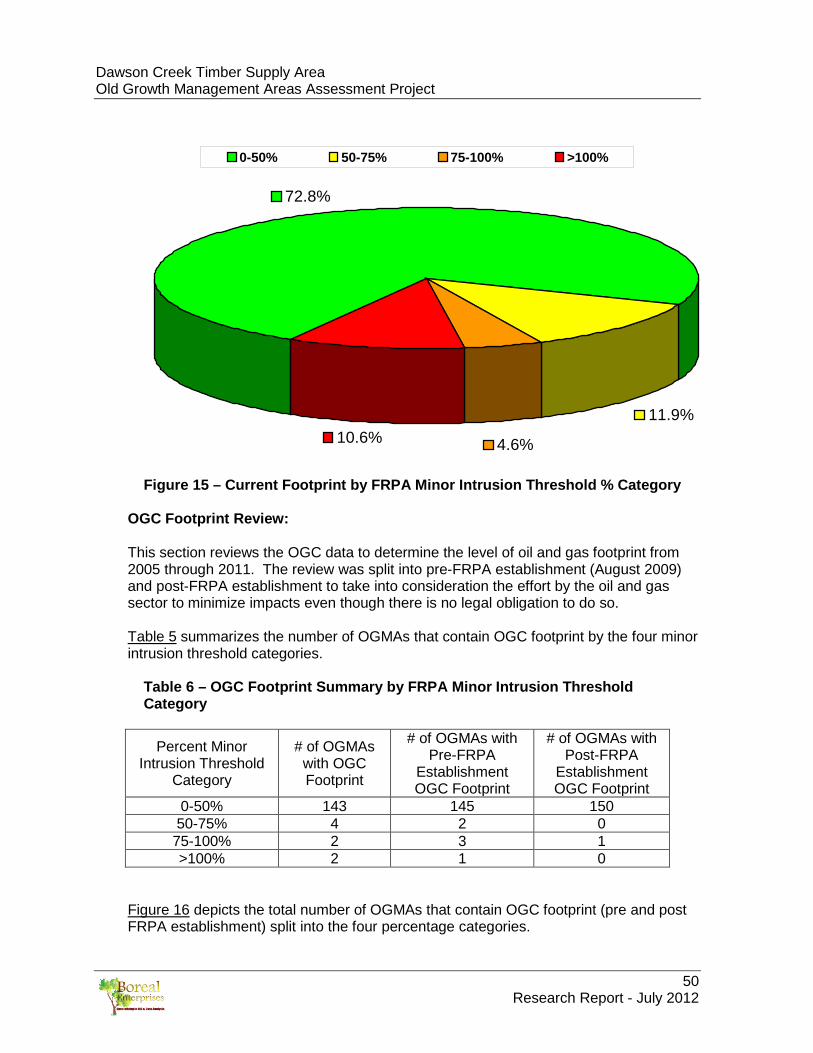
Dawson Creek Timber Supply Area Old Growth Management Areas Assessment Project
50 Research Report - July 2012
11.9%
4.6%10.6%
72.8%
0-50% 50-75% 75-100% >100%
Figure 15 – Current Footprint by FRPA Minor Intrusion Threshold % Category
OGC Footprint Review: This section reviews the OGC data to determine the level of oil and gas footprint from 2005 through 2011. The review was split into pre-FRPA establishment (August 2009) and post-FRPA establishment to take into consideration the effort by the oil and gas sector to minimize impacts even though there is no legal obligation to do so. Table 5 summarizes the number of OGMAs that contain OGC footprint by the four minor intrusion threshold categories.
Table 6 – OGC Footprint Summary by FRPA Minor Intrusion Threshold Category
Percent Minor Intrusion Threshold
Category
# of OGMAs with OGC Footprint
# of OGMAs with Pre-FRPA
Establishment OGC Footprint
# of OGMAs with Post-FRPA
Establishment OGC Footprint
0-50% 143 145 150 50-75% 4 2 0
75-100% 2 3 1 >100% 2 1 0
Figure 16 depicts the total number of OGMAs that contain OGC footprint (pre and post FRPA establishment) split into the four percentage categories.
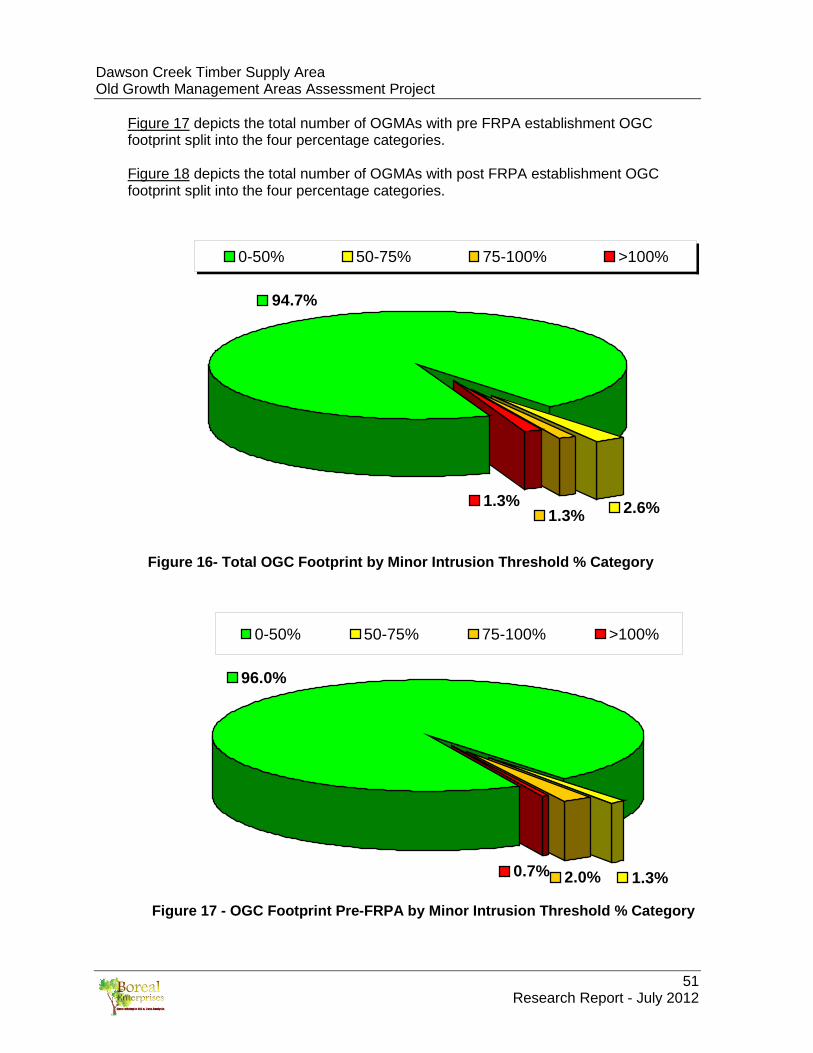
Dawson Creek Timber Supply Area Old Growth Management Areas Assessment Project
51 Research Report - July 2012
Figure 17 depicts the total number of OGMAs with pre FRPA establishment OGC footprint split into the four percentage categories. Figure 18 depicts the total number of OGMAs with post FRPA establishment OGC footprint split into the four percentage categories.
1.3%1.3% 2.6%
94.7%
0-50% 50-75% 75-100% >100%
Figure 16- Total OGC Footprint by Minor Intrusion Threshold % Category
2.0%0.7%
96.0%
1.3%
0-50% 50-75% 75-100% >100%
Figure 17 - OGC Footprint Pre-FRPA by Minor Intrusion Threshold % Category
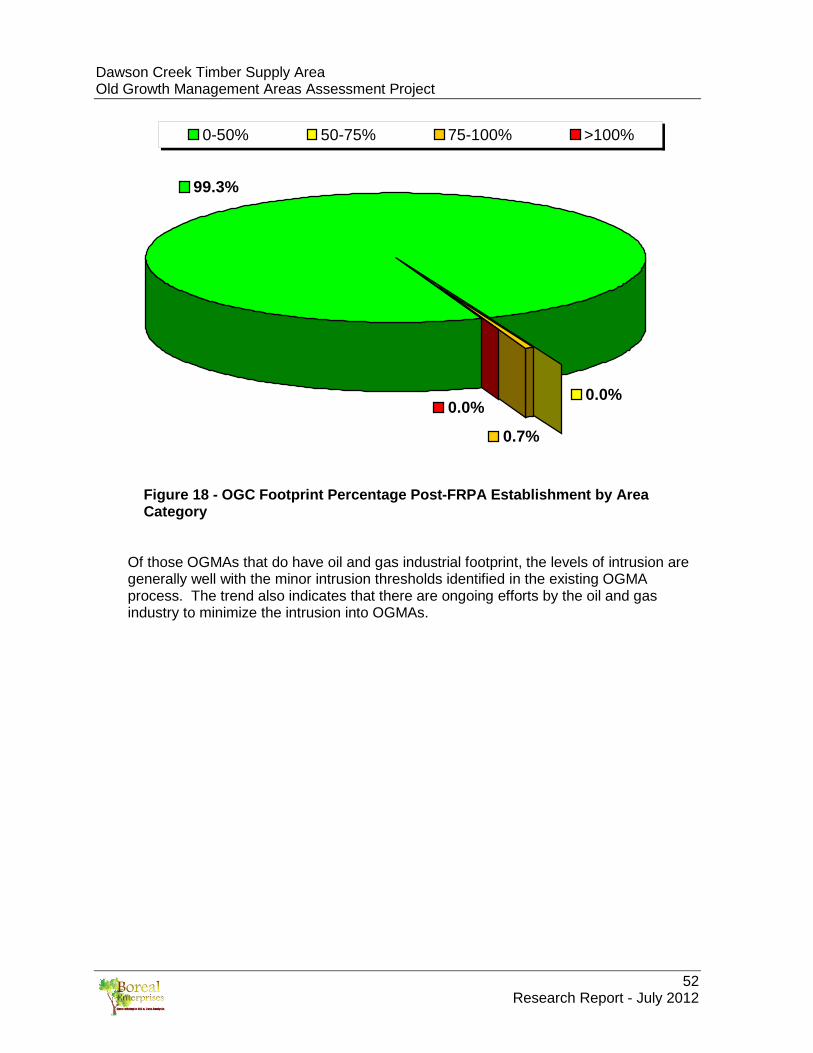
Dawson Creek Timber Supply Area Old Growth Management Areas Assessment Project
52 Research Report - July 2012
0.0%
99.3%
0.7%
0.0%
0-50% 50-75% 75-100% >100%
Figure 18 - OGC Footprint Percentage Post-FRPA Establishment by Area Category
Of those OGMAs that do have oil and gas industrial footprint, the levels of intrusion are generally well with the minor intrusion thresholds identified in the existing OGMA process. The trend also indicates that there are ongoing efforts by the oil and gas industry to minimize the intrusion into OGMAs.
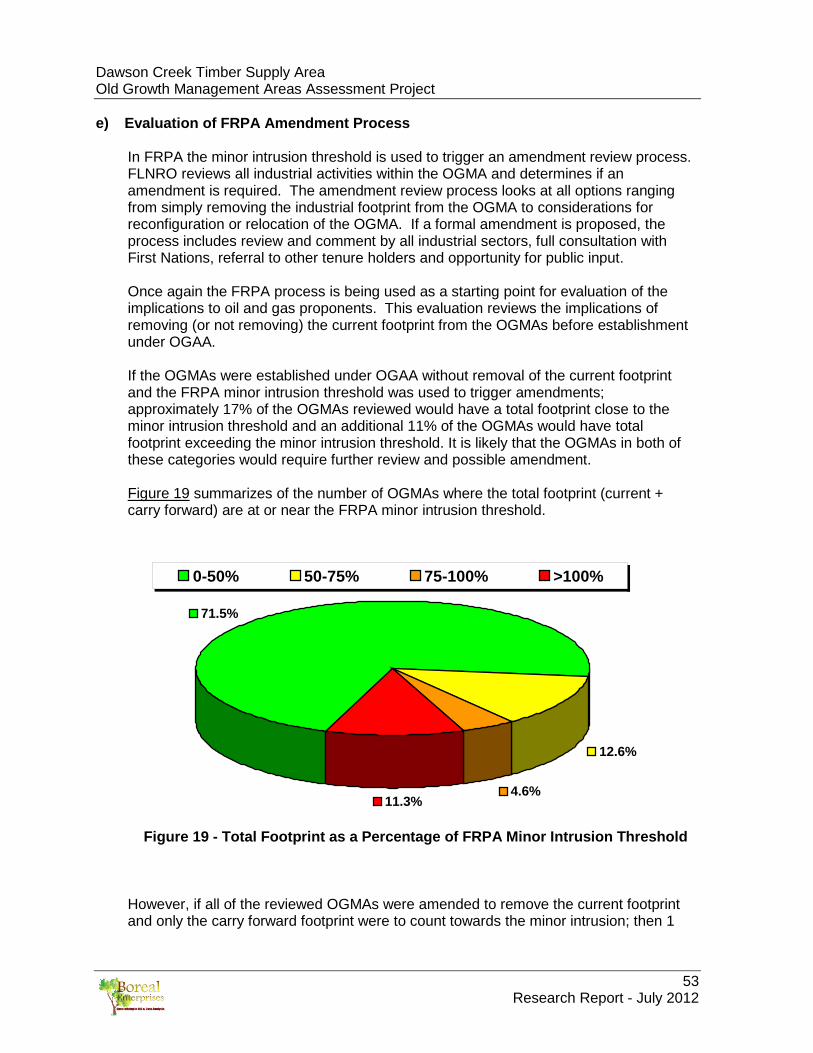
Dawson Creek Timber Supply Area Old Growth Management Areas Assessment Project
53 Research Report - July 2012
e) Evaluation of FRPA Amendment Process
In FRPA the minor intrusion threshold is used to trigger an amendment review process. FLNRO reviews all industrial activities within the OGMA and determines if an amendment is required. The amendment review process looks at all options ranging from simply removing the industrial footprint from the OGMA to considerations for reconfiguration or relocation of the OGMA. If a formal amendment is proposed, the process includes review and comment by all industrial sectors, full consultation with First Nations, referral to other tenure holders and opportunity for public input. Once again the FRPA process is being used as a starting point for evaluation of the implications to oil and gas proponents. This evaluation reviews the implications of removing (or not removing) the current footprint from the OGMAs before establishment under OGAA. If the OGMAs were established under OGAA without removal of the current footprint and the FRPA minor intrusion threshold was used to trigger amendments; approximately 17% of the OGMAs reviewed would have a total footprint close to the minor intrusion threshold and an additional 11% of the OGMAs would have total footprint exceeding the minor intrusion threshold. It is likely that the OGMAs in both of these categories would require further review and possible amendment. Figure 19 summarizes of the number of OGMAs where the total footprint (current + carry forward) are at or near the FRPA minor intrusion threshold.
71.5%
12.6%
4.6%11.3%
0-50% 50-75% 75-100% >100%
Figure 19 - Total Footprint as a Percentage of FRPA Minor Intrusion Threshold
However, if all of the reviewed OGMAs were amended to remove the current footprint and only the carry forward footprint were to count towards the minor intrusion; then 1

Dawson Creek Timber Supply Area Old Growth Management Areas Assessment Project
54 Research Report - July 2012
(one) OGMA would be close to the threshold and would likely require further review and possible amendment.
f) OGMA Boundaries and Constrained Areas
Easily identified boundaries such as creeks and roads were used where ever possible to delineate spatial OGMA in order for them to be easily located in the field. As a result most OGMAs contain non-CFLB. The non-CFLB portion of the OGMA does not contribute to the overall target of old forest retention. Therefore, disturbance to non-CFLB does not impact the old forest values.
i) Non-Spatially Constrained Areas
There are also OGMAs that contain other previously identified values that have implications for industrial development. During the FRPA OGMA establishment process, efforts were made to include areas where forest harvesting was constrained by other values; First Nations, environmental and social, provided the site contained forests that met the old forest criteria. The intent was to minimize the impacts to industrial development resulting from multiple value designations across the landscape. First Nations and social constraints are either broad concerns that apply to the entire OGMA or in some cases are site specific values that are not mapped due to their sensitivity. In these cases the First Nations that identified the value are noted and further discussion with that First Nation is required.
ii) Spatially Constrained Areas
Most environmental values; riparian reserves, WHAs, UWR, are identified and established through mechanisms under FRPA. Figure 20 gives a summary of the amount of area in the 151 OGMAs reviewed that falls in each of the spatially constrained and non constrained criteria. A detailed constrained and non-constrained summary by OGMA is provided in Appendix II. Figure 21 is an example of how this information is depicted for each OGMA analyzed. A full set of maps for the 151 OGMAs can be found in Appendix XI.

Dawson Creek Timber Supply Area Old Growth Management Areas Assessment Project
55 Research Report - July 2012
0.07%
3.90%
0.53%
5.83%
76.06%
13.61%
CFLB Non Constrained Area CFLB Constrained by Riparian CFLB Constrained by WHA
NON-CFLB Non Constrained Area NON-CFLB Constrained by Riparian NON-CFLB Constrained by WHA
Figure 20 - Constrained & Non-Constrained Areas as a Percentage of Total OGMA Area
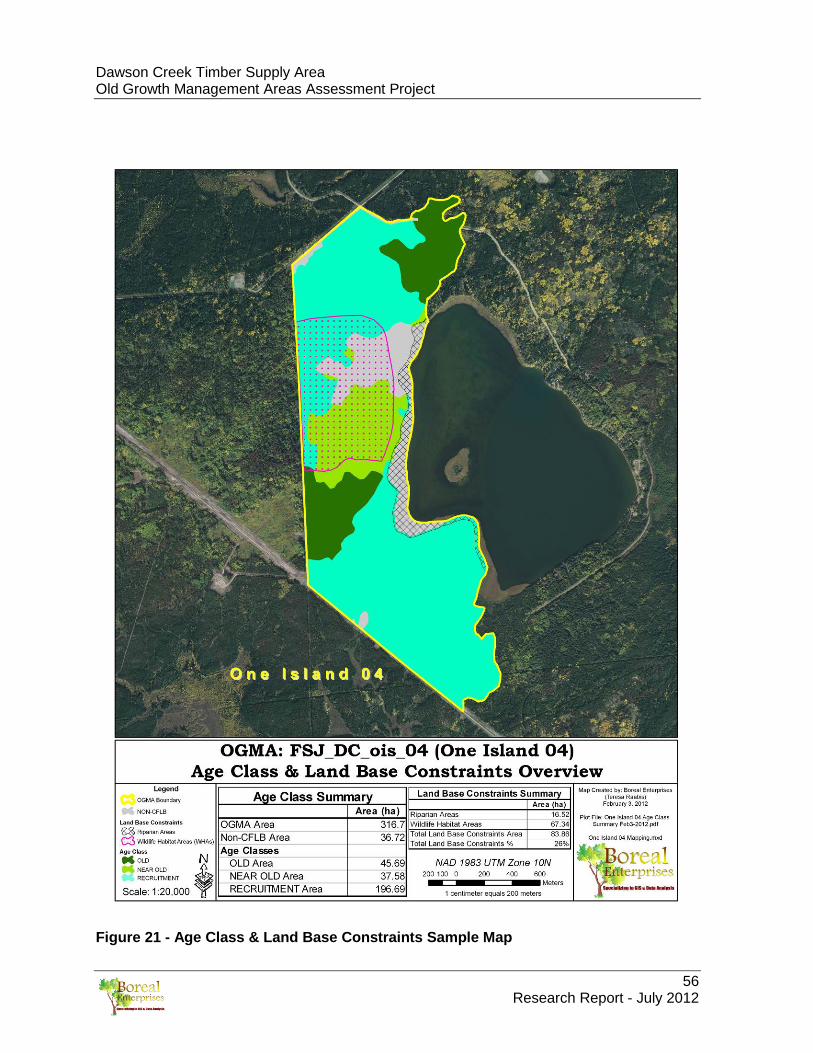
Dawson Creek Timber Supply Area Old Growth Management Areas Assessment Project
56 Research Report - July 2012
Figure 21 - Age Class & Land Base Constraints Sample Map
Dawson Creek Timber Supply Area Old Growth Management Areas Assessment Project
57 Research Report - July 2012
8.0 Recommendations for Establishment and Management The previous sections of the report, in addition to the considerations presented in the following Section are included to provide the necessary background to inform the OGC and FLNRO when reviewing the establishment of OGMAs under OGAA. The following section provides several discussion points that may be appropriate to address during this future dialogue. a) Legal Background
The OGAA Environmental Protection and Management Regulations (EPMR) provide the direction on establishment of OGMAs, however the setting objectives in the establishment process is not included. Objectives for their management will be developed in a Memorandum of Understanding between FLNRO and the OGC. The MOU is expected to address “material adverse effect” and “old seral stage forest representation” and how these relate to management direction in a minor intrusion concept and an amendment process. Section 32 addresses OGMA establishment and Section 37 deals with the notice and consultation process, as follows:
Establishment of OGMAs 32 The minister responsible for administering the Land Act by order may establish one or more areas as an old-growth management area for the purposes of providing old seral stage forest representation. Notice and Consultation 37 (1) Subject to subsection (2), a minister, before making an order under any of
sections 27, 28, 30 to 32, 34 or 35 must
(a) provide notice of the proposed order to
(i) organizations that the minister considers representative of persons who
(A) conduct geophysical exploration, or (B) construct pipelines but who do not hold any associated drilling licence or lease,
that will be affected by the order, and
(ii) holders of leases or drilling licences under the Petroleum and Natural Gas Act that will be affected by the order, and
(b) consult with persons referred to in paragraph (a) if the order may have a material
adverse effect on that person. (2) Subsection (1) does not apply to the following:

Dawson Creek Timber Supply Area Old Growth Management Areas Assessment Project
58 Research Report - July 2012
(e) an order under subsection 32 establishing an old-growth management area if, before coming into force of this section, the area is spatially defined and subject to a spatial old-growth management objective that is
(i) continued under section 93.8 of the Land Act, or (ii) established under the Land Use Objectives, Regulations B.C. Reg.357/2005;
In summary the regulations allow for the establishment of existing spatial OGMAs as is without further notification or consultation. Any new or amended spatial OGMAs would require a full review process before establishment. The objectives for OGMAs are identified in section 7(1) of the regulations:
7(1) For the purposes of the definition of “government’s environmental objectives” in section 1(2) of the Act, the following objectives are prescribed:
(c) That operating areas not be located within an old-growth
management area unless it will not have a material adverse effect on the old seral stage forest representation within the area,
A complete copy of the EPMR regulations can be found in Appendix VI.

Dawson Creek Timber Supply Area Old Growth Management Areas Assessment Project
59 Research Report - July 2012
b) OGAA Establishment This section outlines and reviews some primary questions regarding the establishment of the Dawson Creek TSA OGMAs under OGAA. Potential options and considerations for addressing these questions are presented.
Section 32 of the EPMR allows for the establishment of OGMAs but does not give specific direction beyond that. If the assumption is used that the current FRPA spatial OGMAs will form the basis for OGMAs established under OGAA; there are three broad options that may be considered: • Establish OGMAs as per FRPA: Under this option, the FRPA OGMAs could be established under OGAA as-is without any boundary changes to account for the current industrial footprint. • Amend Current Footprint from All OGMAs: Under this option, it would be possible to review all of the FRPA OGMA boundaries to determine which OGMAs contain footprint. The boundaries on any OGMAs containing footprint could then be reshaped to remove the current industrial footprint.
For this option, additional consideration should be given to the following: For those OGMAs that contain a significant existing footprint and/or are expected to
experience significant future development, consideration may be given to moving the OGMA to a new location of equal size and composition (rotating reserves concept).
For those OGMAs that contain a significant existing footprint but it is determined that the overall OGMA location should be maintained, consideration could be given to recruitment of adjacent equivalent forest stands to offset the disturbance.
For those OGMAs where a significant spatial amendment will be required (major boundary change or moving of the OGMA), consideration of subsurface features such as regions sitting above subsurface synclines may be given, as these areas are less likely to be targeted for oil and gas development.
For all of the above-mentioned options, it may be pertinent to give priority to approval of pending applications over new applications; doing so will ensure that the time frame for application approval is minimized, and will avoid potential overlap when reshaping existing OGMAs that may be located in an area that is already identified in a pending application/future approval.
For all of the above-mentioned options the current process under FRPA requires an Order in Council to re-declare the OGMA if the boundary is moved/changed. Further discussion may be required to determine if, when OGMAs are turned on under OGAA, an Order will in fact be needed to alter the location or boundary of an OGMA if the equivalent biodiversity values are maintained.
• Combination Approach: Under this option, some OGMAs could be established as-is without amendment (as per the first option) and amend those with a high current footprint (>75% of the minor intrusion
Q1. What OGMA boundary will be used to spatially establish the OGMAs under OGAA?
Dawson Creek Timber Supply Area Old Growth Management Areas Assessment Project
60 Research Report - July 2012
threshold) and/or an identified intrusion risk. The current and carry forward footprint could then remain as contributing to the minor intrusion threshold on OGMAs established without amendment.
As long as there are ongoing developments there will always be a challenge with footprint accuracy (due to the time gap, this will occur regardless of which system is used). However, it is important to consider the significance of the potential error in light of the overall landscape level old growth objectives for OGMAs. The analysis completed in this report indicates that the significance of the error is very small.
The Project Team has had the opportunity to review the manually digitized footprint determined in this report. If there are any OGMAs where it is believed that the footprint is incomplete, it may be appropriate to allow other industry members the option to provide additional spatial footprint data to the government agencies before the OGMAs are established under OGAA. Consideration may also be given to the development of an appeal process that lease holders can use to demonstrate that the footprint calculations may be erroneous once the OGMAs are established under OGAA.
Q2. How can the subjective nature and the inherent possibility for error in the footprint determination be addressed?
Dawson Creek Timber Supply Area Old Growth Management Areas Assessment Project
61 Research Report - July 2012
c) Material Adverse Effect The EPMR does not contain definitions to clarify the intent of the terms “...material adverse effect...” or “...old seral stage forest representation...” However, the Environmental Protection and Management Guide, November 2011 Version 1.5 (included in Appendix VII) indicates that information regarding material adverse effect can be found in Forest and Range Practices Act CEPS Bulletin 40, December 2009, Guidance to CE Program staff and delegated decision makers on interpreting the words “material adverse effect” and “material adverse impact”. The CEPS Bulletin 40 is included in Appendix VIII. For the purposes of OGMA establishment under FRPA, all of the CFLB within an OGMA is considered to contribute to the old growth forest target and is to be managed as such. Therefore, all CFLB in the OGMA should be considered “old seral stage forest representation”. The old component already has the biodiversity attributes that are intended to be maintained. Near old forests are within 20 years of the old forest definitions and have most of the old forest attributes present or developing. Recruitment forests, forests younger than the near old definition, are needed in order to address the lack of old forest in some areas. The principle behind recruitment stands is to protect the sites from disturbance to allow the natural aging process to develop mature and old forests that contain old forest attributes.
In developing a definition for material adverse effect, the following points warrant consideration:
Any viable option must be measurable and track-able; Review of the existing CEPS bulletin 40 (attached in Appendix VII) should be
considered; and The current minor intrusion clause under FRPA could be considered to equate to the
intent of the phrase “not have a material adverse effect”. With further discussion, it may be possible to define the material adverse effect quantitatively as being equal to the minor intrusion threshold. Furthermore, it may be appropriate to state that activities that do not disturb the soil (low impact seismic) are not considered as contributing to the material adverse effect as they are setting back forest succession to an early seral stage but not removing crown forested land base. Since the non-CFLB area within the OGMAs does not contribute to the old growth objectives, it may be appropriate to consider development in the non-CFLB portion is as not having a material adverse effect to the OGMA objectives.
Q3. How will “Material Adverse Effect” be defined?

Dawson Creek Timber Supply Area Old Growth Management Areas Assessment Project
62 Research Report - July 2012
The following points/questions deserve consideration: Are there mitigative opportunities that can be applied to reverse or offset
a Material Adverse Effect in a minor intrusion circumstance within an OGMA? For example, can immediate site rehabilitation/reforestation of disturbed CFLB areas
be used as an opportunity to offset losses that occurred during forest clearing operations? If so, would the seral stage, species composition and distribution be taken into consideration?
This question may be most valid in situations in which disturbance occurs within an early seral stage area of the OGMA, as it may be more feasible to re-forest the area and “reverse” the Material Adverse Effect in a short amount of time. This topic will require further discussion to understand if/what opportunities exist to offset a Material Adverse Effect. Allowing for these opportunities may also encourage industrial users to reclaim lands in an expeditious manner.
Since the current regulations do not state what the minor intrusion threshold will be for the OGMAs under OGAA, two main options become available: Use the current FRPA minor intrusion threshold as set out in the order; or Modify the FRPA minor intrusion threshold.
The footprint determination features (as discussed in Section 4.0 a) of this report may be used as a basis for these discussions regarding minor intrusion threshold. Similar to the analysis that was completed in this report, going forward it may not be appropriate to include activities that do not disturb soil (low impact seismic) as contributing to the minor intrusion threshold. Further discussion is required in this regard. • Use the current FRPA rules for minor intrusion which state: Up to 10% in OGMAs less than 50ha; or 5% or 40ha, whichever is less, in OGMAs greater than 50ha.
If the amendment process were to be modified to allow for flexibility in movement or adjustment of OGMA boundaries (i.e. allowance to move OGMAs spatially without triggering a full amendment), further discussion may also be required to understand how enhancements to the amendment process could allow for timely application processing. Additional questions and considerations related to the amendment process are provided in Section 8.5
• Modify the FRPA minor intrusion threshold to provide a new scheme that aligns
with all industrial users.
Q4. Can a “Material Adverse Effect” be reversed?
Q5. What is the minor intrusion threshold?
Dawson Creek Timber Supply Area Old Growth Management Areas Assessment Project
63 Research Report - July 2012
This Option requires further data analysis and discussion with all land users to determine appropriate minor intrusion threshold limits that are mutually productive to industrial users and still achieve the original intent under FRPA. With this additional information, it may be possible to introduce this Option in the future once OGMAs have been established under OGAA and enhanced knowledge regarding the implications of this change is achieved.
All lease holders are given a percentage of the minor intrusion threshold.
If this option were to be pursued, it would require the development and implementation of an additional process to determine how to assign a percentage of the minor intrusion threshold to each tenure holder, and to allow for tenure holders to request additional percentage of the minor intrusion threshold, if necessary.
First come, first serve basis as applications are received. Further discussion may be required to determine how to effectively pursue this option while not encouraging competitiveness between lease holders in OGMAs with multiple tenures and multiple owners per tenure.
d) OGMA Post-Establishment Tracking Process
Once the OGMAs are established under OGAA, a process to monitor the OGMAs for industrial intrusion over time will require development in order to determine if and when the minor intrusion threshold is reached or exceeded. This section will outline and review some considerations regarding tracking the ongoing footprint post-establishment.
Current Tracking Process under FRPA
The current tracking process under FRPA is that industrial activities within an OGMA are referred to FLNRO. On an annual basis the disturbance from these activities is reviewed and tracked non-spatially.
Use of High Resolution Imagery
Q6. How will the minor intrusion threshold be managed when there are multiple lease holders?
Q7. How will the ongoing and cumulative footprint as well as the minor intrusion threshold be spatially tracked and monitored?
Dawson Creek Timber Supply Area Old Growth Management Areas Assessment Project
64 Research Report - July 2012
Use of high resolution imagery as the basis to manually digitize the footprint at predetermined intervals. This option would use a process similar to the one used in this report to determine the current footprint.
Use of Existing Spatial Data
A combination of spatial OGC approved data, spatial crown tenures data, spatial forestry data and as-cleared data from industrial users. Using this option, the data from all sources would be compiled on an annual basis to produce a complete footprint encompassing all industrial users. This option also suggests that high resolution imagery be used to reconcile the footprint through manual digitization at predetermined points in time (for example: every 5-10 years or at an interval that coincides with high resolution imagery production).
Within this option the following points require further discussion:
• If all industrial activities (not just oil and gas activities) will contribute towards the minor intrusion threshold, it will not be possible for the individual oil and gas companies to track and monitor this disturbance with any level of accuracy. Therefore, it may be necessary for the government to develop and implement a tracking process (either spatial or tabular) since they should have access to all the industrial activities within the OGMAs.
• Which features will be classified as footprint in the post-establishment tracking
process (i.e. those in Section 4(a)(i) of this report, or additional features?) • Further clarification is required to determine if the minor intrusion threshold is
cumulative across all industrial users or only to the oil and gas sector.
e) OGMA Amendment Process
This section proposes one primary question regarding the amendment process post-establishment.
During a yearly or bi-annually review, any OGMAs in which the minor intrusion threshold has been exceeded would trigger an amendment for that OGMA.
When an application is submitted that pushes the footprint over the minor intrusion threshold
When the minor intrusion threshold reaches a given percentage.
Q8. When will an amendment be triggered?
Dawson Creek Timber Supply Area Old Growth Management Areas Assessment Project
65 Research Report - July 2012
If this option were pursued, further discussion would be required to determine what the specific percentage of minor intrusion threshold is that would trigger the amendment review process.
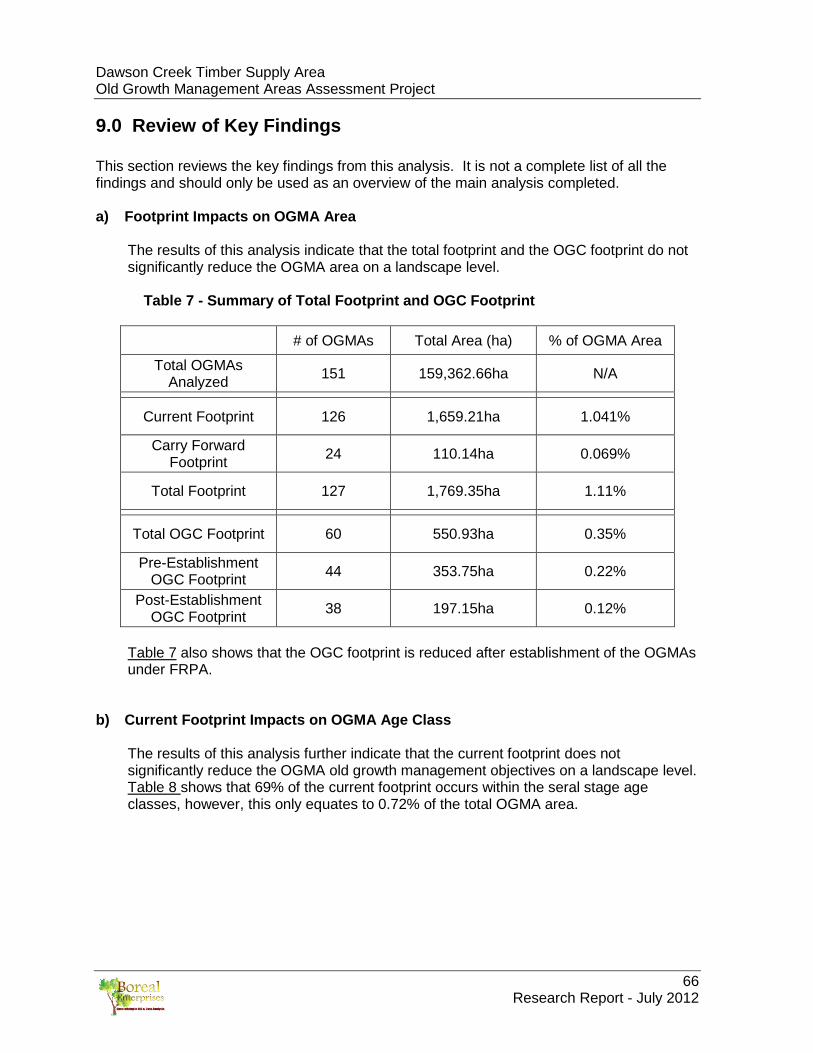
Dawson Creek Timber Supply Area Old Growth Management Areas Assessment Project
66 Research Report - July 2012
9.0 Review of Key Findings This section reviews the key findings from this analysis. It is not a complete list of all the findings and should only be used as an overview of the main analysis completed. a) Footprint Impacts on OGMA Area
The results of this analysis indicate that the total footprint and the OGC footprint do not significantly reduce the OGMA area on a landscape level.
Table 7 - Summary of Total Footprint and OGC Footprint
# of OGMAs Total Area (ha) % of OGMA Area
Total OGMAs Analyzed 151 159,362.66ha N/A
Current Footprint 126 1,659.21ha 1.041%
Carry Forward Footprint 24 110.14ha 0.069%
Total Footprint 127 1,769.35ha 1.11%
Total OGC Footprint 60 550.93ha 0.35%
Pre-Establishment OGC Footprint 44 353.75ha 0.22%
Post-Establishment OGC Footprint 38 197.15ha 0.12%
Table 7 also shows that the OGC footprint is reduced after establishment of the OGMAs under FRPA.
b) Current Footprint Impacts on OGMA Age Class
The results of this analysis further indicate that the current footprint does not significantly reduce the OGMA old growth management objectives on a landscape level. Table 8 shows that 69% of the current footprint occurs within the seral stage age classes, however, this only equates to 0.72% of the total OGMA area.
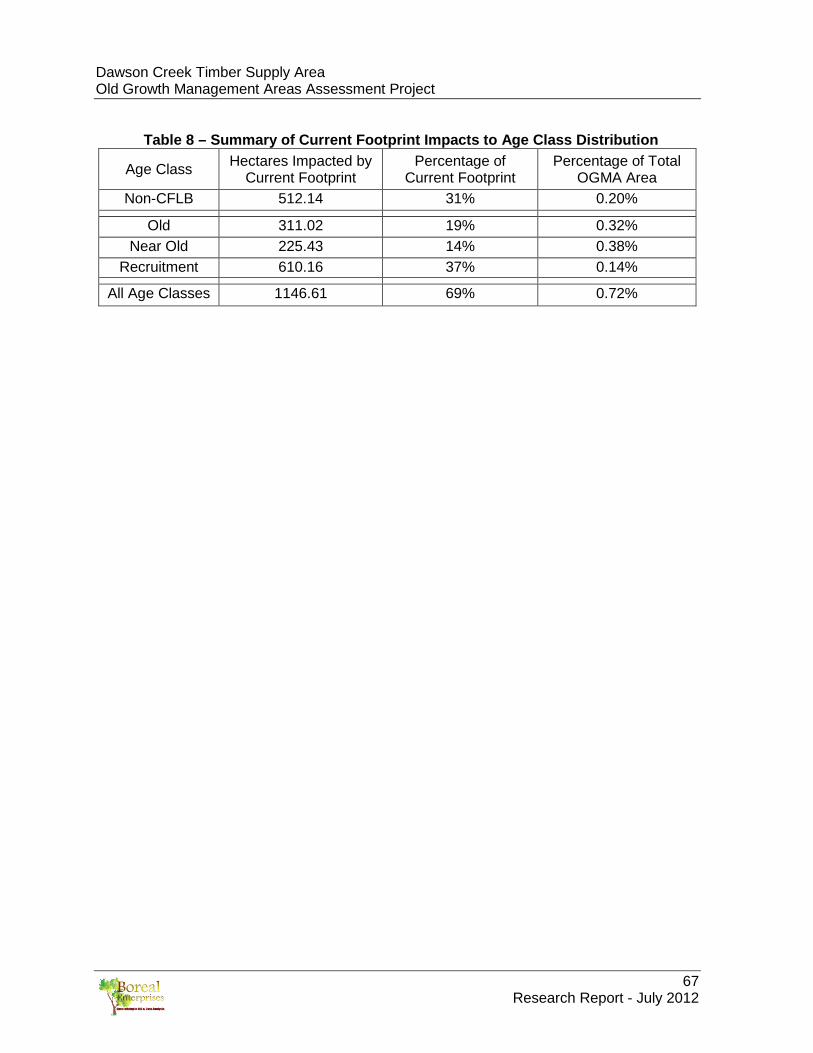
Dawson Creek Timber Supply Area Old Growth Management Areas Assessment Project
67 Research Report - July 2012
Table 8 – Summary of Current Footprint Impacts to Age Class Distribution
Age Class Hectares Impacted by Current Footprint
Percentage of Current Footprint
Percentage of Total OGMA Area
Non-CFLB 512.14 31% 0.20%
Old 311.02 19% 0.32% Near Old 225.43 14% 0.38%
Recruitment 610.16 37% 0.14%
All Age Classes 1146.61 69% 0.72%
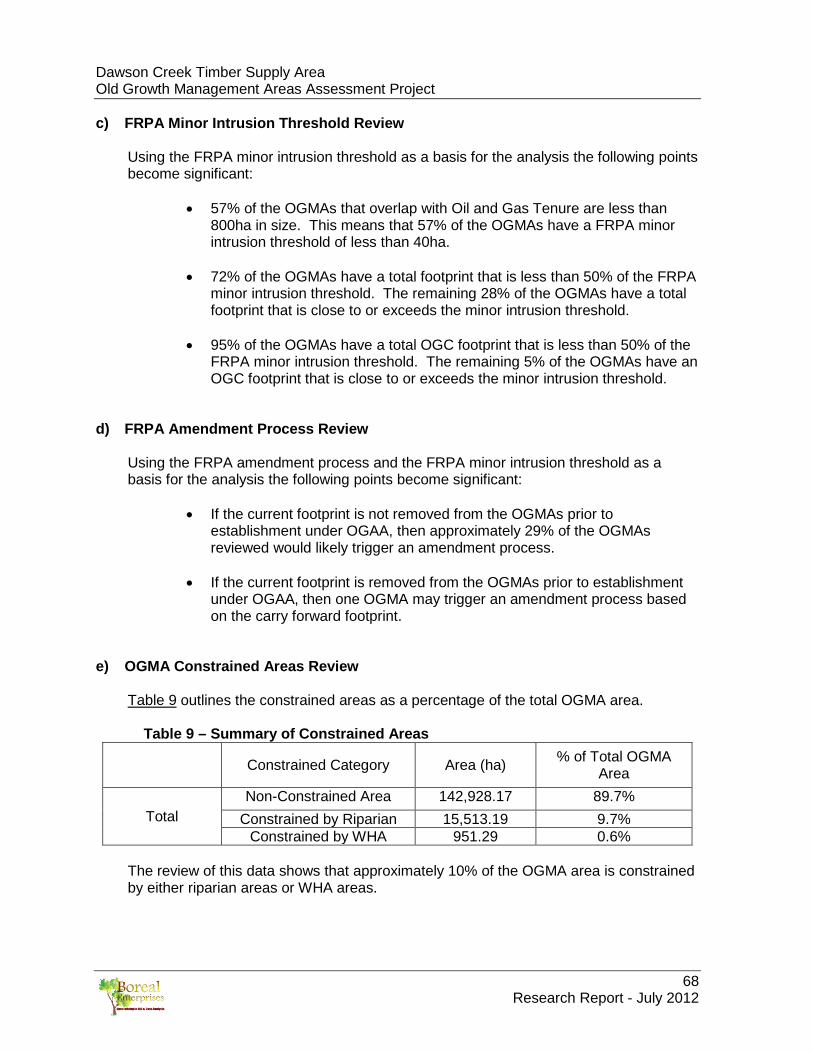
Dawson Creek Timber Supply Area Old Growth Management Areas Assessment Project
68 Research Report - July 2012
c) FRPA Minor Intrusion Threshold Review
Using the FRPA minor intrusion threshold as a basis for the analysis the following points become significant:
• 57% of the OGMAs that overlap with Oil and Gas Tenure are less than 800ha in size. This means that 57% of the OGMAs have a FRPA minor intrusion threshold of less than 40ha.
• 72% of the OGMAs have a total footprint that is less than 50% of the FRPA
minor intrusion threshold. The remaining 28% of the OGMAs have a total footprint that is close to or exceeds the minor intrusion threshold.
• 95% of the OGMAs have a total OGC footprint that is less than 50% of the
FRPA minor intrusion threshold. The remaining 5% of the OGMAs have an OGC footprint that is close to or exceeds the minor intrusion threshold.
d) FRPA Amendment Process Review
Using the FRPA amendment process and the FRPA minor intrusion threshold as a basis for the analysis the following points become significant:
• If the current footprint is not removed from the OGMAs prior to establishment under OGAA, then approximately 29% of the OGMAs reviewed would likely trigger an amendment process.
• If the current footprint is removed from the OGMAs prior to establishment
under OGAA, then one OGMA may trigger an amendment process based on the carry forward footprint.
e) OGMA Constrained Areas Review
Table 9 outlines the constrained areas as a percentage of the total OGMA area.
Table 9 – Summary of Constrained Areas
Constrained Category Area (ha) % of Total OGMA Area
Total Non-Constrained Area 142,928.17 89.7%
Constrained by Riparian 15,513.19 9.7% Constrained by WHA 951.29 0.6%
The review of this data shows that approximately 10% of the OGMA area is constrained by either riparian areas or WHA areas.
Related Documents