DAVID JONES LIMITED Interim Results Presentation 13 March 2000

DAVID JONES LIMITED Interim Results Presentation 13 March 2000.
Dec 30, 2015
Welcome message from author
This document is posted to help you gain knowledge. Please leave a comment to let me know what you think about it! Share it to your friends and learn new things together.
Transcript
DAVID JONES LIMITED
Interim Results Presentation13 March 2000

Peter WilkinsonChief Executive

3
Performance Overview
Improvement
Sales $780.3m + 9.6%
EBIT $ 50.3m +23.3%
PAT (before Abnormals) $ 28.9m +12.9%
EPS (before Abnormals) 7.4c +13.9%
Stock Turn 2.73 times + 6.6%

4
Highlights
• Continued to grow market share
• Strengthened position in WA and Victoria
• Fundamental change in business continuing strongly- benefits still flowing through
• Well positioned to handle any demand swings
• Progress on growth strategy
• New CFO

5
Key Drivers
• Buying department
• Exclusive brands
• Systems improvement
• Cost control
• Supplier relationships
• Customer Service
• Improved marketing

Brian HillChief Financial Officer

7
‘All the Key Financials showed strong growth on the corresponding half’
Key Financials 6 MonthsJan 2000
$m
6 MonthsJan 1999
$mChange
Store Sales 780.3 711.9 +9.6%
EBIT 50.3 40.8 +23.3%
Profit After Tax Before Abnormals 28.9 25.6 +12.9%
Earnings per Share Before Abnormals 7.4 c 6.5 c +13.9%
Dividend per Share 4.0 c 4.0 c -
8
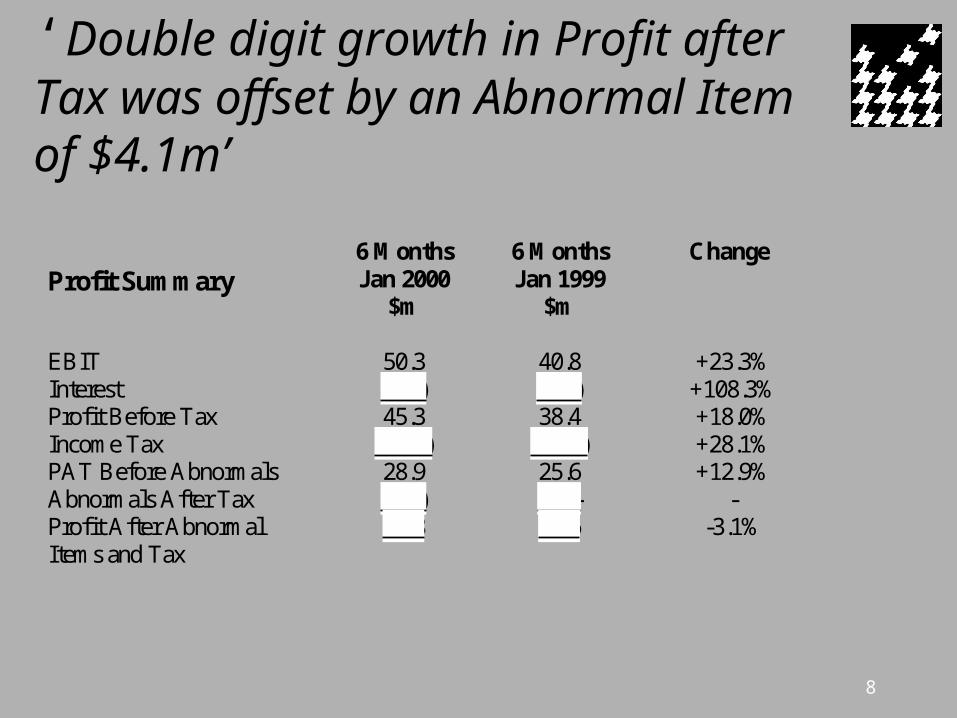
‘Double digit growth in Profit after Tax was offset by an Abnormal Item of $4.1m’
Profit Summary6 MonthsJan 2000
$m
6 MonthsJan 1999
$m
Change
EBIT 50.3 40.8 +23.3%Interest (5.0) (2.4) +108.3%Profit Before Tax 45.3 38.4 +18.0%Income Tax (16.4) (12.8) +28.1%PAT Before Abnormals 28.9 25.6 +12.9%Abnormals After Tax (4.1) - -Profit After AbnormalItems and Tax
24.8 25.6 -3.1%

9
‘Earnings before Interest up 23.3% due to strong growth in Retail Operations and Credit’
Earnings Before Interest & Tax 6 MonthsJan 2000 $m
6 MonthsJan 1999 $m
Change
Retail Earnings 36.0 28.9 +24.6%
Property 9.2 9.1 -
Credit 5.1 2.8 +82.1%
EBIT 50.3 40.8 +23.3%
10
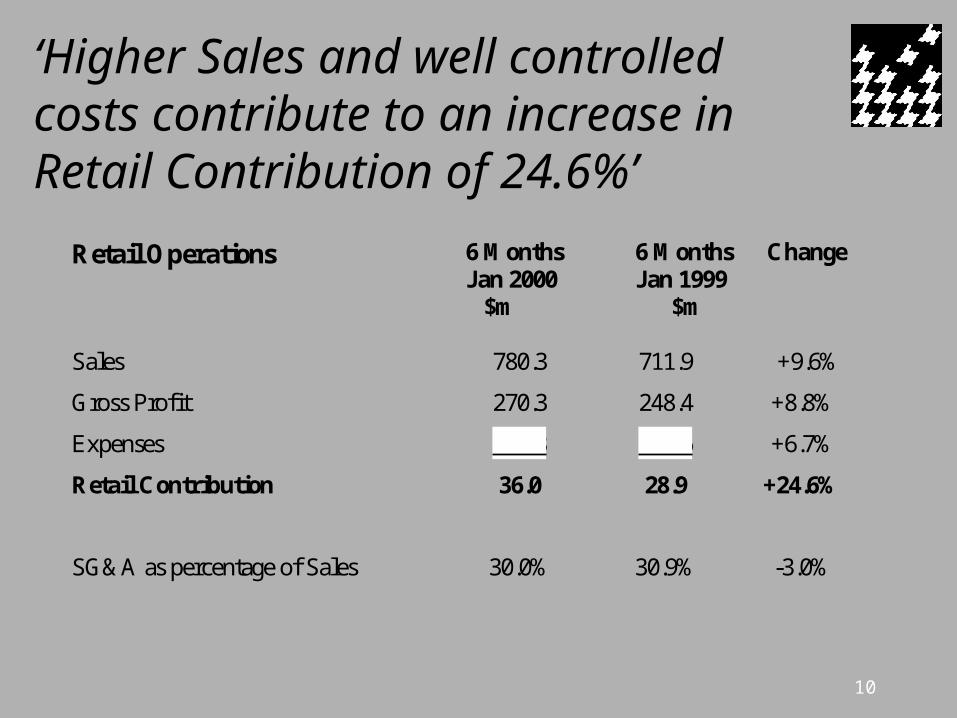
‘Higher Sales and well controlled costs contribute to an increase in Retail Contribution of 24.6%’
Retail Operations 6 MonthsJan 2000 $m
6 MonthsJan 1999 $m
Change
Sales 780.3 711.9 +9.6%
Gross Profit 270.3 248.4 +8.8%
Expenses 234.3 219.6 +6.7%
Retail Contribution 36.0 28.9 +24.6%
SG&A as percentage of Sales 30.0% 30.9% -3.0%
11
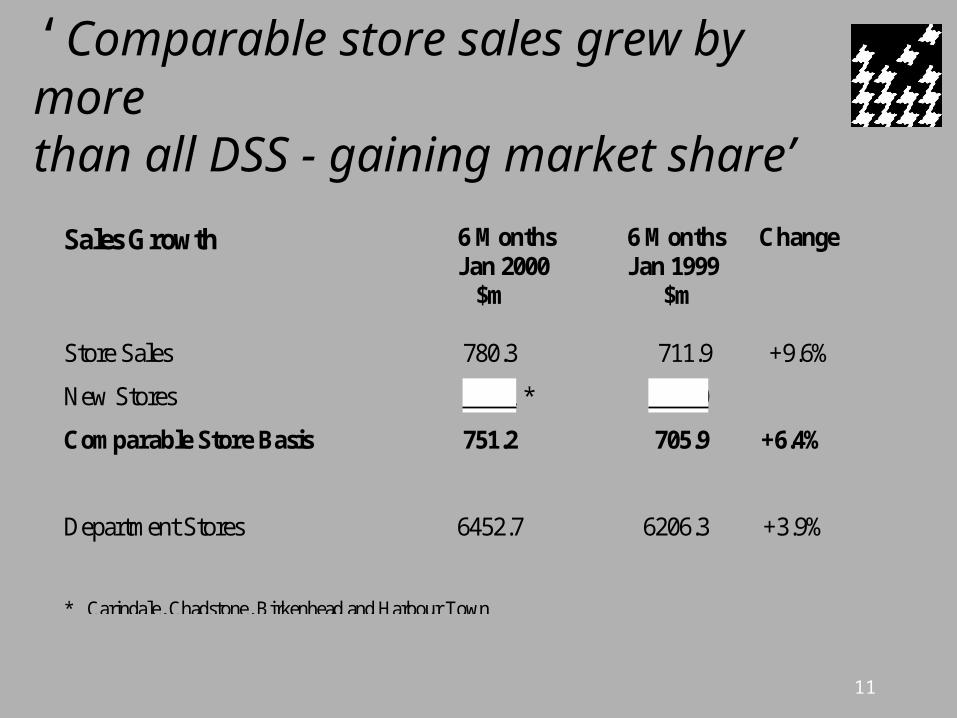
‘Comparable store sales grew by more than all DSS - gaining market share’
Sales Growth 6 MonthsJan 2000 $m
6 MonthsJan 1999 $m
Change
Store Sales 780.3 711.9 +9.6%
New Stores 29.1 * 6.0
Comparable Store Basis 751.2 705.9 +6.4%
Department Stores 6452.7 6206.3 +3.9%
* Carindale, Chadstone, Birkenhead and Harbour Town
12
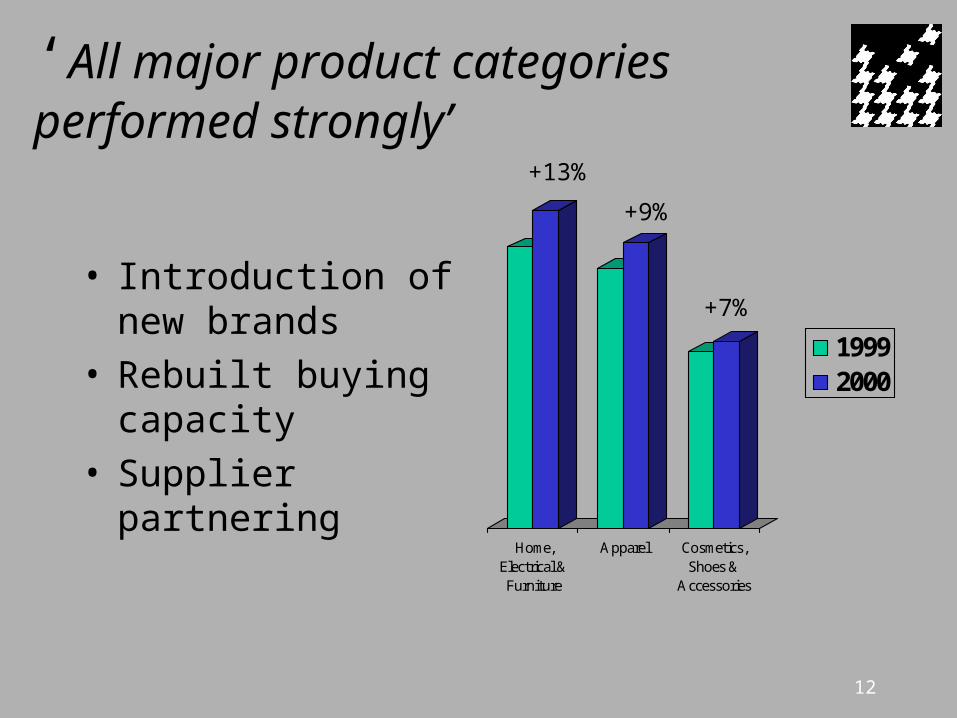
‘All major product categories performed strongly’
• Introduction of new brands
• Rebuilt buying capacity
• Supplier partnering
Home,Electrical &Furniture
Apparel Cosmetics,Shoes &
Accessories
19992000
+13%
+9%
+7%

13
‘Operational efficiencies and fee income drive 82% improvement in Credit Card profits despite higher interest free’
David Jones Credit Card Change on
Corresponding Half
New approved Credit Cards +78%
- Without Shareholder Discount +22%
Operating Expenses + 4%
Fee Income New
Total Card Receivables +16%
Interest Free and Deferred Receivables +42%
14
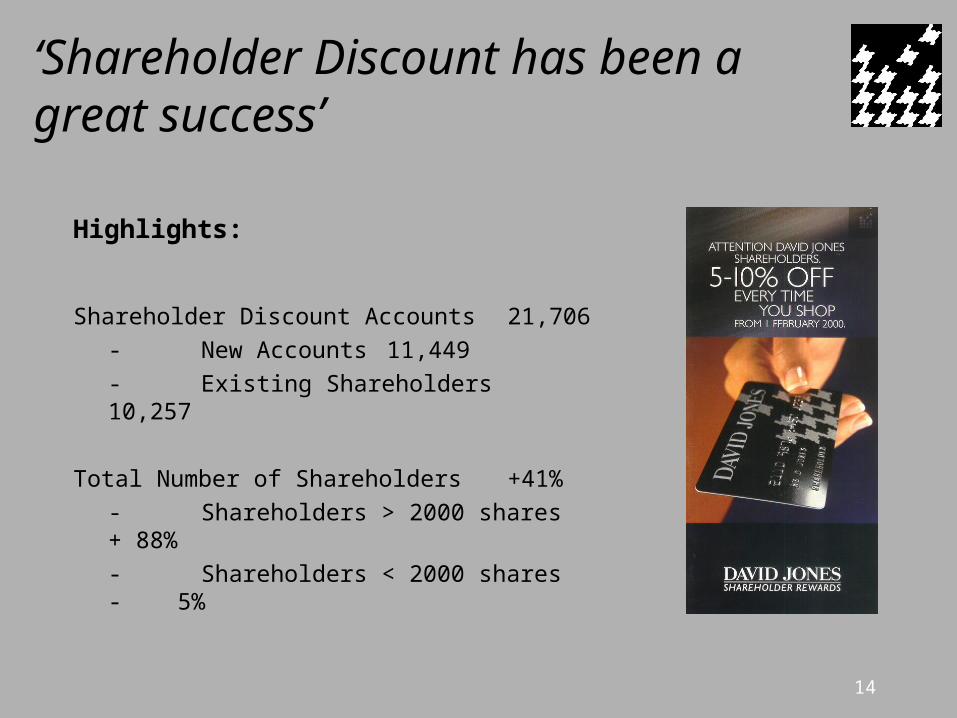
‘Shareholder Discount has been a great success’
Highlights:
Shareholder Discount Accounts 21,706
- New Accounts 11,449
- Existing Shareholders 10,257
Total Number of Shareholders +41%
- Shareholders > 2000 shares + 88%
- Shareholders < 2000 shares - 5%

15
‘Abnormals Reduced Profit After Tax by $4.1m’
Abnormal Item Before Tax $m
Rebated Tax $m
AfterTax$m
Preparing for GST (3.3) 1.2 (2.1)
Adjustment of Net Income
Tax Benefits for Change of
Tax Rate from 36% to 30% - (2.0) (2.0)
Total Abnormal (3.3) (0.8) (4.1)

16
‘Negative Cash Flow primarily due to Capital Return’
Cash Flow 6 MonthsJan 2000
$m
6 MonthJan 1999
$m
Comment
Net Cash Flow (86.6) ( 0.8)
Major Items:
Debtors (7.7) (34.7) Higher debts, but effect ofsecuritisation
Depreciation and Provisions 18.3 18.1 Creditors 36.4 ( 4.2) Higher inventories and timing Dividends (15.7) (11.8) Dividend increases from 3c to 4c Sale of Assets 0.4 21.2 Sale of Rundle Mall last year;
Adelaide in second half Capital Expenditure (65.5) (20.4) Chadstone, Adelaide, Harbour
Town and Southland Return of Capital (79.2) - 20 cents per share return

17
‘Balance Sheet has strengthened with Debt to Equity decreasing from 52.3% to 36.5%’
Balance Sheet 6 MonthsJan 2000
$m
6 MonthJan 1999
$m
Change
$m
Comment
Inventory 250.2 230.3 +19.9
Debtors 74.4 286.6 -212.2 Securitisation of debtors
Property Plant & Equipment 431.7 379.6 +52.1 Adelaide, Chadstone
Other Assets 24.2 19.6
Total Assets 780.6 916.1
Represented by
Creditors & Provisions 213.6 177.2 +36.4 Higher inventories and timing
Borrowings 151.6 253.9 -102.3 Securitisation proceeds/capital return
Equity 415.5 -485.0 -69.5 Capital Return
Debt to Equity 36.5% 52.3%

18
‘Adelaide Central Plaza sale improves Debt to Equity to 20.6% on a pro-forma basis’Pro-forma Balance Sheet(After Sale of Adelaide)
6 MonthsJan 2000
$m
6 MonthJan 1999
$m
Change
$m
Comment
Inventory 250.2 230.3 +19.9
Debtors 74.4 286.6 -212.2 Securitisation of debtors
Property Plant & Equipment 365.8 379.6 -13.8 Chadstone
Other Assets 24.2 19.6
Total Assets 714.7 916.1
Represented by
Creditors & Provisions 213.6 177.2 +36.4 Higher inventories and timing
Borrowings 85.7 253.9 -168.2 Securitisation proceeds/capital return
Equity 415.5 -485.0 -69.5 Capital Return
Debt to Equity 20.6% 52.3%

Peter WilkinsonChief Executive

20
Growth
• Victoria and Western Australia– Underlying growth (Value Proposition)
• Food Business– Customer research positive
– Strong team
– Progress on leases
• E-Commerce– Significantly progressed, hampers success
– Pure plays v. “clicks and mortar”
– multi-channel
• Full strategy briefing “field day” in June

21
Outlook
• Environment in 2H will be impacted by GST– Positioned to handle any swings in demand
• Continue to trade in line with expectations
• Maximising Shareholder Value over-riding corporate objective
Related Documents