Introduction to PowerPivot EXT945 David Dye

David Dye. Introduction Introduction to PowerPivot Working With PowerPivot.
Jan 03, 2016
Welcome message from author
This document is posted to help you gain knowledge. Please leave a comment to let me know what you think about it! Share it to your friends and learn new things together.
Transcript

Introduction to PowerPivotEXT945
David Dye

Introduction Introduction to PowerPivot Working With PowerPivot
Introduction to Microsoft SQL Server Reporting Services

Introduction to PowerPivot

What is PowerPivot? Free add in for Excel Extends Excel capabilities Allows business analysts to create self-service
analytics solutions UtilizesVertiPaq technology
◦ PowerPivot 2010 uses VertiPaq◦ PowerPivot 2013 uses xVelocity
Next generation of the VertiPaq engine◦ VERY fast as it is in-memory technology
If you don’t have enough memory for the project it won’t open
Consider 64Bit◦ Provides native compression
Embedded Analysis database
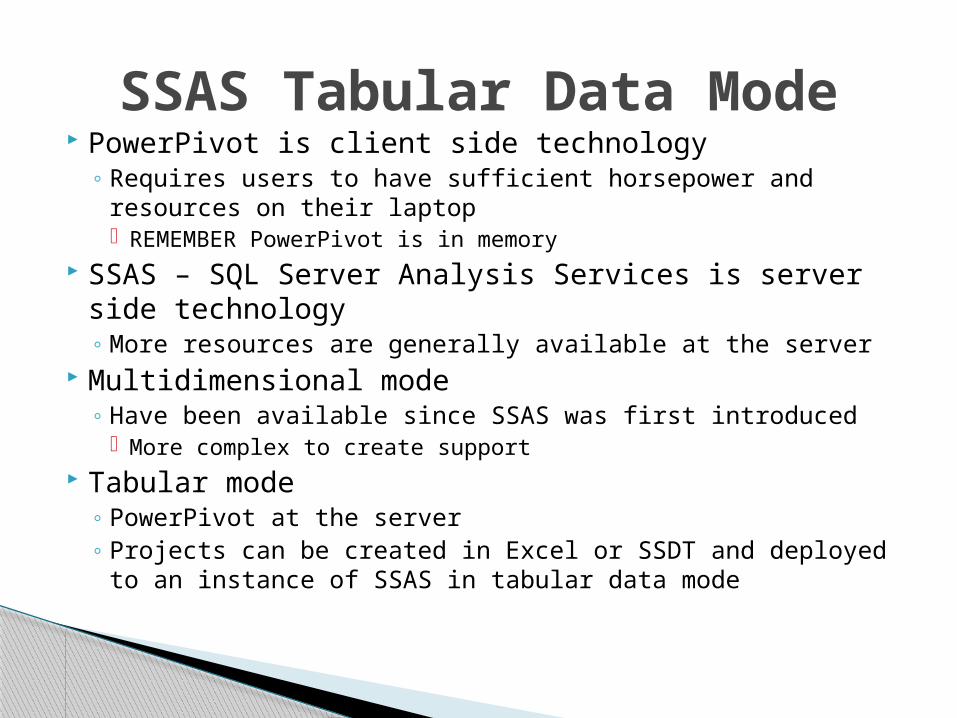
SSAS Tabular Data Mode PowerPivot is client side technology
◦ Requires users to have sufficient horsepower and resources on their laptop REMEMBER PowerPivot is in memory
SSAS – SQL Server Analysis Services is server side technology◦ More resources are generally available at the server
Multidimensional mode◦ Have been available since SSAS was first introduced
More complex to create support Tabular mode
◦ PowerPivot at the server◦ Projects can be created in Excel or SSDT and deployed
to an instance of SSAS in tabular data mode

Excel vs. PowerPivot PowerPivot
◦ In-memory MUCH faster◦ 10x-15x data compression◦ Multidimensional◦ Supports
KPI’s Hierarchies
◦ DAX Data analysis expression language Similar, but more powerful, than the Excel expressions
◦ Integrate multiple sources Excel SQL OData Multidimensional Excel
◦ Organize multiple sources in a relational way

Working with PowerPivot

Working with PowerPivot Once installed the PowerPivot menu is
available
Unless created in PowerPivot it is nothing more than a spreadsheet◦ KEEP IN MIND PowerPivot is ALL in memory
64bit is preferred. If there is not enough memory the PowerPivot project
Cannot be opened Cannot be saved

Data Sources PowerPivot can utilize different data source:
◦ SQL Server◦ SSAS multidimensional data models◦ Excel◦ Clipboard◦ PowerPivot ◦ OData◦ SharePoint lists◦ Access◦ Windows Azure marketplace◦ Text◦ OLEDB◦ ODBC◦ ANYTHING you can connect to!!
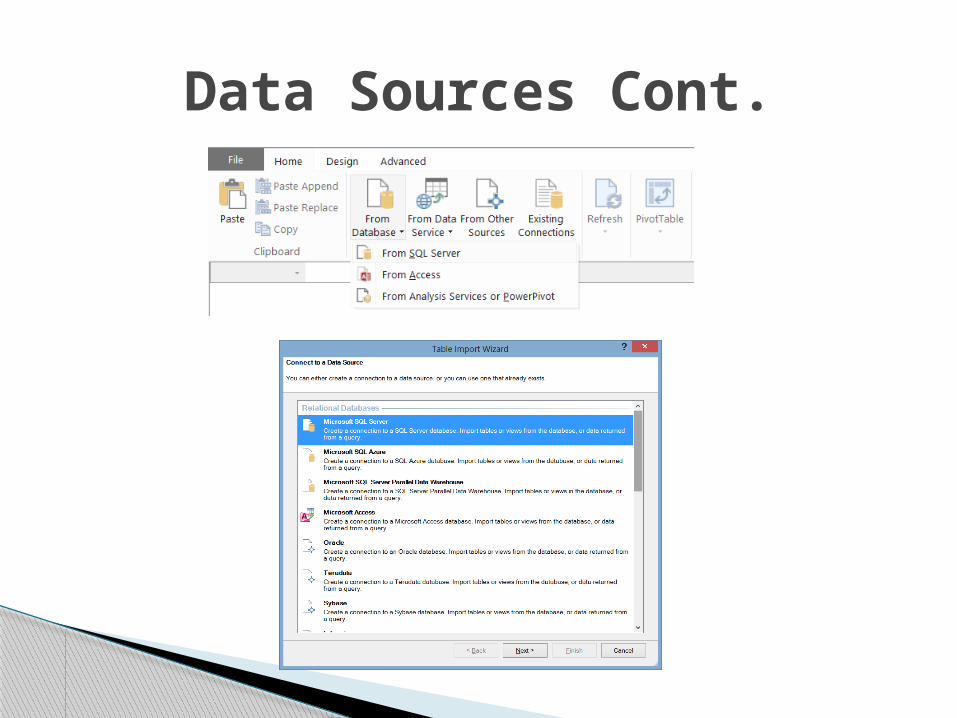
Data Sources Cont.

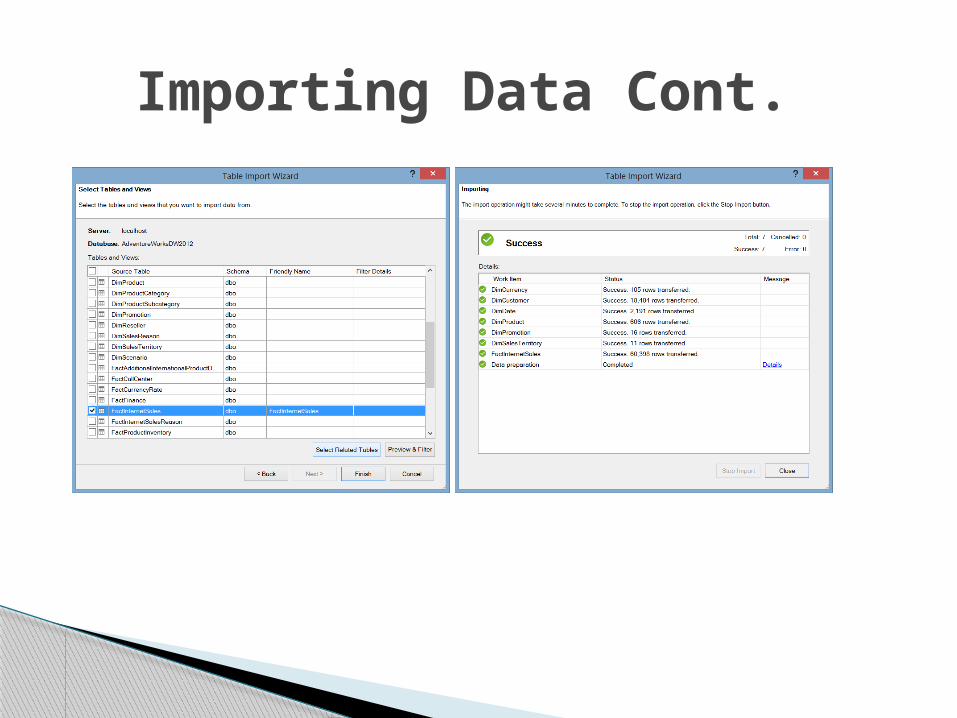
Importing Data Based on data connection Supports
◦ Filtering◦ Friendly Name◦ Defining columns to import
ONLY TAKE WHAT YOU NEED! In memory can quickly fill up with unused data Once finished the data will be loaded in memory
Importing Data Cont.

Unique data source that imports data from the clipboard◦ Not recommended◦ The data exists ONLY in the PowerPivot sheet◦ Cannot be refreshed◦ Best practice to use persistent data sources
SQL Excel SSAS Etc.
Clipboard
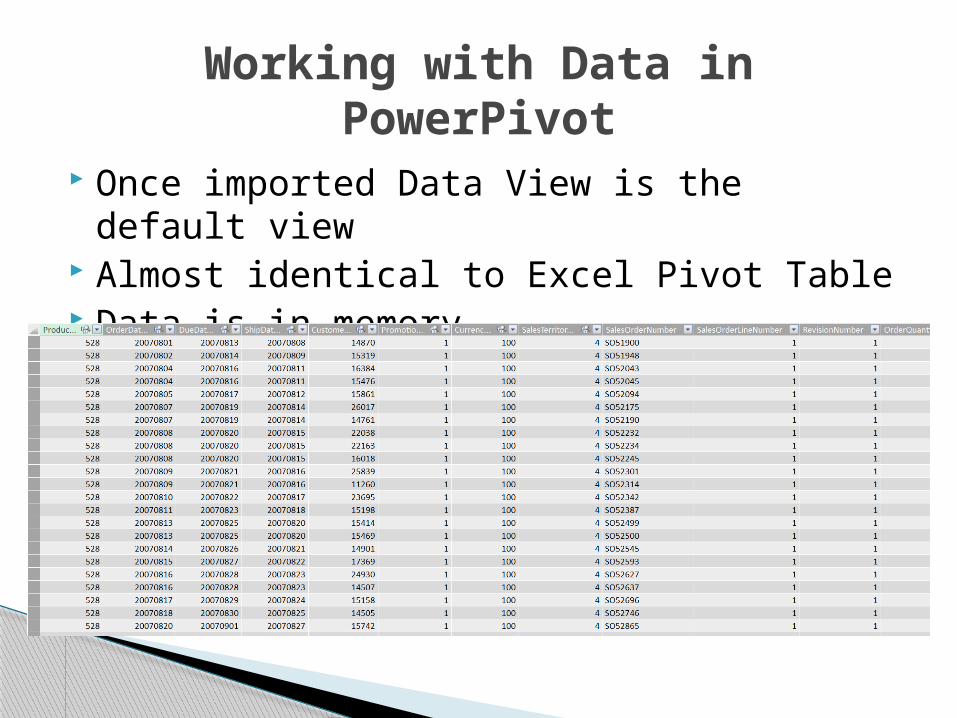
Once imported Data View is the default view Almost identical to Excel Pivot Table Data is in memory
Working with Data in PowerPivot
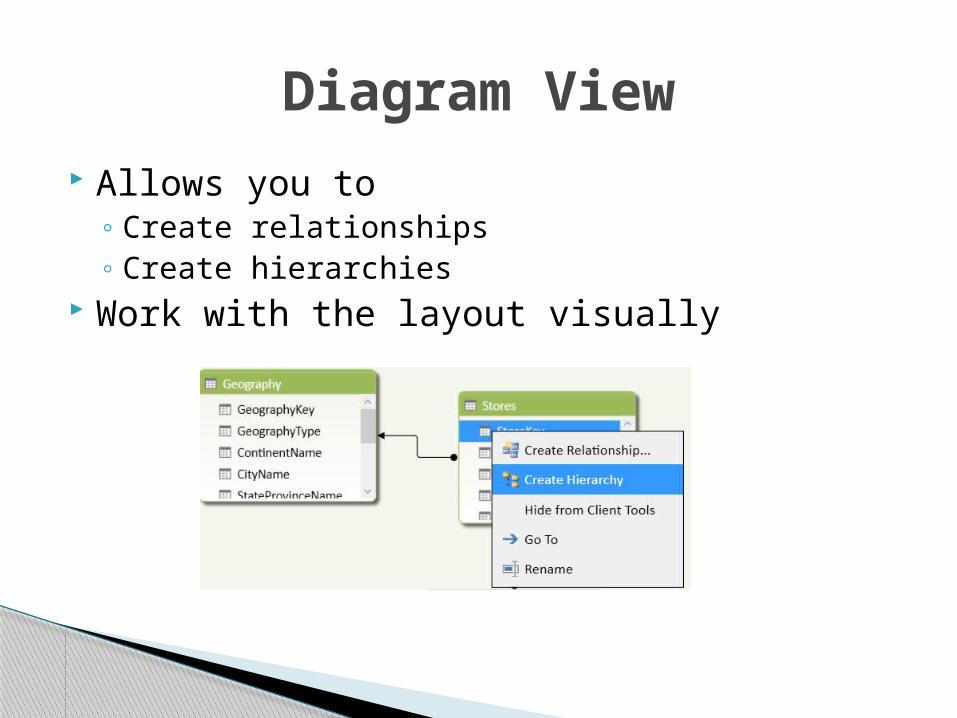
Allows you to◦ Create relationships ◦ Create hierarchies
Work with the layout visually
Diagram View

Allows you to◦ View the data in a spreadsheet type layout
Add calculated column DAX measures
Data View

Provide an easy means for users to navigate Can consist of multiple columns
◦ Examples Year>Month>Day◦ Fiscal Year>Fiscal Quarter>Fiscal Month◦ State>City>Zip code
Hierarchies

Provides a focused subset of the Power Pivot project
Allows a means to focus attention on specific areas of a project
IS NOT a means of security Similar to a view in SQL Server without the
security boundary
Perspective

Once created the project can be navigated using a pivot table
Provides all of the features and functionality of any PivotTable◦ Add Excel formulas
PivotTable

Can be created from within Power Pivot or Excel
PivotChart

Introduced in Excel 2010 Provides the ability to filter data with the
click of a button Easily configurable Available for
◦ Pivot tables◦ Pivot charts◦ When connecting to SSAS
Both tabular data model multidimensional cubes
Slicers
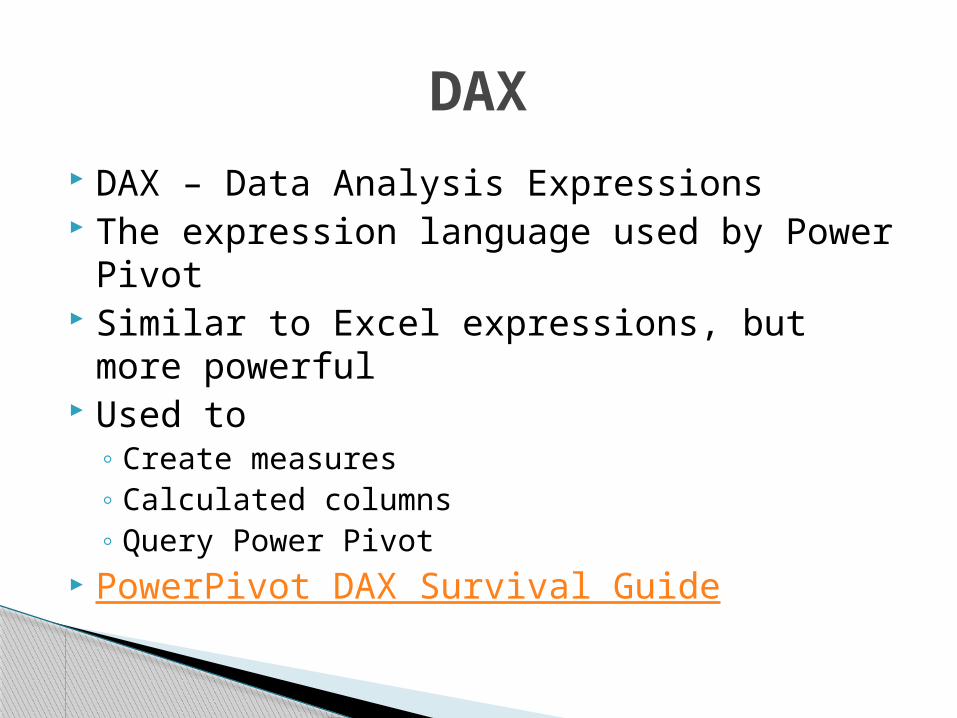
DAX – Data Analysis Expressions The expression language used by Power
Pivot Similar to Excel expressions, but more
powerful Used to
◦ Create measures◦ Calculated columns◦ Query Power Pivot
PowerPivot DAX Survival Guide
DAX
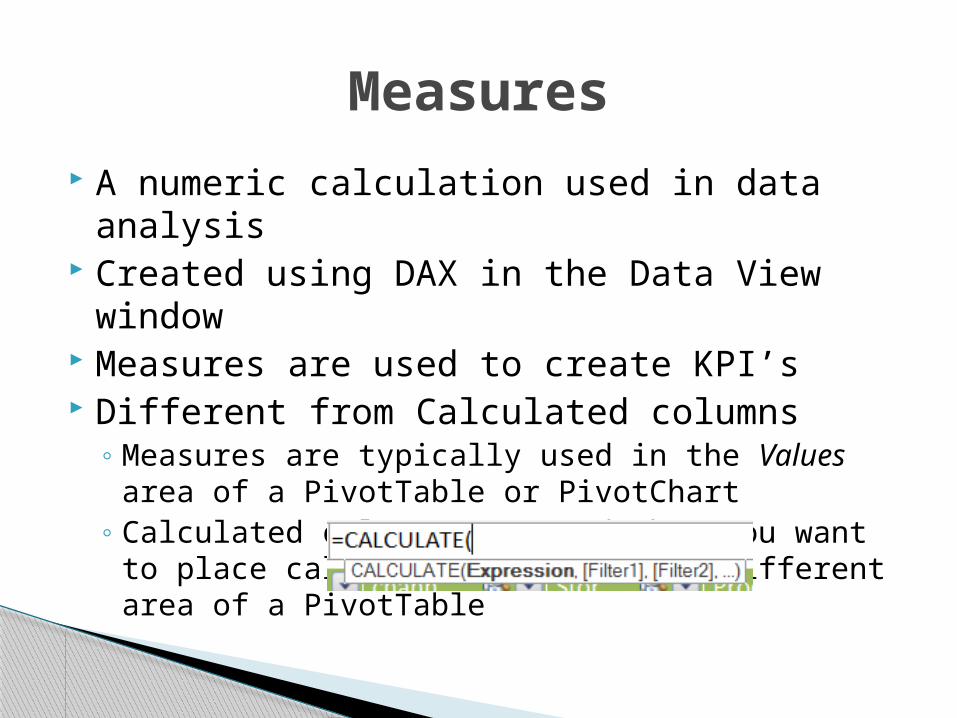
A numeric calculation used in data analysis Created using DAX in the Data View window Measures are used to create KPI’s Different from Calculated columns
◦ Measures are typically used in the Values area of a PivotTable or PivotChart
◦ Calculated columns are used when you want to place calculated results in a different area of a PivotTable
Measures

KPI – Key Performance Indicator Based on a specific calculated measures Provides a graphical representation of
measures of performance
KPI

Follow along◦ http://technet.microsoft.com/en-us/library/
gg413497.aspx
DEMONSTRATION
Related Documents