Dataset Integrity Check for the Diabetes Prevention Program Outcomes Study Phase 1 Data Files Prepared by RTI International 3040 Cornwallis Road Research Triangle Park, NC 27709-2194 March, 2013

Welcome message from author
This document is posted to help you gain knowledge. Please leave a comment to let me know what you think about it! Share it to your friends and learn new things together.
Transcript
Dataset Integrity Check for the Diabetes Prevention Program
Outcomes Study Phase 1 Data Files
Prepared by
RTI International 3040 Cornwallis Road
Research Triangle Park, NC 27709-2194 March, 2013

Revision History Version Author/Title Date Comments
1.0 Norma Pugh March, 2013 Original
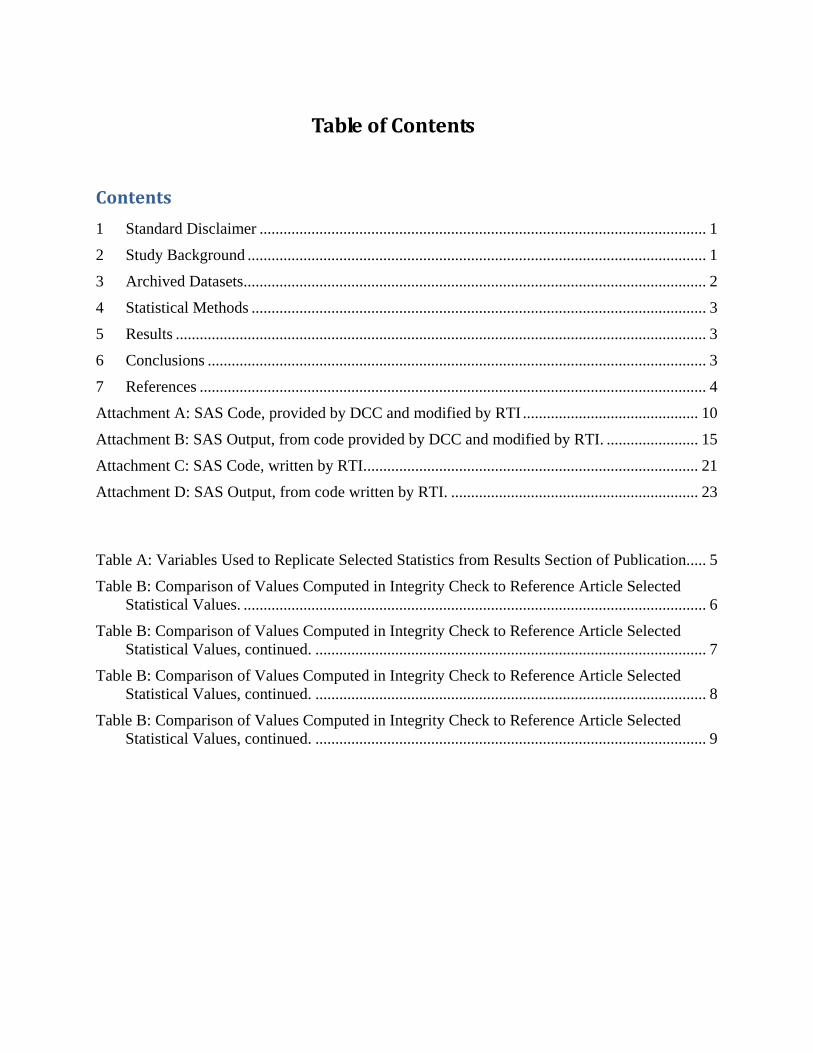
Table of Contents
Contents 1 Standard Disclaimer ................................................................................................................ 1
2 Study Background ................................................................................................................... 1
3 Archived Datasets .................................................................................................................... 2
4 Statistical Methods .................................................................................................................. 3
5 Results ..................................................................................................................................... 3
6 Conclusions ............................................................................................................................. 3
7 References ............................................................................................................................... 4
Attachment A: SAS Code, provided by DCC and modified by RTI ............................................ 10
Attachment B: SAS Output, from code provided by DCC and modified by RTI. ....................... 15
Attachment C: SAS Code, written by RTI. ................................................................................... 21
Attachment D: SAS Output, from code written by RTI. .............................................................. 23
Table A: Variables Used to Replicate Selected Statistics from Results Section of Publication. .... 5
Table B: Comparison of Values Computed in Integrity Check to Reference Article Selected Statistical Values. .................................................................................................................... 6
Table B: Comparison of Values Computed in Integrity Check to Reference Article Selected Statistical Values, continued. .................................................................................................. 7
Table B: Comparison of Values Computed in Integrity Check to Reference Article Selected Statistical Values, continued. .................................................................................................. 8
Table B: Comparison of Values Computed in Integrity Check to Reference Article Selected Statistical Values, continued. .................................................................................................. 9
DPP Phase 1: ADDENDUM
1
1 Standard Disclaimer The intent of this DSIC is to provide confidence that the data distributed by the NIDDK repository is a
true copy of the study data. Our intent is not to assess the integrity of the statistical analyses reported by
study investigators. As with all statistical analyses of complex datasets, complete replication of a set of
statistical results should not be expected on a first (or second) exercise in secondary analysis. This occurs
for a number of reasons including differences in the handling of missing data, restrictions on cases
included in samples for a particular analysis, software coding used to define complex variables, etc.
Experience suggests that most discrepancies can ordinarily be resolved by consultation with the study
data coordinating center (DCC); however, this process is labor-intensive for both DCC and Repository
staff. It is thus not our policy to resolve every discrepancy that is observed in an integrity check.
Specifically, we do not attempt to resolve minor or inconsequential discrepancies with published results
or discrepancies that involve complex analyses, unless NIDDK Repository staff suspect that the observed
discrepancy suggests that the dataset may have been corrupted in storage, transmission, or processing by
repository staff. We do, however, document in footnotes to the integrity check those instances in which
our secondary analyses produced results that were not fully consistent with those reported in the target
publication.
2 Study Background The Diabetes Prevention Program (DPP) was a major multicenter clinical research study aimed at
discovering whether modest weight loss through dietary changes and increased physical activity or
treatment with the oral diabetes drug metformin (Glucophage) could prevent or delay the onset of type 2
diabetes in study participants. At the beginning of the DPP, participants were all overweight and had
prediabetes [1].
The DPP found that participants who lost a modest amount of weight through dietary changes and
increased physical activity sharply reduced their chances of developing diabetes. Taking metformin also
reduced risk, although less dramatically. The DPP resolved its research questions earlier than projected
and, following the recommendation of an external monitoring board, the study was halted a year early.
The researchers published their findings in the February 7, 2002, issue of the New England Journal of
Medicine [1], [2].
Following unblinding of the Diabetes Prevention Program (DPP) results, a 16-session lifestyle
intervention program (DPP Bridge) was offered to all study participants, including those who had initially
DPP Phase 1: ADDENDUM
2
been randomized to lifestyle treatment. Venditti et al. compare the effects of the lifestyle program
between participants who had previous exposure and those who had not [3].
Following DPP Bridge, the Diabetes Prevention Program Outcomes Study (DPPOS Phase 1) protocol
was initiated. Lifestyle sessions were offered to all participants every 3 months. DPP lifestyle
participants were also offered two group classes, each comprising four sessions per year. Those
previously assigned to the metformin group continued the drug, now unmasked, as tolerated, unless the
drug was discontinued for protocol or safety reasons. Outcome assessment examinations continued on the
same yearly and 6 monthly schedule as in the DPP. DPP results concluded that diabetes incidence in
high-risk adults was reduced by 58% with intensive lifestyle intervention and by 31% with metaformin,
compared with placebo. Knowler et al. investigate the long term (10-year follow-up) persistence of these
effects [2], [3].
3 Archived Datasets Original DPP Data: All SAS data files, as provided by the Data Coordinating Center (DCC), are located
in the DPP data folder in the “v2.1\Data\DPP_Data_2008\Form Data\Data” and
“v2.1\Data\DPP_Data_2008\Non-Form Data\Data” sub-folders of the Official Archive. Only clinics and
participants with IRB approval and informed consent to distribute their data to the repository are included.
Out of the 3,819 original DPP participants, 3,665 participants are included in this release dataset [4].
Bridge Data: All SAS data files, as provided by the Data Coordinating Center (DCC), are located in the
DPP Bridge data folder in the “DPP_Bridge_Official_Archive\DPP_BRIDGE_Data\Form_based” and
“DPP_Bridge_Official_Archive\DPP_BRIDGE_Data\non_form_based” sub-folders of the Official
Archive. Only clinics and participants with IRB approval and informed consent to distribute their data to
the repository are included. Out of the 3,819 DPP participants, 3,655 are included in the DPP Bridge
datasets [5].
Outcomes Study (Phase 1) Data: All SAS data files, as provided by the Data Coordinating Center (DCC),
are located in the DPPOS Phase 1 data folder in the “DPPOS_PHASE1_Data\form-based” and
“DPPOS_PHASE1_Data\non-form-based” sub-folders of the Official Archive. Only clinics and
participants with IRB approval and informed consent to distribute their data to the repository are included.
Out of the 3,250 participants who consented to DPPOS Phase 1, there are 3,049 participants included in
this release dataset [6].
DPP Phase 1: ADDENDUM
3
4 Statistical Methods The DCC created archived datasets separately by study phase (DPP, DPP Bridge, and DPPOS Phase 1),
and provided code to be used to correctly merge the 3 sets of data. That code was then modified by the
Repository statistician to run on the data files housed at the repository. The code was tested and analyses
were run to verify the integrity of the data.
Analyses include:
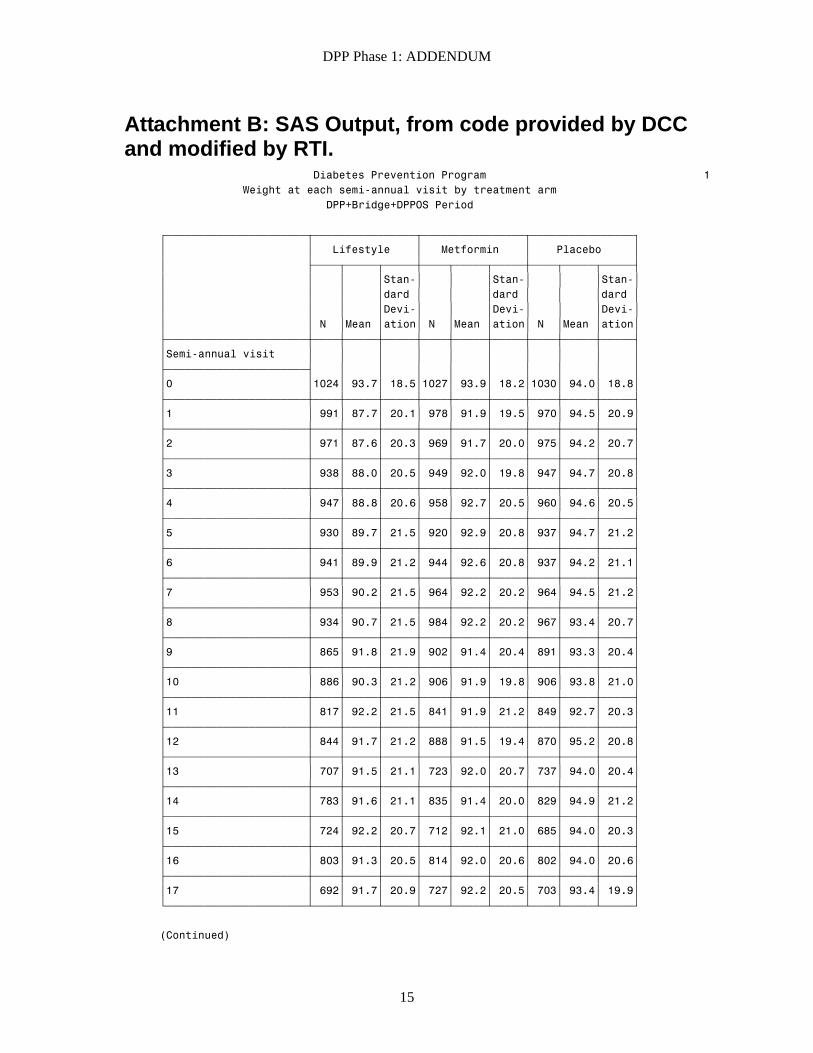
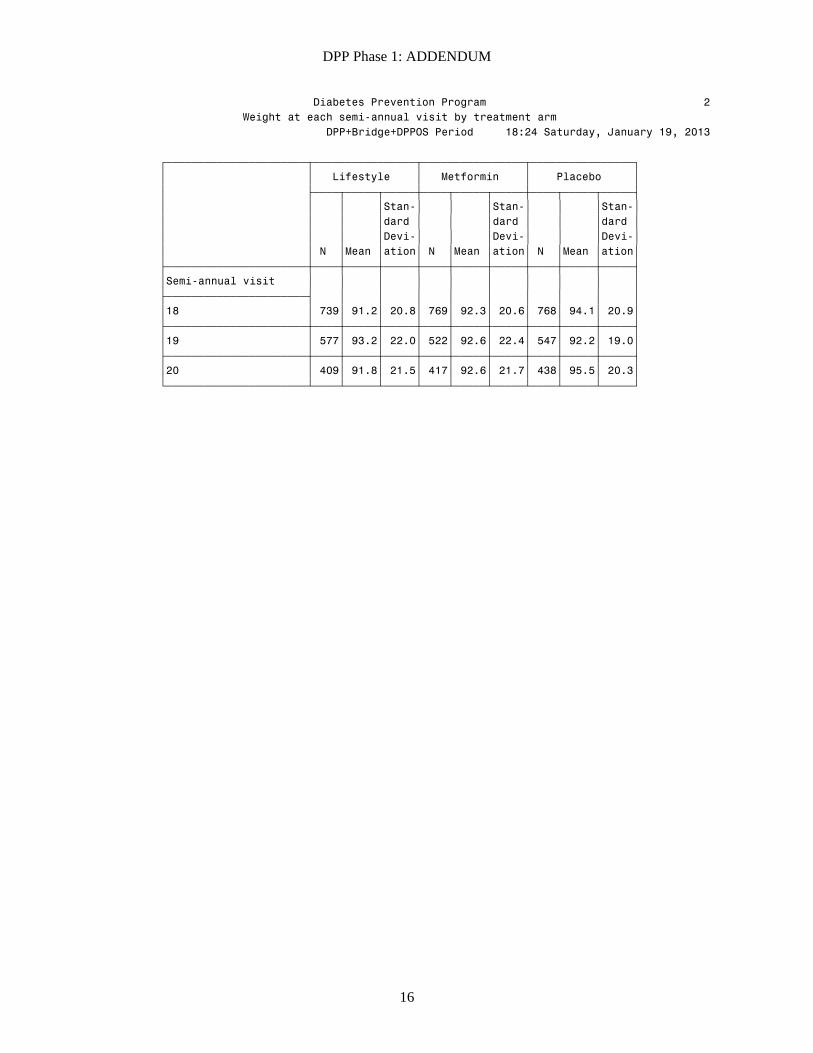
1. Weight at each semi-annual visit by treatment arm, for the full DPP + Bridge + Phase 1 period.
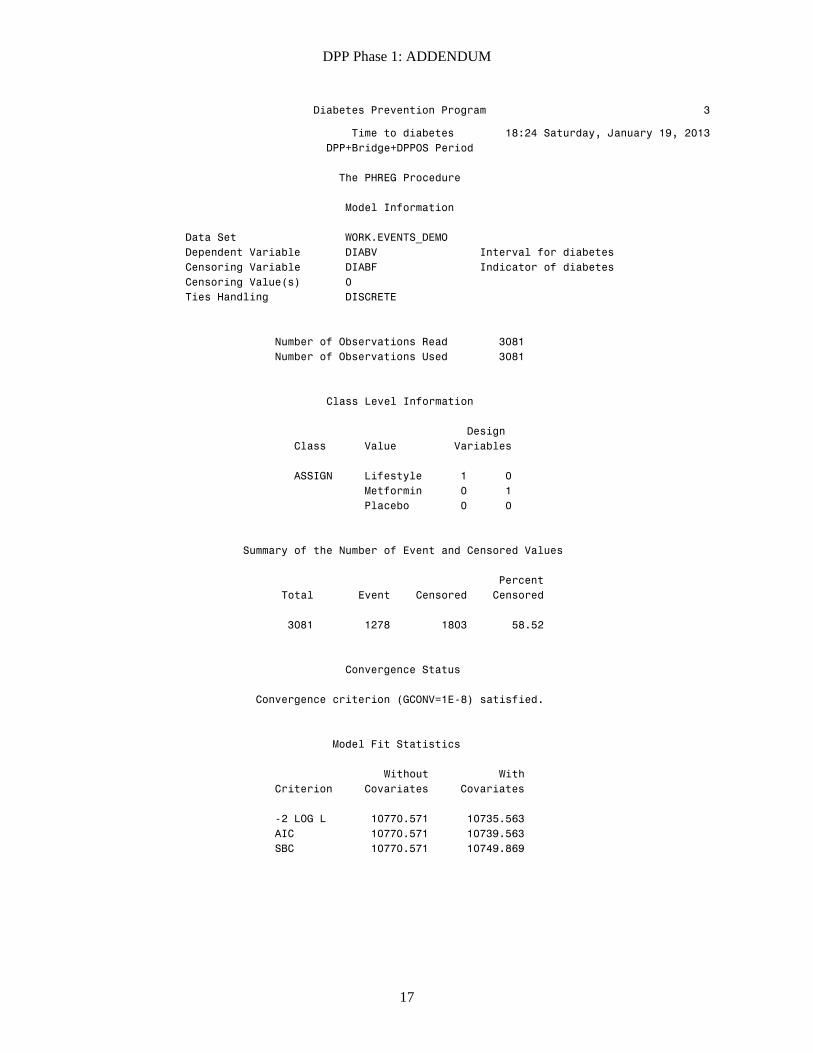
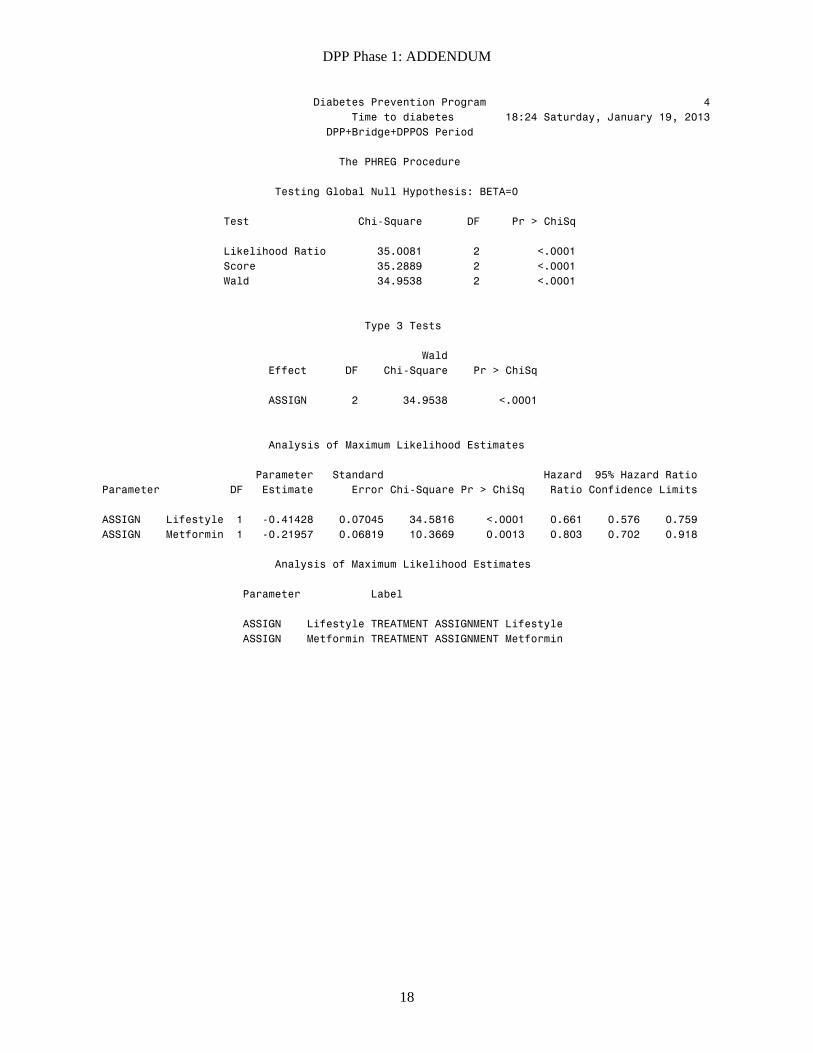
2. Cox proportional hazards model (Time to Diabetes) for the full DPP + Bridge + Phase 1 period.
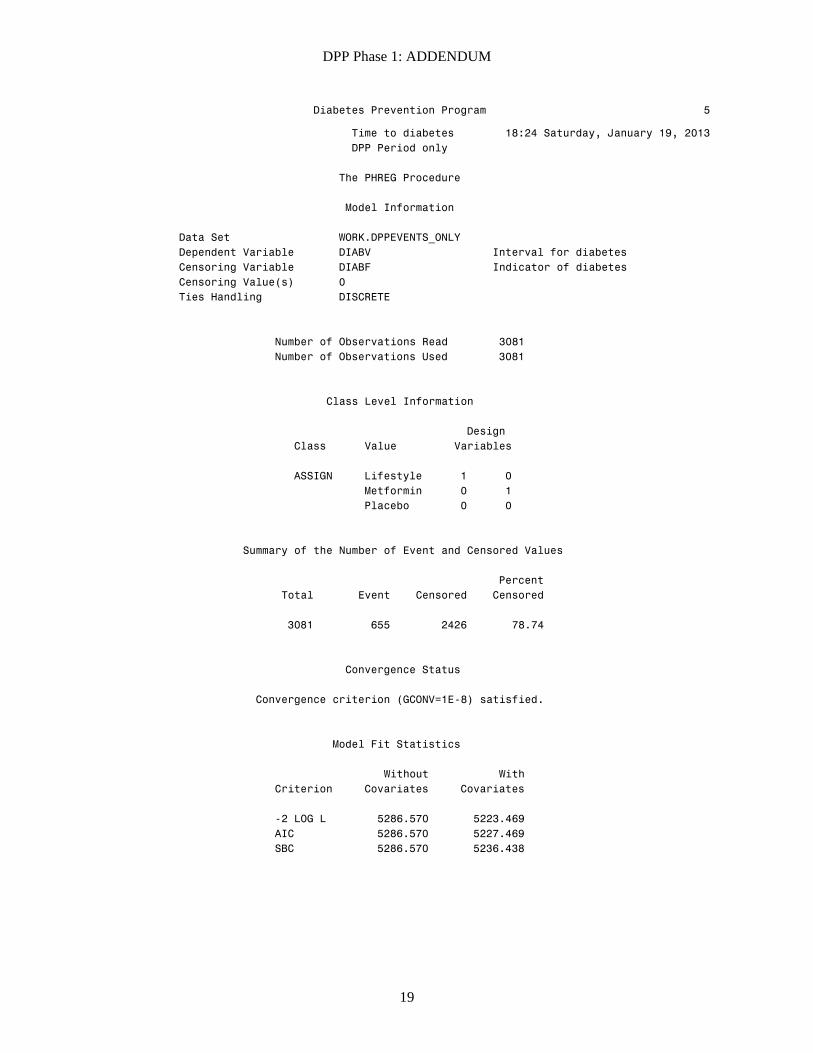
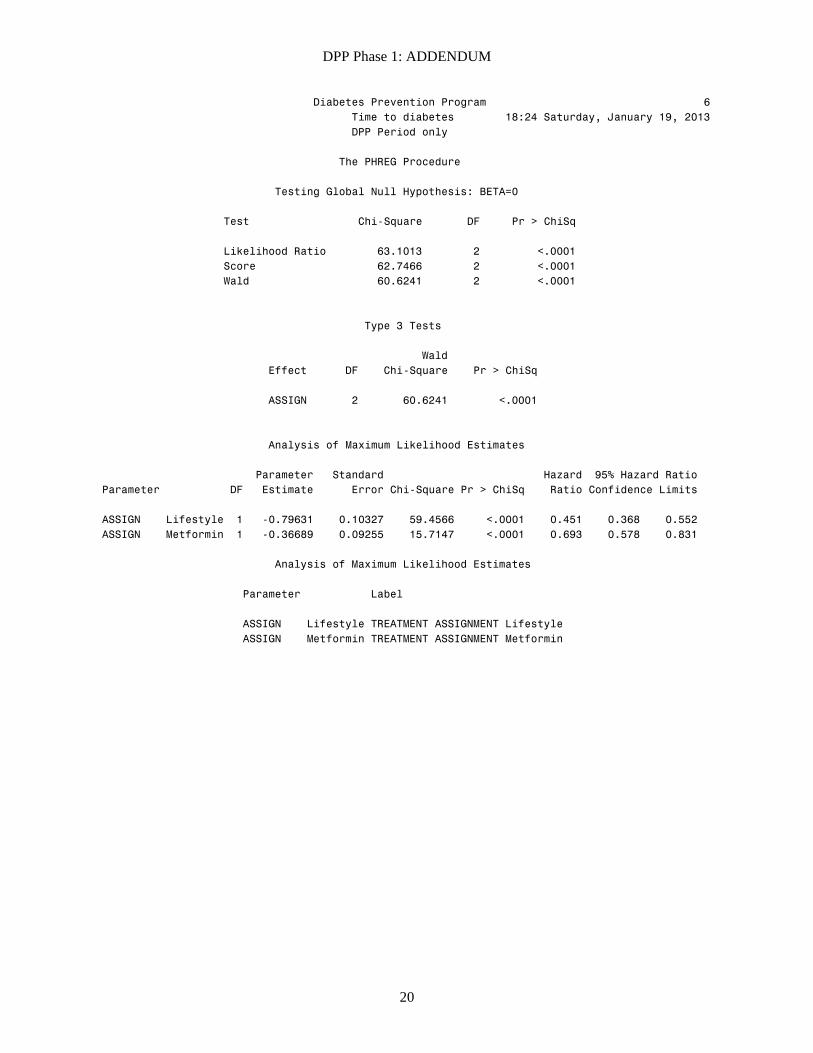
3. Cox proportional hazards model (Time to Diabetes) for the DPP period only.
The complete SAS program and resulting output are included in Attachments A and B.
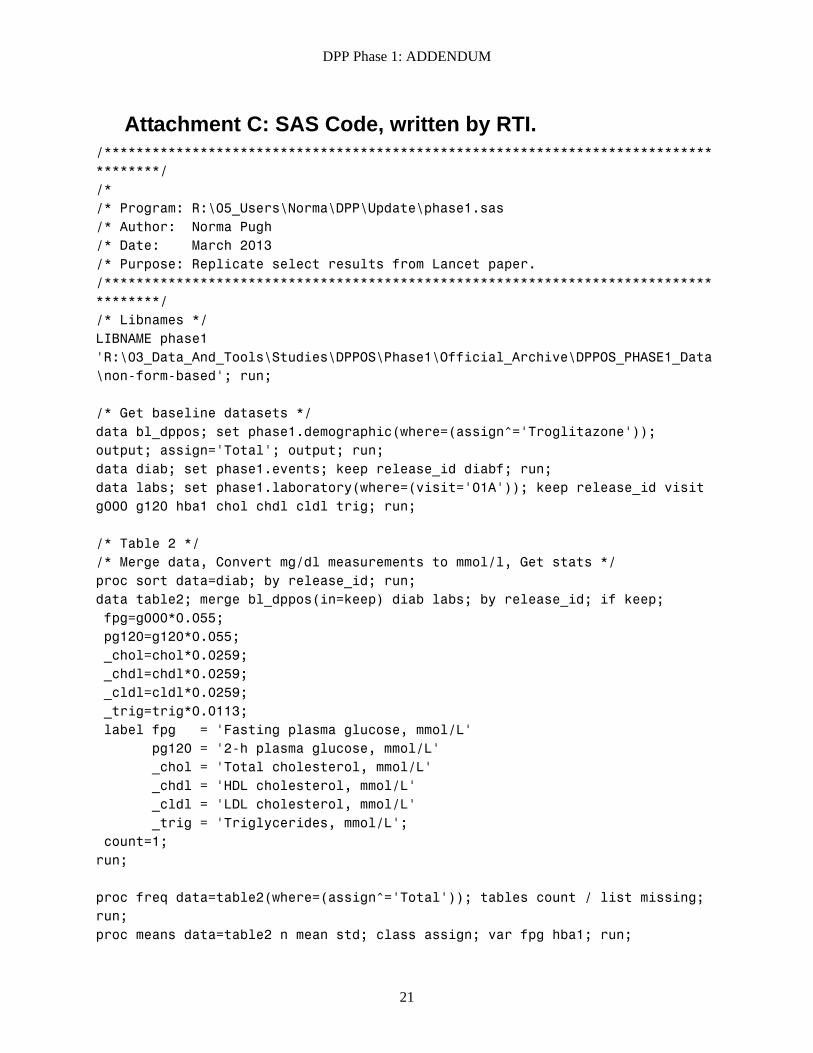
Additionally, we replicated selected variables published by Knowler et al. [2] in the Lancet, 2009. The
SAS program and resulting output for this replication are included in Attachments C and D.
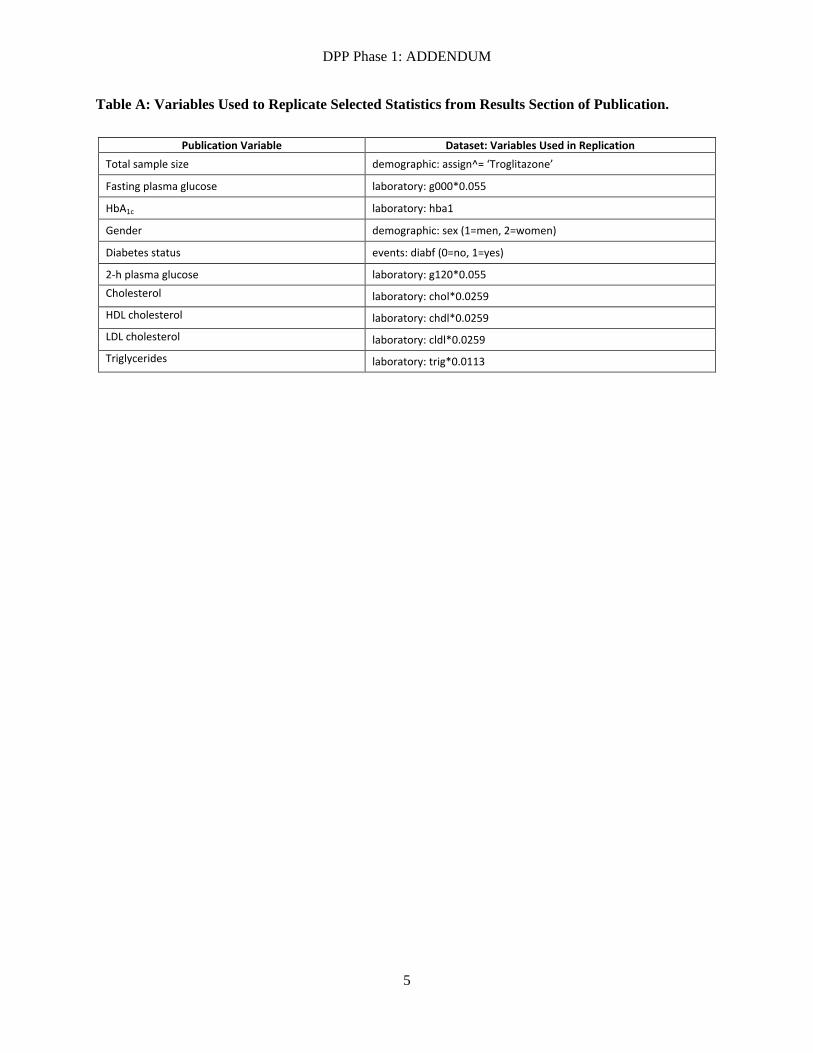
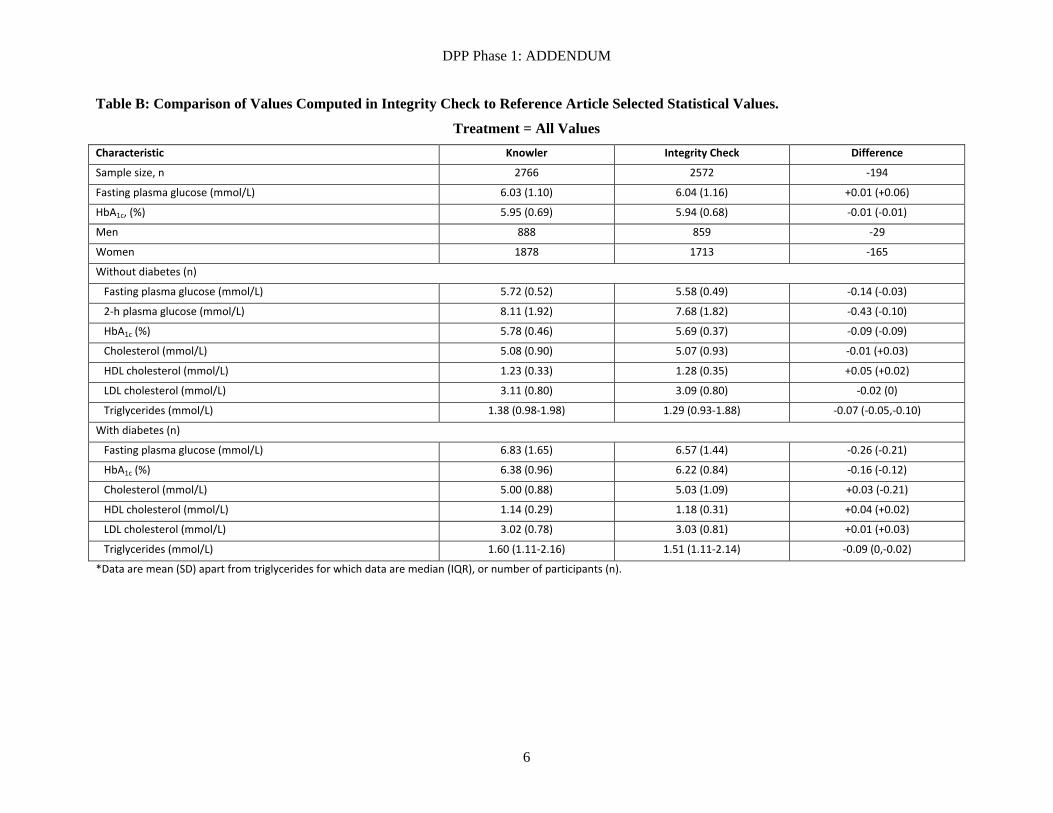
5 Results Selected statistics cover a variety of demographic and laboratory values. Our Table A lists the variables
we used in our replication. Table B compares the results calculated from the archived data file to the
published results. The results of this replication are quite similar to the published results. Note that the
DPP data deposited in the Repository exclude a small subset of DPP participants who did not consent to
making their data available in the Repository. Thus, we did not expect exact replication of statistics from
published studies.
6 Conclusions Based on our Dataset Integrity Checks of previous datasets from the DPP studies, in addition to these
subsequent analyses of the DPP Bridge and Phase 1 data files, we have every reason to believe that the
DPP Phase 1 data files distributed by the NIDDK Repository are true copies of the study data.

DPP Phase 1: ADDENDUM
4
7 References 1. National Diabetes Information Clearinghouse (NDIC) website:
http://diabetes.niddk.nih.gov/dm/pubs/preventionprogram/index.aspx
2. Diabetes Prevention Program Research Group, Knowler WC, Barrett-Connor E, Fowler SE,
Hamman RF, Lachin JM, Walker EA, Nathan DM (2002) Reduction in the incidence of type 2
diabetes with lifestyle intervention or metformin. New England Journal of Medicine, 2002 Feb
7; 346(6):393-403.
3. E.M. Venditti, et al. (2008) First versus repeat treatment with a lifestyle intervention program:
attendance and weight loss outcomes. International Journal of Obesity; 2008 Oct; 32(10):1537-
44.
4. National Institute of Diabetes and Digestive and Kidney Diseases (NIDDK) Data Coordinating
Center (DCC) (2012) DPP Phase 1 Documentation, stored in the
“DPPOS_PHASE1_Documentations” folder.
5. National Institute of Diabetes and Digestive and Kidney Diseases (NIDDK) Data Coordinating
Center (DCC) (2012) DPP Documentation, stored in the
“Official_Archive\v2.1\Documentation\DPP_2008_Data_Release_Docs” folder.
6. National Institute of Diabetes and Digestive and Kidney Diseases (NIDDK) Data Coordinating
Center (DCC) (2012) DPP Phase 1 Documentation, stored in the
“DPPOS_PHASE1_Documentations” folder.
DPP Phase 1: ADDENDUM
5
Table A: Variables Used to Replicate Selected Statistics from Results Section of Publication.
Publication Variable Dataset: Variables Used in Replication
Total sample size demographic: assign^= ‘Troglitazone’
Fasting plasma glucose laboratory: g000*0.055
HbA1c laboratory: hba1
Gender demographic: sex (1=men, 2=women)
Diabetes status events: diabf (0=no, 1=yes)
2-h plasma glucose laboratory: g120*0.055 Cholesterol laboratory: chol*0.0259 HDL cholesterol laboratory: chdl*0.0259 LDL cholesterol laboratory: cldl*0.0259 Triglycerides laboratory: trig*0.0113
DPP Phase 1: ADDENDUM
6
Table B: Comparison of Values Computed in Integrity Check to Reference Article Selected Statistical Values.
Treatment = All Values Characteristic Knowler Integrity Check Difference
Sample size, n 2766 2572 -194
Fasting plasma glucose (mmol/L) 6.03 (1.10) 6.04 (1.16) +0.01 (+0.06)
HbA1c, (%) 5.95 (0.69) 5.94 (0.68) -0.01 (-0.01)
Men 888 859 -29
Women 1878 1713 -165
Without diabetes (n)
Fasting plasma glucose (mmol/L) 5.72 (0.52) 5.58 (0.49) -0.14 (-0.03)
2-h plasma glucose (mmol/L) 8.11 (1.92) 7.68 (1.82) -0.43 (-0.10)
HbA1c (%) 5.78 (0.46) 5.69 (0.37) -0.09 (-0.09)
Cholesterol (mmol/L) 5.08 (0.90) 5.07 (0.93) -0.01 (+0.03)
HDL cholesterol (mmol/L) 1.23 (0.33) 1.28 (0.35) +0.05 (+0.02)
LDL cholesterol (mmol/L) 3.11 (0.80) 3.09 (0.80) -0.02 (0)
Triglycerides (mmol/L) 1.38 (0.98-1.98) 1.29 (0.93-1.88) -0.07 (-0.05,-0.10)
With diabetes (n)
Fasting plasma glucose (mmol/L) 6.83 (1.65) 6.57 (1.44) -0.26 (-0.21)
HbA1c (%) 6.38 (0.96) 6.22 (0.84) -0.16 (-0.12)
Cholesterol (mmol/L) 5.00 (0.88) 5.03 (1.09) +0.03 (-0.21)
HDL cholesterol (mmol/L) 1.14 (0.29) 1.18 (0.31) +0.04 (+0.02)
LDL cholesterol (mmol/L) 3.02 (0.78) 3.03 (0.81) +0.01 (+0.03)
Triglycerides (mmol/L) 1.60 (1.11-2.16) 1.51 (1.11-2.14) -0.09 (0,-0.02)
*Data are mean (SD) apart from triglycerides for which data are median (IQR), or number of participants (n).
DPP Phase 1: ADDENDUM
7
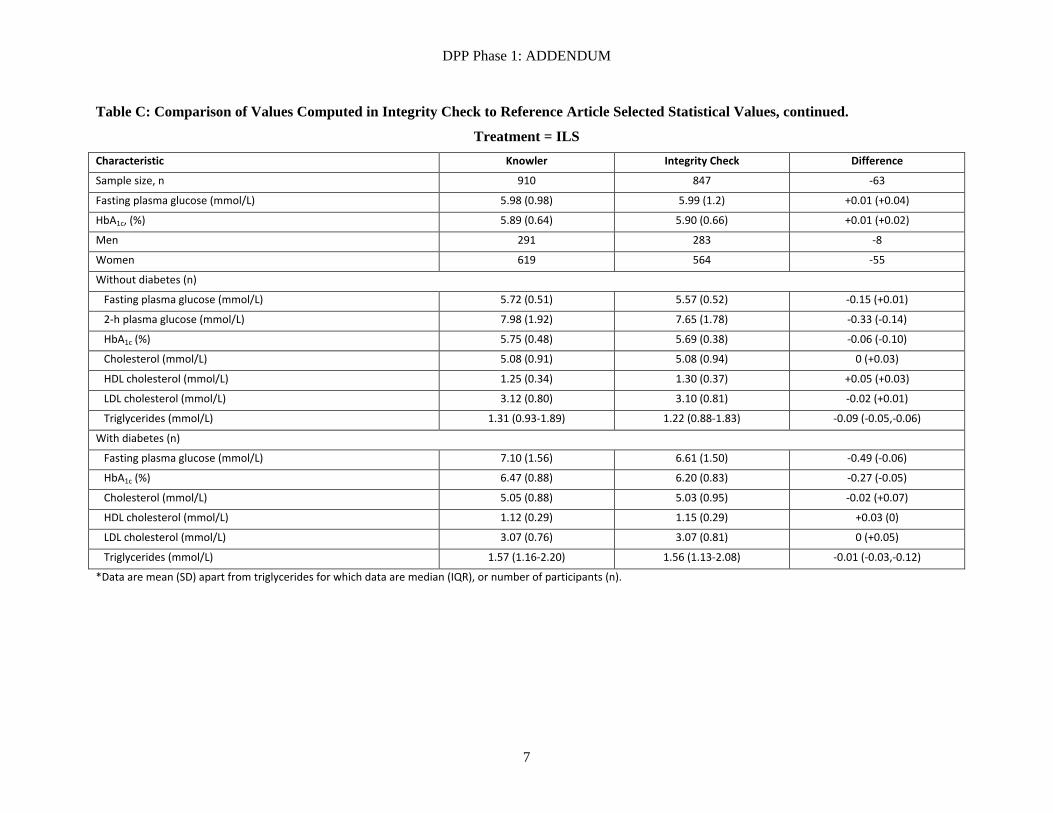
Table C: Comparison of Values Computed in Integrity Check to Reference Article Selected Statistical Values, continued.
Treatment = ILS Characteristic Knowler Integrity Check Difference
Sample size, n 910 847 -63
Fasting plasma glucose (mmol/L) 5.98 (0.98) 5.99 (1.2) +0.01 (+0.04)
HbA1c, (%) 5.89 (0.64) 5.90 (0.66) +0.01 (+0.02)
Men 291 283 -8
Women 619 564 -55
Without diabetes (n)
Fasting plasma glucose (mmol/L) 5.72 (0.51) 5.57 (0.52) -0.15 (+0.01)
2-h plasma glucose (mmol/L) 7.98 (1.92) 7.65 (1.78) -0.33 (-0.14)
HbA1c (%) 5.75 (0.48) 5.69 (0.38) -0.06 (-0.10)
Cholesterol (mmol/L) 5.08 (0.91) 5.08 (0.94) 0 (+0.03)
HDL cholesterol (mmol/L) 1.25 (0.34) 1.30 (0.37) +0.05 (+0.03)
LDL cholesterol (mmol/L) 3.12 (0.80) 3.10 (0.81) -0.02 (+0.01)
Triglycerides (mmol/L) 1.31 (0.93-1.89) 1.22 (0.88-1.83) -0.09 (-0.05,-0.06)
With diabetes (n)
Fasting plasma glucose (mmol/L) 7.10 (1.56) 6.61 (1.50) -0.49 (-0.06)
HbA1c (%) 6.47 (0.88) 6.20 (0.83) -0.27 (-0.05)
Cholesterol (mmol/L) 5.05 (0.88) 5.03 (0.95) -0.02 (+0.07)
HDL cholesterol (mmol/L) 1.12 (0.29) 1.15 (0.29) +0.03 (0)
LDL cholesterol (mmol/L) 3.07 (0.76) 3.07 (0.81) 0 (+0.05)
Triglycerides (mmol/L) 1.57 (1.16-2.20) 1.56 (1.13-2.08) -0.01 (-0.03,-0.12)
*Data are mean (SD) apart from triglycerides for which data are median (IQR), or number of participants (n).
DPP Phase 1: ADDENDUM
8
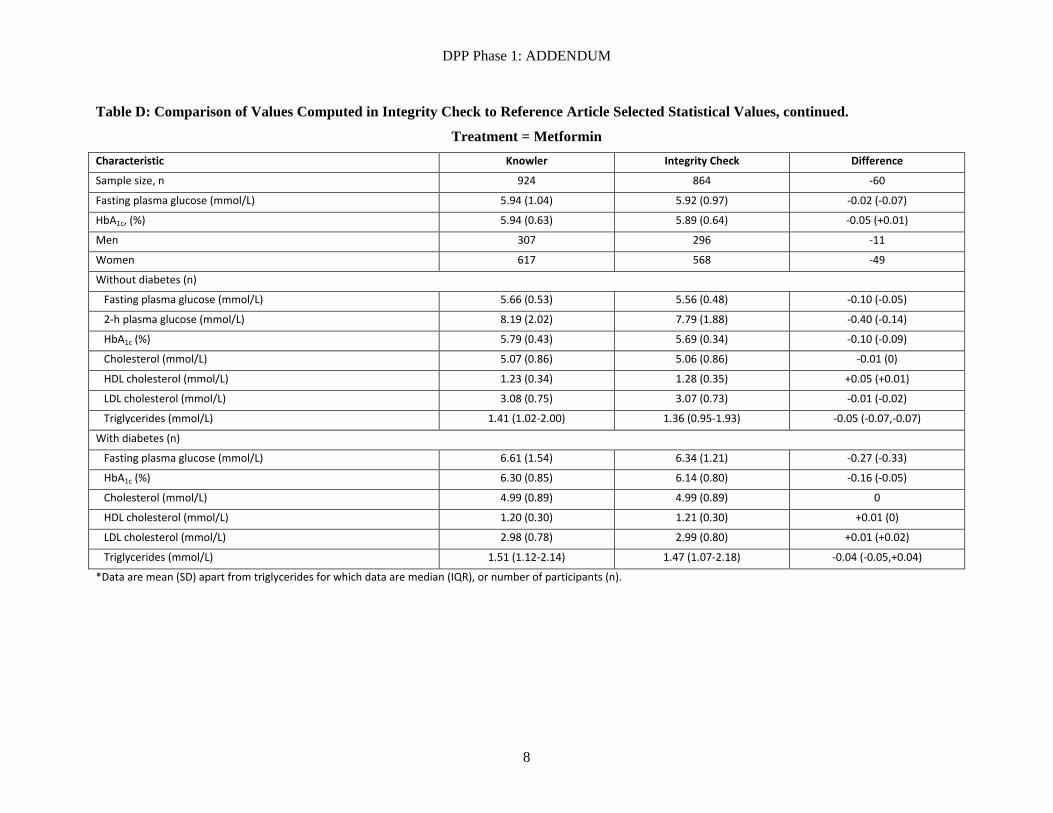
Table D: Comparison of Values Computed in Integrity Check to Reference Article Selected Statistical Values, continued.
Treatment = Metformin Characteristic Knowler Integrity Check Difference
Sample size, n 924 864 -60
Fasting plasma glucose (mmol/L) 5.94 (1.04) 5.92 (0.97) -0.02 (-0.07)
HbA1c, (%) 5.94 (0.63) 5.89 (0.64) -0.05 (+0.01)
Men 307 296 -11
Women 617 568 -49
Without diabetes (n)
Fasting plasma glucose (mmol/L) 5.66 (0.53) 5.56 (0.48) -0.10 (-0.05)
2-h plasma glucose (mmol/L) 8.19 (2.02) 7.79 (1.88) -0.40 (-0.14)
HbA1c (%) 5.79 (0.43) 5.69 (0.34) -0.10 (-0.09)
Cholesterol (mmol/L) 5.07 (0.86) 5.06 (0.86) -0.01 (0)
HDL cholesterol (mmol/L) 1.23 (0.34) 1.28 (0.35) +0.05 (+0.01)
LDL cholesterol (mmol/L) 3.08 (0.75) 3.07 (0.73) -0.01 (-0.02)
Triglycerides (mmol/L) 1.41 (1.02-2.00) 1.36 (0.95-1.93) -0.05 (-0.07,-0.07)
With diabetes (n)
Fasting plasma glucose (mmol/L) 6.61 (1.54) 6.34 (1.21) -0.27 (-0.33)
HbA1c (%) 6.30 (0.85) 6.14 (0.80) -0.16 (-0.05)
Cholesterol (mmol/L) 4.99 (0.89) 4.99 (0.89) 0
HDL cholesterol (mmol/L) 1.20 (0.30) 1.21 (0.30) +0.01 (0)
LDL cholesterol (mmol/L) 2.98 (0.78) 2.99 (0.80) +0.01 (+0.02)
Triglycerides (mmol/L) 1.51 (1.12-2.14) 1.47 (1.07-2.18) -0.04 (-0.05,+0.04)
*Data are mean (SD) apart from triglycerides for which data are median (IQR), or number of participants (n).
DPP Phase 1: ADDENDUM
9
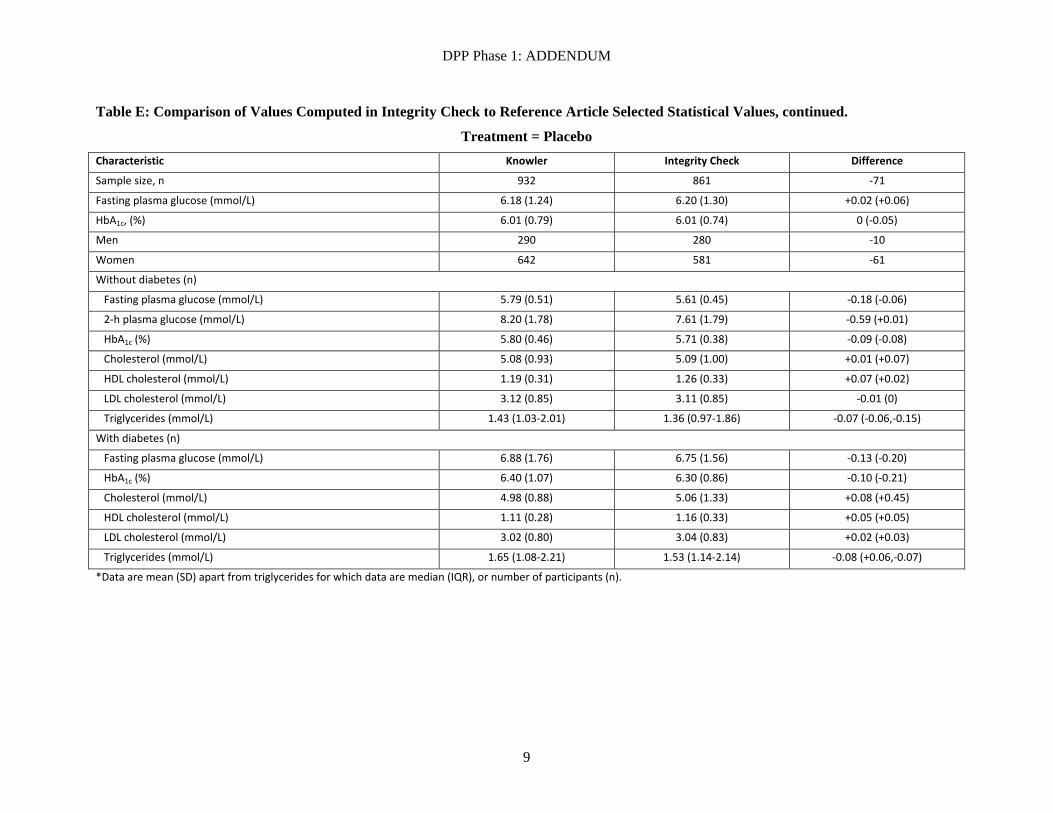
Table E: Comparison of Values Computed in Integrity Check to Reference Article Selected Statistical Values, continued.
Treatment = Placebo Characteristic Knowler Integrity Check Difference
Sample size, n 932 861 -71
Fasting plasma glucose (mmol/L) 6.18 (1.24) 6.20 (1.30) +0.02 (+0.06)
HbA1c, (%) 6.01 (0.79) 6.01 (0.74) 0 (-0.05)
Men 290 280 -10
Women 642 581 -61
Without diabetes (n)
Fasting plasma glucose (mmol/L) 5.79 (0.51) 5.61 (0.45) -0.18 (-0.06)
2-h plasma glucose (mmol/L) 8.20 (1.78) 7.61 (1.79) -0.59 (+0.01)
HbA1c (%) 5.80 (0.46) 5.71 (0.38) -0.09 (-0.08)
Cholesterol (mmol/L) 5.08 (0.93) 5.09 (1.00) +0.01 (+0.07)
HDL cholesterol (mmol/L) 1.19 (0.31) 1.26 (0.33) +0.07 (+0.02)
LDL cholesterol (mmol/L) 3.12 (0.85) 3.11 (0.85) -0.01 (0)
Triglycerides (mmol/L) 1.43 (1.03-2.01) 1.36 (0.97-1.86) -0.07 (-0.06,-0.15)
With diabetes (n)
Fasting plasma glucose (mmol/L) 6.88 (1.76) 6.75 (1.56) -0.13 (-0.20)
HbA1c (%) 6.40 (1.07) 6.30 (0.86) -0.10 (-0.21)
Cholesterol (mmol/L) 4.98 (0.88) 5.06 (1.33) +0.08 (+0.45)
HDL cholesterol (mmol/L) 1.11 (0.28) 1.16 (0.33) +0.05 (+0.05)
LDL cholesterol (mmol/L) 3.02 (0.80) 3.04 (0.83) +0.02 (+0.03)
Triglycerides (mmol/L) 1.65 (1.08-2.21) 1.53 (1.14-2.14) -0.08 (+0.06,-0.07)
*Data are mean (SD) apart from triglycerides for which data are median (IQR), or number of participants (n).
DPP Phase 1: ADDENDUM
10
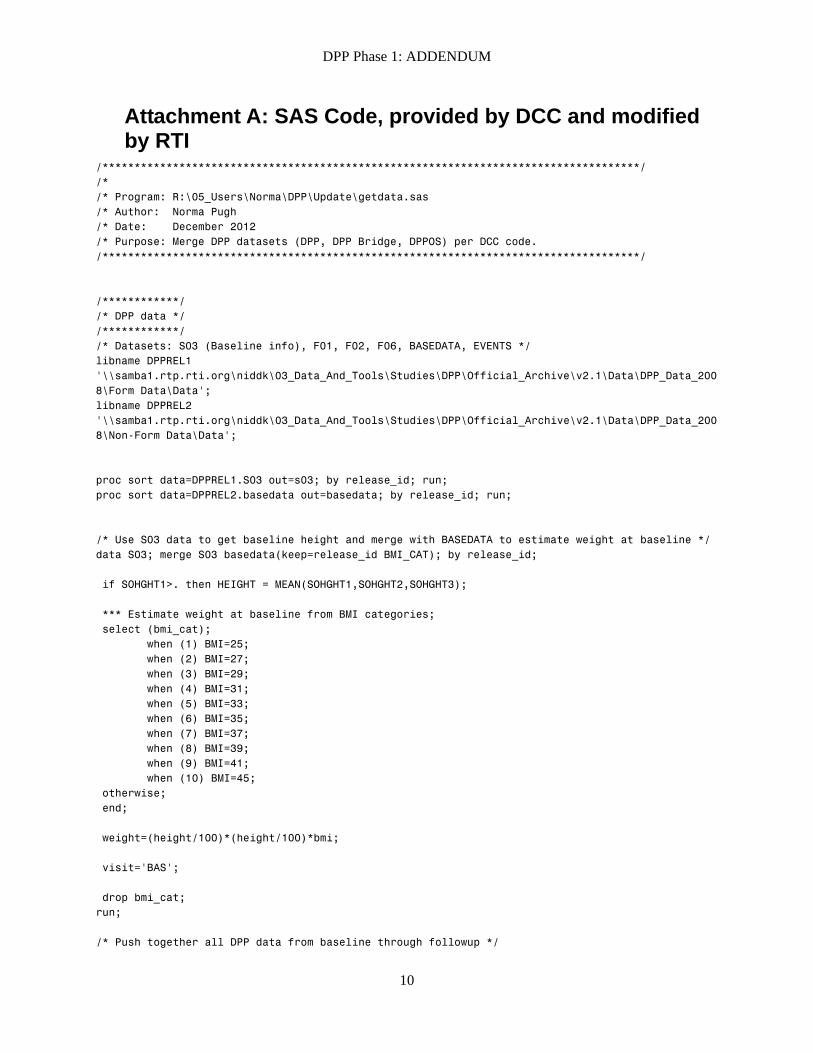
Attachment A: SAS Code, provided by DCC and modified by RTI
/************************************************************************************/ /* /* Program: R:\05_Users\Norma\DPP\Update\getdata.sas /* Author: Norma Pugh /* Date: December 2012 /* Purpose: Merge DPP datasets (DPP, DPP Bridge, DPPOS) per DCC code. /************************************************************************************/ /************/ /* DPP data */ /************/ /* Datasets: S03 (Baseline info), F01, F02, F06, BASEDATA, EVENTS */ libname DPPREL1 '\\samba1.rtp.rti.org\niddk\03_Data_And_Tools\Studies\DPP\Official_Archive\v2.1\Data\DPP_Data_2008\Form Data\Data'; libname DPPREL2 '\\samba1.rtp.rti.org\niddk\03_Data_And_Tools\Studies\DPP\Official_Archive\v2.1\Data\DPP_Data_2008\Non-Form Data\Data'; proc sort data=DPPREL1.S03 out=s03; by release_id; run; proc sort data=DPPREL2.basedata out=basedata; by release_id; run; /* Use S03 data to get baseline height and merge with BASEDATA to estimate weight at baseline */ data S03; merge S03 basedata(keep=release_id BMI_CAT); by release_id; if SOHGHT1>. then HEIGHT = MEAN(SOHGHT1,SOHGHT2,SOHGHT3); *** Estimate weight at baseline from BMI categories; select (bmi_cat); when (1) BMI=25; when (2) BMI=27; when (3) BMI=29; when (4) BMI=31; when (5) BMI=33; when (6) BMI=35; when (7) BMI=37; when (8) BMI=39; when (9) BMI=41; when (10) BMI=45; otherwise; end; weight=(height/100)*(height/100)*bmi; visit='BAS'; drop bmi_cat; run; /* Push together all DPP data from baseline through followup */
DPP Phase 1: ADDENDUM
11
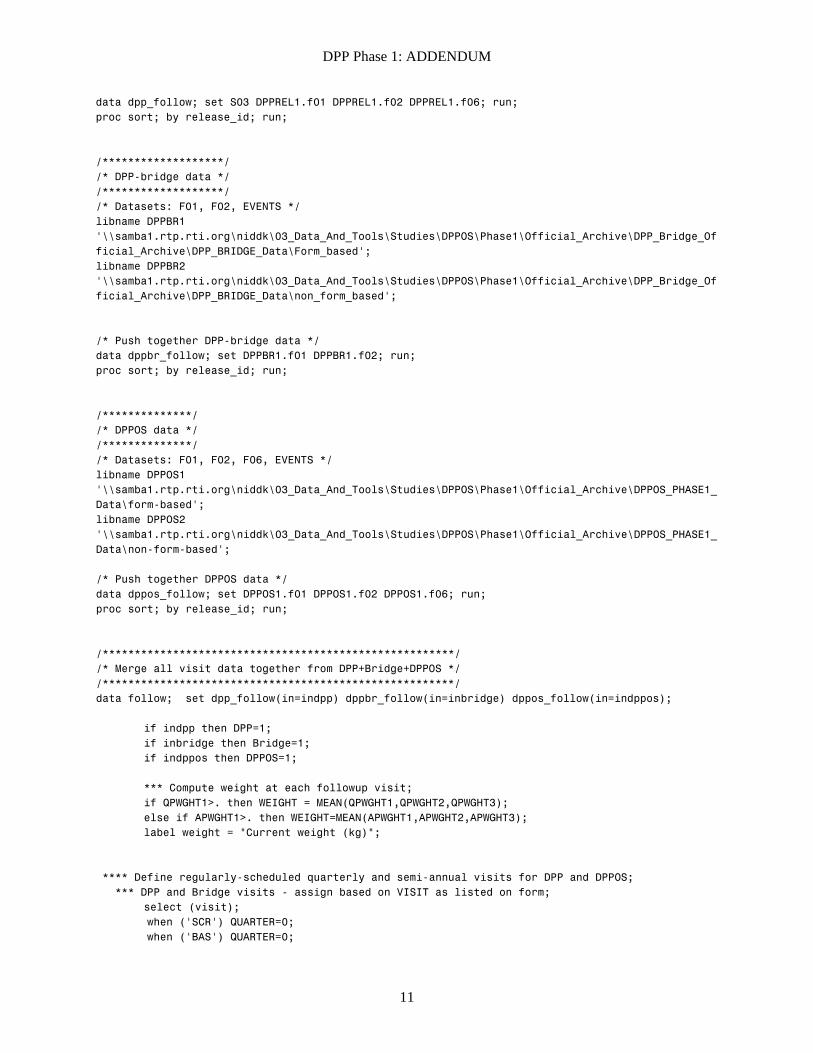
data dpp_follow; set S03 DPPREL1.f01 DPPREL1.f02 DPPREL1.f06; run; proc sort; by release_id; run; /*******************/ /* DPP-bridge data */ /*******************/ /* Datasets: F01, F02, EVENTS */ libname DPPBR1 '\\samba1.rtp.rti.org\niddk\03_Data_And_Tools\Studies\DPPOS\Phase1\Official_Archive\DPP_Bridge_Official_Archive\DPP_BRIDGE_Data\Form_based'; libname DPPBR2 '\\samba1.rtp.rti.org\niddk\03_Data_And_Tools\Studies\DPPOS\Phase1\Official_Archive\DPP_Bridge_Official_Archive\DPP_BRIDGE_Data\non_form_based'; /* Push together DPP-bridge data */ data dppbr_follow; set DPPBR1.f01 DPPBR1.f02; run; proc sort; by release_id; run; /**************/ /* DPPOS data */ /**************/ /* Datasets: F01, F02, F06, EVENTS */ libname DPPOS1 '\\samba1.rtp.rti.org\niddk\03_Data_And_Tools\Studies\DPPOS\Phase1\Official_Archive\DPPOS_PHASE1_Data\form-based'; libname DPPOS2 '\\samba1.rtp.rti.org\niddk\03_Data_And_Tools\Studies\DPPOS\Phase1\Official_Archive\DPPOS_PHASE1_Data\non-form-based'; /* Push together DPPOS data */ data dppos_follow; set DPPOS1.f01 DPPOS1.f02 DPPOS1.f06; run; proc sort; by release_id; run; /*******************************************************/ /* Merge all visit data together from DPP+Bridge+DPPOS */ /*******************************************************/ data follow; set dpp_follow(in=indpp) dppbr_follow(in=inbridge) dppos_follow(in=indppos); if indpp then DPP=1; if inbridge then Bridge=1; if indppos then DPPOS=1; *** Compute weight at each followup visit; if QPWGHT1>. then WEIGHT = MEAN(QPWGHT1,QPWGHT2,QPWGHT3); else if APWGHT1>. then WEIGHT=MEAN(APWGHT1,APWGHT2,APWGHT3); label weight = "Current weight (kg)"; **** Define regularly-scheduled quarterly and semi-annual visits for DPP and DPPOS; *** DPP and Bridge visits - assign based on VISIT as listed on form; select (visit); when ('SCR') QUARTER=0; when ('BAS') QUARTER=0;
DPP Phase 1: ADDENDUM
12
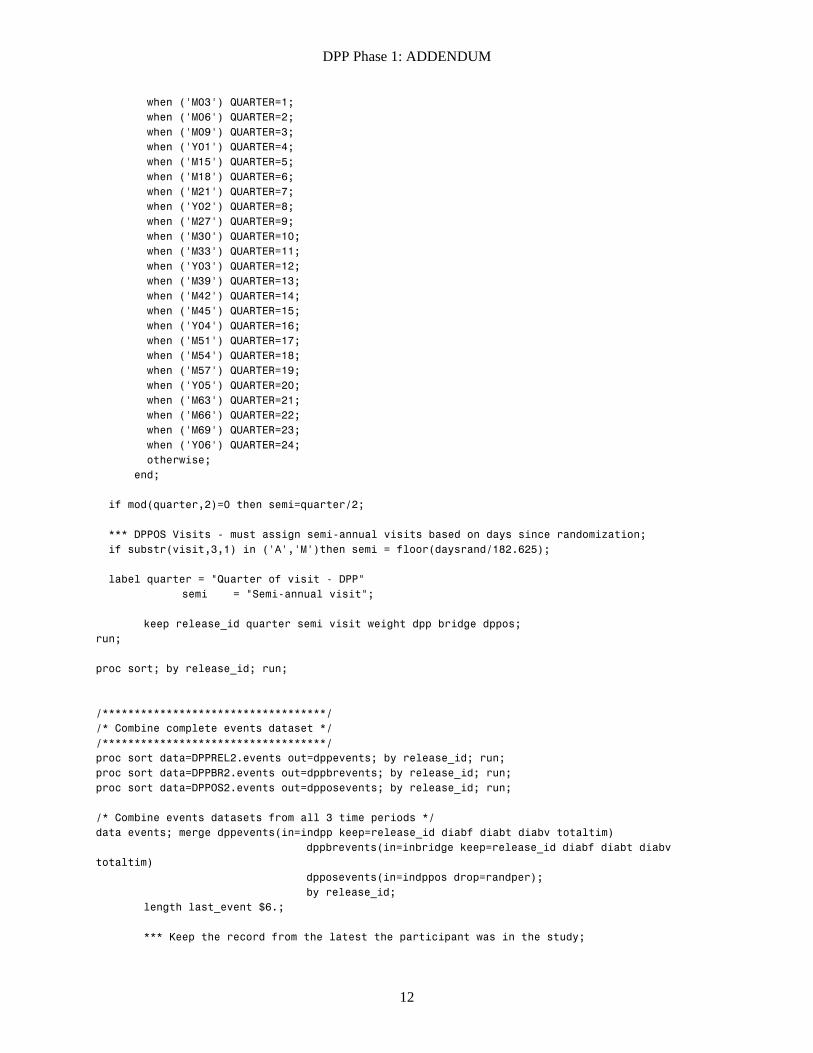
when ('M03') QUARTER=1; when ('M06') QUARTER=2; when ('M09') QUARTER=3; when ('Y01') QUARTER=4; when ('M15') QUARTER=5; when ('M18') QUARTER=6; when ('M21') QUARTER=7; when ('Y02') QUARTER=8; when ('M27') QUARTER=9; when ('M30') QUARTER=10; when ('M33') QUARTER=11; when ('Y03') QUARTER=12; when ('M39') QUARTER=13; when ('M42') QUARTER=14; when ('M45') QUARTER=15; when ('Y04') QUARTER=16; when ('M51') QUARTER=17; when ('M54') QUARTER=18; when ('M57') QUARTER=19; when ('Y05') QUARTER=20; when ('M63') QUARTER=21; when ('M66') QUARTER=22; when ('M69') QUARTER=23; when ('Y06') QUARTER=24; otherwise; end; if mod(quarter,2)=0 then semi=quarter/2; *** DPPOS Visits - must assign semi-annual visits based on days since randomization; if substr(visit,3,1) in ('A','M')then semi = floor(daysrand/182.625); label quarter = "Quarter of visit - DPP" semi = "Semi-annual visit"; keep release_id quarter semi visit weight dpp bridge dppos; run; proc sort; by release_id; run; /***********************************/ /* Combine complete events dataset */ /***********************************/ proc sort data=DPPREL2.events out=dppevents; by release_id; run; proc sort data=DPPBR2.events out=dppbrevents; by release_id; run; proc sort data=DPPOS2.events out=dpposevents; by release_id; run; /* Combine events datasets from all 3 time periods */ data events; merge dppevents(in=indpp keep=release_id diabf diabt diabv totaltim) dppbrevents(in=inbridge keep=release_id diabf diabt diabv totaltim) dpposevents(in=indppos drop=randper); by release_id; length last_event $6.; *** Keep the record from the latest the participant was in the study;
DPP Phase 1: ADDENDUM
13
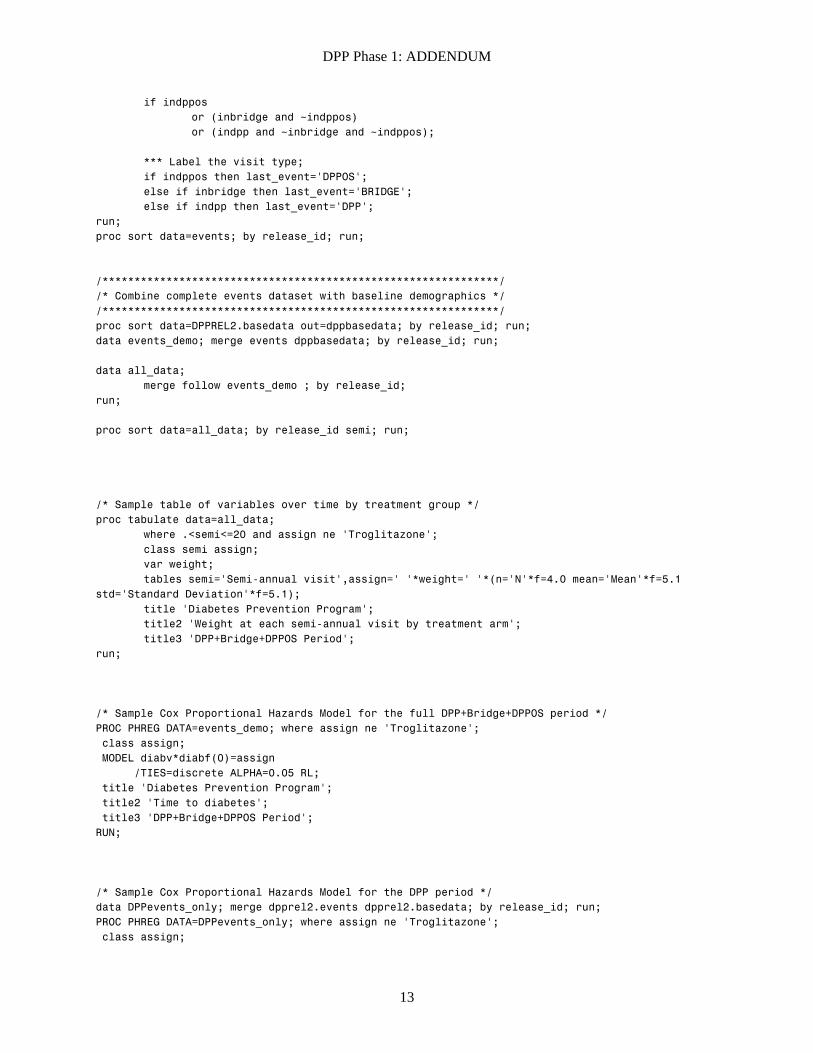
if indppos or (inbridge and ~indppos) or (indpp and ~inbridge and ~indppos); *** Label the visit type; if indppos then last_event='DPPOS'; else if inbridge then last_event='BRIDGE'; else if indpp then last_event='DPP'; run; proc sort data=events; by release_id; run; /**************************************************************/ /* Combine complete events dataset with baseline demographics */ /**************************************************************/ proc sort data=DPPREL2.basedata out=dppbasedata; by release_id; run; data events_demo; merge events dppbasedata; by release_id; run; data all_data; merge follow events_demo ; by release_id; run; proc sort data=all_data; by release_id semi; run; /* Sample table of variables over time by treatment group */ proc tabulate data=all_data; where .<semi<=20 and assign ne 'Troglitazone'; class semi assign; var weight; tables semi='Semi-annual visit',assign=' '*weight=' '*(n='N'*f=4.0 mean='Mean'*f=5.1 std='Standard Deviation'*f=5.1); title 'Diabetes Prevention Program'; title2 'Weight at each semi-annual visit by treatment arm'; title3 'DPP+Bridge+DPPOS Period'; run; /* Sample Cox Proportional Hazards Model for the full DPP+Bridge+DPPOS period */ PROC PHREG DATA=events_demo; where assign ne 'Troglitazone'; class assign; MODEL diabv*diabf(0)=assign /TIES=discrete ALPHA=0.05 RL; title 'Diabetes Prevention Program'; title2 'Time to diabetes'; title3 'DPP+Bridge+DPPOS Period'; RUN; /* Sample Cox Proportional Hazards Model for the DPP period */ data DPPevents_only; merge dpprel2.events dpprel2.basedata; by release_id; run; PROC PHREG DATA=DPPevents_only; where assign ne 'Troglitazone'; class assign;
DPP Phase 1: ADDENDUM
14
MODEL diabv*diabf(0)=assign /TIES=discrete ALPHA=0.05 RL; title 'Diabetes Prevention Program'; title2 'Time to diabetes'; title3 'DPP Period only'; RUN;
DPP Phase 1: ADDENDUM
15
Attachment B: SAS Output, from code provided by DCC and modified by RTI.
Diabetes Prevention Program 1 Weight at each semi-annual visit by treatment arm DPP+Bridge+DPPOS Period „ƒƒƒƒƒƒƒƒƒƒƒƒƒƒƒƒƒƒƒƒƒƒ…ƒƒƒƒƒƒƒƒƒƒƒƒƒƒƒƒ…ƒƒƒƒƒƒƒƒƒƒƒƒƒƒƒƒ…ƒƒƒƒƒƒƒƒƒƒƒƒƒƒƒƒ† ‚ ‚ Lifestyle ‚ Metformin ‚ Placebo ‚ ‚ ‡ƒƒƒƒ…ƒƒƒƒƒ…ƒƒƒƒƒˆƒƒƒƒ…ƒƒƒƒƒ…ƒƒƒƒƒˆƒƒƒƒ…ƒƒƒƒƒ…ƒƒƒƒƒ‰ ‚ ‚ ‚ ‚Stan-‚ ‚ ‚Stan-‚ ‚ ‚Stan-‚ ‚ ‚ ‚ ‚dard ‚ ‚ ‚dard ‚ ‚ ‚dard ‚ ‚ ‚ ‚ ‚Devi-‚ ‚ ‚Devi-‚ ‚ ‚Devi-‚ ‚ ‚ N ‚Mean ‚ation‚ N ‚Mean ‚ation‚ N ‚Mean ‚ation‚ ‡ƒƒƒƒƒƒƒƒƒƒƒƒƒƒƒƒƒƒƒƒƒƒˆƒƒƒƒˆƒƒƒƒƒˆƒƒƒƒƒˆƒƒƒƒˆƒƒƒƒƒˆƒƒƒƒƒˆƒƒƒƒˆƒƒƒƒƒˆƒƒƒƒƒ‰ ‚Semi-annual visit ‚ ‚ ‚ ‚ ‚ ‚ ‚ ‚ ‚ ‚ ‡ƒƒƒƒƒƒƒƒƒƒƒƒƒƒƒƒƒƒƒƒƒƒ‰ ‚ ‚ ‚ ‚ ‚ ‚ ‚ ‚ ‚ ‚0 ‚1024‚ 93.7‚ 18.5‚1027‚ 93.9‚ 18.2‚1030‚ 94.0‚ 18.8‚ ‡ƒƒƒƒƒƒƒƒƒƒƒƒƒƒƒƒƒƒƒƒƒƒˆƒƒƒƒˆƒƒƒƒƒˆƒƒƒƒƒˆƒƒƒƒˆƒƒƒƒƒˆƒƒƒƒƒˆƒƒƒƒˆƒƒƒƒƒˆƒƒƒƒƒ‰ ‚1 ‚ 991‚ 87.7‚ 20.1‚ 978‚ 91.9‚ 19.5‚ 970‚ 94.5‚ 20.9‚ ‡ƒƒƒƒƒƒƒƒƒƒƒƒƒƒƒƒƒƒƒƒƒƒˆƒƒƒƒˆƒƒƒƒƒˆƒƒƒƒƒˆƒƒƒƒˆƒƒƒƒƒˆƒƒƒƒƒˆƒƒƒƒˆƒƒƒƒƒˆƒƒƒƒƒ‰ ‚2 ‚ 971‚ 87.6‚ 20.3‚ 969‚ 91.7‚ 20.0‚ 975‚ 94.2‚ 20.7‚ ‡ƒƒƒƒƒƒƒƒƒƒƒƒƒƒƒƒƒƒƒƒƒƒˆƒƒƒƒˆƒƒƒƒƒˆƒƒƒƒƒˆƒƒƒƒˆƒƒƒƒƒˆƒƒƒƒƒˆƒƒƒƒˆƒƒƒƒƒˆƒƒƒƒƒ‰ ‚3 ‚ 938‚ 88.0‚ 20.5‚ 949‚ 92.0‚ 19.8‚ 947‚ 94.7‚ 20.8‚ ‡ƒƒƒƒƒƒƒƒƒƒƒƒƒƒƒƒƒƒƒƒƒƒˆƒƒƒƒˆƒƒƒƒƒˆƒƒƒƒƒˆƒƒƒƒˆƒƒƒƒƒˆƒƒƒƒƒˆƒƒƒƒˆƒƒƒƒƒˆƒƒƒƒƒ‰ ‚4 ‚ 947‚ 88.8‚ 20.6‚ 958‚ 92.7‚ 20.5‚ 960‚ 94.6‚ 20.5‚ ‡ƒƒƒƒƒƒƒƒƒƒƒƒƒƒƒƒƒƒƒƒƒƒˆƒƒƒƒˆƒƒƒƒƒˆƒƒƒƒƒˆƒƒƒƒˆƒƒƒƒƒˆƒƒƒƒƒˆƒƒƒƒˆƒƒƒƒƒˆƒƒƒƒƒ‰ ‚5 ‚ 930‚ 89.7‚ 21.5‚ 920‚ 92.9‚ 20.8‚ 937‚ 94.7‚ 21.2‚ ‡ƒƒƒƒƒƒƒƒƒƒƒƒƒƒƒƒƒƒƒƒƒƒˆƒƒƒƒˆƒƒƒƒƒˆƒƒƒƒƒˆƒƒƒƒˆƒƒƒƒƒˆƒƒƒƒƒˆƒƒƒƒˆƒƒƒƒƒˆƒƒƒƒƒ‰ ‚6 ‚ 941‚ 89.9‚ 21.2‚ 944‚ 92.6‚ 20.8‚ 937‚ 94.2‚ 21.1‚ ‡ƒƒƒƒƒƒƒƒƒƒƒƒƒƒƒƒƒƒƒƒƒƒˆƒƒƒƒˆƒƒƒƒƒˆƒƒƒƒƒˆƒƒƒƒˆƒƒƒƒƒˆƒƒƒƒƒˆƒƒƒƒˆƒƒƒƒƒˆƒƒƒƒƒ‰ ‚7 ‚ 953‚ 90.2‚ 21.5‚ 964‚ 92.2‚ 20.2‚ 964‚ 94.5‚ 21.2‚ ‡ƒƒƒƒƒƒƒƒƒƒƒƒƒƒƒƒƒƒƒƒƒƒˆƒƒƒƒˆƒƒƒƒƒˆƒƒƒƒƒˆƒƒƒƒˆƒƒƒƒƒˆƒƒƒƒƒˆƒƒƒƒˆƒƒƒƒƒˆƒƒƒƒƒ‰ ‚8 ‚ 934‚ 90.7‚ 21.5‚ 984‚ 92.2‚ 20.2‚ 967‚ 93.4‚ 20.7‚ ‡ƒƒƒƒƒƒƒƒƒƒƒƒƒƒƒƒƒƒƒƒƒƒˆƒƒƒƒˆƒƒƒƒƒˆƒƒƒƒƒˆƒƒƒƒˆƒƒƒƒƒˆƒƒƒƒƒˆƒƒƒƒˆƒƒƒƒƒˆƒƒƒƒƒ‰ ‚9 ‚ 865‚ 91.8‚ 21.9‚ 902‚ 91.4‚ 20.4‚ 891‚ 93.3‚ 20.4‚ ‡ƒƒƒƒƒƒƒƒƒƒƒƒƒƒƒƒƒƒƒƒƒƒˆƒƒƒƒˆƒƒƒƒƒˆƒƒƒƒƒˆƒƒƒƒˆƒƒƒƒƒˆƒƒƒƒƒˆƒƒƒƒˆƒƒƒƒƒˆƒƒƒƒƒ‰ ‚10 ‚ 886‚ 90.3‚ 21.2‚ 906‚ 91.9‚ 19.8‚ 906‚ 93.8‚ 21.0‚ ‡ƒƒƒƒƒƒƒƒƒƒƒƒƒƒƒƒƒƒƒƒƒƒˆƒƒƒƒˆƒƒƒƒƒˆƒƒƒƒƒˆƒƒƒƒˆƒƒƒƒƒˆƒƒƒƒƒˆƒƒƒƒˆƒƒƒƒƒˆƒƒƒƒƒ‰ ‚11 ‚ 817‚ 92.2‚ 21.5‚ 841‚ 91.9‚ 21.2‚ 849‚ 92.7‚ 20.3‚ ‡ƒƒƒƒƒƒƒƒƒƒƒƒƒƒƒƒƒƒƒƒƒƒˆƒƒƒƒˆƒƒƒƒƒˆƒƒƒƒƒˆƒƒƒƒˆƒƒƒƒƒˆƒƒƒƒƒˆƒƒƒƒˆƒƒƒƒƒˆƒƒƒƒƒ‰ ‚12 ‚ 844‚ 91.7‚ 21.2‚ 888‚ 91.5‚ 19.4‚ 870‚ 95.2‚ 20.8‚ ‡ƒƒƒƒƒƒƒƒƒƒƒƒƒƒƒƒƒƒƒƒƒƒˆƒƒƒƒˆƒƒƒƒƒˆƒƒƒƒƒˆƒƒƒƒˆƒƒƒƒƒˆƒƒƒƒƒˆƒƒƒƒˆƒƒƒƒƒˆƒƒƒƒƒ‰ ‚13 ‚ 707‚ 91.5‚ 21.1‚ 723‚ 92.0‚ 20.7‚ 737‚ 94.0‚ 20.4‚ ‡ƒƒƒƒƒƒƒƒƒƒƒƒƒƒƒƒƒƒƒƒƒƒˆƒƒƒƒˆƒƒƒƒƒˆƒƒƒƒƒˆƒƒƒƒˆƒƒƒƒƒˆƒƒƒƒƒˆƒƒƒƒˆƒƒƒƒƒˆƒƒƒƒƒ‰ ‚14 ‚ 783‚ 91.6‚ 21.1‚ 835‚ 91.4‚ 20.0‚ 829‚ 94.9‚ 21.2‚ ‡ƒƒƒƒƒƒƒƒƒƒƒƒƒƒƒƒƒƒƒƒƒƒˆƒƒƒƒˆƒƒƒƒƒˆƒƒƒƒƒˆƒƒƒƒˆƒƒƒƒƒˆƒƒƒƒƒˆƒƒƒƒˆƒƒƒƒƒˆƒƒƒƒƒ‰ ‚15 ‚ 724‚ 92.2‚ 20.7‚ 712‚ 92.1‚ 21.0‚ 685‚ 94.0‚ 20.3‚ ‡ƒƒƒƒƒƒƒƒƒƒƒƒƒƒƒƒƒƒƒƒƒƒˆƒƒƒƒˆƒƒƒƒƒˆƒƒƒƒƒˆƒƒƒƒˆƒƒƒƒƒˆƒƒƒƒƒˆƒƒƒƒˆƒƒƒƒƒˆƒƒƒƒƒ‰ ‚16 ‚ 803‚ 91.3‚ 20.5‚ 814‚ 92.0‚ 20.6‚ 802‚ 94.0‚ 20.6‚ ‡ƒƒƒƒƒƒƒƒƒƒƒƒƒƒƒƒƒƒƒƒƒƒˆƒƒƒƒˆƒƒƒƒƒˆƒƒƒƒƒˆƒƒƒƒˆƒƒƒƒƒˆƒƒƒƒƒˆƒƒƒƒˆƒƒƒƒƒˆƒƒƒƒƒ‰ ‚17 ‚ 692‚ 91.7‚ 20.9‚ 727‚ 92.2‚ 20.5‚ 703‚ 93.4‚ 19.9‚ Šƒƒƒƒƒƒƒƒƒƒƒƒƒƒƒƒƒƒƒƒƒƒ‹ƒƒƒƒ‹ƒƒƒƒƒ‹ƒƒƒƒƒ‹ƒƒƒƒ‹ƒƒƒƒƒ‹ƒƒƒƒƒ‹ƒƒƒƒ‹ƒƒƒƒƒ‹ƒƒƒƒƒŒ (Continued)
DPP Phase 1: ADDENDUM
16
Diabetes Prevention Program 2 Weight at each semi-annual visit by treatment arm DPP+Bridge+DPPOS Period 18:24 Saturday, January 19, 2013 „ƒƒƒƒƒƒƒƒƒƒƒƒƒƒƒƒƒƒƒƒƒƒ…ƒƒƒƒƒƒƒƒƒƒƒƒƒƒƒƒ…ƒƒƒƒƒƒƒƒƒƒƒƒƒƒƒƒ…ƒƒƒƒƒƒƒƒƒƒƒƒƒƒƒƒ† ‚ ‚ Lifestyle ‚ Metformin ‚ Placebo ‚ ‚ ‡ƒƒƒƒ…ƒƒƒƒƒ…ƒƒƒƒƒˆƒƒƒƒ…ƒƒƒƒƒ…ƒƒƒƒƒˆƒƒƒƒ…ƒƒƒƒƒ…ƒƒƒƒƒ‰ ‚ ‚ ‚ ‚Stan-‚ ‚ ‚Stan-‚ ‚ ‚Stan-‚ ‚ ‚ ‚ ‚dard ‚ ‚ ‚dard ‚ ‚ ‚dard ‚ ‚ ‚ ‚ ‚Devi-‚ ‚ ‚Devi-‚ ‚ ‚Devi-‚ ‚ ‚ N ‚Mean ‚ation‚ N ‚Mean ‚ation‚ N ‚Mean ‚ation‚ ‡ƒƒƒƒƒƒƒƒƒƒƒƒƒƒƒƒƒƒƒƒƒƒˆƒƒƒƒˆƒƒƒƒƒˆƒƒƒƒƒˆƒƒƒƒˆƒƒƒƒƒˆƒƒƒƒƒˆƒƒƒƒˆƒƒƒƒƒˆƒƒƒƒƒ‰ ‚Semi-annual visit ‚ ‚ ‚ ‚ ‚ ‚ ‚ ‚ ‚ ‚ ‡ƒƒƒƒƒƒƒƒƒƒƒƒƒƒƒƒƒƒƒƒƒƒ‰ ‚ ‚ ‚ ‚ ‚ ‚ ‚ ‚ ‚ ‚18 ‚ 739‚ 91.2‚ 20.8‚ 769‚ 92.3‚ 20.6‚ 768‚ 94.1‚ 20.9‚ ‡ƒƒƒƒƒƒƒƒƒƒƒƒƒƒƒƒƒƒƒƒƒƒˆƒƒƒƒˆƒƒƒƒƒˆƒƒƒƒƒˆƒƒƒƒˆƒƒƒƒƒˆƒƒƒƒƒˆƒƒƒƒˆƒƒƒƒƒˆƒƒƒƒƒ‰ ‚19 ‚ 577‚ 93.2‚ 22.0‚ 522‚ 92.6‚ 22.4‚ 547‚ 92.2‚ 19.0‚ ‡ƒƒƒƒƒƒƒƒƒƒƒƒƒƒƒƒƒƒƒƒƒƒˆƒƒƒƒˆƒƒƒƒƒˆƒƒƒƒƒˆƒƒƒƒˆƒƒƒƒƒˆƒƒƒƒƒˆƒƒƒƒˆƒƒƒƒƒˆƒƒƒƒƒ‰ ‚20 ‚ 409‚ 91.8‚ 21.5‚ 417‚ 92.6‚ 21.7‚ 438‚ 95.5‚ 20.3‚ Šƒƒƒƒƒƒƒƒƒƒƒƒƒƒƒƒƒƒƒƒƒƒ‹ƒƒƒƒ‹ƒƒƒƒƒ‹ƒƒƒƒƒ‹ƒƒƒƒ‹ƒƒƒƒƒ‹ƒƒƒƒƒ‹ƒƒƒƒ‹ƒƒƒƒƒ‹ƒƒƒƒƒŒ
DPP Phase 1: ADDENDUM
17
Diabetes Prevention Program 3
Time to diabetes 18:24 Saturday, January 19, 2013 DPP+Bridge+DPPOS Period The PHREG Procedure Model Information Data Set WORK.EVENTS_DEMO Dependent Variable DIABV Interval for diabetes Censoring Variable DIABF Indicator of diabetes Censoring Value(s) 0 Ties Handling DISCRETE Number of Observations Read 3081 Number of Observations Used 3081 Class Level Information Design Class Value Variables ASSIGN Lifestyle 1 0 Metformin 0 1 Placebo 0 0 Summary of the Number of Event and Censored Values Percent Total Event Censored Censored 3081 1278 1803 58.52 Convergence Status Convergence criterion (GCONV=1E-8) satisfied. Model Fit Statistics Without With Criterion Covariates Covariates -2 LOG L 10770.571 10735.563 AIC 10770.571 10739.563 SBC 10770.571 10749.869
DPP Phase 1: ADDENDUM
18
Diabetes Prevention Program 4 Time to diabetes 18:24 Saturday, January 19, 2013 DPP+Bridge+DPPOS Period The PHREG Procedure Testing Global Null Hypothesis: BETA=0 Test Chi-Square DF Pr > ChiSq Likelihood Ratio 35.0081 2 <.0001 Score 35.2889 2 <.0001 Wald 34.9538 2 <.0001 Type 3 Tests Wald Effect DF Chi-Square Pr > ChiSq ASSIGN 2 34.9538 <.0001 Analysis of Maximum Likelihood Estimates Parameter Standard Hazard 95% Hazard Ratio Parameter DF Estimate Error Chi-Square Pr > ChiSq Ratio Confidence Limits ASSIGN Lifestyle 1 -0.41428 0.07045 34.5816 <.0001 0.661 0.576 0.759 ASSIGN Metformin 1 -0.21957 0.06819 10.3669 0.0013 0.803 0.702 0.918 Analysis of Maximum Likelihood Estimates Parameter Label ASSIGN Lifestyle TREATMENT ASSIGNMENT Lifestyle ASSIGN Metformin TREATMENT ASSIGNMENT Metformin
DPP Phase 1: ADDENDUM
19
Diabetes Prevention Program 5
Time to diabetes 18:24 Saturday, January 19, 2013 DPP Period only The PHREG Procedure Model Information Data Set WORK.DPPEVENTS_ONLY Dependent Variable DIABV Interval for diabetes Censoring Variable DIABF Indicator of diabetes Censoring Value(s) 0 Ties Handling DISCRETE Number of Observations Read 3081 Number of Observations Used 3081 Class Level Information Design Class Value Variables ASSIGN Lifestyle 1 0 Metformin 0 1 Placebo 0 0 Summary of the Number of Event and Censored Values Percent Total Event Censored Censored 3081 655 2426 78.74 Convergence Status Convergence criterion (GCONV=1E-8) satisfied. Model Fit Statistics Without With Criterion Covariates Covariates -2 LOG L 5286.570 5223.469 AIC 5286.570 5227.469 SBC 5286.570 5236.438
DPP Phase 1: ADDENDUM
20
Diabetes Prevention Program 6 Time to diabetes 18:24 Saturday, January 19, 2013 DPP Period only The PHREG Procedure Testing Global Null Hypothesis: BETA=0 Test Chi-Square DF Pr > ChiSq Likelihood Ratio 63.1013 2 <.0001 Score 62.7466 2 <.0001 Wald 60.6241 2 <.0001 Type 3 Tests Wald Effect DF Chi-Square Pr > ChiSq ASSIGN 2 60.6241 <.0001 Analysis of Maximum Likelihood Estimates Parameter Standard Hazard 95% Hazard Ratio Parameter DF Estimate Error Chi-Square Pr > ChiSq Ratio Confidence Limits ASSIGN Lifestyle 1 -0.79631 0.10327 59.4566 <.0001 0.451 0.368 0.552 ASSIGN Metformin 1 -0.36689 0.09255 15.7147 <.0001 0.693 0.578 0.831 Analysis of Maximum Likelihood Estimates Parameter Label ASSIGN Lifestyle TREATMENT ASSIGNMENT Lifestyle ASSIGN Metformin TREATMENT ASSIGNMENT Metformin
DPP Phase 1: ADDENDUM
21
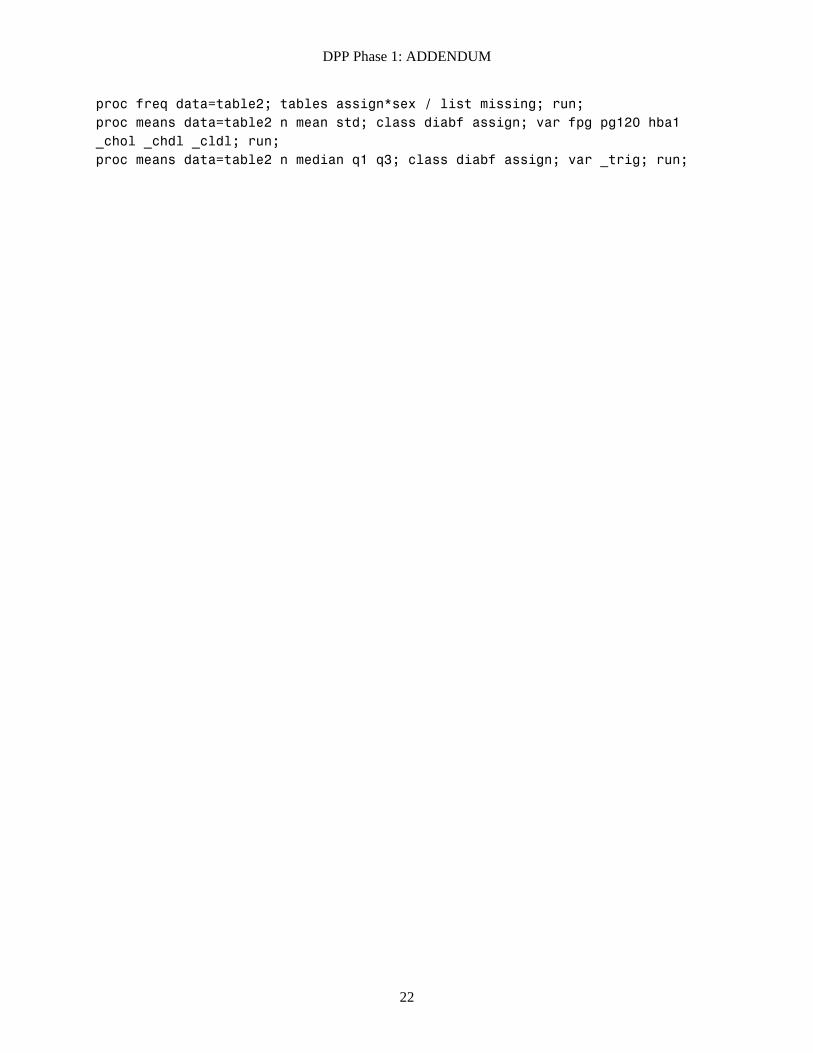
Attachment C: SAS Code, written by RTI. /************************************************************************************/ /* /* Program: R:\05_Users\Norma\DPP\Update\phase1.sas /* Author: Norma Pugh /* Date: March 2013 /* Purpose: Replicate select results from Lancet paper. /************************************************************************************/ /* Libnames */ LIBNAME phase1 'R:\03_Data_And_Tools\Studies\DPPOS\Phase1\Official_Archive\DPPOS_PHASE1_Data\non-form-based'; run; /* Get baseline datasets */ data bl_dppos; set phase1.demographic(where=(assign^='Troglitazone')); output; assign='Total'; output; run; data diab; set phase1.events; keep release_id diabf; run; data labs; set phase1.laboratory(where=(visit='01A')); keep release_id visit g000 g120 hba1 chol chdl cldl trig; run; /* Table 2 */ /* Merge data, Convert mg/dl measurements to mmol/l, Get stats */ proc sort data=diab; by release_id; run; data table2; merge bl_dppos(in=keep) diab labs; by release_id; if keep; fpg=g000*0.055; pg120=g120*0.055; _chol=chol*0.0259; _chdl=chdl*0.0259; _cldl=cldl*0.0259; _trig=trig*0.0113; label fpg = 'Fasting plasma glucose, mmol/L' pg120 = '2-h plasma glucose, mmol/L' _chol = 'Total cholesterol, mmol/L' _chdl = 'HDL cholesterol, mmol/L' _cldl = 'LDL cholesterol, mmol/L' _trig = 'Triglycerides, mmol/L'; count=1; run; proc freq data=table2(where=(assign^='Total')); tables count / list missing; run; proc means data=table2 n mean std; class assign; var fpg hba1; run;
DPP Phase 1: ADDENDUM
22
proc freq data=table2; tables assign*sex / list missing; run; proc means data=table2 n mean std; class diabf assign; var fpg pg120 hba1 _chol _chdl _cldl; run; proc means data=table2 n median q1 q3; class diabf assign; var _trig; run;
DPP Phase 1: ADDENDUM
23
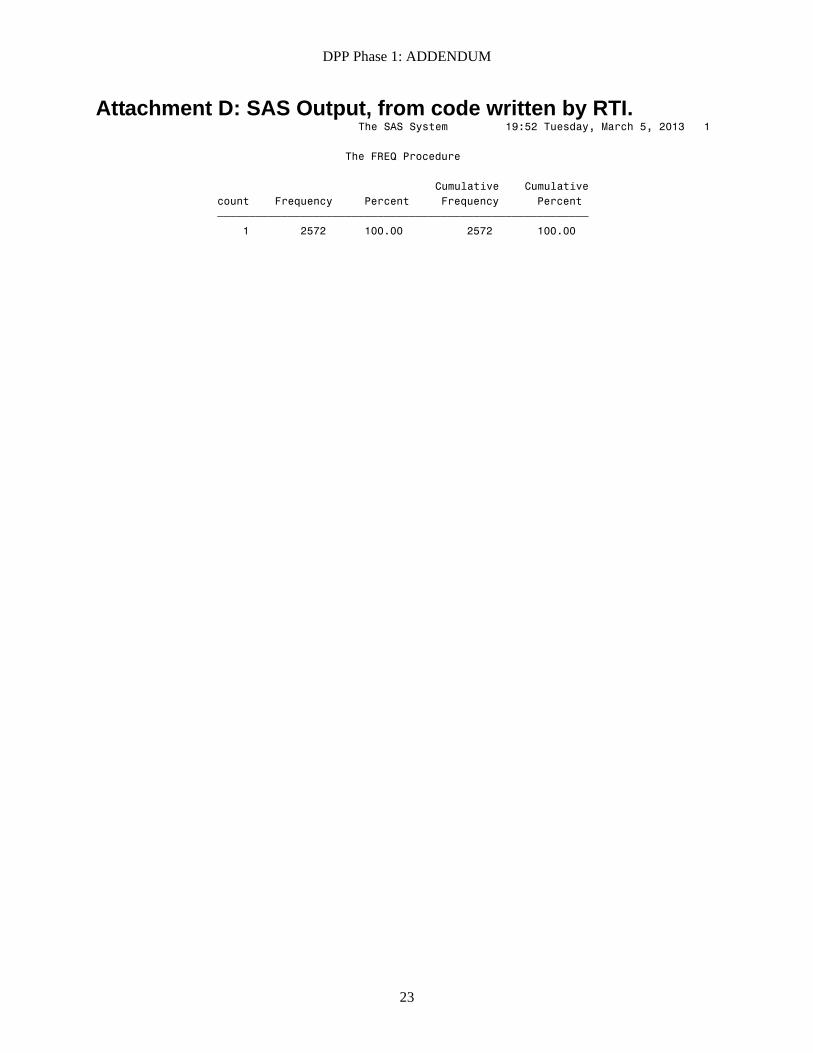
Attachment D: SAS Output, from code written by RTI. The SAS System 19:52 Tuesday, March 5, 2013 1 The FREQ Procedure Cumulative Cumulative count Frequency Percent Frequency Percent ƒƒƒƒƒƒƒƒƒƒƒƒƒƒƒƒƒƒƒƒƒƒƒƒƒƒƒƒƒƒƒƒƒƒƒƒƒƒƒƒƒƒƒƒƒƒƒƒƒƒƒƒƒƒƒƒƒƒ 1 2572 100.00 2572 100.00
DPP Phase 1: ADDENDUM
24
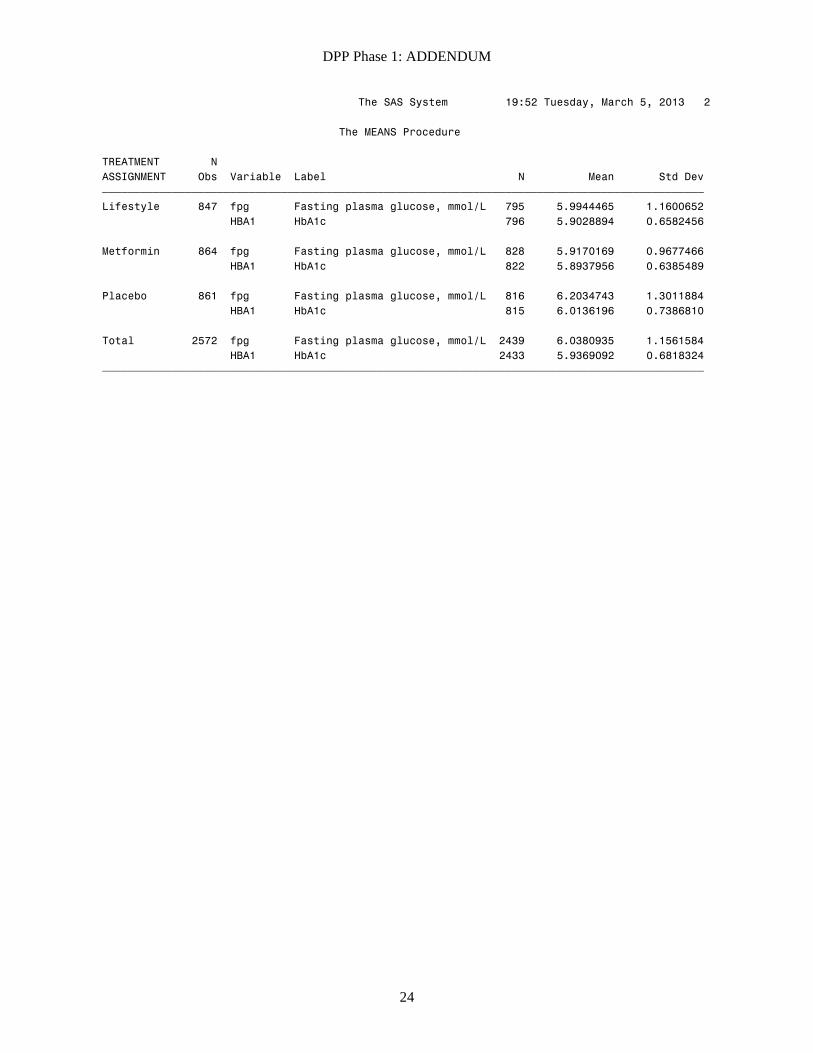
The SAS System 19:52 Tuesday, March 5, 2013 2 The MEANS Procedure TREATMENT N ASSIGNMENT Obs Variable Label N Mean Std Dev ƒƒƒƒƒƒƒƒƒƒƒƒƒƒƒƒƒƒƒƒƒƒƒƒƒƒƒƒƒƒƒƒƒƒƒƒƒƒƒƒƒƒƒƒƒƒƒƒƒƒƒƒƒƒƒƒƒƒƒƒƒƒƒƒƒƒƒƒƒƒƒƒƒƒƒƒƒƒƒƒƒƒƒƒƒƒƒƒƒƒƒƒƒƒ Lifestyle 847 fpg Fasting plasma glucose, mmol/L 795 5.9944465 1.1600652 HBA1 HbA1c 796 5.9028894 0.6582456 Metformin 864 fpg Fasting plasma glucose, mmol/L 828 5.9170169 0.9677466 HBA1 HbA1c 822 5.8937956 0.6385489 Placebo 861 fpg Fasting plasma glucose, mmol/L 816 6.2034743 1.3011884 HBA1 HbA1c 815 6.0136196 0.7386810 Total 2572 fpg Fasting plasma glucose, mmol/L 2439 6.0380935 1.1561584 HBA1 HbA1c 2433 5.9369092 0.6818324 ƒƒƒƒƒƒƒƒƒƒƒƒƒƒƒƒƒƒƒƒƒƒƒƒƒƒƒƒƒƒƒƒƒƒƒƒƒƒƒƒƒƒƒƒƒƒƒƒƒƒƒƒƒƒƒƒƒƒƒƒƒƒƒƒƒƒƒƒƒƒƒƒƒƒƒƒƒƒƒƒƒƒƒƒƒƒƒƒƒƒƒƒƒƒ
DPP Phase 1: ADDENDUM
25
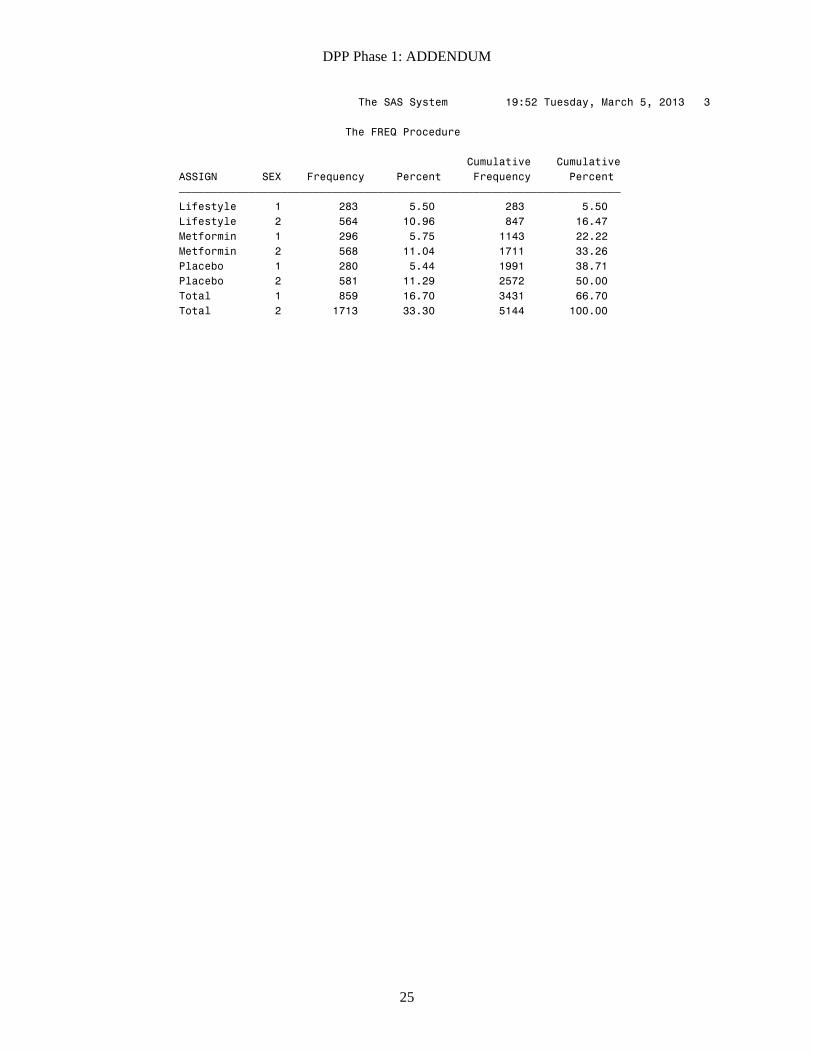
The SAS System 19:52 Tuesday, March 5, 2013 3 The FREQ Procedure Cumulative Cumulative ASSIGN SEX Frequency Percent Frequency Percent ƒƒƒƒƒƒƒƒƒƒƒƒƒƒƒƒƒƒƒƒƒƒƒƒƒƒƒƒƒƒƒƒƒƒƒƒƒƒƒƒƒƒƒƒƒƒƒƒƒƒƒƒƒƒƒƒƒƒƒƒƒƒƒƒƒƒƒƒƒ Lifestyle 1 283 5.50 283 5.50 Lifestyle 2 564 10.96 847 16.47 Metformin 1 296 5.75 1143 22.22 Metformin 2 568 11.04 1711 33.26 Placebo 1 280 5.44 1991 38.71 Placebo 2 581 11.29 2572 50.00 Total 1 859 16.70 3431 66.70 Total 2 1713 33.30 5144 100.00
DPP Phase 1: ADDENDUM
26
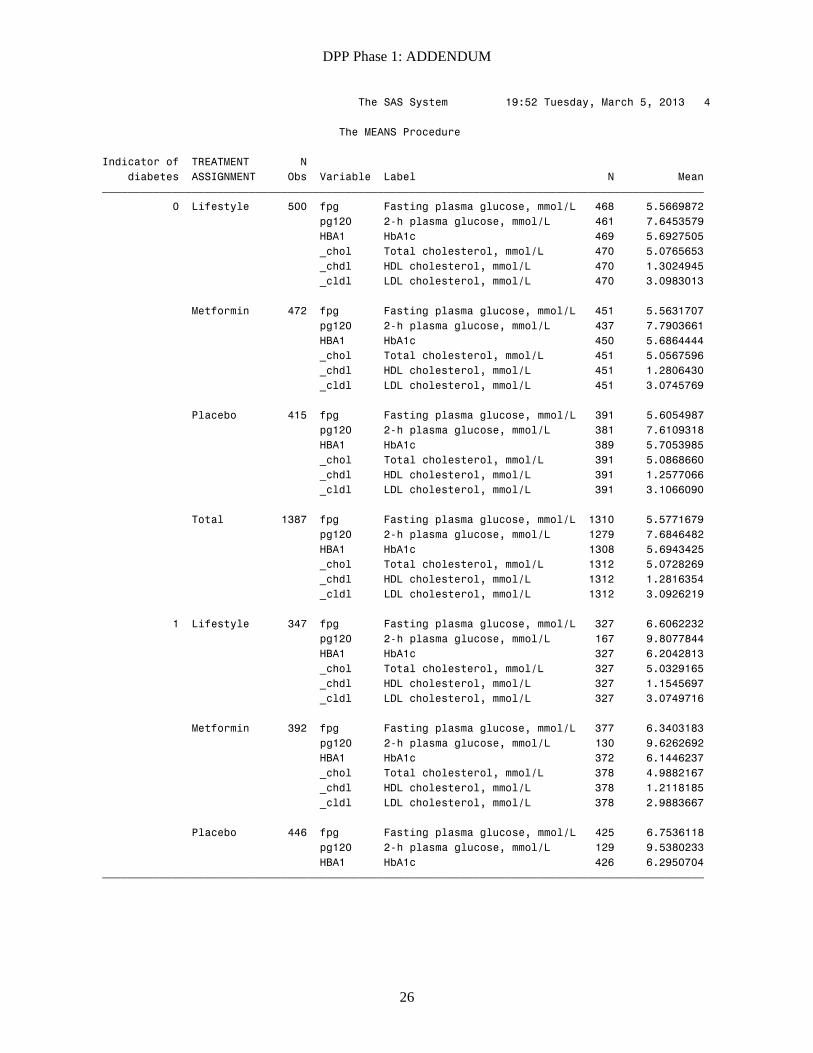
The SAS System 19:52 Tuesday, March 5, 2013 4 The MEANS Procedure Indicator of TREATMENT N diabetes ASSIGNMENT Obs Variable Label N Mean ƒƒƒƒƒƒƒƒƒƒƒƒƒƒƒƒƒƒƒƒƒƒƒƒƒƒƒƒƒƒƒƒƒƒƒƒƒƒƒƒƒƒƒƒƒƒƒƒƒƒƒƒƒƒƒƒƒƒƒƒƒƒƒƒƒƒƒƒƒƒƒƒƒƒƒƒƒƒƒƒƒƒƒƒƒƒƒƒƒƒƒƒƒƒ 0 Lifestyle 500 fpg Fasting plasma glucose, mmol/L 468 5.5669872 pg120 2-h plasma glucose, mmol/L 461 7.6453579 HBA1 HbA1c 469 5.6927505 _chol Total cholesterol, mmol/L 470 5.0765653 _chdl HDL cholesterol, mmol/L 470 1.3024945 _cldl LDL cholesterol, mmol/L 470 3.0983013 Metformin 472 fpg Fasting plasma glucose, mmol/L 451 5.5631707 pg120 2-h plasma glucose, mmol/L 437 7.7903661 HBA1 HbA1c 450 5.6864444 _chol Total cholesterol, mmol/L 451 5.0567596 _chdl HDL cholesterol, mmol/L 451 1.2806430 _cldl LDL cholesterol, mmol/L 451 3.0745769 Placebo 415 fpg Fasting plasma glucose, mmol/L 391 5.6054987 pg120 2-h plasma glucose, mmol/L 381 7.6109318 HBA1 HbA1c 389 5.7053985 _chol Total cholesterol, mmol/L 391 5.0868660 _chdl HDL cholesterol, mmol/L 391 1.2577066 _cldl LDL cholesterol, mmol/L 391 3.1066090 Total 1387 fpg Fasting plasma glucose, mmol/L 1310 5.5771679 pg120 2-h plasma glucose, mmol/L 1279 7.6846482 HBA1 HbA1c 1308 5.6943425 _chol Total cholesterol, mmol/L 1312 5.0728269 _chdl HDL cholesterol, mmol/L 1312 1.2816354 _cldl LDL cholesterol, mmol/L 1312 3.0926219 1 Lifestyle 347 fpg Fasting plasma glucose, mmol/L 327 6.6062232 pg120 2-h plasma glucose, mmol/L 167 9.8077844 HBA1 HbA1c 327 6.2042813 _chol Total cholesterol, mmol/L 327 5.0329165 _chdl HDL cholesterol, mmol/L 327 1.1545697 _cldl LDL cholesterol, mmol/L 327 3.0749716 Metformin 392 fpg Fasting plasma glucose, mmol/L 377 6.3403183 pg120 2-h plasma glucose, mmol/L 130 9.6262692 HBA1 HbA1c 372 6.1446237 _chol Total cholesterol, mmol/L 378 4.9882167 _chdl HDL cholesterol, mmol/L 378 1.2118185 _cldl LDL cholesterol, mmol/L 378 2.9883667 Placebo 446 fpg Fasting plasma glucose, mmol/L 425 6.7536118 pg120 2-h plasma glucose, mmol/L 129 9.5380233 HBA1 HbA1c 426 6.2950704 ƒƒƒƒƒƒƒƒƒƒƒƒƒƒƒƒƒƒƒƒƒƒƒƒƒƒƒƒƒƒƒƒƒƒƒƒƒƒƒƒƒƒƒƒƒƒƒƒƒƒƒƒƒƒƒƒƒƒƒƒƒƒƒƒƒƒƒƒƒƒƒƒƒƒƒƒƒƒƒƒƒƒƒƒƒƒƒƒƒƒƒƒƒƒ
DPP Phase 1: ADDENDUM
27
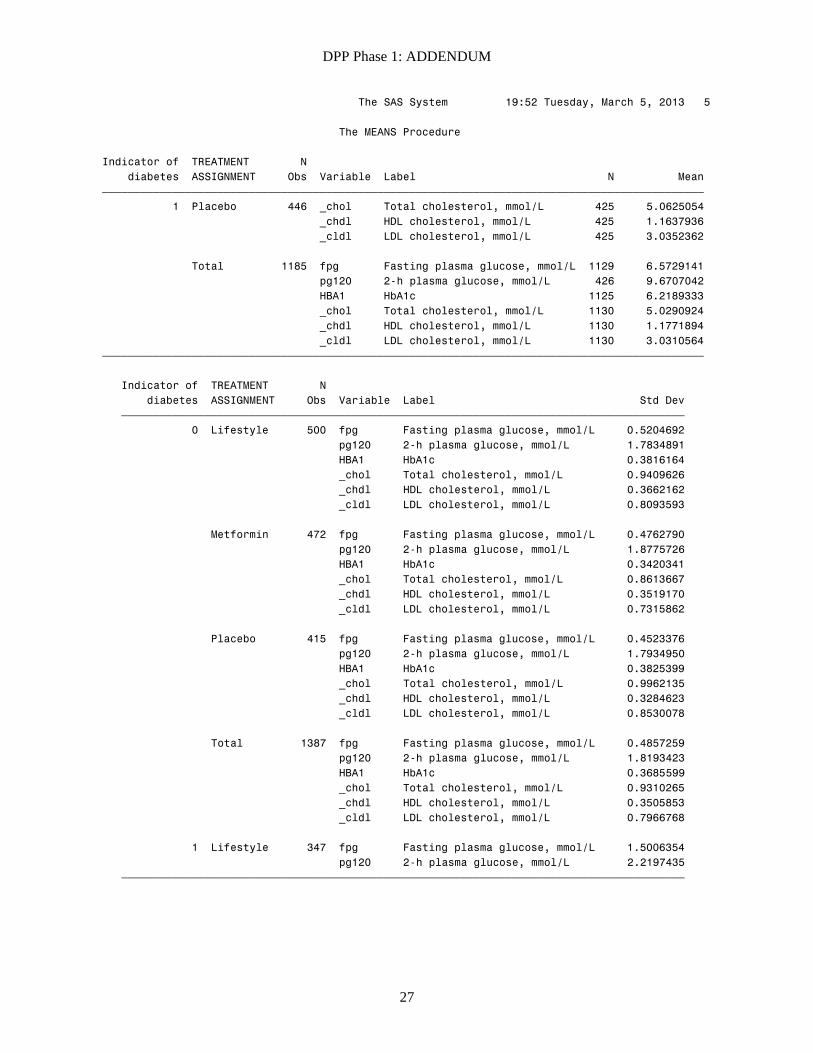
The SAS System 19:52 Tuesday, March 5, 2013 5 The MEANS Procedure Indicator of TREATMENT N diabetes ASSIGNMENT Obs Variable Label N Mean ƒƒƒƒƒƒƒƒƒƒƒƒƒƒƒƒƒƒƒƒƒƒƒƒƒƒƒƒƒƒƒƒƒƒƒƒƒƒƒƒƒƒƒƒƒƒƒƒƒƒƒƒƒƒƒƒƒƒƒƒƒƒƒƒƒƒƒƒƒƒƒƒƒƒƒƒƒƒƒƒƒƒƒƒƒƒƒƒƒƒƒƒƒƒ 1 Placebo 446 _chol Total cholesterol, mmol/L 425 5.0625054 _chdl HDL cholesterol, mmol/L 425 1.1637936 _cldl LDL cholesterol, mmol/L 425 3.0352362 Total 1185 fpg Fasting plasma glucose, mmol/L 1129 6.5729141 pg120 2-h plasma glucose, mmol/L 426 9.6707042 HBA1 HbA1c 1125 6.2189333 _chol Total cholesterol, mmol/L 1130 5.0290924 _chdl HDL cholesterol, mmol/L 1130 1.1771894 _cldl LDL cholesterol, mmol/L 1130 3.0310564 ƒƒƒƒƒƒƒƒƒƒƒƒƒƒƒƒƒƒƒƒƒƒƒƒƒƒƒƒƒƒƒƒƒƒƒƒƒƒƒƒƒƒƒƒƒƒƒƒƒƒƒƒƒƒƒƒƒƒƒƒƒƒƒƒƒƒƒƒƒƒƒƒƒƒƒƒƒƒƒƒƒƒƒƒƒƒƒƒƒƒƒƒƒƒ Indicator of TREATMENT N diabetes ASSIGNMENT Obs Variable Label Std Dev ƒƒƒƒƒƒƒƒƒƒƒƒƒƒƒƒƒƒƒƒƒƒƒƒƒƒƒƒƒƒƒƒƒƒƒƒƒƒƒƒƒƒƒƒƒƒƒƒƒƒƒƒƒƒƒƒƒƒƒƒƒƒƒƒƒƒƒƒƒƒƒƒƒƒƒƒƒƒƒƒƒƒƒƒƒƒƒƒ 0 Lifestyle 500 fpg Fasting plasma glucose, mmol/L 0.5204692 pg120 2-h plasma glucose, mmol/L 1.7834891 HBA1 HbA1c 0.3816164 _chol Total cholesterol, mmol/L 0.9409626 _chdl HDL cholesterol, mmol/L 0.3662162 _cldl LDL cholesterol, mmol/L 0.8093593 Metformin 472 fpg Fasting plasma glucose, mmol/L 0.4762790 pg120 2-h plasma glucose, mmol/L 1.8775726 HBA1 HbA1c 0.3420341 _chol Total cholesterol, mmol/L 0.8613667 _chdl HDL cholesterol, mmol/L 0.3519170 _cldl LDL cholesterol, mmol/L 0.7315862 Placebo 415 fpg Fasting plasma glucose, mmol/L 0.4523376 pg120 2-h plasma glucose, mmol/L 1.7934950 HBA1 HbA1c 0.3825399 _chol Total cholesterol, mmol/L 0.9962135 _chdl HDL cholesterol, mmol/L 0.3284623 _cldl LDL cholesterol, mmol/L 0.8530078 Total 1387 fpg Fasting plasma glucose, mmol/L 0.4857259 pg120 2-h plasma glucose, mmol/L 1.8193423 HBA1 HbA1c 0.3685599 _chol Total cholesterol, mmol/L 0.9310265 _chdl HDL cholesterol, mmol/L 0.3505853 _cldl LDL cholesterol, mmol/L 0.7966768 1 Lifestyle 347 fpg Fasting plasma glucose, mmol/L 1.5006354 pg120 2-h plasma glucose, mmol/L 2.2197435 ƒƒƒƒƒƒƒƒƒƒƒƒƒƒƒƒƒƒƒƒƒƒƒƒƒƒƒƒƒƒƒƒƒƒƒƒƒƒƒƒƒƒƒƒƒƒƒƒƒƒƒƒƒƒƒƒƒƒƒƒƒƒƒƒƒƒƒƒƒƒƒƒƒƒƒƒƒƒƒƒƒƒƒƒƒƒƒƒ
DPP Phase 1: ADDENDUM
28
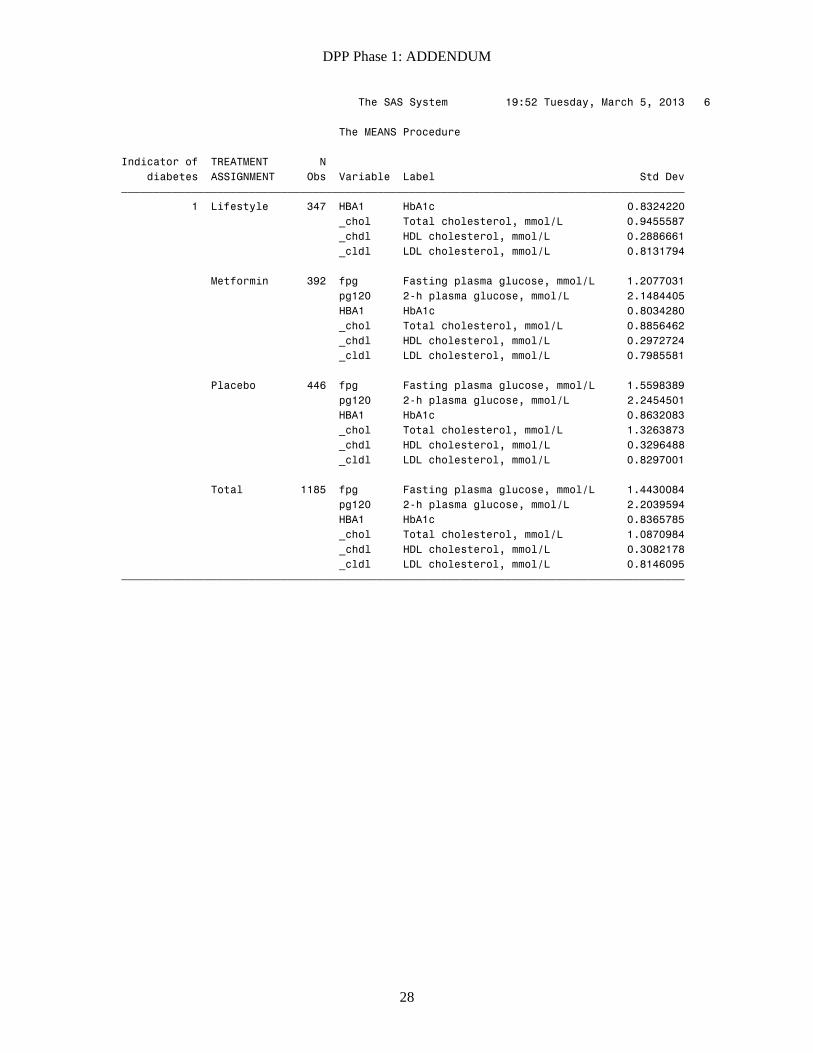
The SAS System 19:52 Tuesday, March 5, 2013 6 The MEANS Procedure Indicator of TREATMENT N diabetes ASSIGNMENT Obs Variable Label Std Dev ƒƒƒƒƒƒƒƒƒƒƒƒƒƒƒƒƒƒƒƒƒƒƒƒƒƒƒƒƒƒƒƒƒƒƒƒƒƒƒƒƒƒƒƒƒƒƒƒƒƒƒƒƒƒƒƒƒƒƒƒƒƒƒƒƒƒƒƒƒƒƒƒƒƒƒƒƒƒƒƒƒƒƒƒƒƒƒƒ 1 Lifestyle 347 HBA1 HbA1c 0.8324220 _chol Total cholesterol, mmol/L 0.9455587 _chdl HDL cholesterol, mmol/L 0.2886661 _cldl LDL cholesterol, mmol/L 0.8131794 Metformin 392 fpg Fasting plasma glucose, mmol/L 1.2077031 pg120 2-h plasma glucose, mmol/L 2.1484405 HBA1 HbA1c 0.8034280 _chol Total cholesterol, mmol/L 0.8856462 _chdl HDL cholesterol, mmol/L 0.2972724 _cldl LDL cholesterol, mmol/L 0.7985581 Placebo 446 fpg Fasting plasma glucose, mmol/L 1.5598389 pg120 2-h plasma glucose, mmol/L 2.2454501 HBA1 HbA1c 0.8632083 _chol Total cholesterol, mmol/L 1.3263873 _chdl HDL cholesterol, mmol/L 0.3296488 _cldl LDL cholesterol, mmol/L 0.8297001 Total 1185 fpg Fasting plasma glucose, mmol/L 1.4430084 pg120 2-h plasma glucose, mmol/L 2.2039594 HBA1 HbA1c 0.8365785 _chol Total cholesterol, mmol/L 1.0870984 _chdl HDL cholesterol, mmol/L 0.3082178 _cldl LDL cholesterol, mmol/L 0.8146095 ƒƒƒƒƒƒƒƒƒƒƒƒƒƒƒƒƒƒƒƒƒƒƒƒƒƒƒƒƒƒƒƒƒƒƒƒƒƒƒƒƒƒƒƒƒƒƒƒƒƒƒƒƒƒƒƒƒƒƒƒƒƒƒƒƒƒƒƒƒƒƒƒƒƒƒƒƒƒƒƒƒƒƒƒƒƒƒƒ
DPP Phase 1: ADDENDUM
29
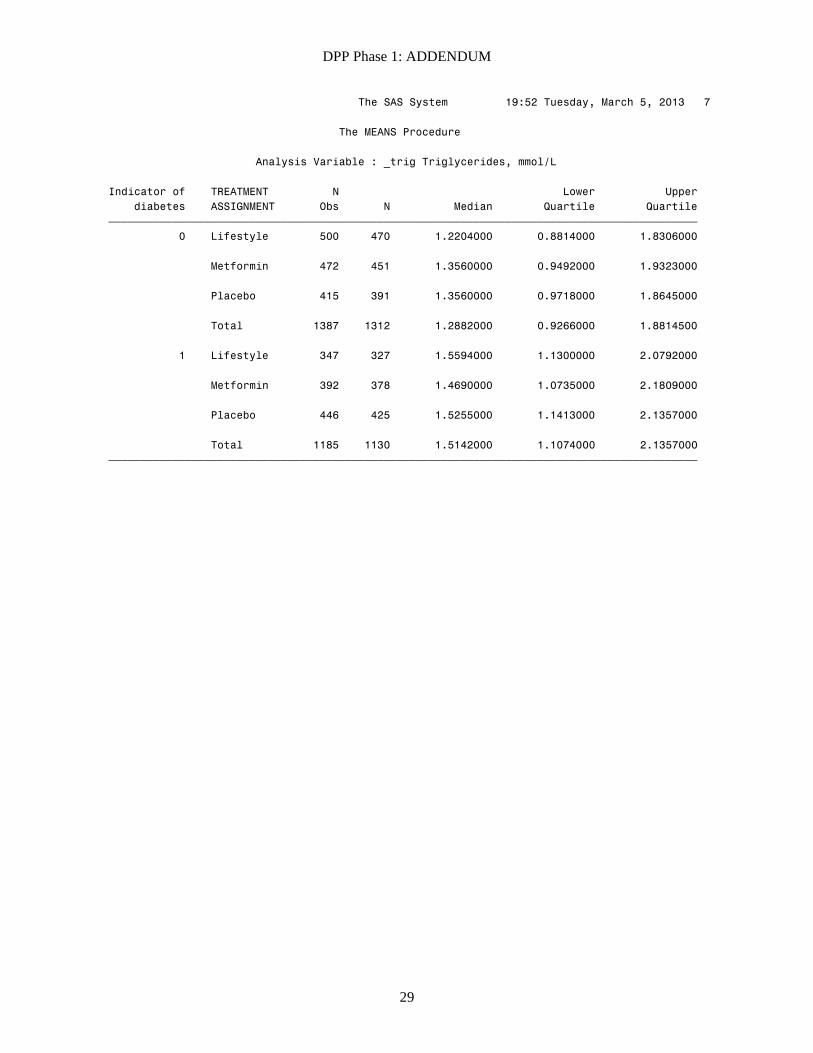
The SAS System 19:52 Tuesday, March 5, 2013 7 The MEANS Procedure Analysis Variable : _trig Triglycerides, mmol/L Indicator of TREATMENT N Lower Upper diabetes ASSIGNMENT Obs N Median Quartile Quartile ƒƒƒƒƒƒƒƒƒƒƒƒƒƒƒƒƒƒƒƒƒƒƒƒƒƒƒƒƒƒƒƒƒƒƒƒƒƒƒƒƒƒƒƒƒƒƒƒƒƒƒƒƒƒƒƒƒƒƒƒƒƒƒƒƒƒƒƒƒƒƒƒƒƒƒƒƒƒƒƒƒƒƒƒƒƒƒƒƒƒƒƒ 0 Lifestyle 500 470 1.2204000 0.8814000 1.8306000 Metformin 472 451 1.3560000 0.9492000 1.9323000 Placebo 415 391 1.3560000 0.9718000 1.8645000 Total 1387 1312 1.2882000 0.9266000 1.8814500 1 Lifestyle 347 327 1.5594000 1.1300000 2.0792000 Metformin 392 378 1.4690000 1.0735000 2.1809000 Placebo 446 425 1.5255000 1.1413000 2.1357000 Total 1185 1130 1.5142000 1.1074000 2.1357000 ƒƒƒƒƒƒƒƒƒƒƒƒƒƒƒƒƒƒƒƒƒƒƒƒƒƒƒƒƒƒƒƒƒƒƒƒƒƒƒƒƒƒƒƒƒƒƒƒƒƒƒƒƒƒƒƒƒƒƒƒƒƒƒƒƒƒƒƒƒƒƒƒƒƒƒƒƒƒƒƒƒƒƒƒƒƒƒƒƒƒƒƒ
Related Documents