Data Visualization For the Rest of Us from the NC Tech4Good Conference
Jan 22, 2018
Welcome message from author
This document is posted to help you gain knowledge. Please leave a comment to let me know what you think about it! Share it to your friends and learn new things together.
Transcript

“The goal is to turn data into information, and information
into insight.”
Carly Fiorina
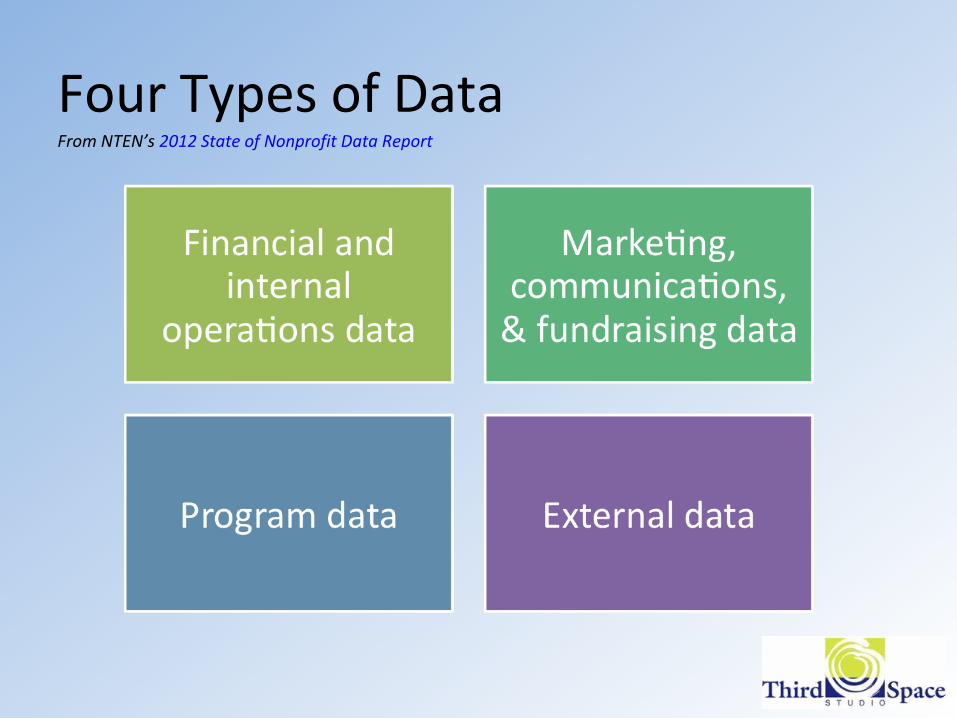
Four Types of DataFrom NTEN’s 2012 State of Nonprofit Data Report

Data Visualization Has Two Purposes

• Start with a question
• Find the data that might help you answer it
• Make sense of the data
Exploration

“It is a capital mistake to theorize before one has the data.”
Arthur Conan Doyle

• Who are you communicating with?
• What do they need to know?
• How might you communicate that with them?
Explanation


Google Chart Gallerydevelopers.google.com/chart/interactive/docs/gallery
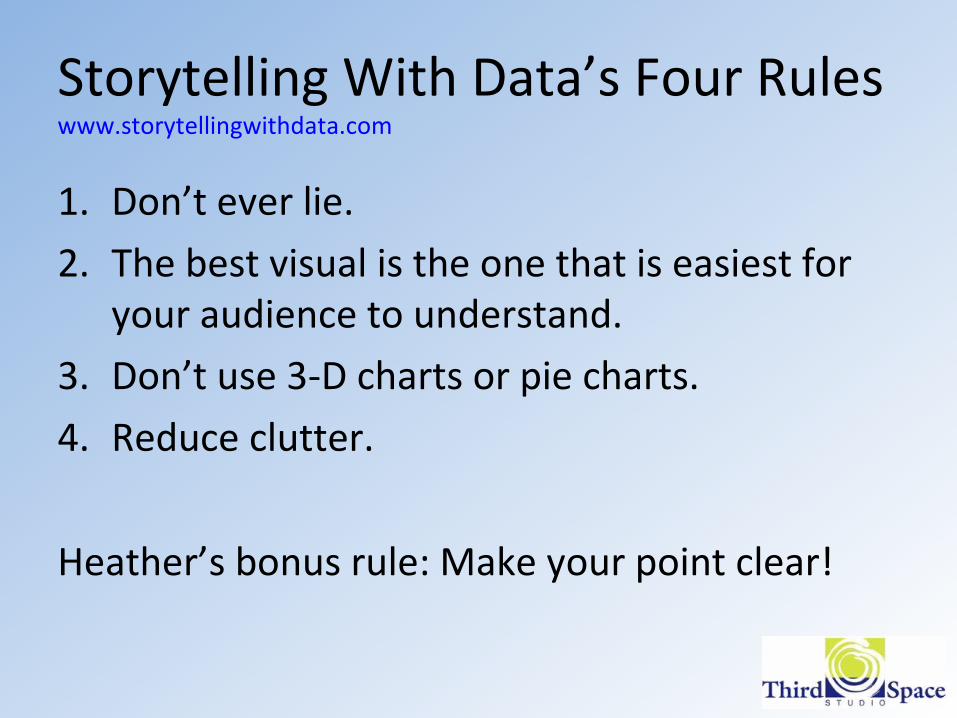
Storytelling With Data’s Four Ruleswww.storytellingwithdata.com
1. Don’t ever lie.
2. The best visual is the one that is easiest for your audience to understand.
3. Don’t use 3-D charts or pie charts.
4. Reduce clutter.
Heather’s bonus rule: Make your point clear!


Example: It’s been a rough few years. How are we doing?
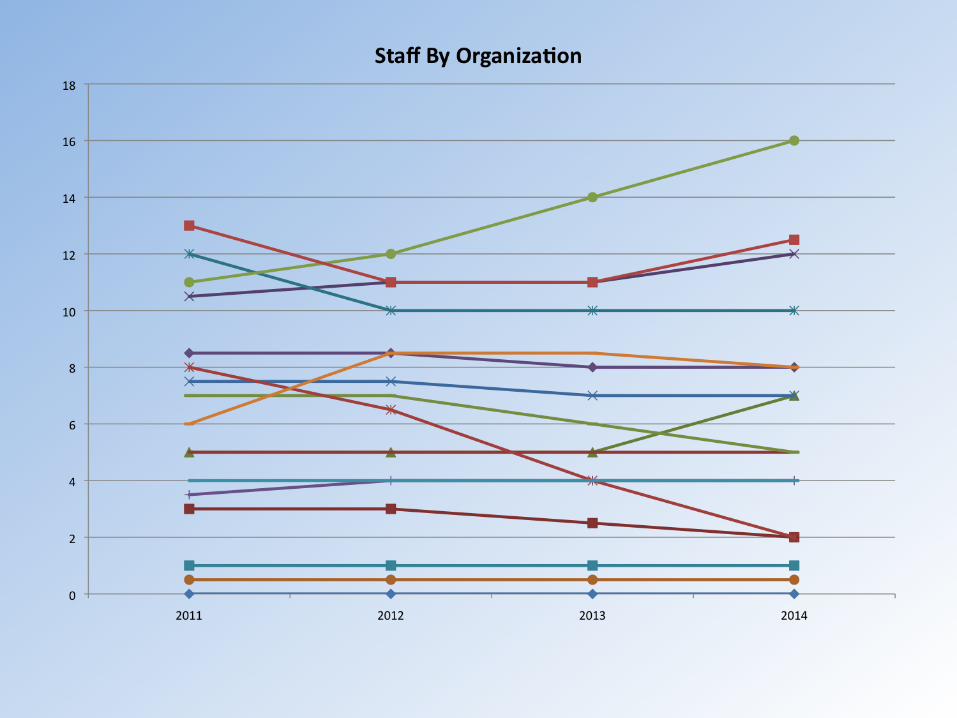

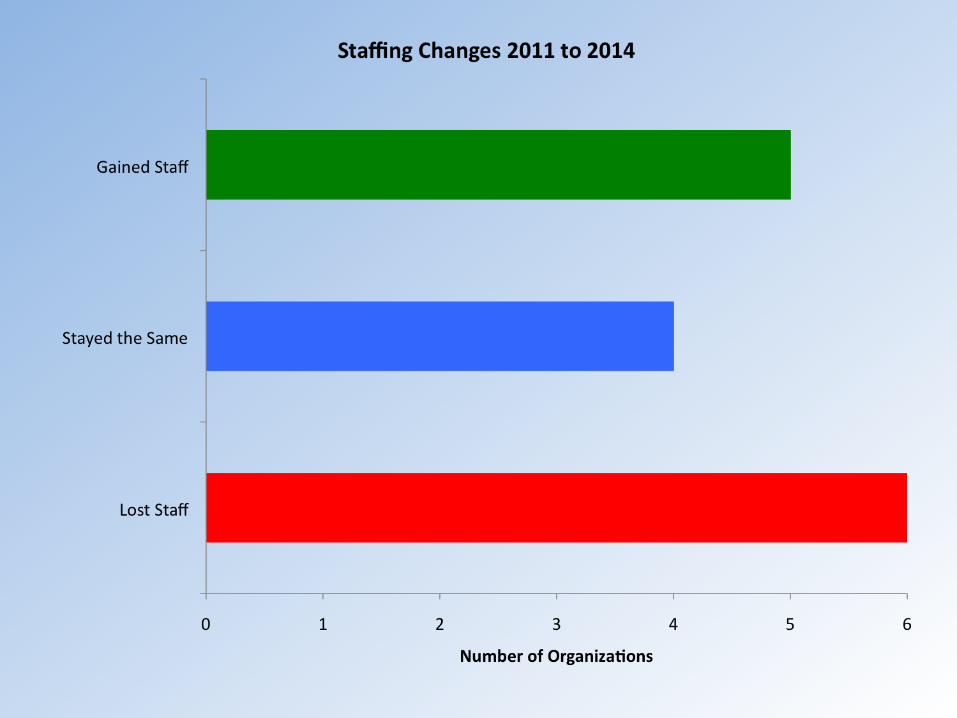

It was a mixed bag for organizations between 2011 and 2014, with almost equal numbers gaining and losing staff over the time period.

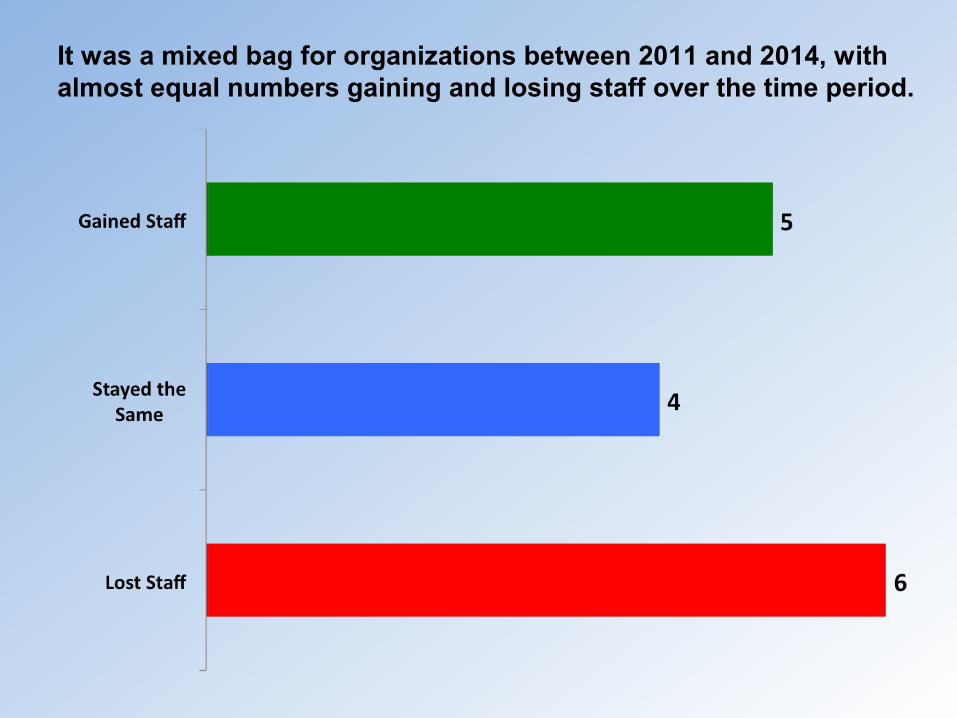
It was a mixed bag for organizations between 2011 and 2014, with almost equal numbers gaining and losing staff over the time period.

Data Makeover from Storytelling with Data

Data Makeover from Storytelling with Data

Simple Data Dashboards
From http://www.blueavocado.org/content/nonprofit-dashboard-and-signal-light-boards

More Complex Data Dashboards

Infographics


Infogr.am
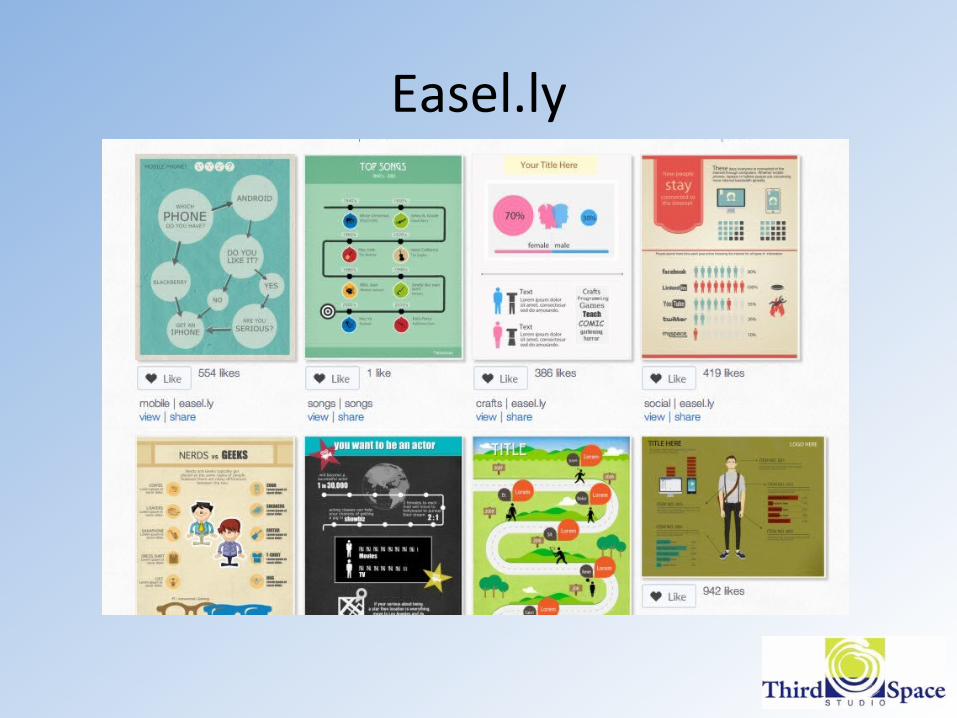
Easel.ly
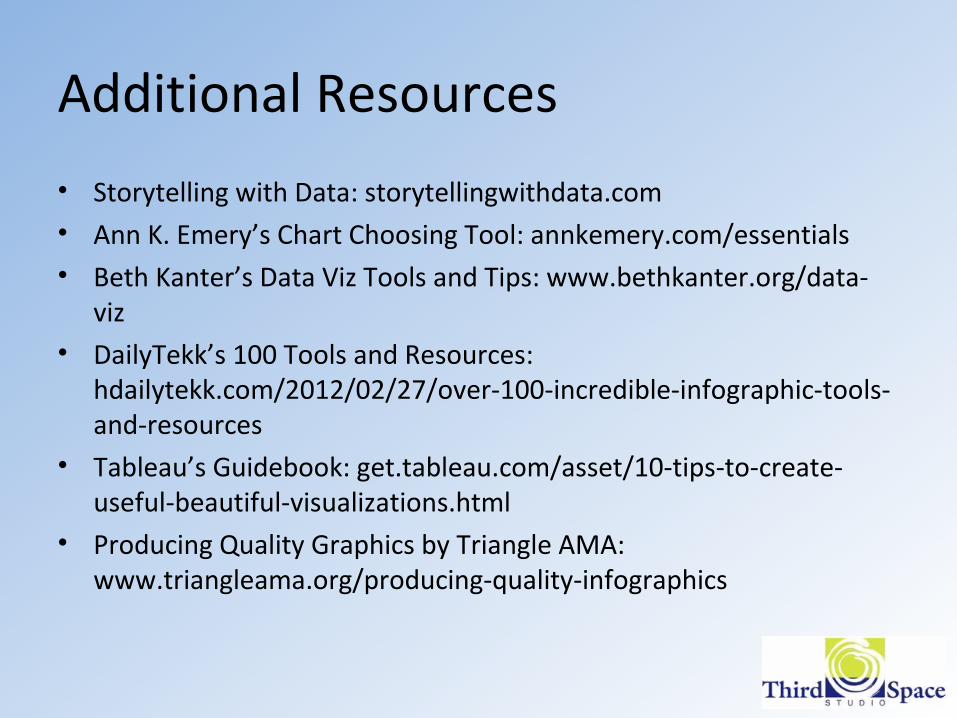
Additional Resources
• Storytelling with Data: storytellingwithdata.com • Ann K. Emery’s Chart Choosing Tool: annkemery.com/essentials• Beth Kanter’s Data Viz Tools and Tips: www.bethkanter.org/data-
viz• DailyTekk’s 100 Tools and Resources:
hdailytekk.com/2012/02/27/over-100-incredible-infographic-tools-and-resources
• Tableau’s Guidebook: get.tableau.com/asset/10-tips-to-create-useful-beautiful-visualizations.html
• Producing Quality Graphics by Triangle AMA: www.triangleama.org/producing-quality-infographics

Related Documents