Data Validation (DV) Report for Kepler ID 8042453 Quarters 1 - 17 This Data Validation Report was produced in the Kepler Science Operations Center Pipeline at NASA Ames Research Center 20-Sep-2014 03:37:42 Z

Welcome message from author
This document is posted to help you gain knowledge. Please leave a comment to let me know what you think about it! Share it to your friends and learn new things together.
Transcript

Data Validation (DV) Reportfor Kepler ID 8042453
Quarters 1 - 17
This Data Validation Report was produced in theKepler Science Operations Center Pipeline
at NASA Ames Research Center
20-Sep-2014 03:37:42 Z

This page intentionally left blank.
ii

Contents
1 Summary 1
2 UKIRT Image 3
3 Flux Time Series 4
4 Dashboards 19
5 Centroid Cloud Plot 20
6 Pixel Level Diagnostics 216.1 Planet Candidate 1 . . . . . . . . . . . . . . . . . . . . . . . . . . . . . . . . . . . . . . . . . . . . . . . . . . . . . . . . . . . . . . . . . . . . . . . . . . . . 21
7 Phased Light Curves 75
8 Planet Candidate 1 778.1 Model Fitter: All Transits . . . . . . . . . . . . . . . . . . . . . . . . . . . . . . . . . . . . . . . . . . . . . . . . . . . . . . . . . . . . . . . . . . . . . . . . 778.2 Model Fitter: Reduced Parameter Fit Results . . . . . . . . . . . . . . . . . . . . . . . . . . . . . . . . . . . . . . . . . . . . . . . . . . . . . . . . . . . . . 858.3 Validation Tests . . . . . . . . . . . . . . . . . . . . . . . . . . . . . . . . . . . . . . . . . . . . . . . . . . . . . . . . . . . . . . . . . . . . . . . . . . . . . 87
8.3.1 Weak Secondary Test . . . . . . . . . . . . . . . . . . . . . . . . . . . . . . . . . . . . . . . . . . . . . . . . . . . . . . . . . . . . . . . . . . . . . . 878.3.2 Flux-Weighted Centroid Test . . . . . . . . . . . . . . . . . . . . . . . . . . . . . . . . . . . . . . . . . . . . . . . . . . . . . . . . . . . . . . . . . . 878.3.3 Eclipsing Binary Discrimination Test . . . . . . . . . . . . . . . . . . . . . . . . . . . . . . . . . . . . . . . . . . . . . . . . . . . . . . . . . . . . . . 878.3.4 Bootstrap Test . . . . . . . . . . . . . . . . . . . . . . . . . . . . . . . . . . . . . . . . . . . . . . . . . . . . . . . . . . . . . . . . . . . . . . . . . . 87
Appendices 108
A Planet Candidate 1 108A.1 Model Fitter: All Transits . . . . . . . . . . . . . . . . . . . . . . . . . . . . . . . . . . . . . . . . . . . . . . . . . . . . . . . . . . . . . . . . . . . . . . . . 108A.2 Model Fitter: Odd & Even Transits . . . . . . . . . . . . . . . . . . . . . . . . . . . . . . . . . . . . . . . . . . . . . . . . . . . . . . . . . . . . . . . . . . 110A.3 Eclipsing Binary Discrimination Test . . . . . . . . . . . . . . . . . . . . . . . . . . . . . . . . . . . . . . . . . . . . . . . . . . . . . . . . . . . . . . . . . . 121
B Single Event Statistics from Residual Flux 122
C Alerts 123
iii

1 SUMMARY Target 8042453
1 Summary
Target Properties Value Uncertainty Units Provenance
Kepler ID 8042453KOI ID K02304Kepler Name -Sky Group 59RA 19.75386260 0 hours KICDec 43.82135000 0 degrees KICMagnitude 15.356 0 KICRadius 0.91 0.36 Solar radii DSEPEffective Temperature 5911 180 Kelvin PHO1log(g) 4.52 0.287 cm/sec2 KIC0[Fe/H] -0.10 0.3 Solar metallicity KIC0Number of Planet Candidates 1Categories MERGED, PLANETARY, INCLUDEPrior Pipeline Instance ID -KOI Model cumulative 20140908104217.csvKepler Names Model keplernames 20140908104737.csvExternal TCE Model -Software Revision svn+ssh://murzim/repo/soc/tags/release/9.2.19@56803Date Report Generated 20-Sep-2014 03:37:42 Z
Quarter Target Module/ Crowding Flux Limb Darkening CoefficientsTable Output Metric Fraction 1 2 3 4
1 20 19/3 0.9592 0.7244 0.4400 0.3432 0.0510 -0.10572 21 9/3 0.9243 0.8369 0.4400 0.3432 0.0510 -0.10573 26 7/3 0.9491 0.8035 0.4400 0.3432 0.0510 -0.10574 29 17/3 0.9290 0.8015 0.4400 0.3432 0.0510 -0.10575 32 19/3 0.9571 0.7278 0.4400 0.3432 0.0510 -0.10576 35 9/3 0.9201 0.8446 0.4400 0.3432 0.0510 -0.10577 38 7/3 0.9486 0.8052 0.4400 0.3432 0.0510 -0.10578 41 17/3 0.9279 0.8587 0.4400 0.3432 0.0510 -0.10579 44 19/3 0.9578 0.7276 0.4400 0.3432 0.0510 -0.1057
10 47 9/3 0.9201 0.8447 0.4400 0.3432 0.0510 -0.105711 50 7/3 0.9485 0.8054 0.4400 0.3432 0.0510 -0.105712 53 17/3 0.8759 0.9185 0.4400 0.3432 0.0510 -0.105713 56 19/3 0.9566 0.7262 0.4400 0.3432 0.0510 -0.105714 59 9/3 0.9208 0.8436 0.4400 0.3432 0.0510 -0.105715 62 7/3 0.9489 0.8045 0.4400 0.3432 0.0510 -0.105716 65 17/3 0.8768 0.9178 0.4400 0.3432 0.0510 -0.105717 68 19/3 0.9553 0.7223 0.4400 0.3432 0.0510 -0.1057
1

1 SUMMARY Target 8042453
Planet KOI ID Kepler KOI Period Period Epoch Semi-major Radius False SuspectedCandidate Name Correlation (days) Ratio (BKJD) Axis (AU) (Re) Alarm EB
1 K02304.01 - 0.89 11.2 1.0 134.7 0.1 1.6 2.46e-45 false
2

2 UKIRT IMAGE Target 8042453
2 UKIRT Image
UKIRT Wide Field Camera (WFCAM) infra-red J-band image. The 1’ x 1’ image is centered on the target (8042453).
3

3 FLUX TIME SERIES Target 8042453
3 Flux Time Series
Summary plot of quarter-stitched PDC flux time series and transits for target 8042453, marked with TPS epoch/period. Transits of identified planets are labeled withepoch KJD and orbital period determined by TPS. For the data of quarter 1, target table 20, start JD is 2454964 and the vertical offset is 0 ppm. For the data of quarter2, target table 21, start JD is 2455002 and the vertical offset is 100000 ppm. For the data of quarter 3, target table 26, start JD is 2455093 and the vertical offset is200000 ppm. For the data of quarter 4, target table 29, start JD is 2455184 and the vertical offset is 300000 ppm.Open ./summary-plots/008042453-00-flux-with-harmonics-tps-01-020.fig
4

3 FLUX TIME SERIES Target 8042453
Summary plot of quarter-stitched PDC flux time series and transits for target 8042453, marked with TPS epoch/period. Transits of identified planets are labeled withepoch KJD and orbital period determined by TPS. For the data of quarter 5, target table 32, start JD is 2455276 and the vertical offset is 0 ppm. For the data of quarter6, target table 35, start JD is 2455372 and the vertical offset is 100000 ppm. For the data of quarter 7, target table 38, start JD is 2455463 and the vertical offset is200000 ppm. For the data of quarter 8, target table 41, start JD is 2455568 and the vertical offset is 300000 ppm.Open ./summary-plots/008042453-00-flux-with-harmonics-tps-05-032.fig
5
3 FLUX TIME SERIES Target 8042453
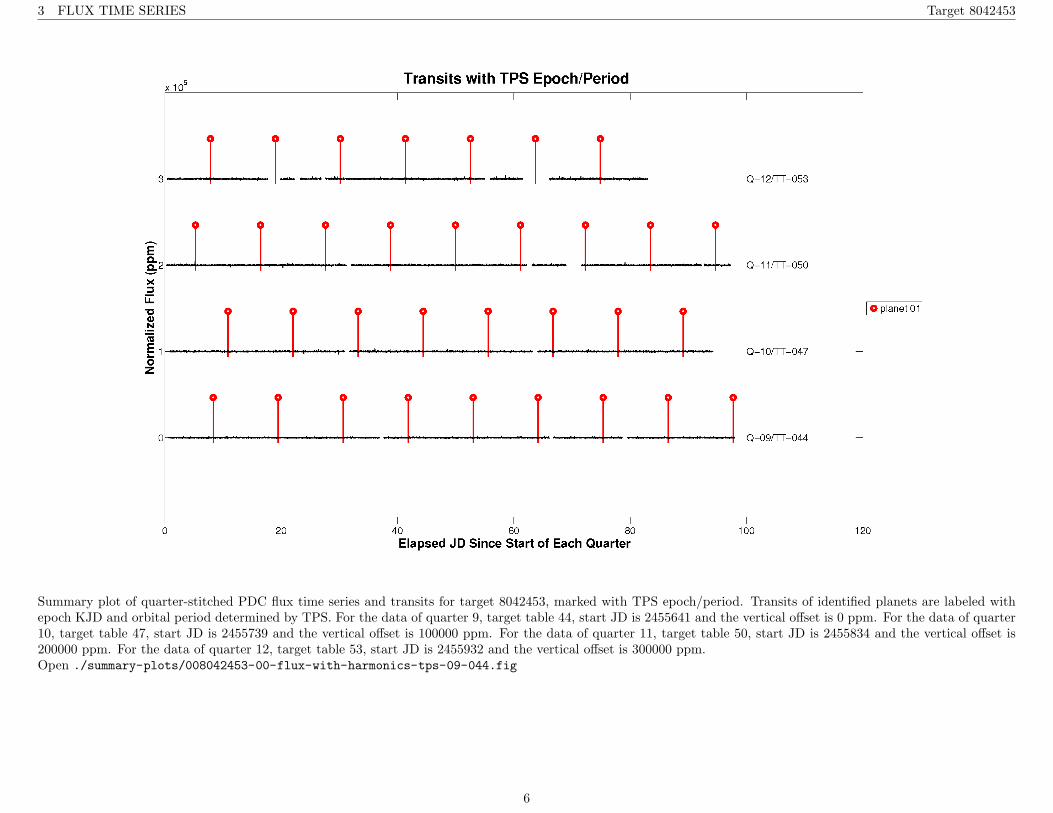
Summary plot of quarter-stitched PDC flux time series and transits for target 8042453, marked with TPS epoch/period. Transits of identified planets are labeled withepoch KJD and orbital period determined by TPS. For the data of quarter 9, target table 44, start JD is 2455641 and the vertical offset is 0 ppm. For the data of quarter10, target table 47, start JD is 2455739 and the vertical offset is 100000 ppm. For the data of quarter 11, target table 50, start JD is 2455834 and the vertical offset is200000 ppm. For the data of quarter 12, target table 53, start JD is 2455932 and the vertical offset is 300000 ppm.Open ./summary-plots/008042453-00-flux-with-harmonics-tps-09-044.fig
6

3 FLUX TIME SERIES Target 8042453
Summary plot of quarter-stitched PDC flux time series and transits for target 8042453, marked with TPS epoch/period. Transits of identified planets are labeled withepoch KJD and orbital period determined by TPS. For the data of quarter 13, target table 56, start JD is 2456015 and the vertical offset is 0 ppm. For the data ofquarter 14, target table 59, start JD is 2456107 and the vertical offset is 100000 ppm. For the data of quarter 15, target table 62, start JD is 2456206 and the verticaloffset is 200000 ppm. For the data of quarter 16, target table 65, start JD is 2456305 and the vertical offset is 300000 ppm.Open ./summary-plots/008042453-00-flux-with-harmonics-tps-13-056.fig
7

3 FLUX TIME SERIES Target 8042453
Summary plot of quarter-stitched PDC flux time series and transits for target 8042453, marked with TPS epoch/period. Transits of identified planets are labeled withepoch KJD and orbital period determined by TPS. For the data of quarter 17, target table 68, start JD is 2456392.Open ./summary-plots/008042453-00-flux-with-harmonics-tps-17-068.fig
8

3 FLUX TIME SERIES Target 8042453
Summary plot of quarter-stitched PDC flux time series and transits for target 8042453, marked with DV fitted epoch/period. Transits of identified planets are labeledwith epoch BKJD and orbital period determined by DV transit fitter. For the data of quarter 1, target table 20, start BJD is 2454964 and the vertical offset is 0 ppm.For the data of quarter 2, target table 21, start BJD is 2455002 and the vertical offset is 100000 ppm. For the data of quarter 3, target table 26, start BJD is 2455093and the vertical offset is 200000 ppm. For the data of quarter 4, target table 29, start BJD is 2455184 and the vertical offset is 300000 ppm.Open ./summary-plots/008042453-00-flux-with-harmonics-dv-fit-01-020.fig
9

3 FLUX TIME SERIES Target 8042453
Summary plot of quarter-stitched PDC flux time series and transits for target 8042453, marked with DV fitted epoch/period. Transits of identified planets are labeledwith epoch BKJD and orbital period determined by DV transit fitter. For the data of quarter 5, target table 32, start BJD is 2455276 and the vertical offset is 0 ppm.For the data of quarter 6, target table 35, start BJD is 2455372 and the vertical offset is 100000 ppm. For the data of quarter 7, target table 38, start BJD is 2455463and the vertical offset is 200000 ppm. For the data of quarter 8, target table 41, start BJD is 2455568 and the vertical offset is 300000 ppm.Open ./summary-plots/008042453-00-flux-with-harmonics-dv-fit-05-032.fig
10

3 FLUX TIME SERIES Target 8042453
Summary plot of quarter-stitched PDC flux time series and transits for target 8042453, marked with DV fitted epoch/period. Transits of identified planets are labeledwith epoch BKJD and orbital period determined by DV transit fitter. For the data of quarter 9, target table 44, start BJD is 2455641 and the vertical offset is 0 ppm.For the data of quarter 10, target table 47, start BJD is 2455739 and the vertical offset is 100000 ppm. For the data of quarter 11, target table 50, start BJD is 2455834and the vertical offset is 200000 ppm. For the data of quarter 12, target table 53, start BJD is 2455932 and the vertical offset is 300000 ppm.Open ./summary-plots/008042453-00-flux-with-harmonics-dv-fit-09-044.fig
11
3 FLUX TIME SERIES Target 8042453
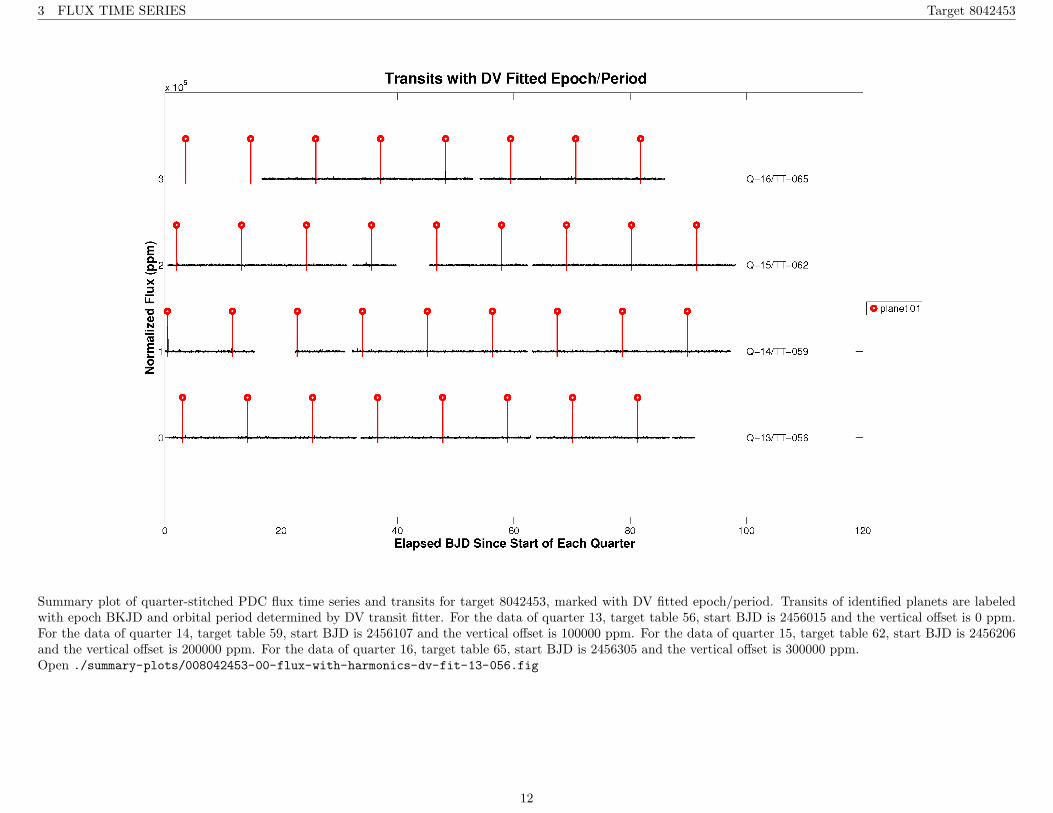
Summary plot of quarter-stitched PDC flux time series and transits for target 8042453, marked with DV fitted epoch/period. Transits of identified planets are labeledwith epoch BKJD and orbital period determined by DV transit fitter. For the data of quarter 13, target table 56, start BJD is 2456015 and the vertical offset is 0 ppm.For the data of quarter 14, target table 59, start BJD is 2456107 and the vertical offset is 100000 ppm. For the data of quarter 15, target table 62, start BJD is 2456206and the vertical offset is 200000 ppm. For the data of quarter 16, target table 65, start BJD is 2456305 and the vertical offset is 300000 ppm.Open ./summary-plots/008042453-00-flux-with-harmonics-dv-fit-13-056.fig
12

3 FLUX TIME SERIES Target 8042453
Summary plot of quarter-stitched PDC flux time series and transits for target 8042453, marked with DV fitted epoch/period. Transits of identified planets are labeledwith epoch BKJD and orbital period determined by DV transit fitter. For the data of quarter 17, target table 68, start BJD is 2456392.Open ./summary-plots/008042453-00-flux-with-harmonics-dv-fit-17-068.fig
No figures named 008042453-00-flux-harmonics-free-tps-*.fig are available.
No figures named 008042453-00-flux-harmonics-free-dv-fit-*.fig are available.
13

3 FLUX TIME SERIES Target 8042453
Summary plot of raw flux time series. For the data of quarter 1, target table 20, start JD is 2454964 and the vertical offset is 0 electrons/cadence. For the data of quarter2, target table 21, start JD is 2455002 and the vertical offset is 0 electrons/cadence. For the data of quarter 3, target table 26, start JD is 2455093 and the vertical offsetis 0 electrons/cadence. For the data of quarter 4, target table 29, start JD is 2455184 and the vertical offset is 0 electrons/cadence.Open ./summary-plots/008042453-00-raw-flux-01-020.fig
14

3 FLUX TIME SERIES Target 8042453
Summary plot of raw flux time series. For the data of quarter 5, target table 32, start JD is 2455276 and the vertical offset is 0 electrons/cadence. For the data of quarter6, target table 35, start JD is 2455372 and the vertical offset is 0 electrons/cadence. For the data of quarter 7, target table 38, start JD is 2455463 and the vertical offsetis 0 electrons/cadence. For the data of quarter 8, target table 41, start JD is 2455568 and the vertical offset is 0 electrons/cadence.Open ./summary-plots/008042453-00-raw-flux-05-032.fig
15
3 FLUX TIME SERIES Target 8042453
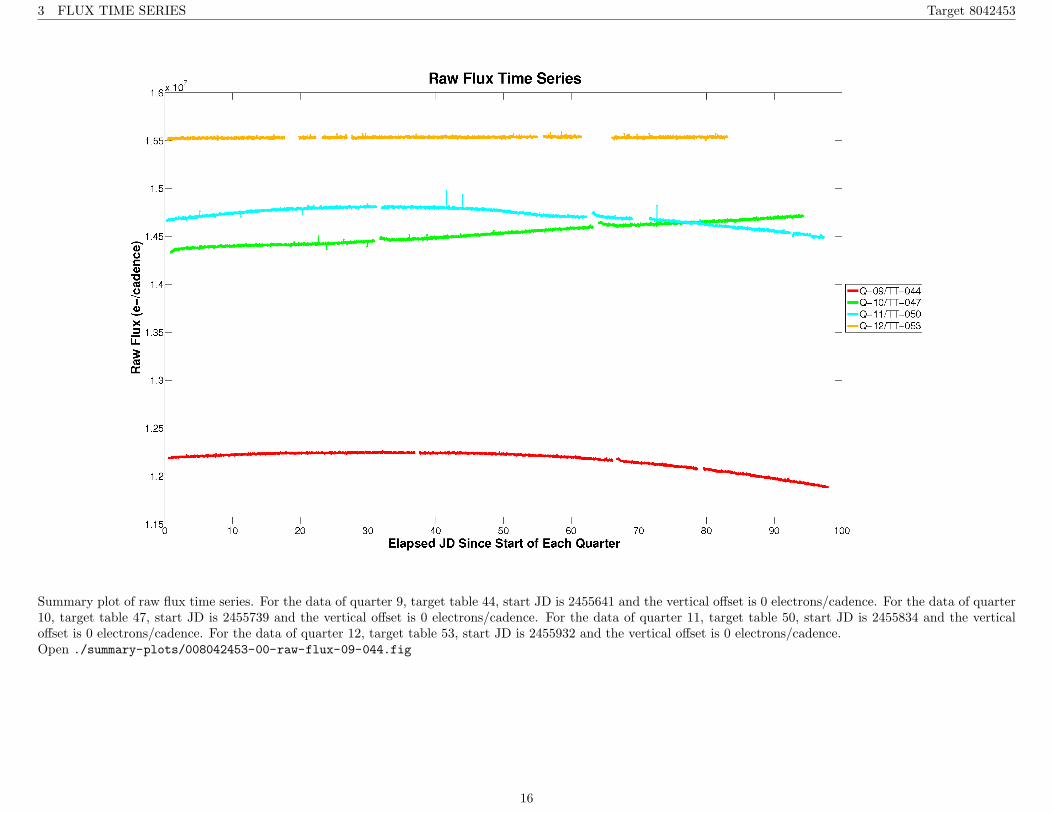
Summary plot of raw flux time series. For the data of quarter 9, target table 44, start JD is 2455641 and the vertical offset is 0 electrons/cadence. For the data of quarter10, target table 47, start JD is 2455739 and the vertical offset is 0 electrons/cadence. For the data of quarter 11, target table 50, start JD is 2455834 and the verticaloffset is 0 electrons/cadence. For the data of quarter 12, target table 53, start JD is 2455932 and the vertical offset is 0 electrons/cadence.Open ./summary-plots/008042453-00-raw-flux-09-044.fig
16

3 FLUX TIME SERIES Target 8042453
Summary plot of raw flux time series. For the data of quarter 13, target table 56, start JD is 2456015 and the vertical offset is 0 electrons/cadence. For the data ofquarter 14, target table 59, start JD is 2456107 and the vertical offset is 0 electrons/cadence. For the data of quarter 15, target table 62, start JD is 2456206 and thevertical offset is 0 electrons/cadence. For the data of quarter 16, target table 65, start JD is 2456305 and the vertical offset is 0 electrons/cadence.Open ./summary-plots/008042453-00-raw-flux-13-056.fig
17
3 FLUX TIME SERIES Target 8042453
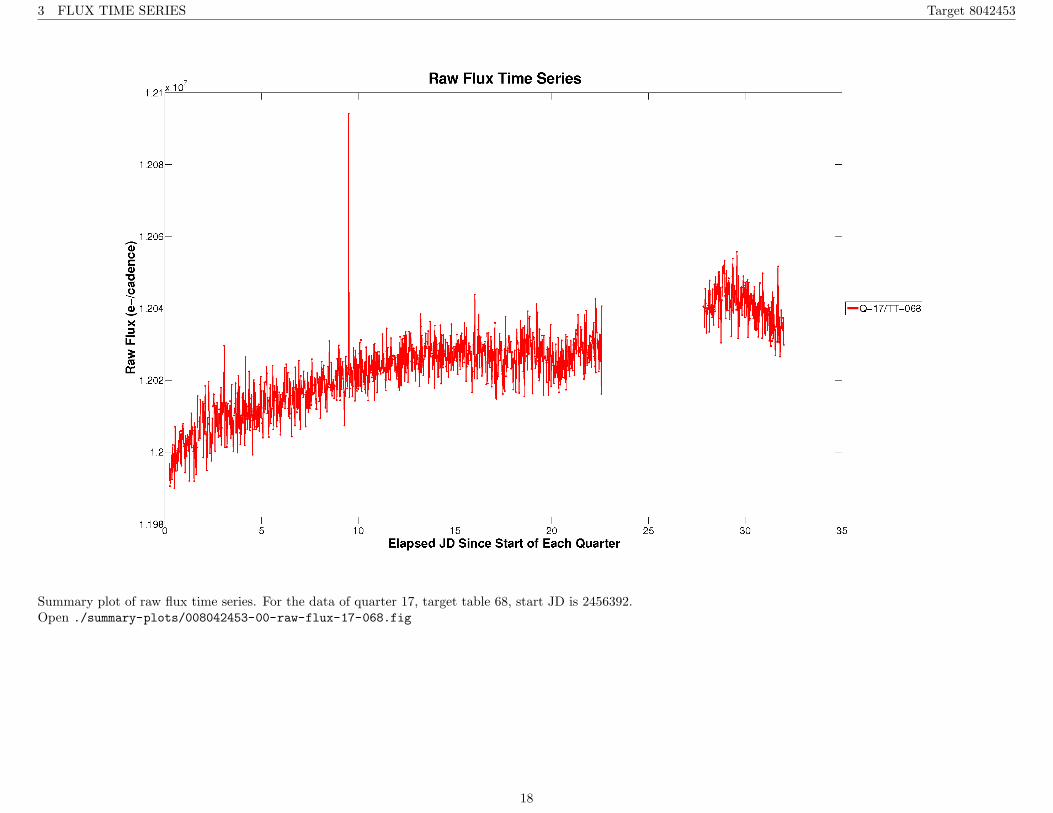
Summary plot of raw flux time series. For the data of quarter 17, target table 68, start JD is 2456392.Open ./summary-plots/008042453-00-raw-flux-17-068.fig
18

4 DASHBOARDS Target 8042453 / Planet Candidate 1
4 Dashboards
Planet Candidate 1
Mod
elF
itte
r
Stellar Radius0.9 ± 0.0 Solar units C
entroid
Test
Period = 11.2 ± 0.0 daysDepth = 326 ± 18 ppmPlanet Radius = 1.6 ± 1.5 Earth radiiSemi-major Axis = 0.1 ± 0.0 AUEquilibrium Temperature = 796 ± 159 KelvinChi-squared/DoF = 0.8SNR = 18.9
Flux Weighted Motion Detection Statistic
Value = 4.11e+00Significance = 12.78%Peak RA Offset -2.31e-04 ± 2.08e-04 arcsec (-1.1 σ)Peak Dec Offset = -1.77e-05 ± 2.08e-04 arcsec (-0.085 σ)Peak Offset Distance = 2.32e-04 ± 2.08e-04 arcsec (1.1 σ)Source RA Offset = 7.34e-01 ± 6.37e-01 arcsec (1.2 σ)Source Dec Offset = 3.78e-01 ± 6.36e-01 arcsec (0.59 σ)Source Offset Distance = 8.25e-01 ± 6.36e-01 arcsec (1.3 σ)
Ecl
ipsi
ng
Bin
ary
Dis
crim
inat
ion
Tes
t
Odd-Even DepthComparison Statistic
Value = 1.41e-02Significance = 90.56%
Odd-Even EpochComparison Statistic
Value = 8.88e-03Significance = 92.49%
Offsets Relative to Out of Transit Centroid
Source RA Offset = 8.95e-02 ± 1.88e-01 arcsec (0.48 σ)Source Dec Offset = -8.37e-03 ± 2.59e-01 arcsec (-0.03 σ)Source Offset Distance = 8.98e-02 ± 2.45e-01 arcsec (0.37 σ)
Offsets Relative to KIC Position
Source RA Offset = 1.56e-01 ± 1.89e-01 arcsec (0.82 σ)Source Dec Offset = 7.58e-02 ± 2.63e-01 arcsec (0.29 σ)Source Offset Distance = 1.73e-01 ± 2.05e-01 arcsec (0.84 σ)
Diff
erence
Image
Cen
troidO
ffsets
Shorter PeriodComparison Statistic
Value = N/ASignificance = N/A
Longer PeriodComparison Statistic
Value = N/ASignificance = N/A
False Alarm = 2.46e-45Final Skip Count = -1Observed Number of Transits = 123Max Multiple Event Statistic = 1.79e+01
Bootstrap
Test
Summary of model fitter results and validation test results for target 8042453, planet candidate 1. In general, green denotes that the candidate is likely a planet, whilered denotes that the candidate is unlikely to be a planet. Cyan denotes that no data is available. The color of the Model Fitter block is: green, when the SNR of thefit is greater than or equal to 10; yellow, if the SNR is greater than or equal to 7.1 but less than 10; red, if the SNR is less than 7.1 or if the fitter failed. The color ofthe Centroid Test and Eclipsing Binary Discrimination Test blocks are: green, when the significance is within 2-sigma; yellow, when the significance is between 2- and3-sigma; red when the significance is greater than 3-sigma. The color of the Difference Image Centroid Offsets block is: green, when the max offset distance sigma is lessthan or equal to 2; yellow, when the max sigma is between 2 and 3; red when the max sigma is greater than 3. The color of the Bootstrap Test block is green wheneverthe false alarm probability is less than 10−12, low enough to limit the total number of false alarms from a four year mission to less than one. If the false alarm probabilityis greater than 10−12, the color of the Bootstrap Test block is: green, when the false alarm probability is less than or equal to the CCDF of a Gaussian distribution at theobserved maximum multiple event statistic; yellow when the false alarm probability is between 1 and 2 times that of a Gaussian distribution at the max multiple eventstatistic; and red when the false alarm probability is more than 2 times that of a Gaussian distribution at the max multiple event statistic.
19

5 CENTROID CLOUD PLOT Target 8042453
5 Centroid Cloud Plot
KeplerId 8042453, KeplerMag 15.356 - This figure shows median detrended flux as a function of median detrended centroids for both ra and dec on the sky. Transitfeatures above the noise jitter are seen as scatter outside the central cloud. Features in the flux time series are seen in the vertical direction while features in the centroidtime series are seen in the horizontal direction. Any tilt to the out-of-cloud scatter indicates correlation between transit features in the flux and centroid time series. Theout of transit mean and standard deviation (SD) indicated in the lower left-hand corner are robust values.Open ./summary-plots/008042453-00-fluxWeighted-centroids-cloud.fig
20
6 PIXEL LEVEL DIAGNOSTICS Target 8042453 / Planet Candidate 1
6 Pixel Level Diagnostics
6.1 Planet Candidate 1
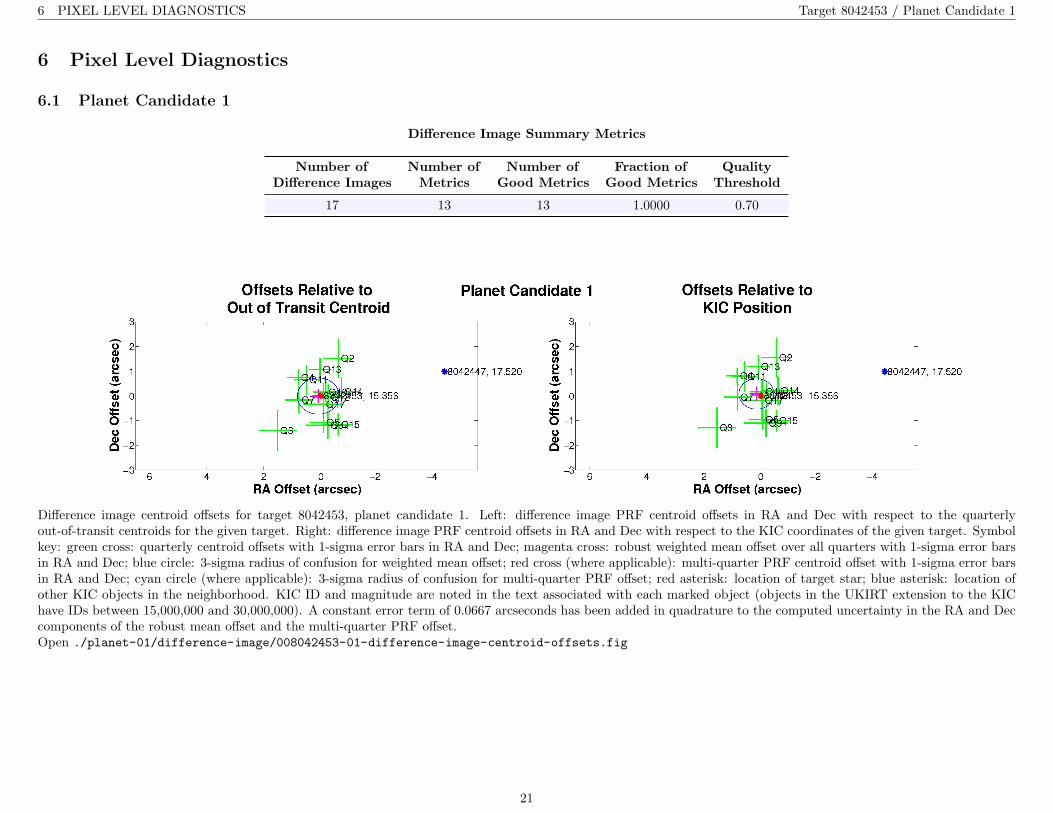
Difference Image Summary Metrics
Number of Number of Number of Fraction of QualityDifference Images Metrics Good Metrics Good Metrics Threshold
17 13 13 1.0000 0.70
Difference image centroid offsets for target 8042453, planet candidate 1. Left: difference image PRF centroid offsets in RA and Dec with respect to the quarterlyout-of-transit centroids for the given target. Right: difference image PRF centroid offsets in RA and Dec with respect to the KIC coordinates of the given target. Symbolkey: green cross: quarterly centroid offsets with 1-sigma error bars in RA and Dec; magenta cross: robust weighted mean offset over all quarters with 1-sigma error barsin RA and Dec; blue circle: 3-sigma radius of confusion for weighted mean offset; red cross (where applicable): multi-quarter PRF centroid offset with 1-sigma error barsin RA and Dec; cyan circle (where applicable): 3-sigma radius of confusion for multi-quarter PRF offset; red asterisk: location of target star; blue asterisk: location ofother KIC objects in the neighborhood. KIC ID and magnitude are noted in the text associated with each marked object (objects in the UKIRT extension to the KIChave IDs between 15,000,000 and 30,000,000). A constant error term of 0.0667 arcseconds has been added in quadrature to the computed uncertainty in the RA and Deccomponents of the robust mean offset and the multi-quarter PRF offset.Open ./planet-01/difference-image/008042453-01-difference-image-centroid-offsets.fig
21

6 PIXEL LEVEL DIAGNOSTICS Target 8042453 / Planet Candidate 1
Multi-Quarter Average PRF Fit of the Difference Images
Mean offset from the PRF fit to the out of transit imageRA Dec Units
Offset 0.0895± 1.88e− 01 −0.0084± 2.59e− 01 arcsecondsOffset/σ 0.48 −0.03
Offset Distance 0.0898± 2.45e− 01 arcsecondsOffset Distance/σ 0.373σ Radius 0.7342 arcseconds
Mean offset from the KIC RA and DecRA Dec Units
Offset 0.1556± 1.89e− 01 0.0758± 2.63e− 01 arcsecondsOffset/σ 0.82 0.29
Offset Distance 0.1731± 2.05e− 01 arcsecondsOffset Distance/σ 0.843σ Radius 0.6156 arcseconds
Bootstrap Multi-Quarter PRF Fit of the Difference Images
Bootstrap multi-quarter PRF fit results for the difference images associated with this planet candidate are not available.
22

6 PIXEL LEVEL DIAGNOSTICS Target 8042453 / Planet Candidate 1
Pixel correlation centroid offsets figure cannot be generated because there are no valid centroid offsets.
23

6 PIXEL LEVEL DIAGNOSTICS Target 8042453 / Planet Candidate 1 / Quarter 1 / Target Table 20
Difference image for target 8042453, planet candidate 1, quarter 1, target table 20. Upper left: difference between mean flux out-of-transit and in-transit; upper right:mean out-of-transit flux; lower left: mean in-transit flux; lower right: difference between mean flux out-of-transit and in-transit after normalizing by the uncertainty inthe difference for each pixel. The optimal aperture is outlined with a white dash-dotted line in each panel and the target mask is outlined with a solid white line. Symbolkey: x: target position from KIC RA and Dec converted to CCD coordinates via motion polynomials; *: position of nearby KIC objects converted to CCD coordinates viamotion polynomials (objects in the UKIRT extension to the KIC have IDs between 15,000,000 and 30,000,000); +: PRF-fit location of target from out-of-transit image;triangle: PRF-fit location of transit source from the difference image. CCD row and column coordinates are 0-based. Number of transits = 3; number of valid in-transitcadences = 15; number of in-transit cadence gaps = 0; number of valid out-of-transit cadences = 42; number of out-of-transit cadence gaps = 0. Difference image qualitymetric = N/A.Open ./planet-01/difference-image/008042453-01-difference-image-01-020.fig
24

6 PIXEL LEVEL DIAGNOSTICS Target 8042453 / Planet Candidate 1 / Quarter 1 / Target Table 20
The pixel correlation statistic plot is not available because either the fit for target 8042453, planet candidate 1 failed,or there were no observed transits for this candidate in target table 20.
25

6 PIXEL LEVEL DIAGNOSTICS Target 8042453 / Planet Candidate 1 / Quarter 1 / Target Table 20
PRF Fit of the Difference Image
The out of transit image centroid and difference image centroid could not be calculated for target 8042453,planet candidate 1, in target table 20.
PRF Fit of the Pixel Correlation Image
The pixel correlation image centroid could not be calculated for target 8042453,planet candidate 1, in target table 20.
26

6 PIXEL LEVEL DIAGNOSTICS Target 8042453 / Planet Candidate 1 / Quarter 2 / Target Table 21
Difference image for target 8042453, planet candidate 1, quarter 2, target table 21. Upper left: difference between mean flux out-of-transit and in-transit; upper right:mean out-of-transit flux; lower left: mean in-transit flux; lower right: difference between mean flux out-of-transit and in-transit after normalizing by the uncertainty inthe difference for each pixel. The optimal aperture is outlined with a white dash-dotted line in each panel and the target mask is outlined with a solid white line. Symbolkey: x: target position from KIC RA and Dec converted to CCD coordinates via motion polynomials; *: position of nearby KIC objects converted to CCD coordinates viamotion polynomials (objects in the UKIRT extension to the KIC have IDs between 15,000,000 and 30,000,000); +: PRF-fit location of target from out-of-transit image;triangle: PRF-fit location of transit source from the difference image. CCD row and column coordinates are 0-based. Number of transits = 6; number of valid in-transitcadences = 32; number of in-transit cadence gaps = 1; number of valid out-of-transit cadences = 76; number of out-of-transit cadence gaps = 0. Difference image qualitymetric = 0.76 (good).Open ./planet-01/difference-image/008042453-01-difference-image-02-021.fig
27

6 PIXEL LEVEL DIAGNOSTICS Target 8042453 / Planet Candidate 1 / Quarter 2 / Target Table 21
The pixel correlation statistic plot is not available because either the fit for target 8042453, planet candidate 1 failed,or there were no observed transits for this candidate in target table 21.
28
6 PIXEL LEVEL DIAGNOSTICS Target 8042453 / Planet Candidate 1 / Quarter 2 / Target Table 21
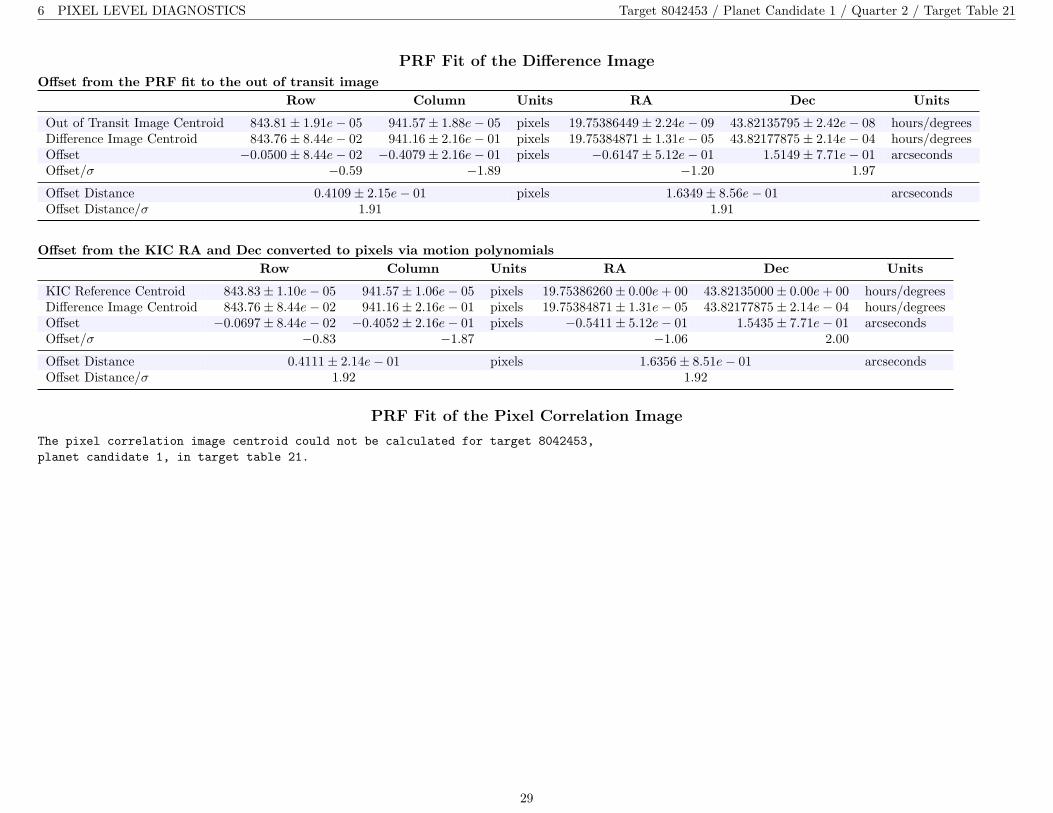
PRF Fit of the Difference Image
Offset from the PRF fit to the out of transit imageRow Column Units RA Dec Units
Out of Transit Image Centroid 843.81± 1.91e− 05 941.57± 1.88e− 05 pixels 19.75386449± 2.24e− 09 43.82135795± 2.42e− 08 hours/degreesDifference Image Centroid 843.76± 8.44e− 02 941.16± 2.16e− 01 pixels 19.75384871± 1.31e− 05 43.82177875± 2.14e− 04 hours/degreesOffset −0.0500± 8.44e− 02 −0.4079± 2.16e− 01 pixels −0.6147± 5.12e− 01 1.5149± 7.71e− 01 arcsecondsOffset/σ −0.59 −1.89 −1.20 1.97
Offset Distance 0.4109± 2.15e− 01 pixels 1.6349± 8.56e− 01 arcsecondsOffset Distance/σ 1.91 1.91
Offset from the KIC RA and Dec converted to pixels via motion polynomialsRow Column Units RA Dec Units
KIC Reference Centroid 843.83± 1.10e− 05 941.57± 1.06e− 05 pixels 19.75386260± 0.00e+ 00 43.82135000± 0.00e+ 00 hours/degreesDifference Image Centroid 843.76± 8.44e− 02 941.16± 2.16e− 01 pixels 19.75384871± 1.31e− 05 43.82177875± 2.14e− 04 hours/degreesOffset −0.0697± 8.44e− 02 −0.4052± 2.16e− 01 pixels −0.5411± 5.12e− 01 1.5435± 7.71e− 01 arcsecondsOffset/σ −0.83 −1.87 −1.06 2.00
Offset Distance 0.4111± 2.14e− 01 pixels 1.6356± 8.51e− 01 arcsecondsOffset Distance/σ 1.92 1.92
PRF Fit of the Pixel Correlation Image
The pixel correlation image centroid could not be calculated for target 8042453,planet candidate 1, in target table 21.
29

6 PIXEL LEVEL DIAGNOSTICS Target 8042453 / Planet Candidate 1 / Quarter 3 / Target Table 26
Difference image for target 8042453, planet candidate 1, quarter 3, target table 26. Upper left: difference between mean flux out-of-transit and in-transit; upper right:mean out-of-transit flux; lower left: mean in-transit flux; lower right: difference between mean flux out-of-transit and in-transit after normalizing by the uncertainty inthe difference for each pixel. The optimal aperture is outlined with a white dash-dotted line in each panel and the target mask is outlined with a solid white line. Symbolkey: x: target position from KIC RA and Dec converted to CCD coordinates via motion polynomials; *: position of nearby KIC objects converted to CCD coordinates viamotion polynomials (objects in the UKIRT extension to the KIC have IDs between 15,000,000 and 30,000,000); +: PRF-fit location of target from out-of-transit image;triangle: PRF-fit location of transit source from the difference image. CCD row and column coordinates are 0-based. Number of transits = 6; number of valid in-transitcadences = 32; number of in-transit cadence gaps = 0; number of valid out-of-transit cadences = 75; number of out-of-transit cadence gaps = 1. Difference image qualitymetric = 0.75 (good).Open ./planet-01/difference-image/008042453-01-difference-image-03-026.fig
30

6 PIXEL LEVEL DIAGNOSTICS Target 8042453 / Planet Candidate 1 / Quarter 3 / Target Table 26
The pixel correlation statistic plot is not available because either the fit for target 8042453, planet candidate 1 failed,or there were no observed transits for this candidate in target table 26.
31

6 PIXEL LEVEL DIAGNOSTICS Target 8042453 / Planet Candidate 1 / Quarter 3 / Target Table 26
PRF Fit of the Difference Image
Offset from the PRF fit to the out of transit imageRow Column Units RA Dec Units
Out of Transit Image Centroid 841.90± 2.96e− 05 938.38± 3.33e− 05 pixels 19.75386322± 3.19e− 09 43.82138019± 3.80e− 08 hours/degreesDifference Image Centroid 841.74± 1.55e− 01 938.87± 2.05e− 01 pixels 19.75390227± 1.63e− 05 43.82098951± 2.23e− 04 hours/degreesOffset −0.1625± 1.55e− 01 0.4947± 2.05e− 01 pixels 1.5212± 6.35e− 01 −1.4065± 8.04e− 01 arcsecondsOffset/σ −1.05 2.42 2.39 −1.75
Offset Distance 0.5207± 1.95e− 01 pixels 2.0718± 7.77e− 01 arcsecondsOffset Distance/σ 2.68 2.67
Offset from the KIC RA and Dec converted to pixels via motion polynomialsRow Column Units RA Dec Units
KIC Reference Centroid 841.92± 8.08e− 06 938.40± 9.64e− 06 pixels 19.75386260± 0.00e+ 00 43.82135000± 0.00e+ 00 hours/degreesDifference Image Centroid 841.74± 1.55e− 01 938.87± 2.05e− 01 pixels 19.75390227± 1.63e− 05 43.82098951± 2.23e− 04 hours/degreesOffset −0.1811± 1.55e− 01 0.4738± 2.05e− 01 pixels 1.5455± 6.35e− 01 −1.2978± 8.04e− 01 arcsecondsOffset/σ −1.17 2.32 2.43 −1.61
Offset Distance 0.5072± 1.92e− 01 pixels 2.0181± 7.68e− 01 arcsecondsOffset Distance/σ 2.64 2.63
PRF Fit of the Pixel Correlation Image
The pixel correlation image centroid could not be calculated for target 8042453,planet candidate 1, in target table 26.
32
6 PIXEL LEVEL DIAGNOSTICS Target 8042453 / Planet Candidate 1 / Quarter 4 / Target Table 29
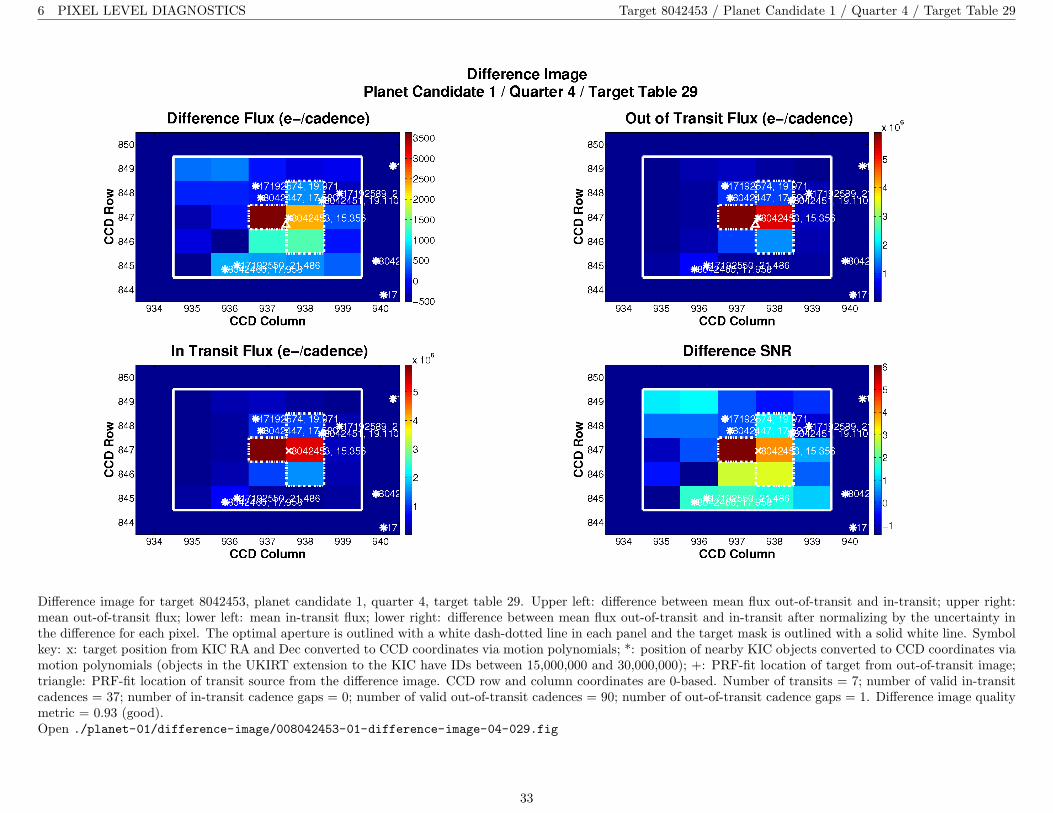
Difference image for target 8042453, planet candidate 1, quarter 4, target table 29. Upper left: difference between mean flux out-of-transit and in-transit; upper right:mean out-of-transit flux; lower left: mean in-transit flux; lower right: difference between mean flux out-of-transit and in-transit after normalizing by the uncertainty inthe difference for each pixel. The optimal aperture is outlined with a white dash-dotted line in each panel and the target mask is outlined with a solid white line. Symbolkey: x: target position from KIC RA and Dec converted to CCD coordinates via motion polynomials; *: position of nearby KIC objects converted to CCD coordinates viamotion polynomials (objects in the UKIRT extension to the KIC have IDs between 15,000,000 and 30,000,000); +: PRF-fit location of target from out-of-transit image;triangle: PRF-fit location of transit source from the difference image. CCD row and column coordinates are 0-based. Number of transits = 7; number of valid in-transitcadences = 37; number of in-transit cadence gaps = 0; number of valid out-of-transit cadences = 90; number of out-of-transit cadence gaps = 1. Difference image qualitymetric = 0.93 (good).Open ./planet-01/difference-image/008042453-01-difference-image-04-029.fig
33

6 PIXEL LEVEL DIAGNOSTICS Target 8042453 / Planet Candidate 1 / Quarter 4 / Target Table 29
The pixel correlation statistic plot is not available because either the fit for target 8042453, planet candidate 1 failed,or there were no observed transits for this candidate in target table 29.
34

6 PIXEL LEVEL DIAGNOSTICS Target 8042453 / Planet Candidate 1 / Quarter 4 / Target Table 29
PRF Fit of the Difference Image
Offset from the PRF fit to the out of transit imageRow Column Units RA Dec Units
Out of Transit Image Centroid 846.94± 2.97e− 05 937.56± 1.88e− 05 pixels 19.75386371± 3.12e− 09 43.82136801± 2.65e− 08 hours/degreesDifference Image Centroid 846.68± 9.61e− 02 937.49± 6.77e− 02 pixels 19.75388384± 9.57e− 06 43.82157457± 7.96e− 05 hours/degreesOffset −0.2631± 9.61e− 02 −0.0675± 6.77e− 02 pixels 0.7842± 3.73e− 01 0.7436± 2.87e− 01 arcsecondsOffset/σ −2.74 −1.00 2.10 2.59
Offset Distance 0.2716± 9.32e− 02 pixels 1.0807± 3.73e− 01 arcsecondsOffset Distance/σ 2.92 2.90
Offset from the KIC RA and Dec converted to pixels via motion polynomialsRow Column Units RA Dec Units
KIC Reference Centroid 846.96± 1.11e− 05 937.56± 1.17e− 05 pixels 19.75386260± 0.00e+ 00 43.82135000± 0.00e+ 00 hours/degreesDifference Image Centroid 846.68± 9.61e− 02 937.49± 6.77e− 02 pixels 19.75388384± 9.57e− 06 43.82157457± 7.96e− 05 hours/degreesOffset −0.2805± 9.61e− 02 −0.0765± 6.77e− 02 pixels 0.8275± 3.73e− 01 0.8085± 2.87e− 01 arcsecondsOffset/σ −2.92 −1.13 2.22 2.82
Offset Distance 0.2907± 9.29e− 02 pixels 1.1569± 3.71e− 01 arcsecondsOffset Distance/σ 3.13 3.11
PRF Fit of the Pixel Correlation Image
The pixel correlation image centroid could not be calculated for target 8042453,planet candidate 1, in target table 29.
35

6 PIXEL LEVEL DIAGNOSTICS Target 8042453 / Planet Candidate 1 / Quarter 5 / Target Table 32
Difference image for target 8042453, planet candidate 1, quarter 5, target table 32. Upper left: difference between mean flux out-of-transit and in-transit; upper right:mean out-of-transit flux; lower left: mean in-transit flux; lower right: difference between mean flux out-of-transit and in-transit after normalizing by the uncertainty inthe difference for each pixel. The optimal aperture is outlined with a white dash-dotted line in each panel and the target mask is outlined with a solid white line. Symbolkey: x: target position from KIC RA and Dec converted to CCD coordinates via motion polynomials; *: position of nearby KIC objects converted to CCD coordinatesvia motion polynomials (objects in the UKIRT extension to the KIC have IDs between 15,000,000 and 30,000,000); +: PRF-fit location of target from out-of-transitimage; triangle: PRF-fit location of transit source from the difference image. CCD row and column coordinates are 0-based. Number of transits = 9; number of validin-transit cadences = 49; number of in-transit cadence gaps = 0; number of valid out-of-transit cadences = 118; number of out-of-transit cadence gaps = 0. Differenceimage quality metric = 0.77 (good).Open ./planet-01/difference-image/008042453-01-difference-image-05-032.fig
36

6 PIXEL LEVEL DIAGNOSTICS Target 8042453 / Planet Candidate 1 / Quarter 5 / Target Table 32
The pixel correlation statistic plot is not available because either the fit for target 8042453, planet candidate 1 failed,or there were no observed transits for this candidate in target table 32.
37

6 PIXEL LEVEL DIAGNOSTICS Target 8042453 / Planet Candidate 1 / Quarter 5 / Target Table 32
PRF Fit of the Difference Image
Offset from the PRF fit to the out of transit imageRow Column Units RA Dec Units
Out of Transit Image Centroid 849.44± 1.36e− 05 940.93± 3.27e− 05 pixels 19.75386348± 2.30e− 09 43.82138206± 3.31e− 08 hours/degreesDifference Image Centroid 849.60± 1.17e− 01 941.16± 1.01e− 01 pixels 19.75386094± 1.20e− 05 43.82108442± 1.12e− 04 hours/degreesOffset 0.1526± 1.17e− 01 0.2233± 1.01e− 01 pixels −0.0992± 4.68e− 01 −1.0715± 4.02e− 01 arcsecondsOffset/σ 1.31 2.21 −0.21 −2.66
Offset Distance 0.2705± 1.02e− 01 pixels 1.0761± 4.07e− 01 arcsecondsOffset Distance/σ 2.65 2.65
Offset from the KIC RA and Dec converted to pixels via motion polynomialsRow Column Units RA Dec Units
KIC Reference Centroid 849.47± 8.61e− 06 940.96± 8.44e− 06 pixels 19.75386260± 0.00e+ 00 43.82135000± 0.00e+ 00 hours/degreesDifference Image Centroid 849.60± 1.17e− 01 941.16± 1.01e− 01 pixels 19.75386094± 1.20e− 05 43.82108442± 1.12e− 04 hours/degreesOffset 0.1310± 1.17e− 01 0.2022± 1.01e− 01 pixels −0.0648± 4.68e− 01 −0.9561± 4.02e− 01 arcsecondsOffset/σ 1.12 2.00 −0.14 −2.38
Offset Distance 0.2409± 1.02e− 01 pixels 0.9583± 4.05e− 01 arcsecondsOffset Distance/σ 2.36 2.36
PRF Fit of the Pixel Correlation Image
The pixel correlation image centroid could not be calculated for target 8042453,planet candidate 1, in target table 32.
38
6 PIXEL LEVEL DIAGNOSTICS Target 8042453 / Planet Candidate 1 / Quarter 6 / Target Table 35
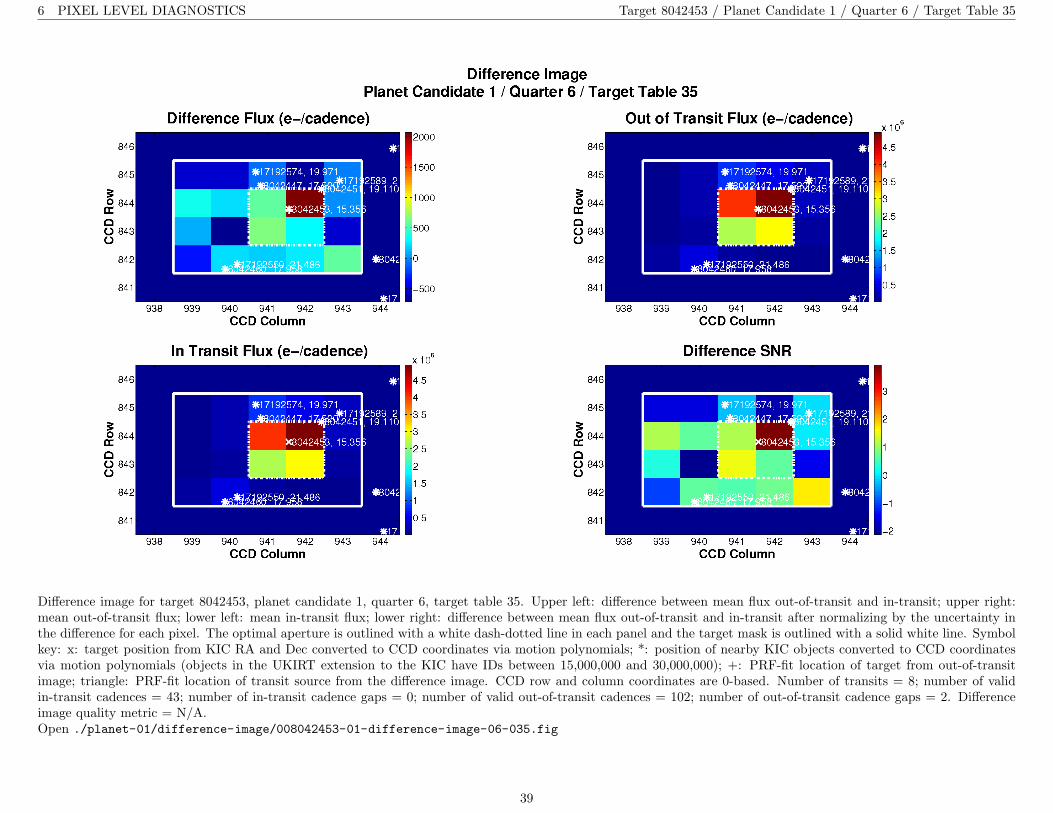
Difference image for target 8042453, planet candidate 1, quarter 6, target table 35. Upper left: difference between mean flux out-of-transit and in-transit; upper right:mean out-of-transit flux; lower left: mean in-transit flux; lower right: difference between mean flux out-of-transit and in-transit after normalizing by the uncertainty inthe difference for each pixel. The optimal aperture is outlined with a white dash-dotted line in each panel and the target mask is outlined with a solid white line. Symbolkey: x: target position from KIC RA and Dec converted to CCD coordinates via motion polynomials; *: position of nearby KIC objects converted to CCD coordinatesvia motion polynomials (objects in the UKIRT extension to the KIC have IDs between 15,000,000 and 30,000,000); +: PRF-fit location of target from out-of-transitimage; triangle: PRF-fit location of transit source from the difference image. CCD row and column coordinates are 0-based. Number of transits = 8; number of validin-transit cadences = 43; number of in-transit cadence gaps = 0; number of valid out-of-transit cadences = 102; number of out-of-transit cadence gaps = 2. Differenceimage quality metric = N/A.Open ./planet-01/difference-image/008042453-01-difference-image-06-035.fig
39

6 PIXEL LEVEL DIAGNOSTICS Target 8042453 / Planet Candidate 1 / Quarter 6 / Target Table 35
The pixel correlation statistic plot is not available because either the fit for target 8042453, planet candidate 1 failed,or there were no observed transits for this candidate in target table 35.
40

6 PIXEL LEVEL DIAGNOSTICS Target 8042453 / Planet Candidate 1 / Quarter 6 / Target Table 35
PRF Fit of the Difference Image
The out of transit image centroid and difference image centroid could not be calculated for target 8042453,planet candidate 1, in target table 35.
PRF Fit of the Pixel Correlation Image
The pixel correlation image centroid could not be calculated for target 8042453,planet candidate 1, in target table 35.
41
6 PIXEL LEVEL DIAGNOSTICS Target 8042453 / Planet Candidate 1 / Quarter 7 / Target Table 38
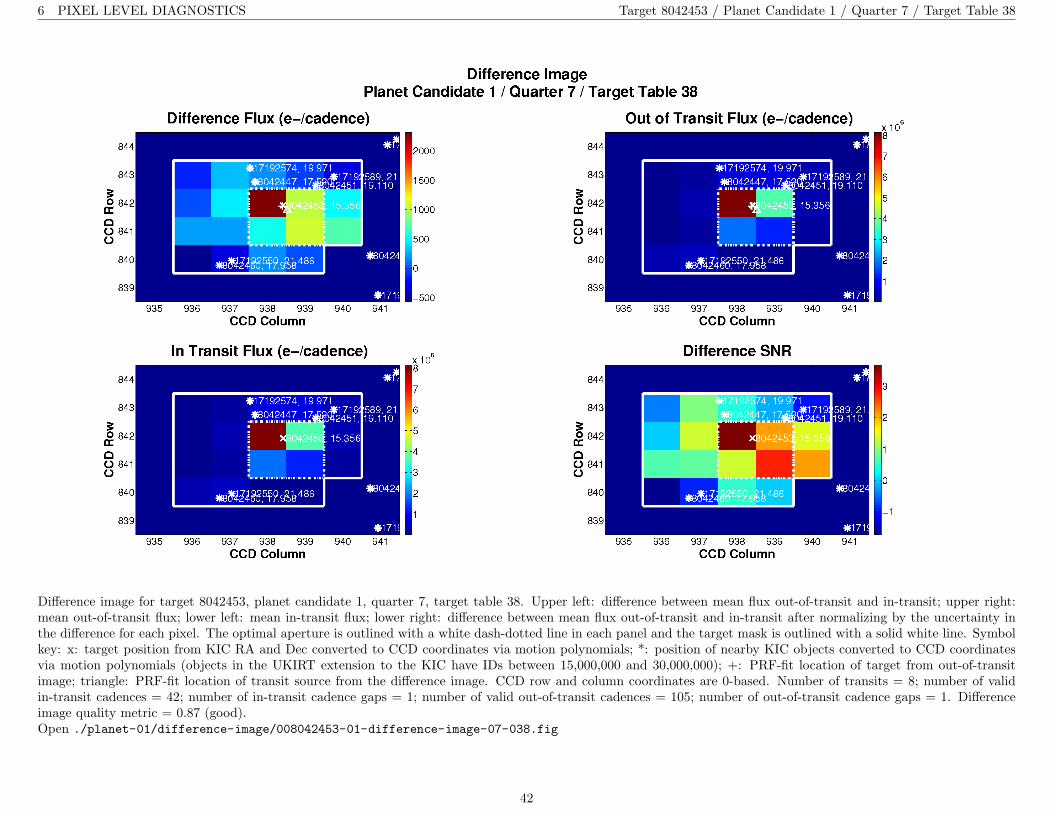
Difference image for target 8042453, planet candidate 1, quarter 7, target table 38. Upper left: difference between mean flux out-of-transit and in-transit; upper right:mean out-of-transit flux; lower left: mean in-transit flux; lower right: difference between mean flux out-of-transit and in-transit after normalizing by the uncertainty inthe difference for each pixel. The optimal aperture is outlined with a white dash-dotted line in each panel and the target mask is outlined with a solid white line. Symbolkey: x: target position from KIC RA and Dec converted to CCD coordinates via motion polynomials; *: position of nearby KIC objects converted to CCD coordinatesvia motion polynomials (objects in the UKIRT extension to the KIC have IDs between 15,000,000 and 30,000,000); +: PRF-fit location of target from out-of-transitimage; triangle: PRF-fit location of transit source from the difference image. CCD row and column coordinates are 0-based. Number of transits = 8; number of validin-transit cadences = 42; number of in-transit cadence gaps = 1; number of valid out-of-transit cadences = 105; number of out-of-transit cadence gaps = 1. Differenceimage quality metric = 0.87 (good).Open ./planet-01/difference-image/008042453-01-difference-image-07-038.fig
42
6 PIXEL LEVEL DIAGNOSTICS Target 8042453 / Planet Candidate 1 / Quarter 7 / Target Table 38
The pixel correlation statistic plot is not available because either the fit for target 8042453, planet candidate 1 failed,or there were no observed transits for this candidate in target table 38.
43

6 PIXEL LEVEL DIAGNOSTICS Target 8042453 / Planet Candidate 1 / Quarter 7 / Target Table 38
PRF Fit of the Difference Image
Offset from the PRF fit to the out of transit imageRow Column Units RA Dec Units
Out of Transit Image Centroid 841.89± 2.47e− 05 938.39± 2.82e− 05 pixels 19.75386373± 2.72e− 09 43.82138342± 3.24e− 08 hours/degreesDifference Image Centroid 841.74± 1.09e− 01 938.53± 1.34e− 01 pixels 19.75388360± 1.17e− 05 43.82133588± 1.43e− 04 hours/degreesOffset −0.1492± 1.09e− 01 0.1321± 1.34e− 01 pixels 0.7742± 4.57e− 01 −0.1712± 5.16e− 01 arcsecondsOffset/σ −1.37 0.99 1.69 −0.33
Offset Distance 0.1993± 1.19e− 01 pixels 0.7929± 4.77e− 01 arcsecondsOffset Distance/σ 1.68 1.66
Offset from the KIC RA and Dec converted to pixels via motion polynomialsRow Column Units RA Dec Units
KIC Reference Centroid 841.91± 8.21e− 06 938.42± 9.46e− 06 pixels 19.75386260± 0.00e+ 00 43.82135000± 0.00e+ 00 hours/degreesDifference Image Centroid 841.74± 1.09e− 01 938.53± 1.34e− 01 pixels 19.75388360± 1.17e− 05 43.82133588± 1.43e− 04 hours/degreesOffset −0.1735± 1.09e− 01 0.1111± 1.34e− 01 pixels 0.8182± 4.57e− 01 −0.0508± 5.16e− 01 arcsecondsOffset/σ −1.59 0.83 1.79 −0.10
Offset Distance 0.2060± 1.15e− 01 pixels 0.8197± 4.62e− 01 arcsecondsOffset Distance/σ 1.79 1.77
PRF Fit of the Pixel Correlation Image
The pixel correlation image centroid could not be calculated for target 8042453,planet candidate 1, in target table 38.
44

6 PIXEL LEVEL DIAGNOSTICS Target 8042453 / Planet Candidate 1 / Quarter 8 / Target Table 41
Difference image for target 8042453, planet candidate 1, quarter 8, target table 41. Upper left: difference between mean flux out-of-transit and in-transit; upper right:mean out-of-transit flux; lower left: mean in-transit flux; lower right: difference between mean flux out-of-transit and in-transit after normalizing by the uncertainty inthe difference for each pixel. The optimal aperture is outlined with a white dash-dotted line in each panel and the target mask is outlined with a solid white line. Symbolkey: x: target position from KIC RA and Dec converted to CCD coordinates via motion polynomials; *: position of nearby KIC objects converted to CCD coordinates viamotion polynomials (objects in the UKIRT extension to the KIC have IDs between 15,000,000 and 30,000,000); +: PRF-fit location of target from out-of-transit image;triangle: PRF-fit location of transit source from the difference image. CCD row and column coordinates are 0-based. Number of transits = 6; number of valid in-transitcadences = 31; number of in-transit cadence gaps = 1; number of valid out-of-transit cadences = 78; number of out-of-transit cadence gaps = 0. Difference image qualitymetric = N/A.Open ./planet-01/difference-image/008042453-01-difference-image-08-041.fig
45

6 PIXEL LEVEL DIAGNOSTICS Target 8042453 / Planet Candidate 1 / Quarter 8 / Target Table 41
The pixel correlation statistic plot is not available because either the fit for target 8042453, planet candidate 1 failed,or there were no observed transits for this candidate in target table 41.
46
6 PIXEL LEVEL DIAGNOSTICS Target 8042453 / Planet Candidate 1 / Quarter 8 / Target Table 41
PRF Fit of the Difference Image
The out of transit image centroid and difference image centroid could not be calculated for target 8042453,planet candidate 1, in target table 41.
PRF Fit of the Pixel Correlation Image
The pixel correlation image centroid could not be calculated for target 8042453,planet candidate 1, in target table 41.
47

6 PIXEL LEVEL DIAGNOSTICS Target 8042453 / Planet Candidate 1 / Quarter 9 / Target Table 44
Difference image for target 8042453, planet candidate 1, quarter 9, target table 44. Upper left: difference between mean flux out-of-transit and in-transit; upper right:mean out-of-transit flux; lower left: mean in-transit flux; lower right: difference between mean flux out-of-transit and in-transit after normalizing by the uncertainty inthe difference for each pixel. The optimal aperture is outlined with a white dash-dotted line in each panel and the target mask is outlined with a solid white line. Symbolkey: x: target position from KIC RA and Dec converted to CCD coordinates via motion polynomials; *: position of nearby KIC objects converted to CCD coordinatesvia motion polynomials (objects in the UKIRT extension to the KIC have IDs between 15,000,000 and 30,000,000); +: PRF-fit location of target from out-of-transitimage; triangle: PRF-fit location of transit source from the difference image. CCD row and column coordinates are 0-based. Number of transits = 8; number of validin-transit cadences = 44; number of in-transit cadence gaps = 0; number of valid out-of-transit cadences = 101; number of out-of-transit cadence gaps = 1. Differenceimage quality metric = 0.86 (good).Open ./planet-01/difference-image/008042453-01-difference-image-09-044.fig
48

6 PIXEL LEVEL DIAGNOSTICS Target 8042453 / Planet Candidate 1 / Quarter 9 / Target Table 44
The pixel correlation statistic plot is not available because either the fit for target 8042453, planet candidate 1 failed,or there were no observed transits for this candidate in target table 44.
49

6 PIXEL LEVEL DIAGNOSTICS Target 8042453 / Planet Candidate 1 / Quarter 9 / Target Table 44
PRF Fit of the Difference Image
Offset from the PRF fit to the out of transit imageRow Column Units RA Dec Units
Out of Transit Image Centroid 849.48± 1.41e− 05 940.95± 3.46e− 05 pixels 19.75386412± 2.40e− 09 43.82137160± 3.51e− 08 hours/degreesDifference Image Centroid 849.68± 1.91e− 01 941.18± 1.26e− 01 pixels 19.75385796± 1.91e− 05 43.82104147± 1.49e− 04 hours/degreesOffset 0.1978± 1.91e− 01 0.2318± 1.26e− 01 pixels −0.2399± 7.44e− 01 −1.1885± 5.36e− 01 arcsecondsOffset/σ 1.03 1.84 −0.32 −2.22
Offset Distance 0.3048± 1.47e− 01 pixels 1.2125± 5.85e− 01 arcsecondsOffset Distance/σ 2.07 2.07
Offset from the KIC RA and Dec converted to pixels via motion polynomialsRow Column Units RA Dec Units
KIC Reference Centroid 849.50± 8.82e− 06 940.96± 8.92e− 06 pixels 19.75386260± 0.00e+ 00 43.82135000± 0.00e+ 00 hours/degreesDifference Image Centroid 849.68± 1.91e− 01 941.18± 1.26e− 01 pixels 19.75385796± 1.91e− 05 43.82104147± 1.49e− 04 hours/degreesOffset 0.1753± 1.91e− 01 0.2220± 1.26e− 01 pixels −0.1808± 7.44e− 01 −1.1107± 5.36e− 01 arcsecondsOffset/σ 0.92 1.76 −0.24 −2.07
Offset Distance 0.2829± 1.44e− 01 pixels 1.1253± 5.75e− 01 arcsecondsOffset Distance/σ 1.96 1.96
PRF Fit of the Pixel Correlation Image
The pixel correlation image centroid could not be calculated for target 8042453,planet candidate 1, in target table 44.
50
6 PIXEL LEVEL DIAGNOSTICS Target 8042453 / Planet Candidate 1 / Quarter 10 / Target Table 47
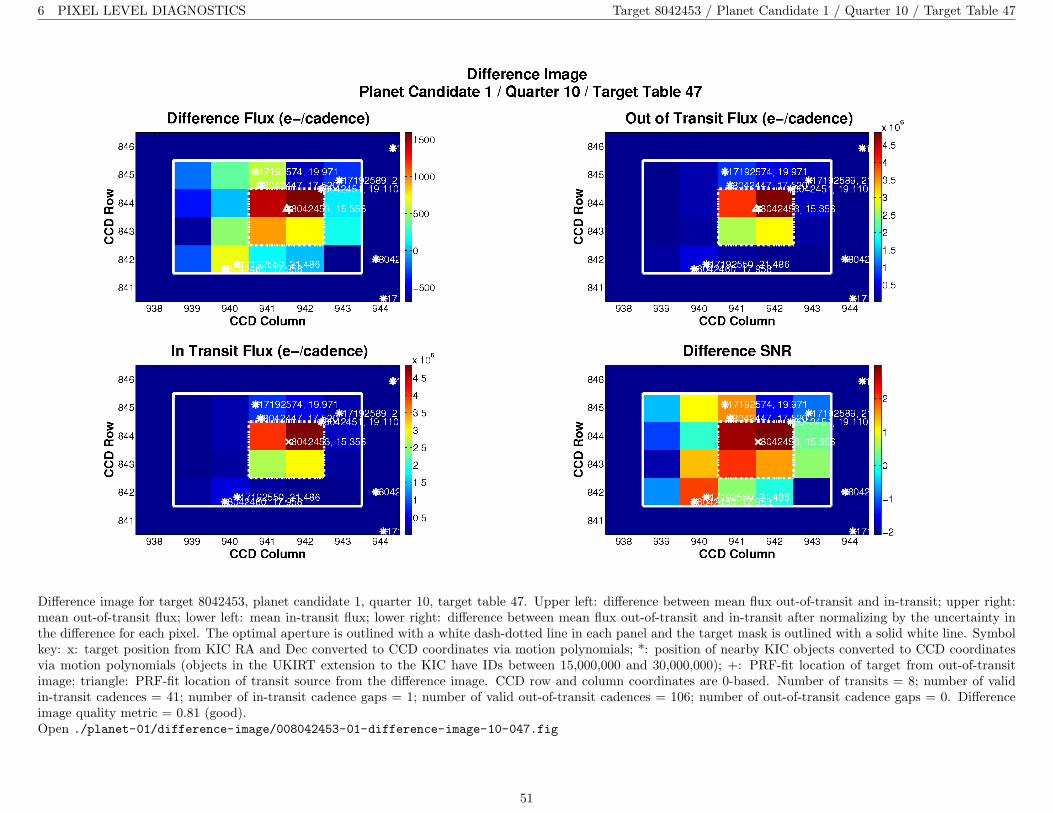
Difference image for target 8042453, planet candidate 1, quarter 10, target table 47. Upper left: difference between mean flux out-of-transit and in-transit; upper right:mean out-of-transit flux; lower left: mean in-transit flux; lower right: difference between mean flux out-of-transit and in-transit after normalizing by the uncertainty inthe difference for each pixel. The optimal aperture is outlined with a white dash-dotted line in each panel and the target mask is outlined with a solid white line. Symbolkey: x: target position from KIC RA and Dec converted to CCD coordinates via motion polynomials; *: position of nearby KIC objects converted to CCD coordinatesvia motion polynomials (objects in the UKIRT extension to the KIC have IDs between 15,000,000 and 30,000,000); +: PRF-fit location of target from out-of-transitimage; triangle: PRF-fit location of transit source from the difference image. CCD row and column coordinates are 0-based. Number of transits = 8; number of validin-transit cadences = 41; number of in-transit cadence gaps = 1; number of valid out-of-transit cadences = 106; number of out-of-transit cadence gaps = 0. Differenceimage quality metric = 0.81 (good).Open ./planet-01/difference-image/008042453-01-difference-image-10-047.fig
51

6 PIXEL LEVEL DIAGNOSTICS Target 8042453 / Planet Candidate 1 / Quarter 10 / Target Table 47
The pixel correlation statistic plot is not available because either the fit for target 8042453, planet candidate 1 failed,or there were no observed transits for this candidate in target table 47.
52
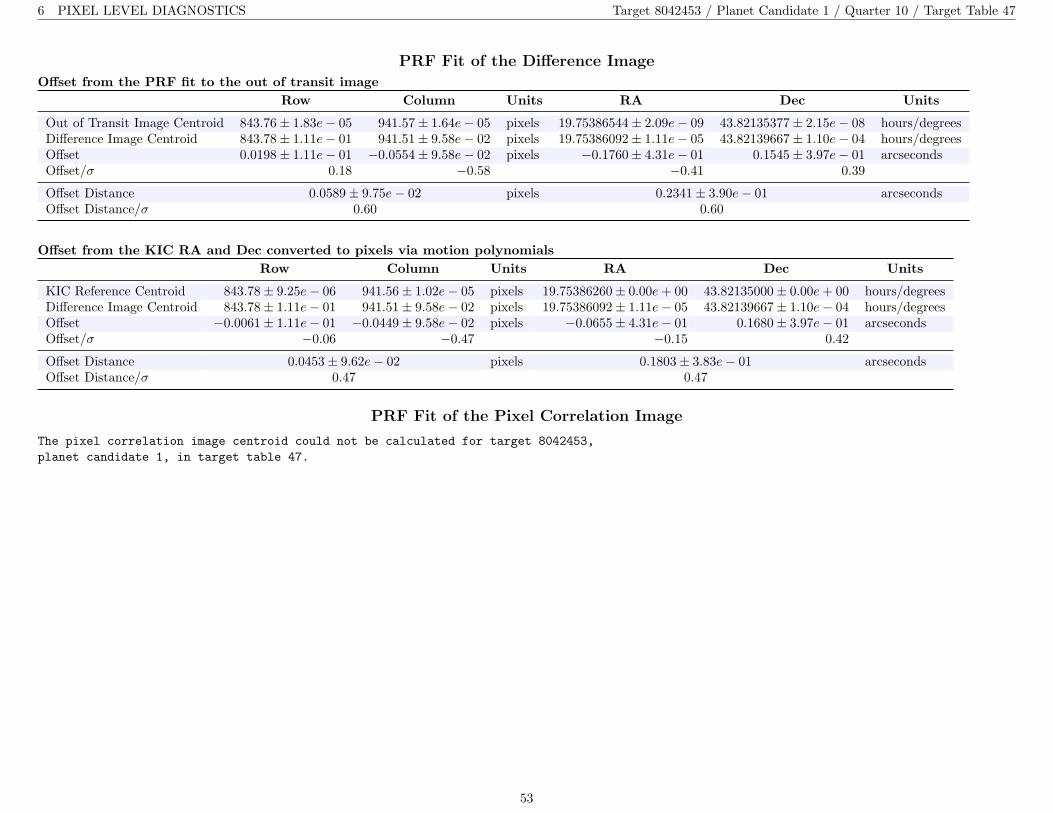
6 PIXEL LEVEL DIAGNOSTICS Target 8042453 / Planet Candidate 1 / Quarter 10 / Target Table 47
PRF Fit of the Difference Image
Offset from the PRF fit to the out of transit imageRow Column Units RA Dec Units
Out of Transit Image Centroid 843.76± 1.83e− 05 941.57± 1.64e− 05 pixels 19.75386544± 2.09e− 09 43.82135377± 2.15e− 08 hours/degreesDifference Image Centroid 843.78± 1.11e− 01 941.51± 9.58e− 02 pixels 19.75386092± 1.11e− 05 43.82139667± 1.10e− 04 hours/degreesOffset 0.0198± 1.11e− 01 −0.0554± 9.58e− 02 pixels −0.1760± 4.31e− 01 0.1545± 3.97e− 01 arcsecondsOffset/σ 0.18 −0.58 −0.41 0.39
Offset Distance 0.0589± 9.75e− 02 pixels 0.2341± 3.90e− 01 arcsecondsOffset Distance/σ 0.60 0.60
Offset from the KIC RA and Dec converted to pixels via motion polynomialsRow Column Units RA Dec Units
KIC Reference Centroid 843.78± 9.25e− 06 941.56± 1.02e− 05 pixels 19.75386260± 0.00e+ 00 43.82135000± 0.00e+ 00 hours/degreesDifference Image Centroid 843.78± 1.11e− 01 941.51± 9.58e− 02 pixels 19.75386092± 1.11e− 05 43.82139667± 1.10e− 04 hours/degreesOffset −0.0061± 1.11e− 01 −0.0449± 9.58e− 02 pixels −0.0655± 4.31e− 01 0.1680± 3.97e− 01 arcsecondsOffset/σ −0.06 −0.47 −0.15 0.42
Offset Distance 0.0453± 9.62e− 02 pixels 0.1803± 3.83e− 01 arcsecondsOffset Distance/σ 0.47 0.47
PRF Fit of the Pixel Correlation Image
The pixel correlation image centroid could not be calculated for target 8042453,planet candidate 1, in target table 47.
53

6 PIXEL LEVEL DIAGNOSTICS Target 8042453 / Planet Candidate 1 / Quarter 11 / Target Table 50
Difference image for target 8042453, planet candidate 1, quarter 11, target table 50. Upper left: difference between mean flux out-of-transit and in-transit; upper right:mean out-of-transit flux; lower left: mean in-transit flux; lower right: difference between mean flux out-of-transit and in-transit after normalizing by the uncertainty inthe difference for each pixel. The optimal aperture is outlined with a white dash-dotted line in each panel and the target mask is outlined with a solid white line. Symbolkey: x: target position from KIC RA and Dec converted to CCD coordinates via motion polynomials; *: position of nearby KIC objects converted to CCD coordinatesvia motion polynomials (objects in the UKIRT extension to the KIC have IDs between 15,000,000 and 30,000,000); +: PRF-fit location of target from out-of-transitimage; triangle: PRF-fit location of transit source from the difference image. CCD row and column coordinates are 0-based. Number of transits = 8; number of validin-transit cadences = 40; number of in-transit cadence gaps = 2; number of valid out-of-transit cadences = 100; number of out-of-transit cadence gaps = 2. Differenceimage quality metric = 0.94 (good).Open ./planet-01/difference-image/008042453-01-difference-image-11-050.fig
54

6 PIXEL LEVEL DIAGNOSTICS Target 8042453 / Planet Candidate 1 / Quarter 11 / Target Table 50
The pixel correlation statistic plot is not available because either the fit for target 8042453, planet candidate 1 failed,or there were no observed transits for this candidate in target table 50.
55

6 PIXEL LEVEL DIAGNOSTICS Target 8042453 / Planet Candidate 1 / Quarter 11 / Target Table 50
PRF Fit of the Difference Image
Offset from the PRF fit to the out of transit imageRow Column Units RA Dec Units
Out of Transit Image Centroid 841.88± 2.54e− 05 938.40± 2.91e− 05 pixels 19.75386443± 2.84e− 09 43.82138790± 3.37e− 08 hours/degreesDifference Image Centroid 841.69± 8.91e− 02 938.32± 1.56e− 01 pixels 19.75387728± 1.07e− 05 43.82156756± 1.61e− 04 hours/degreesOffset −0.1889± 8.91e− 02 −0.0810± 1.56e− 01 pixels 0.5007± 4.18e− 01 0.6468± 5.81e− 01 arcsecondsOffset/σ −2.12 −0.52 1.20 1.11
Offset Distance 0.2056± 1.06e− 01 pixels 0.8179± 4.23e− 01 arcsecondsOffset Distance/σ 1.94 1.93
Offset from the KIC RA and Dec converted to pixels via motion polynomialsRow Column Units RA Dec Units
KIC Reference Centroid 841.91± 9.53e− 06 938.42± 1.03e− 05 pixels 19.75386260± 0.00e+ 00 43.82135000± 0.00e+ 00 hours/degreesDifference Image Centroid 841.69± 8.91e− 02 938.32± 1.56e− 01 pixels 19.75387728± 1.07e− 05 43.82156756± 1.61e− 04 hours/degreesOffset −0.2212± 8.91e− 02 −0.1023± 1.56e− 01 pixels 0.5718± 4.18e− 01 0.7832± 5.81e− 01 arcsecondsOffset/σ −2.48 −0.66 1.37 1.35
Offset Distance 0.2437± 1.08e− 01 pixels 0.9697± 4.30e− 01 arcsecondsOffset Distance/σ 2.26 2.26
PRF Fit of the Pixel Correlation Image
The pixel correlation image centroid could not be calculated for target 8042453,planet candidate 1, in target table 50.
56
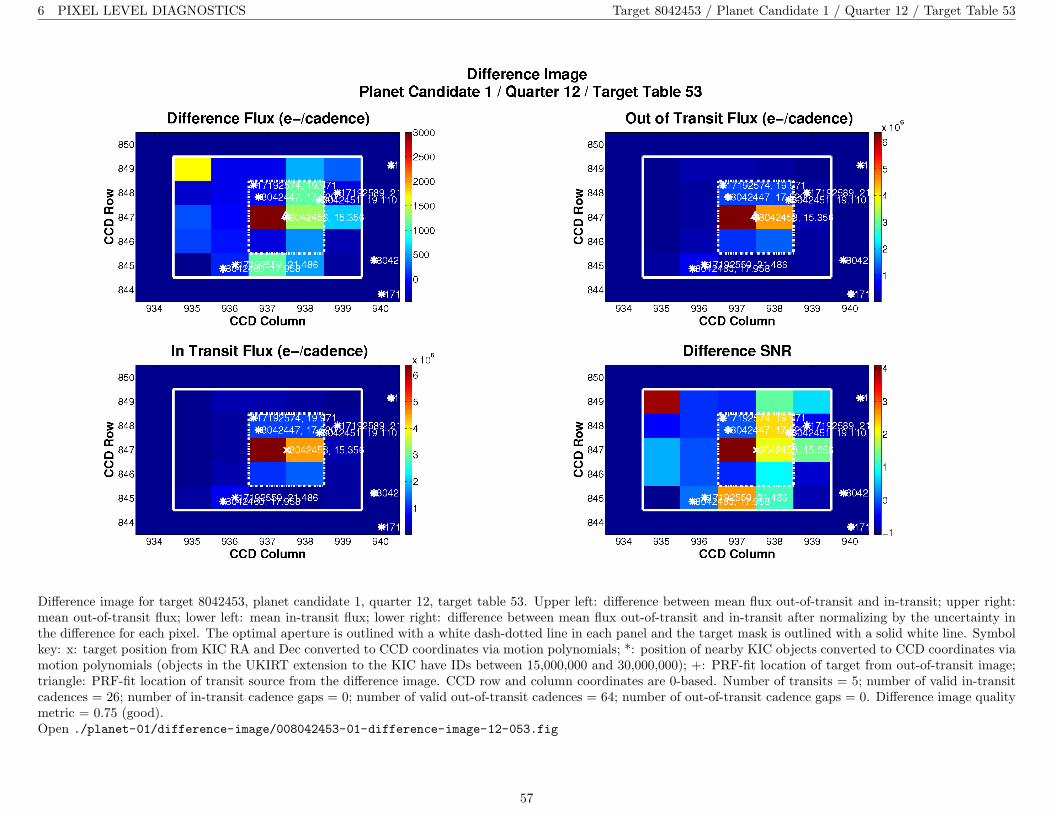
6 PIXEL LEVEL DIAGNOSTICS Target 8042453 / Planet Candidate 1 / Quarter 12 / Target Table 53
Difference image for target 8042453, planet candidate 1, quarter 12, target table 53. Upper left: difference between mean flux out-of-transit and in-transit; upper right:mean out-of-transit flux; lower left: mean in-transit flux; lower right: difference between mean flux out-of-transit and in-transit after normalizing by the uncertainty inthe difference for each pixel. The optimal aperture is outlined with a white dash-dotted line in each panel and the target mask is outlined with a solid white line. Symbolkey: x: target position from KIC RA and Dec converted to CCD coordinates via motion polynomials; *: position of nearby KIC objects converted to CCD coordinates viamotion polynomials (objects in the UKIRT extension to the KIC have IDs between 15,000,000 and 30,000,000); +: PRF-fit location of target from out-of-transit image;triangle: PRF-fit location of transit source from the difference image. CCD row and column coordinates are 0-based. Number of transits = 5; number of valid in-transitcadences = 26; number of in-transit cadence gaps = 0; number of valid out-of-transit cadences = 64; number of out-of-transit cadence gaps = 0. Difference image qualitymetric = 0.75 (good).Open ./planet-01/difference-image/008042453-01-difference-image-12-053.fig
57

6 PIXEL LEVEL DIAGNOSTICS Target 8042453 / Planet Candidate 1 / Quarter 12 / Target Table 53
The pixel correlation statistic plot is not available because either the fit for target 8042453, planet candidate 1 failed,or there were no observed transits for this candidate in target table 53.
58
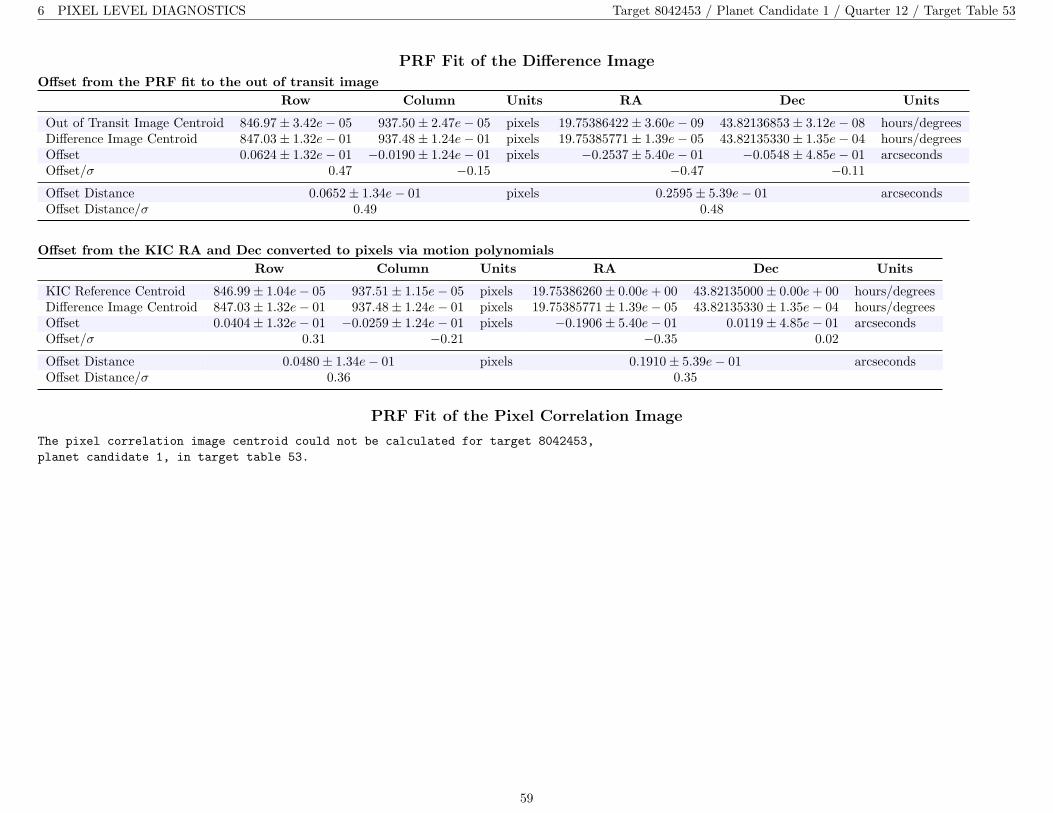
6 PIXEL LEVEL DIAGNOSTICS Target 8042453 / Planet Candidate 1 / Quarter 12 / Target Table 53
PRF Fit of the Difference Image
Offset from the PRF fit to the out of transit imageRow Column Units RA Dec Units
Out of Transit Image Centroid 846.97± 3.42e− 05 937.50± 2.47e− 05 pixels 19.75386422± 3.60e− 09 43.82136853± 3.12e− 08 hours/degreesDifference Image Centroid 847.03± 1.32e− 01 937.48± 1.24e− 01 pixels 19.75385771± 1.39e− 05 43.82135330± 1.35e− 04 hours/degreesOffset 0.0624± 1.32e− 01 −0.0190± 1.24e− 01 pixels −0.2537± 5.40e− 01 −0.0548± 4.85e− 01 arcsecondsOffset/σ 0.47 −0.15 −0.47 −0.11
Offset Distance 0.0652± 1.34e− 01 pixels 0.2595± 5.39e− 01 arcsecondsOffset Distance/σ 0.49 0.48
Offset from the KIC RA and Dec converted to pixels via motion polynomialsRow Column Units RA Dec Units
KIC Reference Centroid 846.99± 1.04e− 05 937.51± 1.15e− 05 pixels 19.75386260± 0.00e+ 00 43.82135000± 0.00e+ 00 hours/degreesDifference Image Centroid 847.03± 1.32e− 01 937.48± 1.24e− 01 pixels 19.75385771± 1.39e− 05 43.82135330± 1.35e− 04 hours/degreesOffset 0.0404± 1.32e− 01 −0.0259± 1.24e− 01 pixels −0.1906± 5.40e− 01 0.0119± 4.85e− 01 arcsecondsOffset/σ 0.31 −0.21 −0.35 0.02
Offset Distance 0.0480± 1.34e− 01 pixels 0.1910± 5.39e− 01 arcsecondsOffset Distance/σ 0.36 0.35
PRF Fit of the Pixel Correlation Image
The pixel correlation image centroid could not be calculated for target 8042453,planet candidate 1, in target table 53.
59

6 PIXEL LEVEL DIAGNOSTICS Target 8042453 / Planet Candidate 1 / Quarter 13 / Target Table 56
Difference image for target 8042453, planet candidate 1, quarter 13, target table 56. Upper left: difference between mean flux out-of-transit and in-transit; upper right:mean out-of-transit flux; lower left: mean in-transit flux; lower right: difference between mean flux out-of-transit and in-transit after normalizing by the uncertainty inthe difference for each pixel. The optimal aperture is outlined with a white dash-dotted line in each panel and the target mask is outlined with a solid white line. Symbolkey: x: target position from KIC RA and Dec converted to CCD coordinates via motion polynomials; *: position of nearby KIC objects converted to CCD coordinates viamotion polynomials (objects in the UKIRT extension to the KIC have IDs between 15,000,000 and 30,000,000); +: PRF-fit location of target from out-of-transit image;triangle: PRF-fit location of transit source from the difference image. CCD row and column coordinates are 0-based. Number of transits = 7; number of valid in-transitcadences = 37; number of in-transit cadence gaps = 1; number of valid out-of-transit cadences = 90; number of out-of-transit cadence gaps = 0. Difference image qualitymetric = 0.92 (good).Open ./planet-01/difference-image/008042453-01-difference-image-13-056.fig
60

6 PIXEL LEVEL DIAGNOSTICS Target 8042453 / Planet Candidate 1 / Quarter 13 / Target Table 56
The pixel correlation statistic plot is not available because either the fit for target 8042453, planet candidate 1 failed,or there were no observed transits for this candidate in target table 56.
61

6 PIXEL LEVEL DIAGNOSTICS Target 8042453 / Planet Candidate 1 / Quarter 13 / Target Table 56
PRF Fit of the Difference Image
Offset from the PRF fit to the out of transit imageRow Column Units RA Dec Units
Out of Transit Image Centroid 849.47± 1.52e− 05 940.95± 3.69e− 05 pixels 19.75386418± 2.53e− 09 43.82138144± 3.73e− 08 hours/degreesDifference Image Centroid 849.34± 6.97e− 02 940.72± 1.29e− 01 pixels 19.75386488± 9.53e− 06 43.82167761± 1.25e− 04 hours/degreesOffset −0.1362± 6.97e− 02 −0.2309± 1.29e− 01 pixels 0.0273± 3.71e− 01 1.0662± 4.50e− 01 arcsecondsOffset/σ −1.95 −1.80 0.07 2.37
Offset Distance 0.2681± 1.12e− 01 pixels 1.0666± 4.45e− 01 arcsecondsOffset Distance/σ 2.40 2.40
Offset from the KIC RA and Dec converted to pixels via motion polynomialsRow Column Units RA Dec Units
KIC Reference Centroid 849.50± 8.62e− 06 940.97± 8.90e− 06 pixels 19.75386260± 0.00e+ 00 43.82135000± 0.00e+ 00 hours/degreesDifference Image Centroid 849.34± 6.97e− 02 940.72± 1.29e− 01 pixels 19.75386488± 9.53e− 06 43.82167761± 1.25e− 04 hours/degreesOffset −0.1635± 6.97e− 02 −0.2483± 1.29e− 01 pixels 0.0887± 3.71e− 01 1.1794± 4.50e− 01 arcsecondsOffset/σ −2.35 −1.93 0.24 2.62
Offset Distance 0.2973± 1.09e− 01 pixels 1.1827± 4.35e− 01 arcsecondsOffset Distance/σ 2.72 2.72
PRF Fit of the Pixel Correlation Image
The pixel correlation image centroid could not be calculated for target 8042453,planet candidate 1, in target table 56.
62

6 PIXEL LEVEL DIAGNOSTICS Target 8042453 / Planet Candidate 1 / Quarter 14 / Target Table 59
Difference image for target 8042453, planet candidate 1, quarter 14, target table 59. Upper left: difference between mean flux out-of-transit and in-transit; upper right:mean out-of-transit flux; lower left: mean in-transit flux; lower right: difference between mean flux out-of-transit and in-transit after normalizing by the uncertainty inthe difference for each pixel. The optimal aperture is outlined with a white dash-dotted line in each panel and the target mask is outlined with a solid white line. Symbolkey: x: target position from KIC RA and Dec converted to CCD coordinates via motion polynomials; *: position of nearby KIC objects converted to CCD coordinatesvia motion polynomials (objects in the UKIRT extension to the KIC have IDs between 15,000,000 and 30,000,000); +: PRF-fit location of target from out-of-transitimage; triangle: PRF-fit location of transit source from the difference image. CCD row and column coordinates are 0-based. Number of transits = 8; number of validin-transit cadences = 41; number of in-transit cadence gaps = 1; number of valid out-of-transit cadences = 106; number of out-of-transit cadence gaps = 0. Differenceimage quality metric = 0.79 (good).Open ./planet-01/difference-image/008042453-01-difference-image-14-059.fig
63

6 PIXEL LEVEL DIAGNOSTICS Target 8042453 / Planet Candidate 1 / Quarter 14 / Target Table 59
The pixel correlation statistic plot is not available because either the fit for target 8042453, planet candidate 1 failed,or there were no observed transits for this candidate in target table 59.
64

6 PIXEL LEVEL DIAGNOSTICS Target 8042453 / Planet Candidate 1 / Quarter 14 / Target Table 59
PRF Fit of the Difference Image
Offset from the PRF fit to the out of transit imageRow Column Units RA Dec Units
Out of Transit Image Centroid 843.76± 1.84e− 05 941.56± 1.65e− 05 pixels 19.75386572± 2.10e− 09 43.82135950± 2.15e− 08 hours/degreesDifference Image Centroid 843.90± 1.51e− 01 941.44± 1.31e− 01 pixels 19.75384721± 1.48e− 05 43.82140640± 1.54e− 04 hours/degreesOffset 0.1378± 1.51e− 01 −0.1252± 1.31e− 01 pixels −0.7211± 5.78e− 01 0.1688± 5.54e− 01 arcsecondsOffset/σ 0.91 −0.95 −1.25 0.30
Offset Distance 0.1862± 1.39e− 01 pixels 0.7406± 5.58e− 01 arcsecondsOffset Distance/σ 1.34 1.33
Offset from the KIC RA and Dec converted to pixels via motion polynomialsRow Column Units RA Dec Units
KIC Reference Centroid 843.79± 9.29e− 06 941.56± 9.90e− 06 pixels 19.75386260± 0.00e+ 00 43.82135000± 0.00e+ 00 hours/degreesDifference Image Centroid 843.90± 1.51e− 01 941.44± 1.31e− 01 pixels 19.75384721± 1.48e− 05 43.82140640± 1.54e− 04 hours/degreesOffset 0.1069± 1.51e− 01 −0.1178± 1.31e− 01 pixels −0.5996± 5.78e− 01 0.2030± 5.54e− 01 arcsecondsOffset/σ 0.71 −0.90 −1.04 0.37
Offset Distance 0.1591± 1.37e− 01 pixels 0.6331± 5.50e− 01 arcsecondsOffset Distance/σ 1.16 1.15
PRF Fit of the Pixel Correlation Image
The pixel correlation image centroid could not be calculated for target 8042453,planet candidate 1, in target table 59.
65

6 PIXEL LEVEL DIAGNOSTICS Target 8042453 / Planet Candidate 1 / Quarter 15 / Target Table 62
Difference image for target 8042453, planet candidate 1, quarter 15, target table 62. Upper left: difference between mean flux out-of-transit and in-transit; upper right:mean out-of-transit flux; lower left: mean in-transit flux; lower right: difference between mean flux out-of-transit and in-transit after normalizing by the uncertainty inthe difference for each pixel. The optimal aperture is outlined with a white dash-dotted line in each panel and the target mask is outlined with a solid white line. Symbolkey: x: target position from KIC RA and Dec converted to CCD coordinates via motion polynomials; *: position of nearby KIC objects converted to CCD coordinatesvia motion polynomials (objects in the UKIRT extension to the KIC have IDs between 15,000,000 and 30,000,000); +: PRF-fit location of target from out-of-transitimage; triangle: PRF-fit location of transit source from the difference image. CCD row and column coordinates are 0-based. Number of transits = 8; number of validin-transit cadences = 44; number of in-transit cadence gaps = 0; number of valid out-of-transit cadences = 103; number of out-of-transit cadence gaps = 1. Differenceimage quality metric = 0.91 (good).Open ./planet-01/difference-image/008042453-01-difference-image-15-062.fig
66

6 PIXEL LEVEL DIAGNOSTICS Target 8042453 / Planet Candidate 1 / Quarter 15 / Target Table 62
The pixel correlation statistic plot is not available because either the fit for target 8042453, planet candidate 1 failed,or there were no observed transits for this candidate in target table 62.
67
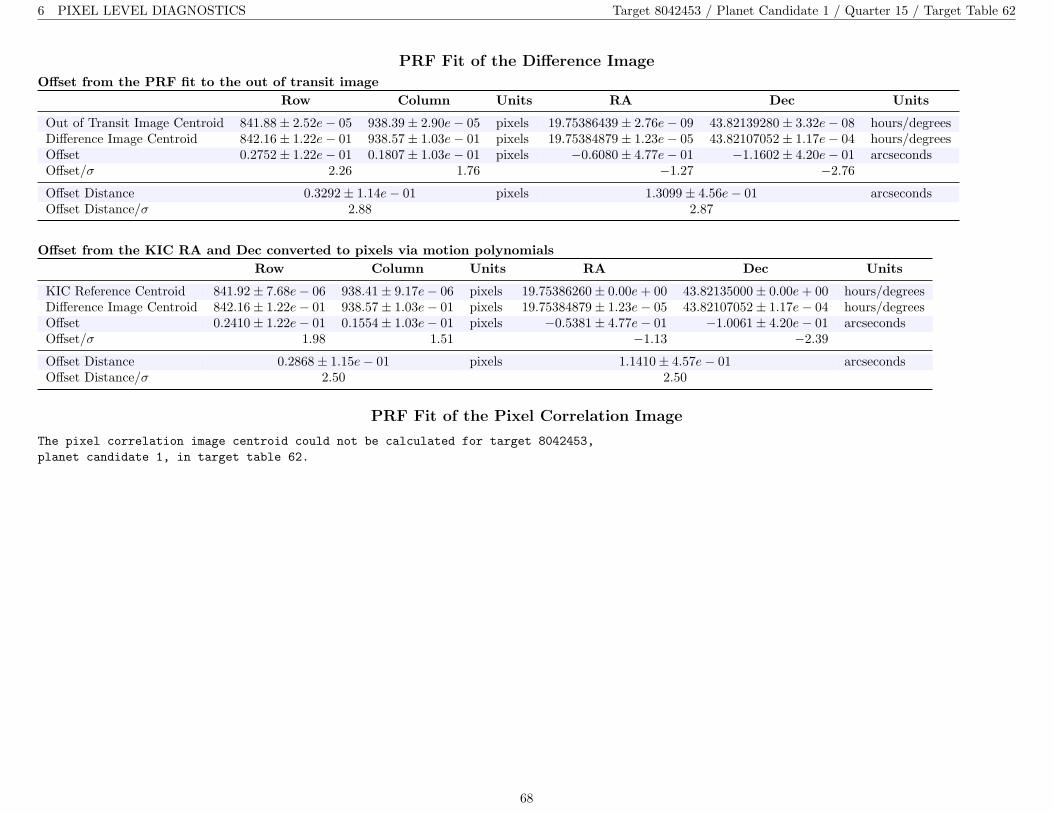
6 PIXEL LEVEL DIAGNOSTICS Target 8042453 / Planet Candidate 1 / Quarter 15 / Target Table 62
PRF Fit of the Difference Image
Offset from the PRF fit to the out of transit imageRow Column Units RA Dec Units
Out of Transit Image Centroid 841.88± 2.52e− 05 938.39± 2.90e− 05 pixels 19.75386439± 2.76e− 09 43.82139280± 3.32e− 08 hours/degreesDifference Image Centroid 842.16± 1.22e− 01 938.57± 1.03e− 01 pixels 19.75384879± 1.23e− 05 43.82107052± 1.17e− 04 hours/degreesOffset 0.2752± 1.22e− 01 0.1807± 1.03e− 01 pixels −0.6080± 4.77e− 01 −1.1602± 4.20e− 01 arcsecondsOffset/σ 2.26 1.76 −1.27 −2.76
Offset Distance 0.3292± 1.14e− 01 pixels 1.3099± 4.56e− 01 arcsecondsOffset Distance/σ 2.88 2.87
Offset from the KIC RA and Dec converted to pixels via motion polynomialsRow Column Units RA Dec Units
KIC Reference Centroid 841.92± 7.68e− 06 938.41± 9.17e− 06 pixels 19.75386260± 0.00e+ 00 43.82135000± 0.00e+ 00 hours/degreesDifference Image Centroid 842.16± 1.22e− 01 938.57± 1.03e− 01 pixels 19.75384879± 1.23e− 05 43.82107052± 1.17e− 04 hours/degreesOffset 0.2410± 1.22e− 01 0.1554± 1.03e− 01 pixels −0.5381± 4.77e− 01 −1.0061± 4.20e− 01 arcsecondsOffset/σ 1.98 1.51 −1.13 −2.39
Offset Distance 0.2868± 1.15e− 01 pixels 1.1410± 4.57e− 01 arcsecondsOffset Distance/σ 2.50 2.50
PRF Fit of the Pixel Correlation Image
The pixel correlation image centroid could not be calculated for target 8042453,planet candidate 1, in target table 62.
68

6 PIXEL LEVEL DIAGNOSTICS Target 8042453 / Planet Candidate 1 / Quarter 16 / Target Table 65
Difference image for target 8042453, planet candidate 1, quarter 16, target table 65. Upper left: difference between mean flux out-of-transit and in-transit; upper right:mean out-of-transit flux; lower left: mean in-transit flux; lower right: difference between mean flux out-of-transit and in-transit after normalizing by the uncertainty inthe difference for each pixel. The optimal aperture is outlined with a white dash-dotted line in each panel and the target mask is outlined with a solid white line. Symbolkey: x: target position from KIC RA and Dec converted to CCD coordinates via motion polynomials; *: position of nearby KIC objects converted to CCD coordinates viamotion polynomials (objects in the UKIRT extension to the KIC have IDs between 15,000,000 and 30,000,000); +: PRF-fit location of target from out-of-transit image;triangle: PRF-fit location of transit source from the difference image. CCD row and column coordinates are 0-based. Number of transits = 6; number of valid in-transitcadences = 32; number of in-transit cadence gaps = 0; number of valid out-of-transit cadences = 74; number of out-of-transit cadence gaps = 4. Difference image qualitymetric = N/A.Open ./planet-01/difference-image/008042453-01-difference-image-16-065.fig
69

6 PIXEL LEVEL DIAGNOSTICS Target 8042453 / Planet Candidate 1 / Quarter 16 / Target Table 65
The pixel correlation statistic plot is not available because either the fit for target 8042453, planet candidate 1 failed,or there were no observed transits for this candidate in target table 65.
70

6 PIXEL LEVEL DIAGNOSTICS Target 8042453 / Planet Candidate 1 / Quarter 16 / Target Table 65
PRF Fit of the Difference Image
The out of transit image centroid and difference image centroid could not be calculated for target 8042453,planet candidate 1, in target table 65.
PRF Fit of the Pixel Correlation Image
The pixel correlation image centroid could not be calculated for target 8042453,planet candidate 1, in target table 65.
71
6 PIXEL LEVEL DIAGNOSTICS Target 8042453 / Planet Candidate 1 / Quarter 17 / Target Table 68
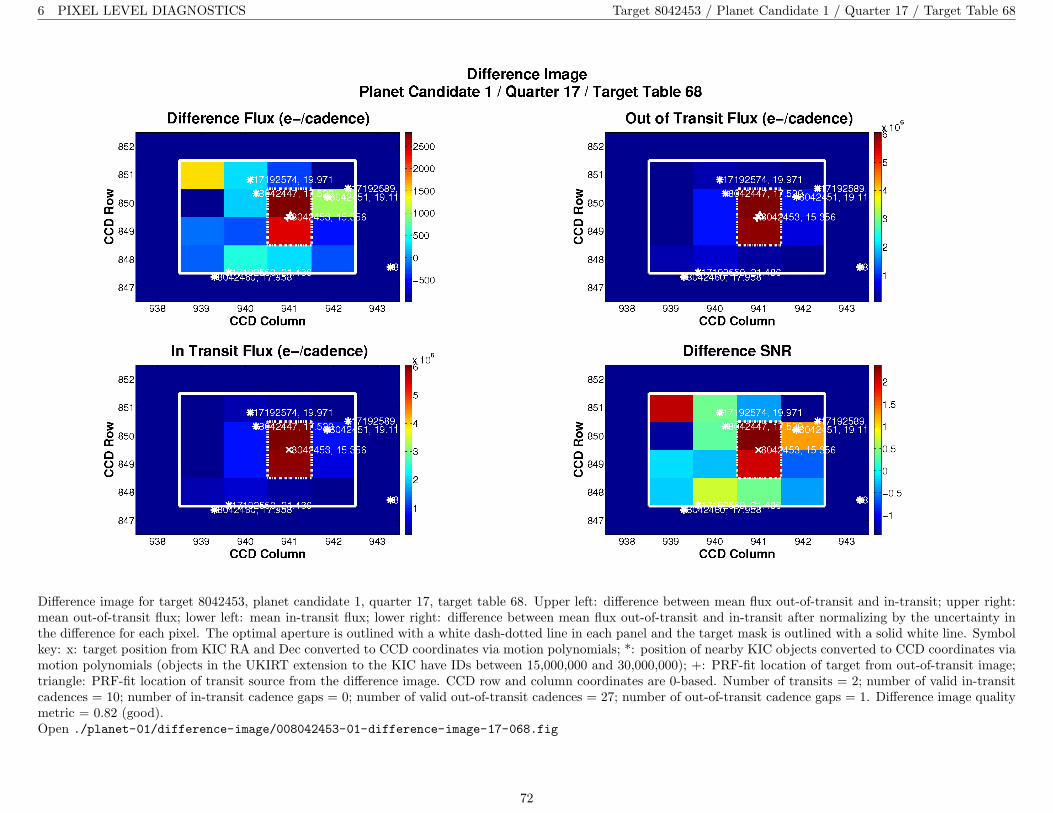
Difference image for target 8042453, planet candidate 1, quarter 17, target table 68. Upper left: difference between mean flux out-of-transit and in-transit; upper right:mean out-of-transit flux; lower left: mean in-transit flux; lower right: difference between mean flux out-of-transit and in-transit after normalizing by the uncertainty inthe difference for each pixel. The optimal aperture is outlined with a white dash-dotted line in each panel and the target mask is outlined with a solid white line. Symbolkey: x: target position from KIC RA and Dec converted to CCD coordinates via motion polynomials; *: position of nearby KIC objects converted to CCD coordinates viamotion polynomials (objects in the UKIRT extension to the KIC have IDs between 15,000,000 and 30,000,000); +: PRF-fit location of target from out-of-transit image;triangle: PRF-fit location of transit source from the difference image. CCD row and column coordinates are 0-based. Number of transits = 2; number of valid in-transitcadences = 10; number of in-transit cadence gaps = 0; number of valid out-of-transit cadences = 27; number of out-of-transit cadence gaps = 1. Difference image qualitymetric = 0.82 (good).Open ./planet-01/difference-image/008042453-01-difference-image-17-068.fig
72

6 PIXEL LEVEL DIAGNOSTICS Target 8042453 / Planet Candidate 1 / Quarter 17 / Target Table 68
The pixel correlation statistic plot is not available because either the fit for target 8042453, planet candidate 1 failed,or there were no observed transits for this candidate in target table 68.
73

6 PIXEL LEVEL DIAGNOSTICS Target 8042453 / Planet Candidate 1 / Quarter 17 / Target Table 68
PRF Fit of the Difference Image
Offset from the PRF fit to the out of transit imageRow Column Units RA Dec Units
Out of Transit Image Centroid 849.47± 2.82e− 05 940.96± 6.73e− 05 pixels 19.75386402± 4.41e− 09 43.82139267± 6.65e− 08 hours/degreesDifference Image Centroid 849.53± 1.42e− 01 941.02± 2.26e− 01 pixels 19.75386167± 1.74e− 05 43.82129761± 2.28e− 04 hours/degreesOffset 0.0619± 1.42e− 01 0.0640± 2.26e− 01 pixels −0.0915± 6.79e− 01 −0.3422± 8.19e− 01 arcsecondsOffset/σ 0.44 0.28 −0.13 −0.42
Offset Distance 0.0890± 1.86e− 01 pixels 0.3542± 7.40e− 01 arcsecondsOffset Distance/σ 0.48 0.48
Offset from the KIC RA and Dec converted to pixels via motion polynomialsRow Column Units RA Dec Units
KIC Reference Centroid 849.50± 8.29e− 06 940.99± 8.21e− 06 pixels 19.75386260± 0.00e+ 00 43.82135000± 0.00e+ 00 hours/degreesDifference Image Centroid 849.53± 1.42e− 01 941.02± 2.26e− 01 pixels 19.75386167± 1.74e− 05 43.82129761± 2.28e− 04 hours/degreesOffset 0.0310± 1.42e− 01 0.0370± 2.26e− 01 pixels −0.0362± 6.79e− 01 −0.1886± 8.19e− 01 arcsecondsOffset/σ 0.22 0.16 −0.05 −0.23
Offset Distance 0.0483± 1.92e− 01 pixels 0.1920± 7.63e− 01 arcsecondsOffset Distance/σ 0.25 0.25
PRF Fit of the Pixel Correlation Image
The pixel correlation image centroid could not be calculated for target 8042453,planet candidate 1, in target table 68.
74
7 PHASED LIGHT CURVES Target 8042453
7 Phased Light Curves
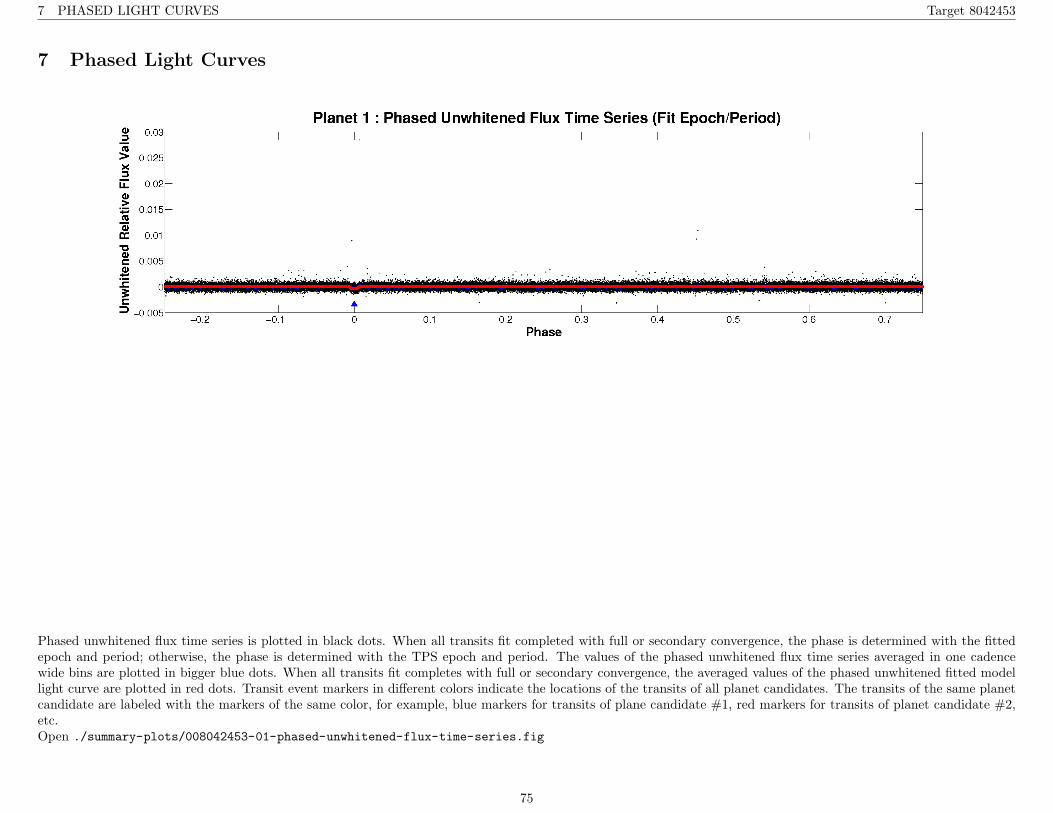
Phased unwhitened flux time series is plotted in black dots. When all transits fit completed with full or secondary convergence, the phase is determined with the fittedepoch and period; otherwise, the phase is determined with the TPS epoch and period. The values of the phased unwhitened flux time series averaged in one cadencewide bins are plotted in bigger blue dots. When all transits fit completes with full or secondary convergence, the averaged values of the phased unwhitened fitted modellight curve are plotted in red dots. Transit event markers in different colors indicate the locations of the transits of all planet candidates. The transits of the same planetcandidate are labeled with the markers of the same color, for example, blue markers for transits of plane candidate #1, red markers for transits of planet candidate #2,etc.Open ./summary-plots/008042453-01-phased-unwhitened-flux-time-series.fig
75
7 PHASED LIGHT CURVES Target 8042453
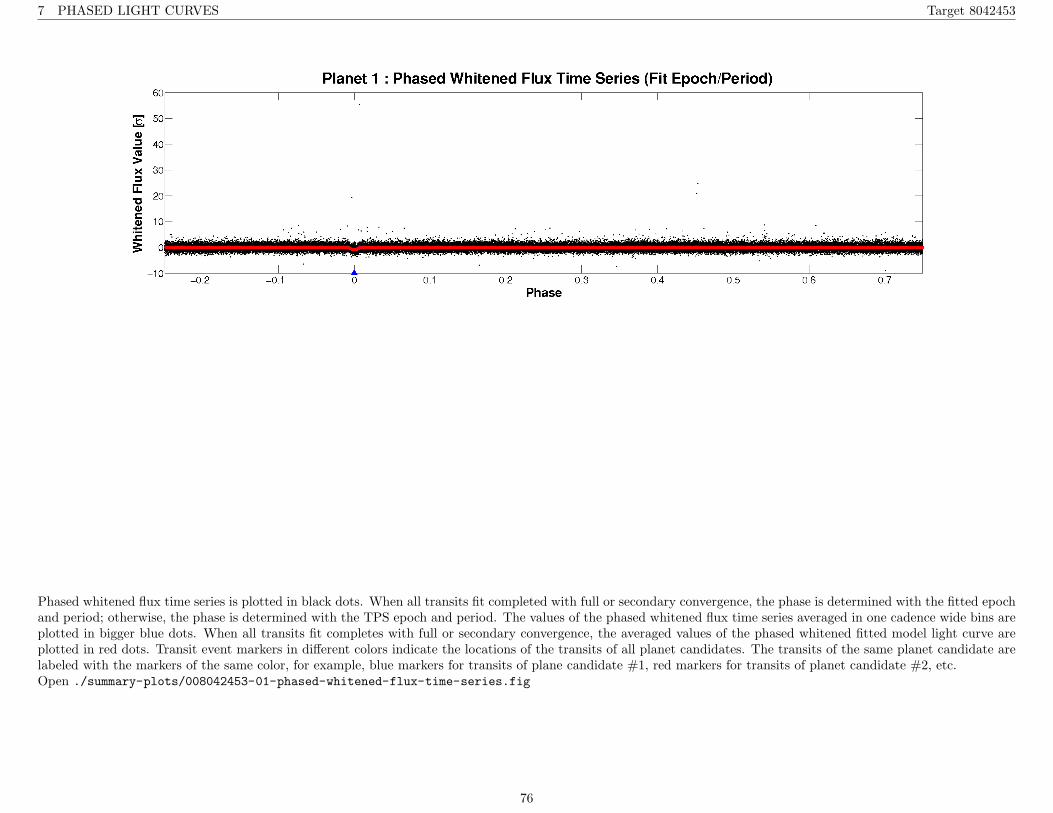
Phased whitened flux time series is plotted in black dots. When all transits fit completed with full or secondary convergence, the phase is determined with the fitted epochand period; otherwise, the phase is determined with the TPS epoch and period. The values of the phased whitened flux time series averaged in one cadence wide bins areplotted in bigger blue dots. When all transits fit completes with full or secondary convergence, the averaged values of the phased whitened fitted model light curve areplotted in red dots. Transit event markers in different colors indicate the locations of the transits of all planet candidates. The transits of the same planet candidate arelabeled with the markers of the same color, for example, blue markers for transits of plane candidate #1, red markers for transits of planet candidate #2, etc.Open ./summary-plots/008042453-01-phased-whitened-flux-time-series.fig
76
8 PLANET CANDIDATE 1 Target 8042453 / Planet Candidate 1
8 Planet Candidate 1
8.1 Model Fitter: All Transits
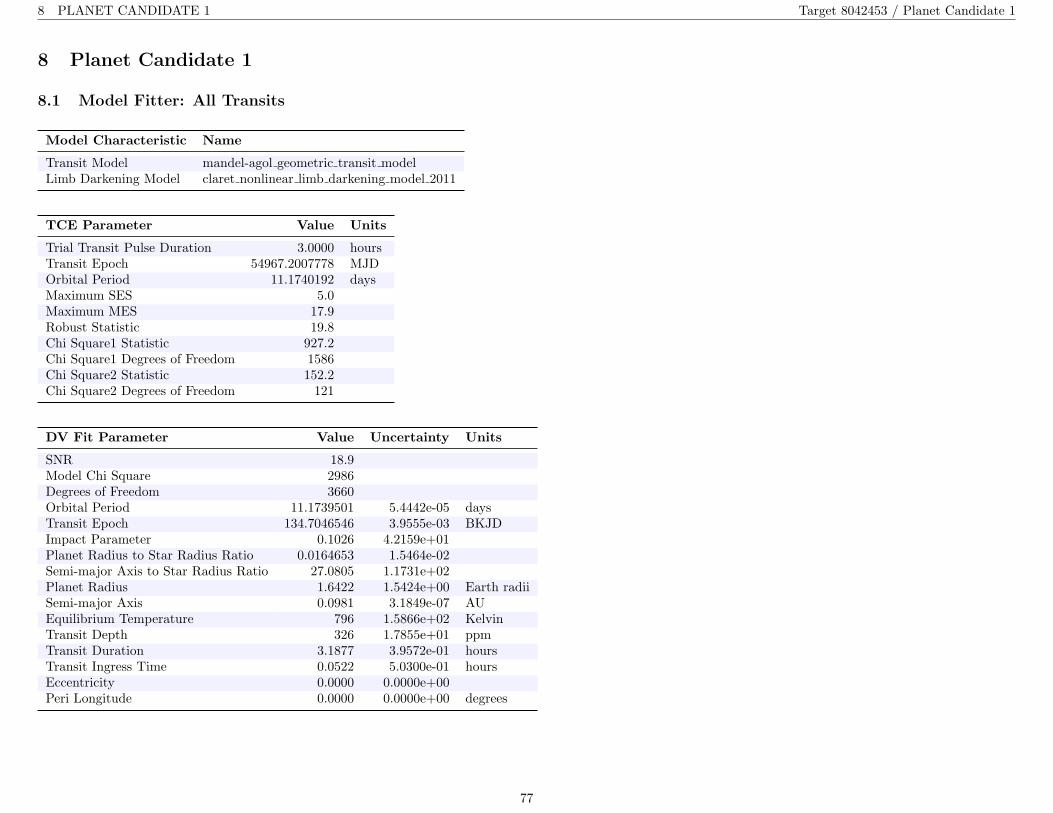
Model Characteristic Name
Transit Model mandel-agol geometric transit modelLimb Darkening Model claret nonlinear limb darkening model 2011
TCE Parameter Value Units
Trial Transit Pulse Duration 3.0000 hoursTransit Epoch 54967.2007778 MJDOrbital Period 11.1740192 daysMaximum SES 5.0Maximum MES 17.9Robust Statistic 19.8Chi Square1 Statistic 927.2Chi Square1 Degrees of Freedom 1586Chi Square2 Statistic 152.2Chi Square2 Degrees of Freedom 121
DV Fit Parameter Value Uncertainty Units
SNR 18.9Model Chi Square 2986Degrees of Freedom 3660Orbital Period 11.1739501 5.4442e-05 daysTransit Epoch 134.7046546 3.9555e-03 BKJDImpact Parameter 0.1026 4.2159e+01Planet Radius to Star Radius Ratio 0.0164653 1.5464e-02Semi-major Axis to Star Radius Ratio 27.0805 1.1731e+02Planet Radius 1.6422 1.5424e+00 Earth radiiSemi-major Axis 0.0981 3.1849e-07 AUEquilibrium Temperature 796 1.5866e+02 KelvinTransit Depth 326 1.7855e+01 ppmTransit Duration 3.1877 3.9572e-01 hoursTransit Ingress Time 0.0522 5.0300e-01 hoursEccentricity 0.0000 0.0000e+00Peri Longitude 0.0000 0.0000e+00 degrees
77

8 PLANET CANDIDATE 1 Target 8042453 / Planet Candidate 1
PDC Flux time series for KeplerId 8042453, Planet candidate 1 in the unwhitened domain. For the data of Quarter-01/TargetTableId-020, start BJD is 2454964 and thevertical offset is 0. For the data of Quarter-02/TargetTableId-021, start BJD is 2455002 and the vertical offset is 0.1. For the data of Quarter-03/TargetTableId-026, startBJD is 2455093 and the vertical offset is 0.2. For the data of Quarter-04/TargetTableId-029, start BJD is 2455184 and the vertical offset is 0.3. Transit event markersindicate the location of transits of the given planet candidate. All transits fit completed with full convergence.Open ./planet-01/planet-search-and-model-fitting-results/all-transits-fit/008042453-01-all-unwhitened-01-020.fig
78

8 PLANET CANDIDATE 1 Target 8042453 / Planet Candidate 1
PDC Flux time series for KeplerId 8042453, Planet candidate 1 in the unwhitened domain. For the data of Quarter-05/TargetTableId-032, start BJD is 2455276 and thevertical offset is 0. For the data of Quarter-06/TargetTableId-035, start BJD is 2455372 and the vertical offset is 0.1. For the data of Quarter-07/TargetTableId-038, startBJD is 2455463 and the vertical offset is 0.2. For the data of Quarter-08/TargetTableId-041, start BJD is 2455568 and the vertical offset is 0.3. Transit event markersindicate the location of transits of the given planet candidate. All transits fit completed with full convergence.Open ./planet-01/planet-search-and-model-fitting-results/all-transits-fit/008042453-01-all-unwhitened-05-032.fig
79
8 PLANET CANDIDATE 1 Target 8042453 / Planet Candidate 1
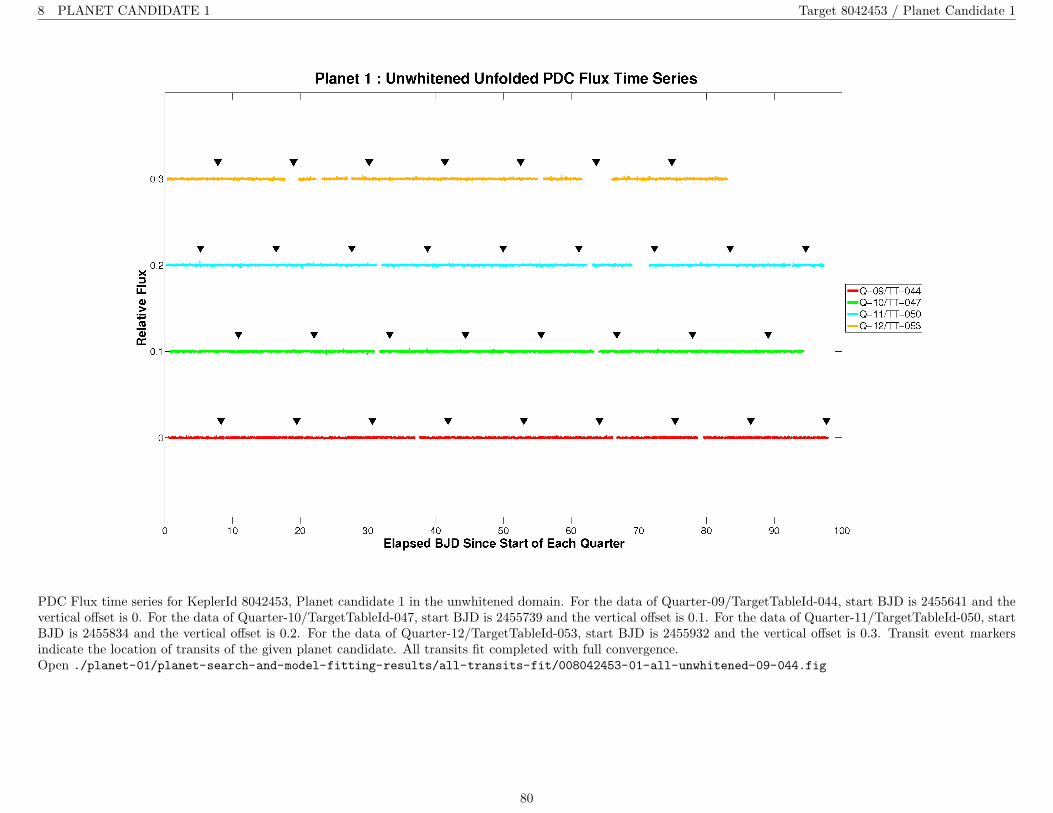
PDC Flux time series for KeplerId 8042453, Planet candidate 1 in the unwhitened domain. For the data of Quarter-09/TargetTableId-044, start BJD is 2455641 and thevertical offset is 0. For the data of Quarter-10/TargetTableId-047, start BJD is 2455739 and the vertical offset is 0.1. For the data of Quarter-11/TargetTableId-050, startBJD is 2455834 and the vertical offset is 0.2. For the data of Quarter-12/TargetTableId-053, start BJD is 2455932 and the vertical offset is 0.3. Transit event markersindicate the location of transits of the given planet candidate. All transits fit completed with full convergence.Open ./planet-01/planet-search-and-model-fitting-results/all-transits-fit/008042453-01-all-unwhitened-09-044.fig
80
8 PLANET CANDIDATE 1 Target 8042453 / Planet Candidate 1
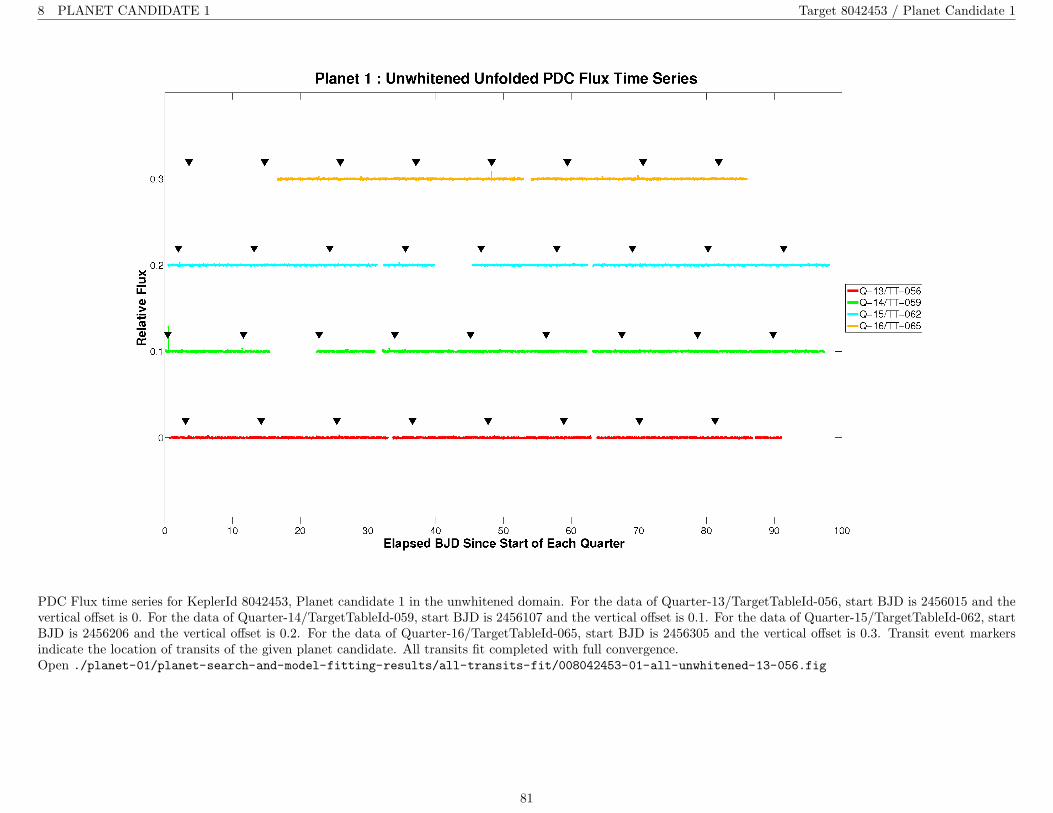
PDC Flux time series for KeplerId 8042453, Planet candidate 1 in the unwhitened domain. For the data of Quarter-13/TargetTableId-056, start BJD is 2456015 and thevertical offset is 0. For the data of Quarter-14/TargetTableId-059, start BJD is 2456107 and the vertical offset is 0.1. For the data of Quarter-15/TargetTableId-062, startBJD is 2456206 and the vertical offset is 0.2. For the data of Quarter-16/TargetTableId-065, start BJD is 2456305 and the vertical offset is 0.3. Transit event markersindicate the location of transits of the given planet candidate. All transits fit completed with full convergence.Open ./planet-01/planet-search-and-model-fitting-results/all-transits-fit/008042453-01-all-unwhitened-13-056.fig
81

8 PLANET CANDIDATE 1 Target 8042453 / Planet Candidate 1
PDC Flux time series for KeplerId 8042453, Planet candidate 1 in the unwhitened domain. For the data of Quarter-17/TargetTableId-068, start BJD is 2456392. Transitevent markers indicate the location of transits of the given planet candidate. All transits fit completed with full convergence.Open ./planet-01/planet-search-and-model-fitting-results/all-transits-fit/008042453-01-all-unwhitened-17-068.fig
82

8 PLANET CANDIDATE 1 Target 8042453 / Planet Candidate 1
PDC Flux time series for KeplerId 8042453, Planet candidate 1 in the unwhitened domain, zoomed on last 5 transits in the unit of work. If # of transits is smaller than5, all transits are shown.Open ./planet-01/planet-search-and-model-fitting-results/all-transits-fit/008042453-01-all-unwhitened-zoomed.fig
PDC Flux time series of all transits for KeplerId 8042453, Planet candidate 1 in the unwhitened domain. Data has been high-pass filtered via a median filter operatingat a specified multiple of the transit duration, folded per the fitted period and epoch, and zoomed to the location of the model transit.Open ./planet-01/planet-search-and-model-fitting-results/all-transits-fit/008042453-01-all-unwhitened-filtered-zoomed.fig
83
8 PLANET CANDIDATE 1 Target 8042453 / Planet Candidate 1
Folded flux time series for KeplerId 8042453, Planet candidate 1 in the whitened domain is plotted in black dots. Values are averaged into 1 cadence wide bins. The bluedots represent the averaged values of the folded flux time series; the red dots represent the averaged values of the folded model light curve of the all transits fit; the greendots are the averaged folded fit residuals, vertically offset for clarity. All transits fit completed with full convergence.Open ./planet-01/planet-search-and-model-fitting-results/all-transits-fit/008042453-01-all-whitened.fig
Folded flux time series for KeplerId 8042453, Planet candidate 1 in the whitened domain, zoomed on the transit. The flux data whose robust weights are larger/smallerthan 0.1 are plotted in dark green/cyan dots, respectively. Values are averaged into 1 cadence wide bins. The blue dots represent the averaged values of the folded fluxtime series; the red dots represent the averaged values of the fitted model light curve of the all transits fit; the green dots are the averaged folded fit residuals, verticallyoffset for clarity. Magenta dots are the averaged values of the folded flux time series, with a phase shift of 0.5 relative to the blue dots, vertically offset for clarity. Alltransits fit completed with full convergence.Open ./planet-01/planet-search-and-model-fitting-results/all-transits-fit/008042453-01-all-whitened-zoomed.fig
84
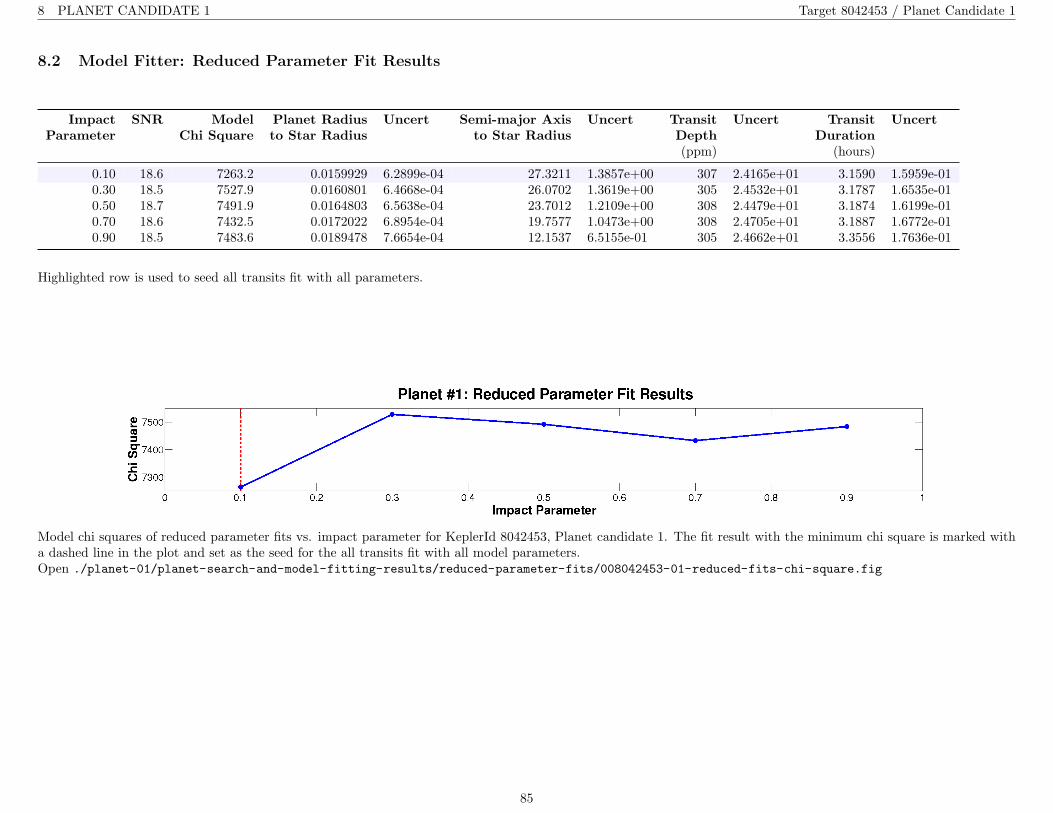
8 PLANET CANDIDATE 1 Target 8042453 / Planet Candidate 1
8.2 Model Fitter: Reduced Parameter Fit Results
Impact SNR Model Planet Radius Uncert Semi-major Axis Uncert Transit Uncert Transit UncertParameter Chi Square to Star Radius to Star Radius Depth Duration
(ppm) (hours)
0.10 18.6 7263.2 0.0159929 6.2899e-04 27.3211 1.3857e+00 307 2.4165e+01 3.1590 1.5959e-010.30 18.5 7527.9 0.0160801 6.4668e-04 26.0702 1.3619e+00 305 2.4532e+01 3.1787 1.6535e-010.50 18.7 7491.9 0.0164803 6.5638e-04 23.7012 1.2109e+00 308 2.4479e+01 3.1874 1.6199e-010.70 18.6 7432.5 0.0172022 6.8954e-04 19.7577 1.0473e+00 308 2.4705e+01 3.1887 1.6772e-010.90 18.5 7483.6 0.0189478 7.6654e-04 12.1537 6.5155e-01 305 2.4662e+01 3.3556 1.7636e-01
Highlighted row is used to seed all transits fit with all parameters.
Model chi squares of reduced parameter fits vs. impact parameter for KeplerId 8042453, Planet candidate 1. The fit result with the minimum chi square is marked witha dashed line in the plot and set as the seed for the all transits fit with all model parameters.Open ./planet-01/planet-search-and-model-fitting-results/reduced-parameter-fits/008042453-01-reduced-fits-chi-square.fig
85

8 PLANET CANDIDATE 1 Target 8042453 / Planet Candidate 1
Ratios of planet radius to star radius of reduced parameter fits vs. impact parameter for KeplerId 8042453, Planet candidate 1. The fit result with the minimum chisquare is marked with a dashed line in the plot and set as the seed for the all transits fit with all model parameters.Open ./planet-01/planet-search-and-model-fitting-results/reduced-parameter-fits/008042453-01-reduced-fits-rp-over-rstar.fig
Ratios of semimajor axis to star radius of reduced parameter fits vs. impact parameter for KeplerId 8042453, Planet candidate 1. The fit result with the minimum chisquare is marked with a dashed line in the plot and set as the seed for the all transits fit with all model parameters.Open ./planet-01/planet-search-and-model-fitting-results/reduced-parameter-fits/008042453-01-reduced-fits-a-over-rstar.fig
86

8 PLANET CANDIDATE 1 Target 8042453 / Planet Candidate 1
8.3 Validation Tests
The Centroid Test and Eclipsing Binary Discrimination Test are chi-squared hypothesis tests. For these tests, a significance of 100% favors a planet, while 0% indicatesan unlikely planet.
8.3.1 Weak Secondary Test
Period (days) Duration (hours) Max MES Sec Phase (days) Sec MES Min Phase (days) Min MES MAD
11.174 3 17.9069 7.4438 2.7485 -0.71875 -3.594 0.71218
8.3.2 Flux-Weighted Centroid Test
Result Value Uncertainty Units Value in Sigmas Significance (%)
Stellar Magnitude 15.3560Motion Detection Statistic 4.1143e+00 12.78Peak RA Offset -2.3100e-04 2.0805e-04 arcseconds -1.1103Peak Dec Offset -1.7724e-05 2.0826e-04 arcseconds -0.0851Peak Offset Distance 2.3168e-04 2.0805e-04 arcseconds 1.1136Source RA Offset 7.3385e-01 6.3659e-01 arcseconds 1.1528Source Dec Offset 3.7787e-01 6.3566e-01 arcseconds 0.5945Source Offset Distance 8.2542e-01 6.3639e-01 arcseconds 1.2970Source RA 19.75388144 1.6339e-05 hoursSource Dec 43.82145496 1.7657e-04 degrees
Peak offsets are relative to the out-of-transit centroid. Source offsets are relative to the KIC target location.
8.3.3 Eclipsing Binary Discrimination Test
Result Value Value in Sigmas Significance (%)
Odd Even Transit Depth Comparison Statistic 1.4052e-02 0.1185 90.56Odd Even Transit Epoch Comparison Statistic 8.8783e-03 0.0942 92.49
8.3.4 Bootstrap Test
Result Value
False Alarm 2.4607e-45Final Skip Count -1
87

8 PLANET CANDIDATE 1 Target 8042453 / Planet Candidate 1
The primary event has been set to zero and both the max and min of the resulting MES vs. Phase are marked with a red star. The best matched pulse duration in hoursis 3. The maximum secondary MES and corresponding phase are 2.7485 and 7.4438 days respectively. The minimum secondary MES and corresponding phase are -3.594and -0.71875 days respectively.Open ./planet-01/report-summary/008042453-01-weak-secondary-diagnostic.fig
88

8 PLANET CANDIDATE 1 Target 8042453 / Planet Candidate 1
KeplerId 8042453, KeplerMag 15.36 - FOLDED FLUX AND CENTROIDS - This figure shows detrended flux and centroid data folded at the fitted orbital period andcentered on the fitted transit over a few fitted transit durations. The top panel shows the change in corrected flux for this target, normalized to the median out of transitvalue, median detrended with the median out of transit value removed. The bottom two panels show the corresponding change in the centroid in right ascension (RA)and declination (DEC) angles on the sky. The centroids are detrended against ancillary data and have the mean out-of-transit value removed. The scaled transit modelfit to the target flux is shown on the centroid plots in red. The peak fitted offset from the out-of-transit centroid is indicated by the solid black horizontal line. One sigmaerror bars are indicated with dashed black horizontal lines. In-transit data points for any other planets identified for this target have been gapped. The out-of-transitmean and standard deviation (SD) indicated in the lower left-hand corner are robust estimates.Open ./planet-01/centroid-test-results/008042453-01-folded-transit-fit-fluxWeighted-centroids.fig
89
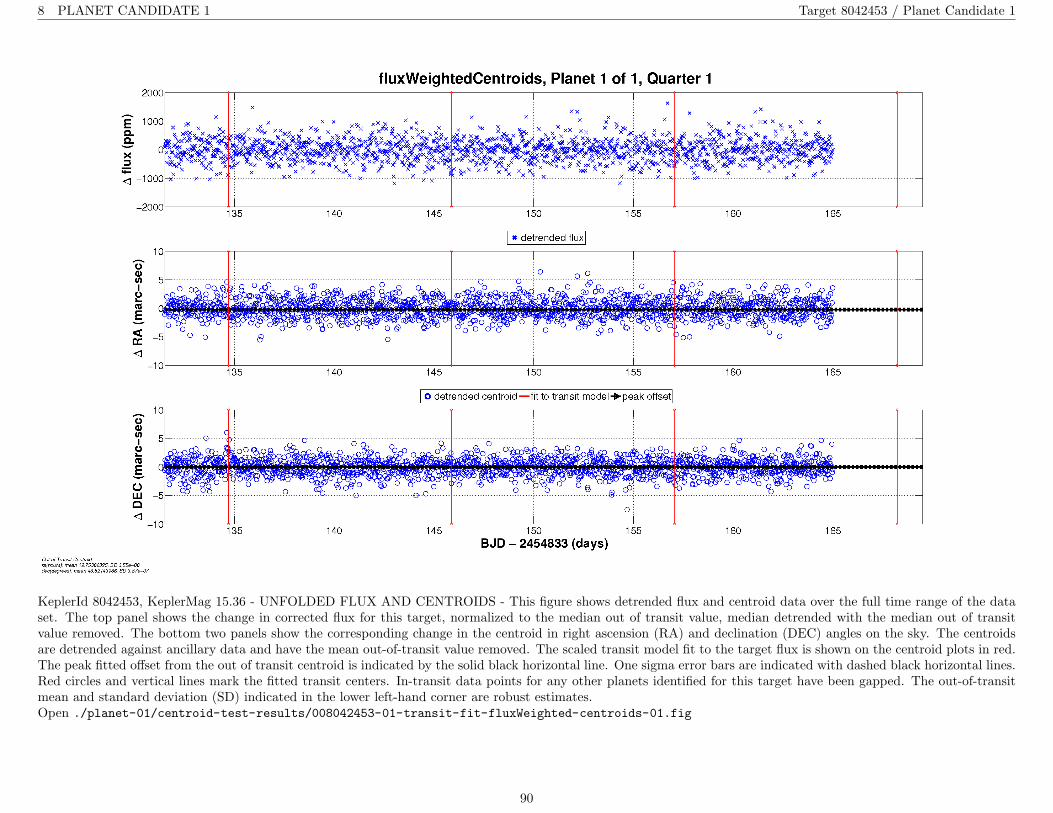
8 PLANET CANDIDATE 1 Target 8042453 / Planet Candidate 1
KeplerId 8042453, KeplerMag 15.36 - UNFOLDED FLUX AND CENTROIDS - This figure shows detrended flux and centroid data over the full time range of the dataset. The top panel shows the change in corrected flux for this target, normalized to the median out of transit value, median detrended with the median out of transitvalue removed. The bottom two panels show the corresponding change in the centroid in right ascension (RA) and declination (DEC) angles on the sky. The centroidsare detrended against ancillary data and have the mean out-of-transit value removed. The scaled transit model fit to the target flux is shown on the centroid plots in red.The peak fitted offset from the out of transit centroid is indicated by the solid black horizontal line. One sigma error bars are indicated with dashed black horizontal lines.Red circles and vertical lines mark the fitted transit centers. In-transit data points for any other planets identified for this target have been gapped. The out-of-transitmean and standard deviation (SD) indicated in the lower left-hand corner are robust estimates.Open ./planet-01/centroid-test-results/008042453-01-transit-fit-fluxWeighted-centroids-01.fig
90
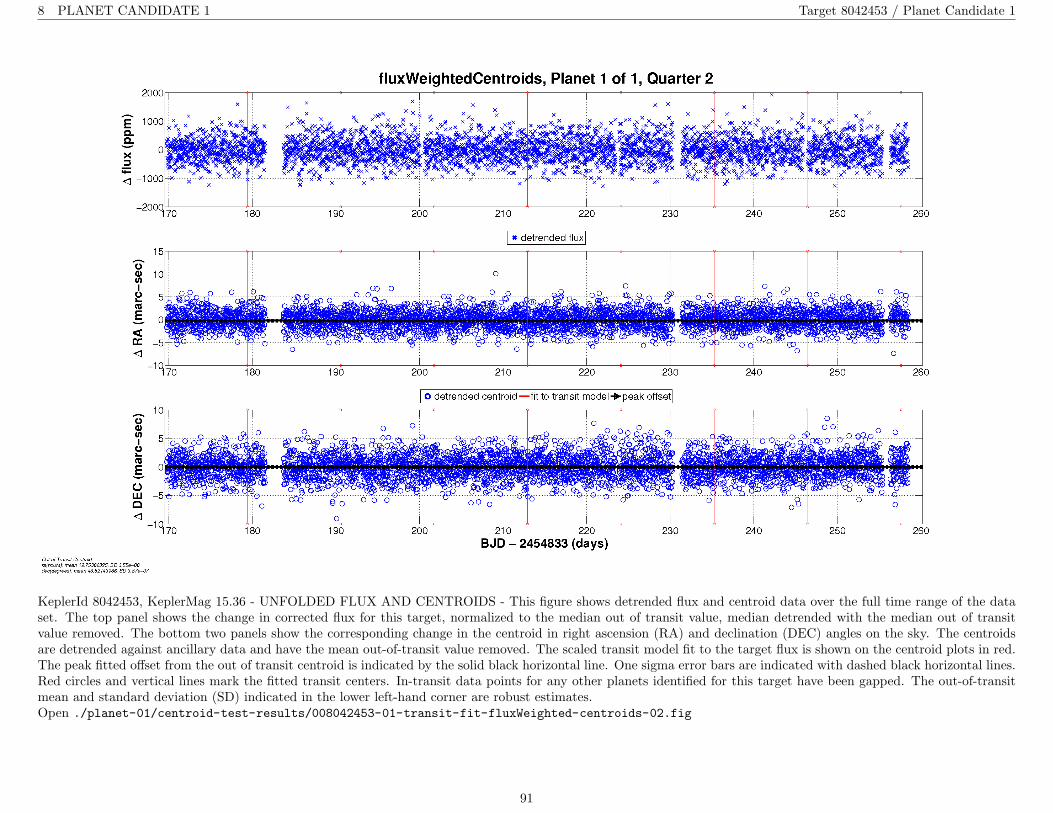
8 PLANET CANDIDATE 1 Target 8042453 / Planet Candidate 1
KeplerId 8042453, KeplerMag 15.36 - UNFOLDED FLUX AND CENTROIDS - This figure shows detrended flux and centroid data over the full time range of the dataset. The top panel shows the change in corrected flux for this target, normalized to the median out of transit value, median detrended with the median out of transitvalue removed. The bottom two panels show the corresponding change in the centroid in right ascension (RA) and declination (DEC) angles on the sky. The centroidsare detrended against ancillary data and have the mean out-of-transit value removed. The scaled transit model fit to the target flux is shown on the centroid plots in red.The peak fitted offset from the out of transit centroid is indicated by the solid black horizontal line. One sigma error bars are indicated with dashed black horizontal lines.Red circles and vertical lines mark the fitted transit centers. In-transit data points for any other planets identified for this target have been gapped. The out-of-transitmean and standard deviation (SD) indicated in the lower left-hand corner are robust estimates.Open ./planet-01/centroid-test-results/008042453-01-transit-fit-fluxWeighted-centroids-02.fig
91

8 PLANET CANDIDATE 1 Target 8042453 / Planet Candidate 1
KeplerId 8042453, KeplerMag 15.36 - UNFOLDED FLUX AND CENTROIDS - This figure shows detrended flux and centroid data over the full time range of the dataset. The top panel shows the change in corrected flux for this target, normalized to the median out of transit value, median detrended with the median out of transitvalue removed. The bottom two panels show the corresponding change in the centroid in right ascension (RA) and declination (DEC) angles on the sky. The centroidsare detrended against ancillary data and have the mean out-of-transit value removed. The scaled transit model fit to the target flux is shown on the centroid plots in red.The peak fitted offset from the out of transit centroid is indicated by the solid black horizontal line. One sigma error bars are indicated with dashed black horizontal lines.Red circles and vertical lines mark the fitted transit centers. In-transit data points for any other planets identified for this target have been gapped. The out-of-transitmean and standard deviation (SD) indicated in the lower left-hand corner are robust estimates.Open ./planet-01/centroid-test-results/008042453-01-transit-fit-fluxWeighted-centroids-03.fig
92
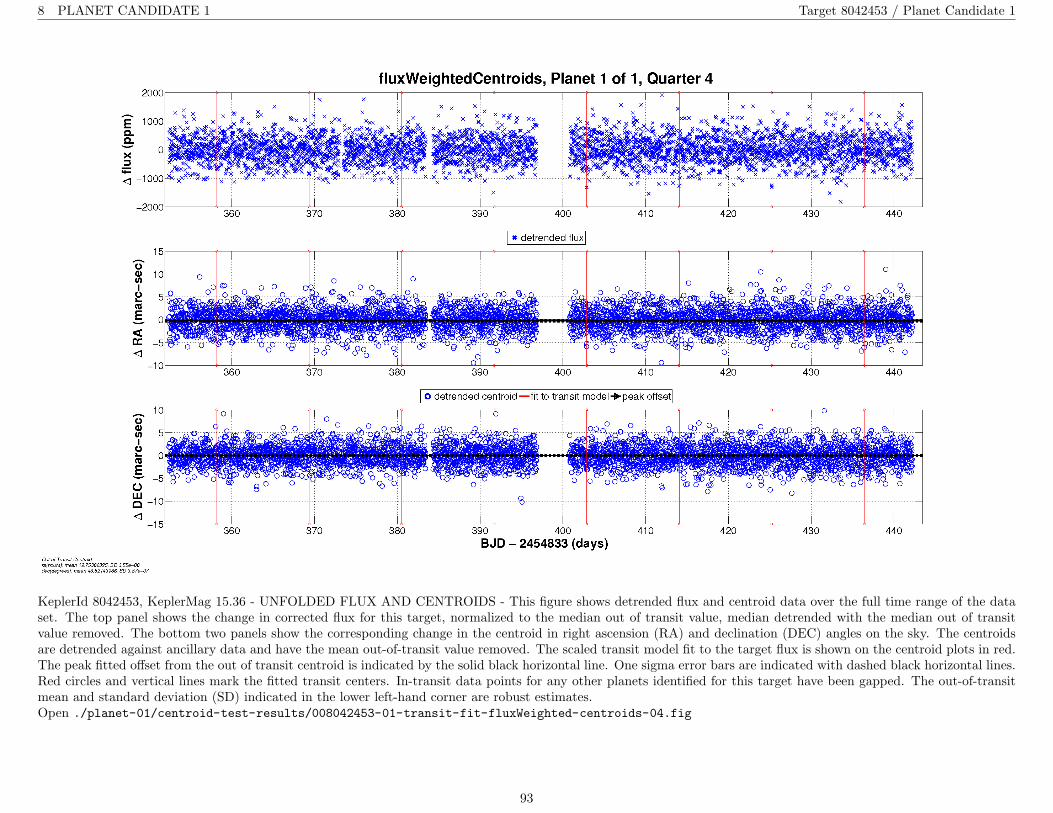
8 PLANET CANDIDATE 1 Target 8042453 / Planet Candidate 1
KeplerId 8042453, KeplerMag 15.36 - UNFOLDED FLUX AND CENTROIDS - This figure shows detrended flux and centroid data over the full time range of the dataset. The top panel shows the change in corrected flux for this target, normalized to the median out of transit value, median detrended with the median out of transitvalue removed. The bottom two panels show the corresponding change in the centroid in right ascension (RA) and declination (DEC) angles on the sky. The centroidsare detrended against ancillary data and have the mean out-of-transit value removed. The scaled transit model fit to the target flux is shown on the centroid plots in red.The peak fitted offset from the out of transit centroid is indicated by the solid black horizontal line. One sigma error bars are indicated with dashed black horizontal lines.Red circles and vertical lines mark the fitted transit centers. In-transit data points for any other planets identified for this target have been gapped. The out-of-transitmean and standard deviation (SD) indicated in the lower left-hand corner are robust estimates.Open ./planet-01/centroid-test-results/008042453-01-transit-fit-fluxWeighted-centroids-04.fig
93

8 PLANET CANDIDATE 1 Target 8042453 / Planet Candidate 1
KeplerId 8042453, KeplerMag 15.36 - UNFOLDED FLUX AND CENTROIDS - This figure shows detrended flux and centroid data over the full time range of the dataset. The top panel shows the change in corrected flux for this target, normalized to the median out of transit value, median detrended with the median out of transitvalue removed. The bottom two panels show the corresponding change in the centroid in right ascension (RA) and declination (DEC) angles on the sky. The centroidsare detrended against ancillary data and have the mean out-of-transit value removed. The scaled transit model fit to the target flux is shown on the centroid plots in red.The peak fitted offset from the out of transit centroid is indicated by the solid black horizontal line. One sigma error bars are indicated with dashed black horizontal lines.Red circles and vertical lines mark the fitted transit centers. In-transit data points for any other planets identified for this target have been gapped. The out-of-transitmean and standard deviation (SD) indicated in the lower left-hand corner are robust estimates.Open ./planet-01/centroid-test-results/008042453-01-transit-fit-fluxWeighted-centroids-05.fig
94

8 PLANET CANDIDATE 1 Target 8042453 / Planet Candidate 1
KeplerId 8042453, KeplerMag 15.36 - UNFOLDED FLUX AND CENTROIDS - This figure shows detrended flux and centroid data over the full time range of the dataset. The top panel shows the change in corrected flux for this target, normalized to the median out of transit value, median detrended with the median out of transitvalue removed. The bottom two panels show the corresponding change in the centroid in right ascension (RA) and declination (DEC) angles on the sky. The centroidsare detrended against ancillary data and have the mean out-of-transit value removed. The scaled transit model fit to the target flux is shown on the centroid plots in red.The peak fitted offset from the out of transit centroid is indicated by the solid black horizontal line. One sigma error bars are indicated with dashed black horizontal lines.Red circles and vertical lines mark the fitted transit centers. In-transit data points for any other planets identified for this target have been gapped. The out-of-transitmean and standard deviation (SD) indicated in the lower left-hand corner are robust estimates.Open ./planet-01/centroid-test-results/008042453-01-transit-fit-fluxWeighted-centroids-06.fig
95

8 PLANET CANDIDATE 1 Target 8042453 / Planet Candidate 1
KeplerId 8042453, KeplerMag 15.36 - UNFOLDED FLUX AND CENTROIDS - This figure shows detrended flux and centroid data over the full time range of the dataset. The top panel shows the change in corrected flux for this target, normalized to the median out of transit value, median detrended with the median out of transitvalue removed. The bottom two panels show the corresponding change in the centroid in right ascension (RA) and declination (DEC) angles on the sky. The centroidsare detrended against ancillary data and have the mean out-of-transit value removed. The scaled transit model fit to the target flux is shown on the centroid plots in red.The peak fitted offset from the out of transit centroid is indicated by the solid black horizontal line. One sigma error bars are indicated with dashed black horizontal lines.Red circles and vertical lines mark the fitted transit centers. In-transit data points for any other planets identified for this target have been gapped. The out-of-transitmean and standard deviation (SD) indicated in the lower left-hand corner are robust estimates.Open ./planet-01/centroid-test-results/008042453-01-transit-fit-fluxWeighted-centroids-07.fig
96
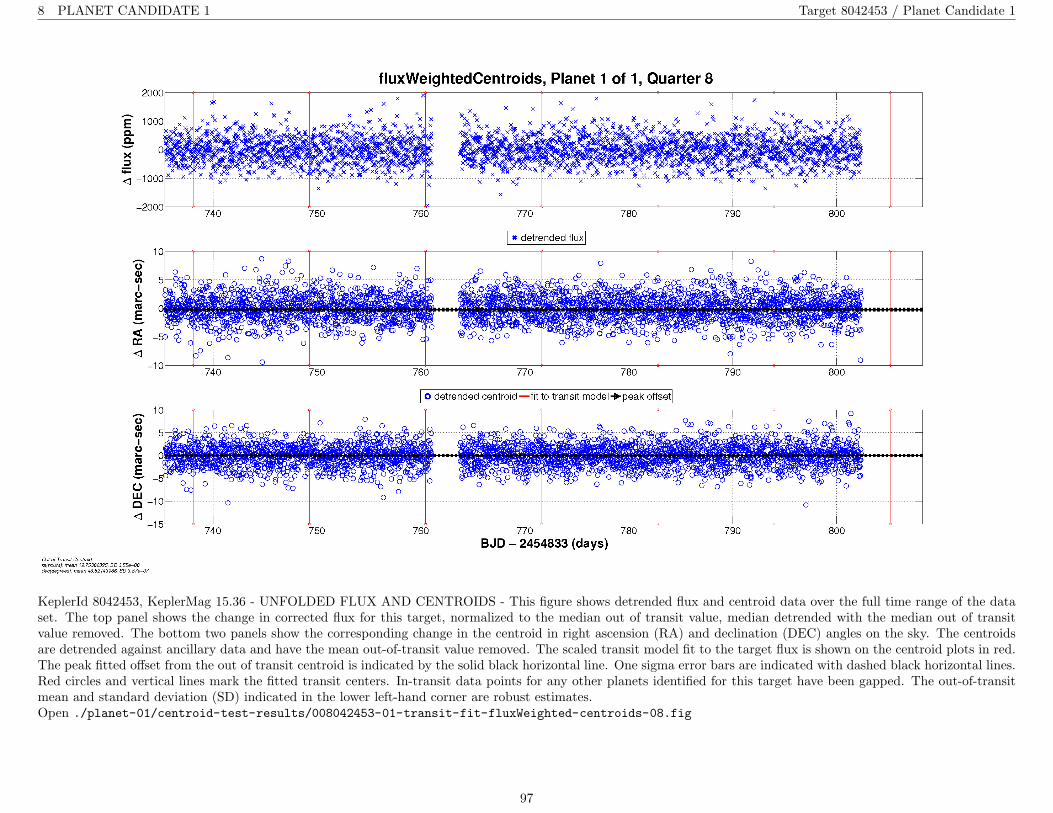
8 PLANET CANDIDATE 1 Target 8042453 / Planet Candidate 1
KeplerId 8042453, KeplerMag 15.36 - UNFOLDED FLUX AND CENTROIDS - This figure shows detrended flux and centroid data over the full time range of the dataset. The top panel shows the change in corrected flux for this target, normalized to the median out of transit value, median detrended with the median out of transitvalue removed. The bottom two panels show the corresponding change in the centroid in right ascension (RA) and declination (DEC) angles on the sky. The centroidsare detrended against ancillary data and have the mean out-of-transit value removed. The scaled transit model fit to the target flux is shown on the centroid plots in red.The peak fitted offset from the out of transit centroid is indicated by the solid black horizontal line. One sigma error bars are indicated with dashed black horizontal lines.Red circles and vertical lines mark the fitted transit centers. In-transit data points for any other planets identified for this target have been gapped. The out-of-transitmean and standard deviation (SD) indicated in the lower left-hand corner are robust estimates.Open ./planet-01/centroid-test-results/008042453-01-transit-fit-fluxWeighted-centroids-08.fig
97
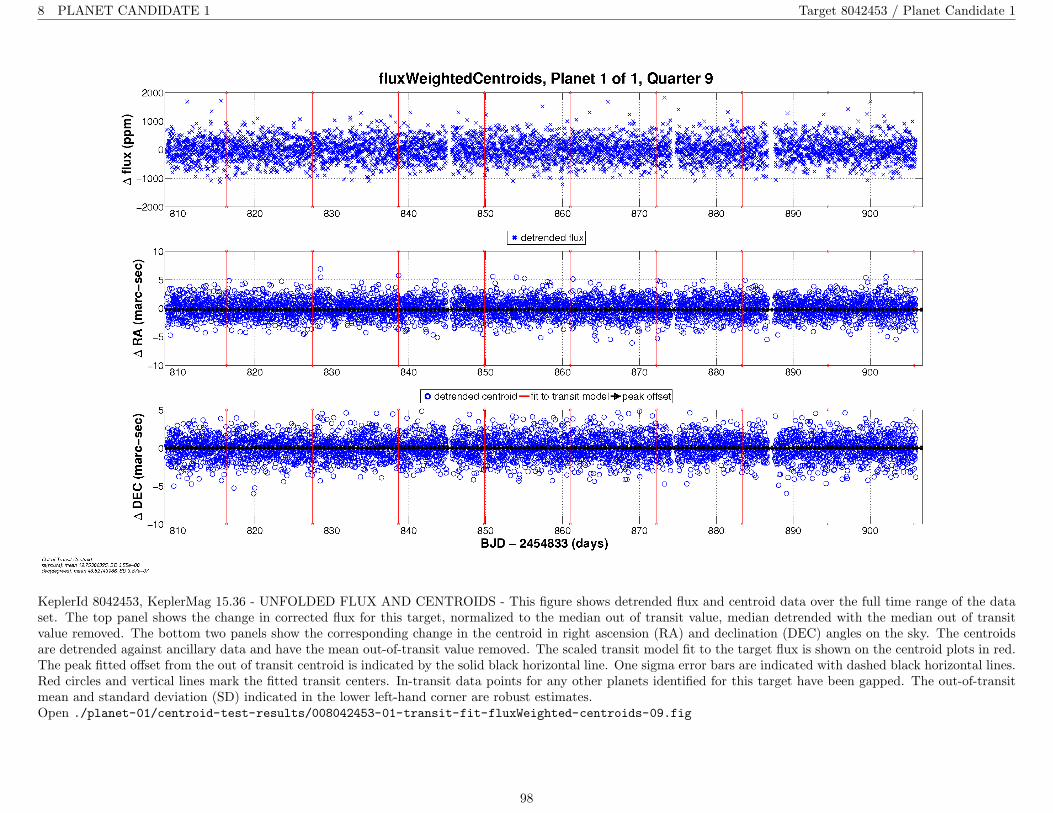
8 PLANET CANDIDATE 1 Target 8042453 / Planet Candidate 1
KeplerId 8042453, KeplerMag 15.36 - UNFOLDED FLUX AND CENTROIDS - This figure shows detrended flux and centroid data over the full time range of the dataset. The top panel shows the change in corrected flux for this target, normalized to the median out of transit value, median detrended with the median out of transitvalue removed. The bottom two panels show the corresponding change in the centroid in right ascension (RA) and declination (DEC) angles on the sky. The centroidsare detrended against ancillary data and have the mean out-of-transit value removed. The scaled transit model fit to the target flux is shown on the centroid plots in red.The peak fitted offset from the out of transit centroid is indicated by the solid black horizontal line. One sigma error bars are indicated with dashed black horizontal lines.Red circles and vertical lines mark the fitted transit centers. In-transit data points for any other planets identified for this target have been gapped. The out-of-transitmean and standard deviation (SD) indicated in the lower left-hand corner are robust estimates.Open ./planet-01/centroid-test-results/008042453-01-transit-fit-fluxWeighted-centroids-09.fig
98

8 PLANET CANDIDATE 1 Target 8042453 / Planet Candidate 1
KeplerId 8042453, KeplerMag 15.36 - UNFOLDED FLUX AND CENTROIDS - This figure shows detrended flux and centroid data over the full time range of the dataset. The top panel shows the change in corrected flux for this target, normalized to the median out of transit value, median detrended with the median out of transitvalue removed. The bottom two panels show the corresponding change in the centroid in right ascension (RA) and declination (DEC) angles on the sky. The centroidsare detrended against ancillary data and have the mean out-of-transit value removed. The scaled transit model fit to the target flux is shown on the centroid plots in red.The peak fitted offset from the out of transit centroid is indicated by the solid black horizontal line. One sigma error bars are indicated with dashed black horizontal lines.Red circles and vertical lines mark the fitted transit centers. In-transit data points for any other planets identified for this target have been gapped. The out-of-transitmean and standard deviation (SD) indicated in the lower left-hand corner are robust estimates.Open ./planet-01/centroid-test-results/008042453-01-transit-fit-fluxWeighted-centroids-10.fig
99

8 PLANET CANDIDATE 1 Target 8042453 / Planet Candidate 1
KeplerId 8042453, KeplerMag 15.36 - UNFOLDED FLUX AND CENTROIDS - This figure shows detrended flux and centroid data over the full time range of the dataset. The top panel shows the change in corrected flux for this target, normalized to the median out of transit value, median detrended with the median out of transitvalue removed. The bottom two panels show the corresponding change in the centroid in right ascension (RA) and declination (DEC) angles on the sky. The centroidsare detrended against ancillary data and have the mean out-of-transit value removed. The scaled transit model fit to the target flux is shown on the centroid plots in red.The peak fitted offset from the out of transit centroid is indicated by the solid black horizontal line. One sigma error bars are indicated with dashed black horizontal lines.Red circles and vertical lines mark the fitted transit centers. In-transit data points for any other planets identified for this target have been gapped. The out-of-transitmean and standard deviation (SD) indicated in the lower left-hand corner are robust estimates.Open ./planet-01/centroid-test-results/008042453-01-transit-fit-fluxWeighted-centroids-11.fig
100

8 PLANET CANDIDATE 1 Target 8042453 / Planet Candidate 1
KeplerId 8042453, KeplerMag 15.36 - UNFOLDED FLUX AND CENTROIDS - This figure shows detrended flux and centroid data over the full time range of the dataset. The top panel shows the change in corrected flux for this target, normalized to the median out of transit value, median detrended with the median out of transitvalue removed. The bottom two panels show the corresponding change in the centroid in right ascension (RA) and declination (DEC) angles on the sky. The centroidsare detrended against ancillary data and have the mean out-of-transit value removed. The scaled transit model fit to the target flux is shown on the centroid plots in red.The peak fitted offset from the out of transit centroid is indicated by the solid black horizontal line. One sigma error bars are indicated with dashed black horizontal lines.Red circles and vertical lines mark the fitted transit centers. In-transit data points for any other planets identified for this target have been gapped. The out-of-transitmean and standard deviation (SD) indicated in the lower left-hand corner are robust estimates.Open ./planet-01/centroid-test-results/008042453-01-transit-fit-fluxWeighted-centroids-12.fig
101
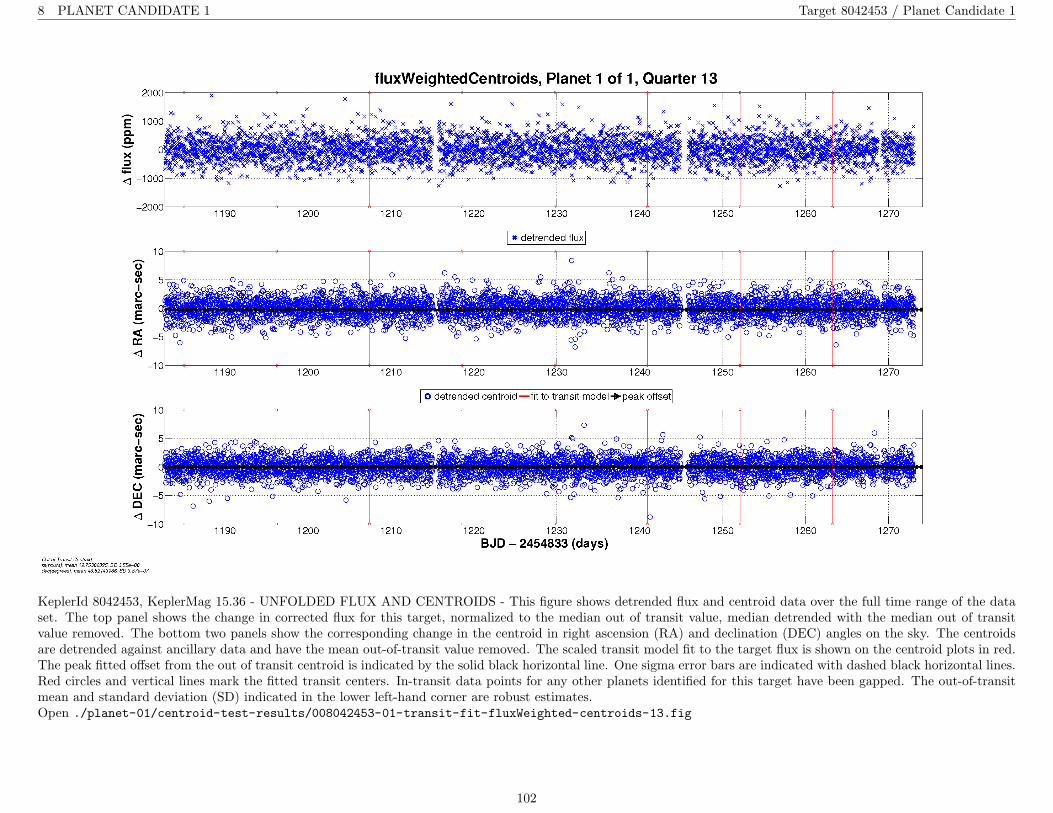
8 PLANET CANDIDATE 1 Target 8042453 / Planet Candidate 1
KeplerId 8042453, KeplerMag 15.36 - UNFOLDED FLUX AND CENTROIDS - This figure shows detrended flux and centroid data over the full time range of the dataset. The top panel shows the change in corrected flux for this target, normalized to the median out of transit value, median detrended with the median out of transitvalue removed. The bottom two panels show the corresponding change in the centroid in right ascension (RA) and declination (DEC) angles on the sky. The centroidsare detrended against ancillary data and have the mean out-of-transit value removed. The scaled transit model fit to the target flux is shown on the centroid plots in red.The peak fitted offset from the out of transit centroid is indicated by the solid black horizontal line. One sigma error bars are indicated with dashed black horizontal lines.Red circles and vertical lines mark the fitted transit centers. In-transit data points for any other planets identified for this target have been gapped. The out-of-transitmean and standard deviation (SD) indicated in the lower left-hand corner are robust estimates.Open ./planet-01/centroid-test-results/008042453-01-transit-fit-fluxWeighted-centroids-13.fig
102
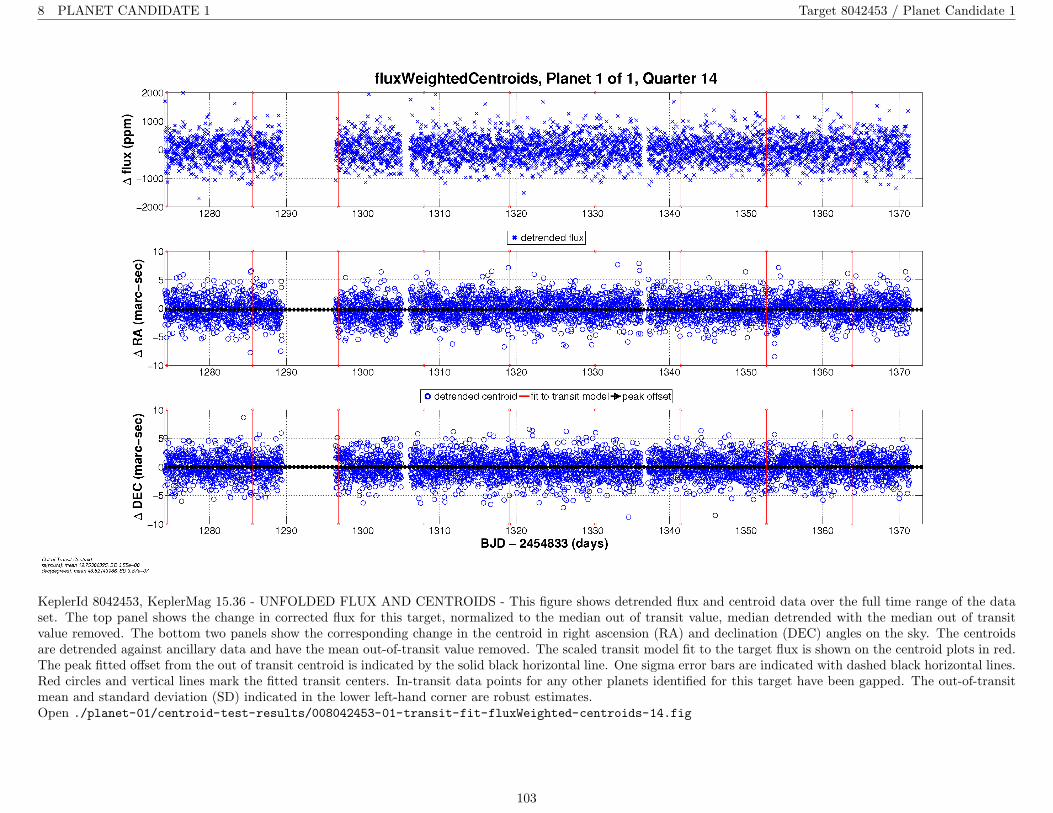
8 PLANET CANDIDATE 1 Target 8042453 / Planet Candidate 1
KeplerId 8042453, KeplerMag 15.36 - UNFOLDED FLUX AND CENTROIDS - This figure shows detrended flux and centroid data over the full time range of the dataset. The top panel shows the change in corrected flux for this target, normalized to the median out of transit value, median detrended with the median out of transitvalue removed. The bottom two panels show the corresponding change in the centroid in right ascension (RA) and declination (DEC) angles on the sky. The centroidsare detrended against ancillary data and have the mean out-of-transit value removed. The scaled transit model fit to the target flux is shown on the centroid plots in red.The peak fitted offset from the out of transit centroid is indicated by the solid black horizontal line. One sigma error bars are indicated with dashed black horizontal lines.Red circles and vertical lines mark the fitted transit centers. In-transit data points for any other planets identified for this target have been gapped. The out-of-transitmean and standard deviation (SD) indicated in the lower left-hand corner are robust estimates.Open ./planet-01/centroid-test-results/008042453-01-transit-fit-fluxWeighted-centroids-14.fig
103

8 PLANET CANDIDATE 1 Target 8042453 / Planet Candidate 1
KeplerId 8042453, KeplerMag 15.36 - UNFOLDED FLUX AND CENTROIDS - This figure shows detrended flux and centroid data over the full time range of the dataset. The top panel shows the change in corrected flux for this target, normalized to the median out of transit value, median detrended with the median out of transitvalue removed. The bottom two panels show the corresponding change in the centroid in right ascension (RA) and declination (DEC) angles on the sky. The centroidsare detrended against ancillary data and have the mean out-of-transit value removed. The scaled transit model fit to the target flux is shown on the centroid plots in red.The peak fitted offset from the out of transit centroid is indicated by the solid black horizontal line. One sigma error bars are indicated with dashed black horizontal lines.Red circles and vertical lines mark the fitted transit centers. In-transit data points for any other planets identified for this target have been gapped. The out-of-transitmean and standard deviation (SD) indicated in the lower left-hand corner are robust estimates.Open ./planet-01/centroid-test-results/008042453-01-transit-fit-fluxWeighted-centroids-15.fig
104

8 PLANET CANDIDATE 1 Target 8042453 / Planet Candidate 1
KeplerId 8042453, KeplerMag 15.36 - UNFOLDED FLUX AND CENTROIDS - This figure shows detrended flux and centroid data over the full time range of the dataset. The top panel shows the change in corrected flux for this target, normalized to the median out of transit value, median detrended with the median out of transitvalue removed. The bottom two panels show the corresponding change in the centroid in right ascension (RA) and declination (DEC) angles on the sky. The centroidsare detrended against ancillary data and have the mean out-of-transit value removed. The scaled transit model fit to the target flux is shown on the centroid plots in red.The peak fitted offset from the out of transit centroid is indicated by the solid black horizontal line. One sigma error bars are indicated with dashed black horizontal lines.Red circles and vertical lines mark the fitted transit centers. In-transit data points for any other planets identified for this target have been gapped. The out-of-transitmean and standard deviation (SD) indicated in the lower left-hand corner are robust estimates.Open ./planet-01/centroid-test-results/008042453-01-transit-fit-fluxWeighted-centroids-16.fig
105

8 PLANET CANDIDATE 1 Target 8042453 / Planet Candidate 1
KeplerId 8042453, KeplerMag 15.36 - UNFOLDED FLUX AND CENTROIDS - This figure shows detrended flux and centroid data over the full time range of the dataset. The top panel shows the change in corrected flux for this target, normalized to the median out of transit value, median detrended with the median out of transitvalue removed. The bottom two panels show the corresponding change in the centroid in right ascension (RA) and declination (DEC) angles on the sky. The centroidsare detrended against ancillary data and have the mean out-of-transit value removed. The scaled transit model fit to the target flux is shown on the centroid plots in red.The peak fitted offset from the out of transit centroid is indicated by the solid black horizontal line. One sigma error bars are indicated with dashed black horizontal lines.Red circles and vertical lines mark the fitted transit centers. In-transit data points for any other planets identified for this target have been gapped. The out-of-transitmean and standard deviation (SD) indicated in the lower left-hand corner are robust estimates.Open ./planet-01/centroid-test-results/008042453-01-transit-fit-fluxWeighted-centroids-17.fig
106

8 PLANET CANDIDATE 1 Target 8042453 / Planet Candidate 1
Bootstrap results for target 8042453, planet 1. Cumulative sum of the probabilities (derived from the histogram of counts) from upper tail to the search transit threshold;false alarm probability is indicated by the star. The Gaussian equivalent threshold for this false alarm probability is 14.0817.Open ./planet-01/bootstrap-results/008042453-01-bootstrap-false-alarm.fig
107

APPENDIX A: PLANET CANDIDATE 1 Target 8042453 / Planet Candidate 1
Appendix A Planet Candidate 1
A.1 Model Fitter: All Transits
Robust weights distribution for KeplerId 8042453, Planet candidate 1. Top plot: all data points. Middle plot: all data points, folded per the fitted period and epoch.Bottom plot: all data points, folded and zoomed.Open ./planet-01/planet-search-and-model-fitting-results/all-transits-fit/008042453-01-all-robust-weights.fig
108

APPENDIX A: PLANET CANDIDATE 1 Target 8042453 / Planet Candidate 1
Fit residuals distribution for KeplerId 8042453, Planet candidate 1. Only the valid data points used to constrain the fit are shown here. A Gaussian fit to the histogramis shown in red.Open ./planet-01/planet-search-and-model-fitting-results/all-transits-fit/008042453-01-all-histo-used.fig
Fit residuals distribution for KeplerId 8042453, Planet candidate 1. Top plot: all valid data. Bottom plot: valid data not used to constrain fit (due to distance from atransit). Gaussian fits to the histograms are shown in red.Open ./planet-01/planet-search-and-model-fitting-results/all-transits-fit/008042453-01-all-histo-all-and-unused.fig
109
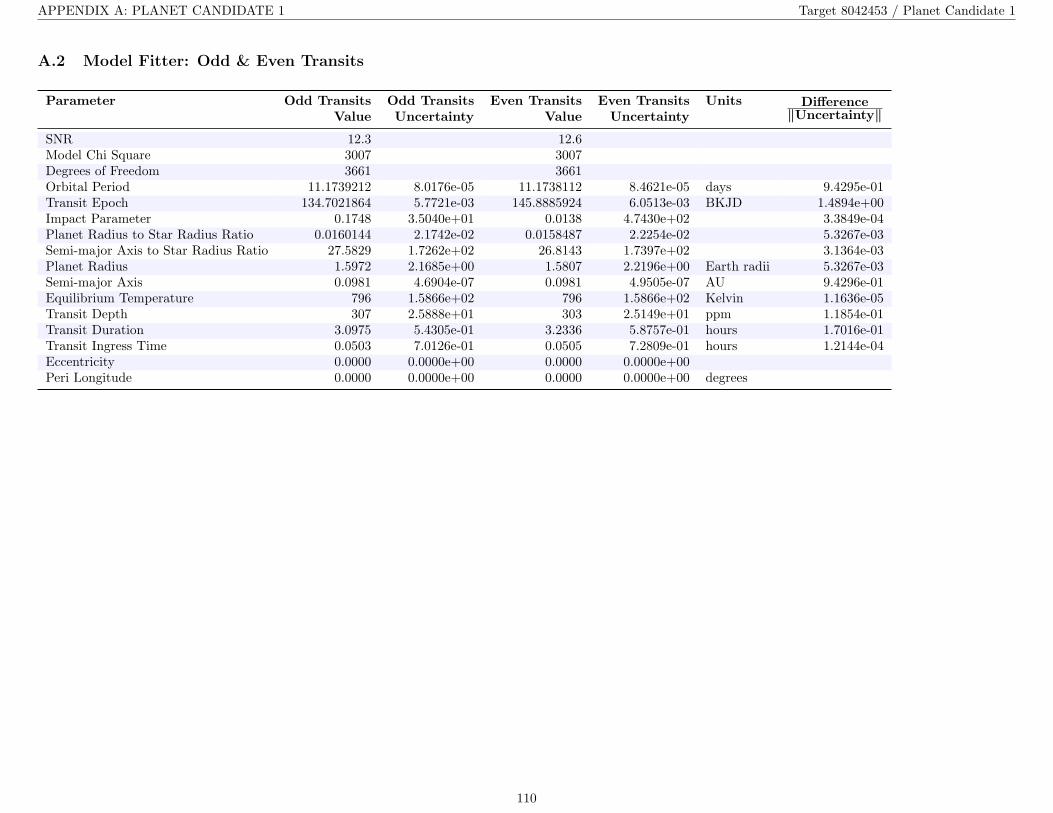
APPENDIX A: PLANET CANDIDATE 1 Target 8042453 / Planet Candidate 1
A.2 Model Fitter: Odd & Even Transits
Parameter Odd Transits Odd Transits Even Transits Even Transits Units Difference‖Uncertainty‖Value Uncertainty Value Uncertainty
SNR 12.3 12.6Model Chi Square 3007 3007Degrees of Freedom 3661 3661Orbital Period 11.1739212 8.0176e-05 11.1738112 8.4621e-05 days 9.4295e-01Transit Epoch 134.7021864 5.7721e-03 145.8885924 6.0513e-03 BKJD 1.4894e+00Impact Parameter 0.1748 3.5040e+01 0.0138 4.7430e+02 3.3849e-04Planet Radius to Star Radius Ratio 0.0160144 2.1742e-02 0.0158487 2.2254e-02 5.3267e-03Semi-major Axis to Star Radius Ratio 27.5829 1.7262e+02 26.8143 1.7397e+02 3.1364e-03Planet Radius 1.5972 2.1685e+00 1.5807 2.2196e+00 Earth radii 5.3267e-03Semi-major Axis 0.0981 4.6904e-07 0.0981 4.9505e-07 AU 9.4296e-01Equilibrium Temperature 796 1.5866e+02 796 1.5866e+02 Kelvin 1.1636e-05Transit Depth 307 2.5888e+01 303 2.5149e+01 ppm 1.1854e-01Transit Duration 3.0975 5.4305e-01 3.2336 5.8757e-01 hours 1.7016e-01Transit Ingress Time 0.0503 7.0126e-01 0.0505 7.2809e-01 hours 1.2144e-04Eccentricity 0.0000 0.0000e+00 0.0000 0.0000e+00Peri Longitude 0.0000 0.0000e+00 0.0000 0.0000e+00 degrees
110

APPENDIX A: PLANET CANDIDATE 1 Target 8042453 / Planet Candidate 1
PDC Flux time series for KeplerId 8042453, Planet candidate 1 in the unwhitened domain. For the data of Quarter-01/TargetTableId-020, start BJD is 2454964 and thevertical offset is 0. For the data of Quarter-02/TargetTableId-021, start BJD is 2455002 and the vertical offset is 0.1. For the data of Quarter-03/TargetTableId-026, startBJD is 2455093 and the vertical offset is 0.2. For the data of Quarter-04/TargetTableId-029, start BJD is 2455184 and the vertical offset is 0.3. Transit event markersindicate the location of transits of the given planet candidate. Odd-even transits fit completed with full convergence.Open ./planet-01/planet-search-and-model-fitting-results/odd-even-transits-fit/008042453-01-odd-even-unwhitened-01-020.fig
111

APPENDIX A: PLANET CANDIDATE 1 Target 8042453 / Planet Candidate 1
PDC Flux time series for KeplerId 8042453, Planet candidate 1 in the unwhitened domain. For the data of Quarter-05/TargetTableId-032, start BJD is 2455276 and thevertical offset is 0. For the data of Quarter-06/TargetTableId-035, start BJD is 2455372 and the vertical offset is 0.1. For the data of Quarter-07/TargetTableId-038, startBJD is 2455463 and the vertical offset is 0.2. For the data of Quarter-08/TargetTableId-041, start BJD is 2455568 and the vertical offset is 0.3. Transit event markersindicate the location of transits of the given planet candidate. Odd-even transits fit completed with full convergence.Open ./planet-01/planet-search-and-model-fitting-results/odd-even-transits-fit/008042453-01-odd-even-unwhitened-05-032.fig
112
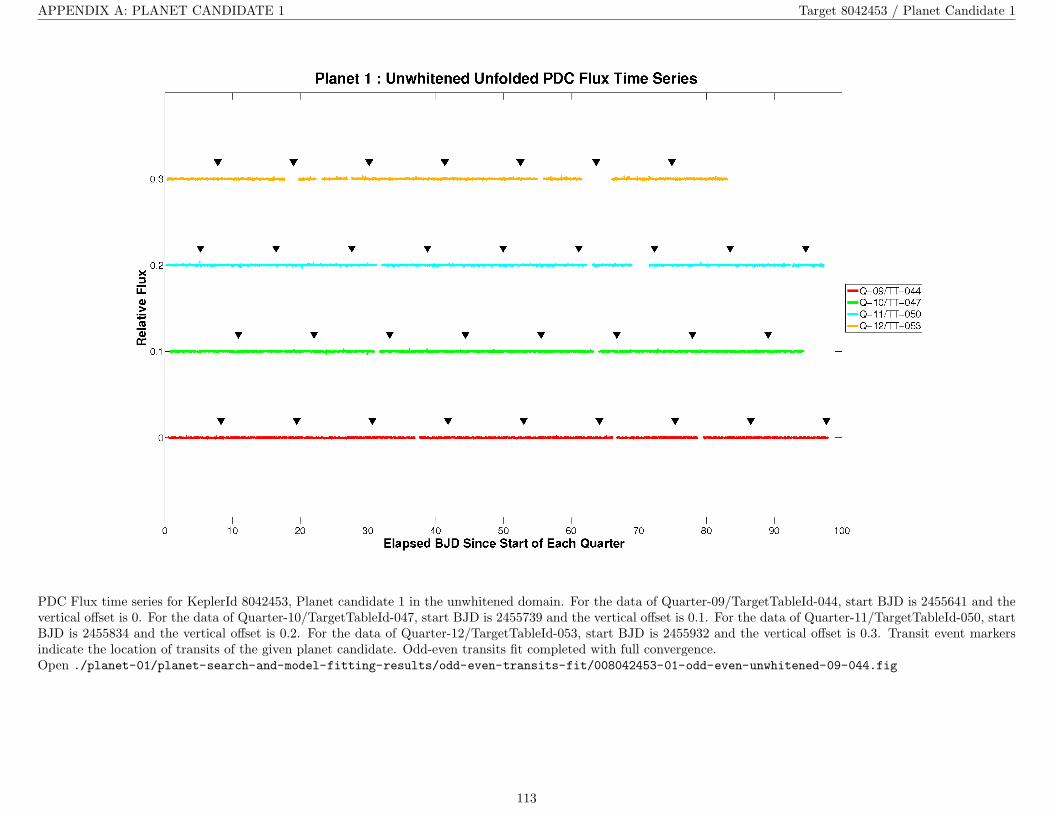
APPENDIX A: PLANET CANDIDATE 1 Target 8042453 / Planet Candidate 1
PDC Flux time series for KeplerId 8042453, Planet candidate 1 in the unwhitened domain. For the data of Quarter-09/TargetTableId-044, start BJD is 2455641 and thevertical offset is 0. For the data of Quarter-10/TargetTableId-047, start BJD is 2455739 and the vertical offset is 0.1. For the data of Quarter-11/TargetTableId-050, startBJD is 2455834 and the vertical offset is 0.2. For the data of Quarter-12/TargetTableId-053, start BJD is 2455932 and the vertical offset is 0.3. Transit event markersindicate the location of transits of the given planet candidate. Odd-even transits fit completed with full convergence.Open ./planet-01/planet-search-and-model-fitting-results/odd-even-transits-fit/008042453-01-odd-even-unwhitened-09-044.fig
113
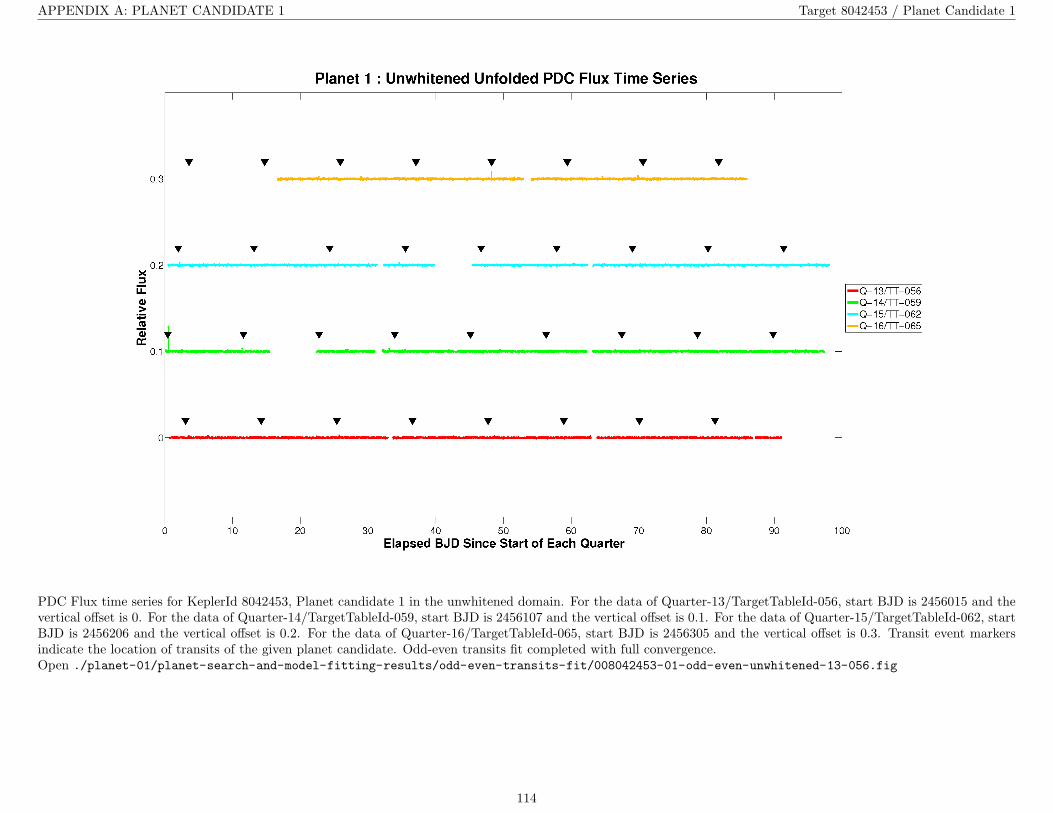
APPENDIX A: PLANET CANDIDATE 1 Target 8042453 / Planet Candidate 1
PDC Flux time series for KeplerId 8042453, Planet candidate 1 in the unwhitened domain. For the data of Quarter-13/TargetTableId-056, start BJD is 2456015 and thevertical offset is 0. For the data of Quarter-14/TargetTableId-059, start BJD is 2456107 and the vertical offset is 0.1. For the data of Quarter-15/TargetTableId-062, startBJD is 2456206 and the vertical offset is 0.2. For the data of Quarter-16/TargetTableId-065, start BJD is 2456305 and the vertical offset is 0.3. Transit event markersindicate the location of transits of the given planet candidate. Odd-even transits fit completed with full convergence.Open ./planet-01/planet-search-and-model-fitting-results/odd-even-transits-fit/008042453-01-odd-even-unwhitened-13-056.fig
114

APPENDIX A: PLANET CANDIDATE 1 Target 8042453 / Planet Candidate 1
PDC Flux time series for KeplerId 8042453, Planet candidate 1 in the unwhitened domain. For the data of Quarter-17/TargetTableId-068, start BJD is 2456392. Transitevent markers indicate the location of transits of the given planet candidate. Odd-even transits fit completed with full convergence.Open ./planet-01/planet-search-and-model-fitting-results/odd-even-transits-fit/008042453-01-odd-even-unwhitened-17-068.fig
115

APPENDIX A: PLANET CANDIDATE 1 Target 8042453 / Planet Candidate 1
PDC Flux time series for KeplerId 8042453, Planet candidate 1 in the unwhitened domain, zoomed on last 5 transits in the unit of work. If # of transits is smaller than5, all transits are shown.Open ./planet-01/planet-search-and-model-fitting-results/odd-even-transits-fit/008042453-01-odd-even-unwhitened-zoomed.fig
PDC Flux time series of odd/even transits for KeplerId 8042453, Planet candidate 1 in the unwhitened domain. Data has been high-pass filtered via a median filteroperating at a specified multiple of the transit duration, folded per the fitted period and epoch, and zoomed to the location of the model transit.Open ./planet-01/planet-search-and-model-fitting-results/odd-even-transits-fit/008042453-01-odd-even-unwhitened-filtered-zoomed.fig
116
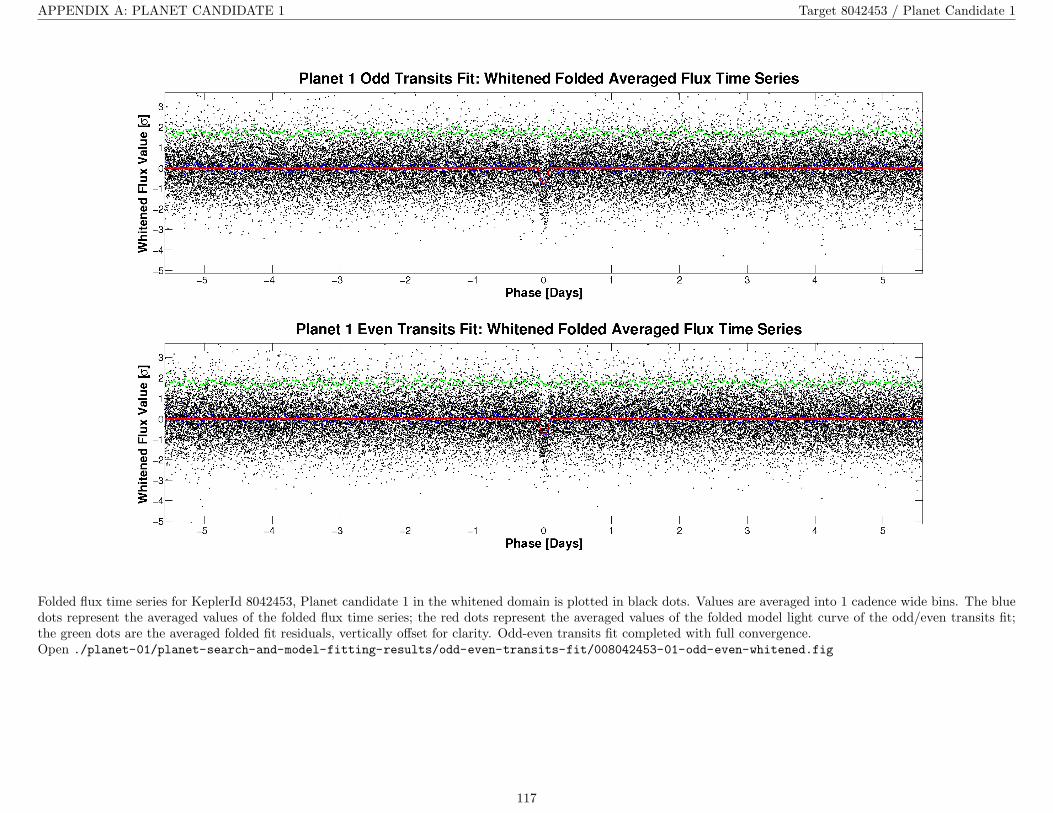
APPENDIX A: PLANET CANDIDATE 1 Target 8042453 / Planet Candidate 1
Folded flux time series for KeplerId 8042453, Planet candidate 1 in the whitened domain is plotted in black dots. Values are averaged into 1 cadence wide bins. The bluedots represent the averaged values of the folded flux time series; the red dots represent the averaged values of the folded model light curve of the odd/even transits fit;the green dots are the averaged folded fit residuals, vertically offset for clarity. Odd-even transits fit completed with full convergence.Open ./planet-01/planet-search-and-model-fitting-results/odd-even-transits-fit/008042453-01-odd-even-whitened.fig
117

APPENDIX A: PLANET CANDIDATE 1 Target 8042453 / Planet Candidate 1
Folded flux time series for KeplerId 8042453, Planet candidate 1 in the whitened domain, zoomed on the transit. The flux data whose robust weights are larger/smallerthan 0.1 are plotted in dark green/cyan dots, respectively. Values are averaged into 1 cadence wide bins. The blue dots represent the averaged values of the folded fluxtime series; the red dots represent the averaged values of the fitted model light curve of the odd/even transits fit; the green dots are the averaged folded fit residuals,vertically offset for clarity. Magenta dots are the averaged values of the folded flux time series, with a phase shift of 0.5 relative to the blue dots, vertically offset forclarity. Odd-even transits fit completed with full convergence.Open ./planet-01/planet-search-and-model-fitting-results/odd-even-transits-fit/008042453-01-odd-even-whitened-zoomed.fig
118

APPENDIX A: PLANET CANDIDATE 1 Target 8042453 / Planet Candidate 1
Robust weights distribution for KeplerId 8042453, Planet candidate 1. Top plot: all data points. Middle plot: all data points, folded per the fitted period and epoch.Bottom plot: all data points, folded and zoomed.Open ./planet-01/planet-search-and-model-fitting-results/odd-even-transits-fit/008042453-01-odd-even-robust-weights.fig
119

APPENDIX A: PLANET CANDIDATE 1 Target 8042453 / Planet Candidate 1
Fit residuals distribution for KeplerId 8042453, Planet candidate 1. Only the valid data points used to constrain the fit are shown here. A Gaussian fit to the histogramis shown in red.Open ./planet-01/planet-search-and-model-fitting-results/odd-even-transits-fit/008042453-01-odd-even-histo-used.fig
Fit residuals distribution for KeplerId 8042453, Planet candidate 1. Top plot: all valid data. Bottom plot: valid data not used to constrain fit (due to distance from atransit). Gaussian fits to the histograms are shown in red.Open ./planet-01/planet-search-and-model-fitting-results/odd-even-transits-fit/008042453-01-odd-even-histo-all-and-unused.fig
120
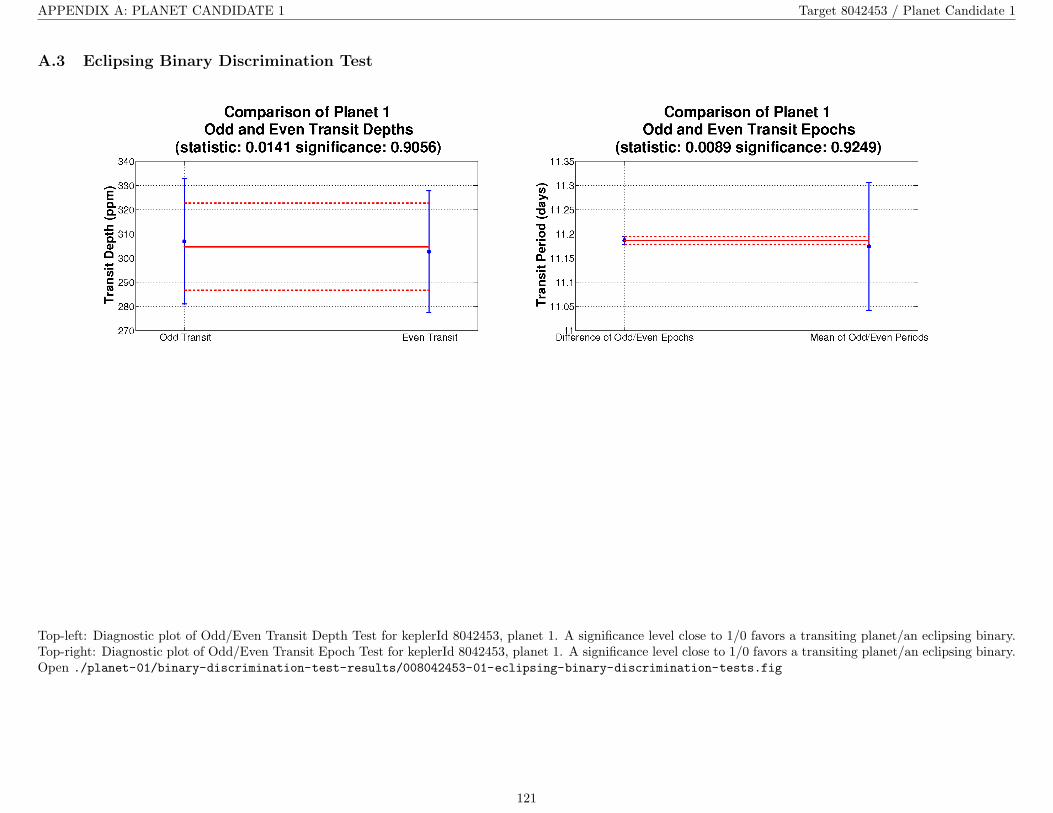
APPENDIX A: PLANET CANDIDATE 1 Target 8042453 / Planet Candidate 1
A.3 Eclipsing Binary Discrimination Test
Top-left: Diagnostic plot of Odd/Even Transit Depth Test for keplerId 8042453, planet 1. A significance level close to 1/0 favors a transiting planet/an eclipsing binary.Top-right: Diagnostic plot of Odd/Even Transit Epoch Test for keplerId 8042453, planet 1. A significance level close to 1/0 favors a transiting planet/an eclipsing binary.Open ./planet-01/binary-discrimination-test-results/008042453-01-eclipsing-binary-discrimination-tests.fig
121
APPENDIX B: SINGLE EVENT STATISTICS FROM RESIDUAL FLUX Target 8042453
Appendix B Single Event Statistics from Residual Flux
No figures named 008042453-00-residual-ses-*.fig are available.
122

APPENDIX C: ALERTS Target 8042453
Appendix C Alerts
Time Severity Message
56920.1464 warning Multi-quarter PRF fitting and offset analysis will not be performed because model fit SNR is above specified threshold (target=1,keplerId=8042453, planet=1, component=generateDvDifferenceImages)
56920.1490 warning No centroid data available. Centroid test results set to default values for all planets. (target=1, keplerId=8042453, component=Centroidtest prf)
56920.1510 warning Pixel correlation test is disabled (target=1, keplerId=8042453, component=Pixel correlation test)
123
Related Documents


![Data Validation and Verification [Autosaved] · ON IP DATA VALIDATION, VERIFICATION AND EXCHANGE DATA VALIDATION AND VERIFICATION USING IPOBSD’S TOOLS. Data Quality Vicious Cycle.](https://static.cupdf.com/doc/110x72/5e9d0eaef4fa863d2d614a6c/data-validation-and-verification-autosaved-on-ip-data-validation-verification.jpg)