Data Service Market Inquiry Dr. Onkokame Mothobi, Senior Researcher Research ICT Africa, South Africa Competition Commission, Pretoria, 17 October 2017 Competition Commssion, South Africa Pretoria 17 th October 2018

Welcome message from author
This document is posted to help you gain knowledge. Please leave a comment to let me know what you think about it! Share it to your friends and learn new things together.
Transcript

Data Service Market Inquiry
Dr. Onkokame Mothobi, Senior Researcher
Research ICT Africa, South Africa
Competition Commission,
Pretoria, 17 October 2017
Competition Commssion, South Africa
Pretoria 17th October 2018

Research ICT Africa- Evidence based policy
Research ICT Africa Mobile Pricing Index (RAMP)
• Voice/ SMS basket: the cost of 30 prepaid mobile voice
calls for a total of 50 minutes, distributed between
destinations and ‘peak’ periods, added to that of 100
SMSs, and divided by the subscription value for the
period of one month.
• Data baskets: the cost of 1 GB, 500 MB and 100 MB
prepaid mobile data bundles, valid for monthly, weekly
and daily periods.
Are data prices in South Africa high?
• The cost of cheapest of 1 GB of data is used to compare prices in
South Africa with other African countries
• South Africa performs poorly in the RAMP index, coming 35th of out of
49 African countries
• The cost of cheapest 1 GB of data in South Africa is USD 8.28 (ZAR
99) seven times higher the cost of 1 GB in Egypt (USD 1.13) and
nearly three times the cost of same data in Ghana, Kenya and Nigeria

SA ’s Cheapest 1GB data Compared to Africa ’s Top
Performers
USD 1.13
USD 1.25
USD 1.49
USD 2.08
USD 2.23
USD 2.23
USD 2.28
USD 2.37
USD 2.40
USD 2.46
USD 2.68
USD 2.75
USD 2.79
USD 8.28
0 2.25 4.5 6.75 9
Egypt
Namibia
Mozambique
Tunisia
Tanzania
Guinea
Sudan
Rwanda
Brundi
Kenya
Ghana
Uganda
Nigeria
South africa
FIGURE 4: SA’S CHEAPEST PREPAID MOBILE 1GB BASKETS COMPARED TO AFRICA’S TOP PERFORMERS (USD)
Source: RAMP Index, 2018

Benchmarking SA against large African Markets
Table 1: Benchmarking South Africa against Ghana, Kenya and Nigeria
AffordabilityComparison
averageTraffic Light
Country-level
indicatorSource
Mobile prepaid 1GB
basket (USD) 2,64 8,28 RIA, 2018
Dominant operator:
mobile prepaid 1GB
basket (USD) 4,06 10,94 RIA, 2018
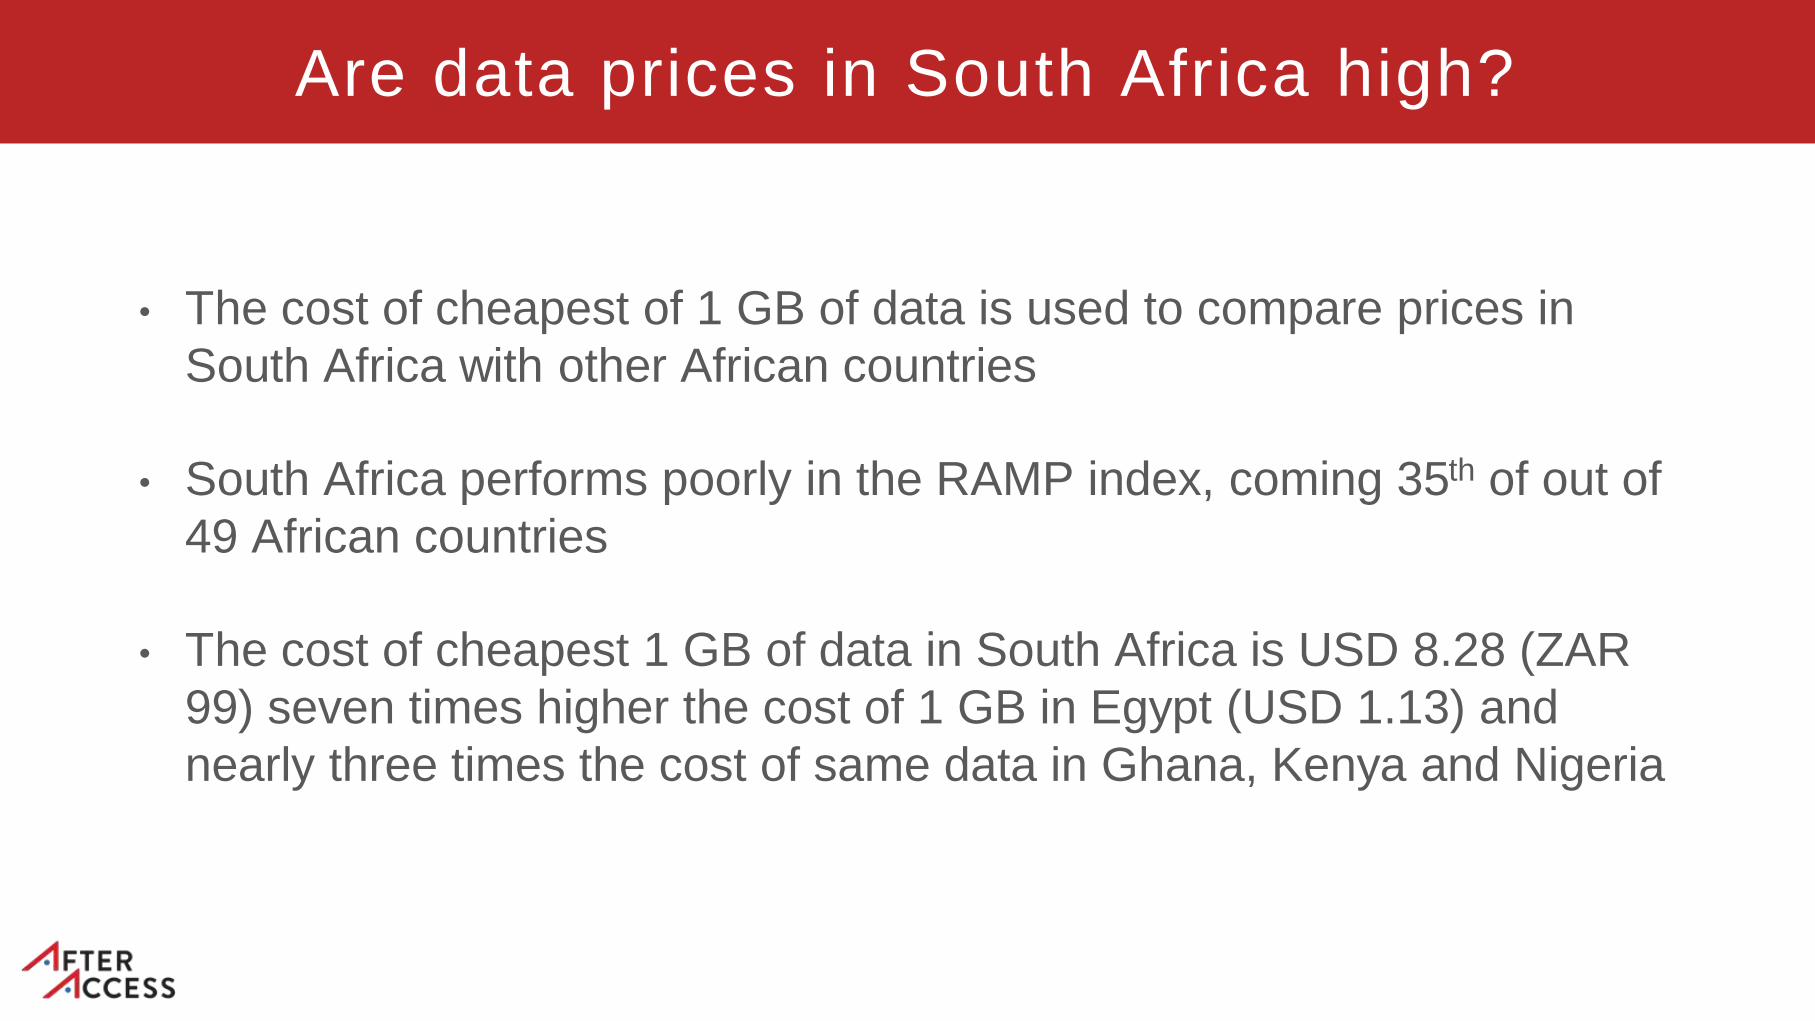
86%
73%
53%
73%
63%65%
19%
30%
17%
26%
13%
36%
26%
15%9%10%
0%
25%
50%
75%
100%
0
5000
10000
15000
20000
Arg
en
tin
a
Co
lom
bia
So
uth
Afr
ica
Peru
Para
gu
ay
Gu
ate
mala
Ind
ia
Nig
eri
a
Pakis
tan
Gh
an
a
Ban
gla
de
sh
Cam
bo
dia
Ken
ya
Ta
nzan
ia
Rw
an
da
Mo
zam
biq
ue
GN
I p
er
ca
pit
a v
alu
e
Internet use GNI per capita
Despite high prices
Internet penetration in
South Africa is higher
than any other
surveyed African
countries
But lower than
Argentina, Colombia,
Paraguay and Peru
and Guatemala

But Internet remains unaffordable to the low-income
earners
32
10
0 00
10
20
30
40
0 - 1 583 1 584 - 7 167 7 168 - 16 417 16 418 - 33 333
Pe
rce
nta
ge
The 2017 RIA After AccessSurvey shows that low-incomeearners pay a significantly highproportion of their disposableincome to accesstelecommunication services
The cost of Internet or theaffordability divide between thelow-income and high-incomeSouth Africans is creatingbarriers to connecting the low-income earners
The Survey shows that almost50% of South Africans do notuse the Internet and furtherthese 50% are those in thebottom of the pyramid
Cost drivers
• ~High rand-dollar exchange rate- Which affects equipment import required forthe constant upgrading of mobile network.
• ~Increasing costs of key inputs – Have had an inflationary effects on dataprices
• ~In the absence of high-demand spectrum being released to operators for4G: high bandwidth services are also not being deployed in the cost-effectivemanner which further exacerbate the high cost of data.
• Regulatory issues: The failure of ICASA to put in place some mandatory andfoundational regulation means that the wholesale facility and service market,which is highly imperfect by nature, does not produce the intended competitiveresults
Competition in data market (wholesale)
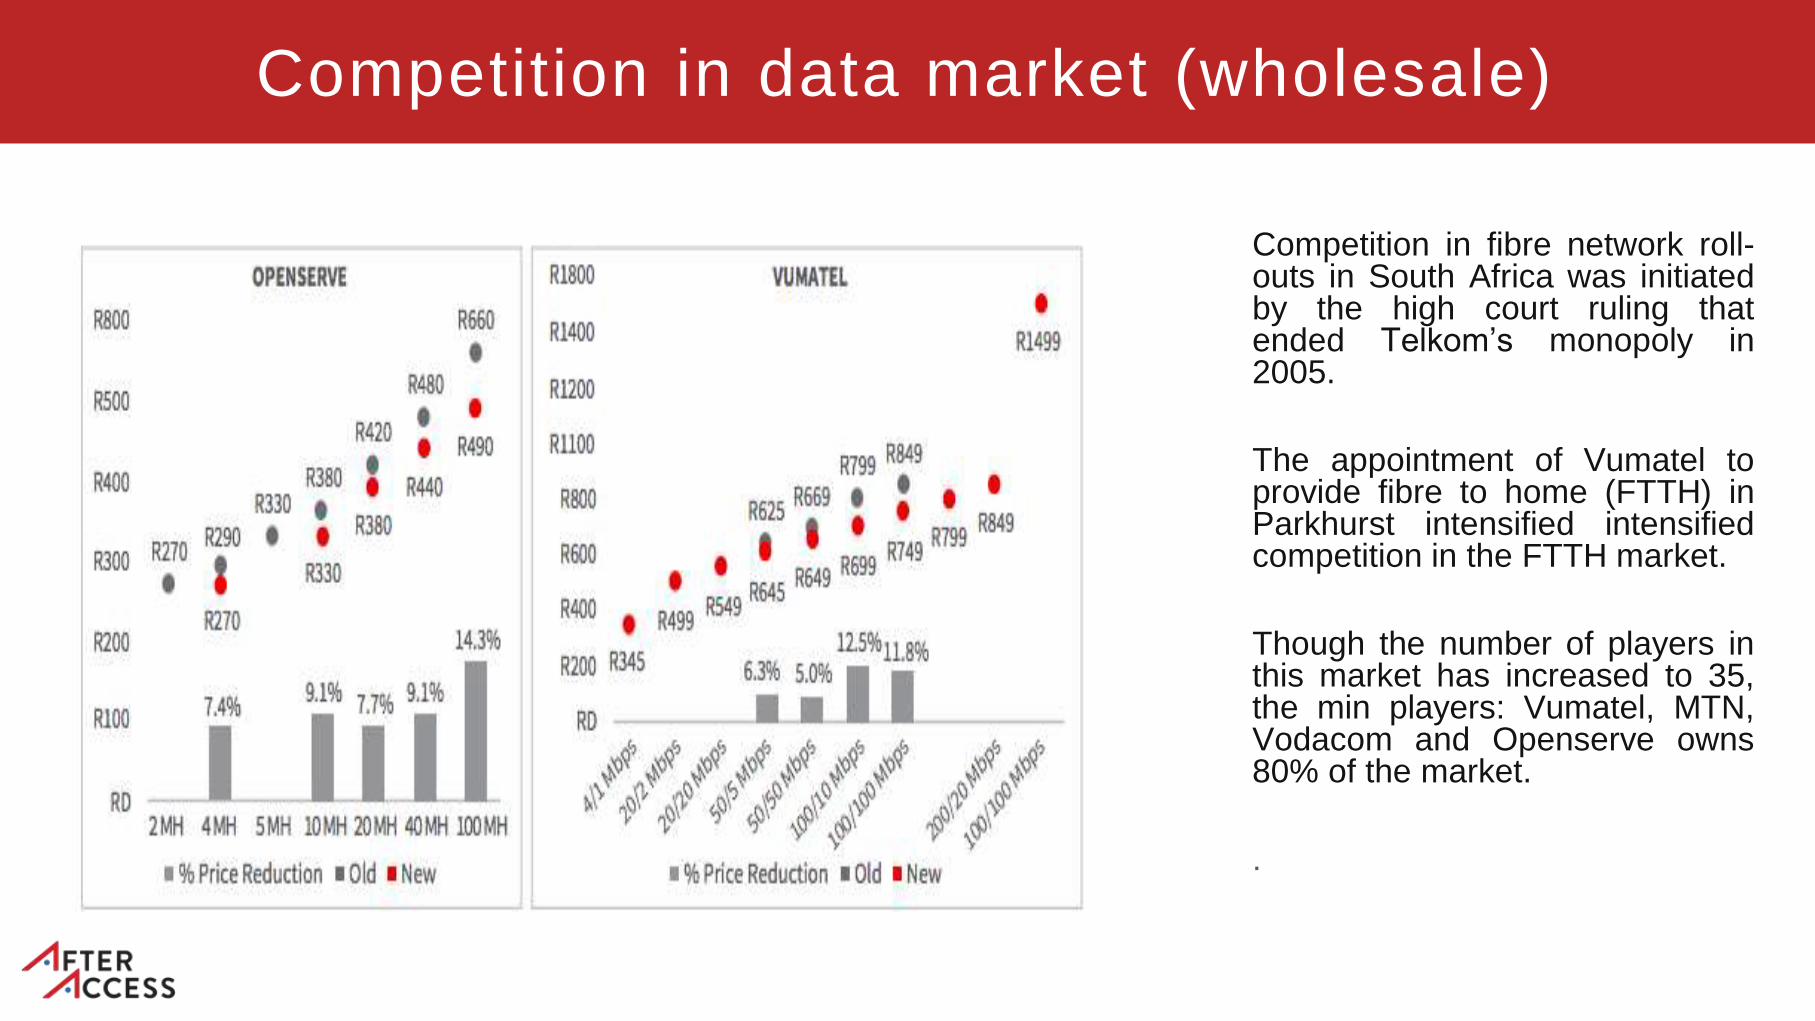
Competition in fibre network roll-outs in South Africa was initiatedby the high court ruling thatended Telkom’s monopoly in2005.
The appointment of Vumatel toprovide fibre to home (FTTH) inParkhurst intensified intensifiedcompetition in the FTTH market.
Though the number of players inthis market has increased to 35,the min players: Vumatel, MTN,Vodacom and Openserve owns80% of the market.
.

Mobile Market
16 15 1619
23 23
17 17
37 37 3735 34 34 35
31
1 2 2 2 3 3 4 5
47 4745 44
40 4044
47
0
12.5
25
37.5
50
2010 2011 2012 2013 2014 2015 2016 2017
Cell MTN Telkom Vodacom The south African mobilemarket is dominated bytwo players: Vodacom andMTN.
Using the HHI the marketis found to be highlyconcentrated which nindex higher than 2500.
Despite smaller players(Cell C and Telkom)adopting a number ofcompetitive strategiesthey have failed to gainsubstantial market share.
Pricing strategy and competition
90
112.5
135
157.5
180
202.5
Q2 2014 Q4 2014 Q2 2015 Q4 2015 Q2 2016 Q4 2016 Q2 2017 Q4 2017 Q2 2018
Cell C MTN Vodacom Telkom
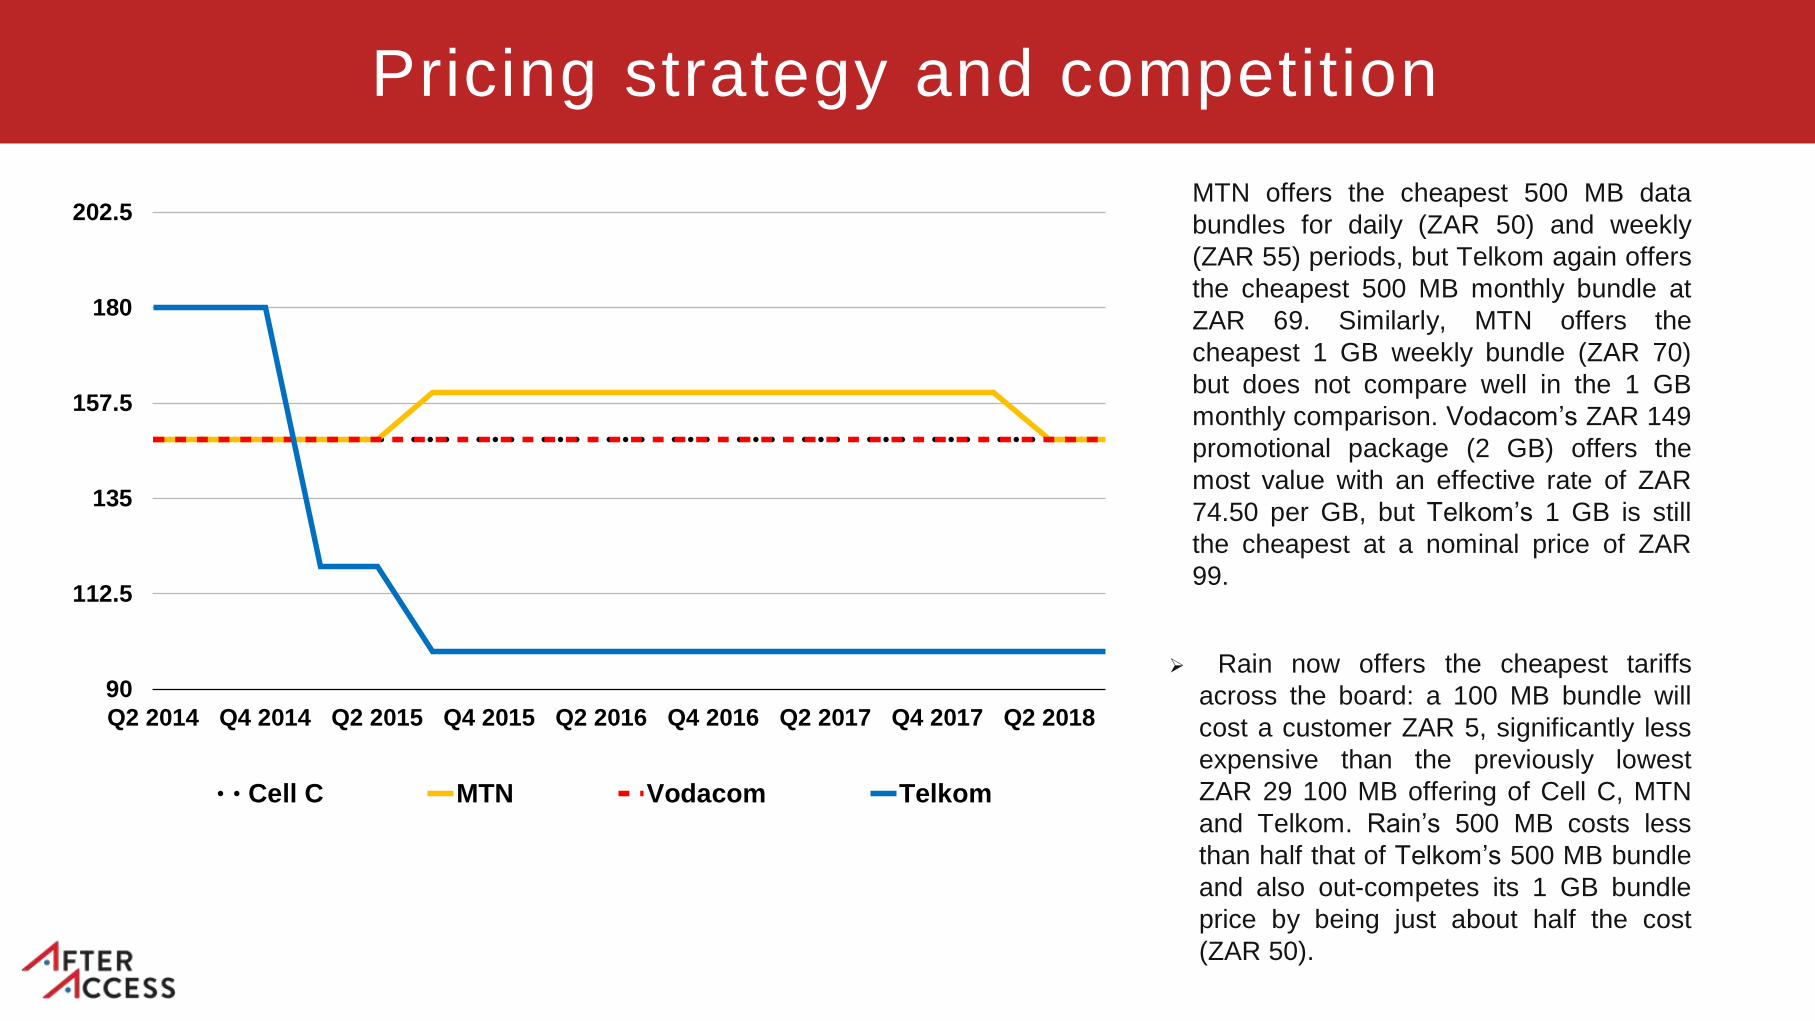
MTN offers the cheapest 500 MB data
bundles for daily (ZAR 50) and weekly
(ZAR 55) periods, but Telkom again offers
the cheapest 500 MB monthly bundle at
ZAR 69. Similarly, MTN offers the
cheapest 1 GB weekly bundle (ZAR 70)
but does not compare well in the 1 GB
monthly comparison. Vodacom’s ZAR 149
promotional package (2 GB) offers the
most value with an effective rate of ZAR
74.50 per GB, but Telkom’s 1 GB is still
the cheapest at a nominal price of ZAR
99.
Rain now offers the cheapest tariffs
across the board: a 100 MB bundle will
cost a customer ZAR 5, significantly less
expensive than the previously lowest
ZAR 29 100 MB offering of Cell C, MTN
and Telkom. Rain’s 500 MB costs less
than half that of Telkom’s 500 MB bundle
and also out-competes its 1 GB bundle
price by being just about half the cost
(ZAR 50).

Quality adjusted prices
Represents the ratio between the1GB data basket and the averagedownload and upload speeds,shows that the two dominantoperators Vodacom and MTN offerhigher quality, respectively.
In the same period Telkom’s qualitywas the lowest. However, since Q12016, it seems that smalleroperators improved their quality,catching up with dominantoperators in Q2 2016 (in line withincreased network investments).Vodacom SA’s high prices areaccompanied by higher Internetspeeds, compared to MTN SA andCell C, which are performing lesswell on the measure based onaverage download/upload speed (inMbps) divided by 1GB basketcosts.
Quality and Coverage
South Africa is connected to six submarine cables.
Telkom, Liquid Telecom South Africa (previously
Neotel) and Broadband Infraco have made considerable
backbone and backhaul investment over the past
decade, giving South Africa the most extensive
coverage in the continent
Supplemented by recent expansion of fibre networks in
larger metropolitan areas
Mobile operator investments
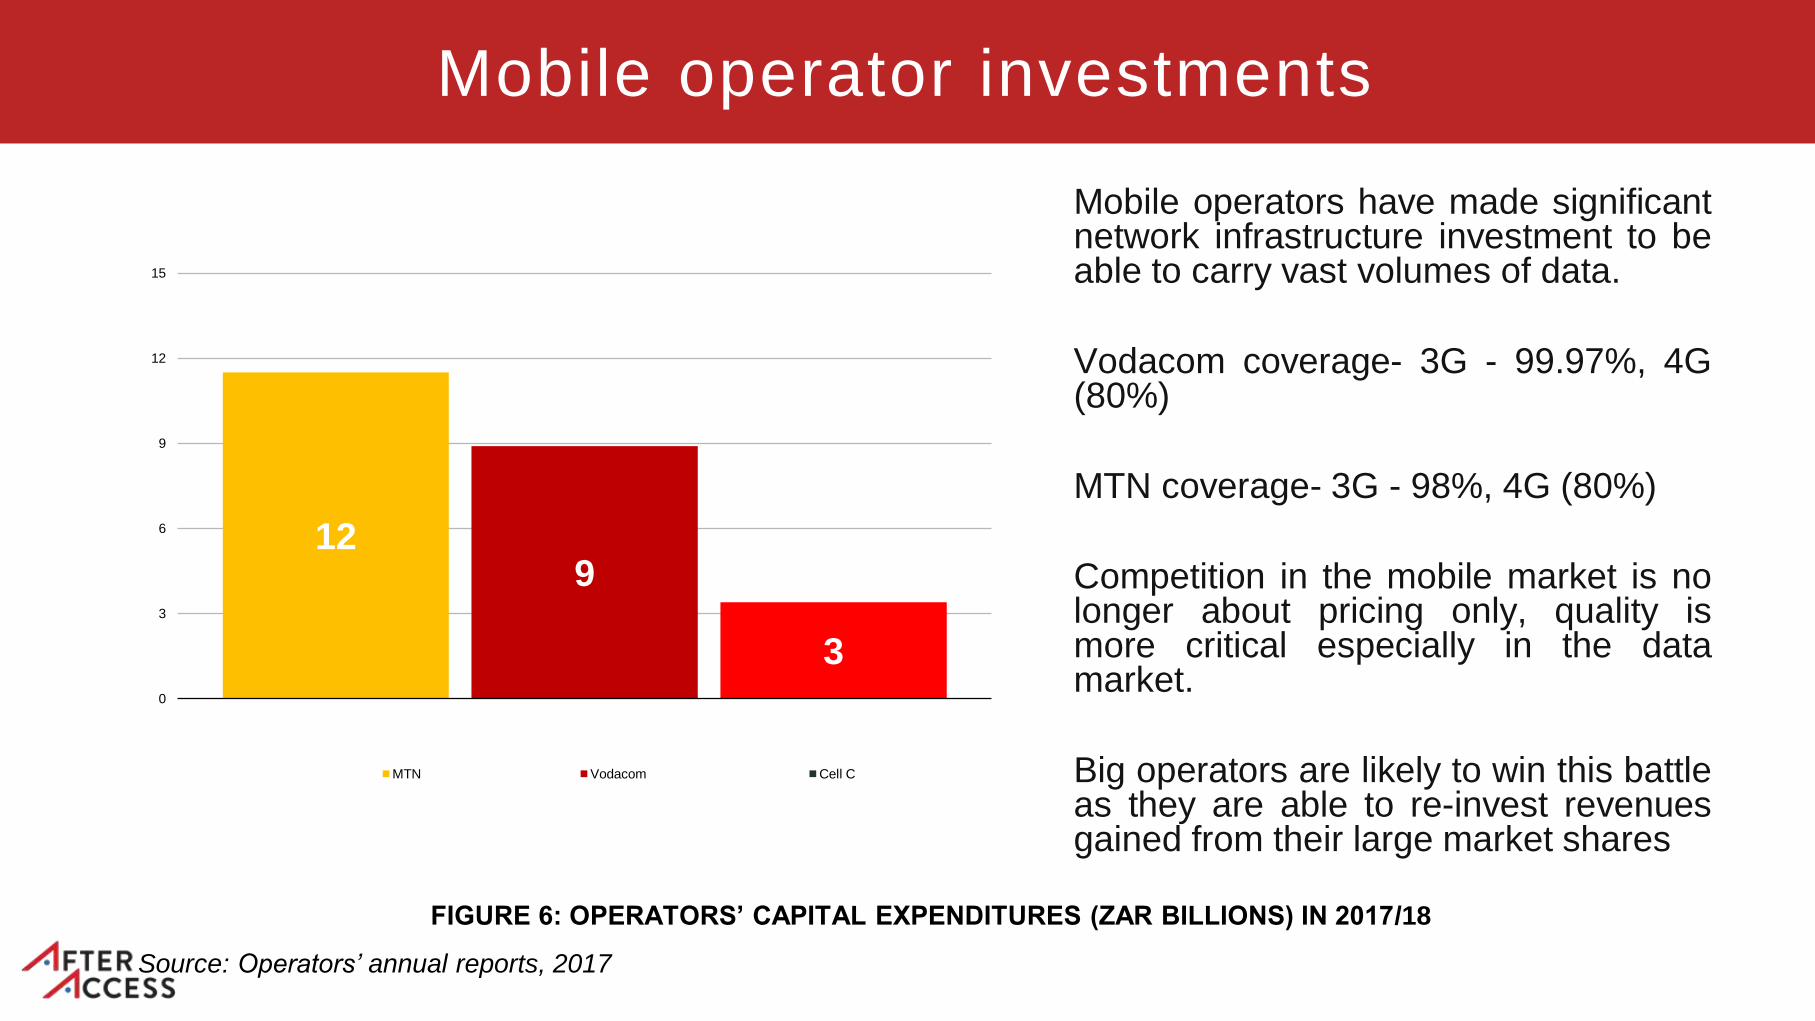
FIGURE 6: OPERATORS’ CAPITAL EXPENDITURES (ZAR BILLIONS) IN 2017/18
Source: Operators’ annual reports, 2017
129
30
3
6
9
12
15
MTN Vodacom Cell C
Mobile operators have made significantnetwork infrastructure investment to beable to carry vast volumes of data.
Vodacom coverage- 3G - 99.97%, 4G(80%)
MTN coverage- 3G - 98%, 4G (80%)
Competition in the mobile market is nolonger about pricing only, quality ismore critical especially in the datamarket.
Big operators are likely to win this battleas they are able to re-invest revenuesgained from their large market shares

Download speed in ZA vs Rest of the World
(Speedchecker)
South Africa performs well in
comparison to other African
countries.
download speeds in South
Africa have been improving
due to innovations and
technological developments.
A development which can
be associated with
investments by
telecommunication
Related Documents