Joshua Patterson, Data Science MD Meetup May Meeting @datametrician DATA SCIENCE ON GPU

Welcome message from author
This document is posted to help you gain knowledge. Please leave a comment to let me know what you think about it! Share it to your friends and learn new things together.
Transcript
Joshua Patterson, Data Science MD Meetup May Meeting
@datametrician
DATA SCIENCE ON GPU
AGENDA
• Hadoop/Spark
• GPU Applications
• Integrated GPU Acceleration
• Cyber Security
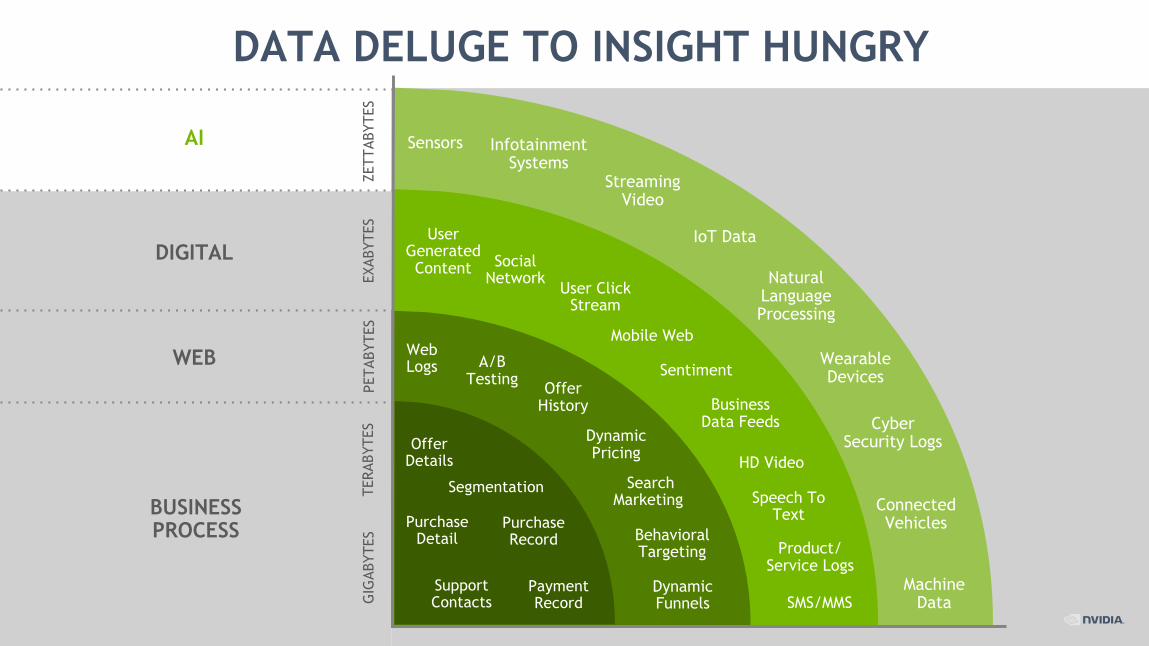
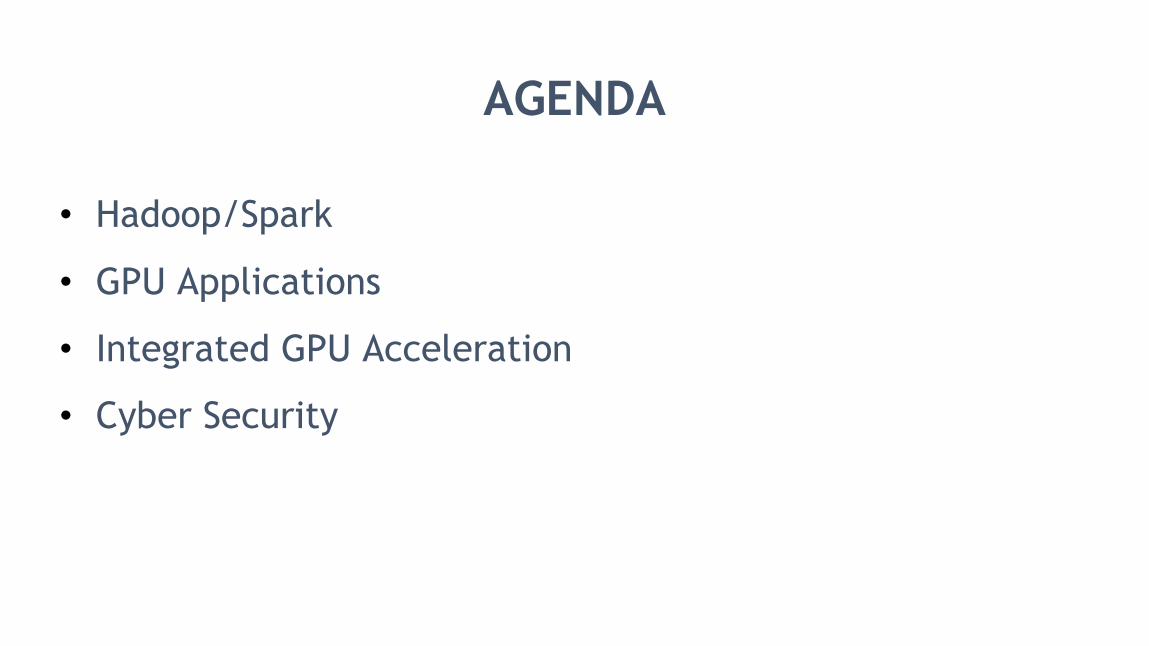
DATA DELUGE TO INSIGHT HUNGRY
• INCREASING DATA VARIETY
Search Marketing
Behavioral Targeting
Dynamic Funnels
User Generated Content
Mobile Web
SMS/MMS
Sentiment
HD Video
Speech To Text
Product/Service Logs
Social Network
Business Data Feeds
User Click Stream
Sensors Infotainment Systems
Wearable Devices
CyberSecurity Logs
ConnectedVehicles
Machine Data
IoT Data
Dynamic Pricing
Payment Record
Purchase Detail
Purchase Record
Support Contacts
Segmentation
Offer Details
Web Logs
Offer History
A/B Testing
BUSINESS PROCESS
PETA
BYTE
STE
RABY
TES
GIG
ABYT
ESEX
ABYT
ESZE
TTAB
YTES
Streaming Video
Natural Language Processing
WEB
DIGITAL
AI
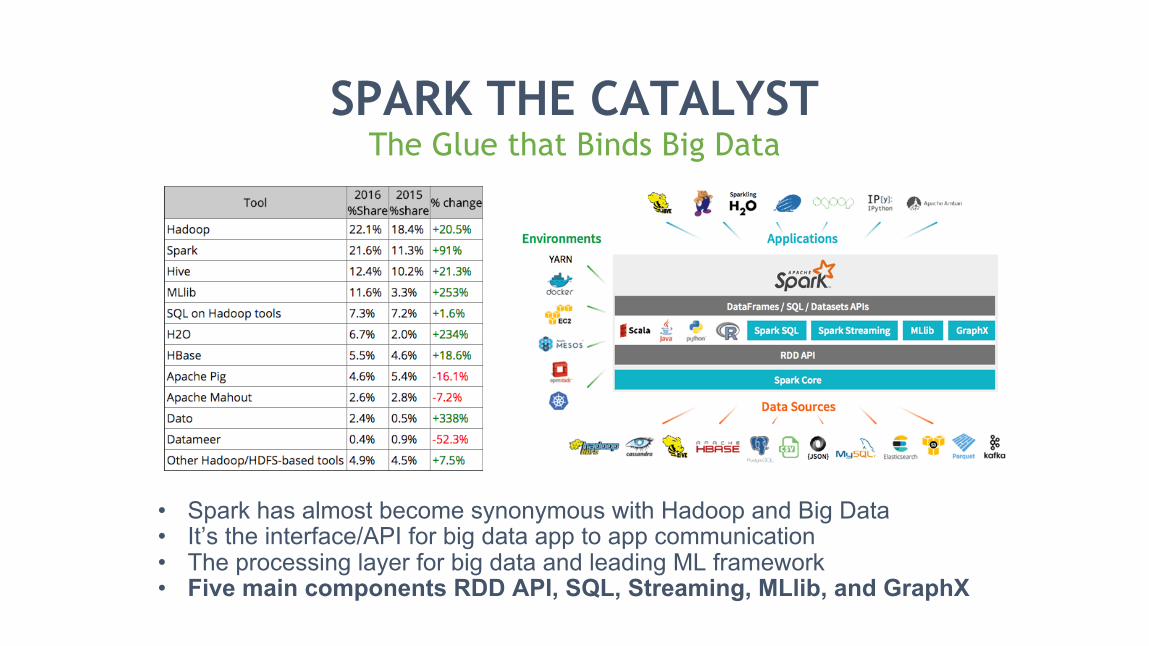
SPARK THE CATALYSTThe Glue that Binds Big Data
• Spark has almost become synonymous with Hadoop and Big Data• It’s the interface/API for big data app to app communication• The processing layer for big data and leading ML framework• Five main components RDD API, SQL, Streaming, MLlib, and GraphX
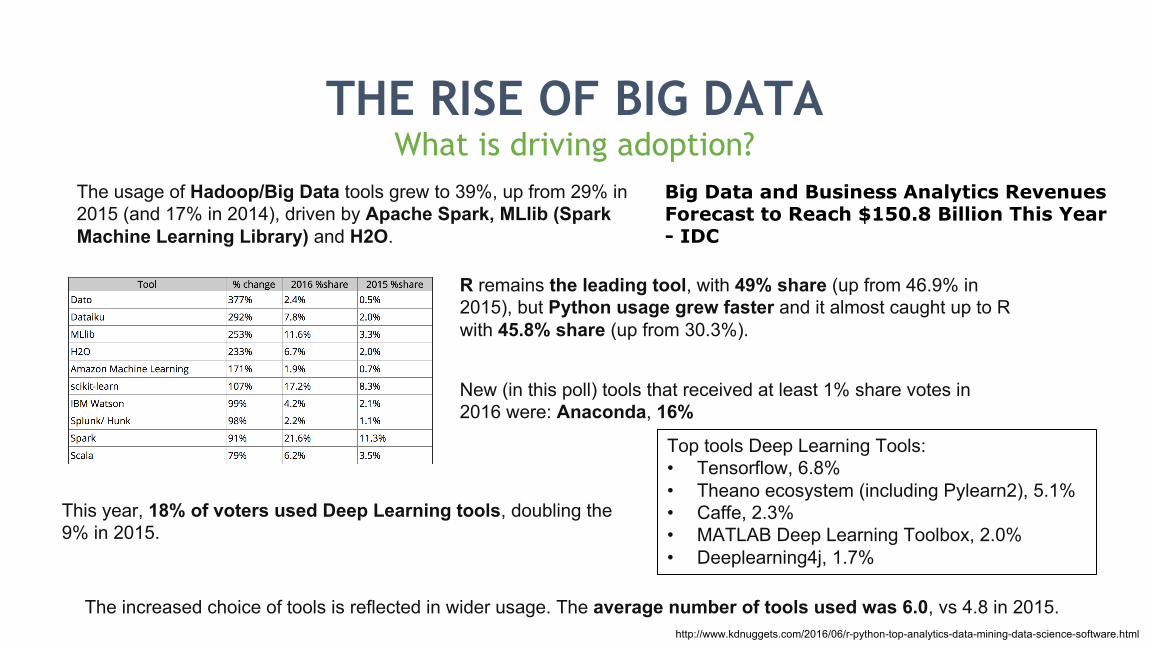
THE RISE OF BIG DATAWhat is driving adoption?
The usage of Hadoop/Big Data tools grew to 39%, up from 29% in 2015 (and 17% in 2014), driven by Apache Spark, MLlib (Spark Machine Learning Library) and H2O.
R remains the leading tool, with 49% share (up from 46.9% in 2015), but Python usage grew faster and it almost caught up to R with 45.8% share (up from 30.3%).
New (in this poll) tools that received at least 1% share votes in 2016 were: Anaconda, 16%
This year, 18% of voters used Deep Learning tools, doubling the 9% in 2015.
Top tools Deep Learning Tools:• Tensorflow, 6.8%• Theano ecosystem (including Pylearn2), 5.1%• Caffe, 2.3%• MATLAB Deep Learning Toolbox, 2.0%• Deeplearning4j, 1.7%
The increased choice of tools is reflected in wider usage. The average number of tools used was 6.0, vs 4.8 in 2015.http://www.kdnuggets.com/2016/06/r-python-top-analytics-data-mining-data-science-software.html
Big Data and Business Analytics Revenues Forecast to Reach $150.8 Billion This Year- IDC
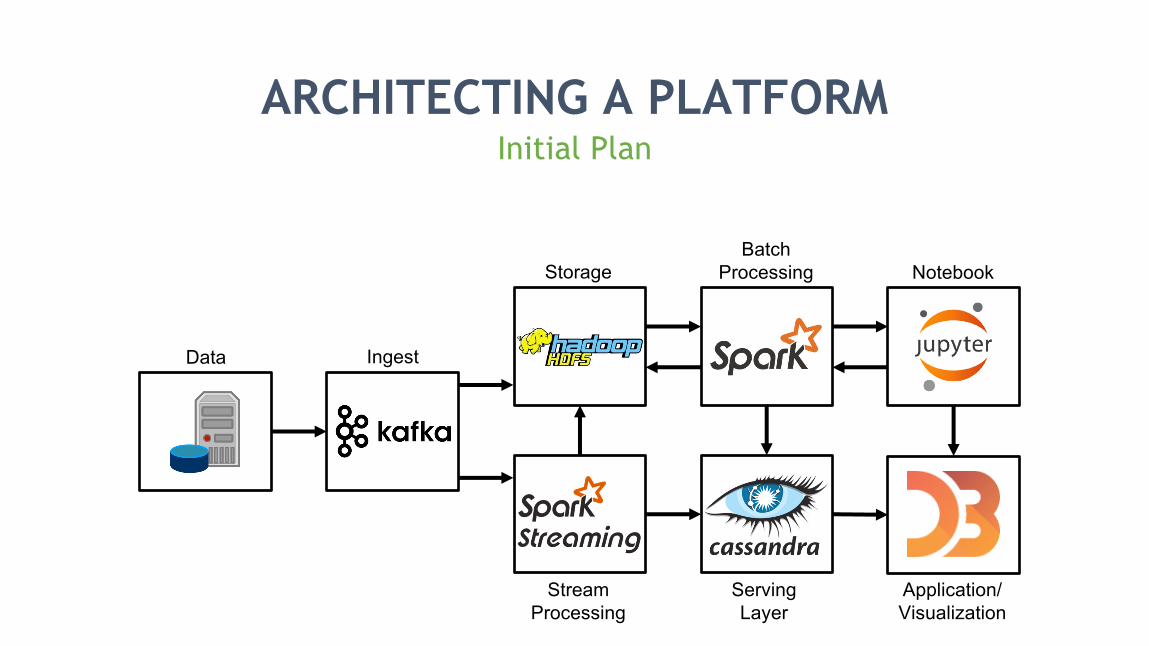
Application/Visualization
ARCHITECTING A PLATFORMInitial Plan
Data Ingest
StorageBatch
Processing
Stream Processing
Serving Layer
Notebook
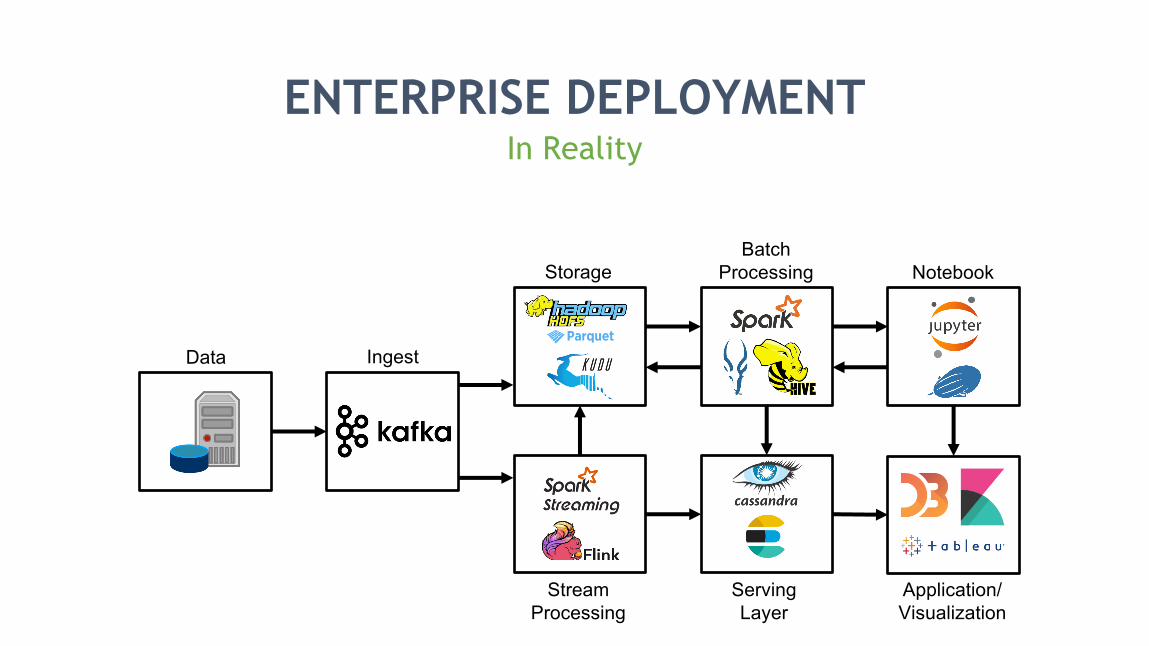
ENTERPRISE DEPLOYMENTIn Reality
Data Ingest
StorageBatch
Processing
Stream Processing
Serving Layer
Application/Visualization
Notebook
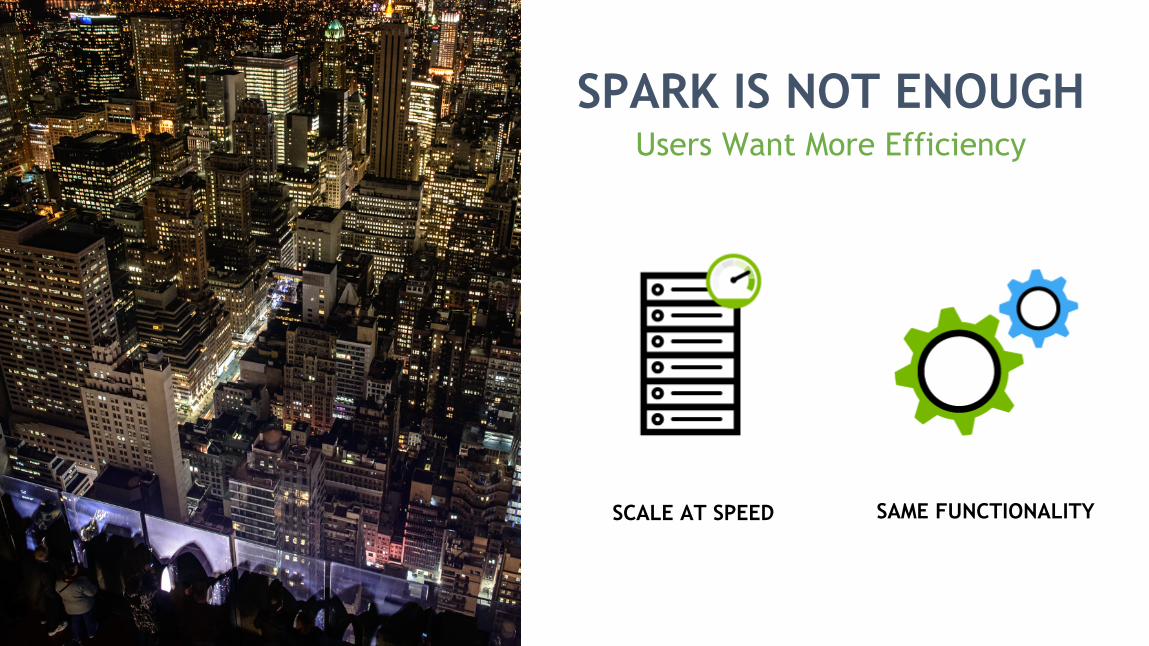
SPARK IS NOT ENOUGHUsers Want More Efficiency
SCALE AT SPEED SAME FUNCTIONALITY
9
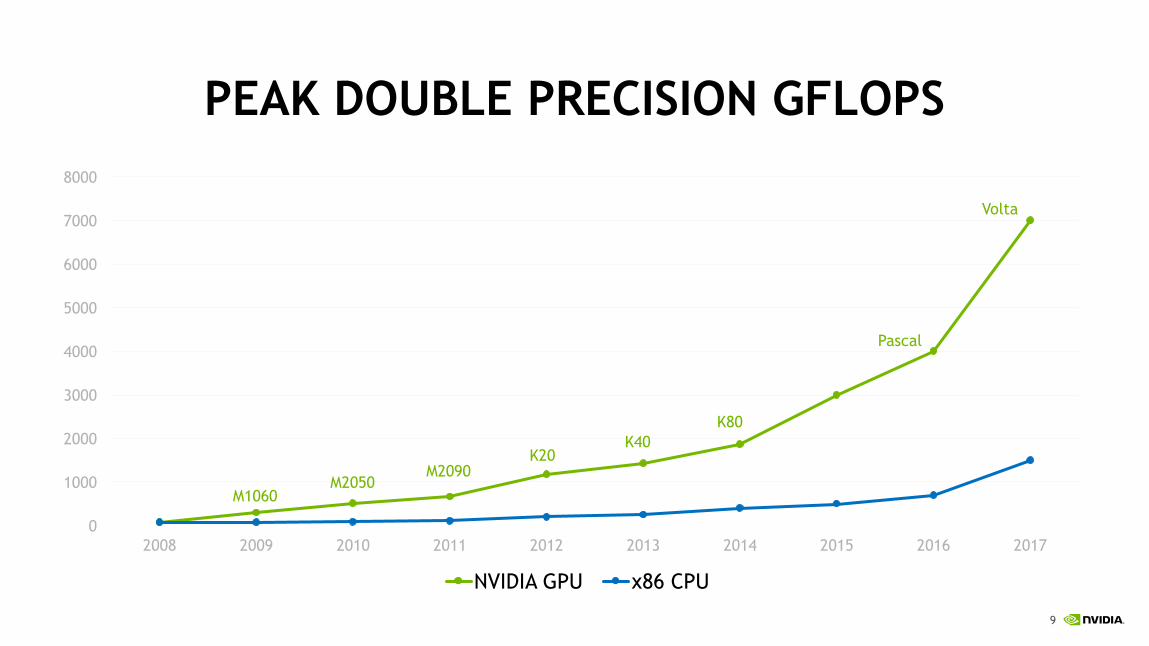
PEAK DOUBLE PRECISION GFLOPS
0
1000
2000
3000
4000
5000
6000
7000
8000
2008 2009 2010 2011 2012 2013 2014 2015 2016 2017
NVIDIA GPU x86 CPU
M1060M2050
M2090K20
K40K80
Pascal
Volta
10
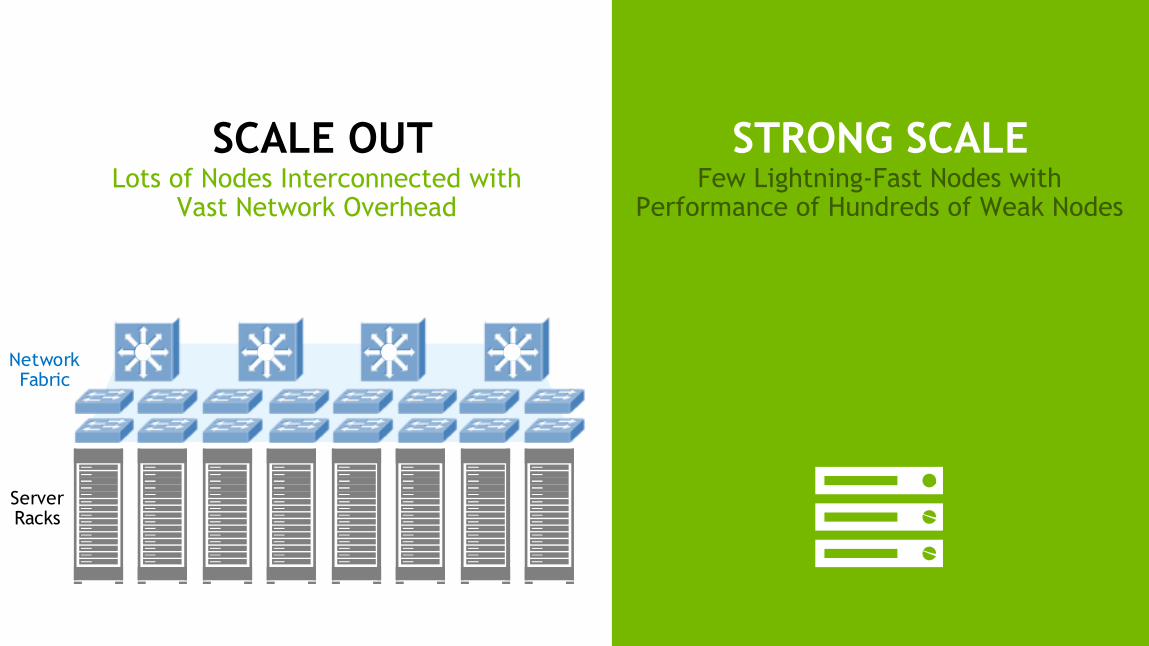
SCALE OUTLots of Nodes Interconnected with
Vast Network Overhead
STRONG SCALEFew Lightning-Fast Nodes with
Performance of Hundreds of Weak Nodes
!
Network
Fabric
Server
Racks
11
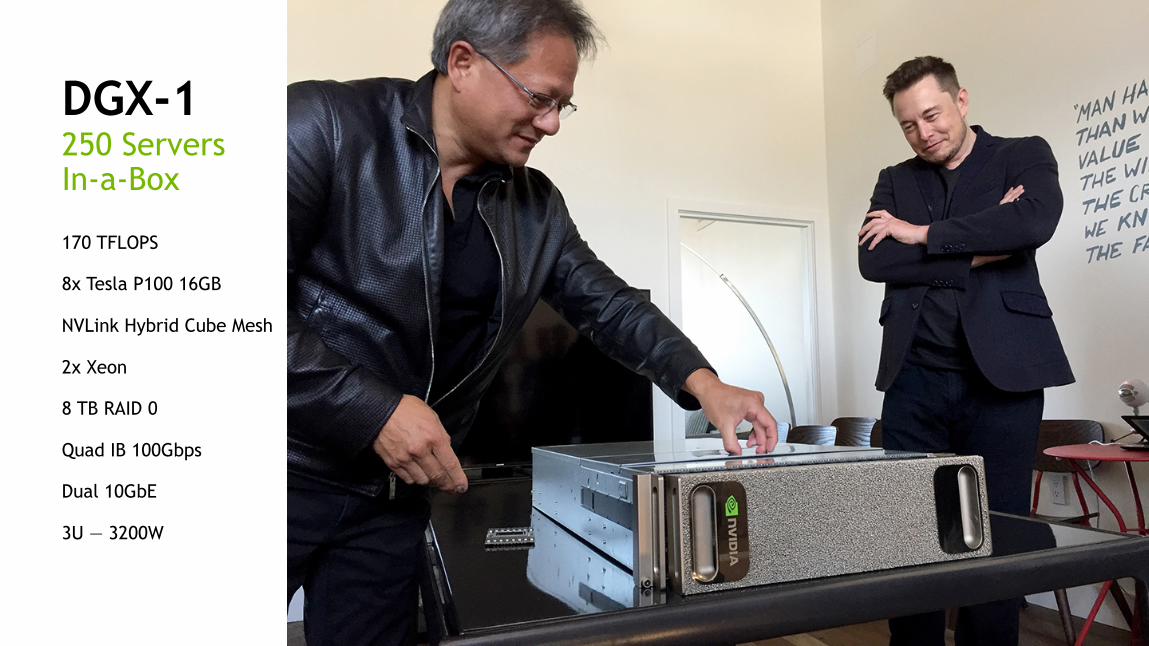
DGX-1250 Servers In-a-Box
170 TFLOPS
8x Tesla P100 16GB
NVLink Hybrid Cube Mesh
2x Xeon
8 TB RAID 0
Quad IB 100Gbps
Dual 10GbE
3U — 3200W
12
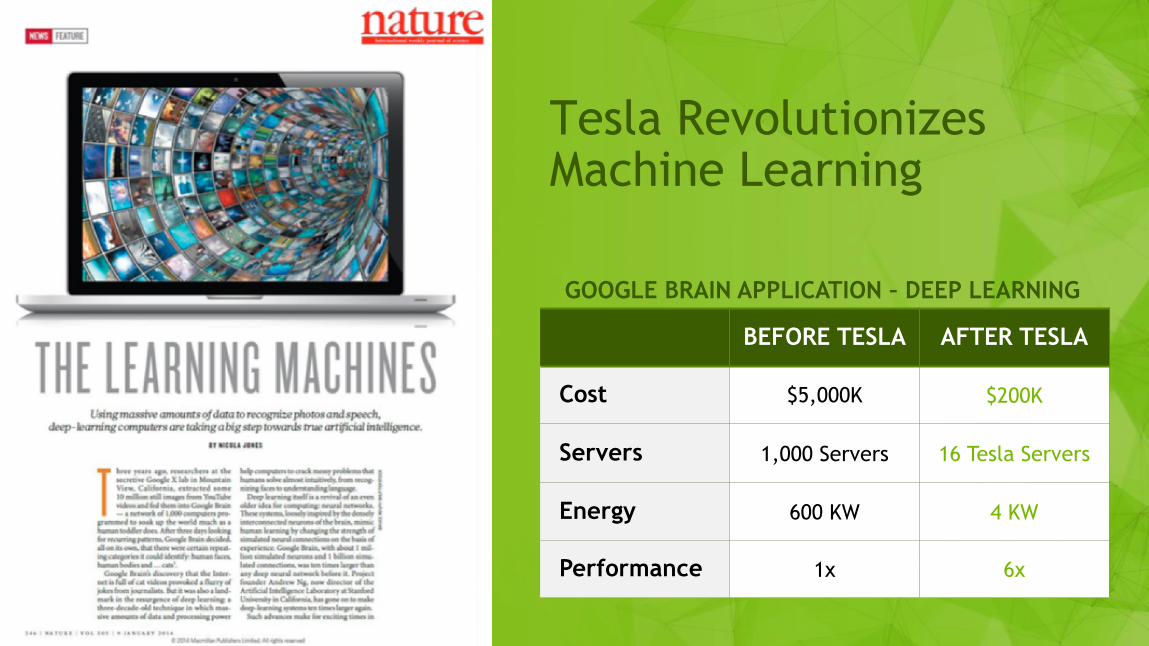
Tesla Revolutionizes Machine Learning
GOOGLE BRAIN APPLICATION – DEEP LEARNING
BEFORE TESLA AFTER TESLA
Cost $5,000K $200K
Servers 1,000 Servers 16 Tesla Servers
Energy 600 KW 4 KW
Performance 1x 6x
13
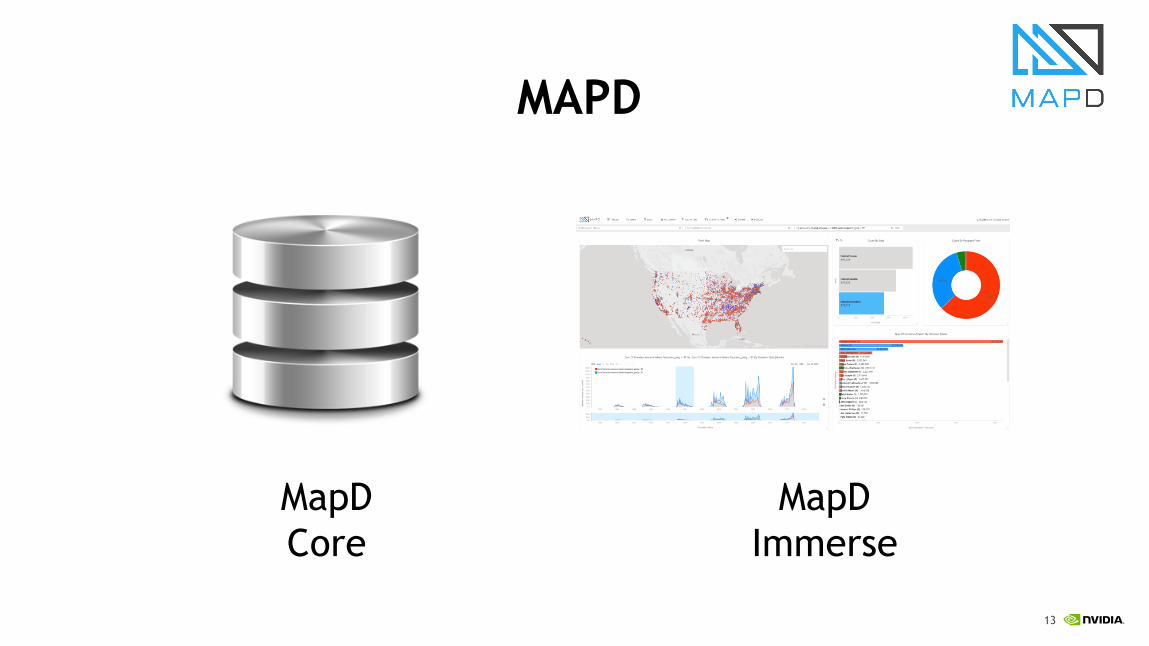
MAPD
MapDCore
MapDImmerse
14
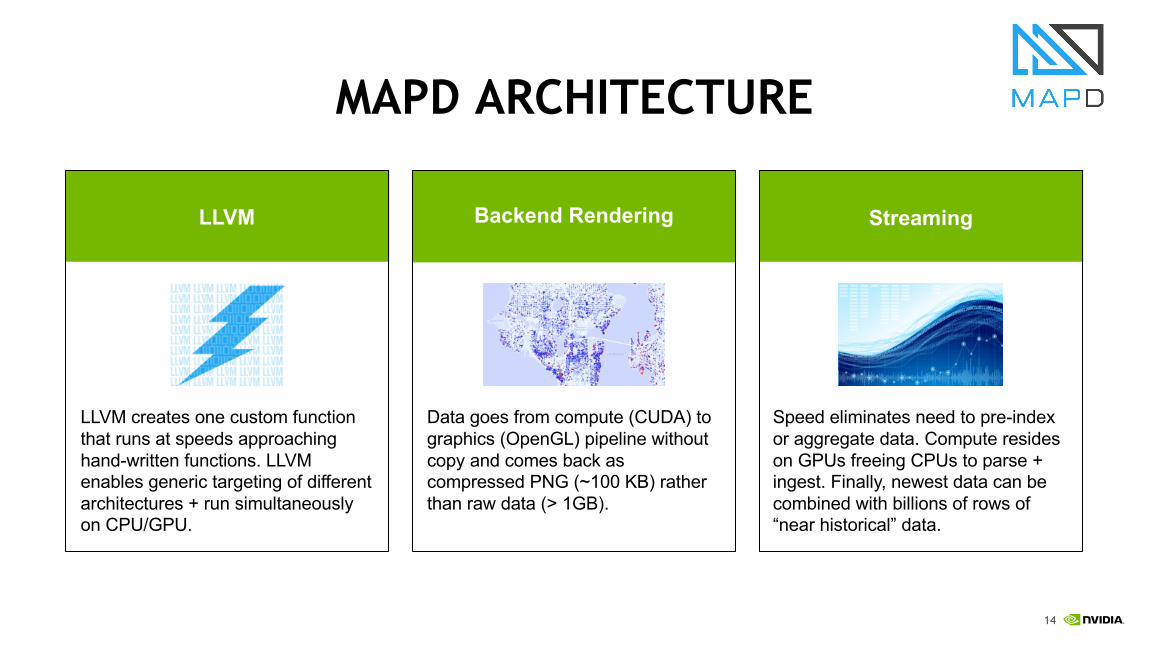
MAPD ARCHITECTURE
LLVM Backend Rendering Streaming
LLVM creates one custom function that runs at speeds approaching hand-written functions. LLVM enables generic targeting of different architectures + run simultaneously on CPU/GPU.
Speed eliminates need to pre-index or aggregate data. Compute resides on GPUs freeing CPUs to parse + ingest. Finally, newest data can be combined with billions of rows of “near historical” data.
Data goes from compute (CUDA) to graphics (OpenGL) pipeline without copy and comes back as compressed PNG (~100 KB) rather than raw data (> 1GB).
15
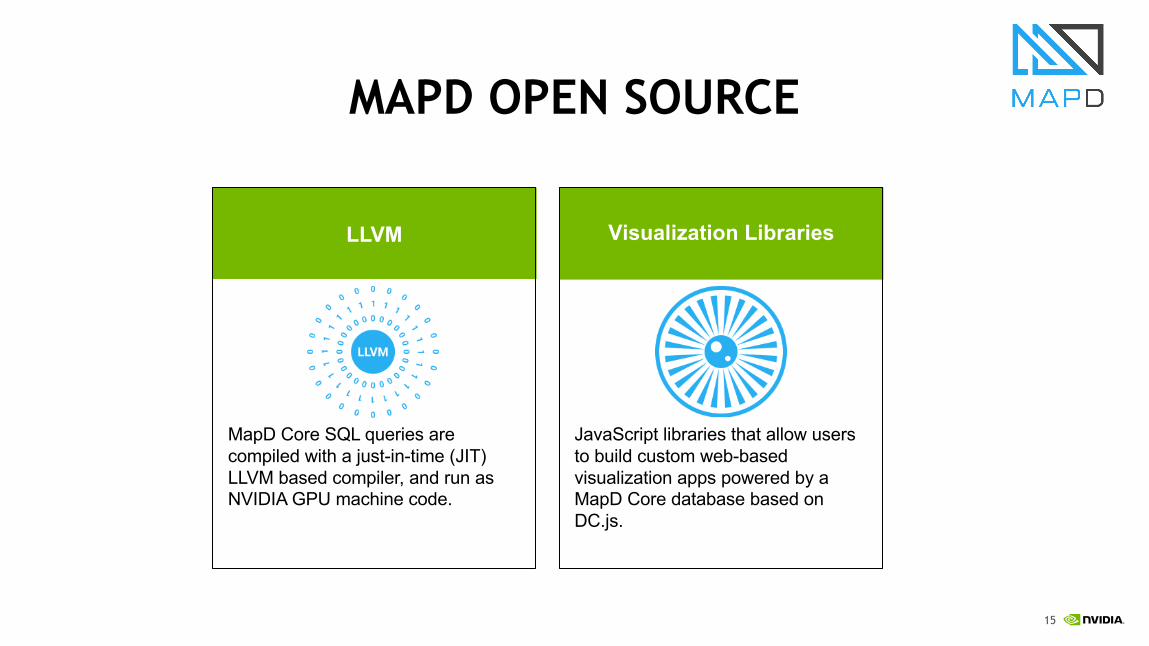
MAPD OPEN SOURCE
Visualization Libraries
JavaScript libraries that allow users to build custom web-based visualization apps powered by a MapD Core database based on DC.js.
LLVM
MapD Core SQL queries are compiled with a just-in-time (JIT) LLVM based compiler, and run as NVIDIA GPU machine code.
16
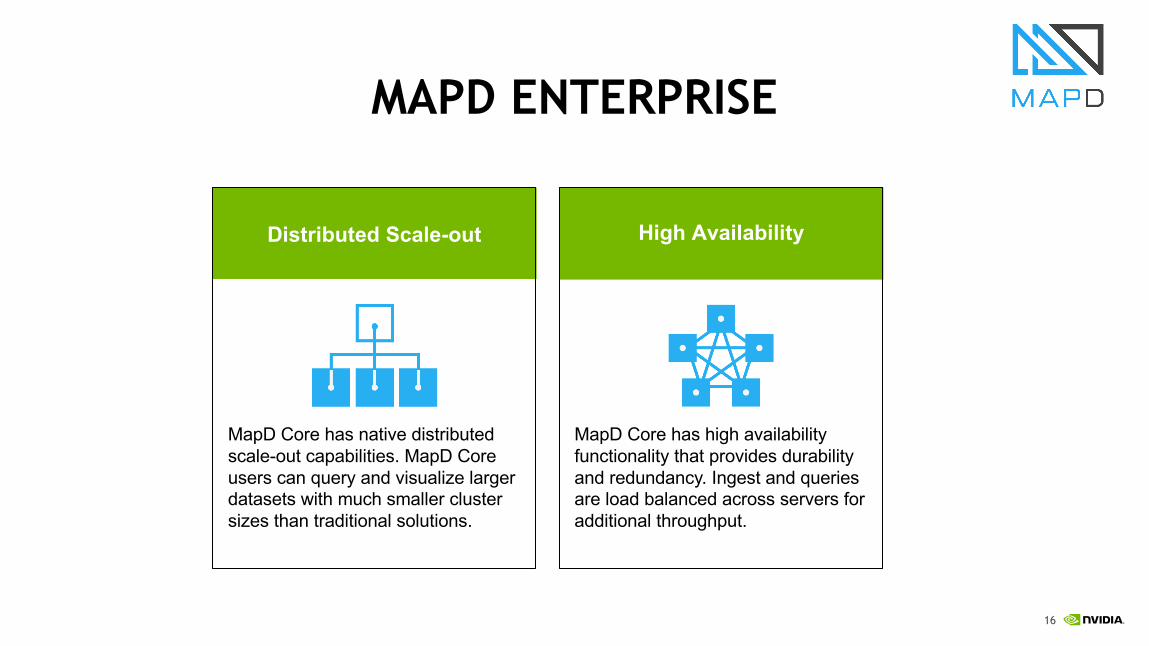
MAPD ENTERPRISE
Distributed Scale-out High Availability
MapD Core has native distributed scale-out capabilities. MapD Core users can query and visualize larger datasets with much smaller cluster sizes than traditional solutions.
MapD Core has high availability functionality that provides durability and redundancy. Ingest and queries are load balanced across servers for additional throughput.
17
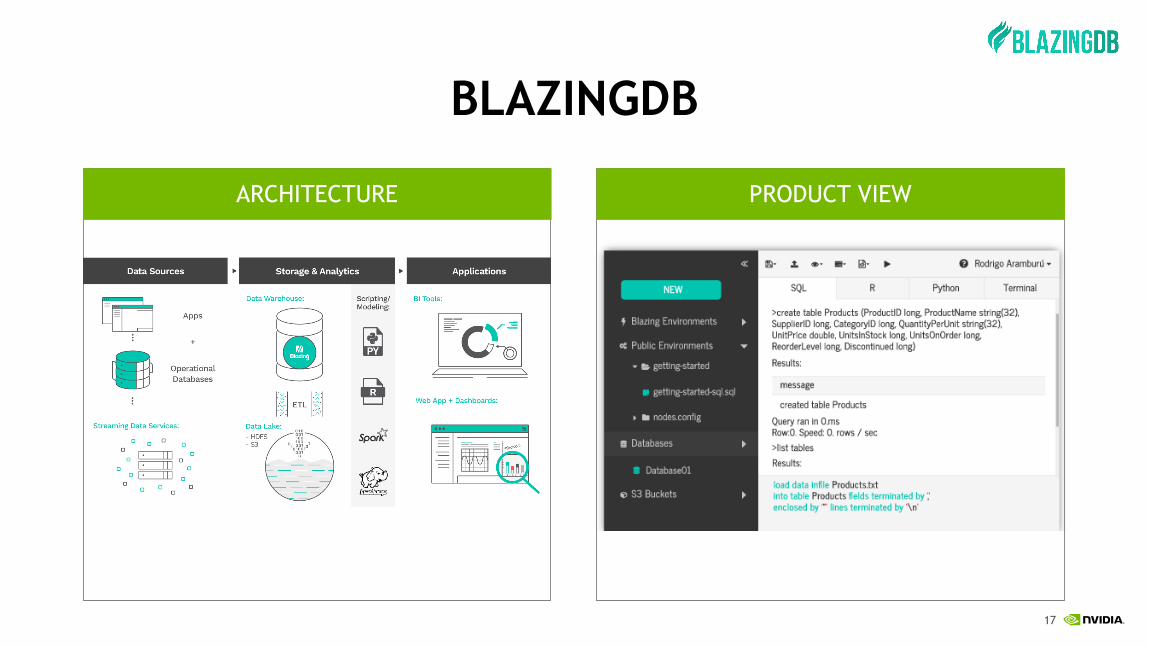
BLAZINGDB
ARCHITECTURE PRODUCT VIEW
18
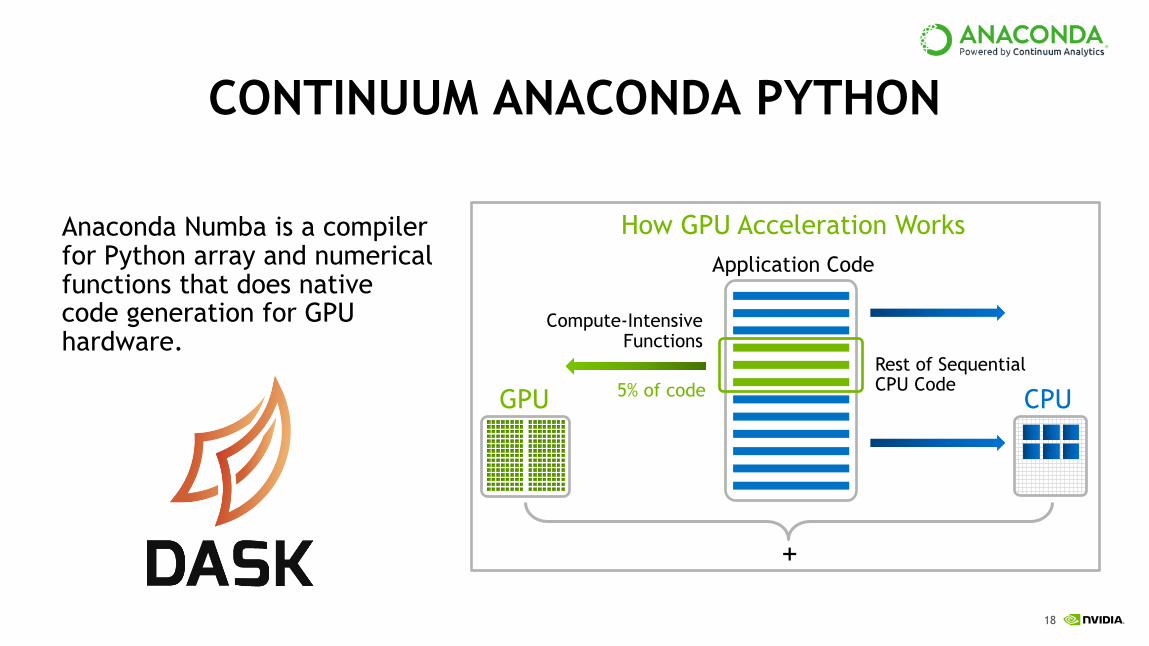
CONTINUUM ANACONDA PYTHON
Anaconda Numba is a compiler for Python array and numerical functions that does native code generation for GPU hardware.
How GPU Acceleration WorksApplication Code
Compute-Intensive Functions
Rest of SequentialCPU Code
GPU 5% of code
+
CPU
19
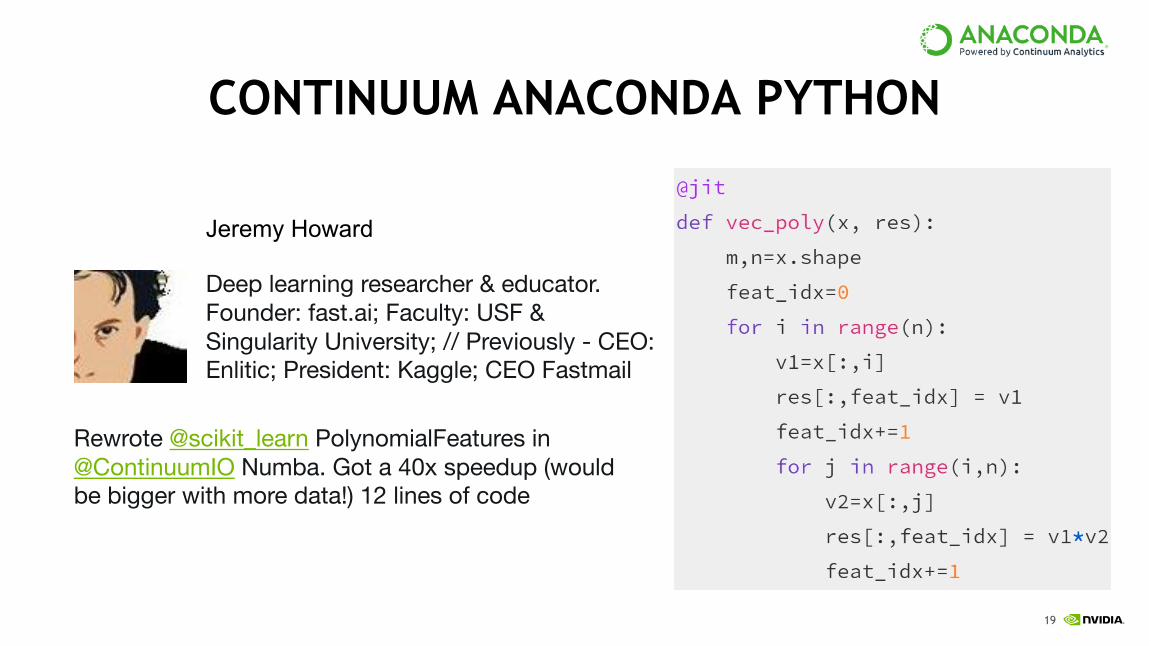
CONTINUUM ANACONDA PYTHON
Rewrote @scikit_learn PolynomialFeatures in @ContinuumIO Numba. Got a 40x speedup (would be bigger with more data!) 12 lines of code
Deep learning researcher & educator. Founder: fast.ai; Faculty: USF & Singularity University; // Previously - CEO: Enlitic; President: Kaggle; CEO Fastmail
Jeremy Howard
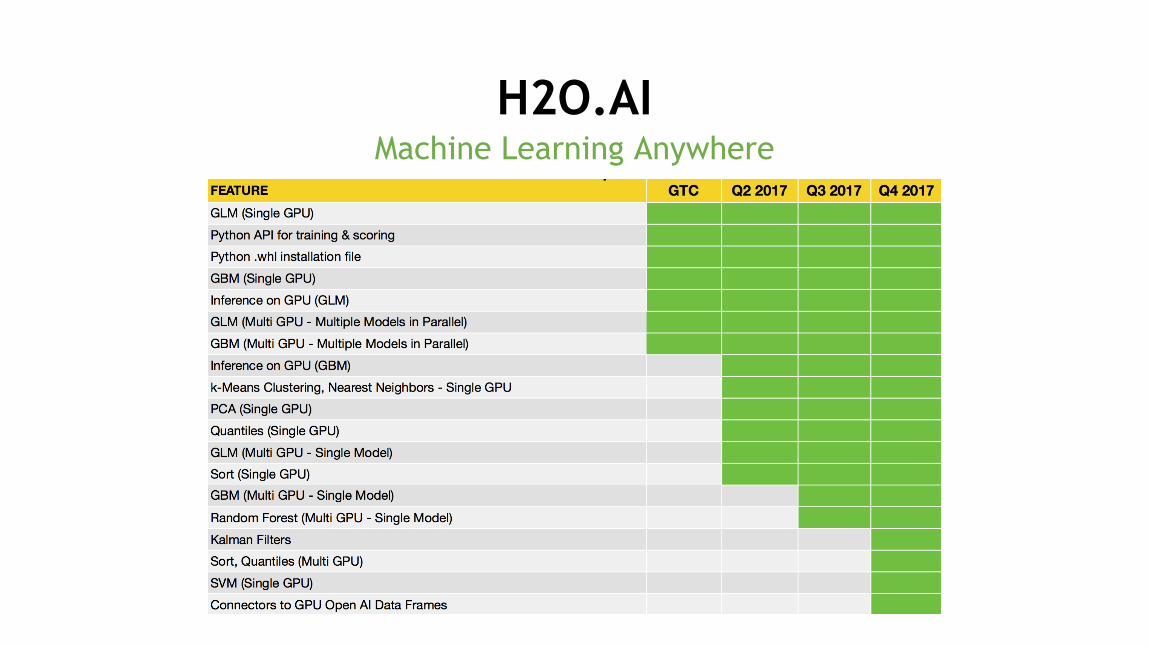
Machine Learning AnywhereH2O.AI
21
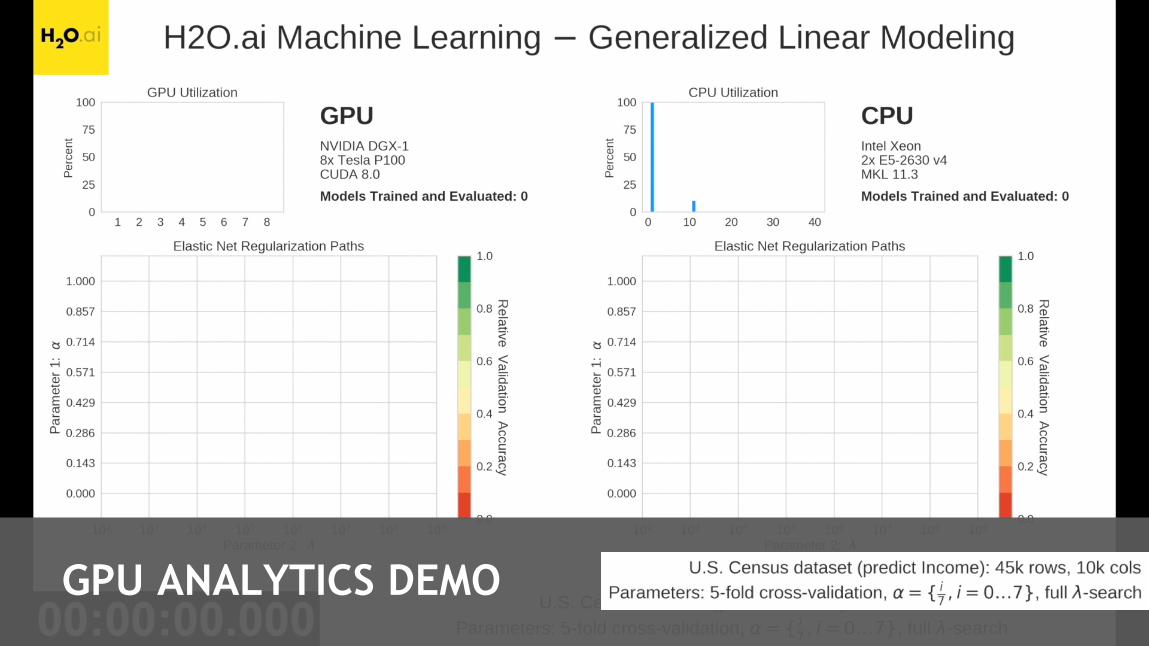
GPU ANALYTICS DEMO
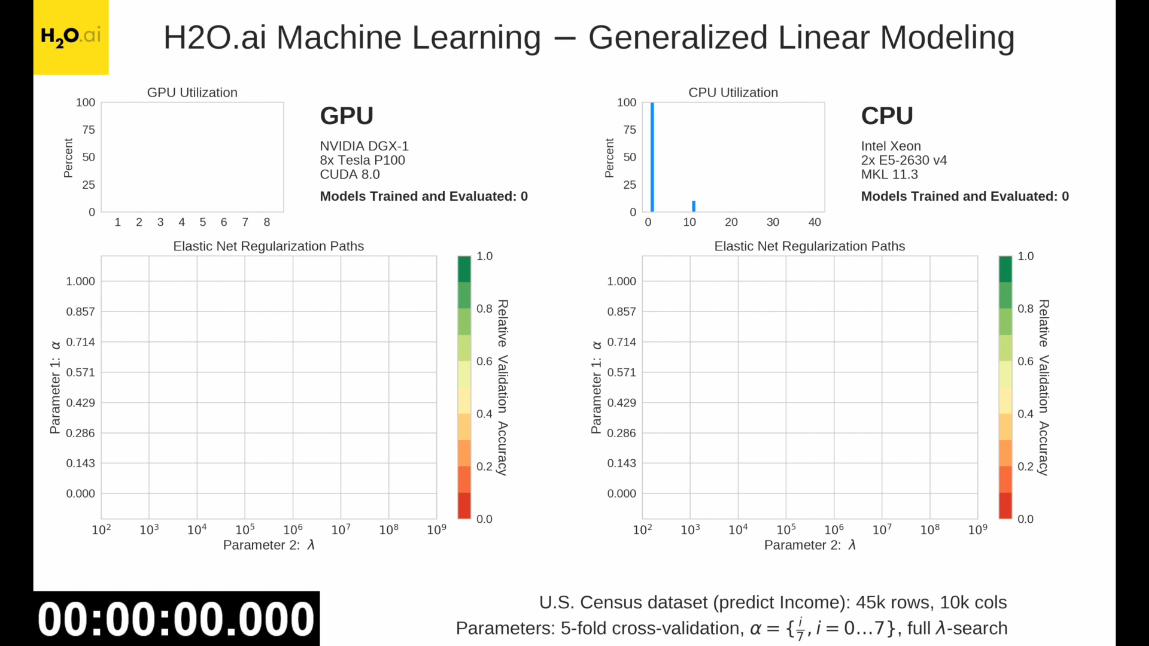
22
23
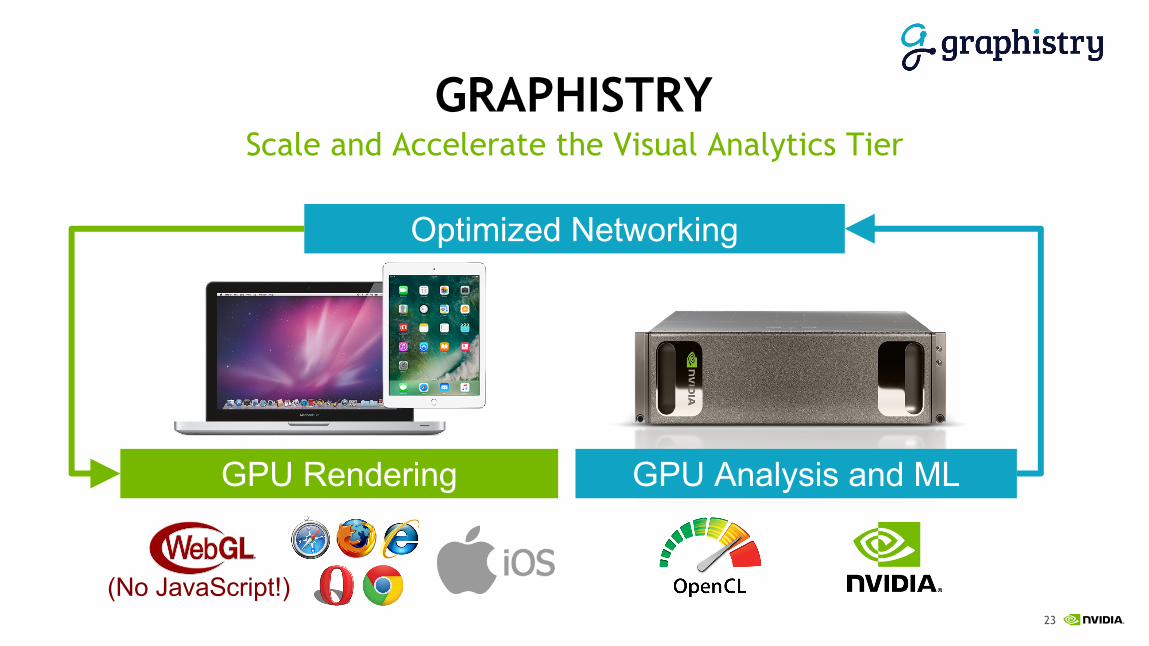
GRAPHISTRYScale and Accelerate the Visual Analytics Tier
Optimized Networking
GPU Analysis and MLGPU Rendering
(No JavaScript!)
Open-source GPU-accelerated graph analytics library
Multi-GPU optimized algorithms
Reduced cost and increased performance
Performance constantly improving
GUNROCK
25
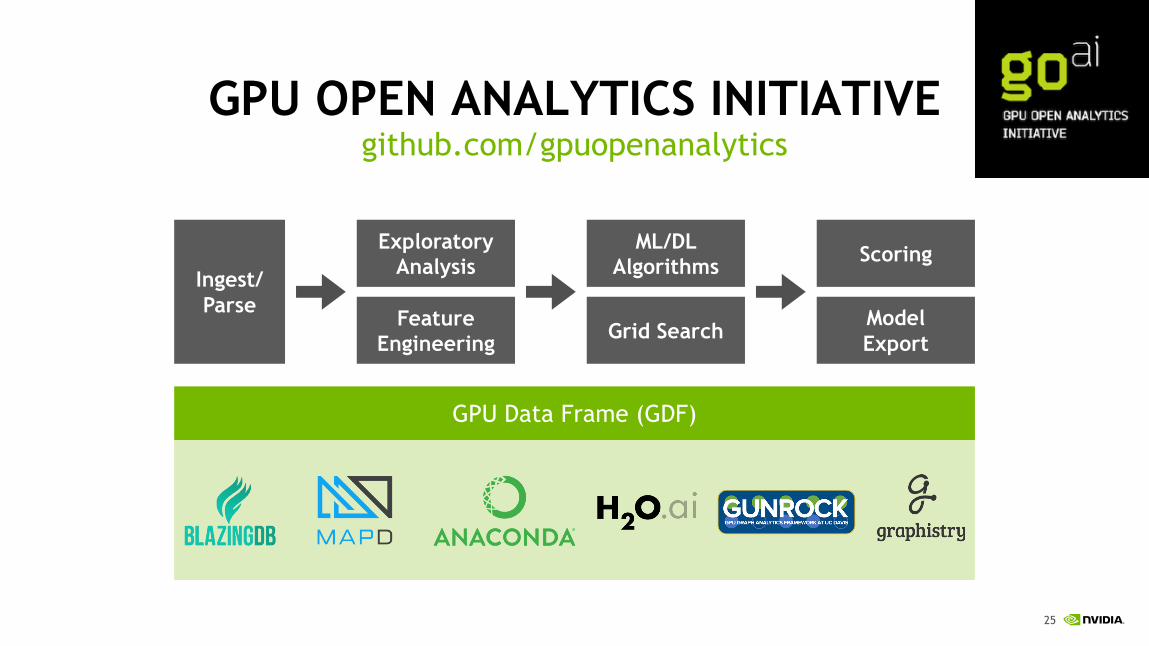
GPU OPEN ANALYTICS INITIATIVEgithub.com/gpuopenanalytics
GPU Data Frame (GDF)
Ingest/Parse
Exploratory Analysis
Feature Engineering
ML/DL Algorithms
Grid Search
Scoring
ModelExport
26
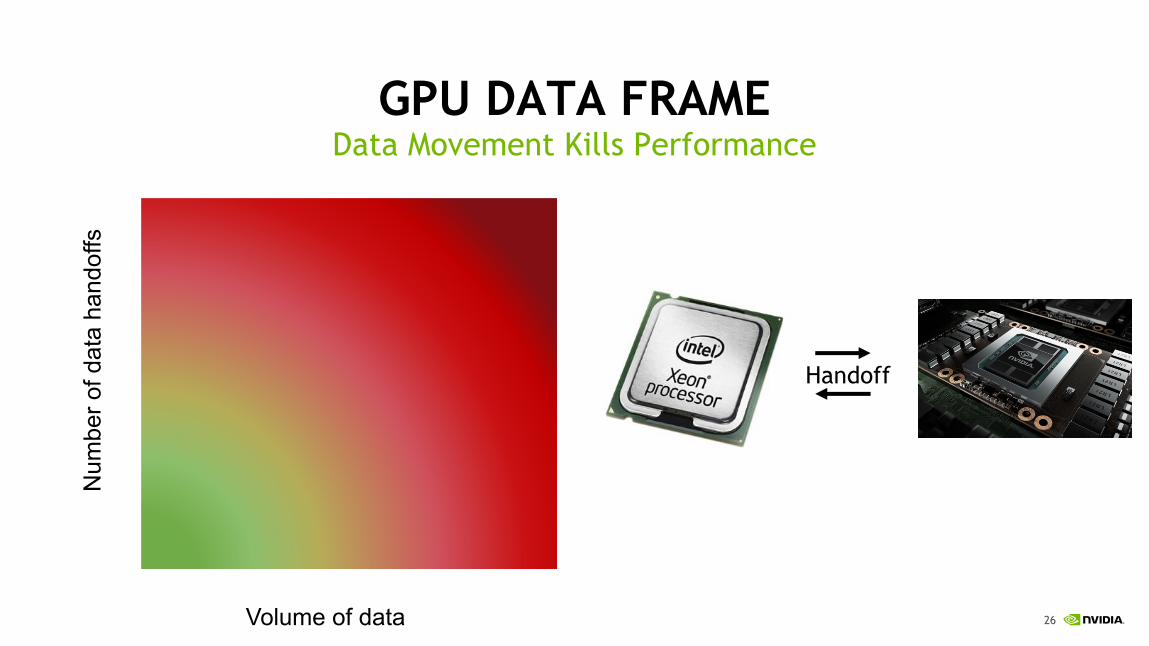
GPU DATA FRAMEData Movement Kills Performance
Volume of data
Num
ber o
f dat
a ha
ndof
fs
Handoff
27
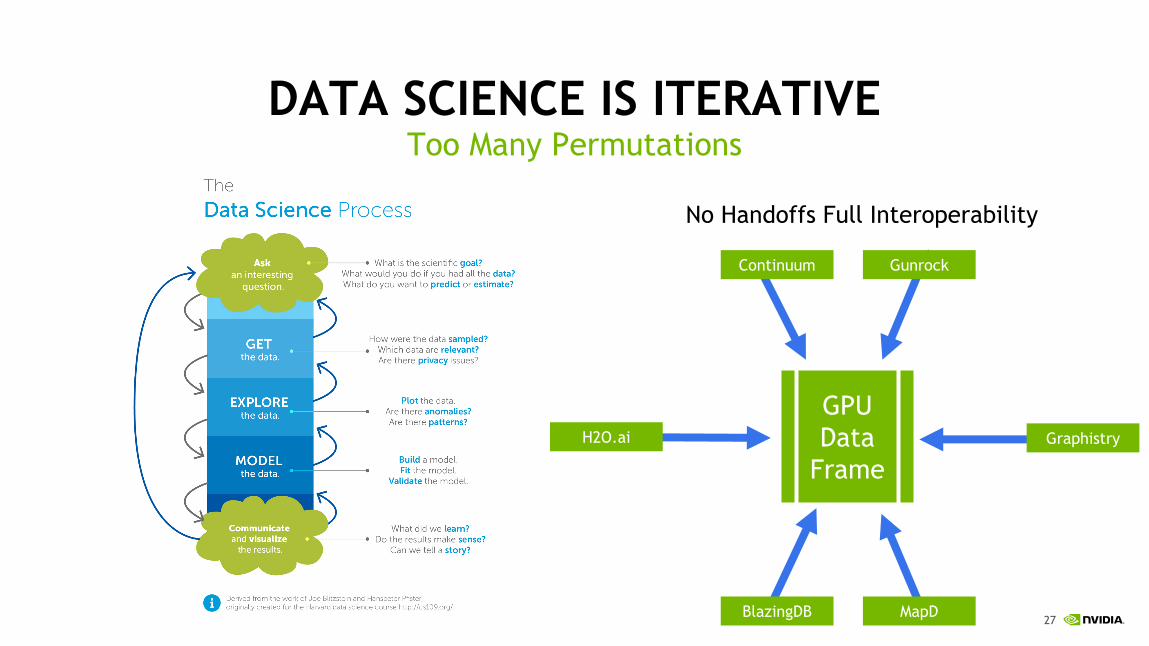
DATA SCIENCE IS ITERATIVEToo Many Permutations
No Handoffs Full Interoperability
H2O.ai
Continuum Gunrock
Graphistry
BlazingDB MapD
GPU Data
Frame
28
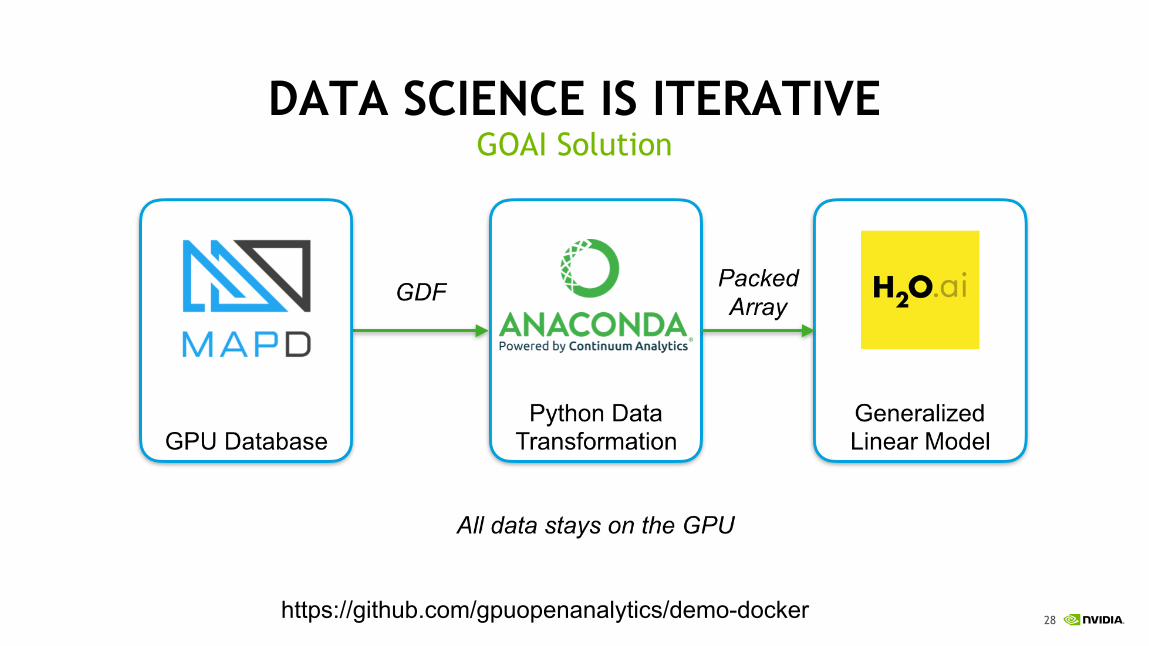
DATA SCIENCE IS ITERATIVEGOAI Solution
https://github.com/gpuopenanalytics/demo-docker
29
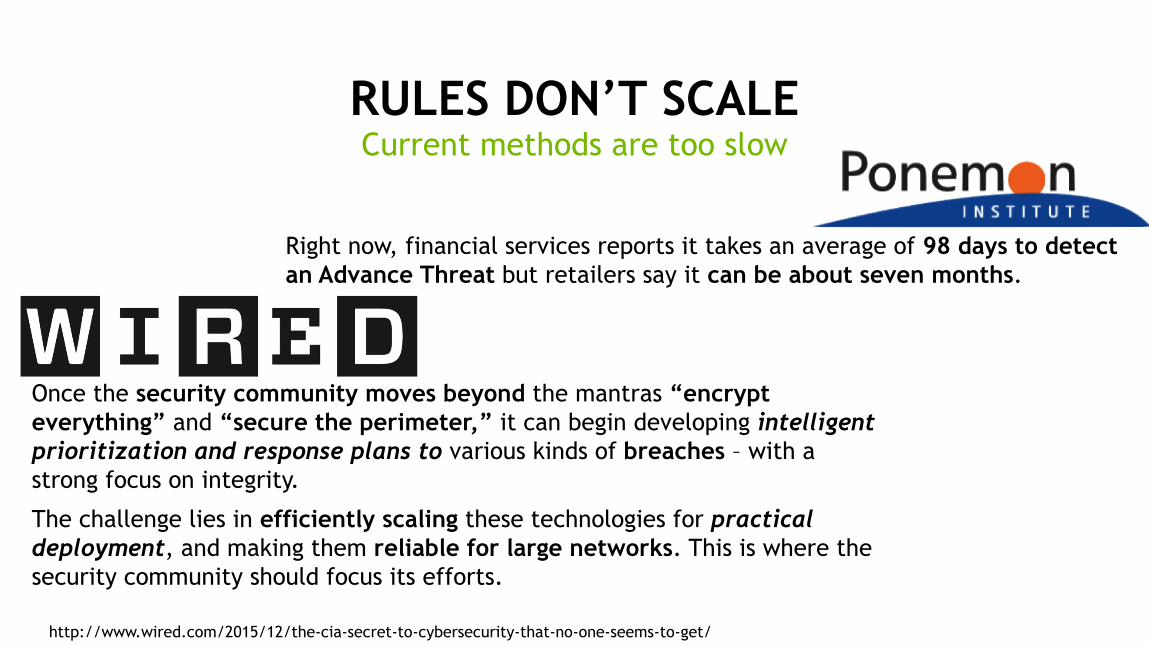
RULES DON’T SCALE
Right now, financial services reports it takes an average of 98 days to detect an Advance Threat but retailers say it can be about seven months.
Once the security community moves beyond the mantras “encrypt everything” and “secure the perimeter,” it can begin developing intelligent prioritization and response plans to various kinds of breaches – with a strong focus on integrity.
The challenge lies in efficiently scaling these technologies for practical deployment, and making them reliable for large networks. This is where the security community should focus its efforts.
http://www.wired.com/2015/12/the-cia-secret-to-cybersecurity-that-no-one-seems-to-get/
Current methods are too slow
30
ATTACKS ARE MORE SOPHISTICATEDHow Hackers Hijacked a Bank’s Entire Online Operation
https://www.wired.com/2017/04/hackers-hijacked-banks-entire-online-operation/
31
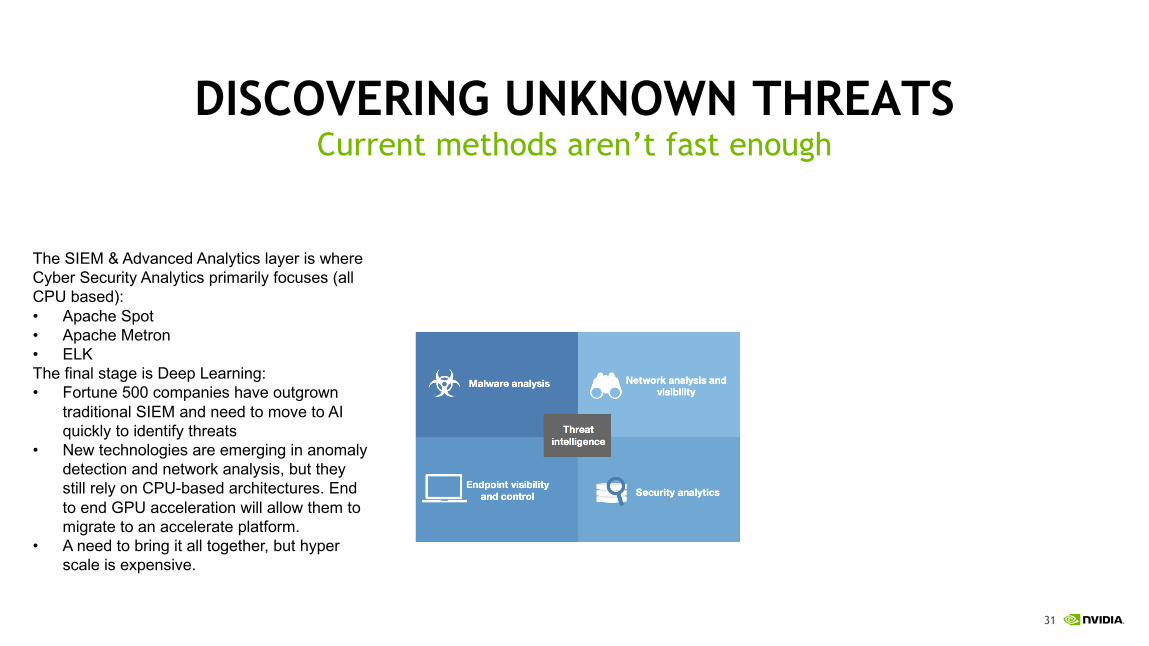
DISCOVERING UNKNOWN THREATSCurrent methods aren’t fast enough
The SIEM & Advanced Analytics layer is where Cyber Security Analytics primarily focuses (all CPU based):• Apache Spot• Apache Metron• ELKThe final stage is Deep Learning:• Fortune 500 companies have outgrown
traditional SIEM and need to move to AI quickly to identify threats
• New technologies are emerging in anomaly detection and network analysis, but they still rely on CPU-based architectures. End to end GPU acceleration will allow them to migrate to an accelerate platform.
• A need to bring it all together, but hyper scale is expensive.
32
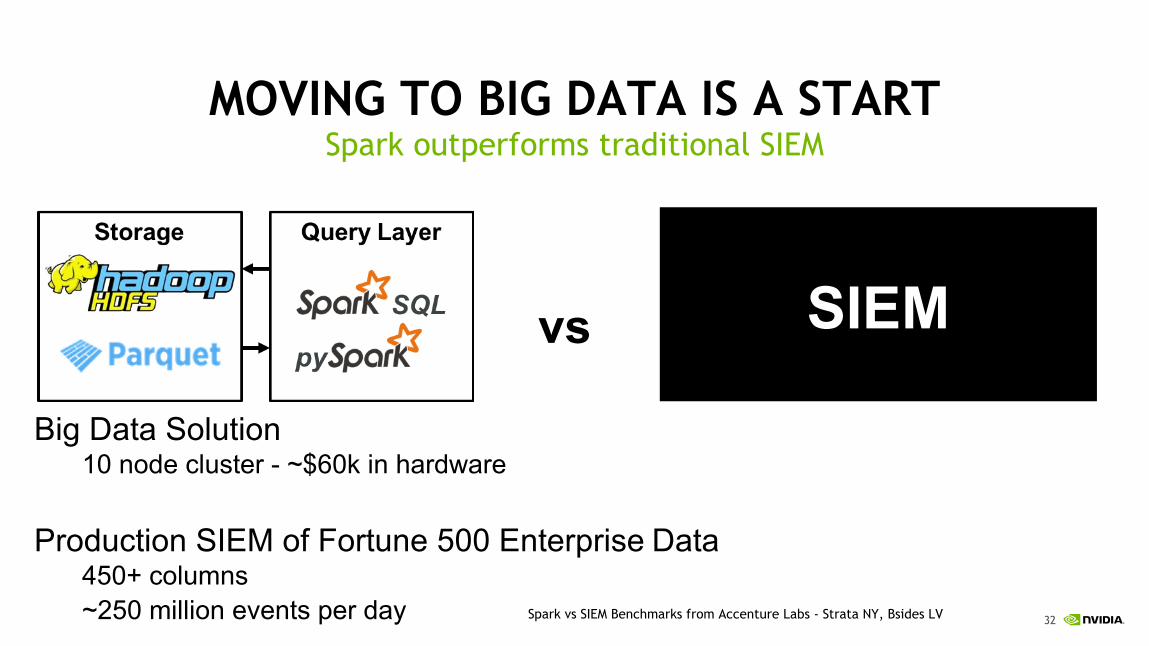
MOVING TO BIG DATA IS A STARTSpark outperforms traditional SIEM
vs
Big Data Solution10 node cluster - ~$60k in hardware
Production SIEM of Fortune 500 Enterprise Data450+ columns~250 million events per day
SIEM
Spark vs SIEM Benchmarks from Accenture Labs - Strata NY, Bsides LV
33
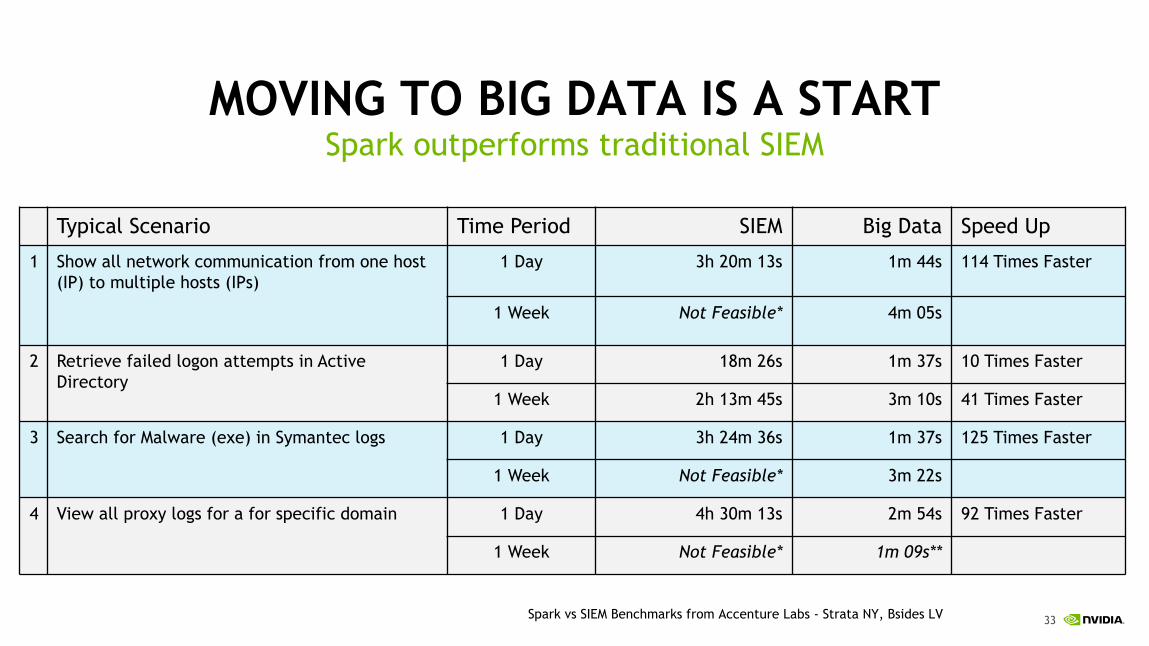
MOVING TO BIG DATA IS A STARTSpark outperforms traditional SIEM
Typical Scenario Time Period SIEM Big Data Speed Up
1 Show all network communication from one host (IP) to multiple hosts (IPs)
1 Day 3h 20m 13s 1m 44s 114 Times Faster
1 Week Not Feasible* 4m 05s
2 Retrieve failed logon attempts in Active Directory
1 Day 18m 26s 1m 37s 10 Times Faster
1 Week 2h 13m 45s 3m 10s 41 Times Faster
3 Search for Malware (exe) in Symantec logs 1 Day 3h 24m 36s 1m 37s 125 Times Faster
1 Week Not Feasible* 3m 22s
4 View all proxy logs for a for specific domain 1 Day 4h 30m 13s 2m 54s 92 Times Faster
1 Week Not Feasible* 1m 09s**
Spark vs SIEM Benchmarks from Accenture Labs - Strata NY, Bsides LV
34
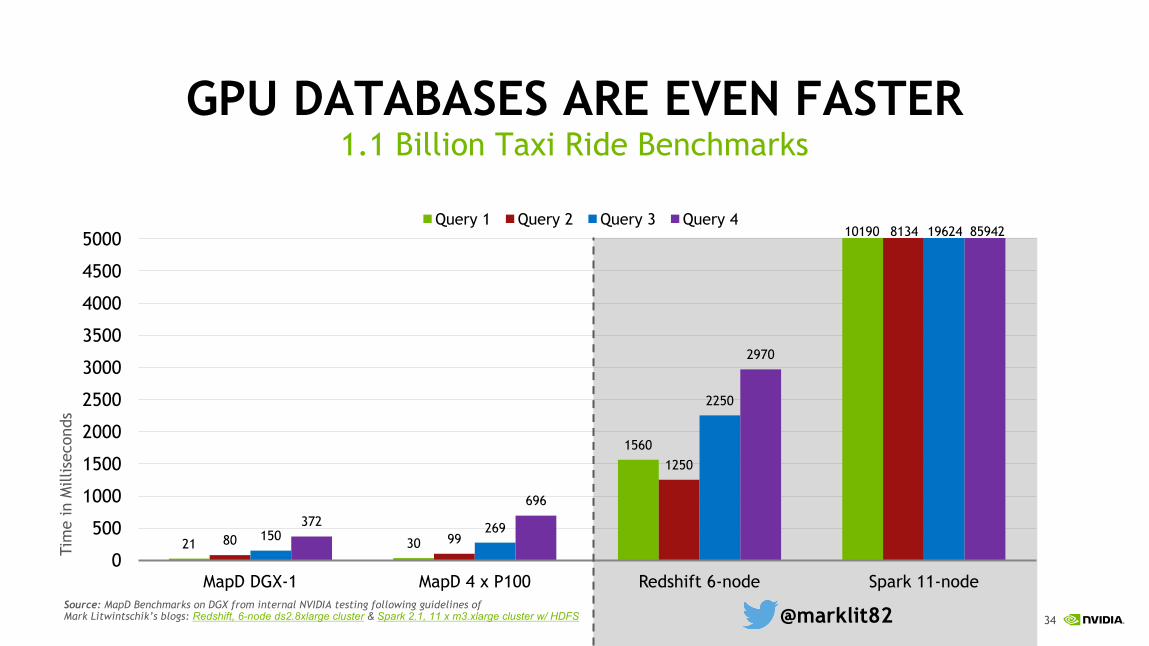
GPU DATABASES ARE EVEN FASTER1.1 Billion Taxi Ride Benchmarks
21 30
1560
80 99
1250
150 269
2250
372
696
2970
0
500
1000
1500
2000
2500
3000
3500
4000
4500
5000
MapD DGX-1 MapD 4 x P100 Redshift 6-node Spark 11-node
Query 1 Query 2 Query 3 Query 4
Tim
e in
Mill
isec
onds
Source: MapD Benchmarks on DGX from internal NVIDIA testing following guidelines of Mark Litwintschik’s blogs: Redshift, 6-node ds2.8xlarge cluster & Spark 2.1, 11 x m3.xlarge cluster w/ HDFS @marklit82
10190 8134 19624 85942
35
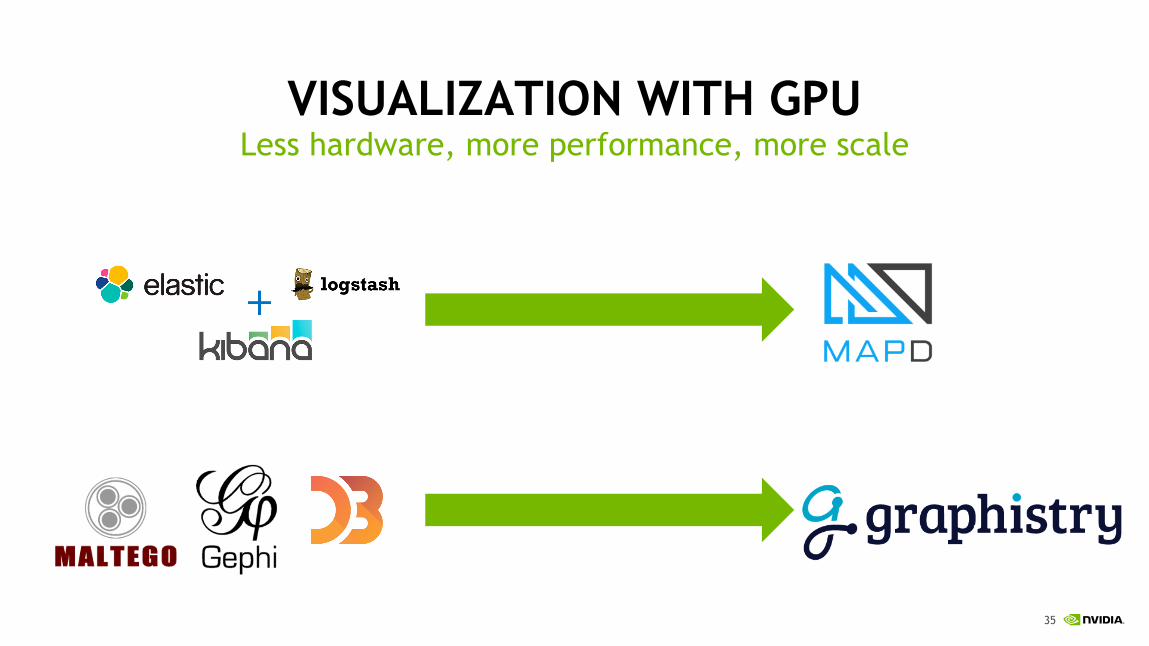
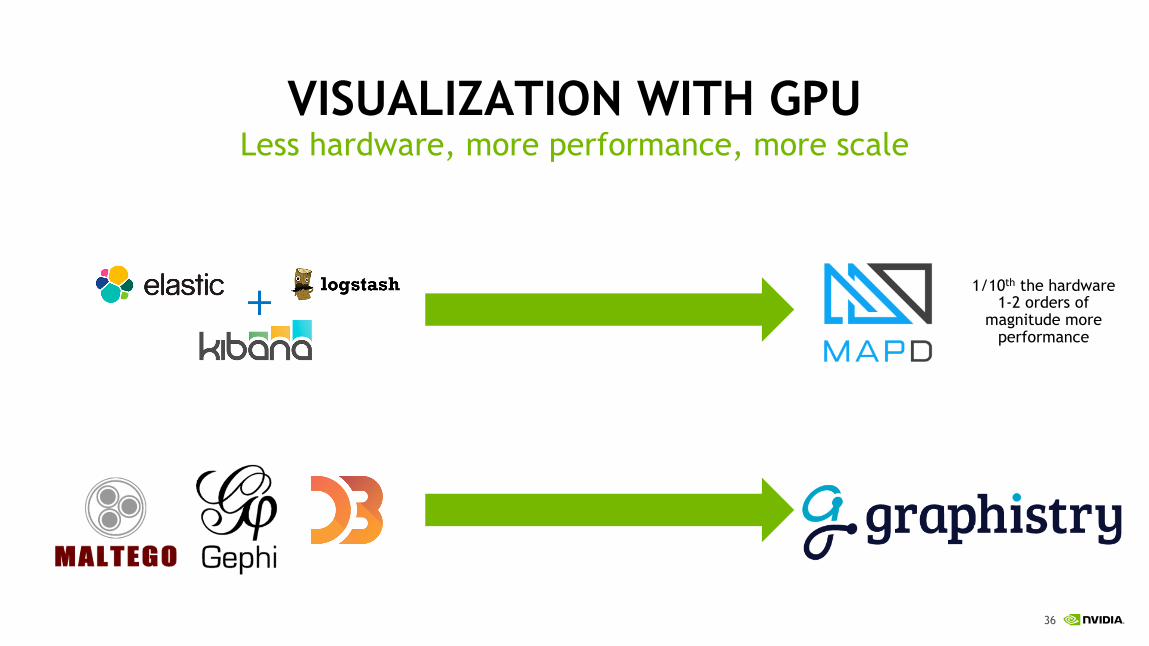
VISUALIZATION WITH GPULess hardware, more performance, more scale
36
VISUALIZATION WITH GPULess hardware, more performance, more scale
1/10th the hardware1-2 orders of
magnitude more performance
37
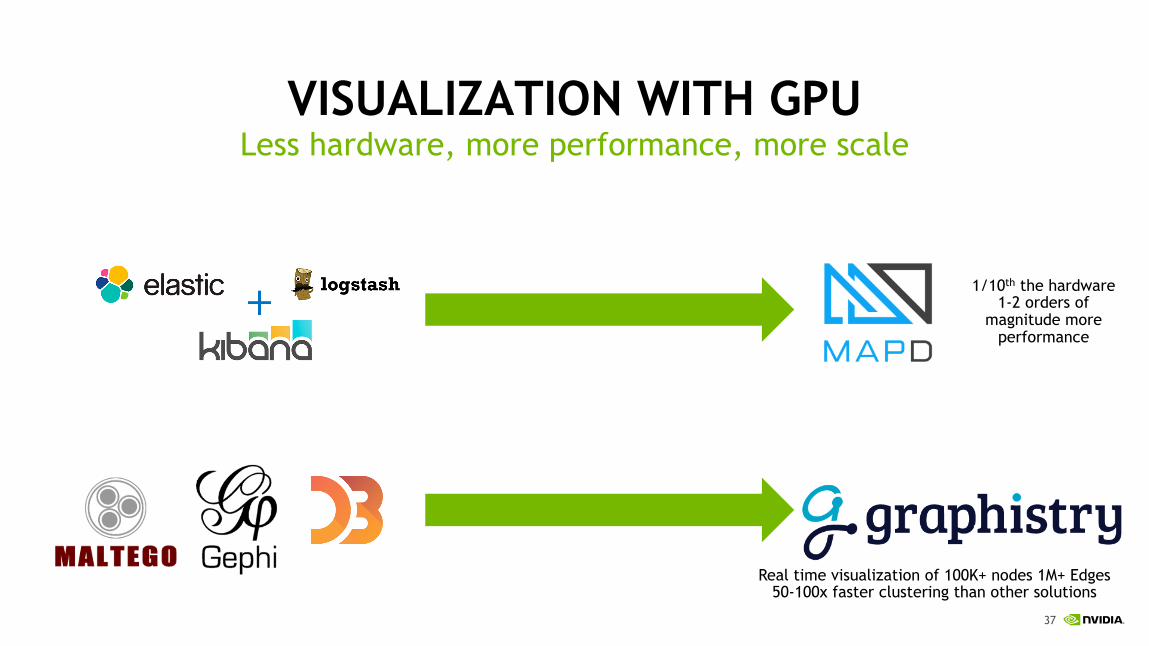
VISUALIZATION WITH GPULess hardware, more performance, more scale
1/10th the hardware1-2 orders of
magnitude more performance
Real time visualization of 100K+ nodes 1M+ Edges50-100x faster clustering than other solutions
38
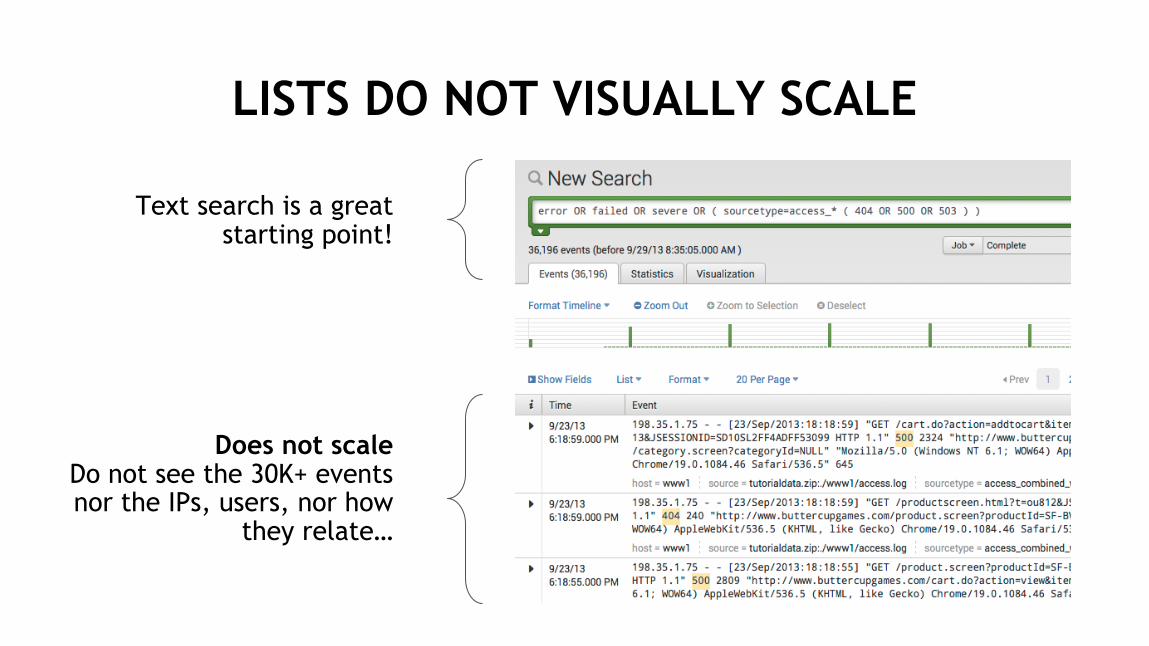
LISTS DO NOT VISUALLY SCALE
Text search is a greatstarting point!
Does not scaleDo not see the 30K+ events nor the IPs, users, nor how
they relate…
39
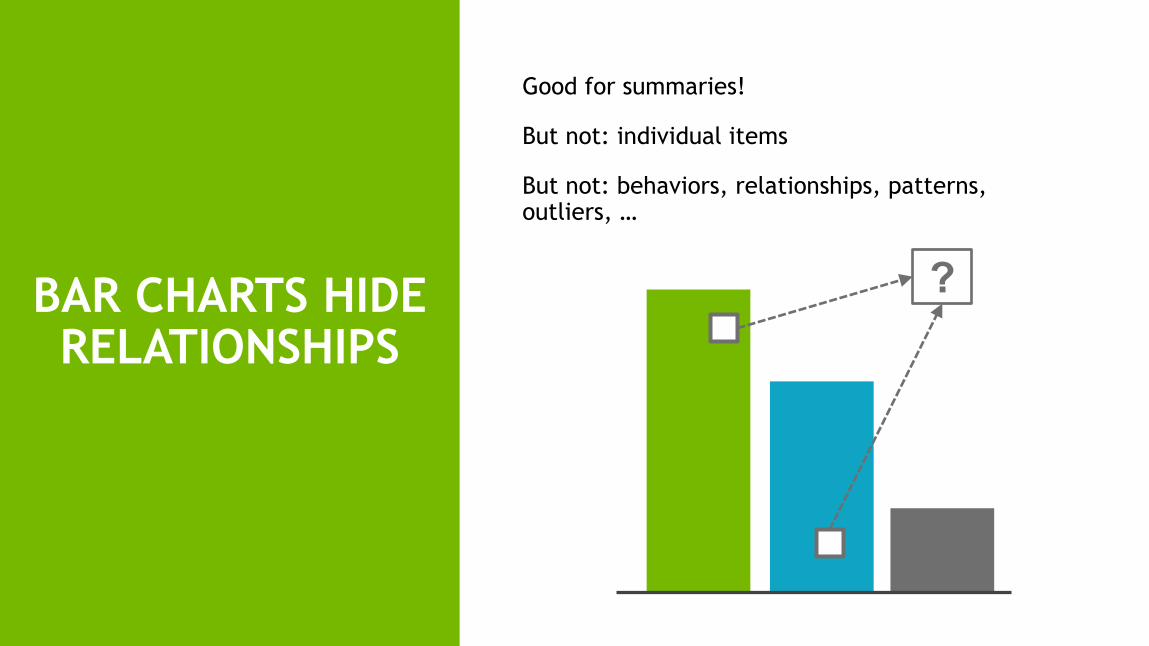
BAR CHARTS HIDE RELATIONSHIPS
Good for summaries!
But not: individual items
But not: behaviors, relationships, patterns, outliers, …
?
40
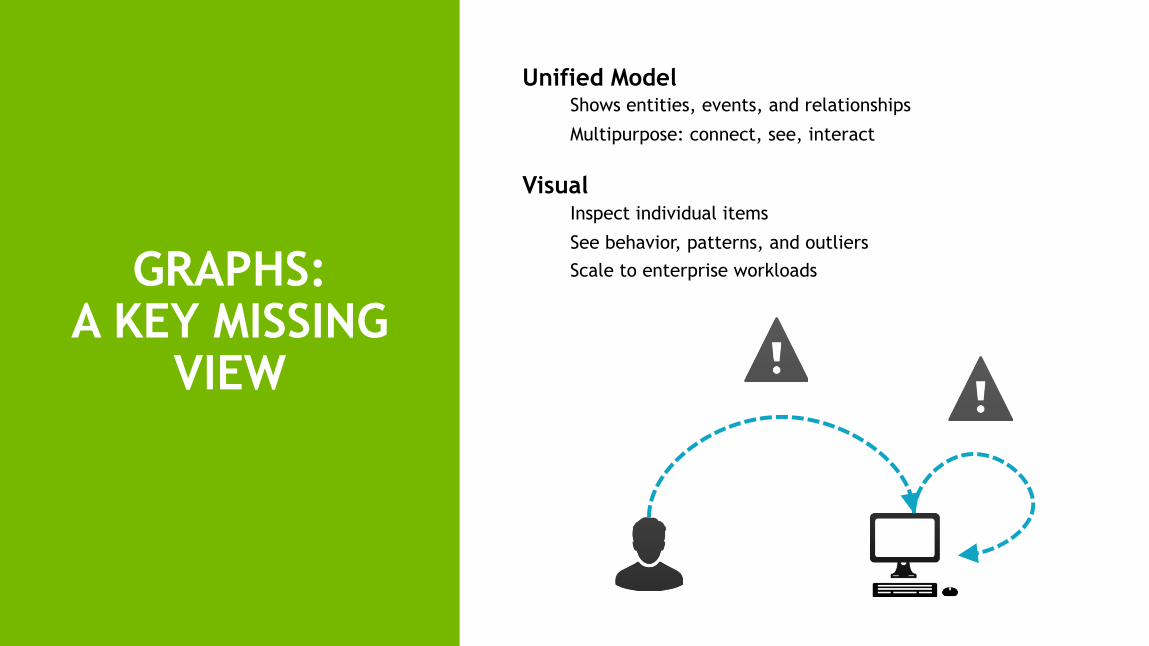
GRAPHS: A KEY MISSING
VIEW
Unified ModelShows entities, events, and relationships
Multipurpose: connect, see, interact
VisualInspect individual items
See behavior, patterns, and outliersScale to enterprise workloads
41
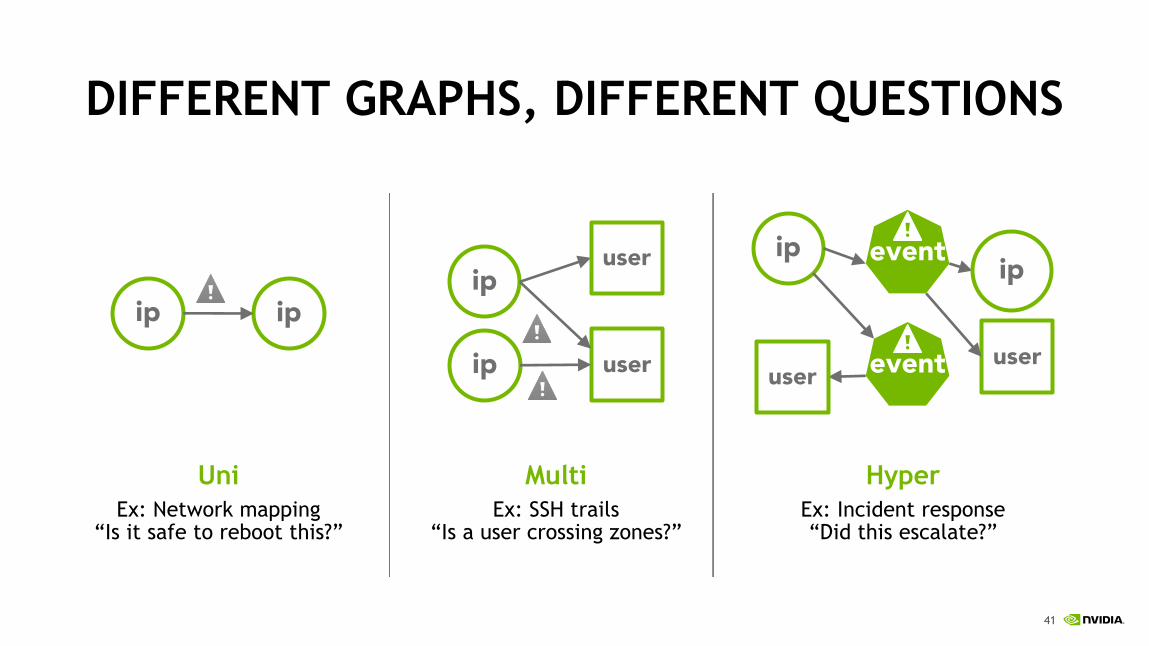
DIFFERENT GRAPHS, DIFFERENT QUESTIONS
UniEx: Network mapping
“Is it safe to reboot this?”
ip ip
HyperEx: Incident response“Did this escalate?”
MultiEx: SSH trails
“Is a user crossing zones?”
ipuser
userip
ip
userevent
event
user
ip
42
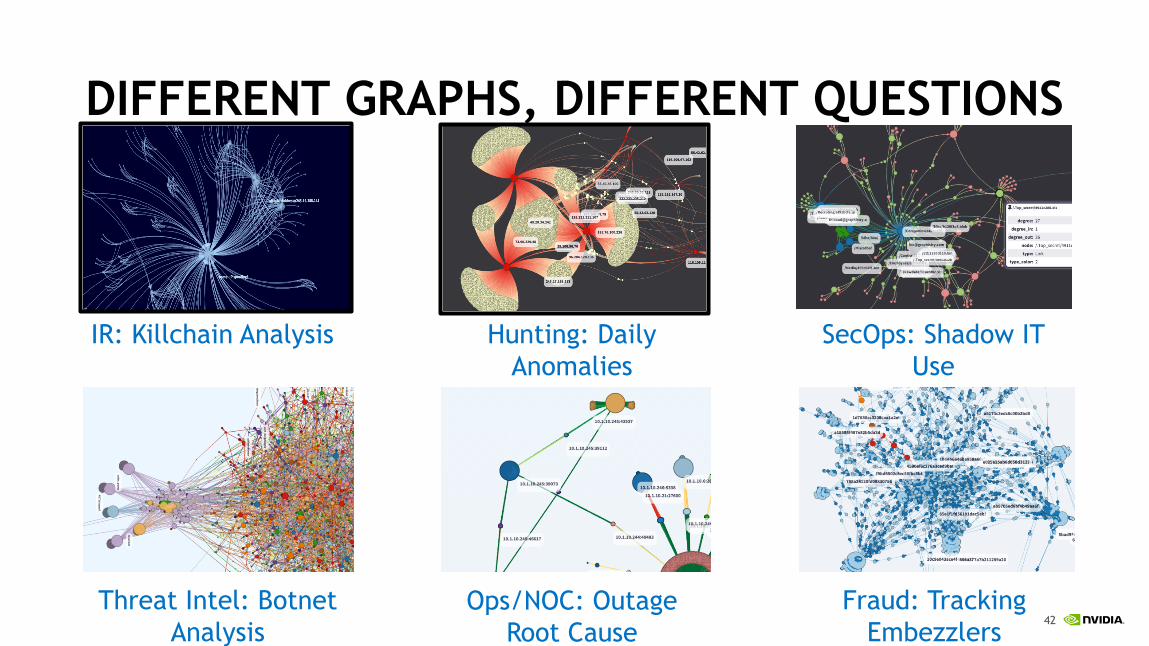
DIFFERENT GRAPHS, DIFFERENT QUESTIONS
Fraud: Tracking Embezzlers
Hunting: Daily Anomalies
SecOps: Shadow IT Use
Ops/NOC: Outage Root Cause
Threat Intel: Botnet Analysis
IR: Killchain Analysis
43
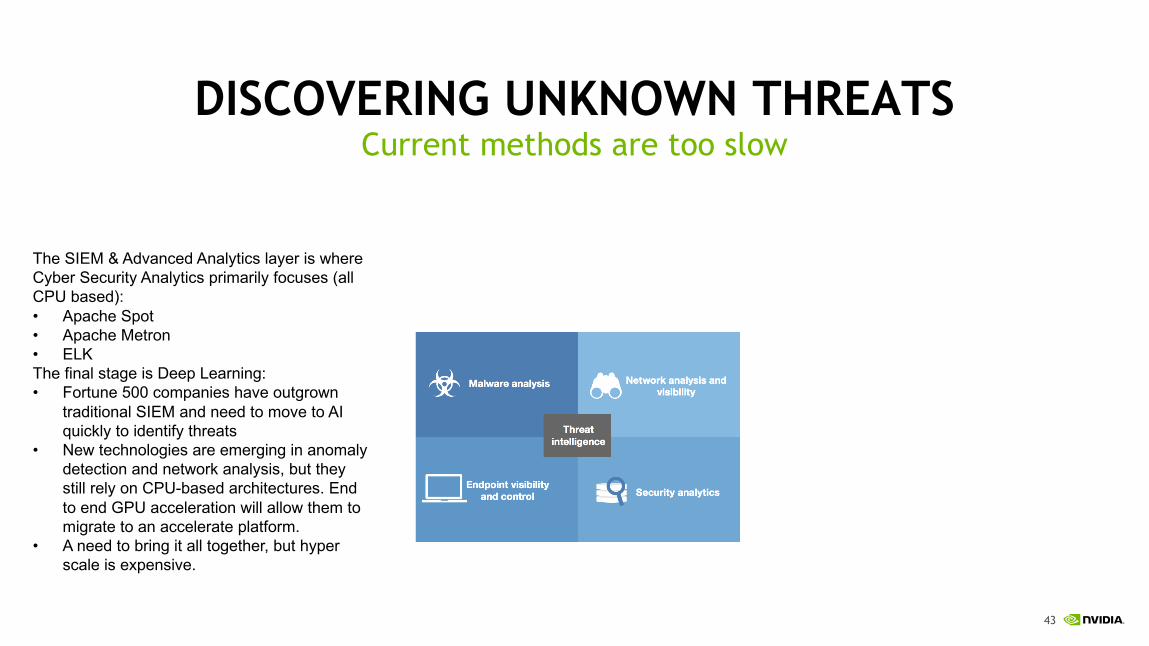
DISCOVERING UNKNOWN THREATSCurrent methods are too slow
The SIEM & Advanced Analytics layer is where Cyber Security Analytics primarily focuses (all CPU based):• Apache Spot• Apache Metron• ELKThe final stage is Deep Learning:• Fortune 500 companies have outgrown
traditional SIEM and need to move to AI quickly to identify threats
• New technologies are emerging in anomaly detection and network analysis, but they still rely on CPU-based architectures. End to end GPU acceleration will allow them to migrate to an accelerate platform.
• A need to bring it all together, but hyper scale is expensive.
44
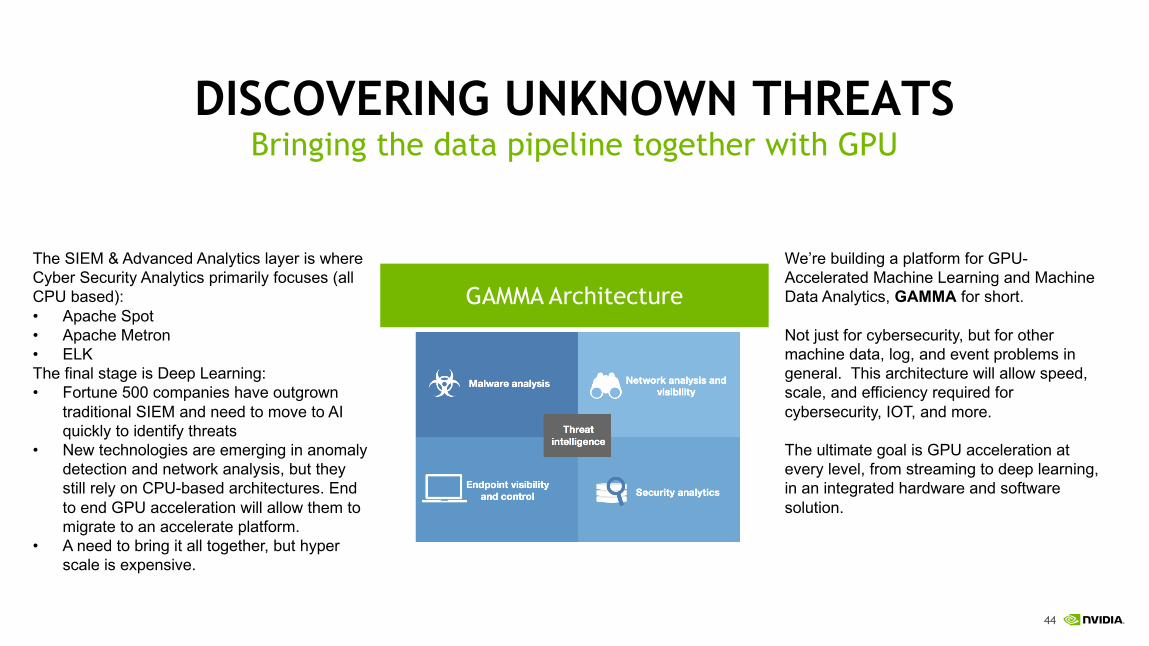
DISCOVERING UNKNOWN THREATSBringing the data pipeline together with GPU
GAMMA Architecture
The SIEM & Advanced Analytics layer is where Cyber Security Analytics primarily focuses (all CPU based):• Apache Spot• Apache Metron• ELKThe final stage is Deep Learning:• Fortune 500 companies have outgrown
traditional SIEM and need to move to AI quickly to identify threats
• New technologies are emerging in anomaly detection and network analysis, but they still rely on CPU-based architectures. End to end GPU acceleration will allow them to migrate to an accelerate platform.
• A need to bring it all together, but hyper scale is expensive.
We’re building a platform for GPU-Accelerated Machine Learning and Machine Data Analytics, GAMMA for short.
Not just for cybersecurity, but for other machine data, log, and event problems in general. This architecture will allow speed, scale, and efficiency required for cybersecurity, IOT, and more.
The ultimate goal is GPU acceleration at every level, from streaming to deep learning, in an integrated hardware and software solution.
45
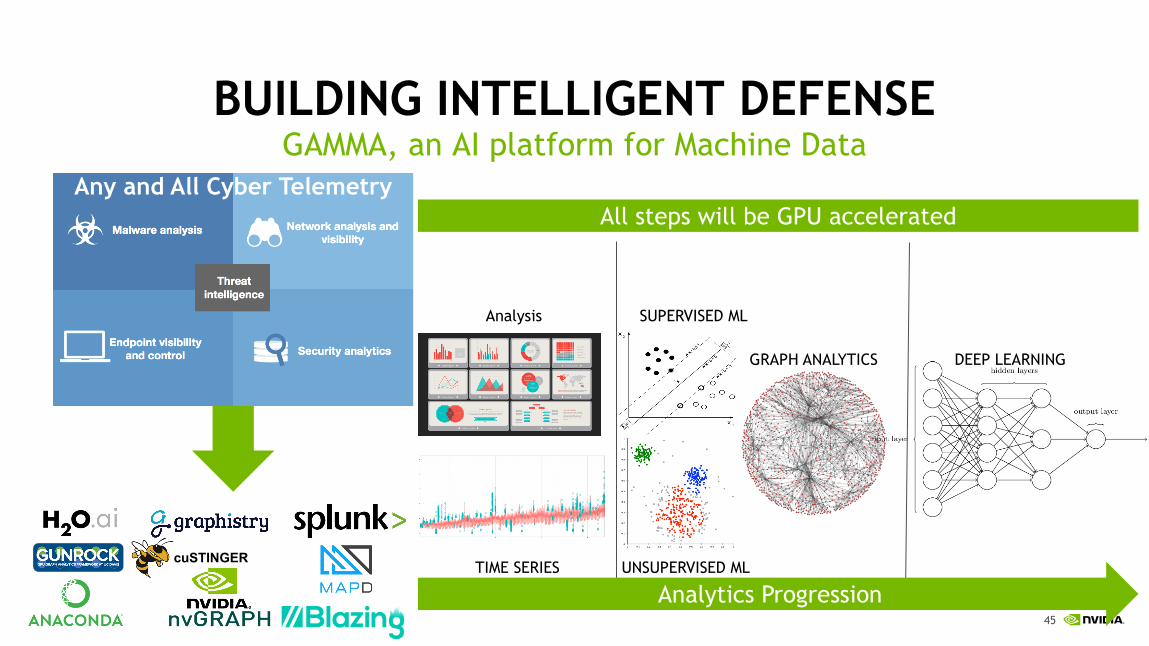
BUILDING INTELLIGENT DEFENSEGAMMA, an AI platform for Machine Data
Analysis SUPERVISED ML
UNSUPERVISED MLTIME SERIES
GRAPH ANALYTICS DEEP LEARNING
cuSTINGER
Analytics Progression
All steps will be GPU acceleratedAny and All Cyber Telemetry
46
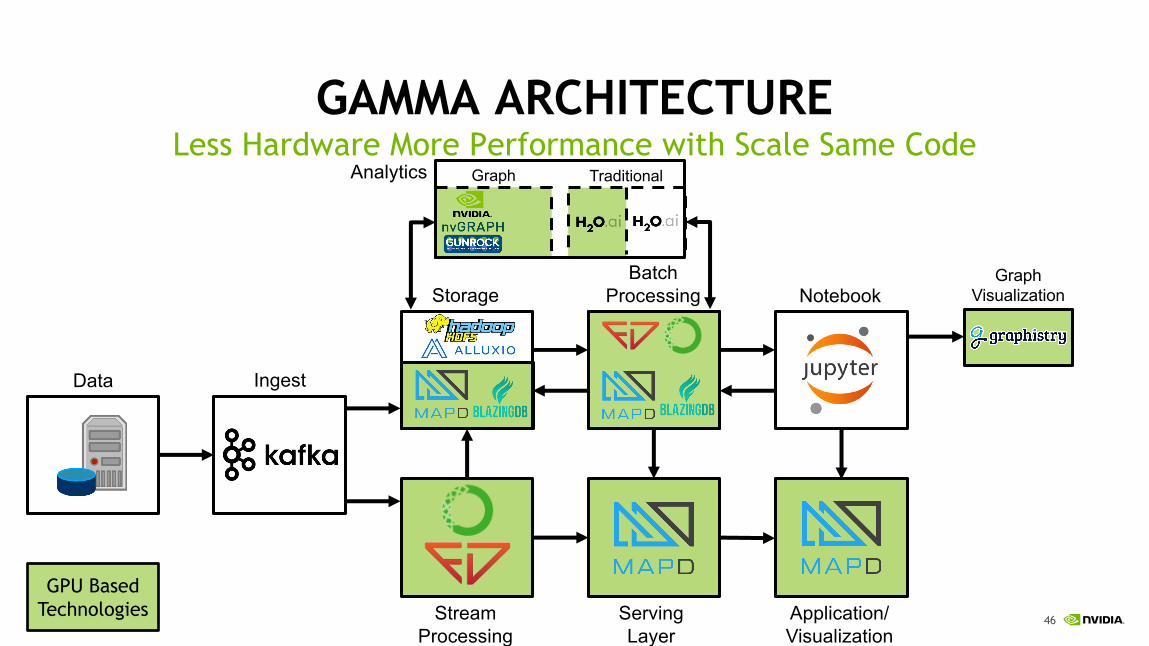
Batch Processing
GPU Based Technologies
Data Ingest
Storage
Stream Processing
Serving Layer
Application/Visualization
Notebook
Analytics
GraphVisualization
Graph Traditional
GAMMA ARCHITECTURELess Hardware More Performance with Scale Same Code
47
CALL TO ACTIONOPEN IS BETTER!
Let’s Collaborate!
Joshua Patterson @datametrician
QUESTIONS?
Related Documents