Data Science for the ASC Joseph Engel, MPS The Endoscopy Center of Fairfield Gastroenterology Associates of Fairfield County Fairfield, Connecticut Becker’s ASC 22 nd Annual Meeting: The Business and Operations of ASCs

Welcome message from author
This document is posted to help you gain knowledge. Please leave a comment to let me know what you think about it! Share it to your friends and learn new things together.
Transcript

Data Science for the ASC
Joseph Engel, MPS
The Endoscopy Center of Fairfield
Gastroenterology Associates of Fairfield County
Fairfield, Connecticut
Becker’s ASC 22nd Annual Meeting: The Business and Operations of ASCs
Data Science for the ASC
Joseph Engel, MPS
Administrator
Gastroenterology Associates of Fairfield County
The Endoscopy Center of Fairfield
I have no disclosures to report
Today we will cover…
• The Data Revolution
• A Data Analytics Plan for ASCs
• An example of a data analysis using a simple Run Chart
The Data Revolution
• What’s going on with data?
• Terminology
• ASCs lag behind
• What is a data analysis?
The Data Revolution
What’s going on with data?
• An enormous amount of data is collected every day
• Cost of collecting data is dropping rapidly
• Realization that data has value
• The need to manage all this data is growing rapidly
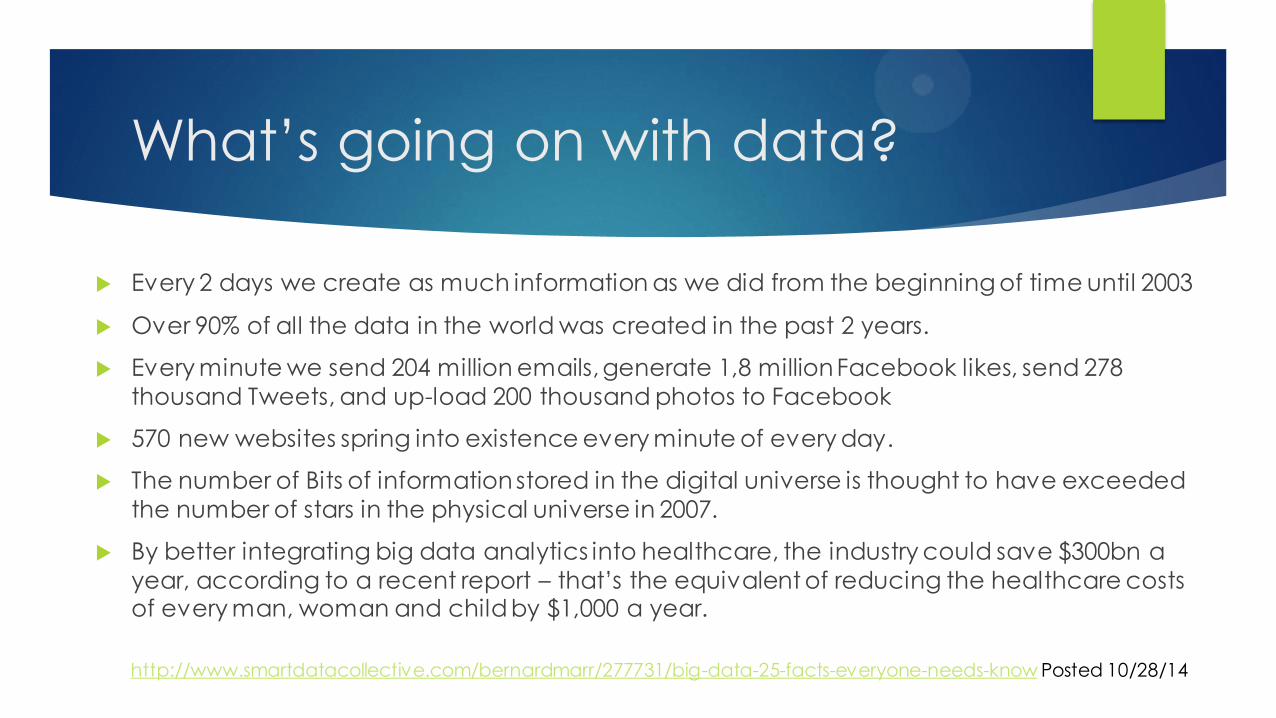
What’s going on with data?
Every 2 days we create as much information as we did from the beginning of time until 2003
Over 90% of all the data in the world was created in the past 2 years.
Every minute we send 204 million emails, generate 1,8 million Facebook likes, send 278
thousand Tweets, and up-load 200 thousand photos to Facebook
570 new websites spring into existence every minute of every day.
The number of Bits of information stored in the digital universe is thought to have exceeded
the number of stars in the physical universe in 2007.
By better integrating big data analytics into healthcare, the industry could save $300bn a
year, according to a recent report – that’s the equivalent of reducing the healthcare costs of every man, woman and child by $1,000 a year.
http://www.smartdatacollective.com/bernardmarr/277731/big-data-25-facts-everyone-needs-know Posted 10/28/14
Data Terminology
• Big Data
• Data Science
• Data Analysis
• Predictive Analytics
• Machine learning
• Data Mining
• Statistics
• Etc.
The Skill Set of the Health Care Manager of the Future
Data Science
Quality Measurement
Negotiation
Compliance Management
Everything Else
ASCs lag behind
Industry and hospitals are swimming in data.
The Question is where is the comparable data for ASCs?
http://www.beckersasc.com/asc-turnarounds-ideas-to-improve-performance/where-is-all-the-asc-data.html
accessed 7/18/2015

What is a Data Analysis?
• Data can be studied in the same way that an astronomer studies objects in the universe or a chemist studies molecules.
• Data is a collection of measurements obtained from observing a phenomenon such as a process.
• The objective of an analysis is to discover the nature and characteristics of the data, describe what one finds and then use the findings to answer questions about that phenomenon.
Create an analytics plan for the
ASC
Think data
Determine the purpose
Brainstorm with staff etc.
Inventory your data
What do you have, what do you need?
Identify who’s involved
Have a central guidebook for your data
Plan organization and storage

Create an analytics plan for the
ASC
List questions
Baseline questions
Questions that might be asked
Outline the data capture process
Learn simple analytical techniques
Don’t hide your data
Use the results
Check out existing analytic programs
Use The Data Science analysis model
Think Data
How can your measure of interest (data) best be tracked and presented?
What is the cost and production relationship?
How much does a unit of production cost?
What works best? e.g. what does your experience show is the best prep?
How can you measure quality?
What’s the best way to manage and protect your data?
How do you share your data?
What is the optimal use of resources?
Purpose
Assess patient experience
Get paid
Satisfy interested parties
Control processes
Measure compliance
Purpose
Measure cost
Measure efficiency and effectiveness
Measure use of resources
Demonstrate how good you are
Predict an outcome

Inventory Your Data – What do you
have now?
JAC AAAHC
Health Department
Surveys
Benchmarking
Budgets
Room usage
Counting meds
Outcomes
Quality measures
Billing data
Logs of all kinds
The data you collect – can it
answer your question?
“The data may not contain the answer. The combination of some data and an aching
desire for an answer does not ensure that a reasonable answer can be extracted from a
given body of data.”
John Tukey (quoted by Jeff Leak)

Useful results require accurate data

Analytics Plan Example
The Surgery Center
Analytics Plan
Data Source Who collects Where it's kept Form Used Purpose Collection Frequency
Schedule time Program Scheduler Software Schedule Software report Set Pt arrival time Each case
Procedure times Procedure Sheet Nurse Pt Chart Paper forms Stats Each case
Staff Costs Payroll System Accounting Payroll system Software report Procedure Cost Weekly
Supply Costs Accounting Accounting staff Acct Software Software report Procedure Cost Monthly
Meds Used Med Log Nurse Head Nurse Office Med Form Ttrack Usage/Order Daily
Patient Survey Patient Outside service Head Nurse Office Pt reply form Measure Satisfaction Per visit
Answer a question with your
data
Are we on time?
What is our cost per procedure?
Are we safe?
Are we cost effective?
Are patients satisfied?
Are we effective?
Learn simple analytical
techniques
Excel
Online templates
Software reports

Use the results
Try to present results graphically
PDSA for using results:
• Plan
• Do
• Study
• Act
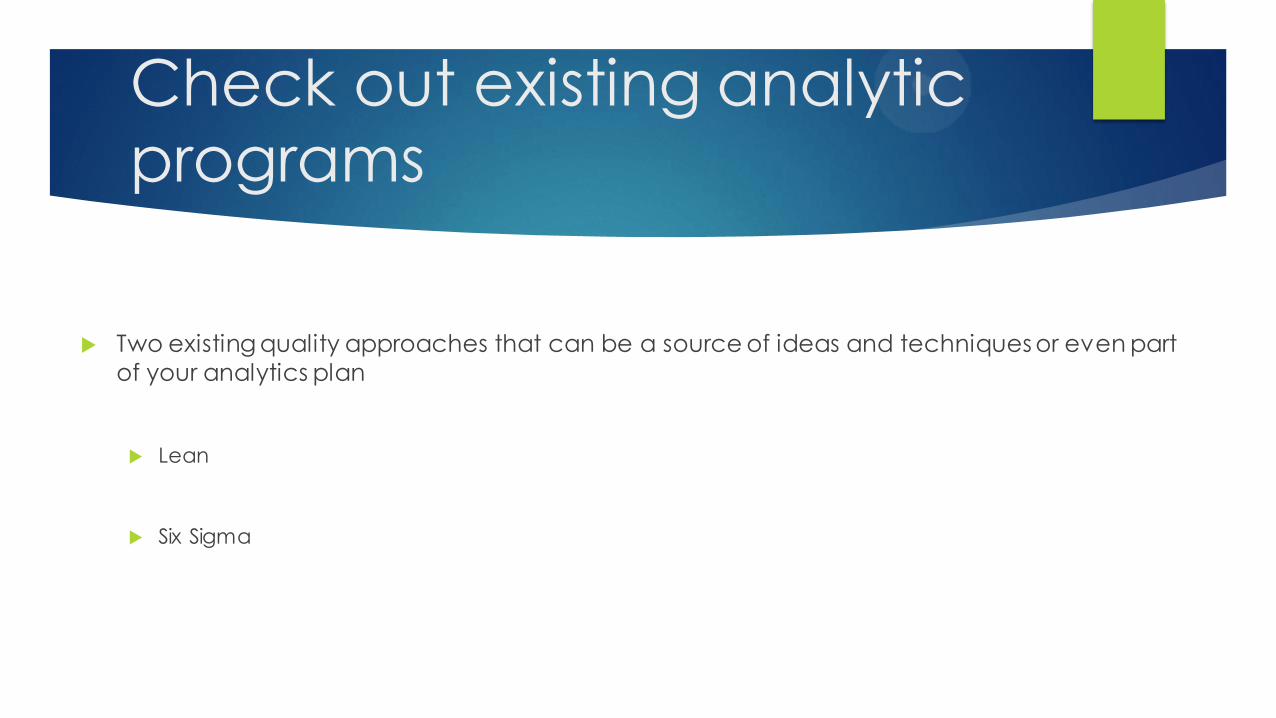
Check out existing analytic programs
Two existing quality approaches that can be a source of ideas and techniques or even part
of your analytics plan
Lean
Six Sigma

Lean and Lean Six Sigma in Healthcare
Lean and Lean Six Sigma applications in healthcare require an understanding of how the tools and methodologies translate to the people-intensive processes of patient care. Once applied, the possibilities are endless.
Using Lean Six Sigma, Morton Plant Hospital in Clearwater, FL, improved patient satisfaction over 50%, reduced emergency department length of service by 21%, and recovered over $4 million in cost of quality.
•Lean
Eliminate non-value-added activities and waste. Save time and money.
•Lean Six Sigma
Increase patient satisfaction and reduce errors by improving your processes.
http://asq.org/healthcaresixsigma/
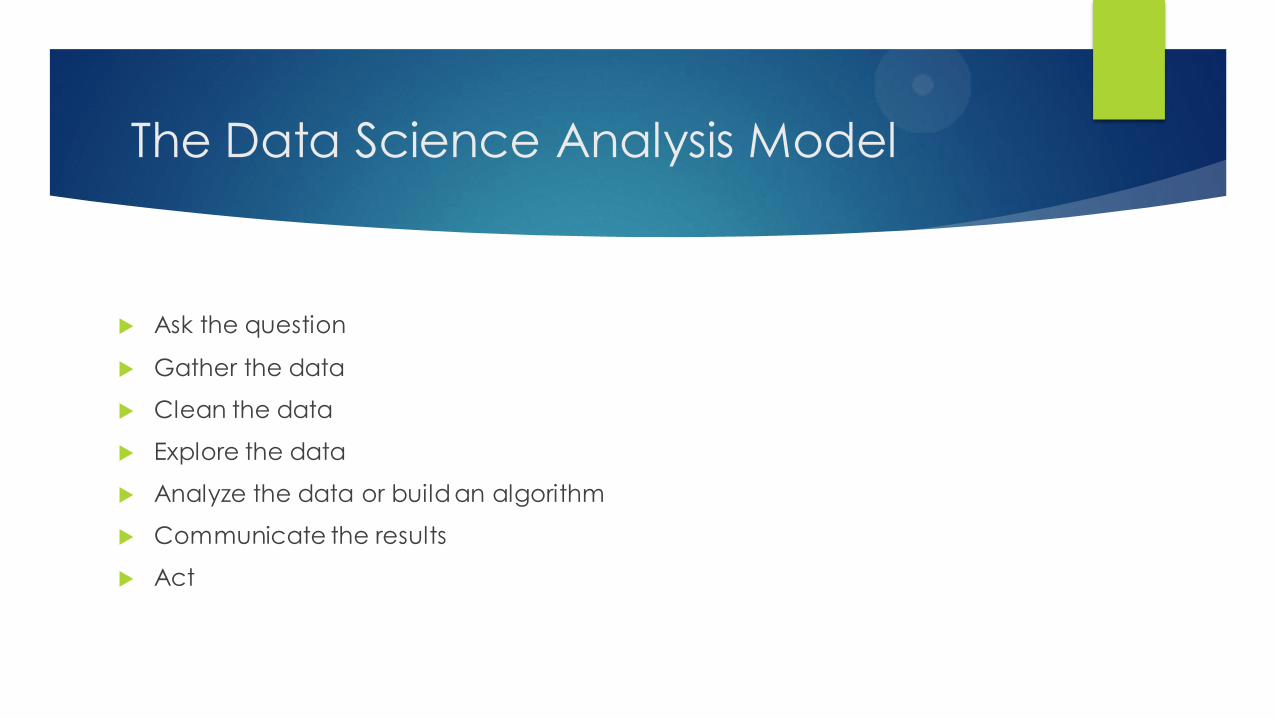
The Data Science Analysis Model
Ask the question
Gather the data
Clean the data
Explore the data
Analyze the data or build an algorithm
Communicate the results
Act

An example of the data
analysis process
Start with a question:
Are we on time?
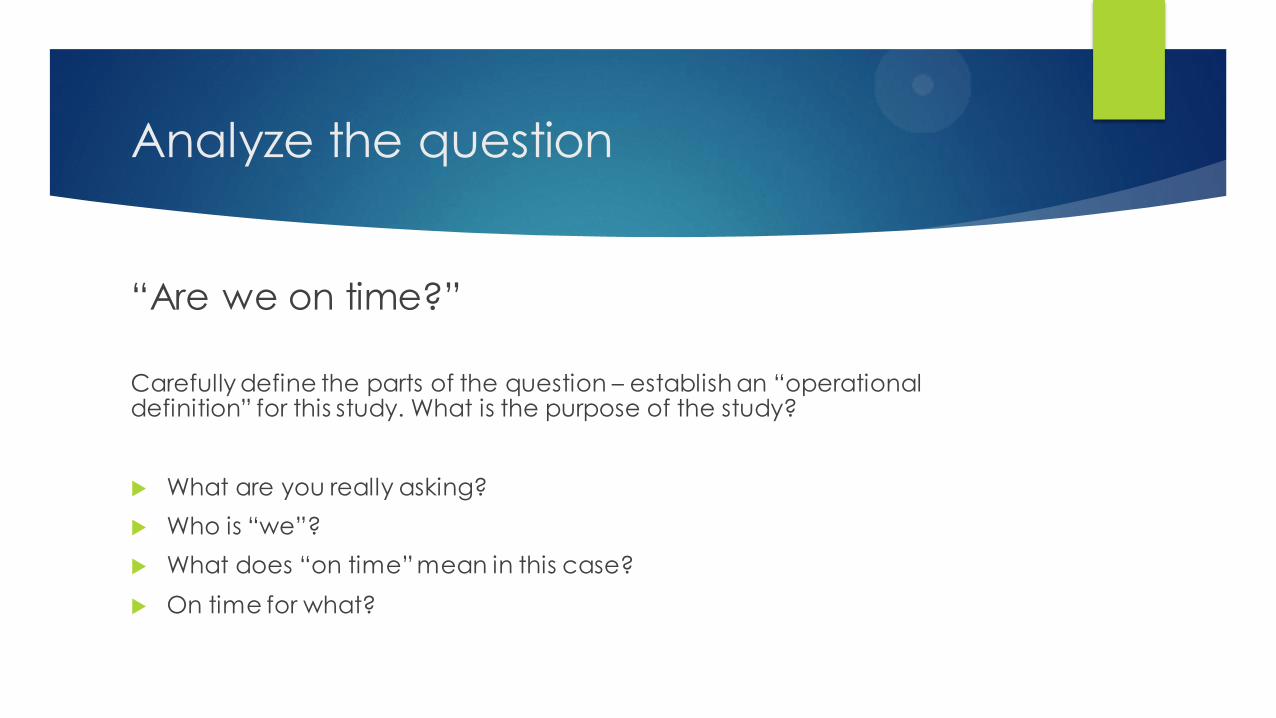
Analyze the question
“Are we on time?”
Carefully define the parts of the question – establish an “operational definition” for this study. What is the purpose of the study?
What are you really asking?
Who is “we”?
What does “on time” mean in this case?
On time for what?

Refine the Question
“We”
…means all staff, the provider, the room, the patient. Everything that has to be ready to start the case.
“On time”
…means any procedure that starts within 5 minutes of it’s scheduled time.

Refine the Question
The purpose of the study
Identify and measure controllable factors. Separate them from random, uncontrollable
factors.
Identify unforeseen factors that cause some level of variation.
Test interventions such as a catch up period or staff retraining.
Set the center’s target for this measure.
E.g. You might set a standard of one delayed case per day.

Tidy data
What data do we have?
Can it be used to answer this question?
Do you need more data or different data?
How is the data stored and organized?
What has to be done to make it usable?
Is it in a form that your analytical tools can process?
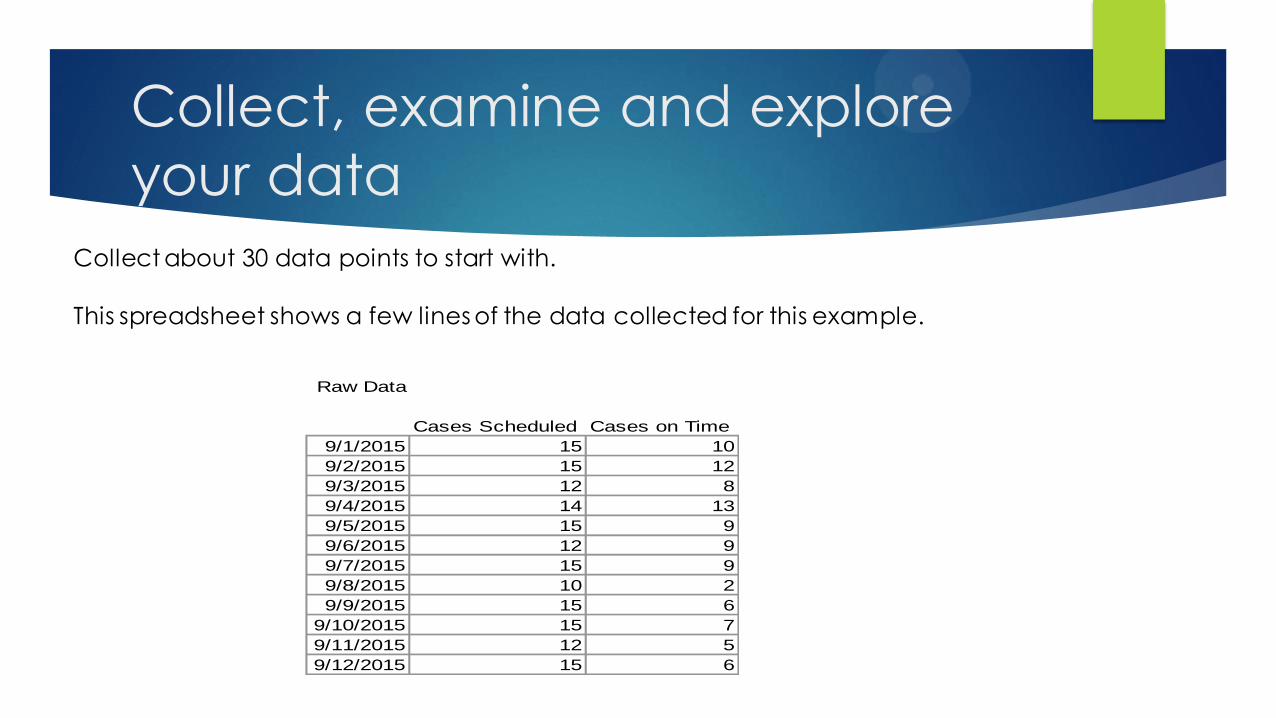
Collect, examine and explore
your data
Collect about 30 data points to start with.
This spreadsheet shows a few lines of the data collected for this example.
Raw Data
Cases Scheduled Cases on Time
9/1/2015 15 10
9/2/2015 15 12
9/3/2015 12 8
9/4/2015 14 13
9/5/2015 15 9
9/6/2015 12 9
9/7/2015 15 9
9/8/2015 10 2
9/9/2015 15 6
9/10/2015 15 7
9/11/2015 12 5
9/12/2015 15 6
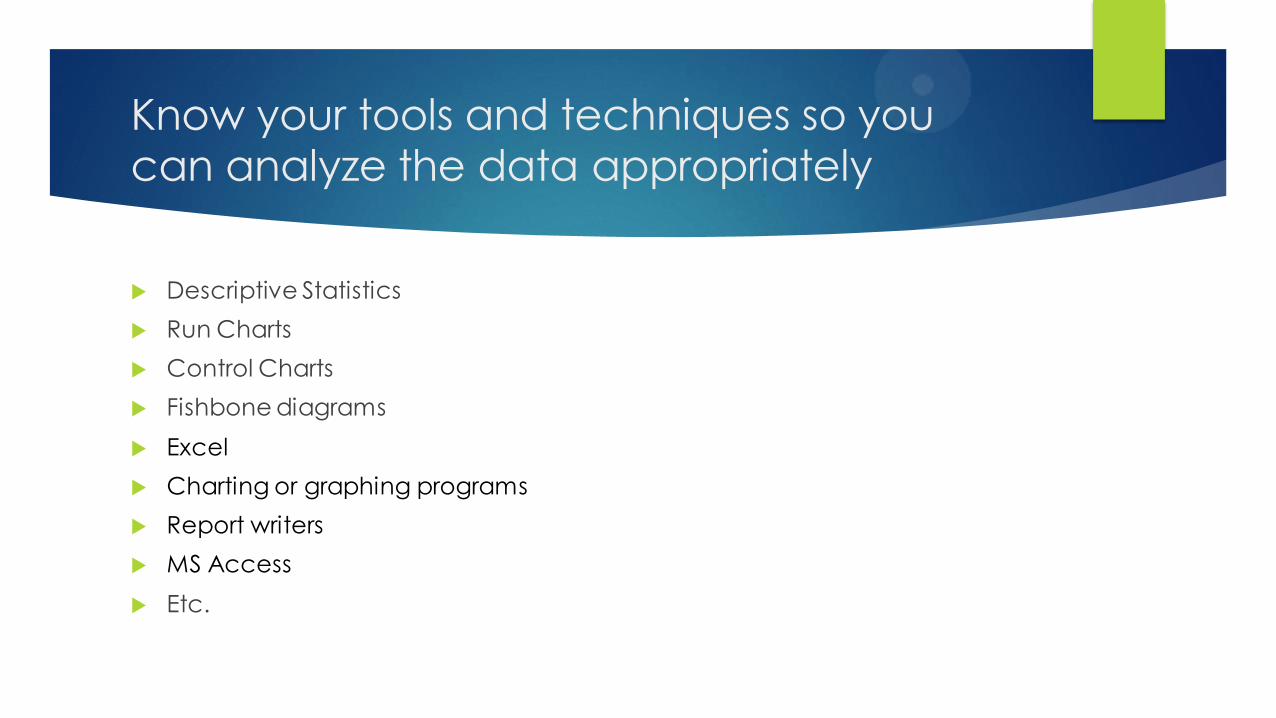
Know your tools and techniques so you can analyze the data appropriately
Descriptive Statistics
Run Charts
Control Charts
Fishbone diagrams
Excel
Charting or graphing programs
Report writers
MS Access
Etc.
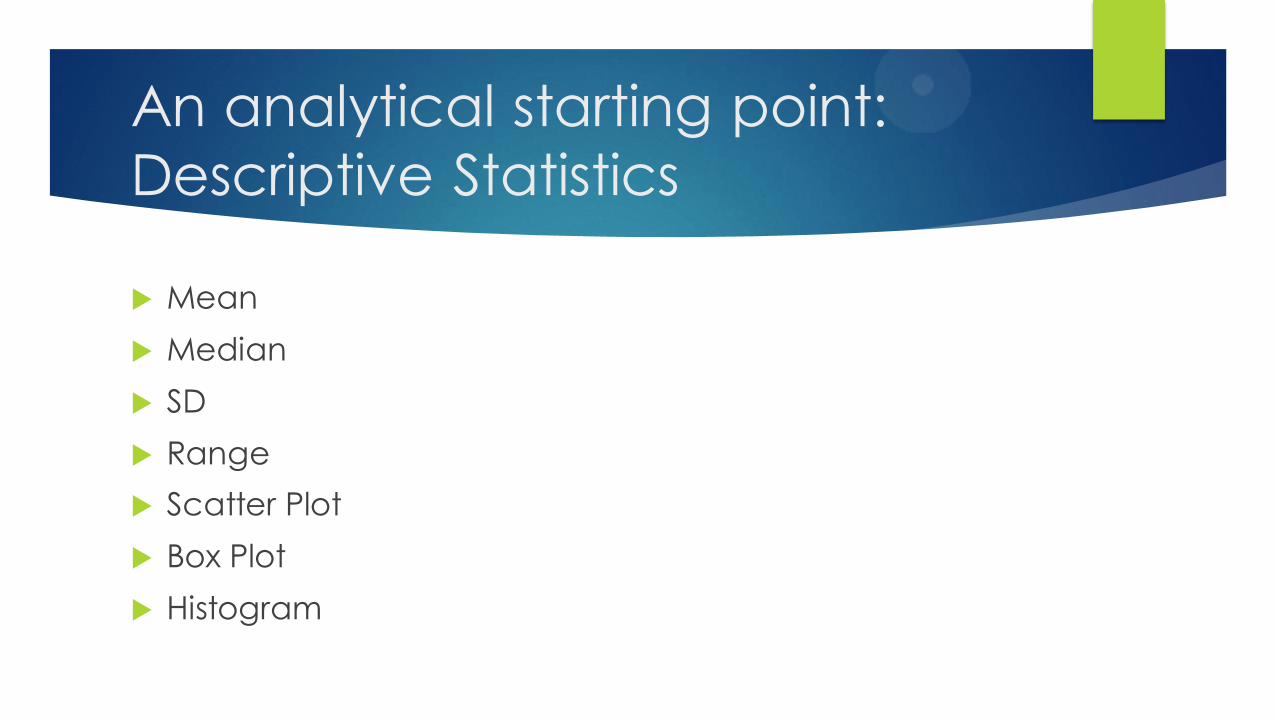
An analytical starting point:
Descriptive Statistics
Mean
Median
SD
Range
Scatter Plot
Box Plot
Histogram
Basic descriptive statistics
Useful for initial data exploration and getting to know
your data
Typically shows a point in time
Does not easily show random vs external causes of
variation
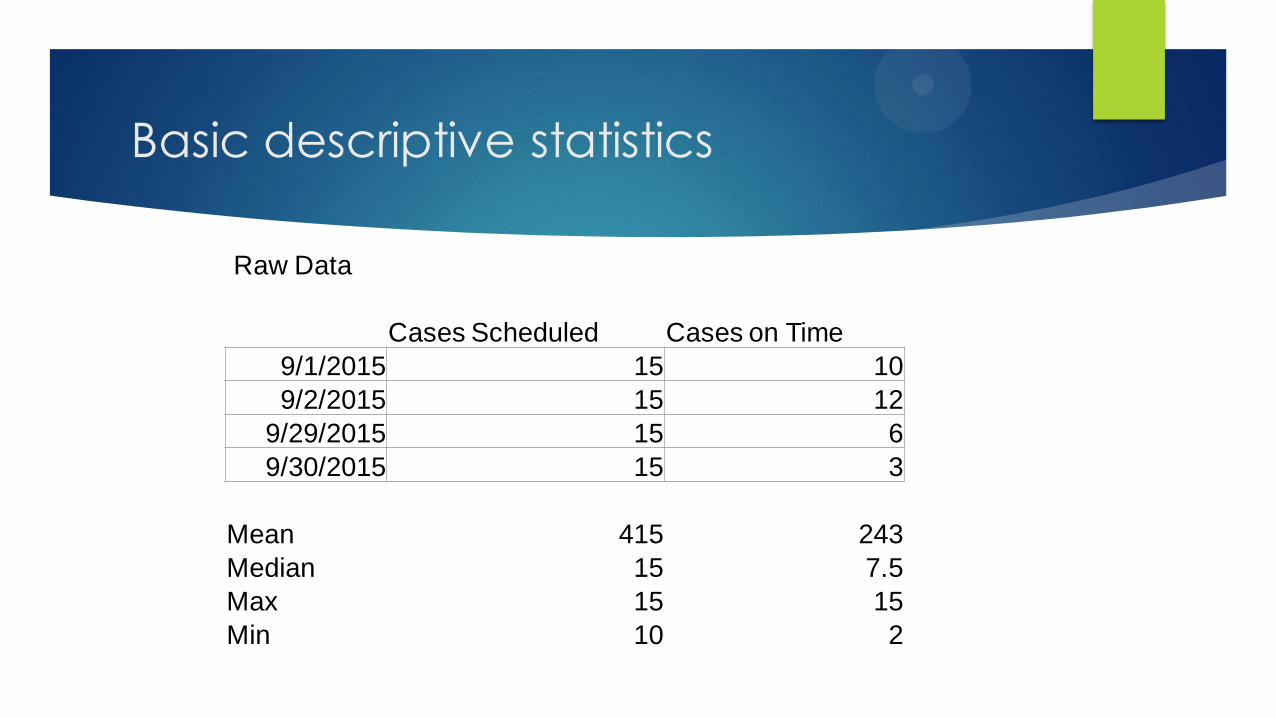
Basic descriptive statistics
Raw Data
Cases Scheduled Cases on Time
9/1/2015 15 10
9/2/2015 15 12
9/29/2015 15 6
9/30/2015 15 3
Mean 415 243
Median 15 7.5
Max 15 15
Min 10 2

Choose an appropriate tool or method of analysis
To answer the question “How many procedures begin at the time scheduled each day?” you will need a tool that shows the variations in the measure of interest over time.
The measure of interest is the number of cases starting within 5 minutes of the time scheduled each day.
The tool used should separate fluctuations due to chance from fluctuations due to outside causes which you may be able to control.
A simple “run chart” can show this difference
The Run Chart
For this example I will use a run chart template available on the Institute for Healthcare Improvement website.
http://www.ihi.org/resources/Pages/Tools/RunChart.aspx
Simple to construct
Precursor to the more detailed Control Chart tool
A reasonable first step

A Simple Run Chart
Median
Goal
0
2
4
6
8
10
12
14
16
9/1
/201
5
9/2
/201
5
9/3
/201
5
9/4
/201
5
9/5
/201
5
9/6
/201
5
9/7
/201
5
9/8
/201
5
9/9
/201
5
9/1
0/2
015
9/1
1/2
015
9/1
2/2
015
9/1
3/2
015
9/1
4/2
015
9/1
5/2
015
9/1
6/2
015
9/1
7/2
015
9/1
8/2
015
9/1
9/2
015
9/2
0/2
015
9/2
1/2
015
9/2
2/2
015
9/2
3/2
015
9/2
4/2
015
9/2
5/2
015
9/2
6/2
015
9/2
7/2
015
9/2
8/2
015
9/2
9/2
015
9/3
0/2
015
The ASC On Time Cases
http://www.ihi.org/resources/pages/tools/runchart.aspx
Evaluating a Run Chart
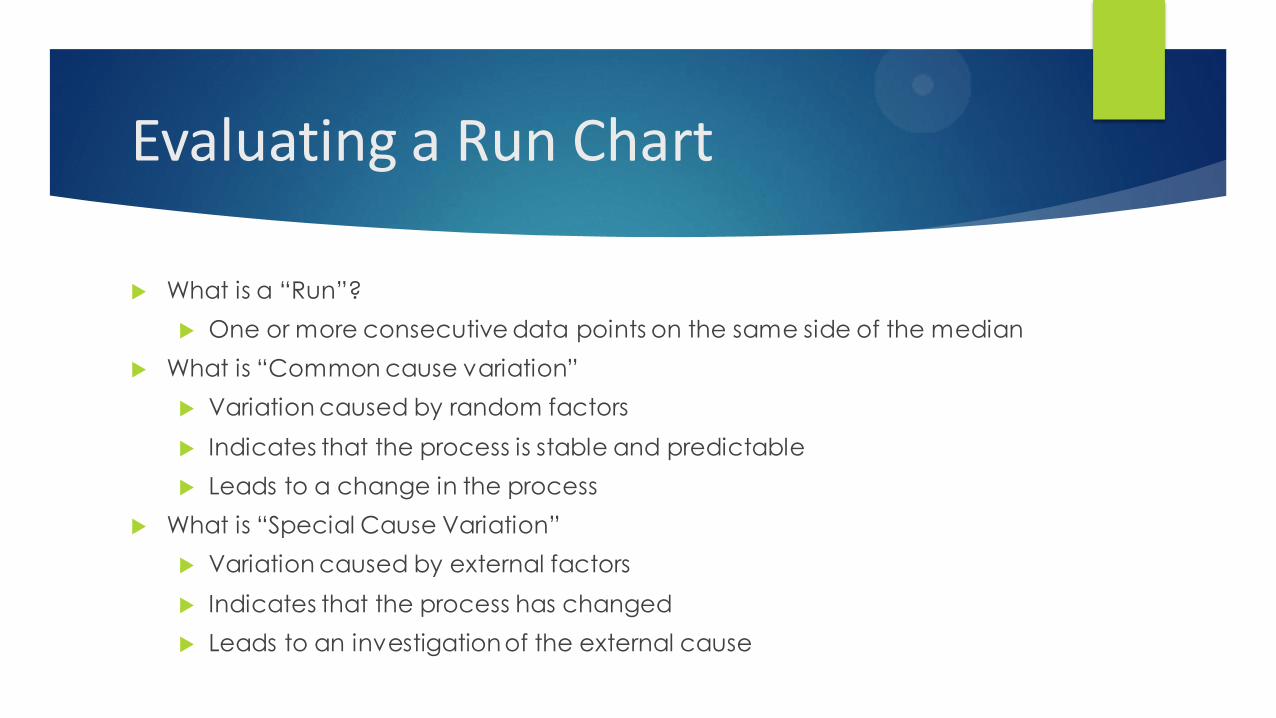
What is a “Run”?
One or more consecutive data points on the same side of the median
What is “Common cause variation”
Variation caused by random factors
Indicates that the process is stable and predictable
Leads to a change in the process
What is “Special Cause Variation”
Variation caused by external factors
Indicates that the process has changed
Leads to an investigation of the external cause

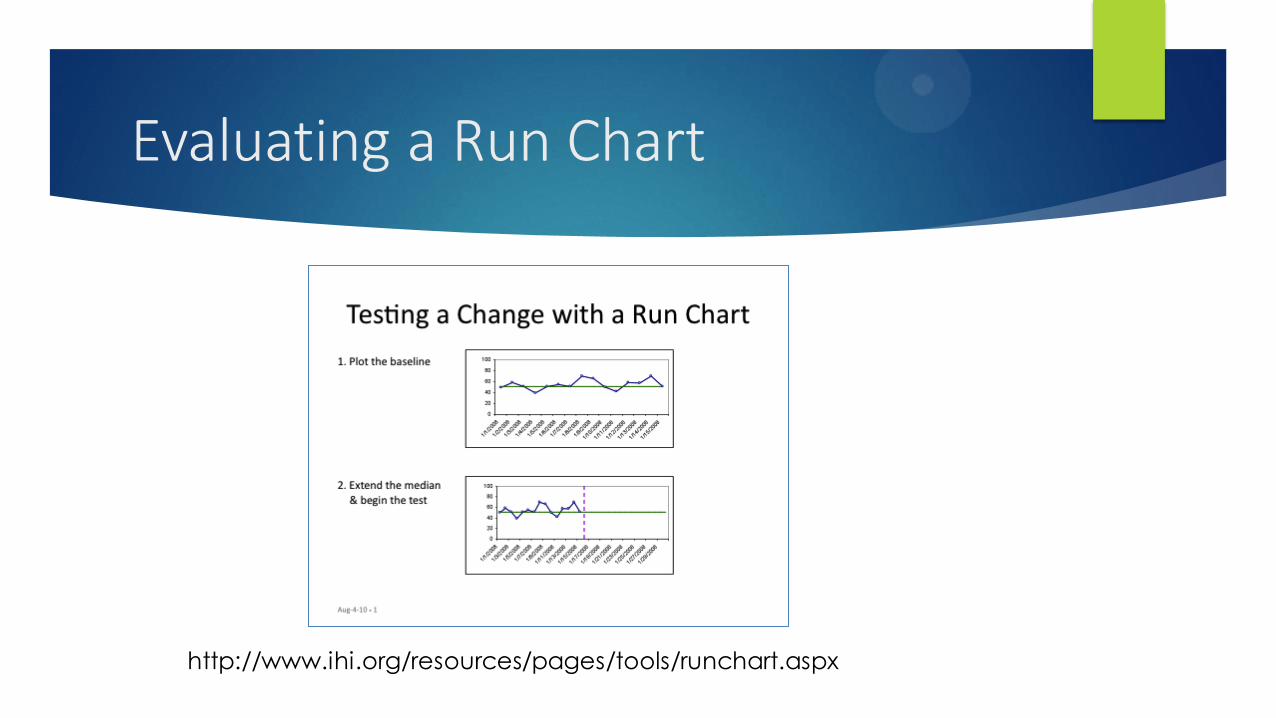
Evaluating a Run Chart
http://www.ihi.org/resources/pages/tools/runchart.aspx

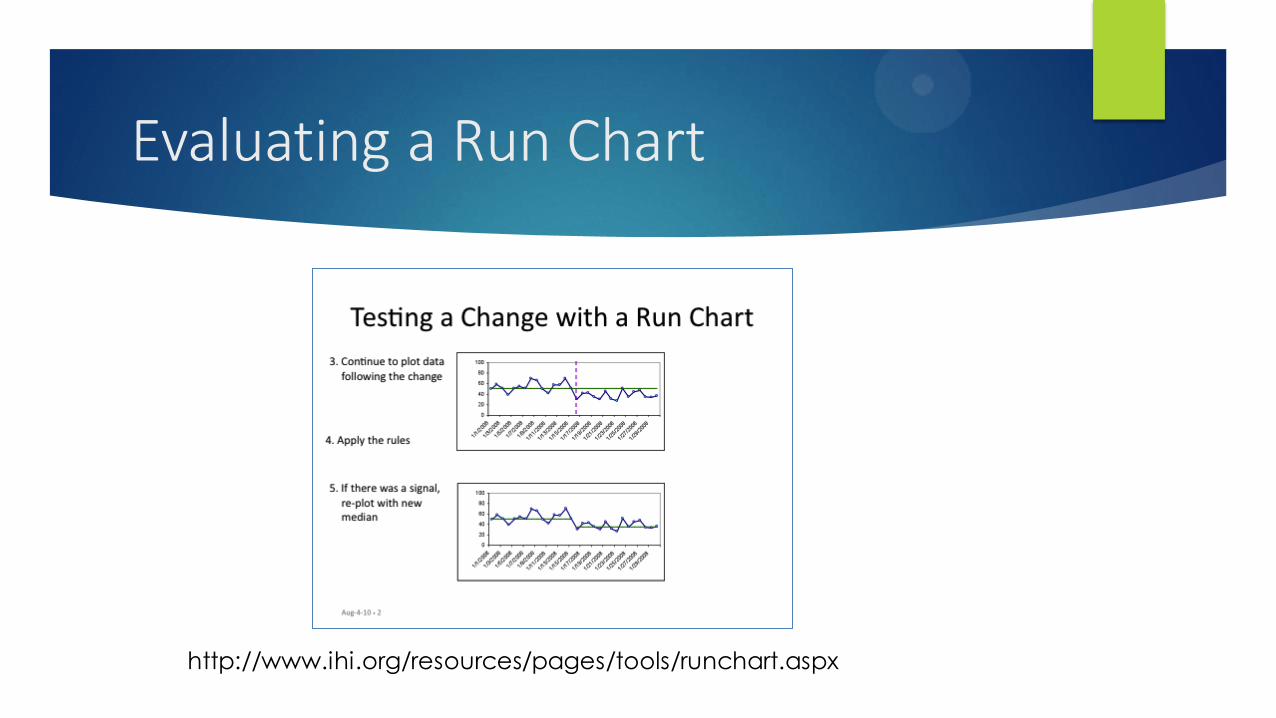
Evaluating a Run Chart
http://www.ihi.org/resources/pages/tools/runchart.aspx

Evaluating a Run Chart
http://www.ihi.org/resources/pages/tools/runchart.aspx
Evaluating a Run Chart
http://www.ihi.org/resources/pages/tools/runchart.aspx
Evaluating a Run Chart
http://www.ihi.org/resources/pages/tools/runchart.aspx
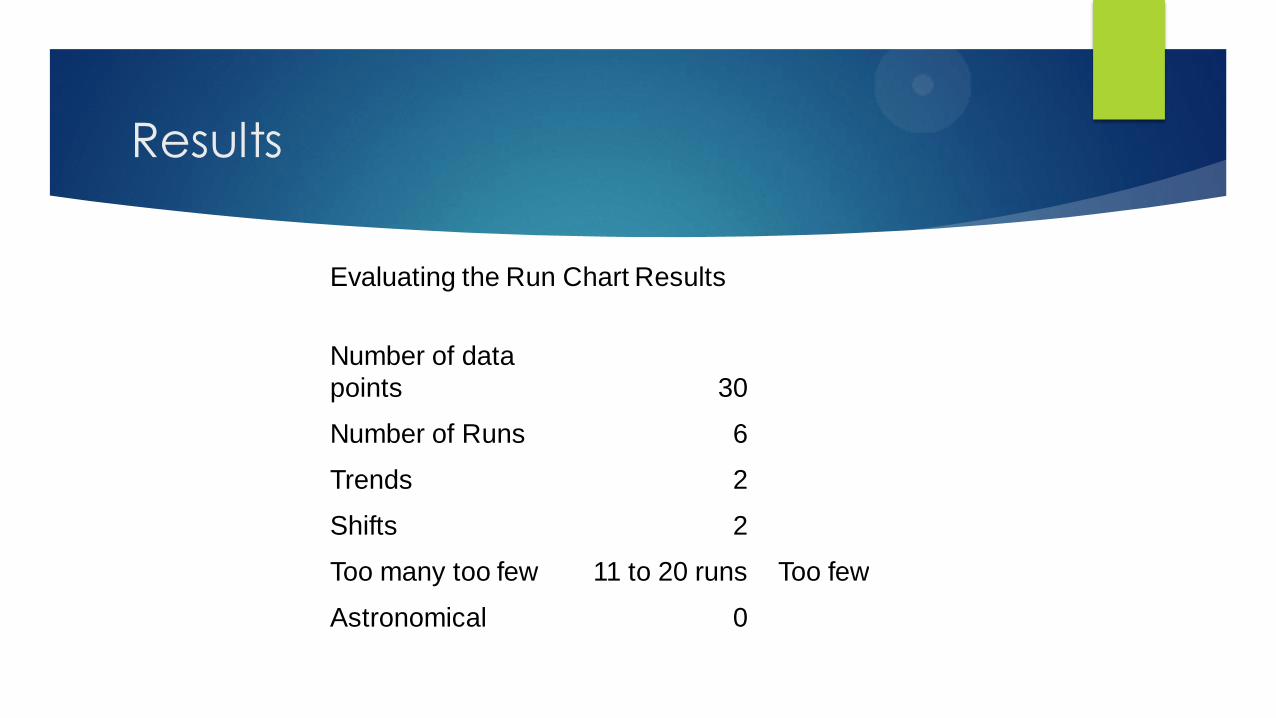
Results
Evaluating the Run Chart Results
Number of data
points 30
Number of Runs 6
Trends 2
Shifts 2
Too many too few 11 to 20 runs Too few
Astronomical 0
Control Charts
More advanced tool to study change in measures over time
Get an idea of things with a run chart then move on to a control chart
Templates and instructions are available on the web
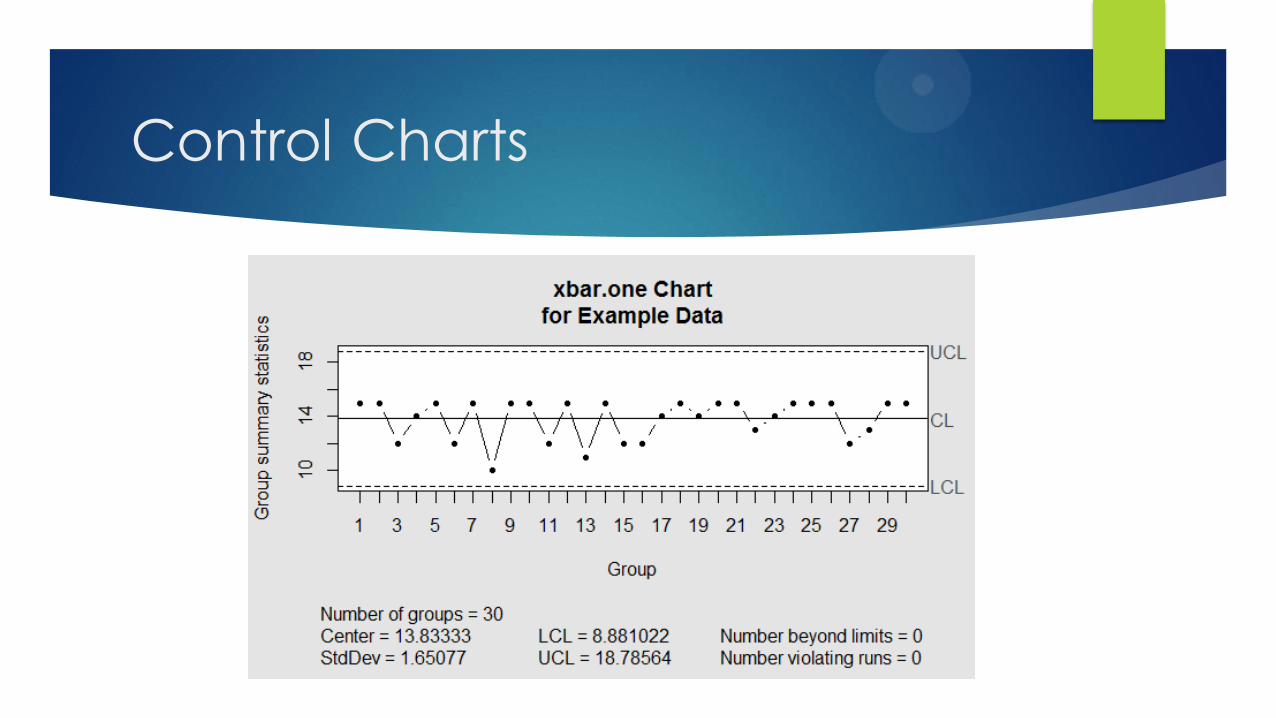
Control Charts
Review of what was covered
Like your data and get to know it
Look into programs that make sense to you
Be organized about it
Involve the right people (everyone)
Get the data that fits your question
Keep it simple

Resources
Carey, R. G. Improving Healthcare With Control Charts – Basic and Advanced SPC Methods and Case Studies,
ASQ Quality Press, 2003.
Leak, J. The Elements of Data Analytic Style - A guide for people who want to analyze data.
http://leanpub.com/datastyle Version accessed 2015-03-02
Health care IT news
http://www.healthcareitnews.com/directory/agency-healthcare-research-and-quality-ahrq
Agency for Healthcare Research and Quality
http://qualityindicators.ahrq.gov/

Resources
Oregon Ambulatory Surgery Center Reporting
http://www.oregon.gov/oha/OHPR/RSCH/pages/ambulatory_surgery_reporting.aspx
The home of the U.S. Government’s open data
http://www.data.gov/
American Society for Quality
http://asq.org/index.aspx
Institute for Healthcare Improvement
http://www.ihi.org/about/Pages/default.aspx
Resources
National Associat ion for Healthcare Quality
http://www.nahq.org/about/content/aboutnahqindex.html
Montgomery, Douglas, C. Int roduction to Stat ist ical Quality Cont rol, Sixth Edit ion
978-0-470-16992-6 2009 by John Wiley & Sons, Inc.
http://www.directtextbook.com/isbn/9780470169926
Creating The Analyt ics Plan
http://stevetodd.typepad.com/my_weblog/2012/03/phase-1-innovation-analyt ics-creating-the-analyt ics-plan-.html
Accessed 9/30/2015
Walter A Shewhart , 1924, and the Hawthorne Factory
http://www.ncbi.nlm.nih.gov/pmc/art icles/PMC2464836/
Accessed 10/2/2015
Resources
Engineering Statistics Handbook
http://www.itl.nist.gov/div898/handbook/index.htm
Handbook for Basic Process Improvement – Air University
http://www.au.af.mil/au/awc/awcgate/navy/bpi_manual/handbook.htm
Data Analytics for the ASC
Questions
Related Documents


