Frequency Lines Frequency Lines Identification: Identification: cmt package for cmt package for On-line (by Fd ) and Off- On-line (by Fd ) and Off- line Virgo data quality line Virgo data quality Sabrina D’Antonio Roma2 Tor Vergata Sabrina D’Antonio Roma2 Tor Vergata Roma 1 Pulsar group: Roma 1 Pulsar group: Pia Astone, Sergio Frasca, Cristiano Pia Astone, Sergio Frasca, Cristiano Palomba, Federica Antonucci Palomba, Federica Antonucci

Data quality tool: frequency domain lines identification by the PSS library (Rome 1 group)
Jan 02, 2016
Frequency Lines Identification: cmt package for On-line (by Fd ) and Off-line Virgo data quality Sabrina D’Antonio Roma2 Tor Vergata Roma 1 Pulsar group: Pia Astone, Sergio Frasca, Cristiano Palomba, Federica Antonucci. - PowerPoint PPT Presentation
Welcome message from author
This document is posted to help you gain knowledge. Please leave a comment to let me know what you think about it! Share it to your friends and learn new things together.
Transcript

Frequency Lines Frequency Lines Identification: Identification: cmt package for cmt package for On-line (by Fd ) and Off-line On-line (by Fd ) and Off-line Virgo data qualityVirgo data quality
Sabrina D’Antonio Roma2 Tor VergataSabrina D’Antonio Roma2 Tor Vergata
Roma 1 Pulsar group:Roma 1 Pulsar group:Pia Astone, Sergio Frasca, Cristiano Palomba, Pia Astone, Sergio Frasca, Cristiano Palomba, Federica AntonucciFederica Antonucci

Data quality tool: frequency Data quality tool: frequency domain lines identification domain lines identification by the PSS libraryby the PSS library (Rome 1 (Rome 1 group)group)
SUMMARY:
Time domain disturbances: event’s identification and removal (to obtain clean data)
Estimation of the average AR spectrum
Frequency domain lines identification
The log file and the spectra files
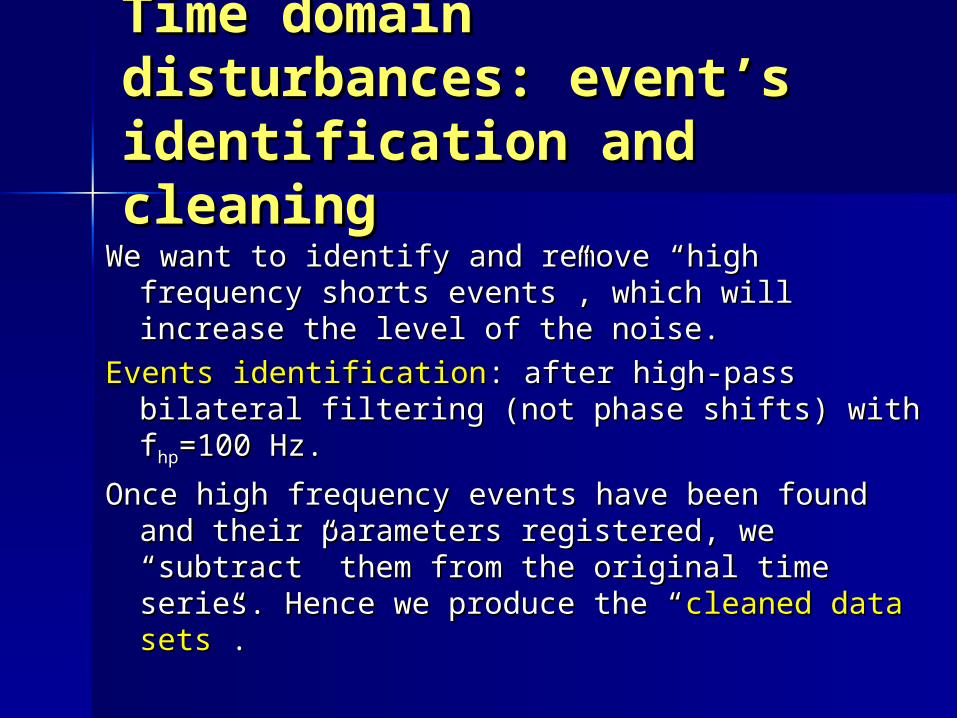
We want to identify and remove “high frequency We want to identify and remove “high frequency shorts events”, which will increase the level of shorts events”, which will increase the level of the noise.the noise.
Events identificationEvents identification: after high-pass bilateral : after high-pass bilateral filtering (not phase shifts) with ffiltering (not phase shifts) with fhphp=100 Hz.=100 Hz.
Once high frequency events have been found and Once high frequency events have been found and their parameters registered, we “subtract” them their parameters registered, we “subtract” them from the original time series. Hence we produce from the original time series. Hence we produce the “the “cleaned data setscleaned data sets”.”.
Time domain Time domain disturbances: event’s disturbances: event’s identification and identification and cleaningcleaning
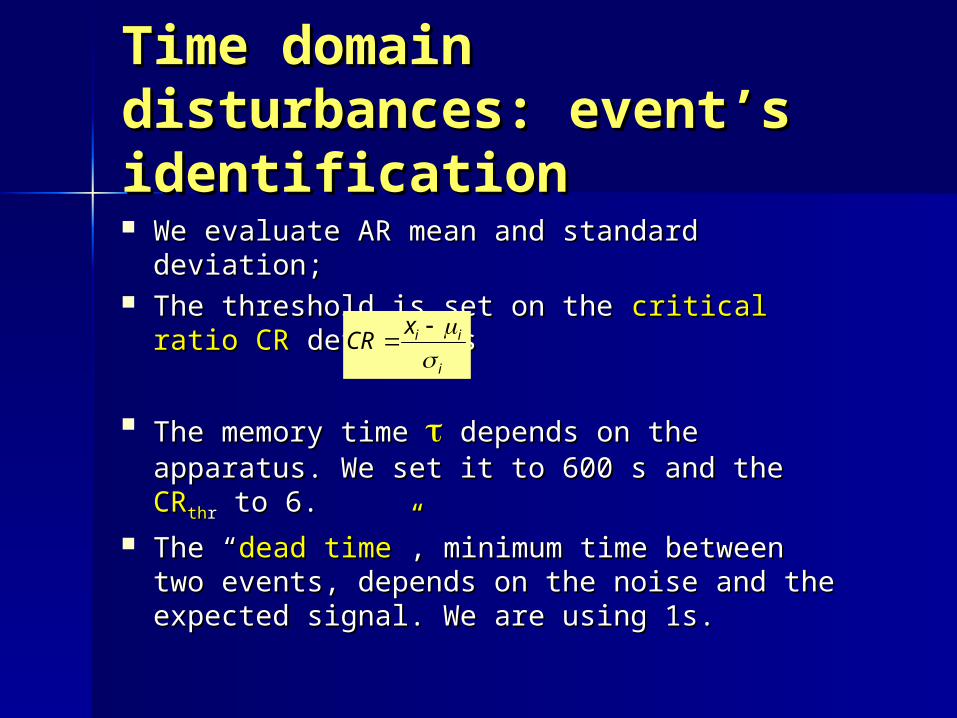
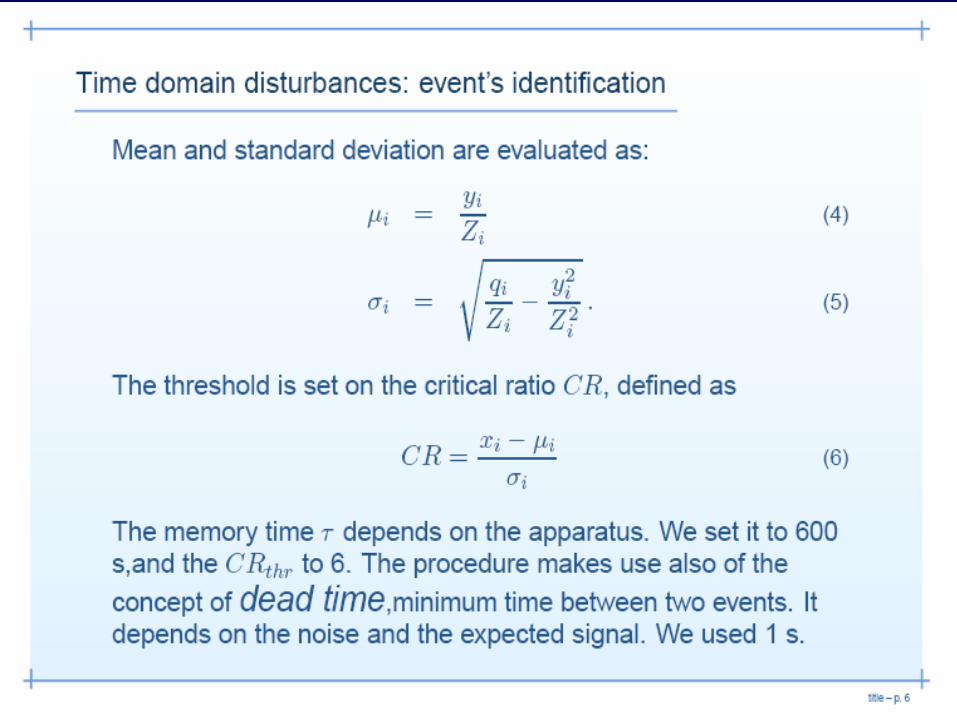
Time domain Time domain disturbances: event’s disturbances: event’s identificationidentification We evaluate AR mean and standard deviation;We evaluate AR mean and standard deviation; The threshold is set on the The threshold is set on the critical ratio CRcritical ratio CR
defined as defined as
The memory time The memory time depends on the depends on the apparatus. We set it to 600 s and the apparatus. We set it to 600 s and the CRCRththrr to to 6.6.
The “The “dead time”dead time”, minimum time between two , minimum time between two events, depends on the noise and the events, depends on the noise and the expected signal. We are using 1s.expected signal. We are using 1s.
i
iixCR
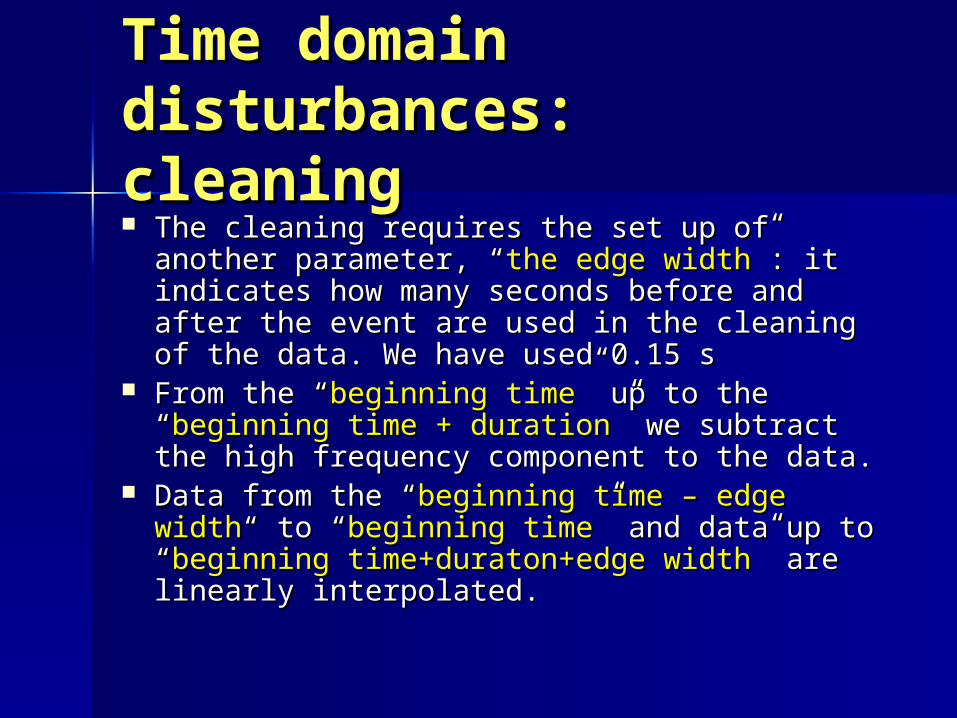
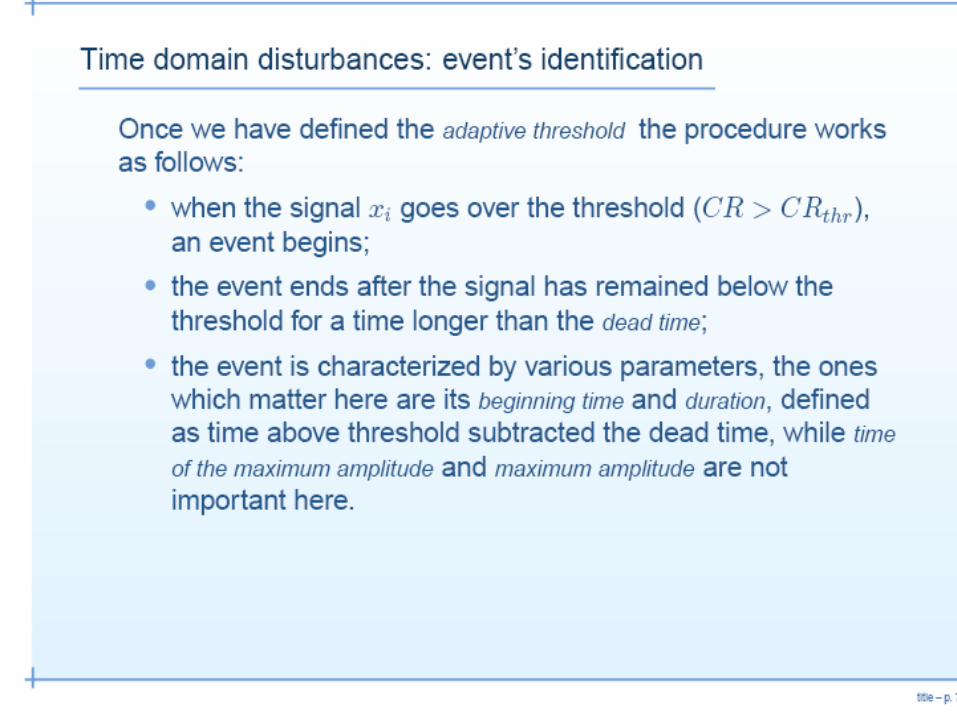
The cleaning requires the set up of another The cleaning requires the set up of another parameter, “parameter, “the edge widththe edge width”: it indicates ”: it indicates how many seconds before and after the how many seconds before and after the event are used in the cleaning of the data. event are used in the cleaning of the data. We have used 0.15 sWe have used 0.15 s
From the “From the “beginning timebeginning time” up to the ” up to the ““beginning time + durationbeginning time + duration” we subtract the ” we subtract the high frequency component to the data.high frequency component to the data.
Data from the “Data from the “beginning time – edge widthbeginning time – edge width“ “ to “to “beginning timebeginning time” and data up to ” and data up to ““beginning time+duraton+edge widthbeginning time+duraton+edge width” are ” are linearly interpolated.linearly interpolated.
Time domain Time domain disturbances: cleaningdisturbances: cleaning

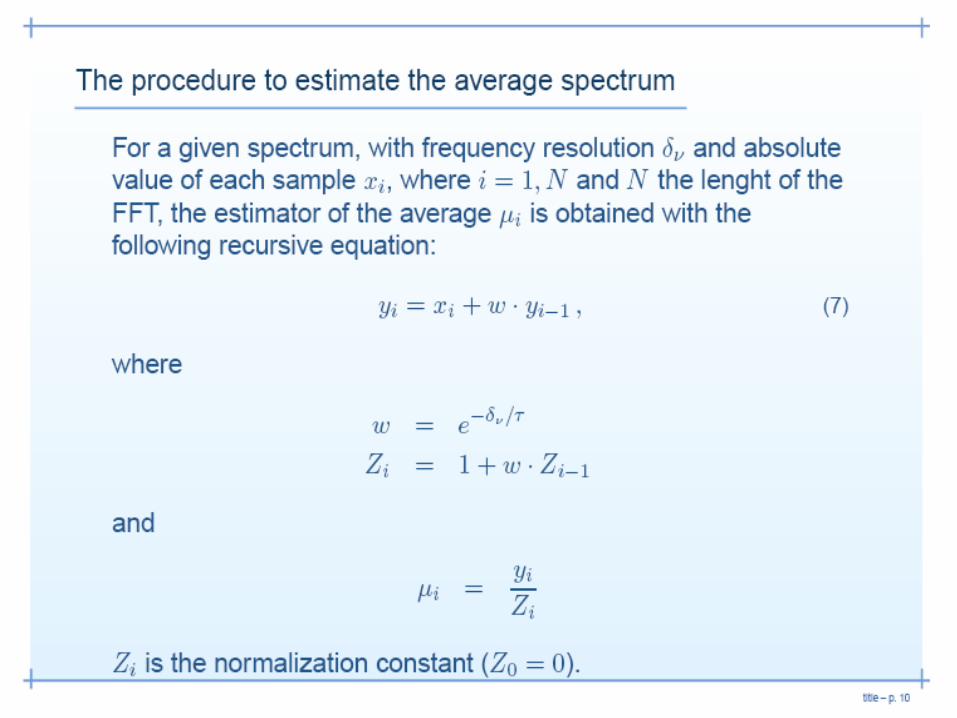
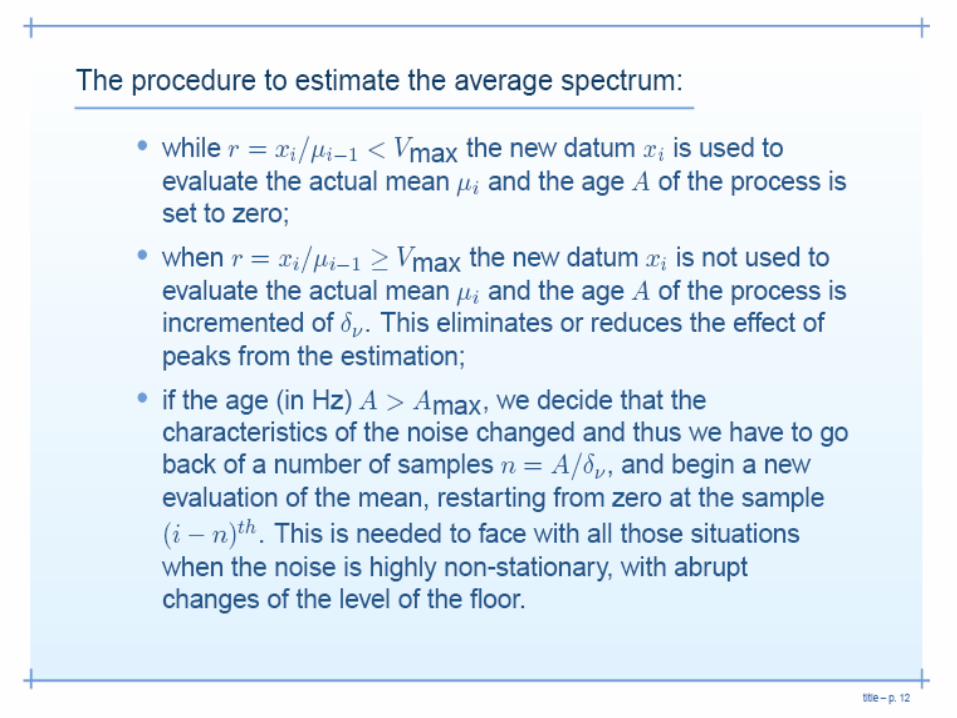
The procedure to The procedure to estimate the average estimate the average spectrumspectrumA good estimator should have the following A good estimator should have the following
properties:properties:If peaks in the frequency domain are present, If peaks in the frequency domain are present,
the estimator should not be affected by the estimator should not be affected by peaks. This should be as much as possible peaks. This should be as much as possible independent on the SNR of the peak;independent on the SNR of the peak;
If the noise level varies, either slowly or rapidly, If the noise level varies, either slowly or rapidly, the estimator should be able to follow the the estimator should be able to follow the noise variations.noise variations.
We refined the procedure, with the use of an We refined the procedure, with the use of an autoregressive estimation (AR) of the autoregressive estimation (AR) of the average of the spectrum, with the basic idea average of the spectrum, with the basic idea of a “clean estimator” .of a “clean estimator” .

AR estimation. Already described applied from AR estimation. Already described applied from higher frequencies toward lower frequencies.higher frequencies toward lower frequencies.
To deal with the increasing of the noise level To deal with the increasing of the noise level toward lower frequencies.toward lower frequencies.
FFT length: 4194314 ->T=1048.6s FFT mode: overlapped (or not) by the half,
flat top- cosine window
The procedure to The procedure to estimate the average estimate the average spectrumspectrum
The frequency lines search starts with the ratio R of the spectrum to its AR estimation. On thisfunction, we set a threshold at the level of SNRthr
=(2.5)0.5.In the log files we record frequency lines with SNR≥GEN_FAC*GEN_FAC*SNRthr
(GEN_FACT used =2).
All the data which cross the threshold are local maxima are then registered into the log file.
Lines frequency Lines frequency identification: peak mapidentification: peak map
Output FilesOutput Files
Log fileLog file Date_of_creation.log: Date_of_creation.log:* information about time domain and frequency domain events* information about time domain and frequency domain events*one file for all the processed time period (?)*one file for all the processed time period (?)*24 Mb (10 days). *24 Mb (10 days). Spectra filesSpectra files: : PS with high frequency resolution df=9.5367e-004 HzPS with high frequency resolution df=9.5367e-004 HzA new file every 100 FFT (?)A new file every 100 FFT (?)Dimension ~ 850 MbDimension ~ 850 Mb
PS with lower frequency resolution df*128 HzPS with lower frequency resolution df*128 HzDimension ~ 6.3 Mb Dimension ~ 6.3 Mb

PSS crea_sfdb job log file PSS crea_sfdb job log file started at Wed Jan 23 09:51:32 2008 started at Wed Jan 23 09:51:32 2008 INPUT : VIR_h_4000Hz_869983200.GWF First data INPUT : VIR_h_4000Hz_869983200.GWF First data
time in the first file of the runtime in the first file of the run OUTPUT : VIR_h_4000Hz_869983200.SBL The first OUTPUT : VIR_h_4000Hz_869983200.SBL The first
SBL file openedSBL file opened ! even NEW: a new FFT has started ! even NEW: a new FFT has started ! PAR1: Beginning time of the new FFT ! PAR1: Beginning time of the new FFT ! PAR2: FFT number in the run ! PAR2: FFT number in the run ! even EVT: time domain events ! even EVT: time domain events ! PAR1: Beginning time, in mjd ! PAR1: Beginning time, in mjd ! PAR2: Duration [s] ! PAR2: Duration [s] ! PAR3: Max hp data amplitude*EINSTEIN ! PAR3: Max hp data amplitude*EINSTEIN ! PAR4: Max CR ! PAR4: Max CR ! PAR5: Energy (sum of squared amp) ! PAR5: Energy (sum of squared amp)
Log file infoLog file info
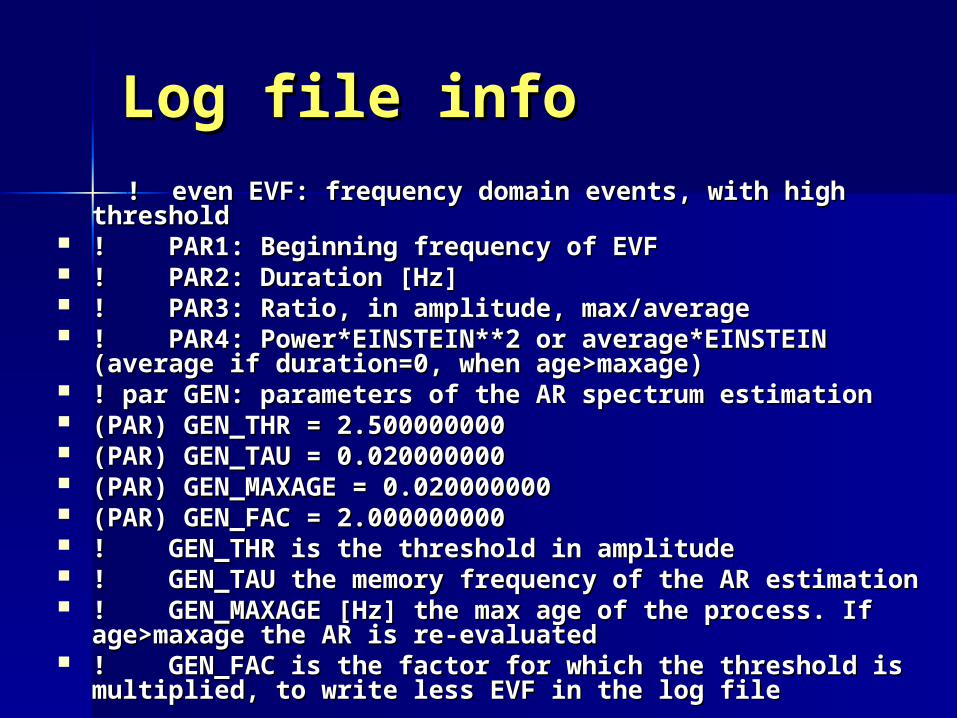
Log file infoLog file info ! even EVF: frequency domain events, with high ! even EVF: frequency domain events, with high
threshold threshold ! PAR1: Beginning frequency of EVF ! PAR1: Beginning frequency of EVF ! PAR2: Duration [Hz] ! PAR2: Duration [Hz] ! PAR3: Ratio, in amplitude, max/average ! PAR3: Ratio, in amplitude, max/average ! PAR4: Power*EINSTEIN**2 or average*EINSTEIN ! PAR4: Power*EINSTEIN**2 or average*EINSTEIN
(average if duration=0, when age>maxage) (average if duration=0, when age>maxage) ! par GEN: parameters of the AR spectrum estimation ! par GEN: parameters of the AR spectrum estimation (PAR) GEN_THR = 2.500000000 (PAR) GEN_THR = 2.500000000 (PAR) GEN_TAU = 0.020000000 (PAR) GEN_TAU = 0.020000000 (PAR) GEN_MAXAGE = 0.020000000 (PAR) GEN_MAXAGE = 0.020000000 (PAR) GEN_FAC = 2.000000000 (PAR) GEN_FAC = 2.000000000 ! GEN_THR is the threshold in amplitude ! GEN_THR is the threshold in amplitude ! GEN_TAU the memory frequency of the AR estimation ! GEN_TAU the memory frequency of the AR estimation ! GEN_MAXAGE [Hz] the max age of the process. If ! GEN_MAXAGE [Hz] the max age of the process. If
age>maxage the AR is re-evaluated age>maxage the AR is re-evaluated ! GEN_FAC is the factor for which the threshold is ! GEN_FAC is the factor for which the threshold is
multiplied, to write less EVF in the log file multiplied, to write less EVF in the log file
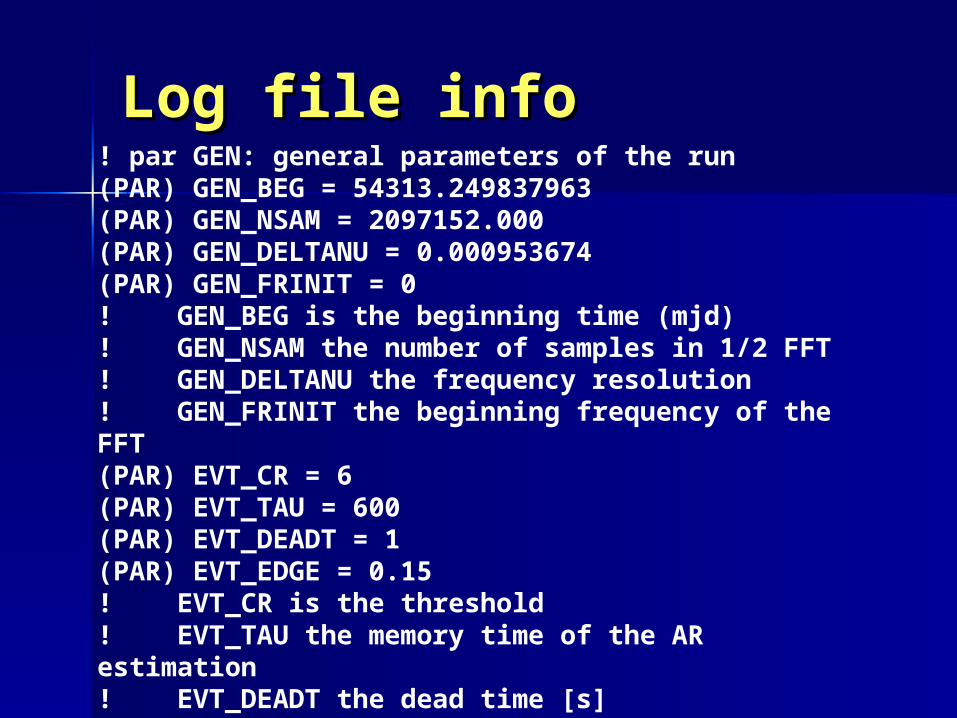
Log file infoLog file info! par GEN: general parameters of the run (PAR) GEN_BEG = 54313.249837963 (PAR) GEN_NSAM = 2097152.000 (PAR) GEN_DELTANU = 0.000953674 (PAR) GEN_FRINIT = 0 ! GEN_BEG is the beginning time (mjd) ! GEN_NSAM the number of samples in 1/2 FFT ! GEN_DELTANU the frequency resolution ! GEN_FRINIT the beginning frequency of the FFT (PAR) EVT_CR = 6 (PAR) EVT_TAU = 600 (PAR) EVT_DEADT = 1 (PAR) EVT_EDGE = 0.15 ! EVT_CR is the threshold ! EVT_TAU the memory time of the AR estimation ! EVT_DEADT the dead time [s] ! EVT_EDGE seconds purged around the event
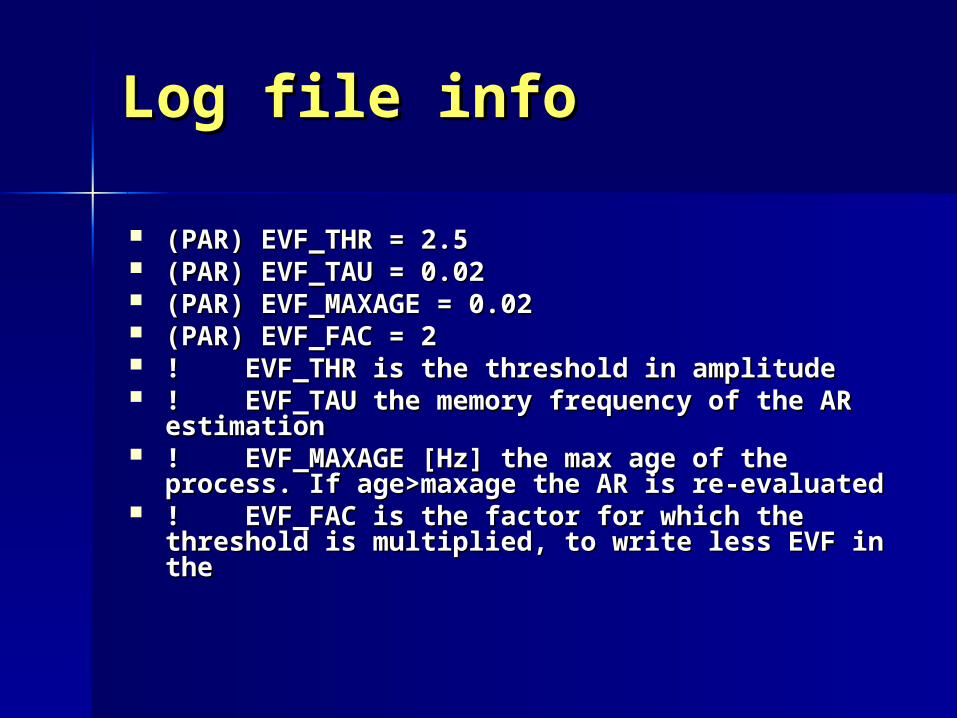
(PAR) EVF_THR = 2.5 (PAR) EVF_THR = 2.5 (PAR) EVF_TAU = 0.02 (PAR) EVF_TAU = 0.02 (PAR) EVF_MAXAGE = 0.02 (PAR) EVF_MAXAGE = 0.02 (PAR) EVF_FAC = 2 (PAR) EVF_FAC = 2 ! EVF_THR is the threshold in amplitude ! EVF_THR is the threshold in amplitude ! EVF_TAU the memory frequency of the AR ! EVF_TAU the memory frequency of the AR
estimation estimation ! EVF_MAXAGE [Hz] the max age of the ! EVF_MAXAGE [Hz] the max age of the
process. If age>maxage the AR is re-evaluated process. If age>maxage the AR is re-evaluated ! EVF_FAC is the factor for which the threshold ! EVF_FAC is the factor for which the threshold
is multiplied, to write less EVF in the is multiplied, to write less EVF in the
Log file infoLog file info
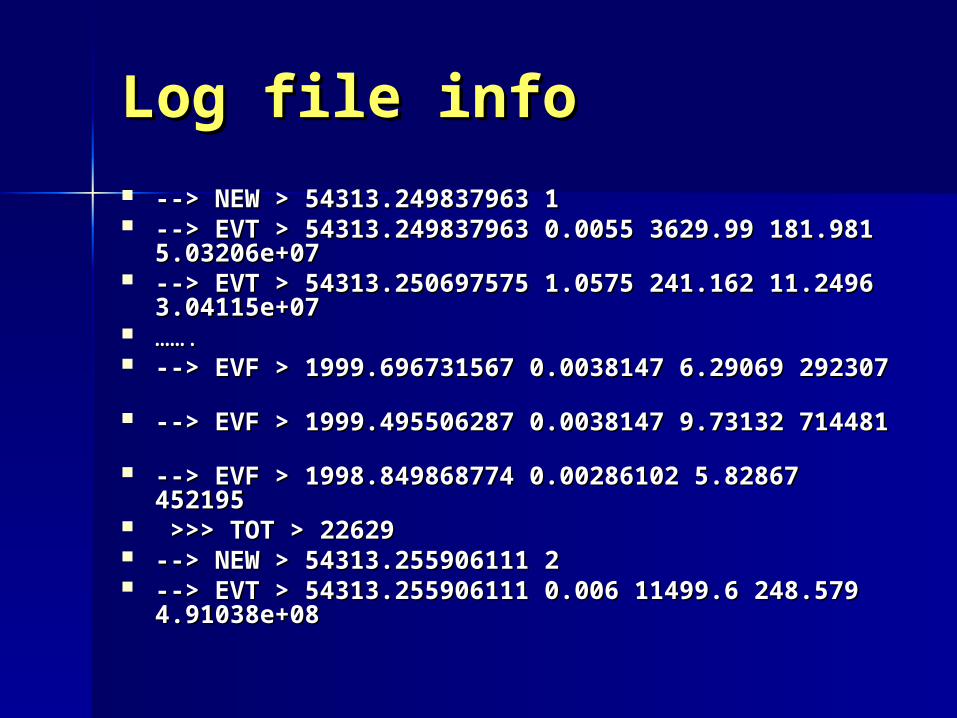
--> NEW > 54313.249837963 1 --> NEW > 54313.249837963 1 --> EVT > 54313.249837963 0.0055 3629.99 --> EVT > 54313.249837963 0.0055 3629.99
181.981 5.03206e+07 181.981 5.03206e+07 --> EVT > 54313.250697575 1.0575 241.162 --> EVT > 54313.250697575 1.0575 241.162
11.2496 3.04115e+0711.2496 3.04115e+07 …………. . --> EVF > 1999.696731567 0.0038147 6.29069 --> EVF > 1999.696731567 0.0038147 6.29069
292307 292307 --> EVF > 1999.495506287 0.0038147 9.73132 --> EVF > 1999.495506287 0.0038147 9.73132
714481 714481 --> EVF > 1998.849868774 0.00286102 5.82867 --> EVF > 1998.849868774 0.00286102 5.82867
452195452195 >>> TOT > 22629 >>> TOT > 22629 --> NEW > 54313.255906111 2 --> NEW > 54313.255906111 2 --> EVT > 54313.255906111 0.006 11499.6 --> EVT > 54313.255906111 0.006 11499.6
248.579 4.91038e+08 248.579 4.91038e+08
Log file infoLog file info
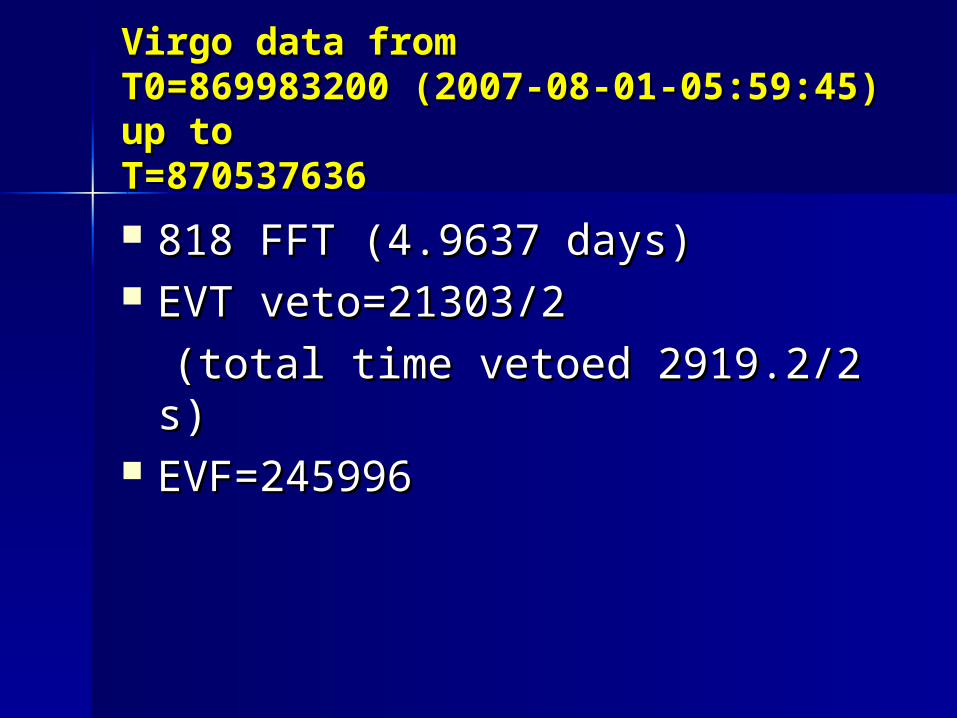
Virgo data from Virgo data from T0=869983200 (2007-08-01-T0=869983200 (2007-08-01-05:59:45)05:59:45)up toup toT=870537636T=870537636 818 FFT (4.9637 days)818 FFT (4.9637 days) EVT veto=21303/2EVT veto=21303/2
(total time vetoed 2919.2/2 s)(total time vetoed 2919.2/2 s) EVF=245996EVF=245996

From the log files: From the log files: Time-events veto Time-events veto
<A>=8.895 10-
17
=5.95 10-15
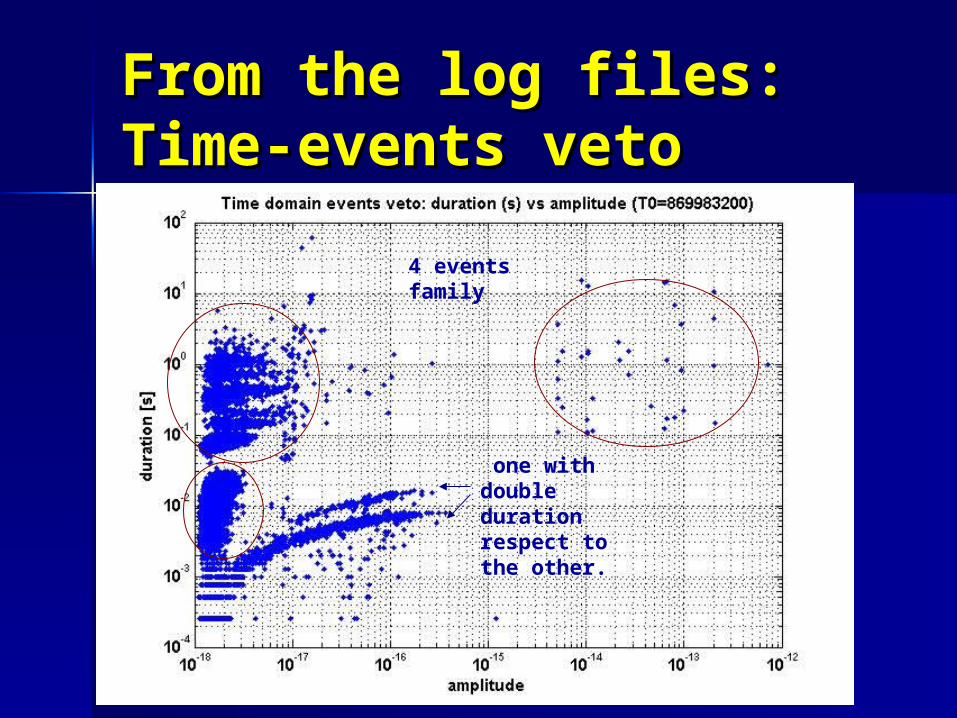
From the log files: From the log files: Time-events vetoTime-events veto
one with double duration respect to the other.
4 events family

From the log files: From the log files: Time-events vetoTime-events veto

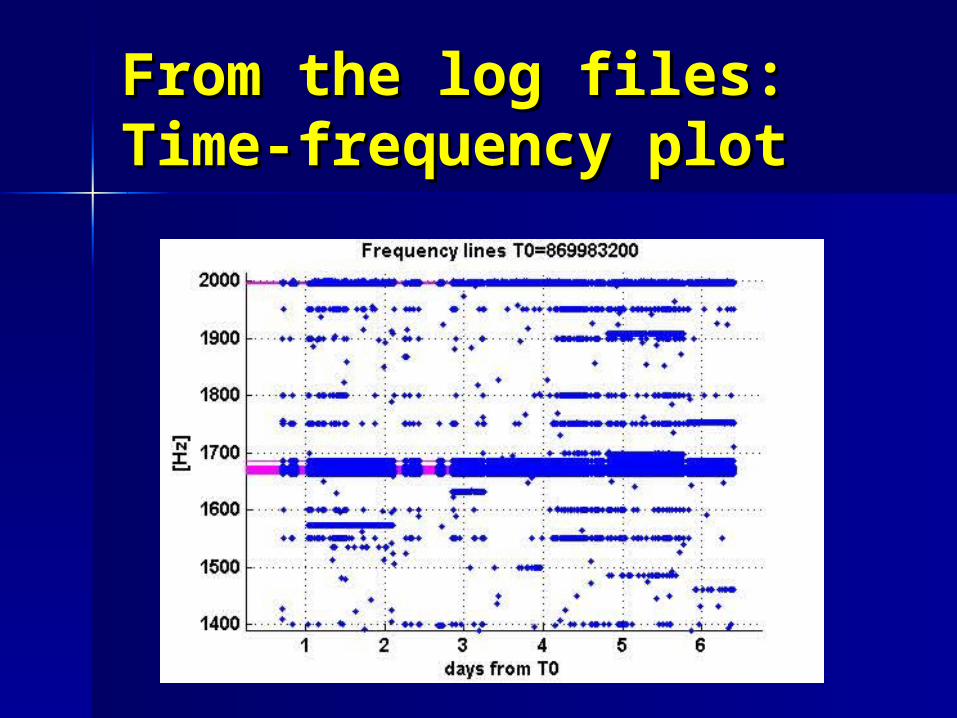
From the log files: From the log files: Time-frequency plotTime-frequency plot
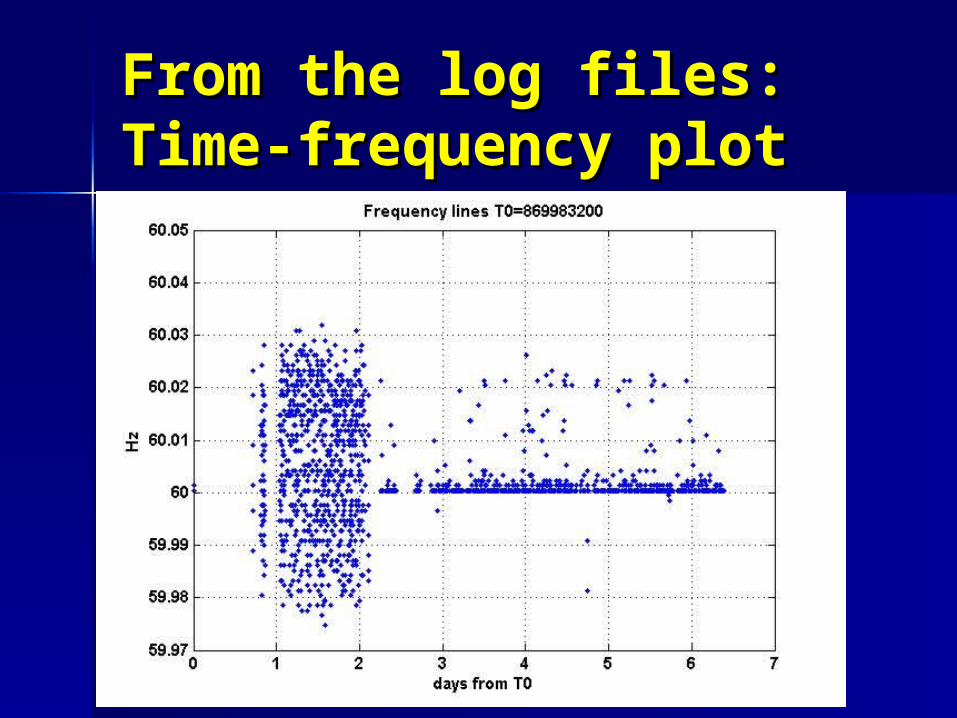
From the log files: From the log files: Time-frequency plotTime-frequency plot
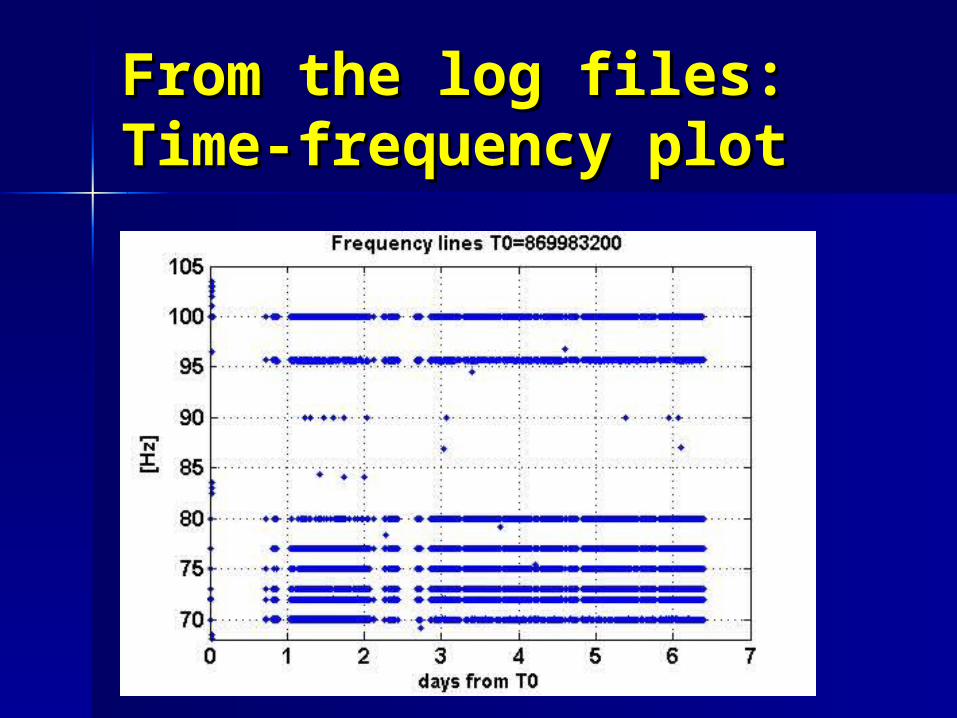
From the log files: From the log files: Time-frequency plotTime-frequency plot
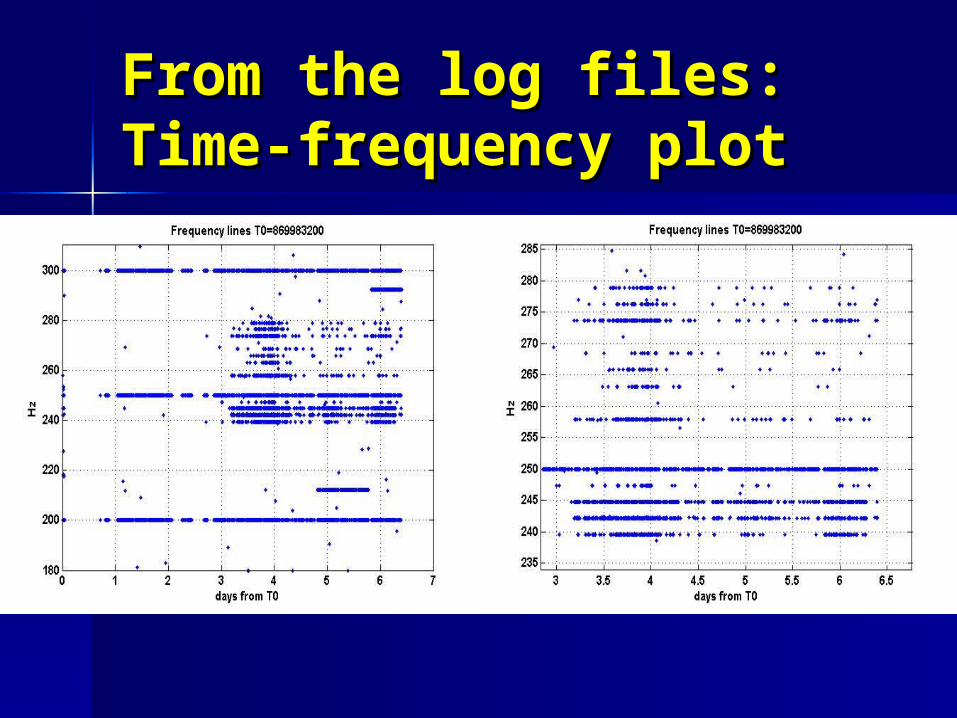
From the log files: From the log files: Time-frequency plotTime-frequency plot
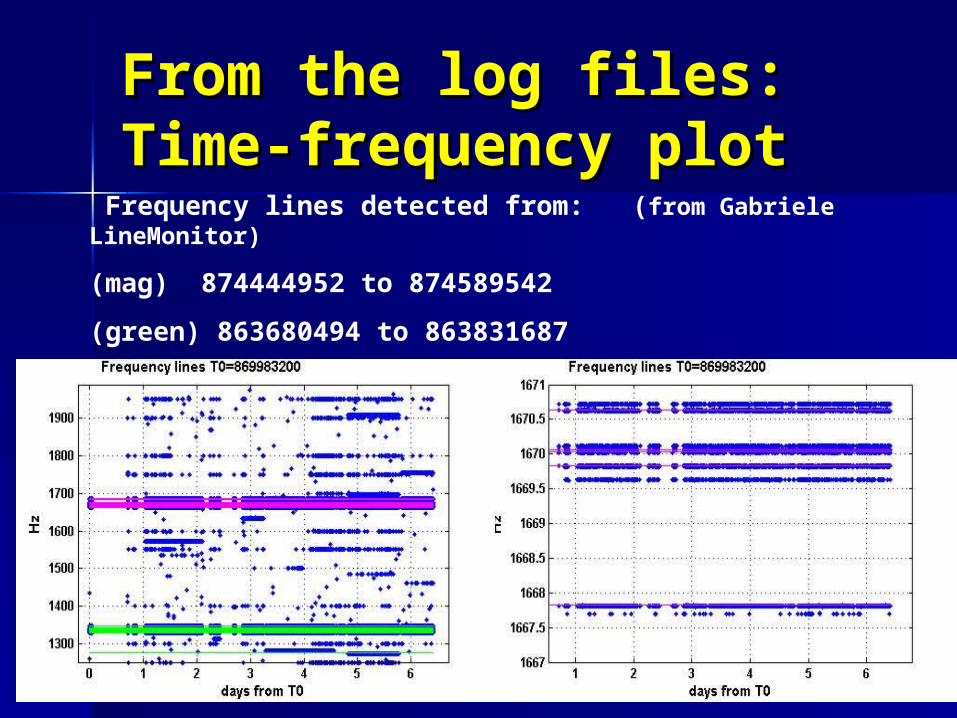
From the log files: From the log files: Time-frequency plotTime-frequency plot
Frequency lines detected from: (from Gabriele LineMonitor)
(mag) 874444952 to 874589542
(green) 863680494 to 863831687

From the log files: From the log files: Time-frequency plotTime-frequency plot
Frequency lines detected from: (from Gabriele LineMonitor)
(mag) 874444952 to 874589542
(green) 863680494 to 863831687
From the log files: From the log files: Time-frequency plotTime-frequency plot
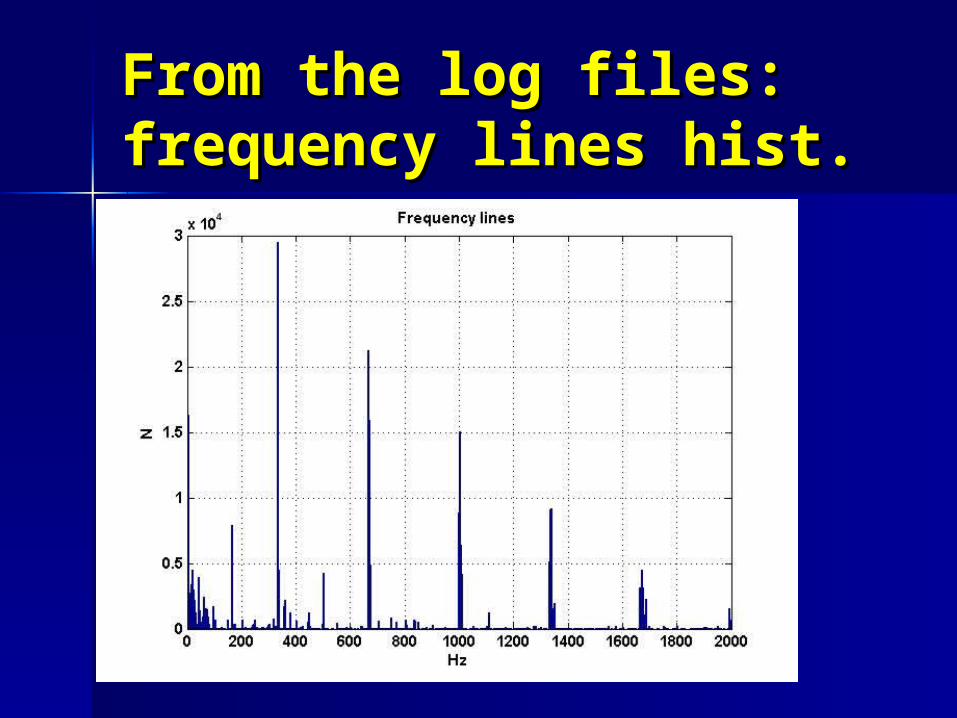
From the log files: From the log files: frequency lines hist.frequency lines hist.

From the log files: From the log files: frequency lines hist.frequency lines hist.
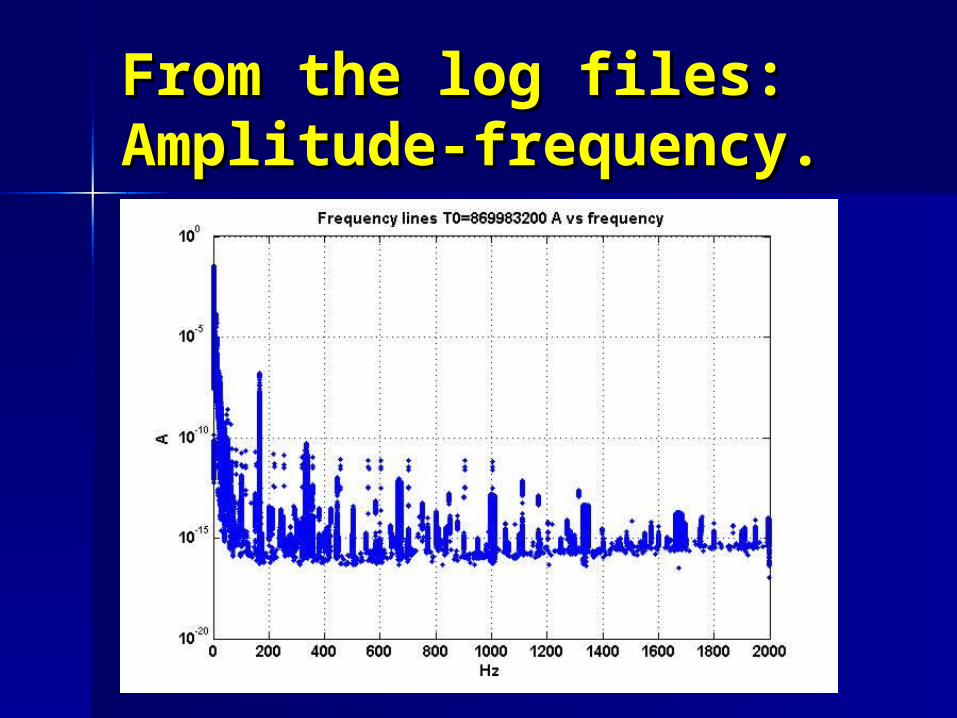
From the log files: From the log files: Amplitude-frequency.Amplitude-frequency.

From the log files: From the log files: CR-frequency.CR-frequency.

From the log files: From the log files: CRCR
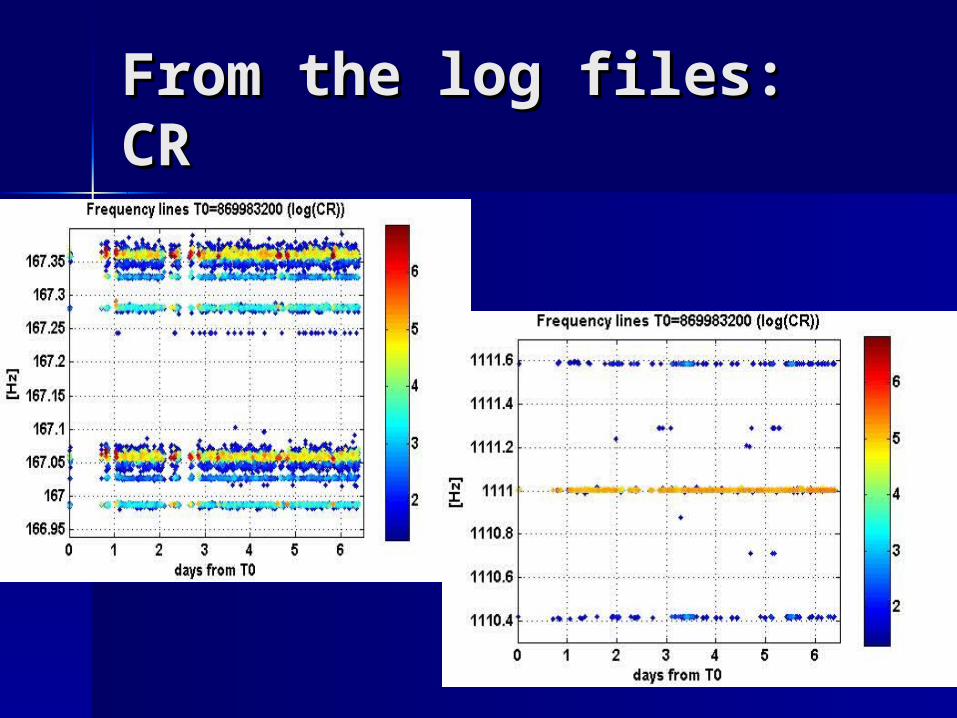
From the log files: From the log files: CRCR

From the log files: From the log files: Duration vs frequencyDuration vs frequency
red dot :
Duration> EVF_MAXAGE EVF_MAXAGE = 0.02= 0.02 Hz
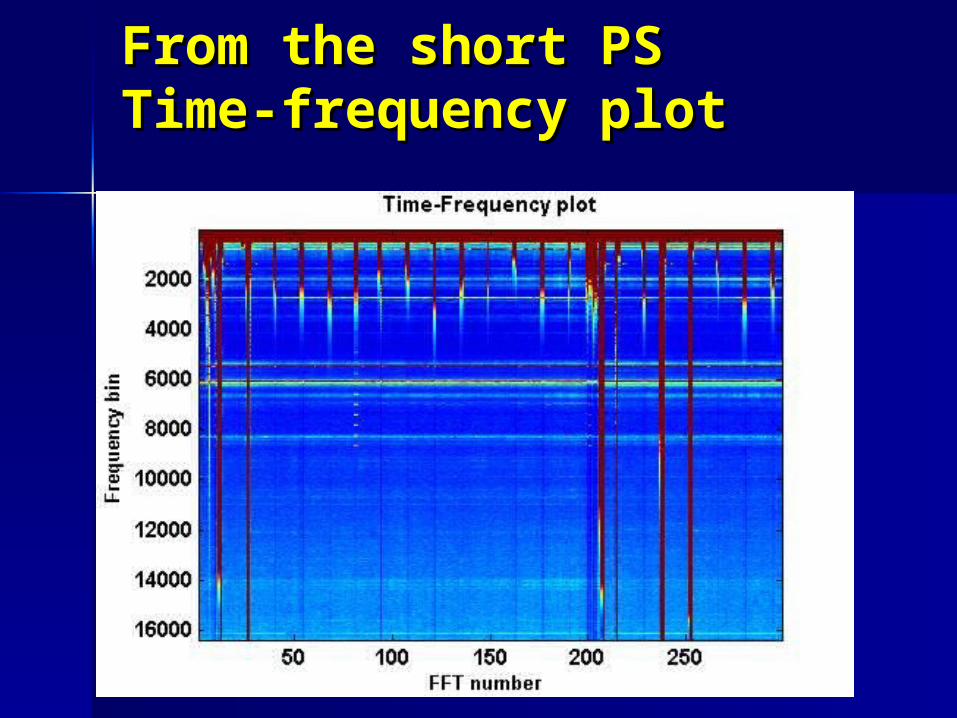
From the short PSFrom the short PSTime-frequency plotTime-frequency plot


TO BE DONE:
To write the documentation
To define with interested people :
files dimension (open a new file after N FFT)
Writing of the output files optional
Lower the SNRthr ….
Suggestions…


Related Documents