Insurance Information Bureau of India Data Quality Manual 10/30/2014

Welcome message from author
This document is posted to help you gain knowledge. Please leave a comment to let me know what you think about it! Share it to your friends and learn new things together.
Transcript
Insurance Information Bureau of India Data Quality Manual
10/30/2014

Page 2 of 21 © Insurance Information Bureau of India, 2014
Contents 1. INTRODUCTION ............................................................................................................................................ 3
2. DATA FLOW ..................................................................................................................................................... 4
3. TYPES OF CHECKS ....................................................................................................................................... 6
3.1 Financial Reconciliation ....................................................................................................... 6
3.2 Data Checks ....................................................................................................................... 6
4. QUALITY SCORECARD METHODOLOGY.......................................................................................... 8
4.1 Financial Reconciliation Score .............................................................................................. 8
4.2 Data Checks Score .............................................................................................................. 8
5. MOTOR ............................................................................................................................................................. 10
5.1 Financial Reconciliation ........................................................................................................... 10
5.2 Validity Checks ....................................................................................................................... 10
5.3 Relationship Checks ................................................................................................................ 11
5.4 Reasonability Checks ............................................................................................................... 12
5.5 Uniqueness Checks ................................................................................................................. 12
5.6 Consistency Checks ................................................................................................................. 12
5.7 Distributional Analysis Checks ................................................................................................. 13
6. FIRE ................................................................................................................................................................... 14
6.1 Financial Reconciliation ........................................................................................................... 14
6.2 Validity Checks ....................................................................................................................... 14
6.3 Relationship Checks ................................................................................................................ 15
6.4 Reasonability Checks ............................................................................................................... 15
6.5 Uniqueness Checks ................................................................................................................. 15
6.6 Consistency Checks ................................................................................................................. 16
6.7 Distributional Analysis Checks ................................................................................................. 17
7. HEALTH ................................................................................................................................................................ 18
7.1 Financial Reconciliation ........................................................................................................... 18
7.2 Validity Checks ....................................................................................................................... 18
7.3 Relationship Checks ................................................................................................................ 19
7.4 Reasonability Checks ............................................................................................................... 20
7.5 Uniqueness Checks ................................................................................................................. 21
7.6 Consistency Checks ................................................................................................................. 21
7.7 Distributional Analysis Checks ................................................................................................. 21
Page 3 of 21 © Insurance Information Bureau of India, 2014
1. INTRODUCTION
Insurance Information Bureau of India (IIB) collects transactional level data from all insurers, licensed to operate in India, backed by a mandate from the Insurance Regulatory & Development Authority of India (IRDA).
The purpose of collecting data is to analyze it and provide useful insights and information to the stakeholders for better decision making. Data are appropriate if they are suitable for the intended purpose of an analysis and relevant to the system or process being analysed. The quality of the output depends upon the quality of data input. Hence, it is of utmost importance to ensure that the data submitted to IIB is authentic and timely.
All data submitted to IIB should be useful for intended analysis. The hard fact is that it is not. To sensitize the insurers towards data quality, we have devised a mechanism to convey to them the extent to which their data can be used by IIB for current as well as future Analytics.
This manual can be used by the Insurers to understand the checks that IIB performs on the data to ascertain quality. Keeping the bar too high initially would result in a lot of data getting rejected. On the other hand, keeping it too low would result in a lot of not-so-usable data entering into our system. IIB would review and revise the manual periodically to level the bar of the data quality slowly, keeping various best practices, including Actuarial Standards of Practice in mind.
It is desired that Insurers use this manual to improve the quality of data they submit to IIB and in turn contribute to better analytics for the Industry as a whole.

Page 4 of 21 © Insurance Information Bureau of India, 2014
2. DATA FLOW
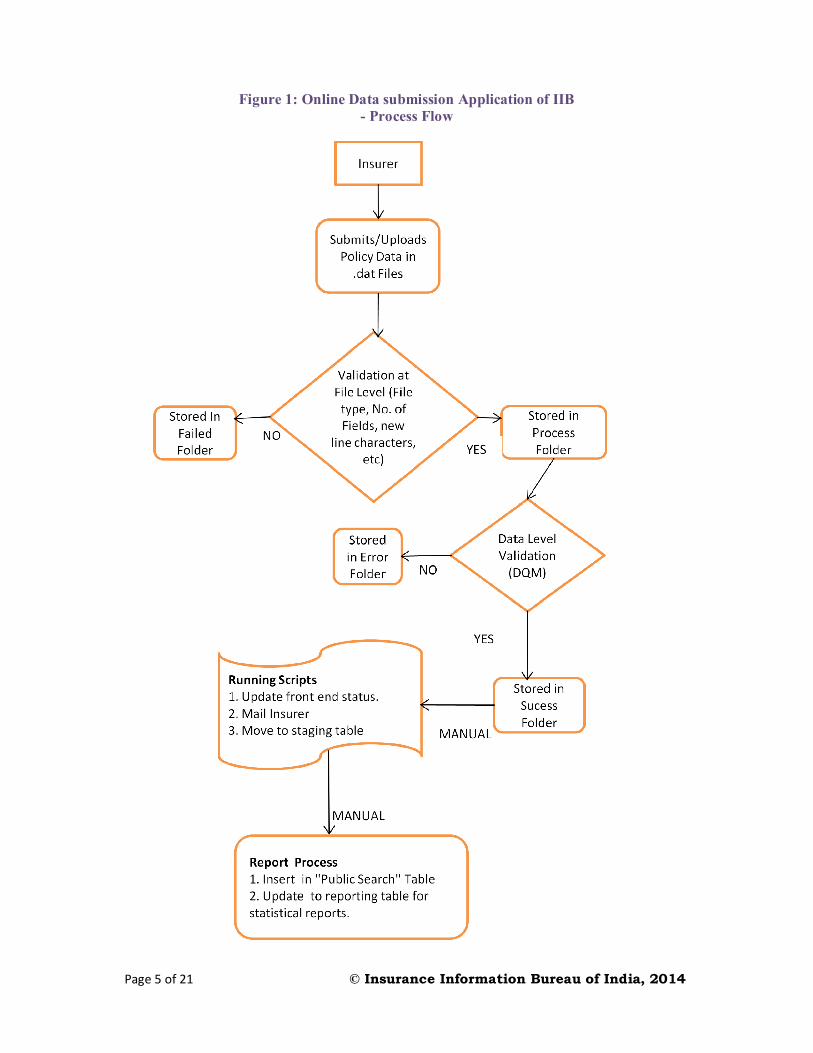
The online data submission application of IIB was developed in 2009 for seamless transfer of data from the insurers to IIB. The application allows the insurers to upload data in .dat files into IIB’s servers. The data goes through various levels of automated and manual checks before they are used for analytics purposes (See Figure 1).
Examples of automated checks (Pre-cleaning checks) through which the data passes are:
• Checks whether the file is valid ascii file or not • Checks for the number of fields present in the raw data submitted by the insurer and tally it
with the actual number of fields required • Checks the uniqueness of transaction id • Checks for new line character • Checks for headers. If present, automated script removes it
Once the data passes the pre-cleaning checks stage, it is stored in the process folder and then the post-cleaning checks are performed to ensure that the total amounts mentioned by the insurers initially while uploading the .dat files match with the amounts computed at IIB’s end, that is the sum of transactions uploaded match with the totals specified by the insurer.
In addition to these automated checks, many more checks are taken up by the analysts as a part of the data cleaning process, before the reports are generated.
Page 5 of 21 © Insurance Information Bureau of India, 2014
Figure 1: Online Data submission Application of IIB - Process Flow
Page 6 of 21 © Insurance Information Bureau of India, 2014
3. TYPES OF CHECKS
The objective is to arrive at a score that reflects the quality of the data to the extent possible. The score should provide an indication of the volume of the experience that could be used for the purpose of industry benchmarks. For example, if the data quality score is 40, it should roughly indicate that around 40% of the total experience – encompassing premiums, exposure and claims – of that insurer could be used in the study to establish industry benchmarks.
Various aspects of data quality – financial reconciliation, checks on various data fields, logical consistency within the data and data consistency between various tables – are considered. The data tables (typically, three tables: policy, exposure and claims) are subject to financial reconciliation and data checks.
3.1 Financial Reconciliation
The annual audited figures submitted to IRDA for premiums and incurred claims should tally with the summation of transactional level premiums and incurred claims, for the same period, submitted to IIB. The purpose of financial reconciliation is to assess the correctness and completeness of the data provided in terms of the amount of premiums and claims.
In future, the figures from FY2014-15 data, as per the revised data formats, will be reconciled with NL-General Forms submitted by insurers to IRDA on a quarterly basis as an independent reconciliation exercise. Policy counts, written exposure and reported claim counts will also be reconciled with the submissions to IRDA.
3.2 Data Checks
The following are the various types of checks performed on the data:
1. Validity checks: The data dictionaries by IIB lay down the data formats for each field. Masters are also provided for some data fields. In validity checks, it is checked whether the values provided against these data fields are valid as per the data dictionary or not.
The fields selected for these checks are the most important ones. Most of them are already being used in various analyses by IIB. Some of these identified fields are considered as critical. The remaining fields are also important but not as critical.
2. Relationship checks: Fields in a transaction record have certain relationships between them. Certain relationships which hold true for all records are identified and checked whether or not the data satisfies them. For example, Policy End Date should be after the Policy Start Date in all records.
3. Reasonability checks: These checks are somewhat subjective in nature. The objective of these checks is to identify outliers. For example, records for which either the premium rate or sum insured is abnormally high or low are identified and considered as errors.
Page 7 of 21 © Insurance Information Bureau of India, 2014
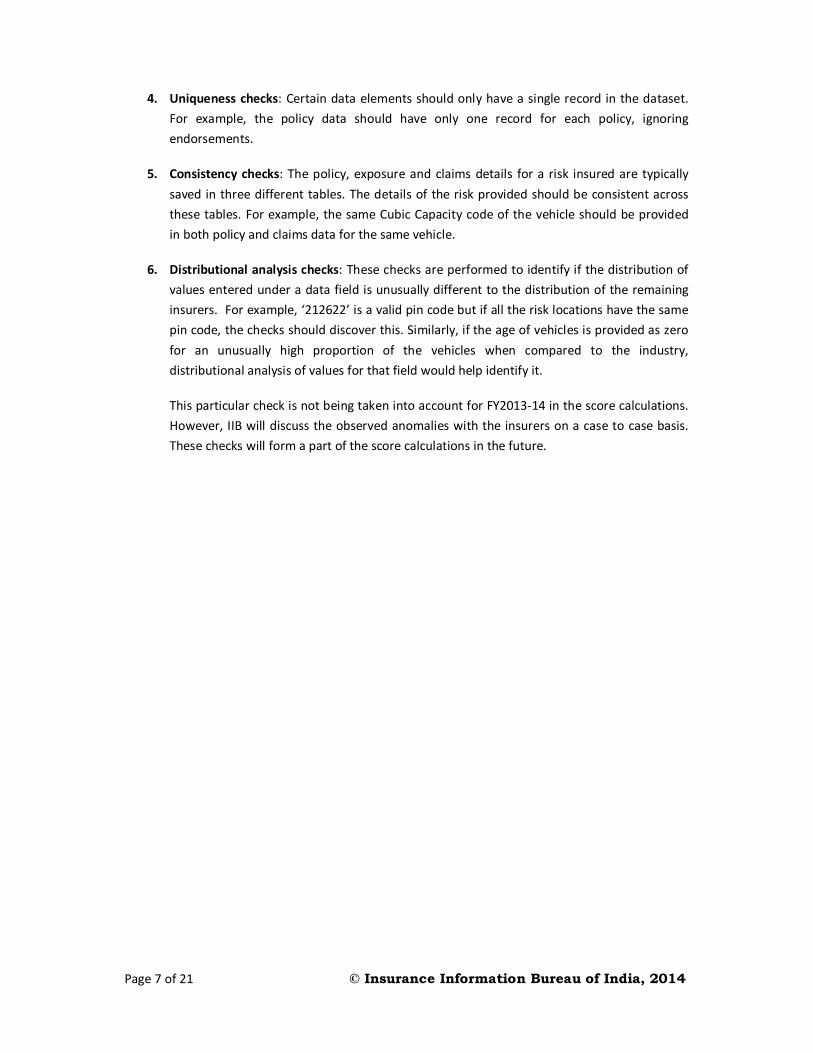
4. Uniqueness checks: Certain data elements should only have a single record in the dataset. For example, the policy data should have only one record for each policy, ignoring endorsements.
5. Consistency checks: The policy, exposure and claims details for a risk insured are typically saved in three different tables. The details of the risk provided should be consistent across these tables. For example, the same Cubic Capacity code of the vehicle should be provided in both policy and claims data for the same vehicle.
6. Distributional analysis checks: These checks are performed to identify if the distribution of values entered under a data field is unusually different to the distribution of the remaining insurers. For example, ‘212622’ is a valid pin code but if all the risk locations have the same pin code, the checks should discover this. Similarly, if the age of vehicles is provided as zero for an unusually high proportion of the vehicles when compared to the industry, distributional analysis of values for that field would help identify it.
This particular check is not being taken into account for FY2013-14 in the score calculations. However, IIB will discuss the observed anomalies with the insurers on a case to case basis. These checks will form a part of the score calculations in the future.
Page 8 of 21 © Insurance Information Bureau of India, 2014
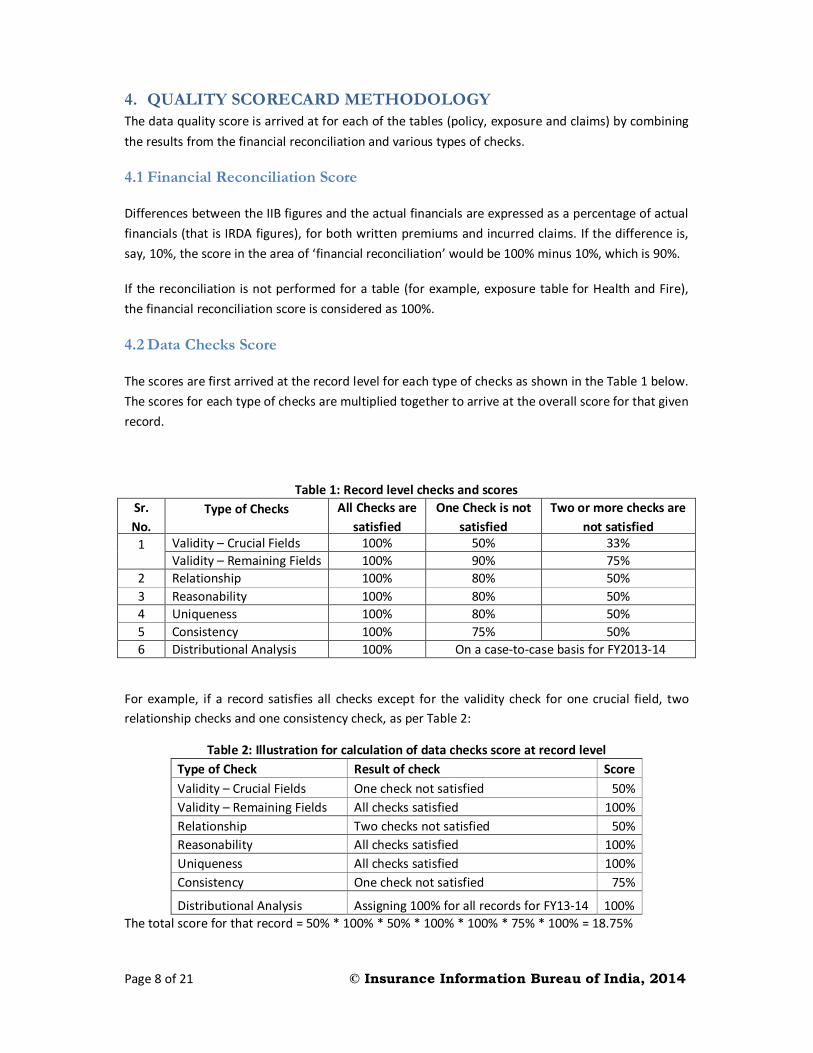
4. QUALITY SCORECARD METHODOLOGY The data quality score is arrived at for each of the tables (policy, exposure and claims) by combining the results from the financial reconciliation and various types of checks.
4.1 Financial Reconciliation Score
Differences between the IIB figures and the actual financials are expressed as a percentage of actual financials (that is IRDA figures), for both written premiums and incurred claims. If the difference is, say, 10%, the score in the area of ‘financial reconciliation’ would be 100% minus 10%, which is 90%.
If the reconciliation is not performed for a table (for example, exposure table for Health and Fire), the financial reconciliation score is considered as 100%.
4.2 Data Checks Score
The scores are first arrived at the record level for each type of checks as shown in the Table 1 below. The scores for each type of checks are multiplied together to arrive at the overall score for that given record.
Table 1: Record level checks and scores Sr. No.
Type of Checks All Checks are satisfied
One Check is not satisfied
Two or more checks are not satisfied
1 Validity – Crucial Fields 100% 50% 33% Validity – Remaining Fields 100% 90% 75%
2 Relationship 100% 80% 50% 3 Reasonability 100% 80% 50% 4 Uniqueness 100% 80% 50% 5 Consistency 100% 75% 50% 6 Distributional Analysis 100% On a case-to-case basis for FY2013-14
For example, if a record satisfies all checks except for the validity check for one crucial field, two relationship checks and one consistency check, as per Table 2:
Table 2: Illustration for calculation of data checks score at record level Type of Check Result of check Score Validity – Crucial Fields One check not satisfied 50% Validity – Remaining Fields All checks satisfied 100% Relationship Two checks not satisfied 50% Reasonability All checks satisfied 100% Uniqueness All checks satisfied 100% Consistency One check not satisfied 75%
Distributional Analysis Assigning 100% for all records for FY13-14 100% The total score for that record = 50% * 100% * 50% * 100% * 100% * 75% * 100% = 18.75%
Page 9 of 21 © Insurance Information Bureau of India, 2014
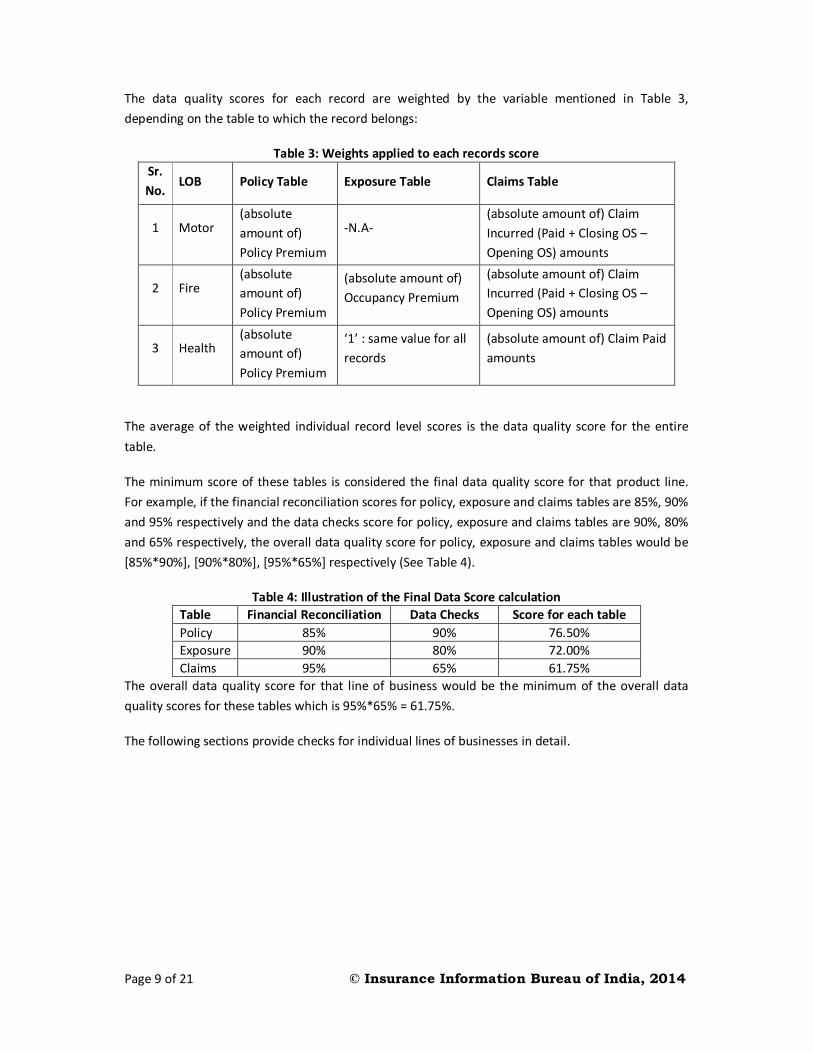
The data quality scores for each record are weighted by the variable mentioned in Table 3, depending on the table to which the record belongs:
Table 3: Weights applied to each records score Sr. No.
LOB Policy Table Exposure Table Claims Table
1 Motor (absolute amount of) Policy Premium
-N.A- (absolute amount of) Claim Incurred (Paid + Closing OS – Opening OS) amounts
2 Fire (absolute amount of) Policy Premium
(absolute amount of) Occupancy Premium
(absolute amount of) Claim Incurred (Paid + Closing OS – Opening OS) amounts
3 Health (absolute amount of) Policy Premium
‘1’ : same value for all records
(absolute amount of) Claim Paid amounts
The average of the weighted individual record level scores is the data quality score for the entire table.
The minimum score of these tables is considered the final data quality score for that product line. For example, if the financial reconciliation scores for policy, exposure and claims tables are 85%, 90% and 95% respectively and the data checks score for policy, exposure and claims tables are 90%, 80% and 65% respectively, the overall data quality score for policy, exposure and claims tables would be [85%*90%], [90%*80%], [95%*65%] respectively (See Table 4).
Table 4: Illustration of the Final Data Score calculation Table Financial Reconciliation Data Checks Score for each table Policy 85% 90% 76.50% Exposure 90% 80% 72.00% Claims 95% 65% 61.75%
The overall data quality score for that line of business would be the minimum of the overall data quality scores for these tables which is 95%*65% = 61.75%.
The following sections provide checks for individual lines of businesses in detail.
Page 10 of 21 © Insurance Information Bureau of India, 2014
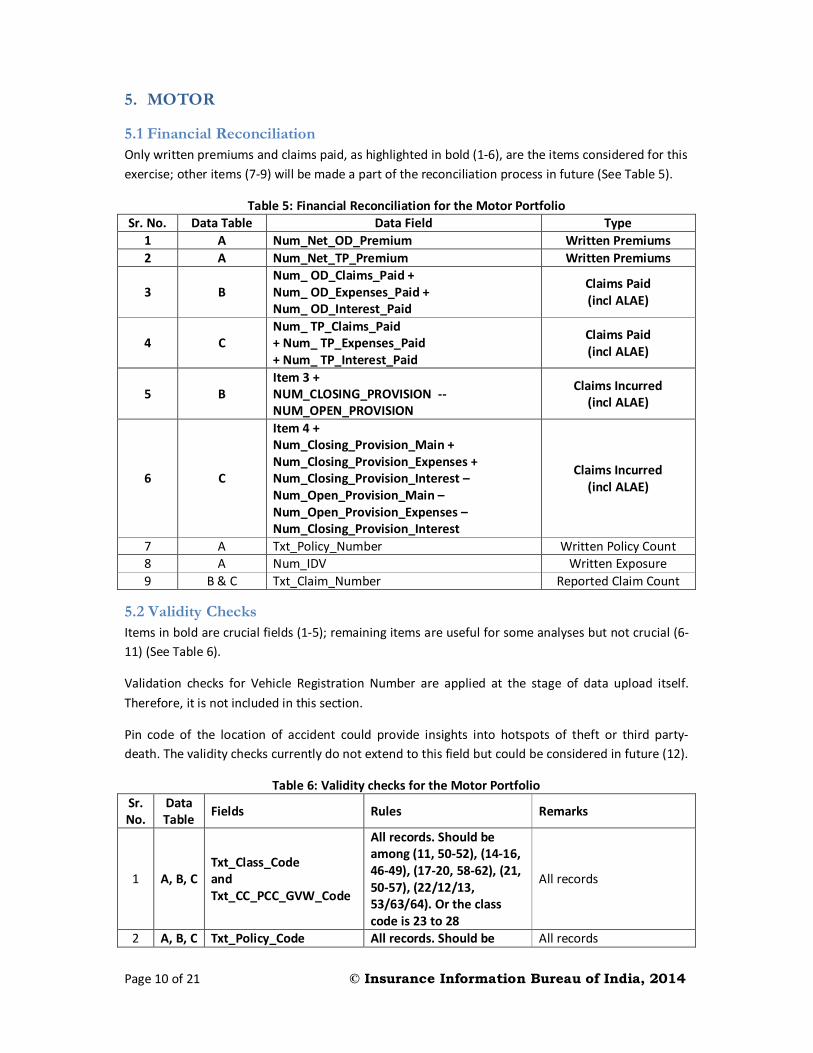
5. MOTOR
5.1 Financial Reconciliation Only written premiums and claims paid, as highlighted in bold (1-6), are the items considered for this exercise; other items (7-9) will be made a part of the reconciliation process in future (See Table 5).
Table 5: Financial Reconciliation for the Motor Portfolio Sr. No. Data Table Data Field Type
1 A Num_Net_OD_Premium Written Premiums 2 A Num_Net_TP_Premium Written Premiums
3 B Num_ OD_Claims_Paid + Num_ OD_Expenses_Paid + Num_ OD_Interest_Paid
Claims Paid (incl ALAE)
4 C Num_ TP_Claims_Paid + Num_ TP_Expenses_Paid + Num_ TP_Interest_Paid
Claims Paid (incl ALAE)
5 B Item 3 + NUM_CLOSING_PROVISION -- NUM_OPEN_PROVISION
Claims Incurred (incl ALAE)
6 C
Item 4 + Num_Closing_Provision_Main + Num_Closing_Provision_Expenses + Num_Closing_Provision_Interest – Num_Open_Provision_Main – Num_Open_Provision_Expenses – Num_Closing_Provision_Interest
Claims Incurred (incl ALAE)
7 A Txt_Policy_Number Written Policy Count 8 A Num_IDV Written Exposure 9 B & C Txt_Claim_Number Reported Claim Count
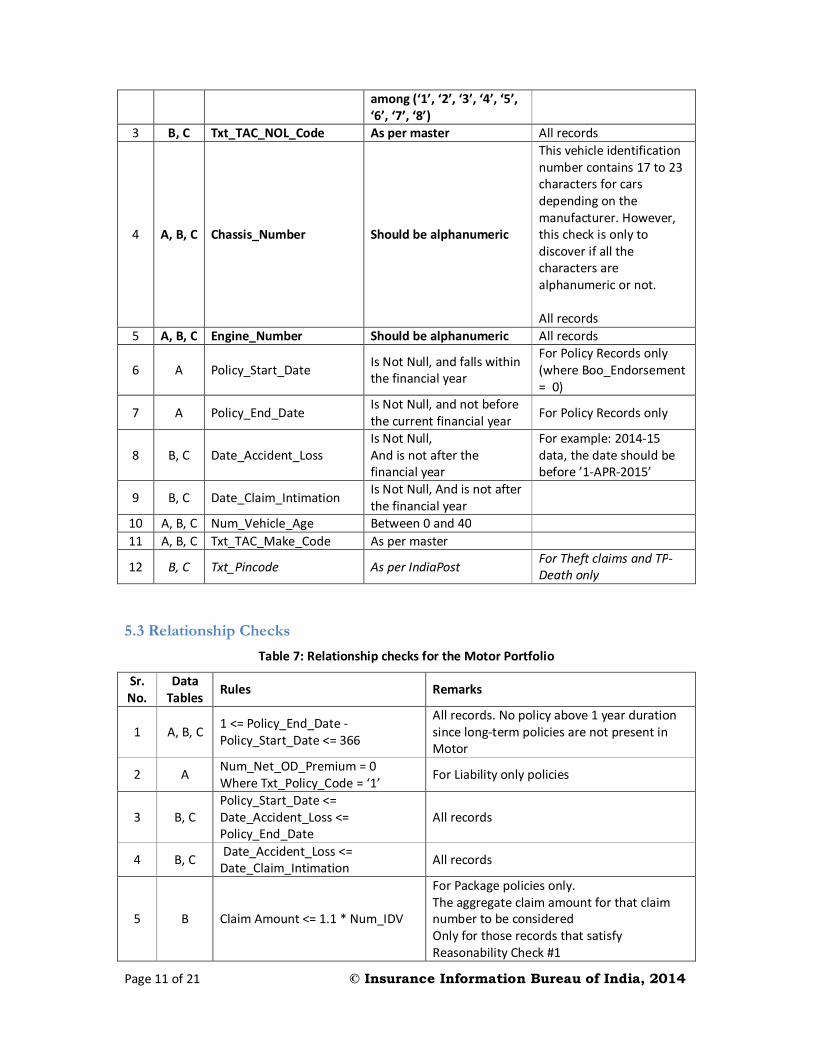
5.2 Validity Checks Items in bold are crucial fields (1-5); remaining items are useful for some analyses but not crucial (6-11) (See Table 6).
Validation checks for Vehicle Registration Number are applied at the stage of data upload itself. Therefore, it is not included in this section.
Pin code of the location of accident could provide insights into hotspots of theft or third party- death. The validity checks currently do not extend to this field but could be considered in future (12).
Table 6: Validity checks for the Motor Portfolio Sr. No.
Data Table Fields Rules Remarks
1 A, B, C Txt_Class_Code and Txt_CC_PCC_GVW_Code
All records. Should be among (11, 50-52), (14-16, 46-49), (17-20, 58-62), (21, 50-57), (22/12/13, 53/63/64). Or the class code is 23 to 28
All records
2 A, B, C Txt_Policy_Code All records. Should be All records
Page 11 of 21 © Insurance Information Bureau of India, 2014
among (‘1’, ‘2’, ‘3’, ‘4’, ‘5’, ‘6’, ‘7’, ‘8’)
3 B, C Txt_TAC_NOL_Code As per master All records
4 A, B, C Chassis_Number Should be alphanumeric
This vehicle identification number contains 17 to 23 characters for cars depending on the manufacturer. However, this check is only to discover if all the characters are alphanumeric or not. All records
5 A, B, C Engine_Number Should be alphanumeric All records
6 A Policy_Start_Date Is Not Null, and falls within the financial year
For Policy Records only (where Boo_Endorsement = 0)
7 A Policy_End_Date Is Not Null, and not before the current financial year For Policy Records only
8 B, C Date_Accident_Loss Is Not Null, And is not after the financial year
For example: 2014-15 data, the date should be before ’1-APR-2015’
9 B, C Date_Claim_Intimation Is Not Null, And is not after the financial year
10 A, B, C Num_Vehicle_Age Between 0 and 40 11 A, B, C Txt_TAC_Make_Code As per master
12 B, C Txt_Pincode As per IndiaPost For Theft claims and TP-Death only
5.3 Relationship Checks
Table 7: Relationship checks for the Motor Portfolio
Sr. No.
Data Tables Rules Remarks
1 A, B, C 1 <= Policy_End_Date - Policy_Start_Date <= 366
All records. No policy above 1 year duration since long-term policies are not present in Motor
2 A Num_Net_OD_Premium = 0 Where Txt_Policy_Code = ‘1’ For Liability only policies
3 B, C Policy_Start_Date <= Date_Accident_Loss <= Policy_End_Date
All records
4 B, C Date_Accident_Loss <= Date_Claim_Intimation All records
5 B Claim Amount <= 1.1 * Num_IDV
For Package policies only. The aggregate claim amount for that claim number to be considered Only for those records that satisfy Reasonability Check #1

Page 12 of 21 © Insurance Information Bureau of India, 2014
5.4 Reasonability Checks
Table 8: Reasonability checks for the Motor Portfolio Sr. No. Data Tables Fields Remarks
1 A, B
15,000 <= Num_ IDV <= 15,00,00,000 For Txt_Class_Code = ‘11’ 5,000 <= Num_ IDV <= 1,00,00,000 For Txt_Class_Code = ‘14’
For Package Policies only. For policy records only in Table A
2 A 0.1% <= Num_Net_Od_Premium / Num_ Idv <= 10%
For Package Policies only. For policy records only
5.5 Uniqueness Checks
Table 9: Uniqueness checks for the Motor Portfolio Sr. No.
Data Tables Fields Remarks
1 A Txt_Insurer & Txt_Policy_Number Policy Records only. Not applicable for endorsements.
2 A Txt_Chassis_Number & Txt_Engine_Number Policy Records only. This is mainly required for the V-Seva project.
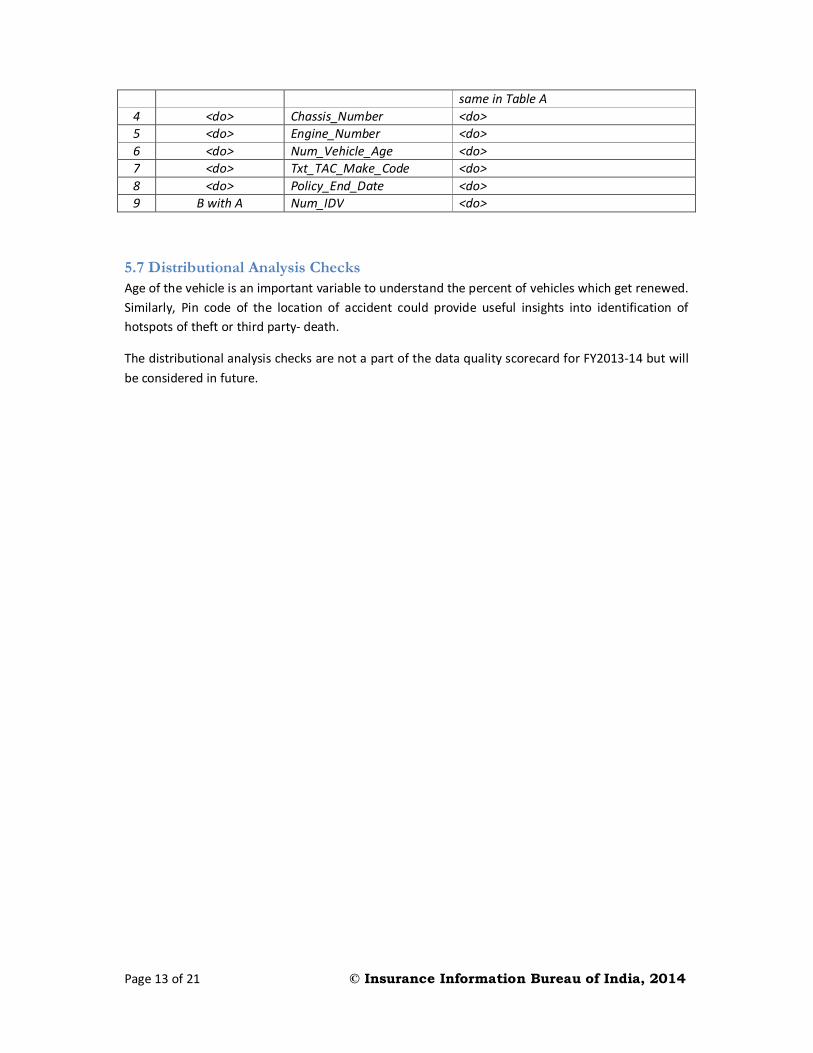
5.6 Consistency Checks The policy numbers (along with risk details) provided in the claims data should be in the policy data of the current year or prior years. The risk details provided in the claims data should also be consistent with the risk details provided in the policy/exposure data. Claims pertaining to policies from PY 2010-11 only are considered. Items in italics are for future consideration (3-9).
Table 10: Consistency checks for the Motor Portfolio Sr. No. Data Tables Fields Remarks
1 B & C with A Txt_Policy_Number
Policy number in every record of Table B and C should be found in Table A in either the current year or the prior years. This check should be applied only those records where Policy Start Date is from April 1, 2010 onwards
2 B & C with A
Txt_Policy_Number This check is applied to only those records that satisfy the Consistency Check 1. Every combination of these 5 fields that are observed in Table B or Table C (Policy Start Date is from April 1, 2010 onwards), that combination should be observed in the policy tables from 2010-14.
Txt_Policy_Code Txt_Class_Code Txt_CC_Pcc_GVW_Code
Policy_Start_Date
3 <do> Txt_Reg_Number_Vehicle The registration number should be the
Page 13 of 21 © Insurance Information Bureau of India, 2014
same in Table A 4 <do> Chassis_Number <do> 5 <do> Engine_Number <do> 6 <do> Num_Vehicle_Age <do> 7 <do> Txt_TAC_Make_Code <do> 8 <do> Policy_End_Date <do> 9 B with A Num_IDV <do>
5.7 Distributional Analysis Checks Age of the vehicle is an important variable to understand the percent of vehicles which get renewed. Similarly, Pin code of the location of accident could provide useful insights into identification of hotspots of theft or third party- death.
The distributional analysis checks are not a part of the data quality scorecard for FY2013-14 but will be considered in future.

Page 14 of 21 © Insurance Information Bureau of India, 2014
6. FIRE
6.1 Financial Reconciliation Only written premiums and claims paid, as highlighted in bold (1-2), are the items considered for this exercise; other items will be made a part of the reconciliation process in future (3-9) (See Table 11). An independent exercise for reconciliation of claims outstanding for 2013-14 would also be performed.
Table 11: Financial Reconciliation checks for the Fire Portfolio Sr. No. Data Table Data Field Type
1 6a Num_Pol_Premium Written Premiums
2 6d Num_Claim_Total_Paid_Amount + Num_Claim_Amount_Expenses
Claims Paid (including ALAE)
3 6b Num_Occ_Premium Written Premiums 4 6c Num_Cover_Peril_Premium Written Premiums
5 6d Item 2 + Num_Claim_Closing_Claims_Provision – Num_Claim_Opening_Claims_Provision
Claims Incurred (incl ALAE)
6 6a, 6b, 6c Txt_Policy_Number Written Policy Count 7 6a Num_Policy_SI Written Exposure 8 6b Num_Occ_ SI_Amount & Num_Occ_SI_Amount Written Exposure 9 6c Txt_Claim_Number Reported Claim Count
6.2 Validity Checks Items in bold are crucial fields (1-3, 5); remaining items are useful for some analyses but not crucial (4, 6-7). Items in italics are for future consideration (8-11).
Table 12: Validity checks for the Fire Portfolio Sr. No.
Data Table Field Rules Remarks
1 6a & 6d Num_Policy_Period Should be numeric and > 0
This is required to identify multi-year policies in the absence of policy start and end dates
2 6a & 6d Txt_Policy_Year Should be ‘20**/20**’ format
For example, ‘2013/2014’ refers to a policy written in 2013-14
3 6b & 6d Txt_Occ_Occupancy_Code As per Master The value ‘4999’ which stands for ‘Others’ is considered a data error
4 6b & 6d Num_Occ_Risk_Pincode Valid as per India Post.
5 6d Date_Claim_Loss_Date Is Not Null, In Date Format, <=’31/03/2014’ All records
6 6d Txt_Claim_NoL_Code As per Master ‘1199’ which is ‘Others’ is considered a data error
7 6d Date_Claim_Intimation Is Not Null, In Date Format, <=’31/03/2014’ All records
8 6b Txt_Occ_Type_Construction As per Master All records 9 6b Num_Occ_Age_Building As per Master All records
10 6b Num_Occ_Height_Building As per Master All records 11 6c Txt_Cover_Peril_Code As per Master All records
Page 15 of 21 © Insurance Information Bureau of India, 2014
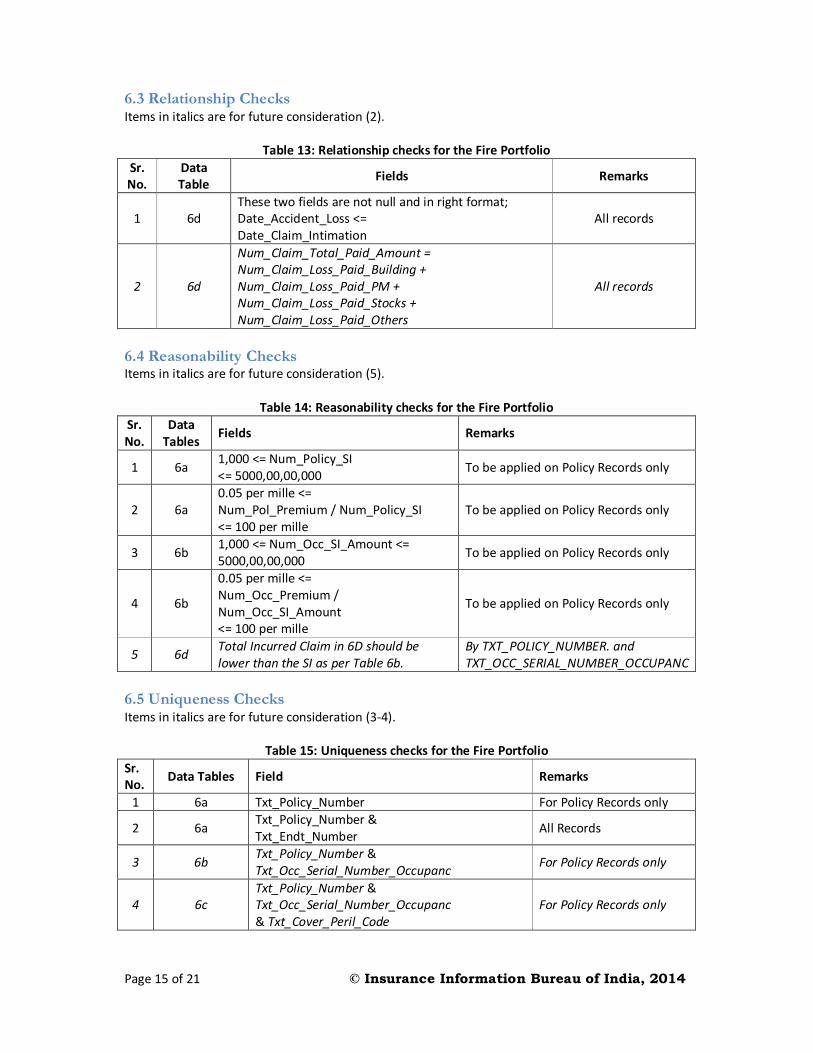
6.3 Relationship Checks Items in italics are for future consideration (2).
Table 13: Relationship checks for the Fire Portfolio Sr. No.
Data Table Fields Remarks
1 6d These two fields are not null and in right format; Date_Accident_Loss <= Date_Claim_Intimation
All records
2 6d
Num_Claim_Total_Paid_Amount = Num_Claim_Loss_Paid_Building + Num_Claim_Loss_Paid_PM + Num_Claim_Loss_Paid_Stocks + Num_Claim_Loss_Paid_Others
All records
6.4 Reasonability Checks Items in italics are for future consideration (5).
Table 14: Reasonability checks for the Fire Portfolio
Sr. No.
Data Tables Fields Remarks
1 6a 1,000 <= Num_Policy_SI <= 5000,00,00,000 To be applied on Policy Records only
2 6a 0.05 per mille <= Num_Pol_Premium / Num_Policy_SI <= 100 per mille
To be applied on Policy Records only
3 6b 1,000 <= Num_Occ_SI_Amount <= 5000,00,00,000 To be applied on Policy Records only
4 6b
0.05 per mille <= Num_Occ_Premium / Num_Occ_SI_Amount <= 100 per mille
To be applied on Policy Records only
5 6d Total Incurred Claim in 6D should be lower than the SI as per Table 6b.
By TXT_POLICY_NUMBER. and TXT_OCC_SERIAL_NUMBER_OCCUPANC
6.5 Uniqueness Checks Items in italics are for future consideration (3-4).
Table 15: Uniqueness checks for the Fire Portfolio Sr. No. Data Tables Field Remarks
1 6a Txt_Policy_Number For Policy Records only
2 6a Txt_Policy_Number & Txt_Endt_Number All Records
3 6b Txt_Policy_Number & Txt_Occ_Serial_Number_Occupanc For Policy Records only
4 6c Txt_Policy_Number & Txt_Occ_Serial_Number_Occupanc & Txt_Cover_Peril_Code
For Policy Records only
Page 16 of 21 © Insurance Information Bureau of India, 2014
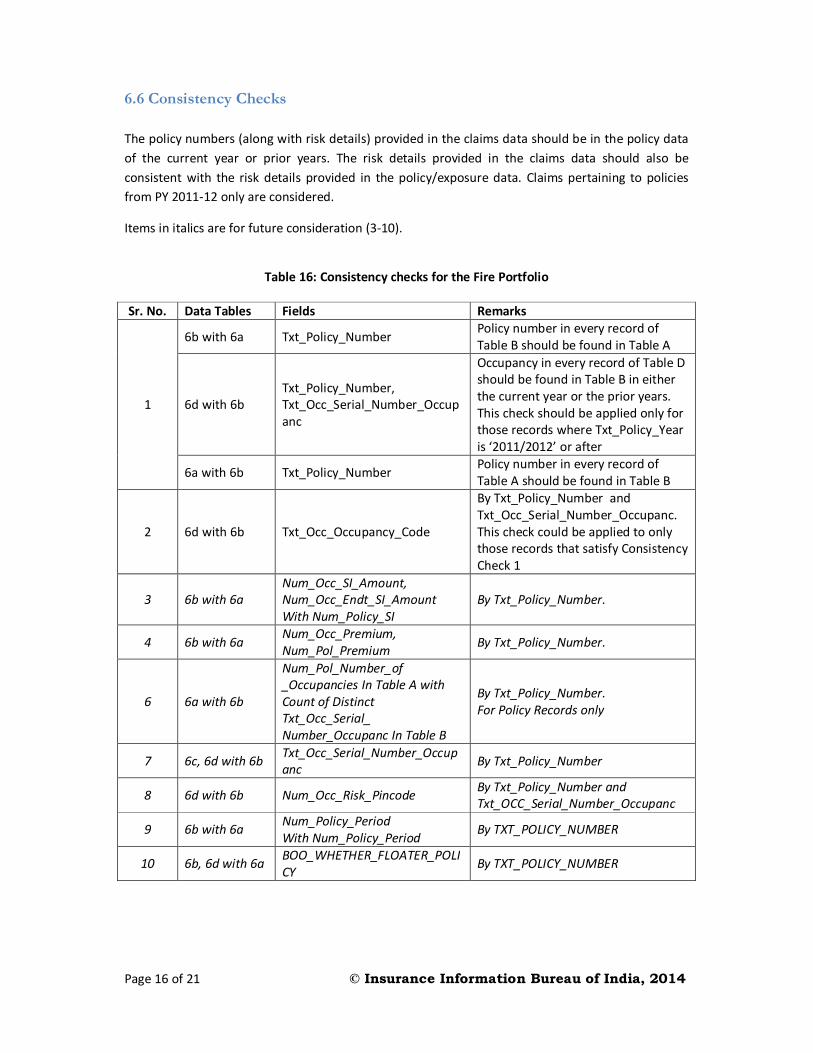
6.6 Consistency Checks The policy numbers (along with risk details) provided in the claims data should be in the policy data of the current year or prior years. The risk details provided in the claims data should also be consistent with the risk details provided in the policy/exposure data. Claims pertaining to policies from PY 2011-12 only are considered.
Items in italics are for future consideration (3-10).
Table 16: Consistency checks for the Fire Portfolio
Sr. No. Data Tables Fields Remarks
1
6b with 6a Txt_Policy_Number Policy number in every record of Table B should be found in Table A
6d with 6b Txt_Policy_Number, Txt_Occ_Serial_Number_Occupanc
Occupancy in every record of Table D should be found in Table B in either the current year or the prior years. This check should be applied only for those records where Txt_Policy_Year is ‘2011/2012’ or after
6a with 6b Txt_Policy_Number Policy number in every record of Table A should be found in Table B
2 6d with 6b Txt_Occ_Occupancy_Code
By Txt_Policy_Number and Txt_Occ_Serial_Number_Occupanc. This check could be applied to only those records that satisfy Consistency Check 1
3 6b with 6a Num_Occ_SI_Amount, Num_Occ_Endt_SI_Amount With Num_Policy_SI
By Txt_Policy_Number.
4 6b with 6a Num_Occ_Premium, Num_Pol_Premium By Txt_Policy_Number.
6 6a with 6b
Num_Pol_Number_of _Occupancies In Table A with Count of Distinct Txt_Occ_Serial_ Number_Occupanc In Table B
By Txt_Policy_Number. For Policy Records only
7 6c, 6d with 6b Txt_Occ_Serial_Number_Occupanc By Txt_Policy_Number
8 6d with 6b Num_Occ_Risk_Pincode By Txt_Policy_Number and Txt_OCC_Serial_Number_Occupanc
9 6b with 6a Num_Policy_Period With Num_Policy_Period By TXT_POLICY_NUMBER
10 6b, 6d with 6a BOO_WHETHER_FLOATER_POLICY By TXT_POLICY_NUMBER
Page 17 of 21 © Insurance Information Bureau of India, 2014
6.7 Distributional Analysis Checks Distributional analysis checks will be performed on the pin code of the occupancy location in the occupancy data (table 6b).
The same checks could be performed on the pin code of the occupancy location in the claims data (table 6d) as well. This may not be necessary if the pin codes provided in the claims data are found to be consistent with the pin codes provided in the occupancy data for each combination of policy number and occupancy serial number.

Page 18 of 21 © Insurance Information Bureau of India, 2014
7. HEALTH
7.1 Financial Reconciliation Only written premiums and claims paid, as highlighted in bold, are the items considered for this exercise (1-2); other items will be made a part of the reconciliation process in future (3-7).
Incurred claims will also be reconciled after revised data formats from 2014-15 onwards.
Table 17: Financial Reconciliation checks for the Health Portfolio Sr. No. Data Table Data Field Type
1 A Num_Policy_Premium Written Premiums
2 C Num_Total_Claim_Paid Claims Paid (incl. ALAE – TPA charges are not included)
3 B Num_Individual_Premium Written Premiums 4 A, B TXT_Policy_Number Written Policy Count
5 B Txt_Policy_Number, Txt_Member_Reference_Key
Total Number of Members Covered
6 A, B Num_Family_Floater_Sum_Insured, Num_Sum_Insured
Written Exposure (for Individual Health)
7 C Txt_Claim_Number Reported Claim Count
7.2 Validity Checks Items in bold are crucial fields (1-5); remaining items are useful for some analyses but not crucial (6-10).
Table 18: Validity checks for the Health Portfolio Sr. No.
Data Table Fields Rules Remarks
1 A, B & C Txt_Product_Type As per master. Valid values are ‘1’, ‘2’, ‘3’, ‘4’, ‘5’, ‘6’, ‘7’, ‘8’, ‘9’ and ‘10’.
‘99’ (Others) is considered as an error
2 A, B & C Txt_Type_of_Policy As per master. Valid values are ‘1’, ‘2’, ‘3’, ‘4’, ‘5’, ‘6’, ‘7’ and ‘8’.
‘99’ (Others) is considered as an error
3 A Num_Group_Size For Type_of_Policy ‘3’ & ‘4’, Group Size should be above 1
Applicable to Policy records only. (Boo_Policy_or_Endorsement=1) For Type_of_Policy ‘1’ & ‘2’, Consistency Check 4 applies
4 B & C Date_of_Birth and Num_Age_of_Insured
If both are null, then the record is considered an error. If Age of Insured is provided, it should be
All Records
Page 19 of 21 © Insurance Information Bureau of India, 2014
between 0 and 120. If Age of Insured is not provided, Date of Birth is used. The calculated age (as at last birthday) as DoB – Policy Start Date should be between 0 and 120.
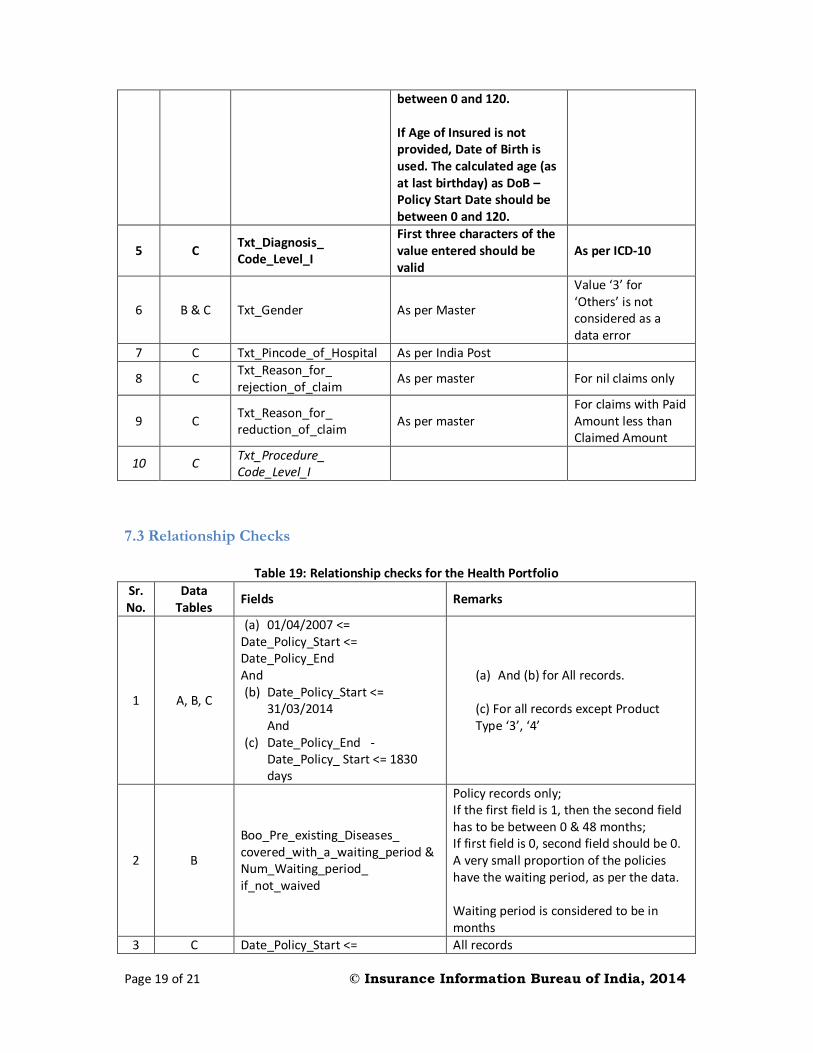
5 C Txt_Diagnosis_ Code_Level_I
First three characters of the value entered should be valid
As per ICD-10
6 B & C Txt_Gender As per Master
Value ‘3’ for ‘Others’ is not considered as a data error
7 C Txt_Pincode_of_Hospital As per India Post
8 C Txt_Reason_for_ rejection_of_claim As per master For nil claims only
9 C Txt_Reason_for_ reduction_of_claim As per master
For claims with Paid Amount less than Claimed Amount
10 C Txt_Procedure_ Code_Level_I
7.3 Relationship Checks
Table 19: Relationship checks for the Health Portfolio Sr. No.
Data Tables Fields Remarks
1 A, B, C
(a) 01/04/2007 <= Date_Policy_Start <= Date_Policy_End And (b) Date_Policy_Start <=
31/03/2014 And
(c) Date_Policy_End - Date_Policy_ Start <= 1830 days
(a) And (b) for All records. (c) For all records except Product Type ‘3’, ‘4’
2 B
Boo_Pre_existing_Diseases_ covered_with_a_waiting_period & Num_Waiting_period_ if_not_waived
Policy records only; If the first field is 1, then the second field has to be between 0 & 48 months; If first field is 0, second field should be 0. A very small proportion of the policies have the waiting period, as per the data. Waiting period is considered to be in months
3 C Date_Policy_Start <= All records

Page 20 of 21 © Insurance Information Bureau of India, 2014
Date_of_Admission <= Date_Policy_End
4 C Date_of_Admission <= Date_of_Discharge All records
5 C Date_of_Admission <= Date_of_Payment All records
6 C Boo_hospital_is_networked, Txt_Type_of_claim_payment
Where Boo_hospital_is_networked = 0 (i.e. Non-Networked Hospital) Txt_Type_of_claim_payment should not be Cashless (i.e. 01 or 06)
7 C Txt_Diagnosis_Code_Level_I, Txt_Gender and Age
For Male, Txt_Diagnosis_Code_Level_I should not be Pregnancy (ICD 10 Code O00-O99) For Female, Txt_Diagnosis_Code_Level_I should not be Pregnancy for age below 16 and greater than 55.
8 C
[Num_Room_&_Nursing_Charges], Num_Surgery_Charges, Num_Consultation_Charges, Num_Medicine_Charges, Num_Miscellaneous_Charges, Num_Pre_Hospitalisation_ Expenses_included_under_150035, Num_Post_Hospitalisation_ Expenses_included_under_150035; Num_Total_Claim_Paid Num_Total_Amount_Claimed
Difference between the sum of all these components with either ‘Num_Total_ Claim_Paid’ or ‘Num_Total_ Amount_claimed’ should not be more than 1000. Also, the components other than miscellaneous charges cannot all be zero or missing Also, claimed amount cannot be lower than 90% of the total paid amount
7.4 Reasonability Checks
Table 20: Reasonability checks for the Health Portfolio Sr. No. Data Tables Checks Remarks
1 A
200 <= Num_Policy_Premium <= 5,00,000 where Type_of_Policy is ‘1’ or ‘2’; 200 <= Num_Policy_Premium / Num_Group_Size <= 100,000 Where Type_of_Policy is ‘3’ or ‘4’;
For policy records only, not the endorsement or cancellation records where Validity 1 check is satisfactorily met
2 C Num_Total_Claim_Paid <= 20 Lakhs
For all records where Txt_Product_Type is not ‘3’ or ‘4’ or ‘10’
3 C Num_Sum_Insured >= 50000 For all records where Type_of_Policy is ‘1’ or ‘2’

Page 21 of 21 © Insurance Information Bureau of India, 2014
7.5 Uniqueness Checks
Table 21: Uniqueness checks for the Health Portfolio Sr. No.
Data Table Fields Remarks
1 A Txt_Policy_Number For Policy Records only
2 A Txt_Policy_Number And Txt_Endorsement_Number All records
3 B Txt_Policy_Number And Txt_Member_Reference_Key For Policy Records only
4 B Txt_Policy_Number, Txt_Endorsement_Number and Txt_Member_Reference_Key
All records
7.6 Consistency Checks The policy numbers (along with risk details) provided in the claims data should be in the policy data of the current year or prior years. The risk details provided in the claims data should also be consistent with the risk details provided in the policy/exposure data. Claims pertaining to policies from PY 2012-13 only are considered for the purpose of these checks.
Items in italics are for future consideration (5-6).
Table 22: Consistency checks for the Health Portfolio Sr. No. Data Tables Fields Remarks
1 B with A, A with B Txt_Policy_Number All policies in A should be found in B.
All policies in B should be found in A.
2 C With B
Txt_Policy_Number & Txt_Member_Reference_Key
Should be found in B in either current or prior years (history).
3 B with A, C with B
Txt_Product_Type & Txt_Type_of_Policy
For B with A, by Txt_Policy_Number where Consistency 1 check is met. For C with A, by Txt_Policy_Number & Txt_Member_Reference_Key where Consistency 2 check is met
4 B with A
Count of Distinct ‘Txt_Member_Reference_Key’ with ‘Num_Group_Size’
by Txt_Policy_Number Policy Types ‘1’ and ‘2’ Only for those records that satisfy the Validity 1 check Only policy records are considered in Table A for ‘Num_Group_Size’
5 C with B Date_of_Birth By Txt_Policy_Number &
‘Txt_Member_Reference_Key’
6 B with A, C with B Num_Sum_Insured By Txt_Policy_Number. Only for
‘Individual’ & ‘Individual Floater’ 7.7 Distributional Analysis Checks
Distributional analysis checks would be performed on number of members by age-band, number of claims and severity by disease type etc.
Related Documents