Data Modeling Overview A Data model is a conceptual representation of data structures(tables) required for a database and is very powerful in expressing and communicating the business requirements. A data model visually represents the nature of data, business rules governing the data, and how it will be organized in the database. A data model is comprised of two parts logical design and physical design. Data model helps functional and technical team in designing the database. Functional team normally refers to one or more Business Analysts, Business Managers, Smart Management Experts, End Users etc., and Technical teams refers to one or more programmers, DBAs etc. Data modelers are responsible for designing the data model and they communicate with functional team to get the business requirements and technical teams to implement the database. The concept of data modeling can be better understood if we compare the development cycle of a data model to the construction of a house. For example Company ABC is planning to build a guest house(database) and it calls the building architect(data modeler) and projects its building requirements (business requirements). Building architect(data modeler) develops the plan (data model) and gives it to company ABC. Finally company ABC calls civil engineers(DBA) to construct the guest house(database). Data Modeling Tools There are a number of data modeling tools to transform business requirements into logical data model, and logical data model to physical data model. From physical data model, these tools can be instructed to generate sql code for creating database. Popular Data Modeling Tools Tool Name Company Name Rational Rose IBM Corporation

Data Modeling DW Concepts
Oct 22, 2015
dw concepts
Welcome message from author
This document is posted to help you gain knowledge. Please leave a comment to let me know what you think about it! Share it to your friends and learn new things together.
Transcript
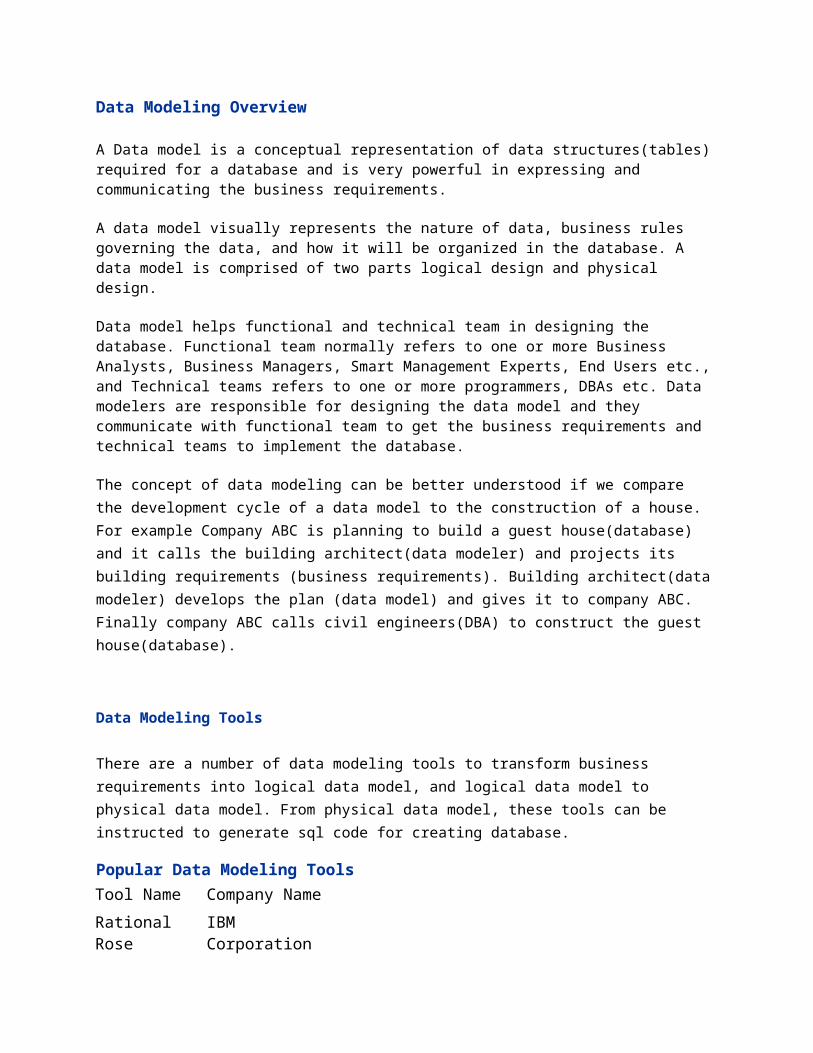
Data Modeling Overview
A Data model is a conceptual representation of data structures(tables) required for a database and is very powerful in expressing and communicating the business requirements.
A data model visually represents the nature of data, business rules governing the data, and how it will be organized in the database. A data model is comprised of two parts logical design and physical design.
Data model helps functional and technical team in designing the database. Functional team normally refers to one or more Business Analysts, Business Managers, Smart Management Experts, End Users etc., and Technical teams refers to one or more programmers, DBAs etc. Data modelers are responsible for designing the data model and they communicate with functional team to get the business requirements and technical teams to implement the database.
The concept of data modeling can be better understood if we compare the development cycle of a data model to the construction of a house. For example Company ABC is planning to build a guest house(database) and it calls the building architect(data modeler) and projects its building requirements (business requirements). Building architect(data modeler) develops the plan (data model) and gives it to company ABC. Finally company ABC calls civil engineers(DBA) to construct the guest house(database).
Data Modeling Tools
There are a number of data modeling tools to transform business requirements into logical data model, and logical data model to physical data model. From physical data model, these tools can be instructed to generate sql code for creating database.
Popular Data Modeling ToolsTool Name Company Name
Rational Rose IBM Corporation
Power Designer Sybase Corporation
Oracle Designer Oracle Corporation
Data Modeler Role
Business Requirement Analysis:» Interact with Business Analysts to get the functional requirements.» Interact with end users and find out the reporting needs.» Conduct interviews, brain storming discussions with project team to get additional requirements.» Gather accurate data by data analysis and functional analysis.
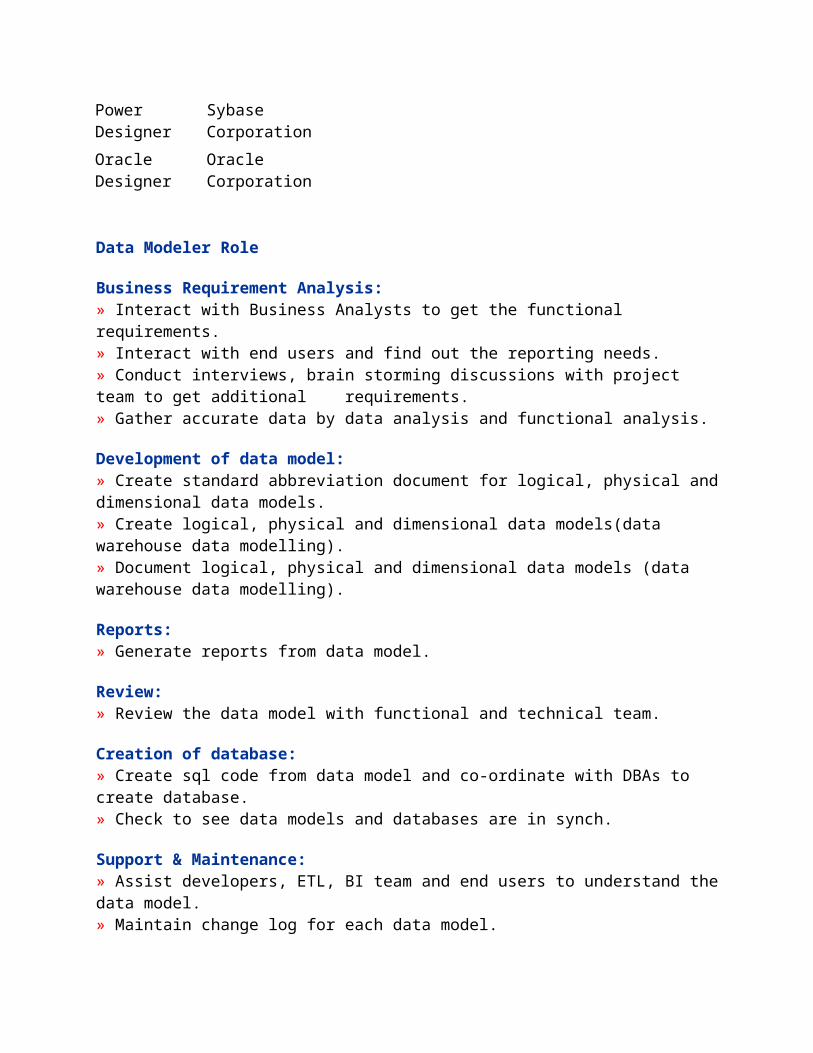
Development of data model:» Create standard abbreviation document for logical, physical and dimensional data models.» Create logical, physical and dimensional data models(data warehouse data modelling).» Document logical, physical and dimensional data models (data warehouse data modelling).
Reports:» Generate reports from data model.
Review:» Review the data model with functional and technical team.
Creation of database:» Create sql code from data model and co-ordinate with DBAs to create database.» Check to see data models and databases are in synch.
Support & Maintenance:» Assist developers, ETL, BI team and end users to understand the data model.» Maintain change log for each data model.
Steps to create a Data Model
These are the general guidelines to create a standard data model and in real time, a data model may not be created in the same sequential manner as shown below. Based on the enterprise’s requirements, some of the steps may be excluded or included in addition to these.
Sometimes, data modeler may be asked to develop a data model based on the existing database. In that situation, the data modeler has to reverse engineer the database and create a data model.
1» Get Business requirements.2» Create High Level Conceptual Data Model.3» Create Logical Data Model.4» Select target DBMS where data modeling tool creates the physical schema.5» Create standard abbreviation document according to business standard.6» Create domain.7» Create Entity and add definitions.8» Create attribute and add definitions.9» Based on the analysis, try to create surrogate keys, super types and sub types.10» Assign datatype to attribute. If a domain is already present then the attribute should be attached to the domain.11» Create primary or unique keys to attribute.12» Create check constraint or default to attribute.13» Create unique index or bitmap index to attribute.14» Create foreign key relationship between entities.15» Create Physical Data Model.15» Add database properties to physical data model.16» Create SQL Scripts from Physical Data Model and forward that to DBA.
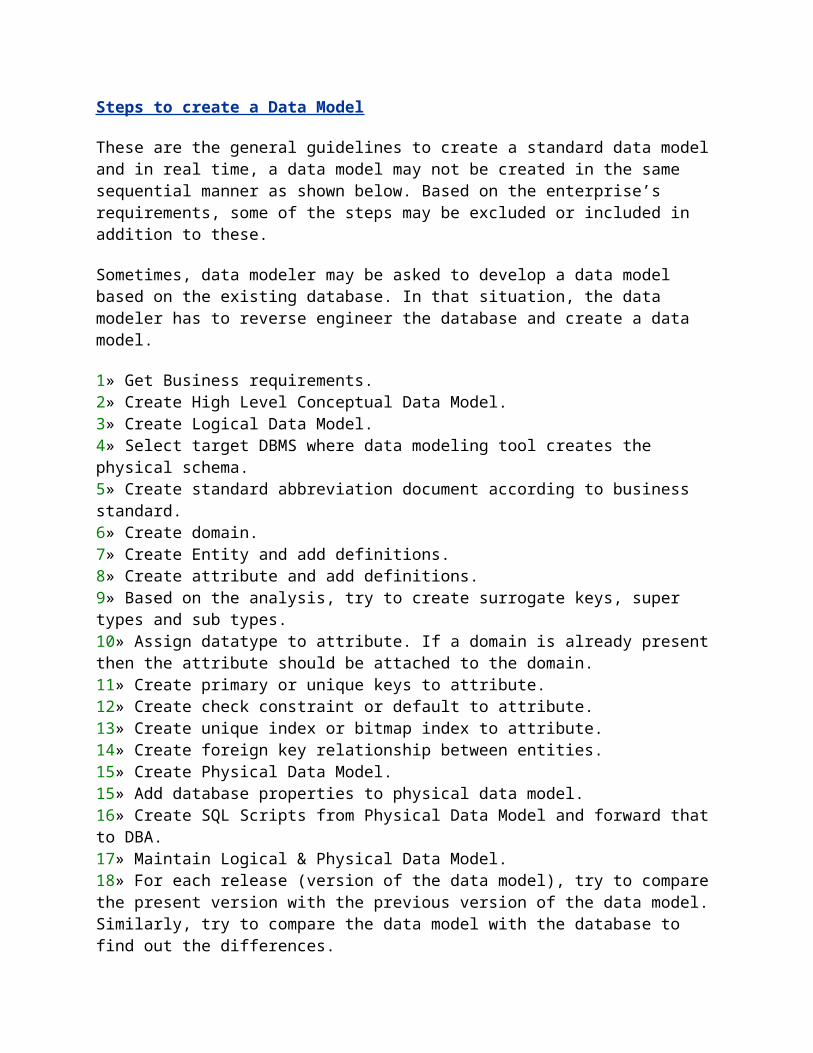
17» Maintain Logical & Physical Data Model.18» For each release (version of the data model), try to compare the present version with the previous version of the data model. Similarly, try to compare the data model with the database to find out the differences.19» Create a change log document for differences between the current version and previous version of the data model.
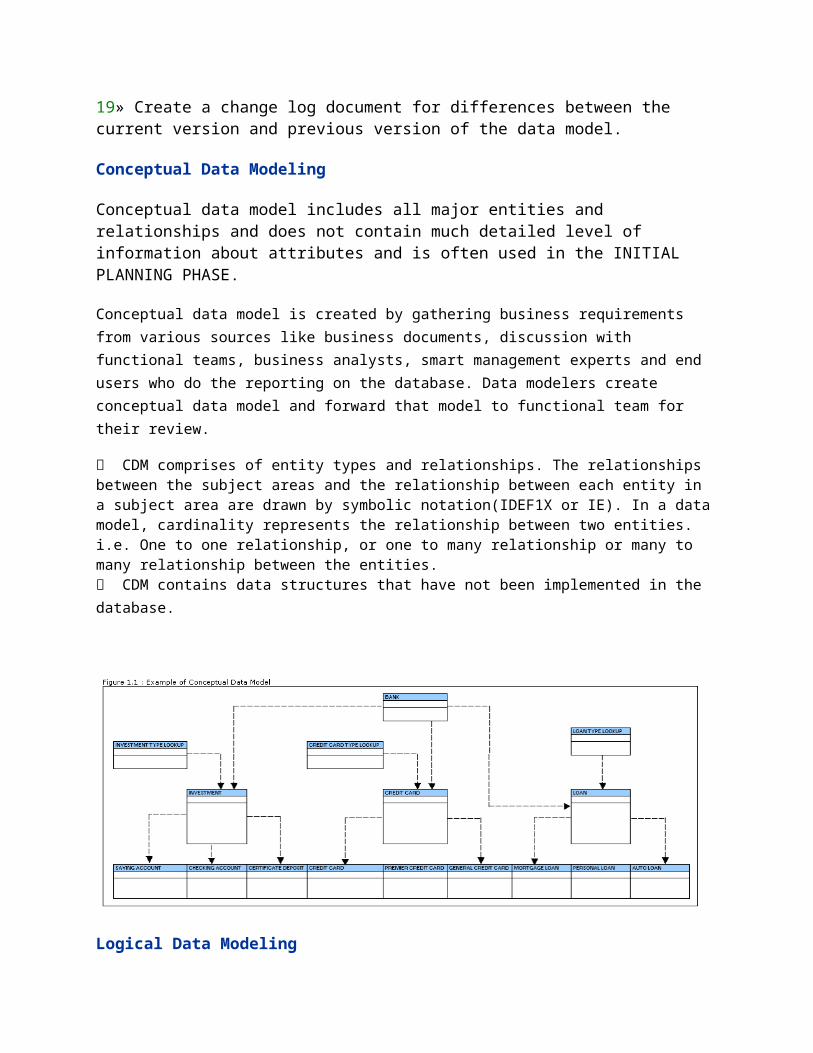
Conceptual Data Modeling
Conceptual data model includes all major entities and relationships and does not contain much detailed level of information about attributes and is often used in the INITIAL PLANNING PHASE.
Conceptual data model is created by gathering business requirements from various sources like business documents, discussion with functional teams, business analysts, smart management experts and end users who do the reporting on the database. Data modelers create conceptual data model and forward that model to functional team for their review.
CDM comprises of entity types and relationships. The relationships between the subject areas and the relationship between each entity in a subject area are drawn by symbolic notation(IDEF1X or IE). In a data model, cardinality represents the relationship between two entities. i.e. One to one relationship, or one to many relationship or many to many relationship between the entities. CDM contains data structures that have not been implemented in the database.
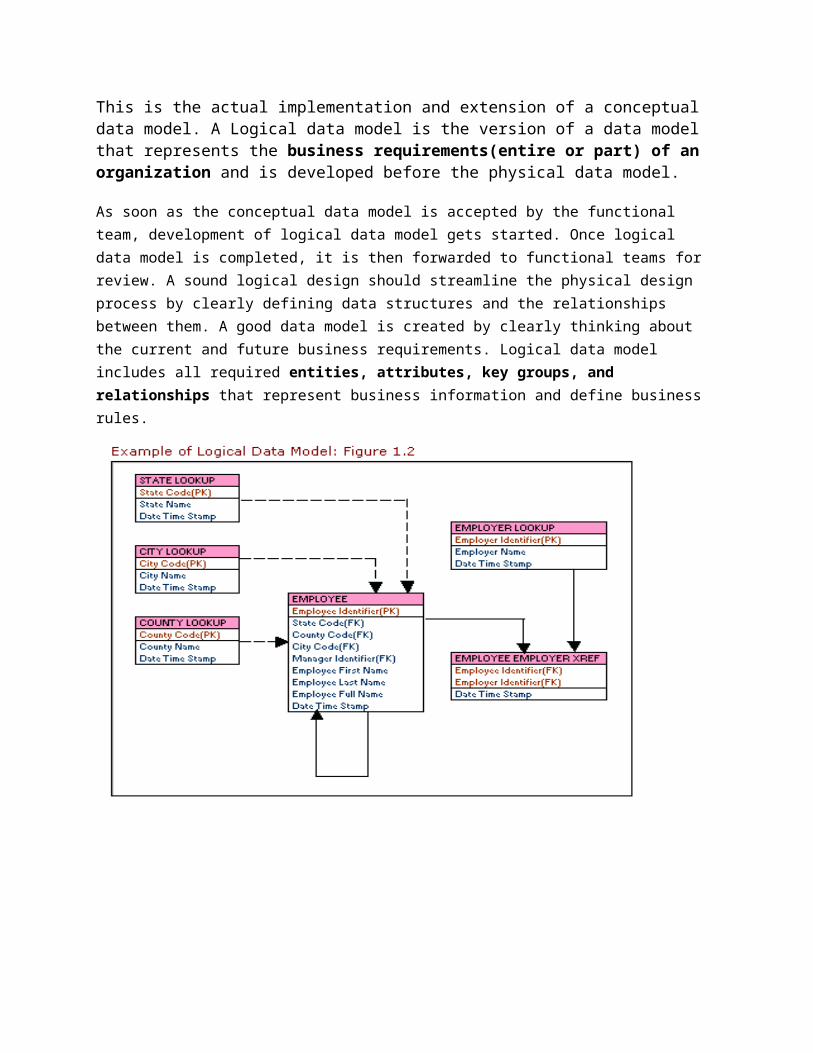
Logical Data Modeling
This is the actual implementation and extension of a conceptual data model. A Logical data model is the version of a data model that represents the business requirements(entire or part) of an organization and is developed before the physical data model.
As soon as the conceptual data model is accepted by the functional team, development of logical data model gets started. Once logical data model is completed, it is then forwarded to functional teams for review. A sound logical design should streamline the physical design process by clearly defining data structures and the relationships between them. A good data model is created by clearly thinking about the current and future business requirements. Logical data model includes all required entities, attributes, key groups, and relationships that represent business information and define business rules.
In the example, we have identified the entity names, attribute names, and relationship. For detailed explanation, refer to relational data modeling.
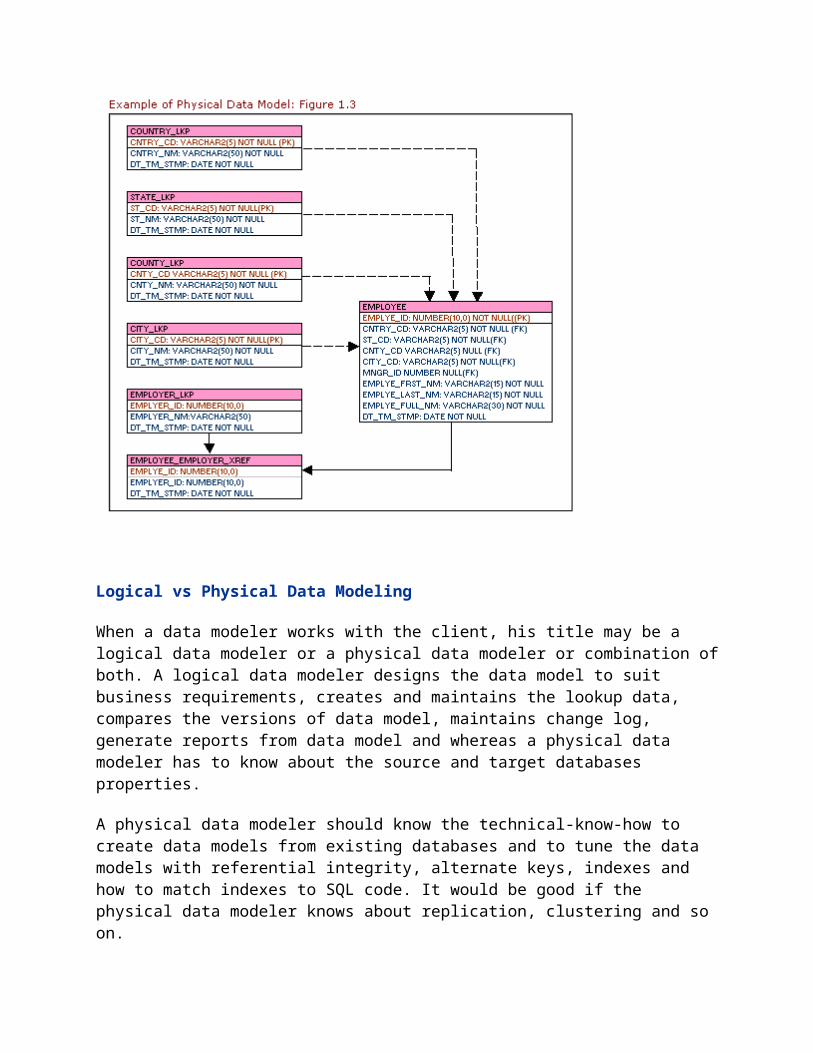
Physical Data Modeling
Physical data model includes all required tables, columns, relationships, database properties for the physical implementation of databases. Database performance, indexing strategy, physical storage and denormalization are important parameters of a physical model.
Logical data model is approved by functional team and there-after development of physical data model work gets started. Once physical data model is completed, it is then forwarded to technical teams(developer, group lead, DBA) for review. The transformations from logical model to physical model include imposing database rules, implementation of referential integrity, super types and sub types etc.
In the example, the entity names have been changed to table names, changed attribute names to column names, assigned nulls and not nulls, and datatype to each column.
Logical vs Physical Data Modeling
When a data modeler works with the client, his title may be a logical data modeler or a physical data modeler or combination of both. A logical data modeler designs the data model to suit business requirements, creates and maintains the lookup data, compares the versions of data model, maintains change log, generate reports from data model and whereas a physical data modeler has to know about the source and target databases properties.
A physical data modeler should know the technical-know-how to create data models from existing databases and to tune the data models with referential integrity, alternate keys, indexes and how to match indexes to SQL code. It would be good if the physical data modeler knows about replication, clustering and so on.
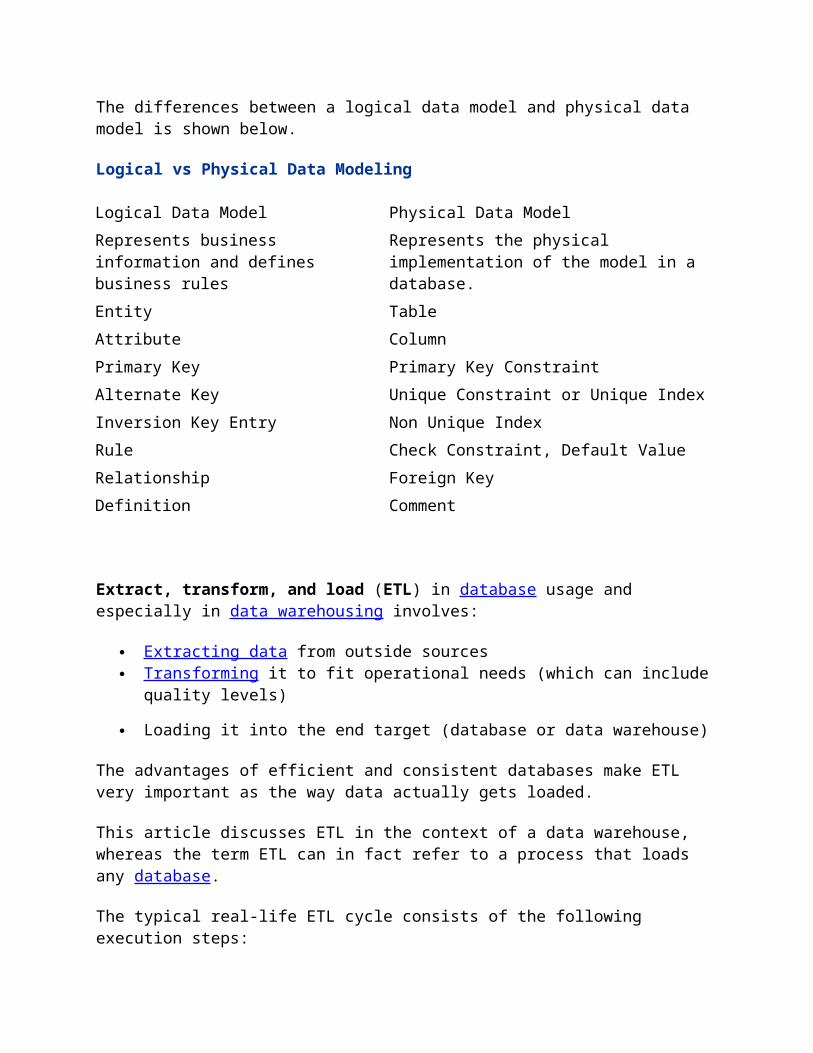
The differences between a logical data model and physical data model is shown below.
Logical vs Physical Data Modeling
Logical Data Model Physical Data Model
Represents business information and defines business rules
Represents the physical implementation of the model in a database.
Entity Table
Attribute Column
Primary Key Primary Key Constraint
Alternate Key Unique Constraint or Unique Index
Inversion Key Entry Non Unique Index
Rule Check Constraint, Default Value
Relationship Foreign Key
Definition Comment
Extract, transform, and load (ETL) in database usage and especially in data warehousing involves:
Extracting data from outside sources Transforming it to fit operational needs (which can include quality levels)
Loading it into the end target (database or data warehouse)
The advantages of efficient and consistent databases make ETL very important as the way data actually gets loaded.
This article discusses ETL in the context of a data warehouse, whereas the term ETL can in fact refer to a process that loads any database.
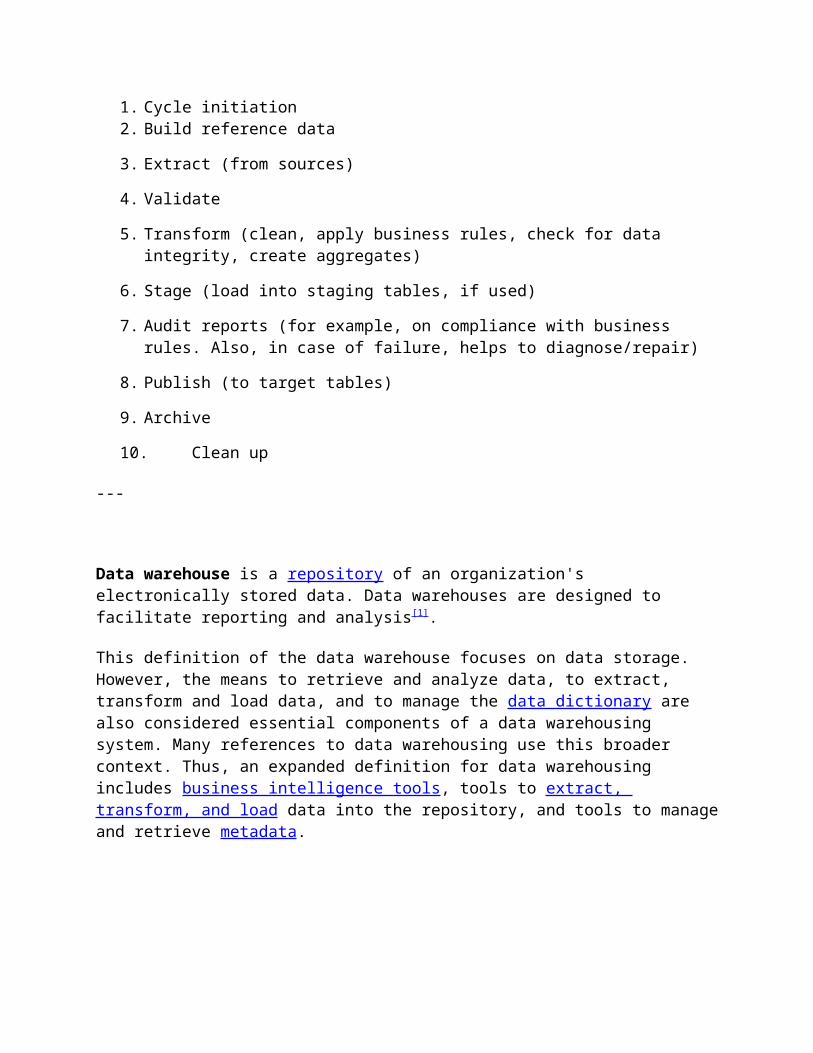
The typical real-life ETL cycle consists of the following execution steps:
1. Cycle initiation2. Build reference data
3. Extract (from sources)
4. Validate
5. Transform (clean, apply business rules, check for data integrity, create aggregates)
6. Stage (load into staging tables, if used)
7. Audit reports (for example, on compliance with business rules. Also, in case of failure, helps to diagnose/repair)
8. Publish (to target tables)
9. Archive
10. Clean up
---
Data warehouse is a repository of an organization's electronically stored data. Data warehouses are designed to facilitate reporting and analysis[1].
This definition of the data warehouse focuses on data storage. However, the means to retrieve and analyze data, to extract, transform and load data, and to manage the data dictionary are also considered essential components of a data warehousing system. Many references to data warehousing use this broader context. Thus, an expanded definition for data warehousing includes business intelligence tools, tools to extract, transform, and load data into the repository, and tools to manage and retrieve metadata.
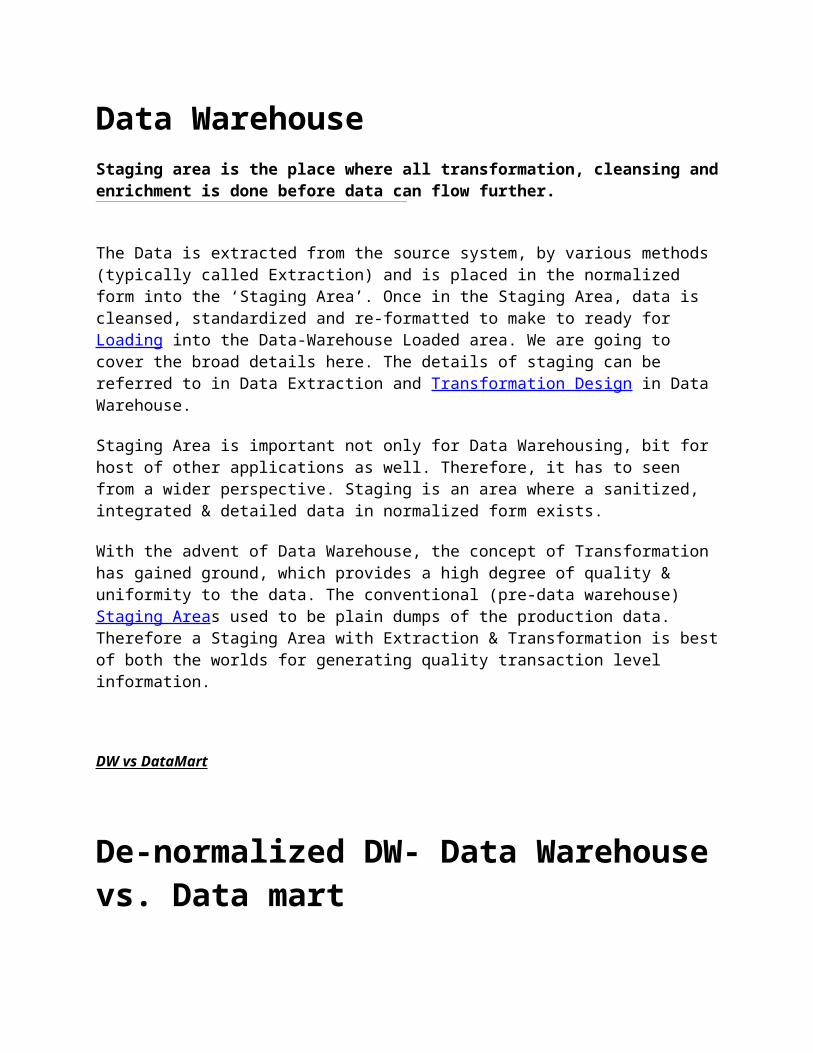
Data Warehouse Staging area is the place where all transformation, cleansing and enrichment is done before data can flow further.
The Data is extracted from the source system, by various methods (typically called Extraction) and is placed in the normalized form into the ‘Staging Area’. Once in the Staging Area, data is cleansed, standardized and re-formatted to make to ready for Loading into the Data-Warehouse Loaded area. We are going to cover the broad details here. The details of staging can be referred to in Data Extraction and Transformation Design in Data Warehouse.
Staging Area is important not only for Data Warehousing, bit for host of other applications as well. Therefore, it has to seen from a wider perspective. Staging is an area where a sanitized, integrated & detailed data in normalized form exists.
With the advent of Data Warehouse, the concept of Transformation has gained ground, which provides a high degree of quality & uniformity to the data. The conventional (pre-data warehouse) Staging Areas used to be plain dumps of the production data. Therefore a Staging Area with Extraction & Transformation is best of both the worlds for generating quality transaction level information.
DW vs DataMart
De-normalized DW- Data Warehouse vs. Data martData Warehouse/ Data Mart form the sanitized repository of Data which can be accessed for various purposes.
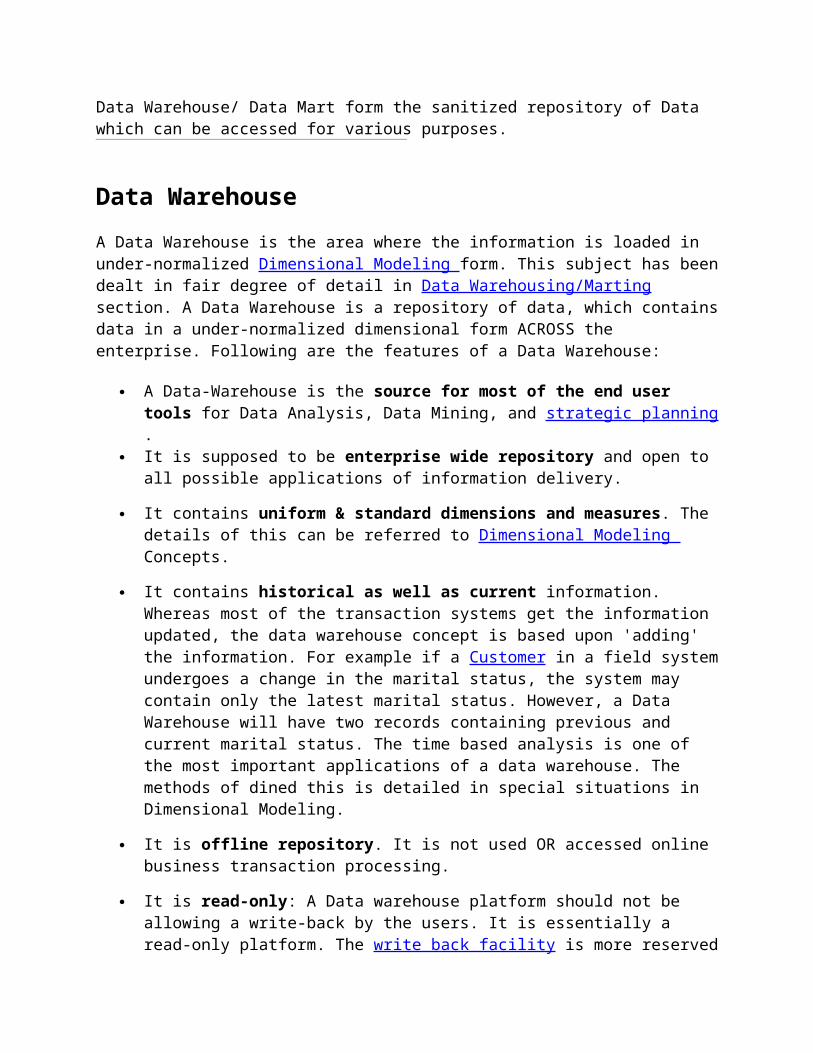
Data Warehouse
A Data Warehouse is the area where the information is loaded in under-normalized Dimensional Modeling form. This subject has been dealt in fair degree of detail in Data Warehousing/Marting section. A Data Warehouse is a repository of data, which contains data in a under-normalized dimensional form ACROSS the enterprise. Following are the features of a Data Warehouse:
A Data-Warehouse is the source for most of the end user tools for Data Analysis, Data Mining, and strategic planning .
It is supposed to be enterprise wide repository and open to all possible applications of information delivery.
It contains uniform & standard dimensions and measures. The details of this can be referred to Dimensional Modeling Concepts.
It contains historical as well as current information. Whereas most of the transaction systems get the information updated, the data warehouse concept is based upon 'adding' the information. For example if a Customer in a field system undergoes a change in the marital status, the system may contain only the latest marital status. However, a Data Warehouse will have two records containing previous and current marital status. The time based analysis is one of the most important applications of a data warehouse. The methods of dined this is detailed in special situations in Dimensional Modeling.
It is offline repository. It is not used OR accessed online business transaction processing.
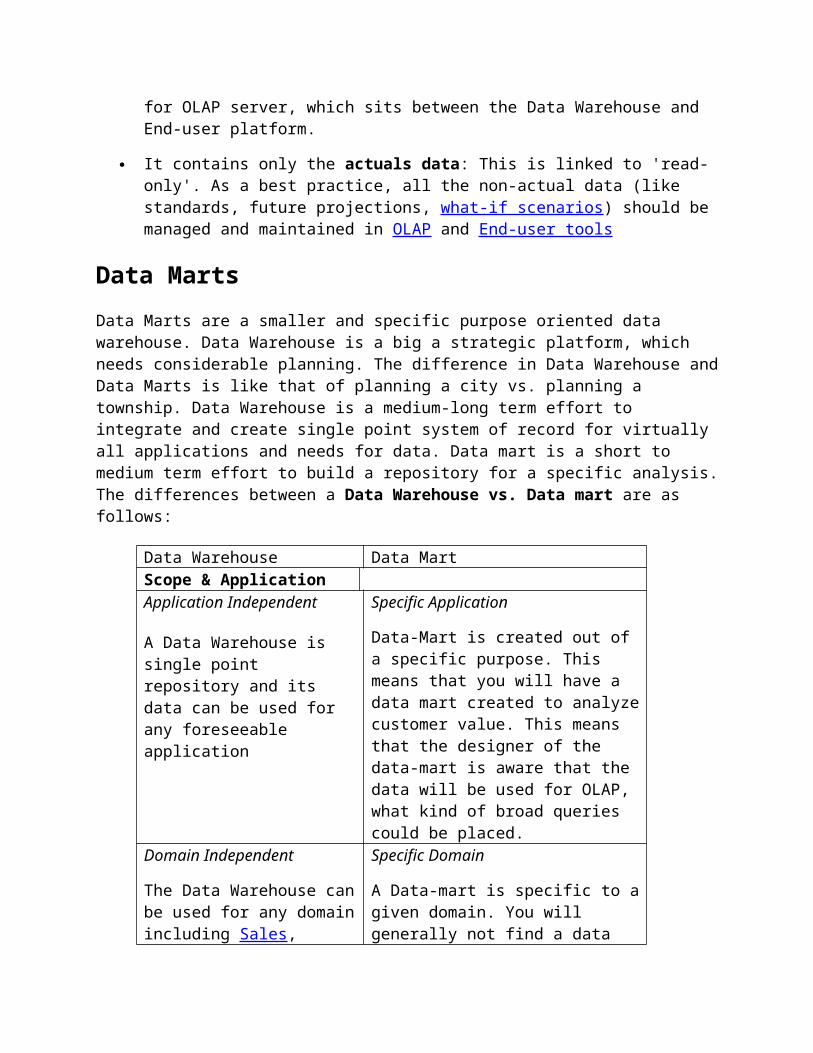
It is read-only: A Data warehouse platform should not be allowing a write-back by the users. It is essentially a read-only platform. The write back facility is more reserved for OLAP server, which sits between the Data Warehouse and End-user platform.
It contains only the actuals data: This is linked to 'read-only'. As a best practice, all the non-actual data (like standards, future projections, what-if scenarios) should be managed and maintained in OLAP and End-user tools
Data Marts
Data Marts are a smaller and specific purpose oriented data warehouse. Data Warehouse is a big a strategic platform, which needs considerable planning. The difference in Data Warehouse and Data Marts is like that of planning a city vs. planning a township. Data Warehouse is a medium-long term effort to integrate and create single point system of record for virtually all applications and needs for data. Data mart is a short to medium term effort to build a repository for a specific analysis. The differences between a Data Warehouse vs. Data mart are as follows:
Data Warehouse Data Mart Scope & Application Application Independent
A Data Warehouse is single point repository and its data can be used for any foreseeable application
Specific Application
Data-Mart is created out of a specific purpose. This means that you will have a data mart created to analyze customer value. This means that the designer of the data-mart is aware that the data will be used for OLAP, what kind of broad queries could be placed.
Domain Independent
The Data Warehouse can be used for any domain including Sales, Customer, operations, finance etc.
Specific Domain
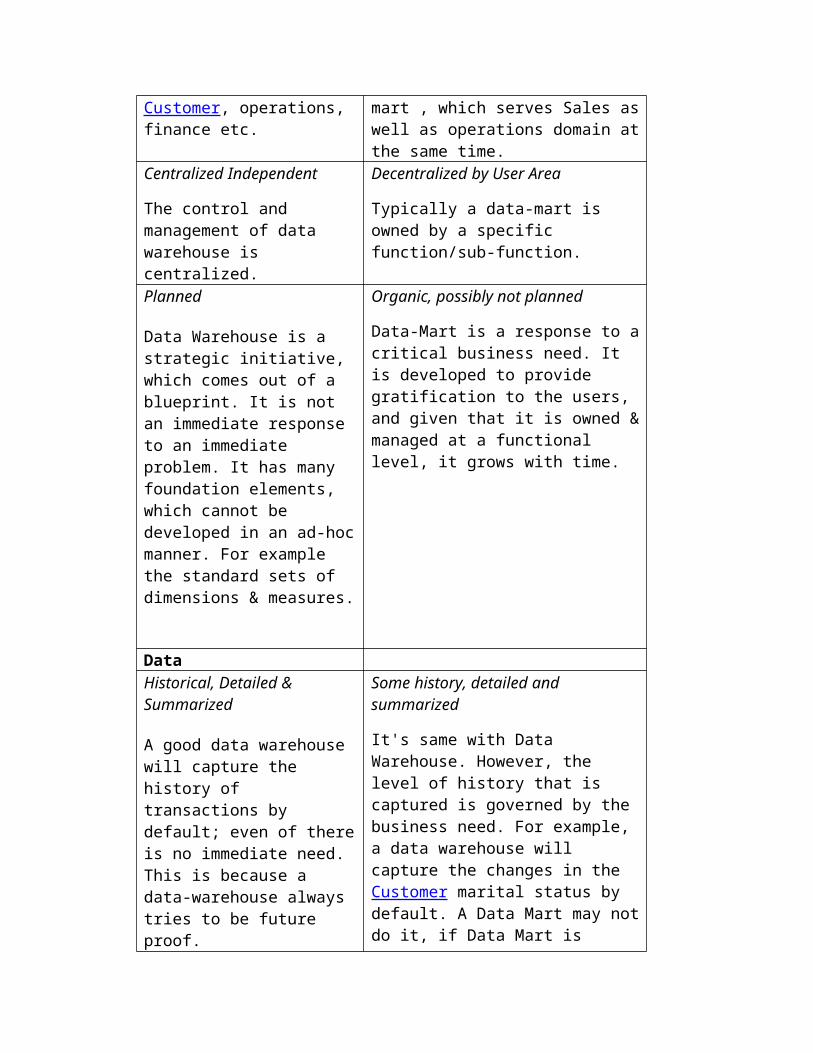
A Data-mart is specific to a given domain. You will generally not find a data mart , which serves Sales as well as operations domain at the same time.
Centralized Independent
The control and management of data warehouse is centralized.
Decentralized by User Area
Typically a data-mart is owned by a specific function/sub-function.
Planned
Data Warehouse is a strategic initiative, which comes out of a blueprint. It is not an immediate response to an immediate problem. It has many foundation elements, which cannot be developed in an ad-hoc manner. For example the standard sets of dimensions & measures.
Organic, possibly not planned
Data-Mart is a response to a critical business need. It is developed to provide gratification to the users, and given that it is owned & managed at a functional level, it grows with time.
Data Historical, Detailed & Some history, detailed and summarized
Summarized
A good data warehouse will capture the history of transactions by default; even of there is no immediate need. This is because a data-warehouse always tries to be future proof.
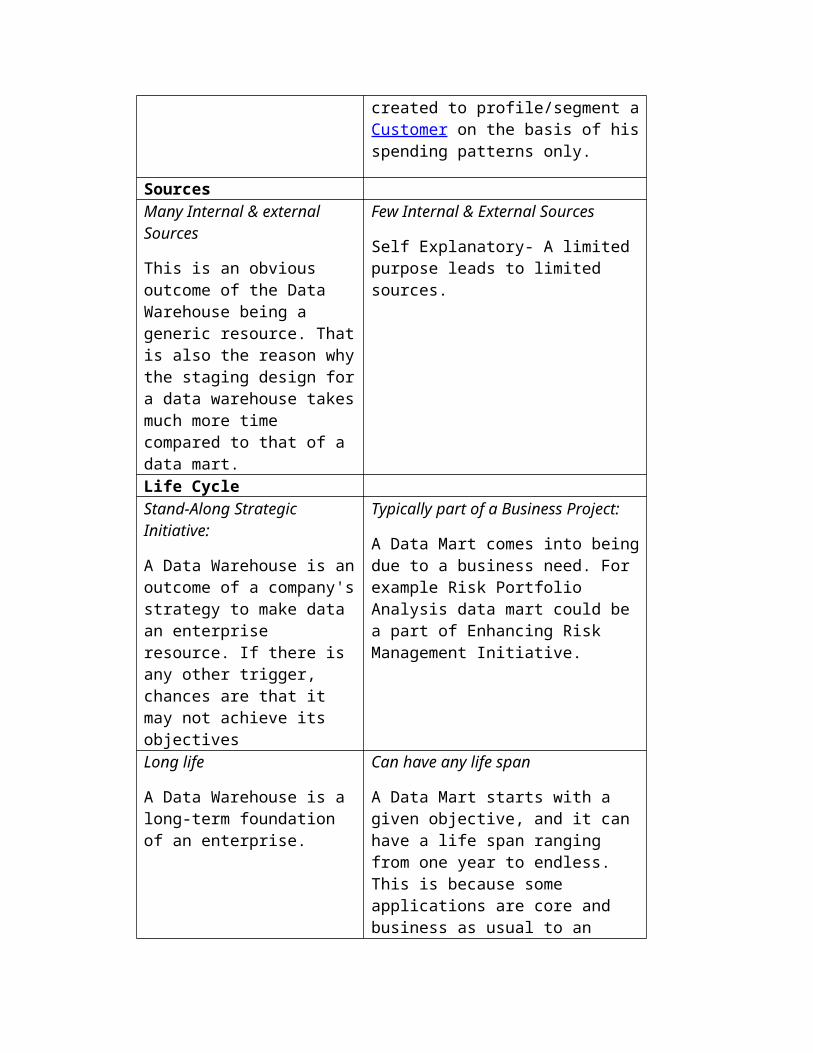
It's same with Data Warehouse. However, the level of history that is captured is governed by the business need. For example, a data warehouse will capture the changes in the Customer marital status by default. A Data Mart may not do it, if Data Mart is created to profile/segment a Customer on the basis of his spending patterns only.
Sources Many Internal & external Sources
This is an obvious outcome of the Data Warehouse being a generic resource. That is also the reason why the staging design for a data warehouse takes much more time compared to that of a data mart.
Few Internal & External Sources
Self Explanatory- A limited purpose leads to limited sources.
Life Cycle Stand-Along Strategic Initiative:
A Data Warehouse is an outcome of a company's strategy to make data an enterprise resource. If there is any other trigger, chances are that it may not achieve its objectives
Typically part of a Business Project:
A Data Mart comes into being due to a business need. For example Risk Portfolio Analysis data mart could be a part of Enhancing Risk Management Initiative.
Long life
A Data Warehouse is a long-term foundation of an enterprise.
Can have any life span
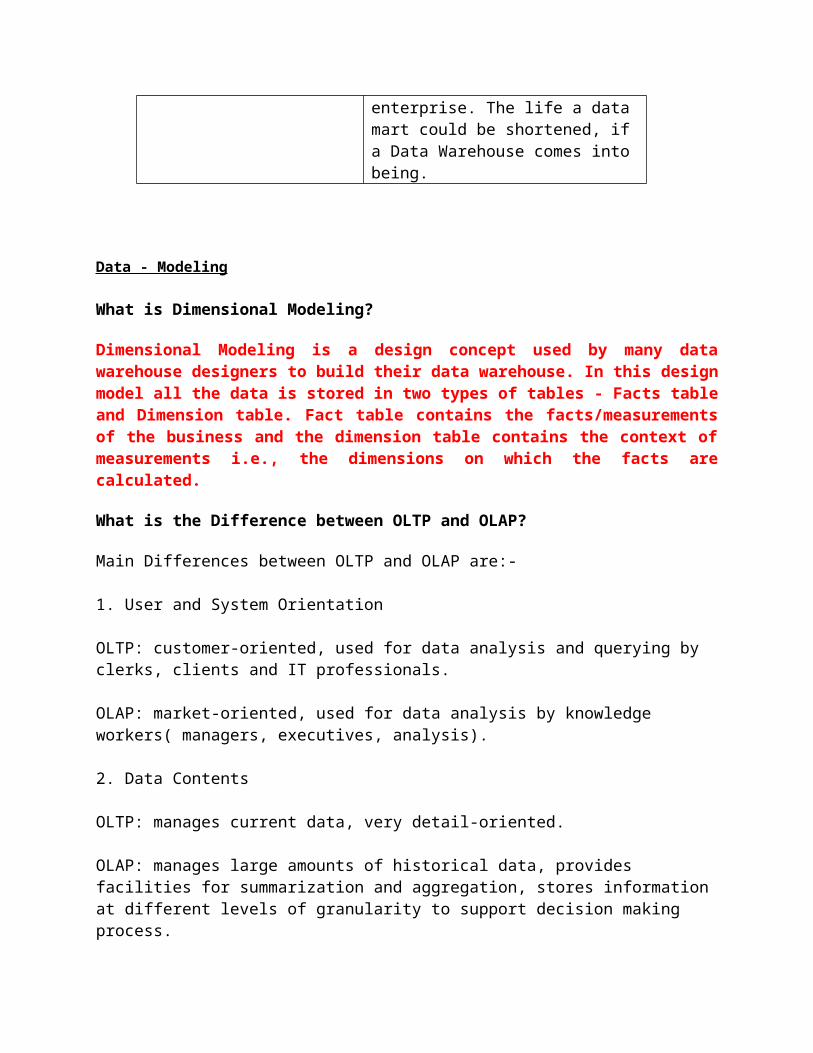
A Data Mart starts with a given objective, and it can have a life span ranging from one year to endless. This is because some applications are core and business as usual to an enterprise. The life a data mart could be shortened, if a Data Warehouse comes into being.
Data - Modeling
What is Dimensional Modeling?
Dimensional Modeling is a design concept used by many data warehouse designers to build their data warehouse. In this design model all the data is stored in two types of tables - Facts table and Dimension table. Fact table contains the facts/measurements of the business and the dimension table contains the context of measurements i.e., the dimensions on which the facts are calculated.
What is the Difference between OLTP and OLAP?
Main Differences between OLTP and OLAP are:-
1. User and System Orientation
OLTP: customer-oriented, used for data analysis and querying by clerks, clients and IT professionals.
OLAP: market-oriented, used for data analysis by knowledge workers( managers, executives, analysis).
2. Data Contents
OLTP: manages current data, very detail-oriented.
OLAP: manages large amounts of historical data, provides facilities for summarization and aggregation, stores information at different levels of granularity to support decision making process.
3. Database Design
OLTP: adopts an entity relationship(ER) model and an application-oriented database design.
OLAP: adopts star, snowflake or fact constellation model and a subject-oriented database design.
4. View
OLTP: focuses on the current data within an enterprise or department.
OLAP: spans multiple versions of a database schema due to the evolutionary process of an organization; integrates information from many organizational locations and data stores
ETL tools are used to extract, transformation and loading the data into data warehouse / data mart
OLAP tools are used to create cubes/reports for business analysis from data warehouse / data mart
ETL tool is used to extract the data and to perform the operation as per our needs for eg : informatica data mart but OLAP is completely differ from etl process it is used for generating report also known as reporting tool eg: bo and cognos.
What do you mean by dimension attributes?The Dimension Attributes are the various columns in a dimension table. For example , attributes in a PRODUCT dimension can be product category, product type etc. Generally the Dimension Attributes are used in query filter condition and to display other related information about an dimension.
What is a surrogate key?A surrogate key is a substitution for the natural primary key. It is a unique identifier or number ( normally created by a database sequence generator ) for each record of a dimension table that can be used for the primary key to the table.
A surrogate key is useful because natural keys may change.
What is BI?Business Intelligence is a term introduced by Howard Dresner of Gartner Group in 1989. He described Business Intelligence as a set of concepts and methodologies to improve decision making in business through use of facts and fact based systems.
What is aggregation?In a data warehouse paradigm "aggregation" is one way of improving query performance. An aggregate fact table is a new table created off of an existing fact table by summing up facts for a set of associated dimension. Grain of an aggregate fact is higher than the fact table. Aggreagate tables contain fewer rows thus making quesries run faster.
What are the different approaches for making a Datawarehouse?This is a generic question: From a business perspective, it is very important to first get clarity on the end user requirements and a system study before commencing any Data warehousing project. From a technical perspective, it is important to first understand the dimensions and measures, determine quality and structure of source data from the OLTP systems and then decide which dimensional model to apply, i.e. whether we do a star or snowflake or a combination of both. From a conceptual perspective, we can either go the Ralph Kimball method (build data marts and then consolidate at the end to form an enterprise Data warehouse) or the Bill Inmon method (build a large Data warehouse and derive data marts from the same. In order to decide on the method, a strong understanding of the business requirement and data structure is needed as also consensus with the customer.
What is staging area?Staging area is also called ‘Operational Data Store’ (ODS). It is a data holding place where the data which is extracted from all the data sources are stored. From the Staging area, data is loaded to the data warehouse. Data cleansing takes place in this stage.
What is the difference between star and snowflake schema?The main difference between star schema and snowflake schema is that the star schema is highly denormalized and the snowflake schema is normalized. So the data access latency is less in star schema in comparison to snowflake schema. As the star schema is denormalized, the size of the data warehouse will be larger than that of snowflake schema. The schemas are selected as per the client requirements. Performance wise, star schema is good. But if memory utilization is a major concern, then snow flake schema is better than star schema.
What is Data mart?A data mart is a subset of an organizational data store, usually oriented to a specific purpose or major data subject, that may be distributed to support business needs.[1] Data marts are analytical data stores designed to focus on specific business functions for a specific community within an organization. Data marts are often derived from subsets of data in a data warehouse, though in the bottom-up data warehouse design methodology the data warehouse is created from the union of organizational data marts.
Normalized versus dimensional approach for storage of data
There are two leading approaches to storing data in a data warehouse - the dimensional approach and the normalized approach.
In the dimensional approach, transaction data are partitioned into either "facts", which are generally numeric transaction data, or "dimensions", which are the reference information that gives context to the facts. For example, a sales transaction can be broken up into facts such as the number of products ordered and the price paid for the products, and into dimensions such as order date, customer name, product number, order ship-to and bill-to locations, and salesperson responsible for receiving the order. A key advantage of a dimensional approach is that the data warehouse is easier for the user to understand and to use. Also, the retrieval of data from the data warehouse tends to operate very quickly. The main disadvantages of the dimensional approach are: 1) In order to maintain the integrity of facts and dimensions, loading the data warehouse with data from different operational systems is complicated, and 2) It is difficult to modify the data warehouse structure if the organization adopting the dimensional approach changes the way in which it does business.
In the normalized approach, the data in the data warehouse are stored following, to a degree, database normalization rules. Tables are grouped together by subject areas that reflect general data categories (e.g., data on customers, products, finance, etc.) The main advantage of this approach is that it is straightforward to add information into the database. A disadvantage of this approach is that, because of the number of tables involved, it can be difficult for users both to 1)
join data from different sources into meaningful information and then 2) access the information without a precise understanding of the sources of data and of the data structure of the data warehouse.
These approaches are not mutually exclusive. Dimensional approaches can involve normalizing data to a degree.
Benefits of data warehousing
Some of the benefits that a data warehouse provides are as follows: [7][8]
A data warehouse provides a common data model for all data of interest regardless of the data's source. This makes it easier to report and analyze information than it would be if multiple data models were used to retrieve information such as sales invoices, order receipts, general ledger charges, etc.
Prior to loading data into the data warehouse, inconsistencies are identified and resolved. This greatly simplifies reporting and analysis.
Information in the data warehouse is under the control of data warehouse users so that, even if the source system data is purged over time, the information in the warehouse can be stored safely for extended periods of time.
Because they are separate from operational systems, data warehouses provide retrieval of data without slowing down operational systems.
Data warehouses can work in conjunction with and, hence, enhance the value of operational business applications, notably customer relationship management (CRM) systems.
Data warehouses facilitate decision support system applications such as trend reports (e.g., the items with the most sales in a particular area within the last two years), exception reports, and reports that show actual performance versus goals.
Cube can (and arguably should) mean something quite specific - OLAP artifacts presented through an OLAP server such as MS Analysis Services or Oracle (nee Hyperion) Essbase. However, it also gets used much more loosely. OLAP cubes of this sort use cube-aware query tools which use a different API to a standard relational database. Typically OLAP servers maintain their own optimized data structures (known as MOLAP), although they can be implemented as a front-end to a relational data source (known as ROLAP) or in various hybrid modes (known as HOLAP)
I try to be specific and use 'cube' specifically to refer to cubes on OLAP servers such as SSAS.
Business Objects works by querying data through one or more sources (which could be relational databases, OLAP cubes, or flat files) and creating an in-memory data structure called a MicroCube which it uses to support interactive slice-and-dice activities. Analysis Services and MSQuery can make a cube (.cub) file which can be opened by the AS client software or Excel and sliced-and-diced in a similar manner. IIRC Recent versions of Business Objects can also open .cub files.
To be pedantic I think Business Objects sits in a 'semi-structured reporting' space somewhere between a true OLAP system such as ProClarity and ad-hoc reporting tool such as Report Builder, Oracle Discoverer or Brio. Round trips to the Query Panel make it somewhat clunky as a pure stream-of-thought OLAP tool but it does offer a level of interactivity that traditional reports don't. I see the sweet spot of Business Objects as sitting in two places: ad-hoc reporting by staff not necessarily familiar with SQL and provding a scheduled report delivered in an interactive format that allows some drill-down into the data.
'Data Mart' is also a fairly loosely used term and can mean any user-facing data access medium for a data warehouse system. The definition may or may not include the reporting tools and metadata layers, reporting layer tables or other items such as Cubes or other analytic systems.
I tend to think of a data mart as the database from which the reporting is done, particularly if it is a readily definable subsystem of the overall data warehouse architecture. However it is quite reasonable to think of it as the user facing reporting layer, particularly if there are ad-hoc reporting tools such as Business Objects or OLAP systems that allow end-users to get at the data directly.The term "data mart" has become somewhat ambiguous, but it is traditionally associated with a subject-oriented subset of an organization's information systems. Data mart does not explicitly imply the presence of a multi-dimensional technology such as OLAP and data mart does not explicitly imply the presence of summarized numerical data.
A cube, on the other hand, tends to imply that data is presented using a multi-dimensional nomenclature (typically an OLAP technology) and that the data is generally summarized as intersections of multiple hierarchies. (i.e. the net worth of your family vs. your personal net worth and everything in between) Generally, “cube” implies something very specific whereas “data mart” tends to be a little more general.
I suppose in OOP speak you could accurately say that a data mart “has-a” cube, “has-a” relational database, “has-a” nifty reporting interface, etc… but it would be less correct to say that any one of those individually “is-a” data mart. The term data mart is more inclusive.
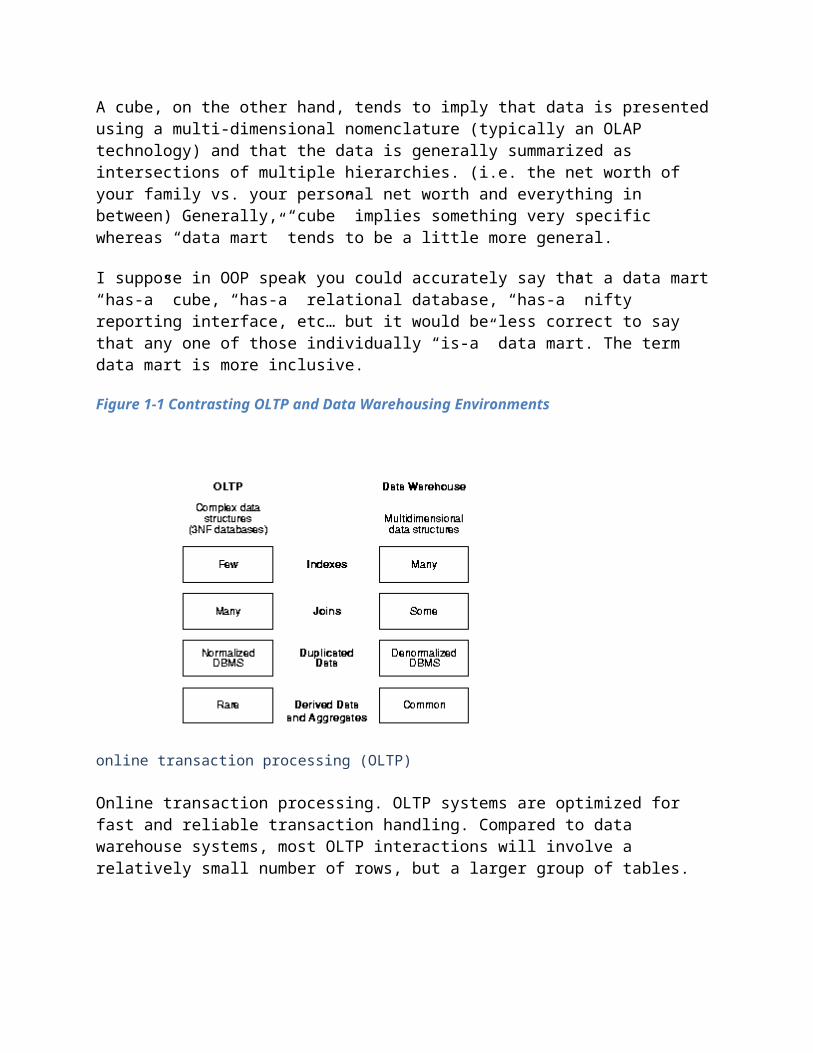
Figure 1-1 Contrasting OLTP and Data Warehousing Environments
online transaction processing (OLTP)
Online transaction processing. OLTP systems are optimized for fast and reliable transaction handling. Compared to data warehouse systems, most OLTP interactions will involve a relatively small number of rows, but a larger group of tables.
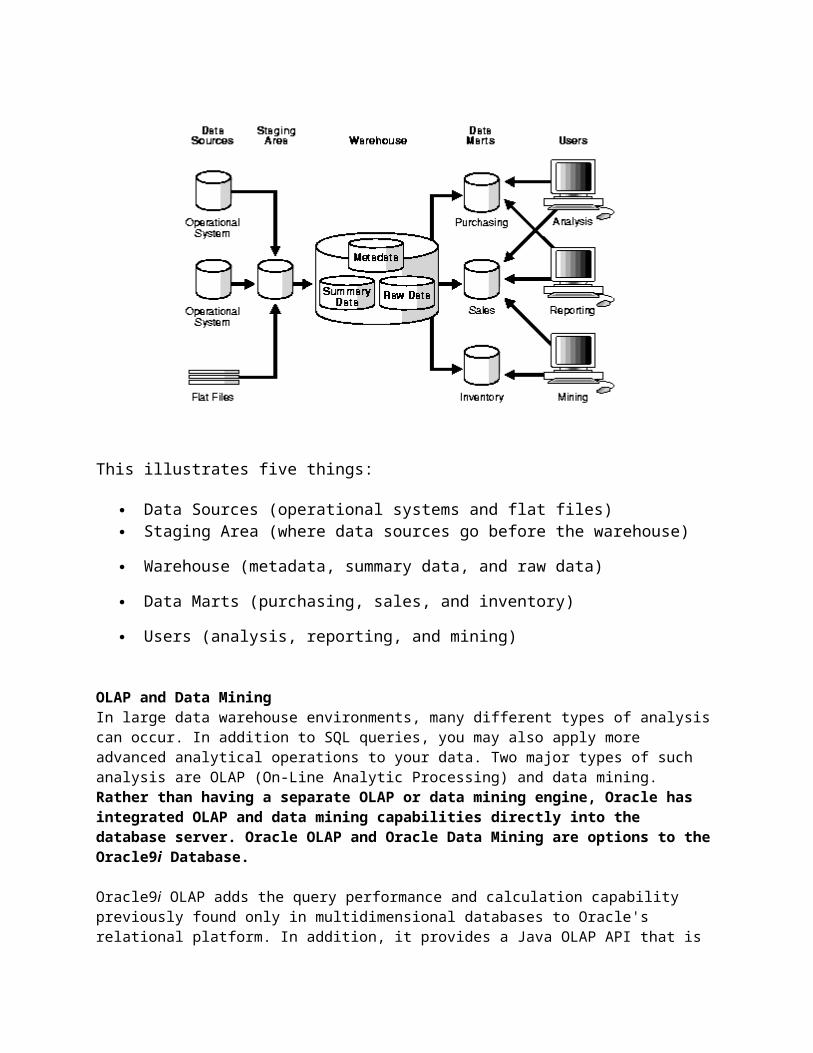
This illustrates five things:
Data Sources (operational systems and flat files)
Staging Area (where data sources go before the warehouse)
Warehouse (metadata, summary data, and raw data)
Data Marts (purchasing, sales, and inventory)
Users (analysis, reporting, and mining)
OLAP and Data MiningIn large data warehouse environments, many different types of analysis can occur. In addition to SQL queries, you may also apply more advanced analytical operations to your data. Two major types of such analysis are OLAP (On-Line Analytic Processing) and data mining. Rather than having a separate OLAP or data mining engine, Oracle has integrated OLAP and data mining capabilities directly into the database server. Oracle OLAP and Oracle Data Mining are options to the Oracle9i Database.
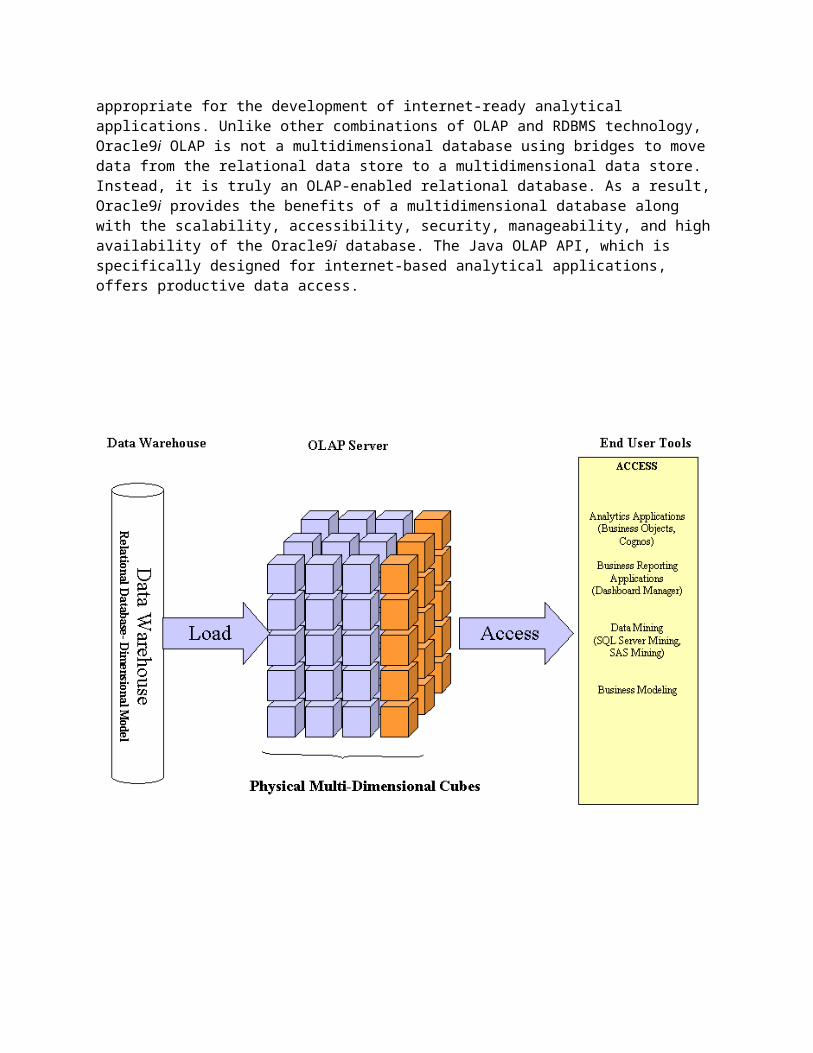
Oracle9i OLAP adds the query performance and calculation capability previously found only in multidimensional databases to Oracle's relational platform. In addition, it provides a Java OLAP API that is appropriate for the development of internet-ready analytical applications. Unlike other combinations of OLAP and RDBMS technology, Oracle9i OLAP is not a multidimensional database using bridges to move data from the relational data store to a multidimensional data store. Instead, it is truly an OLAP-enabled relational database. As a result, Oracle9i provides the benefits of a multidimensional database along with the scalability, accessibility, security, manageability, and high availability of the Oracle9i database. The Java OLAP API, which is specifically designed for internet-based analytical applications, offers productive data access.
How can PL/SQL be best used for the ETL process? PL/SQL, Oracle's procedural programming language, is a solid choice for an ETL tool. However, you must realize that PL/SQL is not an ETL tool, but a programming language with almost unlimited ETL capabilities.
If you do decide that PL/SQL is your ETL "tool" of choice, you will find that any ETL function that you require will be available. So if you wish to read files into the database, you can use an external table or SQL*Loader, but if you use PL/SQL you could use the UTL_FILE package and then use looping and conditional processing as you require. The options are almost limitless.
So I think that PL/SQL could be your ETL solution if you have no other tools available. Another approach might be writing procedures, packages and functions that may be used by an ETL tool. This is usually done when complicated transformations cannot be efficiently implemented in the ETL.
As you can see PL/SQL fits well into any ETL process.
Buy vs. Build
When it comes to ETL tool selection, it is not always necessary to purchase a third-party tool. This determination largely depends on three things:
Complexity of the data transformation: The more complex the data transformation is, the more suitable it is to purchase an ETL tool.
Data cleansing needs: Does the data need to go through a thorough cleansing exercise before it is suitable to be stored in the data warehouse? If so, it is best to purchase a tool with strong data cleansing functionalities. Otherwise, it may be sufficient to simply build the ETL routine from scratch.
Data volume. Available commercial tools typically have features that can speed up data movement. Therefore, buying a commercial product is a better approach if the volume of data transferred is large.
ETL Tool Functionalities While the selection of a database and a hardware platform is a must, the selection of an ETL tool
is highly recommended, but it's not a must. When you evaluate ETL tools, it pays to look for the following characteristics:
Functional capability: This includes both the 'transformation' piece and the 'cleansing' piece. In general, the typical ETL tools are either geared towards having strong transformation capabilities or having strong cleansing capabilities, but they are seldom very strong in both. As a result, if you know your data is going to be dirty coming in, make sure your ETL tool has strong cleansing capabilities. If you know there are going to be a lot of different data transformations, it then makes sense to pick a tool that is strong in transformation.
Ability to read directly from your data source: For each organization, there is a different set of data sources. Make sure the ETL tool you select can connect directly to your source data.
Metadata support: The ETL tool plays a key role in your metadata because it maps the source data to the destination, which is an important piece of the metadata. In fact, some organizations have come to rely on the documentation of their ETL tool as their metadata source. As a result, it is very important to select an ETL tool that works with your overall metadata strategy.
OLAP Tool Functionalities
Before we speak about OLAP tool selection criterion, we must first distinguish between the two types of OLAP tools, MOLAP (Multidimensional OLAP) and ROLAP (Relational OLAP).
1. MOLAP: In this type of OLAP, a cube is aggregated from the relational data source (data warehouse). When user generates a report request, the MOLAP tool can generate the create quickly because all data is already pre-aggregated within the cube.
2. ROLAP: In this type of OLAP, instead of pre-aggregating everything into a cube, the ROLAP engine essentially acts as a smart SQL generator. The ROLAP tool typically comes with a 'Designer' piece, where the data warehouse administrator can specify the relationship between the relational tables, as well as how dimensions, attributes, and hierarchies map to the underlying database tables.
Right now, there is a convergence between the traditional ROLAP and MOLAP vendors. ROLAP vendor recognize that users want their reports fast, so they are implementing MOLAP functionalities in their tools; MOLAP vendors recognize that many times it is necessary to drill down to the most detail level information, levels where the traditional cubes do not get to for performance and size reasons.
So what are the criteria for evaluating OLAP vendors? Here they are:
Ability to leverage parallelism supplied by RDBMS and hardware: This would greatly increase the tool's performance, and help loading the data into the cubes as quickly as possible. Performance: In addition to leveraging parallelism, the tool itself should be quick both in terms of loading the data into the cube and reading the data from the cube. Customization efforts: More and more, OLAP tools are used as an advanced reporting tool. This is because in many cases, especially for ROLAP implementations, OLAP tools often can be used as a reporting tool. In such cases, the ease of front-end customization becomes an important factor in the tool selection process. Security Features: Because OLAP tools are geared towards a number of users, making sure people see only what they are supposed to see is important. By and large, all established OLAP tools have a security layer that can interact with the common corporate login protocols. There are, however, cases where large corporations have developed their own user authentication mechanism and have a "single sign-on" policy. For these cases, having a seamless integration between the tool and the in-house authentication can require some work. I would recommend that you have the tool vendor team come in and make sure that the two are compatible. Metadata support: Because OLAP tools aggregates the data into the cube and sometimes serves as the front-end tool, it is essential that it works with the metadata strategy/tool you have selected.
Popular Tools Business Objects
Cognos Hyperion
Microsoft Analysis Services
MicroStrategy
Conceptual, Logical, And Physical Data Models
There are three levels of data modeling. They are conceptual, logical, and physical. This section will explain the difference among the three, the order with which each one is created, and how to go from one level to the other.
Conceptual Data Model
Features of conceptual data model include:
Includes the important entities and the relationships among them. No attribute is specified.
No primary key is specified.
At this level, the data modeler attempts to identify the highest-level relationships among the different entities.
Logical Data Model
Features of logical data model include:
Includes all entities and relationships among them. All attributes for each entity are specified.
The primary key for each entity specified.
Foreign keys (keys identifying the relationship between different entities) are specified.
Normalization occurs at this level.
At this level, the data modeler attempts to describe the data in as much detail as possible, without regard to how they will be physically implemented in the database.
In data warehousing, it is common for the conceptual data model and the logical data model to be combined into a single step (deliverable).
The steps for designing the logical data model are as follows:
1. Identify all entities. 2. Specify primary keys for all entities.
3. Find the relationships between different entities.
4. Find all attributes for each entity.
5. Resolve many-to-many relationships.
6. Normalization.
Physical Data Model
Features of physical data model include:
Specification all tables and columns. Foreign keys are used to identify relationships between tables.
Denormalization may occur based on user requirements.
Physical considerations may cause the physical data model to be quite different from the logical data model.
At this level, the data modeler will specify how the logical data model will be realized in the database schema.
The steps for physical data model design are as follows:
1. Convert entities into tables. 2. Convert relationships into foreign keys.
3. Convert attributes into columns.
4. Modify the physical data model based on physical constraints / requirements.
Dimensional Data Model
Dimensional data model is most often used in data warehousing systems. This is different from the 3rd normal form, commonly used for transactional (OLTP) type systems. As you can imagine, the same data would then be stored differently in a dimensional model than in a 3rd normal form model.
To understand dimensional data modeling, let's define some of the terms commonly used in this type of modeling:
Dimension: A category of information. For example, the time dimension.
Attribute: A unique level within a dimension. For example, Month is an attribute in the Time Dimension.
Hierarchy: The specification of levels that represents relationship between different attributes within a dimension. For example, one possible hierarchy in the Time dimension is Year → Quarter → Month → Day.
Fact Table: A fact table is a table that contains the measures of interest. For example, sales amount would be such a measure. This measure is stored in the fact table with the appropriate granularity. For example, it can be sales amount by store by day. In this case, the fact table would contain three columns: A date column, a store column, and a sales amount column.
Lookup Table: The lookup table provides the detailed information about the attributes. For example, the lookup table for the Quarter attribute would include a list of all of the quarters available in the data warehouse. Each row (each quarter) may have several fields, one for the unique ID that identifies the quarter, and one or more additional fields that specifies how that particular quarter is represented on a report (for example, first quarter of 2001 may be represented as "Q1 2001" or "2001 Q1").
A dimensional model includes fact tables and lookup tables. Fact tables connect to one or more lookup tables, but fact tables do not have direct relationships to one another. Dimensions and hierarchies are represented by lookup tables. Attributes are the non-key columns in the lookup tables.
In designing data models for data warehouses / data marts, the most commonly used schema types are Star Schema and Snowflake Schema.
Star Schema: In the star schema design, a single object (the fact table) sits in the middle and is radially connected to other surrounding objects (dimension lookup tables) like a star. A star schema can be simple or complex. A simple star consists of one fact table; a complex star can have more than one fact table.
Snowflake Schema: The snowflake schema is an extension of the star schema, where each point of the star explodes into more points. The main advantage of the snowflake schema is the improvement in query performance due to minimized disk storage requirements and joining smaller lookup tables. The main disadvantage of the snowflake schema is the additional maintenance efforts needed due to the increase number of lookup tables.
Whether one uses a star or a snowflake largely depends on personal preference and business needs. Personally, I am partial to snowflakes, when there is a business case to analyze the information at that particular level.
Aggregation: One way of speeding up query performance. Facts are summed up for selected dimensions from the original fact table. The resulting aggregate table will have fewer rows, thus making queries that can use them go faster.
Attribute: Attributes represent a single type of information in a dimension. For example, year is an attribute in the Time dimension.
Conformed Dimension: A dimension that has exactly the same meaning and content when being referred from different fact tables.
Data Mart: Data marts have the same definition as the data warehouse (see below), but data marts have a more limited audience and/or data content.
Data Warehouse: A warehouse is a subject-oriented, integrated, time-variant and non-volatile collection of data in support of management's decision making process (as defined by Bill Inmon).
Data Warehousing: The process of designing, building, and maintaining a data warehouse system.
Dimension: The same category of information. For example, year, month, day, and week are all part of the Time Dimension.
Dimensional Model: A type of data modeling suited for data warehousing. In a dimensional model, there are two types of tables: dimensional tables and fact tables. Dimensional table records information on each dimension, and fact table records all the "fact", or measures.
Dimensional Table: Dimension tables store records related to this particular dimension. No facts are stored in a dimensional table.
ETL: Stands for Extraction, Transformation, and Loading. The movement of data from one area to another.
Fact Table: A type of table in the dimensional model. A fact table typically includes two types of columns: fact columns and foreign keys to the dimensions.
Hierarchy: A hierarchy defines the navigating path for drilling up and drilling down. All attributes in a hierarchy belong to the same dimension.
Metadata: Data about data. For example, the number of tables in the database is a type of metadata.
Metric: A measured value. For example, total sales is a metric.
MOLAP: Multidimensional OLAP. MOLAP systems store data in the multidimensional cubes.
OLAP: On-Line Analytical Processing. OLAP should be designed to provide end users a quick way of slicing and dicing the data.
ROLAP: Relational OLAP. ROLAP systems store data in the relational database.
Snowflake Schema: A common form of dimensional model. In a snowflake schema, different hierarchies in a dimension can be extended into their own dimensional tables. Therefore, a dimension can have more than a single dimension table.
Star Schema: A common form of dimensional model. In a star schema, each dimension is represented by a single dimension table.
----------
The following are the typical processes involved in the datawarehousing project cycle.
Requirement Gathering Physical Environment Setup
Data Modeling
ETL
OLAP Cube Design
Front End Development
Performance Tuning
Quality Assurance
Rolling out to Production
Production Maintenance
Incremental Enhancements
This is a very important step in the data warehousing project. Indeed, it is fair to say that the foundation of the data warehousing system is the data model. A good data model will allow the data warehousing system to grow easily, as well as allowing for good performance.
In data warehousing project, the logical data model is built based on user requirements, and then it is translated into the physical data model. The detailed steps can be found in the Conceptual, Logical, and Physical Data Modeling section.
Part of the data modeling exercise is often the identification of data sources. Sometimes this step is deferred until the ETL step. However, my feeling is that it is better to find out where the data exists, or, better yet, whether they even exist anywhere in the enterprise at all. Should the data not be available, this is a good time to raise the alarm. If this was delayed until the ETL phase, rectifying it will becoming a much tougher and more complex process.
The ETL (Extraction, Transformation, Loading) process typically takes the longest to develop, and this can easily take up to 50% of the data warehouse implementation cycle or longer. The reason for this is that it takes time to get the source data, understand the necessary columns, understand the business rules, and understand the logical and physical data models.
Possible Pitfalls
There is a tendency to give this particular phase too little development time. This can prove suicidal to the project because end users will usually tolerate less formatting, longer time to run reports, less functionality (slicing and dicing), or fewer delivered reports; one thing that they will not tolerate is wrong information.
A second common problem is that some people make the ETL process more complicated than necessary. In ETL design, the primary goal should be to optimize load speed without sacrificing on quality. This is, however, sometimes not followed. There are cases where the design goal is to cover all possible future uses, whether they are practical or just a figment of someone's imagination. When this happens, ETL performance suffers, and often so does the performance of the entire data warehousing system.
There are three major areas where a data warehousing system can use a little performance tuning:
ETL - Given that the data load is usually a very time-consuming process (and hence they are typically relegated to a nightly load job) and that data warehousing-related batch jobs are typically of lower priority, that means that the window for data loading is not very long. A data warehousing system that has its ETL process finishing right on-time is going to have a lot of problems simply because often the jobs do not get started on-time due to factors that is beyond the control of the data warehousing team. As a result, it is always an excellent idea for the data warehousing group to tune the ETL process as much as possible.
Query Processing - Sometimes, especially in a ROLAP environment or in a system where the reports are run directly against the relationship database, query performance can be an issue. A study has shown that users typically lose interest after 30 seconds of waiting for a report to return. My experience has been that ROLAP reports or reports that run directly against the RDBMS often exceed this time limit, and it is hence ideal for the data warehousing team to invest some time to tune the query, especially the most popularly ones.
Report Delivery - It is also possible that end users are experiencing significant delays in receiving their reports due to factors other than the query performance. For example, network traffic, server setup, and even the way that the front-end was built sometimes play significant roles. It is important for the data warehouse team to look into these areas for performance tuning.
QA
Once the development team declares that everything is ready for further testing, the QA team takes over. The QA team is always from the client. Usually the QA team members will know little about data warehousing, and some of them may even resent the need to have to learn another tool or tools. This makes the QA process a tricky one.
Sometimes the QA process is overlooked. On my very first data warehousing project, the project team worked very hard to get everything ready for Phase 1, and everyone thought that we had met the deadline. There was one mistake, though, the project managers failed to recognize that it is necessary to go through the client QA process before the project can go into production. As a result, it took five extra months to bring the project to production (the original development time had been only 2 1/2
In the OLAP world, there are mainly two different types: Multidimensional OLAP (MOLAP) and Relational OLAP (ROLAP). Hybrid OLAP (HOLAP) refers to technologies that combine MOLAP and ROLAP.
MOLAP
This is the more traditional way of OLAP analysis. In MOLAP, data is stored in a multidimensional cube. The storage is not in the relational database, but in proprietary formats.
Advantages:
Excellent performance: MOLAP cubes are built for fast data retrieval, and is optimal for slicing and dicing operations.
Can perform complex calculations: All calculations have been pre-generated when the cube is created. Hence, complex calculations are not only doable, but they return quickly.
Disadvantages:
Limited in the amount of data it can handle: Because all calculations are performed when the cube is built, it is not possible to include a large amount of data in the cube itself. This is not to say that the data in the cube cannot be derived from a large amount of data. Indeed, this is possible. But in this case, only summary-level information will be included in the cube itself.
Requires additional investment: Cube technology are often proprietary and do not already exist in the organization. Therefore, to adopt MOLAP technology, chances are additional investments in human and capital resources are needed.
ROLAP
This methodology relies on manipulating the data stored in the relational database to give the appearance of traditional OLAP's slicing and dicing functionality. In essence, each action of slicing and dicing is equivalent to adding a "WHERE" clause in the SQL statement.
Advantages:
Can handle large amounts of data: The data size limitation of ROLAP technology is the limitation on data size of the underlying relational database. In other words, ROLAP itself places no limitation on data amount.
Can leverage functionalities inherent in the relational database: Often, relational database already comes with a host of functionalities. ROLAP technologies, since they sit on top of the relational database, can therefore leverage these functionalities.
Disadvantages:
Performance can be slow: Because each ROLAP report is essentially a SQL query (or multiple SQL queries) in the relational database, the query time can be long if the underlying data size is large.
Limited by SQL functionalities: Because ROLAP technology mainly relies on generating SQL statements to query the relational database, and SQL statements do not fit all needs (for example, it is difficult to perform complex calculations using SQL), ROLAP technologies are therefore traditionally limited by what SQL can do. ROLAP vendors have mitigated this risk by building into the tool out-of-the-box complex functions as well as the ability to allow users to define their own functions.
HOLAP
HOLAP technologies attempt to combine the advantages of MOLAP and ROLAP. For summary-type information, HOLAP leverages cube technology for faster performance. When detail information is needed, HOLAP can "drill through" from the cube into the underlying relational data.
OLAP – Online Analytical Processing – Tools
OLAP (online analytical processing) is a function of business intelligence software that enables a user to easily and selectively extract and view data from different points of view. Designed for managers looking to make sense of their information, OLAP tools structure data hierarchically – the way managers think of their enterprises, but also allows business analysts to rotate that data, changing the relationships to get more detailed insight into corporate information.
WebFOCUS OLAP combines all the functionality of query tools, reporting tools, and OLAP into a single powerful solution with one common interface so business analysts can slice and dice the data and see business processes in a new way. WebFOCUS makes data part of an organization's natural culture by giving developers the premier design environments for automated ad hoc and parameter-driven reporting and giving everyone else the ability to receive and retrieve data in any format, performing analysis using whatever device or application is part of the daily working life.
WebFOCUS ad hoc reporting and OLAP features allow users to slice and dice data in an almost unlimited number of ways. Satisfying the broadest range of analytical needs, business intelligence application developers can easily enhance reports with extensive data-analysis functionality so that end users can dynamically interact with the information. WebFOCUS also supports the real-time creation of Excel spreadsheets and Excel PivotTables with full styling, drill-downs, and formula capabilities so that Excel power users can analyze their corporate data in a tool with which they are already familiar.
Business intelligence (BI) tools empower organizations to facilitate improved business decisions. BI tools enable users throughout the extended enterprise not only to access company information but also to report and analyze that critical data in an efficient and intuitive manner. It's is not just about delivering reports from a data warehouse; it's about providing large numbers of people – executives, analysts, customers, partners, and everyone else – secure and simple access to the right information so they can make better decisions. The best BI tools allow employees to enhance their productivity while maintaining a high degree of self-sufficiency.
Related Documents