Data Mining Techniques for DNA Microarray Data Miguel Rocha Isabel Rocha CCTC / CEB Universidade do Minho

Welcome message from author
This document is posted to help you gain knowledge. Please leave a comment to let me know what you think about it! Share it to your friends and learn new things together.
Transcript

Data Mining Techniques for
DNA Microarray Data
Miguel RochaIsabel Rocha
CCTC / CEB Universidade do Minho

PRESENTATION STRUCTURE
TECHNOLOGYDATA PRE-PROCESSING
DATA MININGCLUSTERING
CLASSIFICATIONCONCLUSIONS

TECHNOLOGYDATA PRE-PROCESSING
STATISTICAL TESTSDATA MININGCLUSTERING
CLASSIFICATIONCONCLUSIONS
TECHNOLOGYSCOPE
Transcription analysis is the most mature high-
throughput analytical tool, but we still don’t understand
the full impact of the information.
How can we analyse the transcriptome?

TECHNOLOGYSCOPE
The Saccharomyces cerevisiae genome has
~6,000 genes …
The human genome has
more than 20,000 genes …
What are the functions of
these genes?
How can we measure the
transcription level of allgenes and compare them?
Purified mRNA
DNA
mRNA
protein
Cell
DNA array
TECHNOLOGYDATA PRE-PROCESSING
STATISTICAL TESTSDATA MININGCLUSTERING
CLASSIFICATIONCONCLUSIONS

TECHNOLOGYAPPLICATIONS
• Identification of complex genetic
diseases
• Drug discovery and toxicology
studies
• Mutation detection
• Pathogen analysis
• Differing expression of genes over
time, between tissues, and disease
states
TECHNOLOGYDATA PRE-PROCESSING
STATISTICAL TESTSDATA MININGCLUSTERING
CLASSIFICATIONCONCLUSIONS

TECHNOLOGYOFF-CHIP vs ON-CHIP
Two different Technologies:
Off-chip - pre-synthesized oligonucleotides, with
usually > 100 nucleotides, are spotted or printed
on the surface of the support (usually polylisine
coated glass slides). Can be made in-house. Also
known as cDNA arrays.
On-chip – smaller oligonucleotides (20-80-mer) are
synthesized in situ using several methods like
barrier methods, ink-jet or photolitographic
appraches (example – Affymetrix GeneChips)
These 2 different approaches also imply different
experimental design strategies.
TECHNOLOGYDATA PRE-PROCESSING
STATISTICAL TESTSDATA MININGCLUSTERING
CLASSIFICATIONCONCLUSIONS

TECHNOLOGYOFF-CHIP vs ON-CHIP
Probe (DNA)
Target
Glass/plast
Mutant + reference array
Oligonucleotide arraycDNA array
Mutant array
Reference array
Cy3 = cyanine 3 = greenCy5 = cyanine 5 = red
TECHNOLOGYDATA PRE-PROCESSING
STATISTICAL TESTSDATA MININGCLUSTERING
CLASSIFICATIONCONCLUSIONS

TECHNOLOGYOFF-CHIP vs ON-CHIP
Technology
Long probes generated by PCR
Short probes synthesised
on the support
cDNA arrays oligonucleotide arrays
TECHNOLOGYDATA PRE-PROCESSING
STATISTICAL TESTSDATA MININGCLUSTERING
CLASSIFICATIONCONCLUSIONS

TECHNOLOGYAFFYMETRIX GENE-CHIPS
…TGTGATGGTGCCTTAACCCAGTCTTCCTGACACCGTAGG...
GGAATTGGGTCAGAAGGACTGTGGC
GGAATTGGGTCACAAGGACTGTGGC
Perfect match oligoMismatch oligo
3’5’
mRNA
PMMM
Expression level = average difference = (PM-MM) / (#probe pairs in Avg.)
TECHNOLOGYDATA PRE-PROCESSING
STATISTICAL TESTSDATA MININGCLUSTERING
CLASSIFICATIONCONCLUSIONS

DATA PRE-PROCESSINGMISSING VALUES & BACKGROUND CORRECTION
Missing values treatment:Do nothingSubstitute missing values with mean / mode /
median / specified valueUse imputation by k-nearest neighbours
Background correction:expression level = spot intensity – background
intensityPotential problems: spot intensities lower or
equal than the local background
TECHNOLOGYDATA PRE-PROCESSING
STATISTICAL TESTSDATA MININGCLUSTERING
CLASSIFICATIONCONCLUSIONS

Fold change = Expression level experiment / Expression level control
Problem:
log 2
Fold
chan
ge
Fold change0
1
-15 10
-0.5
0.5
0
0 1
Sample < Ref. Sample > Ref.
A common approach is to log-transform data
DATA PRE-PROCESSINGLOG TRANSFORM
TECHNOLOGYDATA PRE-PROCESSING
STATISTICAL TESTSDATA MININGCLUSTERING
CLASSIFICATIONCONCLUSIONS

DATA PRE-PROCESSINGFLAT PATTERN FILTERING
Why to remove flat patterns:We cannot distinguish signal from noise in such
genesFlat patterns correlate well with nearly anything
What is “flat”?- Definition based on the number of peaks- Based on a measure of variation (e.g.
standard deviation)
TECHNOLOGYDATA PRE-PROCESSING
STATISTICAL TESTSDATA MININGCLUSTERING
CLASSIFICATIONCONCLUSIONS
Option:Only filter genes with values
near 0 in all experiments -
use root mean square

DATA PRE-PROCESSINGPATTERN STANDARDIZATION
It is common to re-scale the values in
order to achieve values with an average of 0 and a std deviation of 1
This normalization will help in the task of
clustering !!
How ?Subtracting the average value of the
gene expression to each individual
value and dividing the result by the standard deviation
TECHNOLOGYDATA PRE-PROCESSING
STATISTICAL TESTSDATA MININGCLUSTERING
CLASSIFICATIONCONCLUSIONS

STATISTICAL TESTSDIFFERENTIAL EXPRESSION
In terms of biological research it is very
important to identify the set of genes that have different levels of expressioncomparing two experimental conditions (e.g. healthy cell vs cancer cell, wild type
vs mutant).
The identification of genes that are
differentially expressed relies on Statistical tests of hypothesis, based on
the assumption that the values of gene expression are “generated” following a
normal distribution.
TECHNOLOGYDATA PRE-PROCESSING
STATISTICAL TESTSDATA MININGCLUSTERING
CLASSIFICATIONCONCLUSIONS

STATISTICAL TESTST TEST
0 2 4 6 8 100
0.1
0.2
0.3
0.4
0.5
0.6
0.7
0.8
Transcription level
Fre
quency
ExperimentControl
Hypothesis: Is the average transcription level of Experiment and Control identical?
TECHNOLOGYDATA PRE-PROCESSING
STATISTICAL TESTSDATA MININGCLUSTERING
CLASSIFICATIONCONCLUSIONS

STATISTICAL TESTST TEST
0.82710.9911.5910.7111.1011.1410.93N
0.7337.738.088.778.238.268.32N-1
0.4235.736.306.056.056.056.05N-2
........................
0.00512.0511.9912.0311.6611.7011.703
0.0049.569.799.849.208.938.822
0.0039.209.399.298.378.458.411
P-valueExp
3
Exp
2
Exp
1
Control
3
Control
2
Control
1Gene
An example with low and high P-values
What happens when we are testing many times?
TECHNOLOGYDATA PRE-PROCESSING
STATISTICAL TESTSDATA MININGCLUSTERING
CLASSIFICATIONCONCLUSIONS

STATISTICAL TESTST TEST – CORRECTION FOR MULTIPLE TESTING
P is the probability of making an error
when testing once…
When testing R times the probability of making an error increases to
Perror(R) = 1 – (1 – P)R ≈ RP
Bonferroni suggested Pcorr = P/R as a
better cutoff-value to compensate for
multiple-testing
TECHNOLOGYDATA PRE-PROCESSING
STATISTICAL TESTSDATA MININGCLUSTERING
CLASSIFICATIONCONCLUSIONS

STATISTICAL TESTSOTHER STATISTICAL TOOLS
A number of Statistical techniques can be
applied for more elaborate analysis:
- One way analysis of variance (ANOVA)
Analyse the mean and variance of gene expression across groups of conditions
- Two factor ANOVA (TFA)
Used to find genes whose expression is significantly different over two factors
- Significance analysis of microarrays
Used to pick out significant genes based on
differential expression between sets of samples
(one class, two class, multiclass)
TECHNOLOGYDATA PRE-PROCESSING
STATISTICAL TESTSDATA MININGCLUSTERING
CLASSIFICATIONCONCLUSIONS

Optimization
ComputerScience
MachineLearning
DATA MININGDEFINITION
What is Data Mining ?The analysis of datasets, typically of huge dimensions,
aiming to discover previously and potentially interesting
unknown relationships in a way understandable to the
user.
Statistics
Databases
Data Mining
TECHNOLOGYDATA PRE-PROCESSING
STATISTICAL TESTSDATA MININGCLUSTERING
CLASSIFICATIONCONCLUSIONS

DATA MININGTASKS
Tasks of Data Mining:
Exploring the data – typically visualization tools
Clustering – Unsupervised learning
The aim is to group the data into clusters, finding
sets of related itens
Association rule induction
The aim is to find IF ..THEN ... Rules that apply to a
significant subset of records
Prediction – Supervised learning
Classification, regression, time series analysis
All these tasks have applications in Microarray Data Analysis !!
TECHNOLOGYDATA PRE-PROCESSING
STATISTICAL TESTSDATA MININGCLUSTERING
CLASSIFICATIONCONCLUSIONS

CLUSTERINGINTRODUCTION
PS X1 X2 X3
EEEE1111
EEEE2222
EEEE3333
EEEE4444
Metabolic pathway
Motivation: co-regulated genes show a “similar“ behaviour
“Guilt by association” → if unknown gene i is similar in
expression to known gene j, maybe they are involved
in the same/related pathway
AimTo find sets of genes that are co-expressed over a set of conditions (experiments) – UNSUPERVISED LEARNING
Assumption (biological)Similarity in gene expression implies some form ofregulatory or functional similarity
TECHNOLOGYDATA PRE-PROCESSING
STATISTICAL TESTSDATA MININGCLUSTERING
CLASSIFICATIONCONCLUSIONS
CLUSTERINGINTRODUCTION
x1
x2
x3
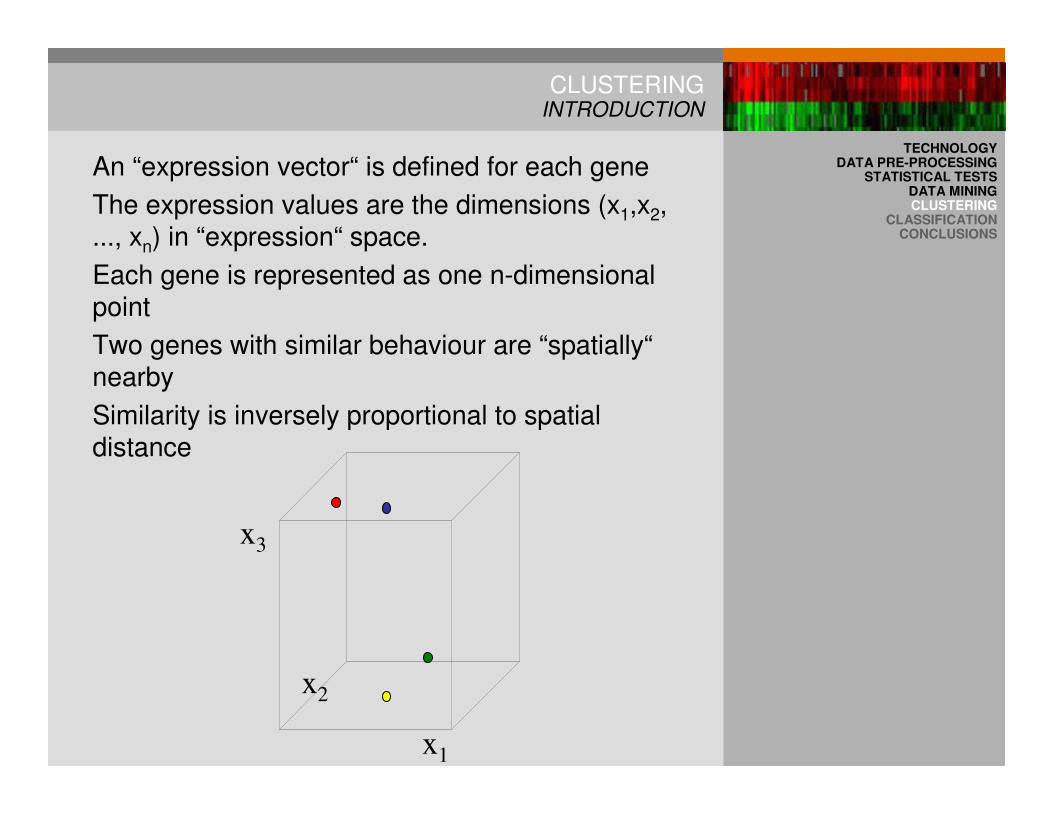
An “expression vector“ is defined for each gene
The expression values are the dimensions (x1,x2, ..., xn) in “expression“ space.
Each gene is represented as one n-dimensional point
Two genes with similar behaviour are “spatially“nearby
Similarity is inversely proportional to spatial distance
TECHNOLOGYDATA PRE-PROCESSING
STATISTICAL TESTSDATA MININGCLUSTERING
CLASSIFICATIONCONCLUSIONS

CLUSTERINGINTRODUCTION
x1
x2
x3
Neighbours
How similar are the red and the blue spheres?
But, what is similarity?There exists no a priori definition of similarity
Different similarity measures can be used
Different patterns are “observed“ with different similarity
measures
TECHNOLOGYDATA PRE-PROCESSING
STATISTICAL TESTSDATA MININGCLUSTERING
CLASSIFICATIONCONCLUSIONS

CLUSTERINGDISTANCE METRICS
Manhattan distance
Euclidean distance
Pearson‘s correlation coefficient
It is the dot product of two normalized vectors, or the cosine between two vectors. It measures the similarity in the shapes of two profiles, while not taking the magnitude of the profiles into account and therefore suits well the biological intuition of coexpression.
||...||||),(2211 pp j
xi
xj
xi
xj
xi
xjid −++−+−=
)||...|||(|),(22
22
2
11 pp jx
ix
jx
ix
jx
ixjid −++−+−=
Comparing distance
Comparing
shape
TECHNOLOGYDATA PRE-PROCESSING
STATISTICAL TESTSDATA MININGCLUSTERING
CLASSIFICATIONCONCLUSIONS

CLUSTERINGTHE PROBLEM
Optimization problemTo find a set of clusters that accomplish the following aims:
- Homogeneity
Elements within a cluster should be “near”, i.e., should have small intra-cluster distances
- Separation
Elements of distinct clusters should be “far”, i.e., should have large inter-cluster distances
Since these aims are sometimes contradictory
the problem is quite difficult to handle !!
inter intra
TECHNOLOGYDATA PRE-PROCESSING
STATISTICAL TESTSDATA MININGCLUSTERING
CLASSIFICATIONCONCLUSIONS

CLUSTERINGTHE PROBLEM
Clustering experiments
The aim of clustering can also be to cluster experiments, i.e., to find sets of
experiments where the expression of the
genes is similar
In this case, we have for each experiment a vector with the values of expressions for the
whole set of genes
The algorithms are the same altough the
dimensions are different imposing distinct
problems to the algorithms
TECHNOLOGYDATA PRE-PROCESSING
STATISTICAL TESTSDATA MININGCLUSTERING
CLASSIFICATIONCONCLUSIONS

CLUSTERINGALGORITHMS
Classes of algorithms
- Hierarchical clustering
- K-means
- Self-organizing maps and Self-
organizing trees
- Evolutionary/ memetic algorithms
- Quality-based algorithms
- Biclustering
- ...
TECHNOLOGYDATA PRE-PROCESSING
STATISTICAL TESTSDATA MININGCLUSTERING
CLASSIFICATIONCONCLUSIONS

CLUSTERINGHIERARCHICAL CLUSTERING
- Almost a de facto standard, enjoys an
enormous popularity
- The same concepts are applied in the
construction of phylogenetic trees
The basic idea – agglomerative HC
Start with a cluster for each gene
In each step, the pair of clusters with the
minimum difference is merged
The process proceeds until a single
cluster is obtained
The final clusters are obtained by cutting
the tree at a certain level
TECHNOLOGYDATA PRE-PROCESSING
STATISTICAL TESTSDATA MININGCLUSTERING
CLASSIFICATIONCONCLUSIONS

CLUSTERINGHIERARCHICAL CLUSTERING
Venn diagram
One alternative is divisive hierachicalclustering:
- Start with a single cluster
- Divide one cluster and create two new
clusters until every cluster has a single gene.
TECHNOLOGYDATA PRE-PROCESSING
STATISTICAL TESTSDATA MININGCLUSTERING
CLASSIFICATIONCONCLUSIONS

CLUSTERINGHIERARCHICAL CLUSTERING
Distance measure between two clusters
- Single linkage (nearest neighbour)
Given by the distance between the two
closest points
- Complete linkage
Given by the distance between the two
furthest points
- Average linkage
Average distance between the points in the cluster
TECHNOLOGYDATA PRE-PROCESSING
STATISTICAL TESTSDATA MININGCLUSTERING
CLASSIFICATIONCONCLUSIONS

CLUSTERINGHIERARCHICAL CLUSTERING
Nearest neighbour, level 2, k = 7 clusters
Nearest neighbour, level 3, k = 6 clusters
TECHNOLOGYDATA PRE-PROCESSING
STATISTICAL TESTSDATA MININGCLUSTERING
CLASSIFICATIONCONCLUSIONS

CLUSTERINGHIERARCHICAL CLUSTERING
Nearest neighbour, level 4, k = 5 clusters
The height of the “U” indicates
the distances between two
clusters
TECHNOLOGYDATA PRE-PROCESSING
STATISTICAL TESTSDATA MININGCLUSTERING
CLASSIFICATIONCONCLUSIONS

CLUSTERINGHIERARCHICAL CLUSTERING
Nearest neighbour, level 5, k = 4 clusters
The centre of mass distance of X4 and X5 is close to the centre of mass distance for the new cluster with 4 members.
TECHNOLOGYDATA PRE-PROCESSING
STATISTICAL TESTSDATA MININGCLUSTERING
CLASSIFICATIONCONCLUSIONS

CLUSTERINGHIERARCHICAL CLUSTERING
Nearest neighbour, level 6, k = 3 clusters
Nearest neighbour, level 7, k = 2 clusters
TECHNOLOGYDATA PRE-PROCESSING
STATISTICAL TESTSDATA MININGCLUSTERING
CLASSIFICATIONCONCLUSIONS

CLUSTERINGHIERARCHICAL CLUSTERING
Nearest neighbour, level 8, k = 1 clusterTECHNOLOGY
DATA PRE-PROCESSINGSTATISTICAL TESTS
DATA MININGCLUSTERING
CLASSIFICATIONCONCLUSIONS

CLUSTERINGHIERARCHICAL CLUSTERING
Spindle pole body
assembly
The proteasome
mRNA Splicing
Glycolysis
The mitochondrial
ribosome
ATP synthesis
Chromatin structure
The ribosome and
translationDNA replication
TCA cycle & respiration
An example: 8 experiments
10 clusters
TECHNOLOGYDATA PRE-PROCESSING
STATISTICAL TESTSDATA MININGCLUSTERING
CLASSIFICATIONCONCLUSIONS

CLUSTERINGK-MEANS
K-means doesn’t stand for an algorithm
but it is a formulation of the problem:
The microarray clustering task is
formulated as a minimum sum-of-
squares clustering problem, where the
purpose is to minimize the average of the square of the distance between each
point an the centroid of the cluster it is assigned to.
The simplest algorithm to solve this problem is the Lloyd algorithm.
TECHNOLOGYDATA PRE-PROCESSING
STATISTICAL TESTSDATA MININGCLUSTERING
CLASSIFICATIONCONCLUSIONS

CLUSTERINGK-MEANS
Lloyd Algorithm:
K – the number of clusters is given
1. Initially, K centroids for the clusters are randomly generated within a given range
2. The genes are assigned to the cluster with the nearest centroid
3. If there has been no changes in 2 the process is finished. Else the centroids of each cluster are re-calculated as the average of the assigned genes and return to 2.
When the process stabilizes the result can be regarded as a membership function for each cluster.
TECHNOLOGYDATA PRE-PROCESSING
STATISTICAL TESTSDATA MININGCLUSTERING
CLASSIFICATIONCONCLUSIONS

CLUSTERINGK-MEANS
- One of the most popular clustering algorithms
- A partitioning method
- It has been around for a while
Has many variations
Has been given many different names (reinvented)
- Simple to understand and implement
- Since it is a local optimization method, it is prone to reach local minima. One solution is to run it a number of times and choose the best overall result.
TECHNOLOGYDATA PRE-PROCESSING
STATISTICAL TESTSDATA MININGCLUSTERING
CLASSIFICATIONCONCLUSIONS

CLUSTERINGK-MEANS
X1
X2
X3
X4
X5
X6
X7
X8
X9
X10
X11
X12
X13
X14
X15
X16
X17
X18
X19
X20
X21
k1
k2
k3
k4
Initialization
Clustering in 2 dimensions
Initial position of cluster centres is random.
Calculate the mean of each cluster
TECHNOLOGYDATA PRE-PROCESSING
STATISTICAL TESTSDATA MININGCLUSTERING
CLASSIFICATIONCONCLUSIONS

CLUSTERINGK-MEANS
Step 1
X1
X2
X3
X4
X5
X6
X7
X8
X9
X10
X11
X12
X13
X14
X15
X16
X17
X18
X19
X20
X21
k1
k2
k3
k4
Reassign each record to one of the K
means
TECHNOLOGYDATA PRE-PROCESSING
STATISTICAL TESTSDATA MININGCLUSTERING
CLASSIFICATIONCONCLUSIONS

CLUSTERINGK-MEANS
Step 2
X1
X2
X3
X4
X5
X6
X7
X8
X9
X10
X11
X12
X13
X14
X15
X16
X17
X18
X19
X20
X21
k1
k2
k3
k4
Cluster centres are shifted to the centre of data points assigned to this cluster centre.
TECHNOLOGYDATA PRE-PROCESSING
STATISTICAL TESTSDATA MININGCLUSTERING
CLASSIFICATIONCONCLUSIONS

CLUSTERINGK-MEANS
Step 3
X1
X2
X3
X4
X5
X6
X7
X8
X9
X10
X11
X12
X13
X14
X15
X16
X17
X18
X19
X20
X21
k1
k2
k3
k4
Cluster centres are shifted to the centre of data points
assigned to this cluster centre.
Iteration of step 1 to 3 until cluster centres are not shifted anymore. Algorithm terminates!
TECHNOLOGYDATA PRE-PROCESSING
STATISTICAL TESTSDATA MININGCLUSTERING
CLASSIFICATIONCONCLUSIONS

CLUSTERINGK-MEANS
How to set K?Very important parameter
Too large: One cluster per recordToo small: One cluster for all records
There is a “natural” number of clusters in the data
Many different ways of setting KCan try a few and seeCan start with a few clusters and split the
large onesCan start with many and merge the small
ones
K-means cannot deal with overlapping clustersNo degree of membership
Problem with outliersCan be dealt with in preprocessing
TECHNOLOGYDATA PRE-PROCESSING
STATISTICAL TESTSDATA MININGCLUSTERING
CLASSIFICATIONCONCLUSIONS

CLUSTERINGSOMs
A Self-organizing map (SOM) is a model that allows the mapping and visualization of high-dimensional input data (the genes in this case) into an output map of neurons.
The outputs are organized in a two-dimensional grid of neurons.
Each output neuron is represented by a prototype vector.
A process of training involves the changing of the prototype vectors according to: -They are initially random- At each step, each input vector is associated with an output node- The prototypes are updated to get nearer the sum of the inputs it is associated to and away from the others
TECHNOLOGYDATA PRE-PROCESSING
STATISTICAL TESTSDATA MININGCLUSTERING
CLASSIFICATIONCONCLUSIONS

CLUSTERINGEVOLUTIONARY ALGORITHMS
Evolutionary Algorithms (EAs) are a family of
optimization methods inspired on the ideas of Darwin‘s
evolution of species.
They make a robust class of optimization meta- heuristics
with applications in a number of fields
An EA has a population of evolving individuals, each
encoding a solution for the target problem
Each individual can be evaluated by applying a fitness
function to the solution encoded
New solutions are created by the application of
reproduction operators to existing individuals – typically
crossover and mutation
Stocastic selection, favouring high fitness individuals, is
used to select the individuals to be parents
TECHNOLOGYDATA PRE-PROCESSING
STATISTICAL TESTSDATA MININGCLUSTERING
CLASSIFICATIONCONCLUSIONS
CLUSTERINGEVOLUTIONARY ALGORITHMS
EAs have been applied in clustering by considering the formulation of the k-means approach, i.e., the fitness function is the sum-of-squares of distances from the points to the cluster centroids.
Typically, EA individuals encode a set of coordinates for the centroid of the clusters.
Real-valued encoding schemes are used, as well as appropriate crossover and mutation operators
The combination of EAs with local search optimization methods – Memetic Algorithms – has also been proposed. In this case the local opt. method is the Lloyd algorithm (k-means).
TECHNOLOGYDATA PRE-PROCESSING
STATISTICAL TESTSDATA MININGCLUSTERING
CLASSIFICATIONCONCLUSIONS

CLUSTERINGOTHER APPROACHES
Self-organizing trees (SOTs) combine SOMs with ideas from divisive hierarchical clustering. The output nodes are organized in binary trees and their number os not fixed.
Quality-based clustering – a number of greedy algorithms that try to find a number of clusters with a guranteed quality, i.e. the members of the cluster are co-expressed.
Bi-clustering algorithms – the aim is to simultaneously group experiments and genes.
TECHNOLOGYDATA PRE-PROCESSING
STATISTICAL TESTSDATA MININGCLUSTERING
CLASSIFICATIONCONCLUSIONS

CLUSTERINGINTERPRETATION OF THE RESULTS
Often, the result of microarray data analysis is a list of genes.
• The list has to be summarized with respect to its biological
meaning. For this, information about the genes and the related
proteins has to be gathered.
PRIMARY DATABASES
Some information about genes and the encoded proteins is
available already from sequence (primary) databases, e.g.
GenBank. Database accession number, nucleotide and protein
sequences, database cross references, and a sequence name
that may or may not give a hint to the function.
CURATED DATABASES
In contrast, some databases are curated. That means that
biologists will get the information first and compare them with
literature before it goes into the database. Thus, the database
is of high quality, but it takes some time until a newly
discovered sequence is entered. Because information is only
entered by curators, annotation can be unified.
A very famous curated database is SWISSPROT/UniProtKB
(http://www.expasy.ch).
There are other organism specific curated databases like
ecocyc (www.ecocy.org)
TECHNOLOGYDATA PRE-PROCESSING
STATISTICAL TESTSDATA MININGCLUSTERING
CLASSIFICATIONCONCLUSIONS

CLUSTERINGANNOTATION SYSTEMS
To overcome some of the problems, an annotation
system has been created: Gene Ontology
(http://www.geneontology.org).
Ontology means here the art (or science) of giving
everything its correct name.
• It represents a unified, consistent system, i.e. terms
occur only once, and there is a dictionary of allowed
words.
• Furthermore, terms are related to each other: the
hierarchy goes from very general terms to very detailed
ones.
Gene Ontology by itself is only a system for annotating
genes and proteins. It does not relate database entries
to a special annotation value.
• Luckily, research communities for several model
organisms have agreed on entering Gene Ontology
information into the databases. As this is done ‘by
hand’, GO annotation for most organisms is far from
complete.
TECHNOLOGYDATA PRE-PROCESSING
STATISTICAL TESTSDATA MININGCLUSTERING
CLASSIFICATIONCONCLUSIONS

CLUSTERINGINTERPRETATION OF THE RESULTS
Bioconductor metadata packages
Runs in R
These packages contain one-to-one and one-to-many
mappings for frequently used chips, especially
Affymetrix arrays.
• Information available includes gene names, gene
symbol, database accession numbers, Gene Ontology
function description, enzmye classification number (EC),
relations to PubMed abstracts, and others.
Other Tools (Mapping of Gene Expression data in Pathways)
• Some systems collect pathway maps from users.
However, most pathway information is still on metabolic
pathways (see KEGG for this).
• For other pathway information, see www.biocarta.com
and www.stke.org (requires registration). For software,
see e.g. GeneMAPP (www.genmapp.org) or GoMiner
(http://discover.nci.nih.gov/gominer).
TECHNOLOGYDATA PRE-PROCESSING
STATISTICAL TESTSDATA MININGCLUSTERING
CLASSIFICATIONCONCLUSIONS

CLASSIFICATIONINTRODUCTION
In classification, a number of examples where
the class is known (thus Supervised Learning) is given – training examples
Datasets are usually given by tables where
the rows are the examples and the columns
are the features of each examples.
(…)
YESweaklow24sunny
YESweaklow20overcast
NOstronghigh12rainy
NOweaklow32sunny
PLAYwindhumidítytemper.outlook
TECHNOLOGYDATA PRE-PROCESSING
STATISTICAL TESTSDATA MININGCLUSTERING
CLASSIFICATIONCONCLUSIONS

CLASSIFICATIONINTRODUCTION
An algorithm is used to build a model (e.g decision tree, set of rules, ...) given the
training examples
The model generalizes the training
examples
The model built is capable of predicting the class for new examples (where the
class is unknown)
A good algorithm should choose an
accurate model but avoid overfitting the training cases
TECHNOLOGYDATA PRE-PROCESSING
STATISTICAL TESTSDATA MININGCLUSTERING
CLASSIFICATIONCONCLUSIONS

CLASSIFICATIONINTRODUCTION
Main use of classification in microarrays:
To classify experiments in one of a finite
set of alternatives (e.g. healthy, cancer type A or B,, …) given the values if the
expression for the genes in that condition.
- Examples are the experiments/ conditions
- Attributes are the values of the
expression for each gene
Or, to classify genes in functional groups;
the role of experiments and genes are switched.
TECHNOLOGYDATA PRE-PROCESSING
STATISTICAL TESTSDATA MININGCLUSTERING
CLASSIFICATIONCONCLUSIONS

CLASSIFICATIONINTRODUCTION
Alternative models for classification:
- Decision trees
- Classification rules- Neural Networks
- Support Vector Machines
- Instance-based learning- Bayesian models
- ...
Each of these paradigms imposes a given
structure. The details / parameters of the model have to be determined, typically
using optimization methods.
TECHNOLOGYDATA PRE-PROCESSING
STATISTICAL TESTSDATA MININGCLUSTERING
CLASSIFICATIONCONCLUSIONS

CLASSIFICATIONDECISION TREES
- In decision trees, models are n-ary trees, where nodes test the values of attributes and leafs keep the value of the class.
- Process of classifying a new example is recursive, going down the tree and testing the value of the attribute in each node, and following the approprite branch until a leaf is reached.
Outlook
Humidity
sunny
overcast
Yes
Wind
NoYes No Yes
high normal strong weak
rainy
TECHNOLOGYDATA PRE-PROCESSING
STATISTICAL TESTSDATA MININGCLUSTERING
CLASSIFICATIONCONCLUSIONS

CLASSIFICATIONDECISION TREES
- Process of building a decision treeinvolves choosing the attributes to test at
each level.
- The process is recursive following a top-
down approach: starts with all the training
examples and finds the best attribute to test –
the one that best differentiates the examples
in terms of the class (ideas from information theory).
- The process is recursive and it is repeated
for each branch, considering only the
examples that follow that path.
- Most popular algorithms: ID3 and C4.5
TECHNOLOGYDATA PRE-PROCESSING
STATISTICAL TESTSDATA MININGCLUSTERING
CLASSIFICATIONCONCLUSIONS

CLASSIFICATIONNEURAL NETWORKS
Artificial Neural Networks are models that mimic the
information processing in the nervous central system:
natural neurons
Able to define nonlinear mappings between a number of
input and output variables; quite robust when facing noisy
data; used in regression and classification
Most common - Multilayer Perceptrons (MLPs)
TECHNOLOGYDATA PRE-PROCESSING
STATISTICAL TESTSDATA MININGCLUSTERING
CLASSIFICATIONCONCLUSIONS
(……) (……) (……)
INPUTS:(e.g. values
of
gene
expression)
OUTPUTS:one for each class
(define probability for
membership)

CLASSIFICATIONNEURAL NETWORKS
MLPs “learn“ by setting the weights of the
connections in the networks, using numerical
optimization methods in order to minimize an
error function (e.g. Backpropagation)
The topology of the MLP defines its complexity;
more nodes/ weights imply more complex
networks
The hardest problem in using MLPs is
overfitting the training data; the best way to
avoid this problem is to keep the model as
simple as possible !!
TECHNOLOGYDATA PRE-PROCESSING
STATISTICAL TESTSDATA MININGCLUSTERING
CLASSIFICATIONCONCLUSIONS

CLASSIFICATIONSUPPORT VECTOR MACHINES
Support Vector Machines (SVMs) rely on hyperplanes that separate the training examples in a “feature space” of a higher dimensionality.
They make an efficient alternative, very resilient to overfitting the training data since they choose the maximum separation hyperplane
They are quite efficient in training when compared to MLPs; they work fairly well with a large number of attributes
The definition of the kernel functions makes them flexible to define distance functions
They have been applied in microarray classification in work of several researchers
Can also be applied in regression
TECHNOLOGYDATA PRE-PROCESSING
STATISTICAL TESTSDATA MININGCLUSTERING
CLASSIFICATIONCONCLUSIONS

CLASSIFICATIONCOMPARING CLASSIFIERS
A model is built using a set of training examples – it is obvious that we cannot use that set of examples to evaluate its performance / compare different models
Two solutions:- Split the original data into two sets: training and test set; the first is used to build the model, the second is used to evaluate it. It has the disadvantage of “wasting“ data
- Cross validationTo divide the original set into K folds; for each fold i create a model with the training data being all examples not in fold i and evaluate the model with examples from fold i; average the results for the K folds.Slower but more reliable; uses all data available
TECHNOLOGYDATA PRE-PROCESSING
STATISTICAL TESTSDATA MININGCLUSTERING
CLASSIFICATIONCONCLUSIONS

CLASSIFICATIONAN EXAMPLE
Paper by Brown et al (2000) , PNAS
- Dataset: S. cerevisiae, nearly 2500 genes, 79
experiments- Aim: classify genes in 6 functional classes
- Models used: Decision trees, SVMs, linear
discriminants
- Each model: 79 attributes; 2500 examples
- Used training/ test set split to evaluate the models.
- Results: SVMs outperformed all other
methods
TECHNOLOGYDATA PRE-PROCESSING
STATISTICAL TESTSDATA MININGCLUSTERING
CLASSIFICATIONCONCLUSIONS

CLASSIFICATIONFEATURE SELECTION
The most important obstacle to using DM
classification techniques when working with
microarray data is the dimensionality, i.e. the
huge number of attributes
Typically the classification algorithms presented
before work well with tens of attributes, but tend
to degrade their performance with hundreds or
thousands, specially when the number of examples is quite smaller
Feature selection techniques are designed to
reduce the number of attributes in the model,
before the data is presented to the learning algorithm.
TECHNOLOGYDATA PRE-PROCESSING
STATISTICAL TESTSDATA MININGCLUSTERING
CLASSIFICATIONCONCLUSIONS

CLASSIFICATIONFEATURE SELECTION
There are two major classes of feature selection techniques:
Filter methodsThese are general methods that are based in the general
features of the data, being independent of the algorithm
used in the learning step.
In the case of MAs these are in general useful to perform a
first reduction of the number of genes (typically to a few
hundred). Sometimes a ranking can be created.
Wrapper methodsThese FS methods are embedded into the learning
algorithm.
These are used in MAs to further reduce the number of
genes to a few tens, in combination with learning
algorithms (such as SVMs)
Typically, they involve an optimization method being the
cost function given by the accuracy and the number of
genes
TECHNOLOGYDATA PRE-PROCESSING
STATISTICAL TESTSDATA MININGCLUSTERING
CLASSIFICATIONCONCLUSIONS

CLASSIFICATIONFEATURE SELECTION – AN EXAMPLE
Deutsch (2003), Bioinformatics
- Datasets: Leukemia dataset (Golub,1999) - >7000 genes
and 72 samples, small round blue cell tumors (Khan,2001) -
2300 genes and 80 samples
- In both cases, the purpose is to classify experiments,
labeling each with the type of cancer
-Aim of this work: to develop a FS algorithm to reduce the
number of genes needed to reach a diagnosis
- Classification algorithm: the simplest, 1 nearest neighbour;
-Filter methods: preprocess the data removing unimportant
genes; ranks the genes
- Wrapper method: Evolutionary Algorithm encoding which
genes will be in the classifier; fitness function takes accuracy
of classification into account
TECHNOLOGYDATA PRE-PROCESSING
STATISTICAL TESTSDATA MININGCLUSTERING
CLASSIFICATIONCONCLUSIONS

CONCLUSIONS
DNA microarraysMicroarrays measure the concentration of mRNA There is a long way from cell harvest to measuring the transcription level – and the data can be noisyProper pre-processing is important
Analysis of microarraysSeveral assumptions are made in the progress of analysis
Data analysis can be conducted in different ways:
Hypothesis testing (t-test), Cluster analysis,
Classification
Data analysis should be integrated with existing knowledge from literature and databases
TECHNOLOGYDATA PRE-PROCESSING
STATISTICAL TESTSDATA MININGCLUSTERING
CLASSIFICATIONCONCLUSIONS

CONCLUSIONS
DNA microarrays are a useful tool in Functional Genomics, given proper methods for data analysis
Data Mining techniques can provide a very rich set of solutions in the analysis of microarray data
The methods presented in this session are only an appetizer … there are lots of nice papers out there to read ☺
TECHNOLOGYDATA PRE-PROCESSING
STATISTICAL TESTSDATA MININGCLUSTERING
CLASSIFICATIONCONCLUSIONS
Related Documents


