Data, Methods, and Tips for Health Workforce Supply and Demand Modeling May 14, 2014 By Tim Dall

Welcome message from author
This document is posted to help you gain knowledge. Please leave a comment to let me know what you think about it! Share it to your friends and learn new things together.
Transcript

Data, Methods, and Tips for Health Workforce Supply and Demand Modeling
May 14, 2014By Tim Dall

Goals
• To describe alternative approaches to health workforce supply and demand modeling at the national, state, and local levels
• To discuss data sources
• To share tips and best practices to help ensure study success
2
Agenda
• Terms and definitions
• Demand modeling−Evolution of health workforce modeling−Advantages and disadvantages of alternative approaches−Data and methods
• Supply modeling−Evolution of health workforce modeling−Advantages and disadvantages of alternative approaches−Data and methods
• Tips for improving workforce study success
3

Terms and Definitions
• Health care services−Demand: amount of services that people are willing to use at
different price points−Utilization: actual use (usually analyzed in the form of medical
claims)−Need: an informed opinion on the level of services that would be
appropriate
• Workforce “requirements”−Demand: number and mix of health workers to meet demand for
services−Need: an informed opinion on the number and mix of health
workers to meet the need for services• Minimum need• Best practices
4

Terms and Definitions, cont.
• Supply− Licensed: health workers eligible to work−Active: health workers employed or seeking employment in an
area that requires their clinical skills or knowledge− Full time equivalent (FTE): “standardized” measure of active
supply taking into account part time workers• Example 1: Full time = 1 FTE; part time = ½ FTE• Example 2: FTE = average patient care hours worked among providers
working at least 30 hours per week
• Adequacy of supply−Shortfall: Demand exceeds supply−Surplus (excess supply): Supply exceeds demand−Equilibrium: Supply equals demand (± X%)
5

Terms and Definitions, cont.
• Models“A model is a mathematical framework representing some aspects of reality at a sufficient level of detail to inform a clinical or policy decision” 1
1 Roberts M, Russell LB, Paltiel AD, Chambers M, McEwan P, Krahn M. Conceptualizing a model: a report of the ISPOR-SMDM Modeling Good Research Practices Task Force--2. Value Health 2012; 15(6):804-811
6
Demand Modeling
• Drivers of demand for services and providers
• Modeling approaches
• Data and model inputs
7

Drivers of Demand for Health Care Services
• Epidemiological factors (need, or perceived need)−Correlated with demographics (particularly age)−Correlated with other health risk factors (e.g., disease presence)
• Price and socioeconomic factors (ability/willingness to pay)− If a person has medical insurance, the correlation between use of
health care services and household income largely disappears
• Health care system characteristics and economic considerations−Reimbursement/ what services are covered, value-based pricing− Provider-induced demand−Defensive medicine
• Technology (treatment possibilities)
• Societal norms and expectations
8

Drivers of Demand for Health Care Providers
• Demand for services−Mix of services by condition and care delivery setting−Complexity of services
• Provider characteristics−Scope of practice−Cost or relative value (e.g., physician assistant vs physician)
9

Models Differ in Approach, Complexity, and Value
10
Provider-to-population
ratios(benchmarking)
Correlation analysis
(econometric)
Macrosimulation(population
based)
Microsimulation(person based)
Provider-to-population ratios,
benchmarking
Expert PanelsNeed/demand
hybridSimulation
Demand Models
Needs-based Models
Exam
ples Weiner, HMO
Model (1994)Cooper, Trend Model (2002)
HRSA Models 1990s-2012
HRSA Models 2013+IHS ModelsSHEPS Models
Exam
ples
GMENAC(1970s) Application of HRSA, IHS, SHEPS models
HRSA HPSA designations

FTE Practitioner Use per 100,000 Population, by Age Group (based on utilization patterns)
11
15 1124 29 40
53 65
2118
27
54
44
66
54
34
1912
16
38
131
11
1422
54
0
50
100
150
200
250
0 to 5 6 to 17 18 to 20 21 to 44 45 to 64 65 to 74 75+
Age Group
FTE
Prov
ider
s
General & Family Practice General Internal Medicine GeriatricsPediatrics Physician Assistants Nurse Practitioners
HRSA (2013): Projecting the Supply and Demand for Primary Care Practitioners Through 2020http://bhpr.hrsa.gov/healthworkforce/supplydemand/usworkforce/primarycare/projectingprimarycare.pdf

Demand for FTE Primary Care Providers/10K Population
• Non-Hispanic, black, female, age 75+, insured, with diabetes, with hypertension, obese: 26 FTE/10,000 population
• Non-Hispanic, black, female, age 75+, insured, no diabetes, no hypertension, normal weight: 8.6 FTE/10,000 population
• Non-Hispanic, black, male, age 18-34, insured, with diabetes, with hypertension, obese: 5.9 FTE/10,000 population
• Non-Hispanic, black, female, age 18-34, insured, no diabetes, no hypertension, normal weight: 2.4 FTE/10,000 population
12

Cooper’s Economic Trend Model
− Healthcare system too complex to model, so identify few key drivers of demand
− Our demand is limited primarily by our ability to pay for services
− “The major trend affecting demand for physician services is the economy.” (income elasticity = 0.75)
− “Population growth is a second major factor that affects demand for physicians.”
• Cooper et al., 2002. Economic and Demographic Trends Signal an Impending Physician Shortage. Health Affairs. 21(1):140-154.
13

Tim’s Apple Trend Model
• Key findings−A major trend affecting
demand for physician services is apple consumption
−Consumption of 118,000 apples reduces physician demand by 1
−National per capita consumption of an apple/day reduces physician demand to zero
• Key implication− “An apple a day keeps
the doctor away”
Source: Analysis of per capita apple consumption: 1970 - 2004
y = -2.557x + 284.23
0
50
100
150
200
250
300
350
15 16 17 18 19 20 21 22
Annual Apple Consumption per Capita (lbs)
Phys
icia
ns p
er 1
00,0
00 P
opul
atio
n
14

Limitations of Historical Approaches to Modeling Demand
• Population averages (provider-to-pop ratios) inflexible for modeling− Geographic variation in health risk factors other than demographics− Paradigm shifts in care delivery− Policy changes such as Health Care Reform
• Few demand drivers (demographics, income, insurance, HMOs)
• Reliance on key assumptions (e.g., economic growth, HMO growth)
• Expert panel limitations− Convolution of “need” versus “demand”− Bias: e.g., physicians and nurse practitioners likely have very different
views on scope of practice and implications for provider demand
• Static models− Utilization is independent of supply− Provider demand is independent of other “factors of production”
15

Healthcare Demand Microsimulation Model: Overview
Population DatabaseDemographic, socioeconomic, & health risk
factors
Utilization PatternsRelationship between patient characteristics
and health care use
Service and Product Demand
Inpatient DaysBy diagnosis category
Emergency VisitsBy diagnosis category
Provider Office VisitsBy occupation/specialty
Outpatient Clinic VisitsBy occupation/specialty
Hospital Ambulatory
Dentist Office VisitsBy occupation/specialty
Nursing Facilities
Residential Care
Post‐acute/Long TermOther
Employment
Public healthSchool healthAcademiaOther
Staffing PatternsBy occupation/specialty & setting
Home & Hospice VisitsBy occupation
Health Workforce DemandBy occupation/specialty and setting
External FactorsTrends or changes in policy, prices,
economic conditions, technology
16

Develop Representative Sample of Current and Future Population to Model Demand
Combines:Behavioral Risk Factor Surveillance System (BRFSS)American Community Survey (ACS)National Nursing Home Survey (NNHS)
17
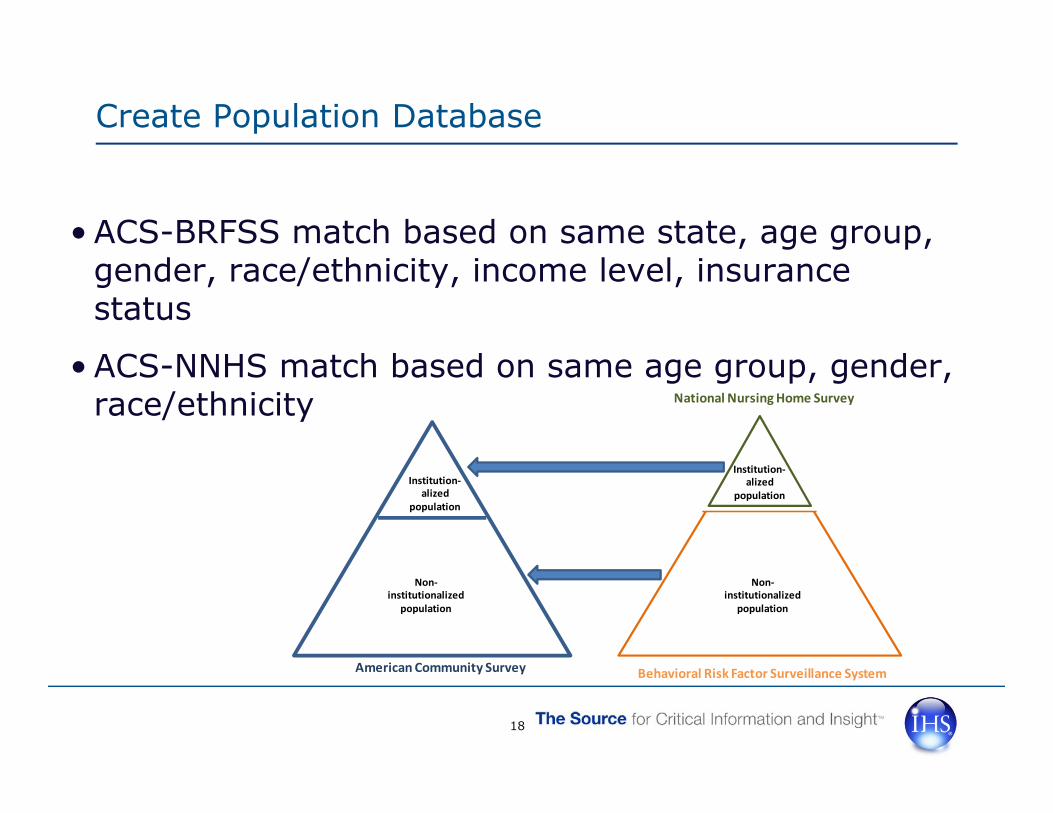
Create Population Database
• ACS-BRFSS match based on same state, age group, gender, race/ethnicity, income level, insurance status
• ACS-NNHS match based on same age group, gender, race/ethnicity
American Community Survey
National Nursing Home Survey
Behavioral Risk Factor Surveillance System
Non‐institutionalized
population
Institution‐alized
population
Non‐institutionalized
population
Institution‐alized
population
18

Project Demand for Services: Chronic Disease Example
0%
5%
10%
15%
20%
25%
30%
2013 2016 2019 2022 2025
Percen
t Growth (relative to 2012)
Year
History of stroke
History of heart attack
Cardiovascular disease
Diabetes
Hypertension
Arthritis
Dislipdemia
Total U.S. Population
Asthma
19
Source: Dall et al., 2013, Health Affairs

Example: Healthcare Utilization for Cardiologist and Cardiology-Related Services
Parameter Office Visits1
Outpatient Visits1
Emergency Visits2
Hospitalization2
Race
-Et
hnic
ity Hispanic 0.78 ** 0.67 ** 1.02** 0.86**
Non-Hispanic black 0.73 ** 2.15 ** 1.41** 1.34** Non-Hispanic white 0.93 ** 1.31 ** 0.96** 0.97** Non-Hispanic other race 1.00 1.00 1.00 1.00
Male 1.13 ** 1.62 ** 0.92** 0.99
Age
18-34 years 0.13 ** 0.12 ** 0.45** 0.25** 35-44 years 0.32 ** 0.59 ** 0.84** 0.53** 45-64 years 0.53 ** 0.72 ** 0.83** 0.69** 65-74 years 0.88 ** 1.35 ** 0.91** 0.90** 75+ years 1.00 1.00 1.00 1.00
Smoker 0.77 ** 0.62 ** 0.97 0.95 D
iagn
osed
With
Hypertension 1.34 ** 1.31 ** 2.50** 1.91** Coronary heart disease 7.03 ** 6.37 ** 2.60** 3.39** History of heart attack 1.61 ** 1.90 ** 2.59** 2.58** History of stroke 1.07 ** 0.80 ** 2.38** 2.53** Diabetes 1.18 ** 1.51 ** 1.08** 1.25** Arthritis 1.02 ** 1.32 ** 0.94** 0.89** Asthma 1.04 ** 1.06 ** 1.05* 1.09** History of cancer 1.15 ** 0.83 ** 0.93** 0.91**
Insured 1.56 ** 1.14 ** 0.76** 0.99 Medicaid 1.29 ** 1.59 ** 1.57** 1.42**
Hou
seho
ld In
com
e < $10,000 0.89 ** 0.64 1.66** 1.53** $10,000 to < $15,000 0.83 ** 0.64 ** 1.36** 1.51** $15,000 to < $20,000 0.85 ** 0.86 ** 1.10** 1.28 $20,000 to < $25,000 0.93 ** 0.39 ** 1.35* 1.32 $25,000 to < $35,000 0.88 ** 0.78 ** 1.56** 1.36** $35,000 to < $50,000 1.03 ** 0.69 ** 1.17** 1.16** $50,000 to < $75,000 0.99 0.80 ** 1.06** 1.09** $75,000 or higher 1.00 1.00 1.00 1.00
Body
W
eigh
t Not available 0.89 ** 0.89 ** 2.26** 1.98 Normal 0.97 ** 0.97 1.14** 1.02 Overweight 1.00 1.00 1.00 1.00 Obese 1.04 ** 0.69 ** 1.09** 1.12
Metro area 1.35 ** 0.94 ** 1.04 0.93
1 Rate ratios from Poisson regression analysis using 2006-2010 Medical Expenditure Panel Survey (MEPS).2 Odds ratios from logistic regression analysis using 2006-2010 MEPS. Statistically significant at the 0.05 (*) or 0.01 (**) level.
20

Distribution (%) of Nurses Across Employment SettingsRNs LPNs
Work Setting
OES a 2008-10 ACS
b
2008 NSSRN
c
2008-10 ACS
b2012 2010Hospitals 62.0 60.4 63.2 62.2 29.3
Inpatient e 55.6 54.1 56.6 55.7Emergency e 6.4 6.3 6.6 6.5
Offices 7.4 9.8 5.110.5
8.6Outpatient 4.0 4.5 4.6 5.7Home health 6.2 5.5 3.8 6.4 6.3Government 5.6 5.8Nursing care facilities (skilled/long term)
5.3 5.1 7.4 5.3 30.7
Residential care facilities 1.7 1.6 0.4 1.3Nurse education 3.1 1.2 0.6d 3.8 0.3 d
School health 1.9Social work 0.7 0.7Public/community health 7.8Other 2.2 5.4 14.9 3.9 17.8Total f 100 100 100 100 100
Sources and notes: a Occupational Employment Statistics. b 2008-2010 pooled files of the American Community Survey, reported in HRSA 2013 nursing report. c 2008 National Sample Survey of Registered Nurses. d Nurses in teaching positions might be recorded in the ACS under teaching rather than under nursing. e Estimated based on estimate that 89.6% of hospital nurses are working in inpatient settings and 10.4% are working in emergency settings, with nurses in administration allocated proportionately across settings (from the 2008 NSSRN). fNumbers might not sum to 100% because of rounding
21

Care Delivery Patterns: Converting Service Demand to Health Profession FTEs
• Translate demand for health care services into full time equivalent (FTE) providers−Example: 1,000 ambulatory visits to a pediatrician equates to
approximately 0.23 FTE pediatrician; 1,000 hospital rounds equates to approximately 0.48 FTE pediatrician
• Data sources−Occupation/specialty/setting specific surveys and studies−National organizations (e.g., Medical Group Management
Association’s Physician Compensation and Production Survey)−National ratios (e.g., home health aides to home health visits)−Reported statistics (e.g., nurse staffing ratios in nursing homes)
22
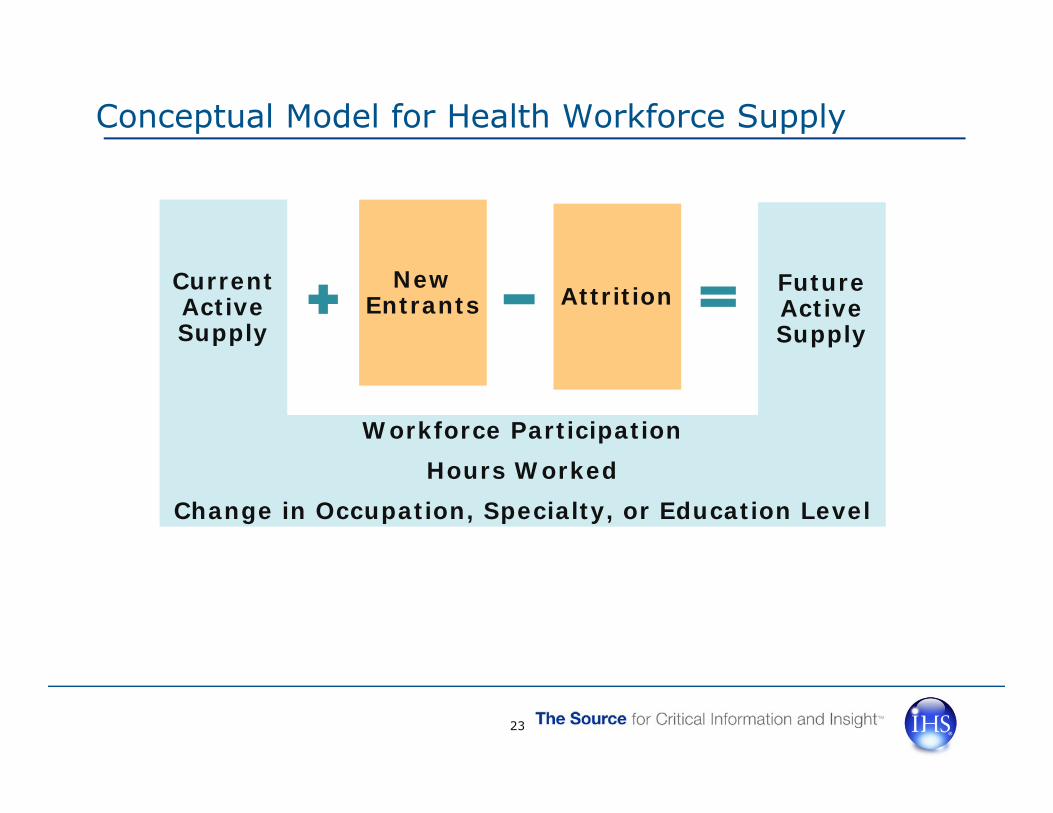
Conceptual Model for Health Workforce Supply
CurrentActive Supply
New Entrants Attrition Future
Active Supply
Workforce ParticipationHours Worked
Change in Occupation, Specialty, or Education Level
23
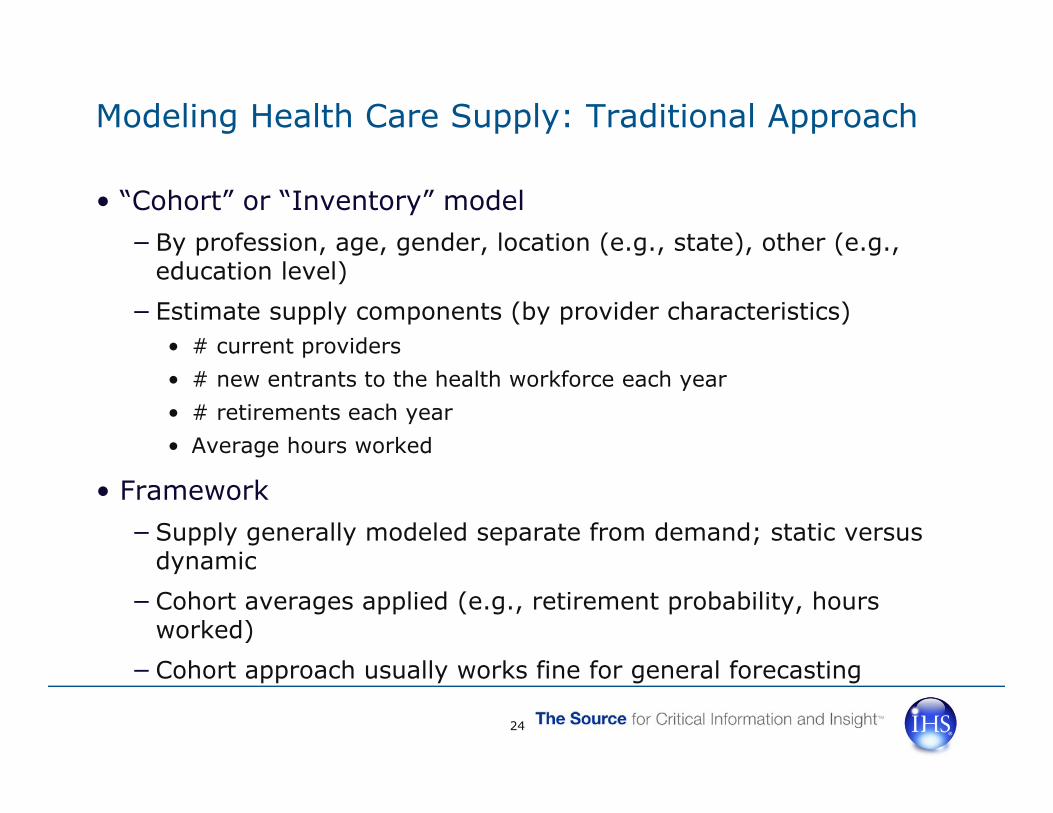
Modeling Health Care Supply: Traditional Approach
• “Cohort” or “Inventory” model−By profession, age, gender, location (e.g., state), other (e.g.,
education level)−Estimate supply components (by provider characteristics)
• # current providers• # new entrants to the health workforce each year• # retirements each year• Average hours worked
• Framework−Supply generally modeled separate from demand; static versus
dynamic−Cohort averages applied (e.g., retirement probability, hours
worked)−Cohort approach usually works fine for general forecasting
24
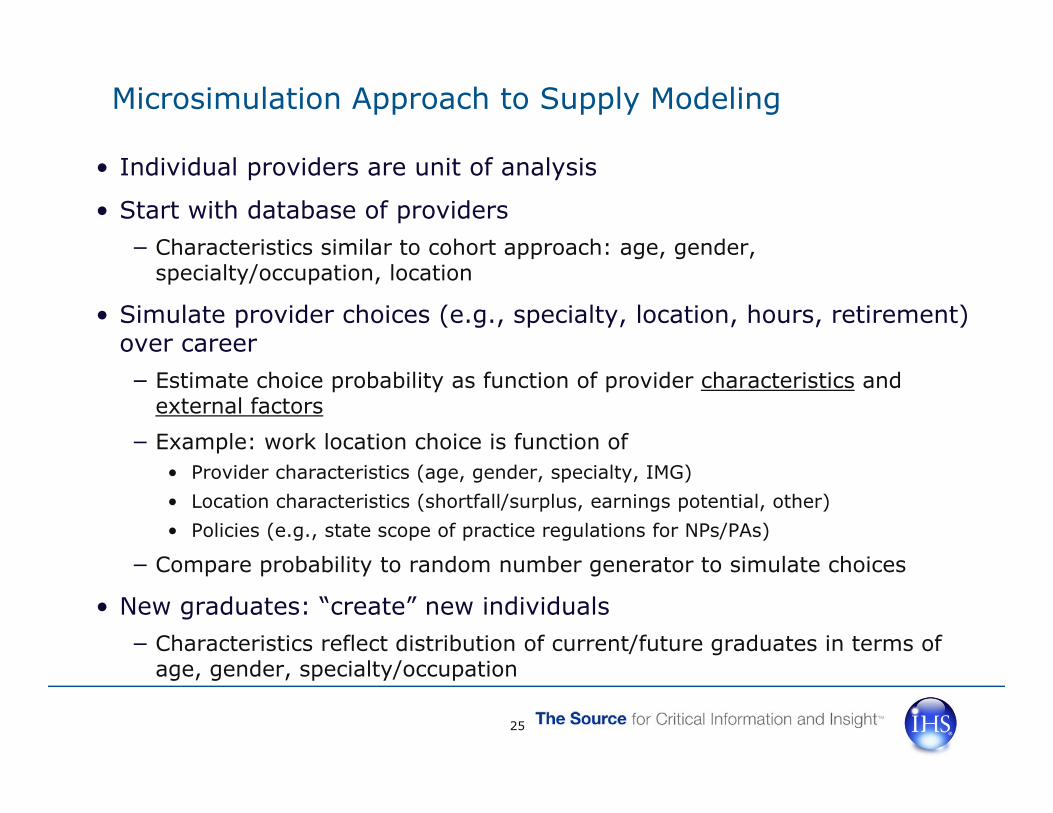
Microsimulation Approach to Supply Modeling
• Individual providers are unit of analysis
• Start with database of providers− Characteristics similar to cohort approach: age, gender,
specialty/occupation, location
• Simulate provider choices (e.g., specialty, location, hours, retirement) over career− Estimate choice probability as function of provider characteristics and
external factors− Example: work location choice is function of
• Provider characteristics (age, gender, specialty, IMG)• Location characteristics (shortfall/surplus, earnings potential, other)• Policies (e.g., state scope of practice regulations for NPs/PAs)
− Compare probability to random number generator to simulate choices
• New graduates: “create” new individuals− Characteristics reflect distribution of current/future graduates in terms of
age, gender, specialty/occupation
25

Strengths and Limitations of Alternative Supply Approaches
Features Traditional (Cohort) Approach
Microsimulation Approach
Simplicity Simpler More complex
Data needs Fewer data needs Greater data needs
Flexibility for modeling policies and trends in supply determinants
Less flexible More flexible
Static versus dynamic: • Integrate supply & demand• Integrate economic factors
Less flexible More flexible
Research needs Compute averages Regression analysis or other approaches to calculate model parameters
Accessibility Can be developed in MS Excel spreadsheet
Requires more powerfulsoftware (e.g., SAS)
26

Supply-Related Data Sources
• State licensure files− Many states collect valuable information via survey at relicensure
• National and profession surveys− American Community Survey− HRSA Nurse Practitioner survey− AAMC Physician Workforce Survey− Individual profession surveys
• Association/licensure databases− American Medical Association Masterfile− American Dental Association Masterfile− National Commission on Certification of Physician Assistants Masterfile
• Integrated Postsecondary Education Data System (IPEDS)
27
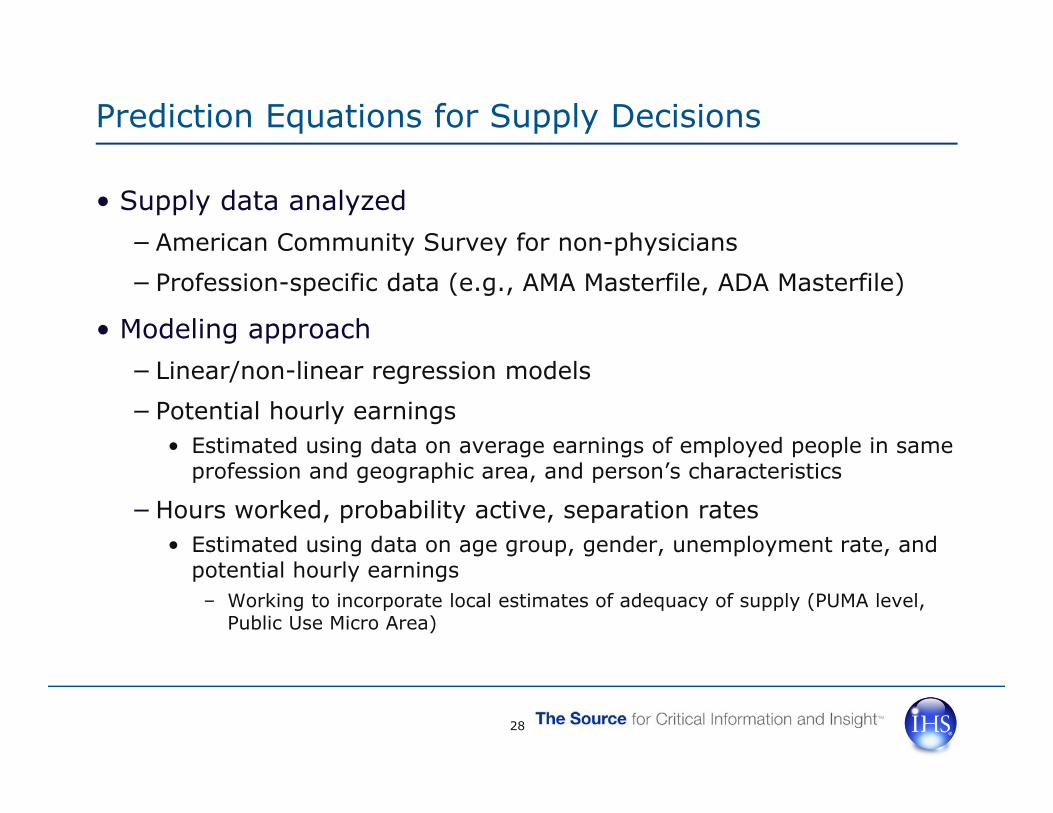
Prediction Equations for Supply Decisions
• Supply data analyzed−American Community Survey for non-physicians− Profession-specific data (e.g., AMA Masterfile, ADA Masterfile)
• Modeling approach− Linear/non-linear regression models− Potential hourly earnings
• Estimated using data on average earnings of employed people in same profession and geographic area, and person’s characteristics
−Hours worked, probability active, separation rates• Estimated using data on age group, gender, unemployment rate, and
potential hourly earnings– Working to incorporate local estimates of adequacy of supply (PUMA level,
Public Use Micro Area)
28

Average Weekly Patient Care Hours Across Primary Care Physician Specialties
29
0
5
10
15
20
25
30
35
40
45
50
Age 39 andless
40 to 44 45 to 49 50 to 54 55 to 59 60 to 64 65 to 69 Age 70 andgreater
Patie
nt Care Hou
rs per W
eek
Age Group
Female
Male
Source: FL Physician Survey, 2012-1013
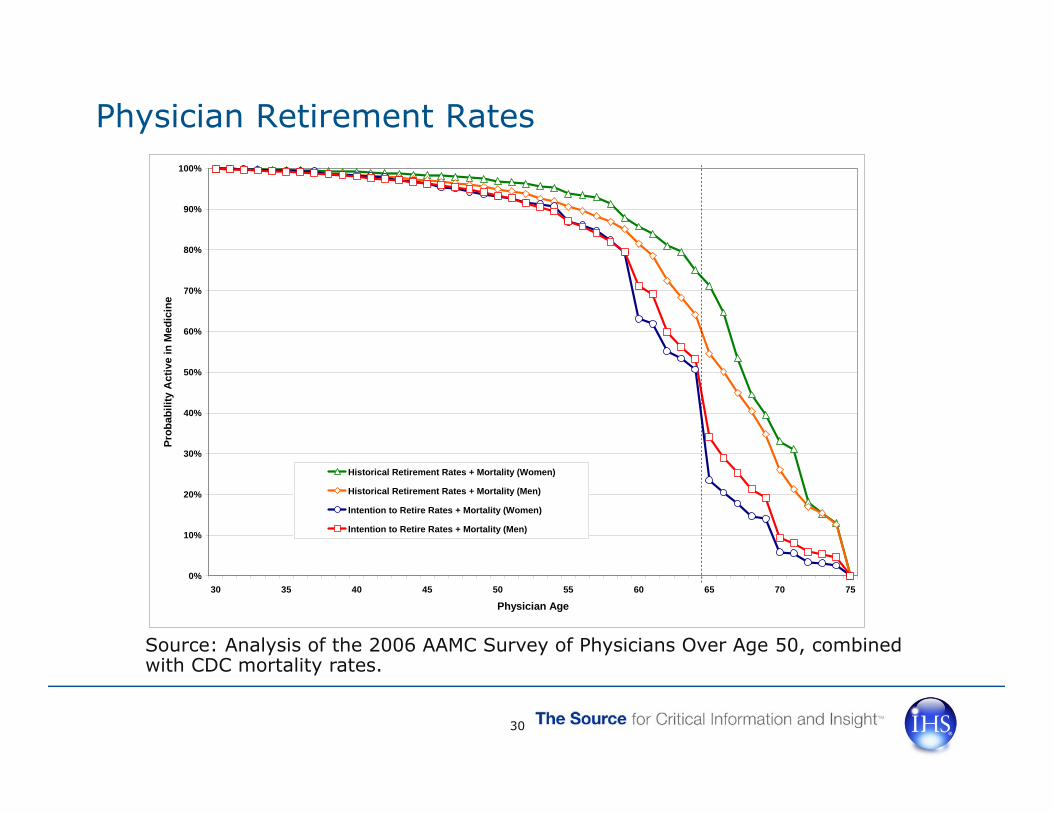
Physician Retirement Rates
30
0%
10%
20%
30%
40%
50%
60%
70%
80%
90%
100%
30 35 40 45 50 55 60 65 70 75
Physician Age
Prob
abili
ty A
ctiv
e in
Med
icin
e
Historical Retirement Rates + Mortality (Women)
Historical Retirement Rates + Mortality (Men)
Intention to Retire Rates + Mortality (Women)
Intention to Retire Rates + Mortality (Men)
Source: Analysis of the 2006 AAMC Survey of Physicians Over Age 50, combined with CDC mortality rates.

Workforce Attrition for General & Family Practice Doctors in FL
31
0
10
20
30
40
50
60
70
80
90
100
50 55 60 65 70 75 80 85
Percen
t of P
hysician
s Not Retire
d
Age
General & Family Practice (Female) General & Family Practice (Male)
Sources: CDC mortality rates combined with FL survey data (intention to retire in next 5 years)

RESOURCES AND TIPS FOR SUCCESSFUL WORKFORCE STUDY
32

Resource: State/Researcher Access to Nursing Component of Web-Based Workforce Model
• Web-based version of model currently being developed by HRSA and will be beta tested with select states−States have access to more accurate nurse workforce data
through licensure process−States will have ability to upload their minimum data sets for
nursing−States will have ability to run supply and demand scenarios
related to nursing
33
Tips for Successful Study• Up front, clearly define goals of the study− Primarily interested in forecasting? Interest in policy analysis?
• Use an advisory committee that includes clinicians• Beware of small specialties (small sample size issues)• Give the supply data a thorough cleaning−Some licensed providers might not be actively practicing even if
their records indicate they are active−New licenses to the state workforce might include physicians in
GME who do not intend to practice in the state, locum tenens, retirees
• Conduct sensitivity analyses and stress tests with the model• Use the peer review process to check your proposed approach
and findings• Models and projections need periodic updating and refinement−Consider future data availability
34
Related Documents