Data Management and Visualization with Tableau Rachel Lewellen, University of Massachusetts Amherst Martha Kyrillidou, Association of Research Libraries March 17, 2015

Welcome message from author
This document is posted to help you gain knowledge. Please leave a comment to let me know what you think about it! Share it to your friends and learn new things together.
Transcript
Data Management and Visualization with Tableau
Rachel Lewellen, University of
Massachusetts Amherst
Martha Kyrillidou, Association of
Research Libraries
March 17, 2015

Webcast Series
• March 3, 2015: Sarah Anne Murphy, Ohio State University
• March 10, 2015: Jeremy Buhler, University of British Columbia
• March 17, 2015: Rachel Lewellen, University of Massachusetts Amherst
• April 21, 2015: Discussion and Q&A
UMass Amherst Libraries
Tableau at UMass Amherst Libraries
Rachel Lewellen Assessment Librarian University of Massachusetts Amherst [email protected]
2 UMass Amherst Libraries
How we use Tableau
• To answer questions and inform decisions • To monitor data over time • To communicate results
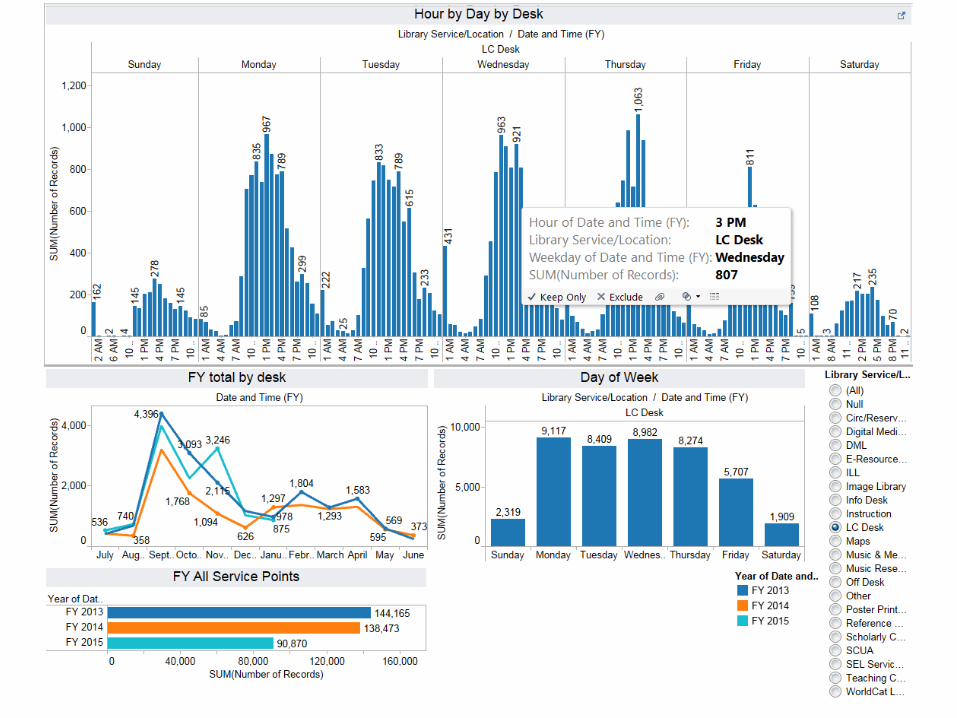
LibAnalyics Service Desk Statistics
Excel Data
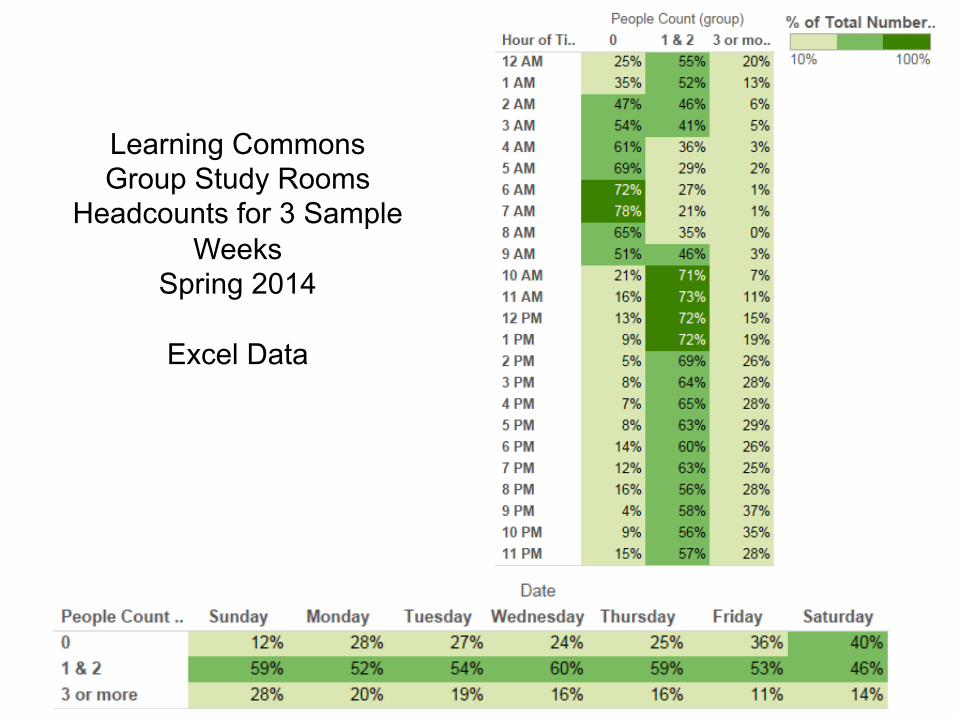
Learning Commons Group Study Rooms
Headcounts for 3 Sample Weeks
Spring 2014
Excel Data

Door Count Data – What time is best for focus group recruiting? Microsoft SQL Server Database Connection
Aleph - Oracle Database Connection

Five College Consortium EBL Pilot Project – Excel Data

MINES Data Measuring the Impact of Networked Electronic Services
Survey data
about Eresources
• Purpose of
Use • Location • User Group • School and
College • Why Selected • Resource MYSQL Database Connection
9 UMass Amherst Libraries
How we share results
• Publish to Tableau Public • Publish to Tableau Server • Print views or PDF’s • Email images • Work collaboratively with Desktop
Professional
10 UMass Amherst Libraries
Questions

If you are using Tableau or other data analytics platforms, please join and post your examples in
ARL-ASSESS Google group

Related Documents