Mary Campa, Ph.D. and Zhiwei Yu, MPH California Department of Public Health Center for Family Health Maternal, Child and Adolescent Health Division Epidemiology, Assessment, and Program Development Branch September 17, 2014 Data-Informed: Maximizing Adolescent Sexual and Reproductive Health Program Capacity in California

Welcome message from author
This document is posted to help you gain knowledge. Please leave a comment to let me know what you think about it! Share it to your friends and learn new things together.
Transcript
Mary Campa, Ph.D. and Zhiwei Yu, MPH
California Department of Public Health
Center for Family Health
Maternal, Child and Adolescent Health Division
Epidemiology, Assessment, and Program Development Branch
September 17, 2014
Data-Informed: Maximizing Adolescent Sexual and
Reproductive Health Program Capacity in California

Objectives
At the conclusion of this presentation, participants will be able to…
1. describe successes and challenges in adolescent sexual health
in California;
2. identify at least 3 resources for obtaining local data about
adolescent sexual health; and,
3. identify steps for integrating local data into program planning.

Adolescent Sexual and Reproductive
Health at MCAH
• MCAH Program Standards
– Adolescent Family Life Program (AFLP) / AFLP – PYD
– Information and Education Program (I&E)
– Personal Responsibility and Education Program (CA PREP)
• MCAH Epidemiology, Assessment and Program Development
– Population surveillance
– Program monitoring
– Program evaluation
• Title V 5-Year Needs Assessment related to children and
adolescents

Reframing Adolescent Sexual Health
• National push to reframe adolescent sexual health (ASH) to be:
– youth-positive
– inclusive
– socially responsible
– holistic
• A youth-positive model of ASH aligns with MCAH’s priorities on
positive-youth development, recognition of the social determinants
of health, and focus on life course development.

Adolescent Health In California, 2012
• Approximately 5.6 million adolescents in California
– 12 percent of the nation’s adolescent population
• Nearly 3 million California children live in areas of concentrated
poverty; roughly 32.3% of total California children
• The majority of adolescents in California are Latino (Hispanic)
Percentage
0% 25% 50% 75% 100%
Adolescent Health In California, 2012
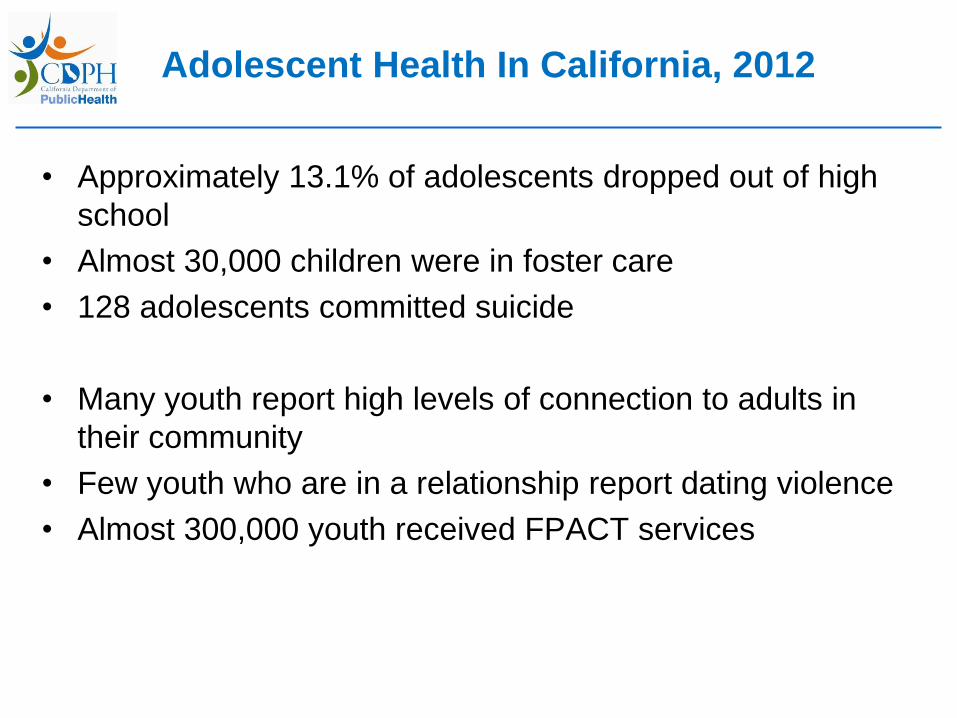
• Approximately 13.1% of adolescents dropped out of high
school
• Almost 30,000 children were in foster care
• 128 adolescents committed suicide
• Many youth report high levels of connection to adults in
their community
• Few youth who are in a relationship report dating violence
• Almost 300,000 youth received FPACT services

46.7
43.9
40.9 39.4 39.0 38.6
40.2 40.1 38.3
35.4
31.5
28.0
25.7
47.7
45.0
42.6 41.1 40.5 39.7
41.1 41.5 40.2
37.9
34.2
31.3 29.4
10
20
30
40
50
60
2000 2001 2002 2003 2004 2005 2006 2007 2008 2009 2010 2011 2012
Bir
ths p
er
1,0
00 f
em
ale
s i
n s
pecif
ied
gro
up
Year
California
U.S.
Birth Rates, Ages 15 – 19, 2000 – 2012,
California and U.S.
California data sources: Births: 2000-2012, Birth Statistical Master File, California Department of Public Health, Center for Health Statistics and
Informatics. Population: 2000-2009, State of California, Department of Finance, Race/Hispanics Population with Age and Gender Detail, 2000–2010.
Sacramento, California, September 2012. 2010-2012, State of California, Department of Finance, Report P-3: State and County Population
Projections by Race/Ethnicity, Detailed Age, and Gender, 2010-2060. Sacramento, California, January 2013. U.S. data sources: 2000-2011, Martin
JA, Hamilton BE, Ventura SJ, Osterman MJK, and Mathews TJ. Births: Final data for 2011. NVSR 62(1). Hyattsville, MD: National Center for Health
Statistics, 2013. *Preliminary data for 2012, Hamilton BE, Martin JA, Ventura SJ. Births: Preliminary data for 2012. NVSR 62(3). Hyattsville, MD:
National Center for Health Statistics, 2013. Note: The California birth rates presented here differ from rates computed on the basis of other population
estimates such as those published by the National Center for Health Statistics. Further, these rates should not be compared to rates CDPH published
prior to 2013, wherein the population was based on the California Department of Finance population projections as of July, 2007.
*
The birth rate among
California females
ages 15 – 19
declined 45%
between 2000 and
2012. Between 2011
and 2012, the rate
declined 8%.
This decline is similar
to that observed in
the overall U.S. birth
rate among females
ages 15 – 19.

In 2012, the birth rate
among females ages
18 – 19 was 3.3
times that of those
ages 15 – 17.
Between 2000 and
2012, the birth rate
among females ages
18 – 19 decreased by
34 births per 1,000.
During the same time
period, the birth rate
among females ages
15 – 17 fell 51%.
Birth Rates by Age Group, 2000 – 2012,
California
Data sources: Births: 2000-2012, Birth Statistical Master File, California Department of Public Health, Center for Health Statistics and Informatics.
Population: 2000-2009, State of California, Department of Finance, Race/Hispanics Population with Age and Gender Detail, 2000–2010. Sacramento,
California, September 2012. 2010-2012, State of California, Department of Finance, Report P-3: State and County Population Projections by
Race/Ethnicity, Detailed Age, and Gender, 2010-2060. Sacramento, California, January 2013. Note: The rates should not be compared to rates
CDPH published prior to 2013, wherein the population was based on the California Department of Finance population projections as of July, 2007.
26.5 23.8
22.6 21.6 21.3 21.6 21.7 21.8 20.8 19.2
16.4 14.8
13.1
77.1
74.1
68.6 66.2
65.1 63.9
68.3 68.4
65.3
59.2
53.1
46.7
43.1
10
20
30
40
50
60
70
80
90
2000 2001 2002 2003 2004 2005 2006 2007 2008 2009 2010 2011 2012
Bir
ths p
er
1,0
00 f
em
ale
s i
n s
pecif
ied
gro
up
Year
Ages 15-17
Ages18-19
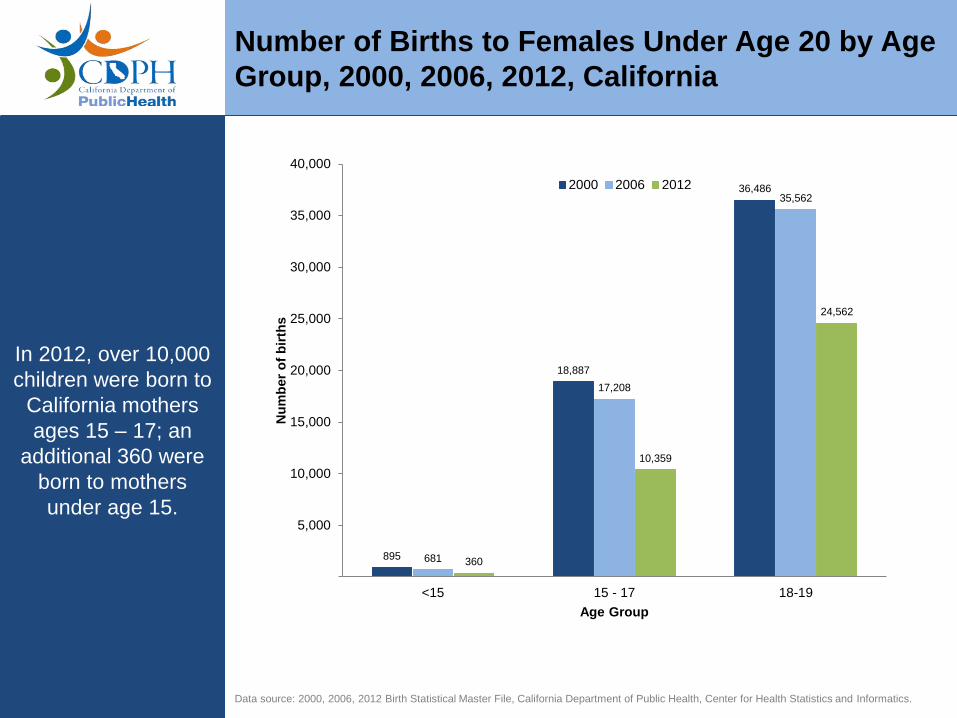
Number of Births to Females Under Age 20 by Age
Group, 2000, 2006, 2012, California
Data source: 2000, 2006, 2012 Birth Statistical Master File, California Department of Public Health, Center for Health Statistics and Informatics.
895
18,887
36,486
681
17,208
35,562
360
10,359
24,562
5,000
10,000
15,000
20,000
25,000
30,000
35,000
40,000
<15 15 - 17 18-19
Nu
mb
er
of
bir
ths
Age Group
2000 2006 2012
In 2012, over 10,000
children were born to
California mothers
ages 15 – 17; an
additional 360 were
born to mothers
under age 15.


Birth Rates by Race and Hispanic Ethnicity,
Ages 15 – 19, 2000, 2006, 2012, California
Data sources: Births: 2000, 2006, 2012, Birth Statistical Master File, California Department of Public Health, Center for Health Statistics and
Informatics. Population: 2000, 2006, State of California, Department of Finance, Race/Hispanics Population with Age and Gender Detail, 2000–2010.
Sacramento, California, September 2012. 2012, State of California, Department of Finance, Report P-3: State and County Population Projections by
Race/Ethnicity, Detailed Age, and Gender, 2010-2060. Sacramento, California, January 2013. Note: The rates should not be compared to rates CDPH
published prior to 2013, wherein the population was based on the California Department of Finance population projections as of July, 2007. Births to
mothers identified as “other” or “unknown” race are excluded from the analysis; they comprised <1% per year in 2000 and 2006, and 1.5% in 2012.
77.3
22.3
59.1
27.7
15.0
45.7
40.6
66.9
15.8
45.1
22.4
9.7
40.1
32.7
38.9
10.2
30.8
17.9
5.0
31.0
19.8
10
20
30
40
50
60
70
80
90
Hispanic White(non-Hispanic)
African American(non-Hispanic)
Multiple Race(non-Hispanic)
Asian(non-Hispanic)
American Indian(non-Hispanic)
Pacific Islander(non-Hispanic)
Bir
ths p
er
1,0
00 f
em
ale
s i
n s
pecif
ied
gro
up
Race/Ethnicity
2000 2006 2012
The birth rate among
California females
ages 15 – 19
declined across all
racial/ethnic groups.
Hispanic females had
the greatest absolute
decline in birth rate
between 2000 and
2012, declining a full
38 births per 1,000
females ages 15-19.
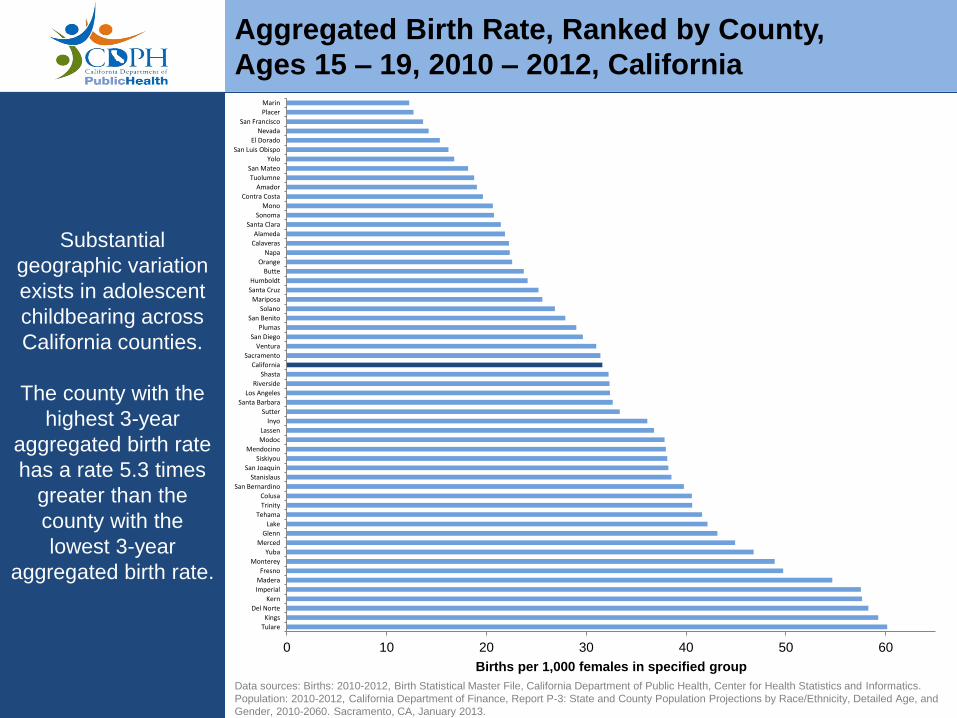
Substantial
geographic variation
exists in adolescent
childbearing across
California counties.
The county with the
highest 3-year
aggregated birth rate
has a rate 5.3 times
greater than the
county with the
lowest 3-year
aggregated birth rate.
Aggregated Birth Rate, Ranked by County,
Ages 15 – 19, 2010 – 2012, California
0 10 20 30 40 50 60
Tulare
Kings
Del Norte
Kern
Imperial
Madera
Fresno
Monterey
Yuba
Merced
Glenn
Lake
Tehama
Trinity
Colusa
San Bernardino
Stanislaus
San Joaquin
Siskiyou
Mendocino
Modoc
Lassen
Inyo
Sutter
Santa Barbara
Los Angeles
Riverside
Shasta
California
Sacramento
Ventura
San Diego
Plumas
San Benito
Solano
Mariposa
Santa Cruz
Humboldt
Butte
Orange
Napa
Calaveras
Alameda
Santa Clara
Sonoma
Mono
Contra Costa
Amador
Tuolumne
San Mateo
Yolo
San Luis Obispo
El Dorado
Nevada
San Francisco
Placer
Marin
Births per 1,000 females in specified group
Data sources: Births: 2010-2012, Birth Statistical Master File, California Department of Public Health, Center for Health Statistics and Informatics.
Population: 2010-2012, California Department of Finance, Report P-3: State and County Population Projections by Race/Ethnicity, Detailed Age, and
Gender, 2010-2060. Sacramento, CA, January 2013.
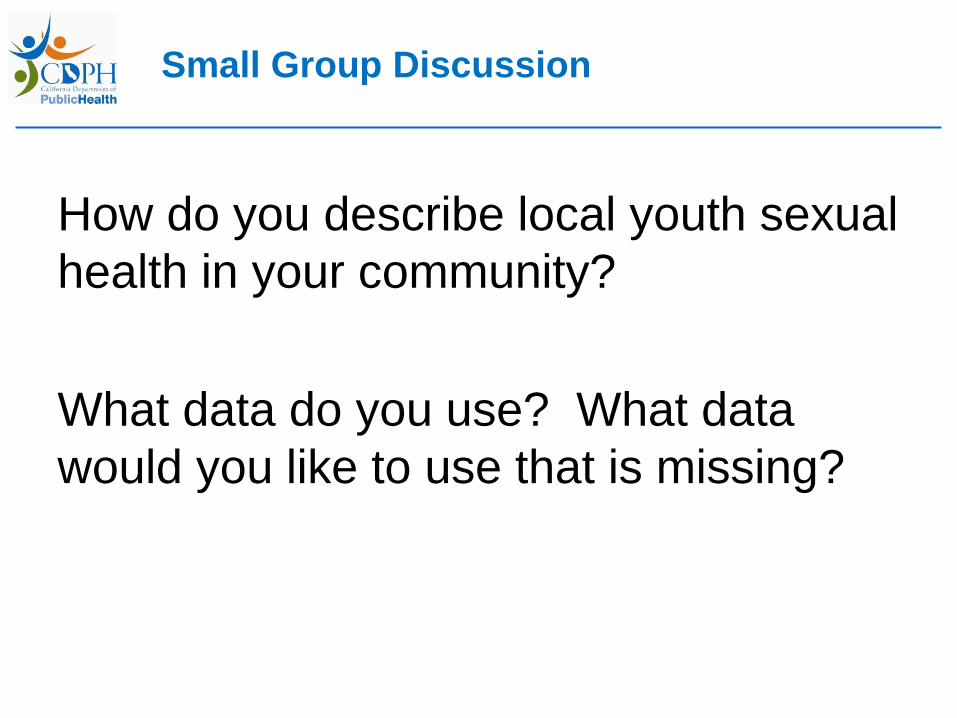
Small Group Discussion
How do you describe local youth sexual
health in your community?
What data do you use? What data
would you like to use that is missing?

MCAH Adolescent Health Data Website
http://www.cdph.ca.gov/data/statistics/Pages/AdolescentHealthData.aspx

TBR Press Release and FAQ

The Local and State Populations
County County
N % N % Ranking11N % N % Ranking11
Total Population1 848,839 100.0 37,570,307 100.0 11 Adolescent Population1 140,294 100.0 5,376,295 100.0 11
Aged 10 - 14 years 68,100 8.0 2,556,893 6.8 8 Hispanic 83,896 59.8 2,661,266 49.5 11
Aged 15 - 17 years 42,443 5.0 1,646,388 4.4 7 African American 7,576 5.4 327,954 6.1 12
Aged 18 - 19 years 29,751 3.5 1,173,014 3.1 7 Asian 4,630 3.3 575,264 10.7 28
Uninsured2 171,416 21.2 6,694,764 18.2 15 White 39,563 28.2 1,564,502 29.1 41
Public Health Insurance2 293,077 36.3 10,611,883 28.8 8 Male 72,251 51.5 2,758,039 51.3 8
Single Head-of-Household2 37,864 15.0 1,244,103 10.0 22 Female 68,043 48.5 2,618,256 48.7 45
Population Living in Poverty2 183,684 22.8 5,676,189 15.5 7 Living in Foster Care4866 0.6 27874 0.5 25
Children Living in Poverty2 80,481 32.2 1,971,754 21.6 6 Family PACT Providers5 53 2.4 2,190 100.0 7
Unemployment Rate2 14.3 -- 12.1 -- 21 Teen Family PACT Clients5 6,957 19.0 291,325 16.0 10
Rural MSSAs3 10 71.4 227 41.8 10 High School Dropout Rate616.8 -- 13.1 -- 9
Adolescent Sexual and Reproductive HealthKern County, 2011
Adolescence is the developmental period from ages 10 to 19. During adolescence and into early adulthood, the brain undergoes the
last major period of growth and reorganization, resulting in an increased need for stimulation and changes in social and emotional
information processing. Adolescence is a time for youth to explore their identity and values. Often this occurs in the context of peer
relationships though parents and other adult figures remain influential. Although the morbidity and mortality rates increase sharply
from childhood through adolescence, most youth fare well. Adolescence is a critical time for establishing patterns for a positive
adulthood - including an active role in one's reproductive and sexual health.
California
Notes: 1 Adolescent Population aged 10 - 19. State of California, Department of Finance, Report P-3: State and County Population Projections by Race/Ethnicity, Detailed Age, and Gender, 2010-2060. Sacramento, California,
January 2013. 2Estimated number of population with no health insurance coverage, public health insurance; Estimated number of households with male/female householder, no wife/husband present; estimated total persons
and children under age 18 below federal poverty level in past 12 months; unemployment rate percentage: 2010-2012, U.S. Census Bureau, American Community Survey (3-year estimates) retrieved from
http://factfinder2.census.gov/. 3Total rural and frontier MSSAs: Office of Statewide Health Planning & Development, Medical Study Service Areas, retrieved from: http://www.oshpd.ca.gov/hwdd/MSSA/. 4 PIT estimate, July
1, 2011, youth ages 0-17; University of California at Berkeley, California Child Welfare Indicators Project (CCWIP) retrieved from: http://cssr.berkeley.edu/ucb_childwelfare/PIT.aspx. 5Family Pact: 2011-2012, Bixby Center for
Global Reproductive Health and University of California San Francisco, Family PACT Program Report. Sacramento, CA. 2013. Retrieved from: http://bixbycenter.ucsf.edu/publications/files/Family%20PACT%20AR_2011-12.pdf. 6High School Cohort Drop Out Rate: 2010-2011. California Department of Education, retrieved from: http://dq.cde.ca.gov/dataquest/. 7Rate per 1,000 females, 2011; Percent of repeat births is percent of births to females
aged 15 – 19 with 1-7 previous lives births. Birth Statistical Master File, California Department of Public Health, Center for Health Statistics and Informatics. 8Rate per 100,000 youth. 2012. California Department of Public
Health, STD Control Branch, rates by race, age and juridiction, retrieved from http://www.cdph.ca.gov/data/statistics/Pages/STDLHJData.aspx. 9Rate per 100,000 youth, 2011. California Department of Justice, Office of the
Attorney General, California Arrests Data File, retrieved from: http://oag.ca.gov/crime/cjsc/stats/arrests. 10 Percent 9th graders rated with high level of caring adult in community; percent 9th graders with boyfriend or
girlfriend who report dating violence; percent of 9th graders reporting depression-related feelings in past year: 2009-2011. WestEd Health and Human Development Department for California Department of Education,
retrieved from: http://chks.wested.org/resources/. 11County rankings determined by assigning rank of one to the largest value among counties and rank of 58 to smallest value.
Kern KernCalifornia
Adolescent Sexual and Reproductive
Health, County Profiles
County
Local State Ranking11 Female Male Hispanic Asian White
Adolescent Behaviors and Outcomes
Adolescent birth rate (aged 15-19)1,7 52.7 28.0 2 -- -- 64.2 -- 31.9
Percent of repeat adolescent births (aged 15-19)7 18.6 17.4 9 -- -- 19.4 -- 17.1
Chlamydia rate (aged 15 - 19)8 2239.7 1402.8 2 3505.7 1056.1 2380.2 1245.6 1714.0
Gonorrhea rate (aged 15 - 19)8 277.6 159.3 3 436.3 262.1 465.4 159.9 231.2
Juvenile arrest rate (aged 10 - 19)9 994.9 361.0 18 177.8 665.9 358.7 -- 351.4
Have caring adult in community10 64.0 63.0 25 -- -- 62.0 61.0 74.0
32.0 31.0 25 39.0 23.5 30.8 27.2 31.1
5.0 6.0 25 5.4 5.3 4.9 3.1 6.8
Kern County Adolescent Birth Rate by Age Group1,7
, 2001 - 2011
Adolescent Sexual and Reproductive HealthKern County, 2011
African American
7.2Experienced dating violence in past year10
Depression-related feelings10 27.3
70.0
2070.8
Geography Gender Race and Ethnicity
75.1
16.0
8037.6
2394.0
• 1,486 adolescent births occurred in Kern County in 2011, representing 4.7% of adolescent births in the State that year. 2.5% of CA females ages 15-19 lived in Kern County in 2011.
• The adolescent birth rate has decreased 25.1 percent since the high in 2008; the State has seen a similar decrease in that time, dropping 26.8 percent.
• 67.3% of adolescent births in Kern County in 2011 were to women aged 18-19. The State average was 69.1%.
• 71.4% of adolescent births in Kern County in 2011 were to mothers who reported a Hispanic ethnicity. The State average was 73.8%.
• 15.6% of teen births in Kern County in 2011 were to foreign-born mothers. The State average was 19.7%.
Adolescent Births In Kern County1,7
Adole
scent
Birth
Rate
, per
1,0
00 f
em
ale
s

Updated MSSA Report

MCAH Program Data
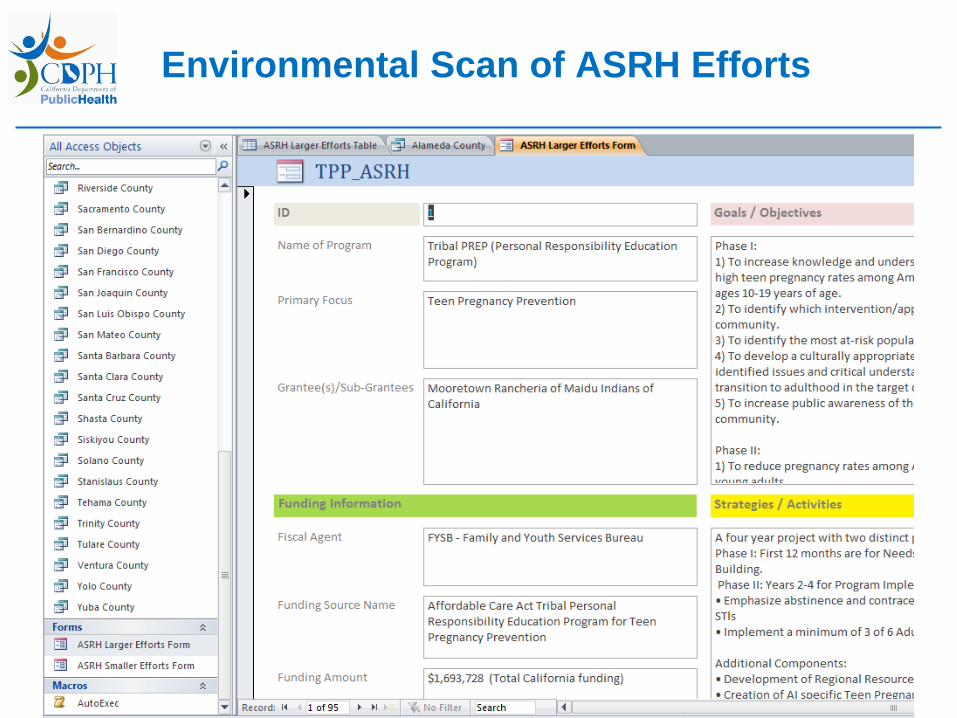
Environmental Scan of ASRH Efforts

Maternal Infant Health Assessment
(MIHA) Snapshots

Data Informed Program Targeting
• In an environment of limited funds, it is critical to reach
the most high-need youth
• Targeting can occur based on
– Means-Testing
– Category
• Population group
• Geography
23

Small Group Discussion & Activity
How do you determine your program
service area?
How do you determine who is most in
need of services in your community?

Geographical Program Targeting
Based on Need
• Geographical targeting can
– reduce administrative costs;
– limit type 2 errors of over service; and,
– increase services to youth with most need.
• Requires
– Small area geography
– Defined need criteria
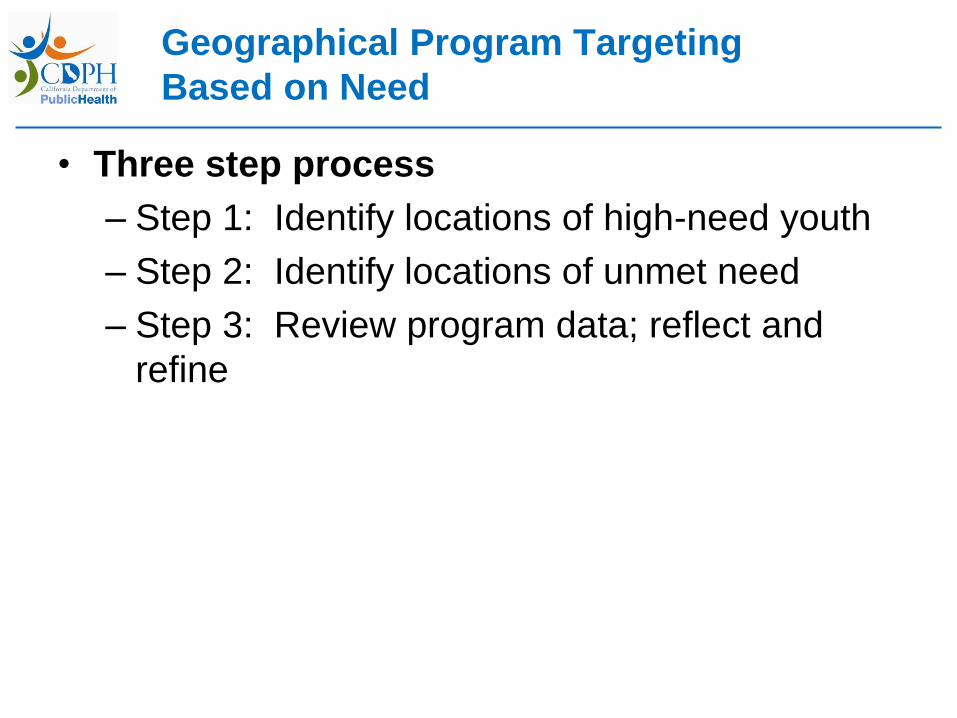
Geographical Program Targeting
Based on Need
• Three step process
– Step 1: Identify locations of high-need youth
– Step 2: Identify locations of unmet need
– Step 3: Review program data; reflect and
refine

Considerable
variation in early
childbearing exists
within California
counties.
The average
difference in birth
rates among
adolescents across
MSSAs within
counties is over 36
births per 1,000.
Geographic Distribution of 2010 – 2012 Aggregated
Birth Rate+ by MSSA, Ages 15 – 19, California
Data sources: Teen Births: Years 2010-2012 Birth Statistical Master File, California Department of Public Health, Health Information and Research
Section. Teen population: MCAH calculation of the MSSA population using California, Department of Finance, Report P-3: State and County
Population Projections by Race/Ethnicity, Detailed Age, and Gender, 2010-2060. Sacramento, California, January 2013 and Census 2010 population
by census tract http://factfinder2.census.gov/faces/nav/jsf/pages/index.xhtml
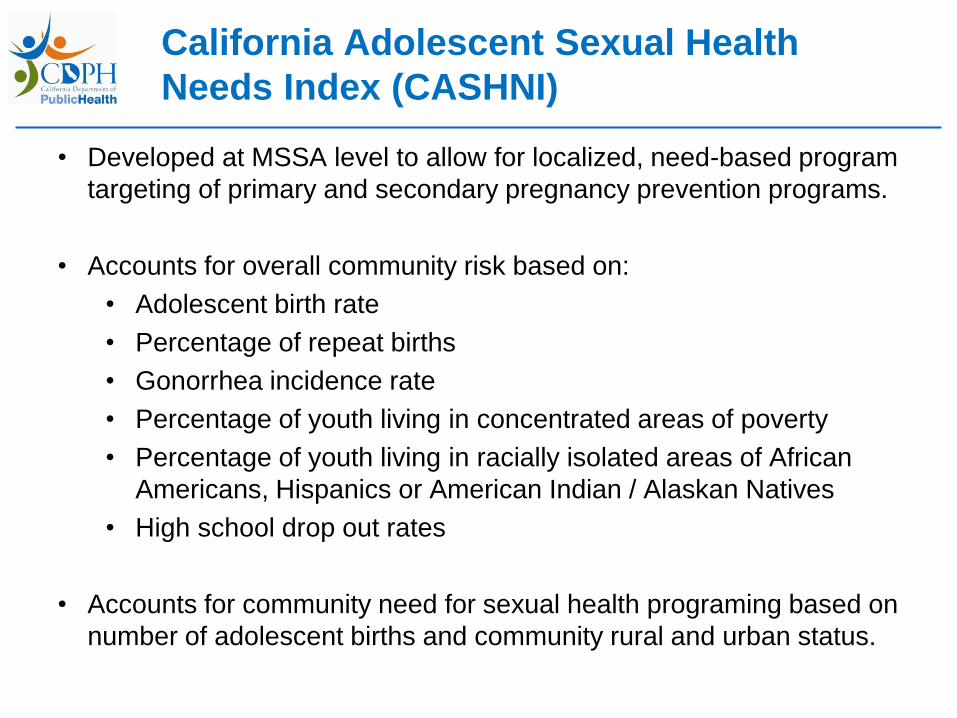
California Adolescent Sexual Health
Needs Index (CASHNI)
• Developed at MSSA level to allow for localized, need-based program
targeting of primary and secondary pregnancy prevention programs.
• Accounts for overall community risk based on:
• Adolescent birth rate
• Percentage of repeat births
• Gonorrhea incidence rate
• Percentage of youth living in concentrated areas of poverty
• Percentage of youth living in racially isolated areas of African
Americans, Hispanics or American Indian / Alaskan Natives
• High school drop out rates
• Accounts for community need for sexual health programing based on
number of adolescent births and community rural and urban status.
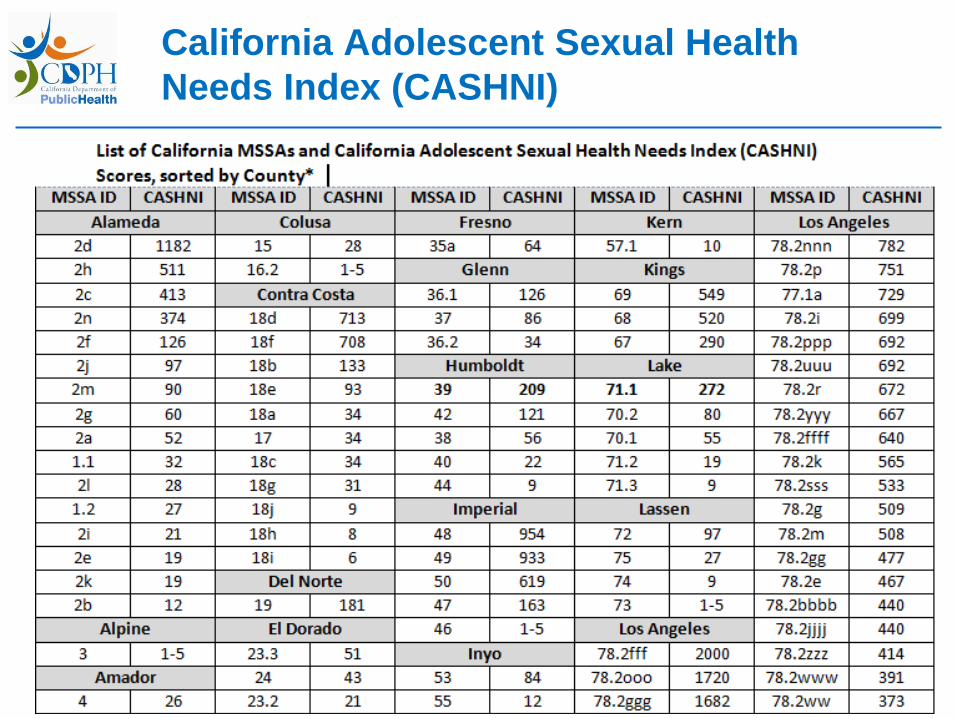
California Adolescent Sexual Health
Needs Index (CASHNI)

Wrap Up
3
0
• Understanding adolescent sexual and
reproductive health in California
• Maximizing data – informed programming
• Reflect, revise and improve
Thank you!
• Acknowledgements: – Mark Damesyn, Dr.P.H.
– Marina Chabot, MSc
– Maggie Tufts, MPH
– MCAH ASRH Program Staff (PREP, AFLP, I&E)
– UCSF Evaluation Partners
• Contact Information:
Mary Campa, Ph.D. Zhiwei Yu, MPH
[email protected] [email protected]
3
1
Related Documents