.:- Aw r NASA CR- WRL 3165-25-T '-I u I._' v '. ' 7, '•' DATA GAPS IN THE NASA EARTH RESOURCES SPECTRAL INFORMATION SYSTEM (NASA-CH-150980) DATA GAPS IN THE NASA N76-78576 EARTH RESOURCES SPECTRAL INFORMATION SYSTEM Technical Report, Oct. 1969 - Sep. 1970 (Michigan Univ.) 24 p Unclas - Robert K. Vincent 00/98 05334 INFRARED AND OPTICS LABORATORY WILLOW RUN LABORATORIES INSTITUTE OF SCIENCE AND TECHNOLOGY THE UNIVERSITY OF MICHIGAN prepared for NATIONAL AERONAUTICS AND SPACE ADMINISTRATION NASA Manned Spacecraft Center Contract NAS 9-9784 W. E. Hensley/TF, Project Manager N REC EIWJJ 17 rnftr1 O3$Lf 2

Welcome message from author
This document is posted to help you gain knowledge. Please leave a comment to let me know what you think about it! Share it to your friends and learn new things together.
Transcript
.:- Aw r
NASA CR-WRL 3165-25-T
'-I
u I._'v '. ' 7, '•'
DATA GAPS IN THE NASA EARTH RESOURCES SPECTRAL INFORMATION SYSTEM
(NASA-CH-150980) DATA GAPS IN THE NASA N76-78576 EARTH RESOURCES SPECTRAL INFORMATION SYSTEM Technical Report, Oct. 1969 - Sep. 1970 (Michigan Univ.) 24 p Unclas
- Robert K. Vincent00/98 05334
INFRARED AND OPTICS LABORATORY WILLOW RUN LABORATORIES
INSTITUTE OF SCIENCE AND TECHNOLOGY THE UNIVERSITY OF MICHIGAN
prepared for
NATIONAL AERONAUTICS AND SPACE ADMINISTRATION
NASA Manned Spacecraft Center Contract NAS 9-9784
W. E. Hensley/TF, Project Manager
N RECEIWJJ 17
rnftr1
O3$Lf 2
1404, 1
I
NOTICES
• Sponsorship. The work repOrtid herein was conducted by the Willow Run Laboratories of the Institute Of Sc . e and Technology for the National Aero-nautics and Space Administr.tion Under NASA Contract NAS9 -9784 with Mr. W. E. Hensley/TF, Earth Rez^ourcl:m Office, as Project Manager. Contracts and grants to The University of Michigan for the support of sponsored research are administered through the Off ire of the Vice-President for Research.
Disclaimers. This report was prepared as an account of Government-sponsored work. Neither the United States, nor the National Aeronautics and Space Administration (NASA', nor any person acting on behalf of NASA:
(A) Makes any warrant'- or representation, expressed or implied, with respect to the accuracy, completeness, or usefulness of the informa-tion contained in th i s report, or that the use of any information, apparatus, method, or process disclosed in this report may not in-fringe privately -owned rights: or
(B) Assumes any liabilities with respect to the use of, or for damages resulting from, the use of any information, apparatus, method or pro-cess disclosed in this report.
As used above, "person actin on behalf of NASA" includes any employee or contractor of NASA, or empyce of such contractor, to the extent that such employee or contractor of NASA or employee of such contractor prepares, disseminates, or provides access to any information pursuant to his employ-mentor contract with NASA, or his employment with such contractor.
Availability Notice. Requests for copies of this report should be referred to
National Aeronautics and Space Administration Scientlfi and Technical Information Facility P. 0. BoN 33 College park, Maryland 20740
Final Disposition. After this document has served its purpose, it may be destroyed. Please do not return it to the Willow Run Laboratories.
D
NOTICES • Sponsorship. The work reported herein was conducted by the Willow Run
Laboratories of the Institute of Science and Technology for the National Aero-nautics and Space Administration under NASA Contract NAS9 -9784 with Mr. W. E. Hensley/TF, Earth Resources Office, as Project Manager. Contracts and grants to The University of Michigan for the support of sponsored research are administered through the Office of the Vice-President for Research.
Disclaimers. This report was prepared as an account of Government-sponsored work. Neither the United States, nor the National Aeronautics and Space Administration (NASA), nor any person acting on behalf of NASA:
(A) Makes any warranty or representation, expressed or implied, with respect to the accuracy, completeness, or usefulness of the informa-tion contained in this report, or that the use of any information, apparatus, method, or process disclosed in this report may not in-fringe privately-owned rights: or
(B) Assumes any liabilities with respect to the use of, or for damages resulting from, the use of any information, apparatus, method or pro-cess disclosed in this report.
As used above, "person acting on behalf of NASA" includes any employee or contractor of NASA, or employee of such contractor, to the extent that such employee or contractor of NASA or employee of such contractor prepares, disseminates, or provides access to any information pursuant to his employ-ment or contract with NASA, or his employment with such contractor.
Availability Notice. Requests for copies of this report should be referred to
National Aeronautics and Space Administration Scientific and Technical Information Facility P. 0. Box 33 College Park, Maryland 20740
Final Disposition. After this document has served its purpose, it may be destroyed. Please do not return it to the Willow Run Laboratories.
NASA CR-WRL 3165-25-T
TECHNICAL REPORT
DATA GAPS IN THE NASA EARTH RESOURCES SPECTRAL INFORMATION SYSTEM
Sir Robert K. Vincent
INFRARED AND OPTICS LABORATORY WILLOW RUN LABORATORIES
INSTITUTE OF SCIENCE AND TECHNOLOGY THE UNIVERSITY OF MICHIGAN
prepared for
NATIONAL AERONAUTICS AND SPACE ADMINISTRATION
March 1971
CONTRACT NAS9-9784
NASA Manned Spacecraft Center Houston, Texas 77058
W. E. Hensley/TF, Project Manager on Earth Resources Office
WILLOW RUN LABORATORIES
FOREWORD
This report describes part of a comprehensive and continuing program of re-
search into remote sensing of the environment from aircraft and satellites. The
research is being carried out by the Willow Run Laboratories, a unit of The Uni-
versity of Michigan's Institute of Science and Technology, for the NASA Manned
Spacecraft Center, Houston, Texas. The basic objective of this multidisciplinary
program is to develop remote sensing as a practical tool to provide the planner and
decision-maker with extensive information quickly and economically.
Timely information from remote sensing will be important to such people as
the farmer, the city planner, the conservationist, and others concerned with a variety
of problems such as crop yield and disease, urban land studies and development, water
pollution, and forest management. The scope of our program includes: (1) extending
understanding of basic processes; (2) developing new applications, advanced remote-sensing systems, and automatic data processing to extract information in a useful form;
and (3) assisting in data collection, processing and analysis, including material spec-
tra and ground-truth verification.
The research described here was performed under NASA Contract NAS9 -9784,
Task B3, and covers the period October 1969 through September 1970. The program
was directed by M. R. Holter, formerly Head of the Infrared and Optics Laboratory,
and is now being directed by R. R. Legault, Associate Director. The work was done
under the management of the NASA Contract Monitor, W. E. Hensley/TF, Manned
Spacecraft Center. The Willow Run Laboratories' number for this report is
3165-25-T. Reports issued by the Infrared and Optics Laboratory under related
programs are listed in Appendix H.
WILLOW RUN LABORATORIES
ABSTRACT
A need for additional spectral data to be added to the NASA Earth Resources
Spectral Information System is examined in view of the requirements for various
types of data analysis projects. The following is a summary of the major data gaps.
Vegetation data are required (1) at wavelengths greater than 3 Am, (2) on plants native
to the southern and western U. S. and to foreign countries (especially tropical plants),
(3) on spectra related to plant vigor and (4) on spectra related to plant maturity.
Rocks and mineral data are required (1) in all wavelength regions, but particularly
for those lessthan 8jtm, (2)on the spectral effects of surface-roughness variations,
and (3) on the spectral indices of refraction for minerals, particularly in the infra-
red region. More soils and water data are required (1) for wavelengths greater than
3 Am, (2) on water, ice, and snow, and (3) on the spectral refractive indices of ice.
V
WILLOW RUN LABORATORIES
CONTENTS
Foreword ....................................iii Abstract. . . . . . . . . . . . . . . . . . . . . . . . . . . . . . . . . . . . v List of Figures .................................viii List of Tables ..................................viii Summary.................................... 1 1. Introduction .................................2 2. Gaps in Vegetation Data ..........................2 3. Gaps in Rock and Mineral Data .......................7 4. Gaps in Soil and Water Data ........................10 5. Conclusions .................................12 Appendix I: Bibliography of Emission Measurements of Rocks,
Minerals, and Soils from 1962 to February 1970 .......13 Appendix U: List of Related Reports .....................15 References ...................................18 Distribution List ................................19
Or
vu
WILLOW RUN LABORATORIES
FIGURES
1. Number of Vegetation Spectra Versus Wavelength ..............4 2. Plant Health Study ................................6 3. Crop Maturity Study ..............................8 4. Number of Soil Spectra Versus Wavelength ..................11
TABLES -
1. Supplement to Vegetation Subject Codes ...................3 2. Geographical Origin of Vegetation Included in the Earth
Resources Spectral Information System ..................5 3. Supplement to Rock and Mineral Subject Codes ...............7 4. Supplement to Soil Subject Codes .......................10 5. Data Gap Summary ..............................12
VIII
• •• .-.••fl.•
I
WILLOW RUN LABORATORIES
DATA GAPS IN THE NASA EARTH RESOURCES SPECTRAL INFORMATION SYSTEM
Technical Report
SUMMARY
The NASA Earth Resources Spectral Information System (ERSIS) has been in-staUed on the Univac 1108 digital computer at the Manned Spacecraft Center to pro-vide spectra of various materials as an aid to scientific investigators in research pertaining to the remote sensing of natural terrestrial targets. This Earth Re-sources Spectral Information System is also operational on the University of Michigan Control Data 1604B computer.
Although ERSIS contains approximately 3000 spectra of natural materials col-lected from the open literature and contractor-report sources, the need still exists for new data, especially in some categories in which the paucity of data is quite pronounced. The purpose of this report is to identify those data categories where the data shortage is greatest relative to our estimate of the required data, so that the general scientific community can be made aware of where contributions are most needed. When insufficient data of a given type exists, we will refer to this condition as a data gap. Data gaps in both organic (vegetation) and inorganic (rocks, minerals, soils, and water) natural materials are discussed in this report.
The following is a summary of the major data gaps: Vegetation data are re-quired (1) at wavelengths greater than 3 Am, (2) on plants native to southern and western U. S. and to foreign countries (especially tropical plants), (3) on spectra related to vigor, and (4) on spectra related to plant maturity. Rocks and mineral data are required (1) in all wavelength regions, but particularly for those less than 8 Am, (2) on the spectral effects of surface-roughness variations, and (3) on the spectral indices of refraction for minerals, particularly in the infrared region. Soils and water data are required (1) for wavelengths greater than 3 Am, (2) on water, ice, and snow, and (3) on the spectral refractive indices of ice.
WILLOW RUN LABORATORIES
1 INTRODUCTION
The NASA Earth Resources Spectral Information System (ERSIS) has been installed on the
UnIvac 1108 digital computer at the Maimed Spacecraft Center to provide spectra of various
materials as an aid to scientific investigators in research pertaining to the remote sensing of
natural terrestrial targets. The Earth Resources Spectral Information System is also opera-
tionalon The University of Michigan Control Data 1604B computer. A report [1] giving a de-
scription of ERSIS and the data it contains is one of three current reports, in addition to this
one, which discuss various aspects of the information system. A second report [2] discusses
the mechanics of step-by-step use of ERSIS and the retrieval program to retrieve data of vari-
ous kinds. To illustrate the type of analysis for which this information system is useful, a
third report [3] has been written describing four data-analysis projects which either use or
improve the use of data from ERSIS.
Although ERSIS contains approximately 3000 spectra of natural materials collected from the
open literature and contractor-report sources, the need still exists for new data, especially in
some categories in which the paucity of data is quite pronounced. The purpose of this report
Is to identify these data categories so that the general scientific community can be made aware
of where contributions are most needed. When insufficient data of a given type exists, we will
refer to this condition as a data gap. Data gaps in both organic (vegetation) and inorganic
(rocks, minerals, soils, and water) natural materials will be discussed.
The following is a summary of the major data gaps. Vegetation data are required (1) at
wavelengths greater than 3 lim, (2) on plants native to southern and western U. S. and to foreign
countries (especially tropical plants), (3) on spectra related to plant vigor, and (4) on spectra
related to plant maturity. Rocks and mineral data are required (1) in all wavelength regions,
but particularly for those less than 8 jim, (2) on the spectral effects of surface-roughness vari-
ations, and (3) on the spectral indices of refraction for minerals, particularly in the infrared
region. Soils and water data are required (1) for wavelengths greater than 3 gm, (2) on water,
ice, and snow, and (3) on the spectral refractive indices of ice.
2 GAPS IN VEGETATION DATA
The appearance of plants and vegetated surfaces to multispectral sensors or to the human
eye depends on the interaction of these surfaces with radiation, which is either reflected sun-
2
WILLOW RUN LABORATORIES
light and skylight or emitted thermal radiation. The precise spectral quality and intensity of
vegetation reflectance and emittance depends on leaf texture, morphology, physiology, chemistry,
soil site, and climate.
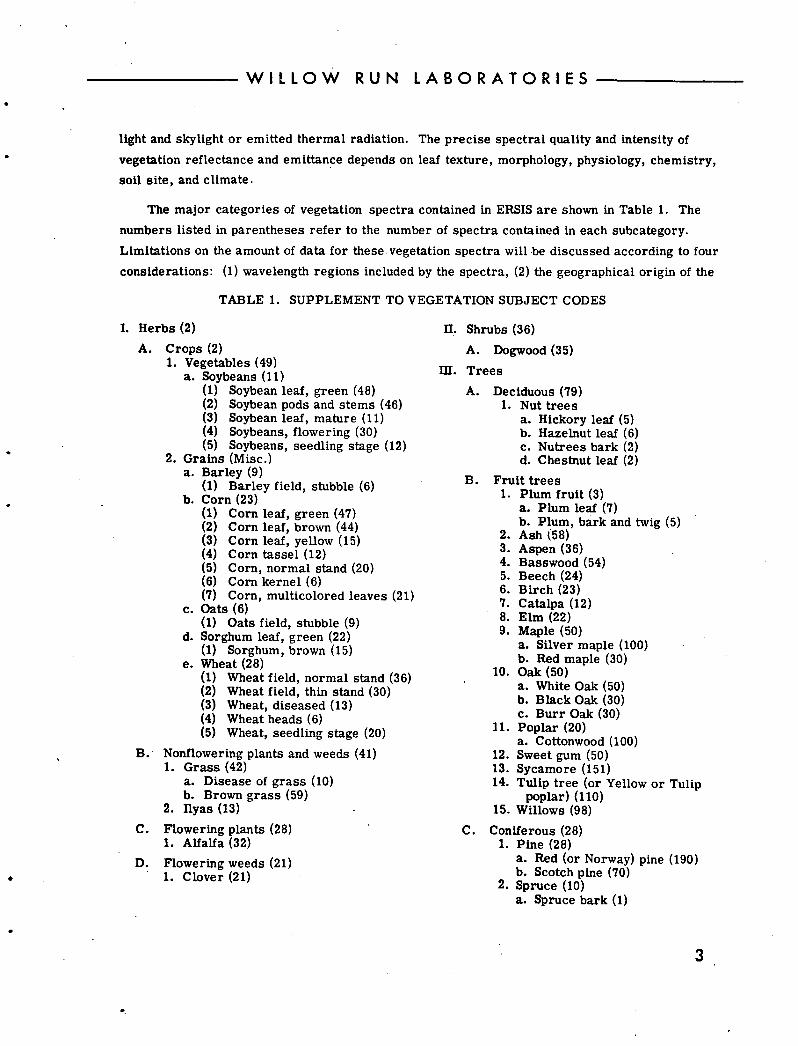
The major categories of vegetation spectra contained in ERSIS are shown in Table 1. The
numbers listed in parentheses refer to the number of spectra contained in each subcategory.
Limitations on the amount of data for these vegetation spectra will be discussed according to four
considerations: (1) wavelength regions included by the spectra, (2) the geographical origin of the
TABLE 1. SUPPLEMENT TO VEGETATION SUBJECT CODES
I. Herbs (2)
A. Crops (2) 1. Vegetables (49)
a. Soybeans (11) (1) Soybean leaf, green (48) (2) Soybean pods and stems (46) (3) Soybean leaf, mature (11) (4) Soybeans, flowering (30) (5) Soybeans, seedling stage (12)
2. Grains (Misc.) a. Barley (9)
(1) Barley field, stubble (6) b. Corn (23)
(1) Corn leaf, green (47) (2) Corn leaf, brown (44) (3) Corn leaf, yellow (15) (4) Corn tassel (12) (5) Corn, normal stand (20) (6) Corn kernel (6) (7) Corn, multicolored leaves (21)
c. Oats (6) (1) Oats field, stubble (9)
d. Sorghum leaf, green (22) (1) Sorghum, brown (15)
e. Wheat (28) (1) Wheat field, normal stand (36) (2) Wheat field, thin stand (30) (3) Wheat, diseased (13) (4) Wheat heads (6) (5) Wheat, seedling stage (20)
B. Nonflowering plants and weeds (41) 1. Grass (42)
a. Disease of grass (10) b. Brown grass (59)
2. Ilyas (13)
C. Flowering plants (28) 1. Alfalfa (32)
D. Flowering weeds (21) 1. Clover (21)
U. Shrubs (36)
A. Dogwood (35)
M. Trees
A. Deciduous (79) I. Nut trees
a. Hickory leaf (5) b. Hazelnut leaf (6) c. Nutrees bark (2) d. Chestnut leaf (2)
B. Fruit trees 1. Plum fruit (3)
a. Plum leaf (7) b. Plum, bark and twig (5)
2. Ash (58) 3. Aspen (36) 4. Basswood (54) 5. Beech (24) 6. Birch (23) 7. Catalpa (12) 8. Elm (22) 9. Maple (50)
a. Silver maple (100) b. Red maple (30)
10. Oak (50) a. White Oak (50) b. Black Oak (30) c. Burr Oak (30)
11. Poplar (20) a. Cottonwood (100)
12. Sweet gum (50) 13. Sycamore (151) 14. Tulip tree (or Yellow or Tulip
poplar) (110) 15. Willows (98)
C. Coniferous (28) I. Pine (28)
a. Red (or Norway) pine (190) b. Scotch pine (70)
2. Spruce (10) a. Spruce bark (1)
3

2500
2000
02
0
1500
z
1000
500
WILLOW RUN LABORATORIES
plant specimens, (3) the number of plants for which plant-health studies have been reported, and
(4) the number of kinds of plants for which spectra have been obtained during various stages of
plant growth (maturity studies).
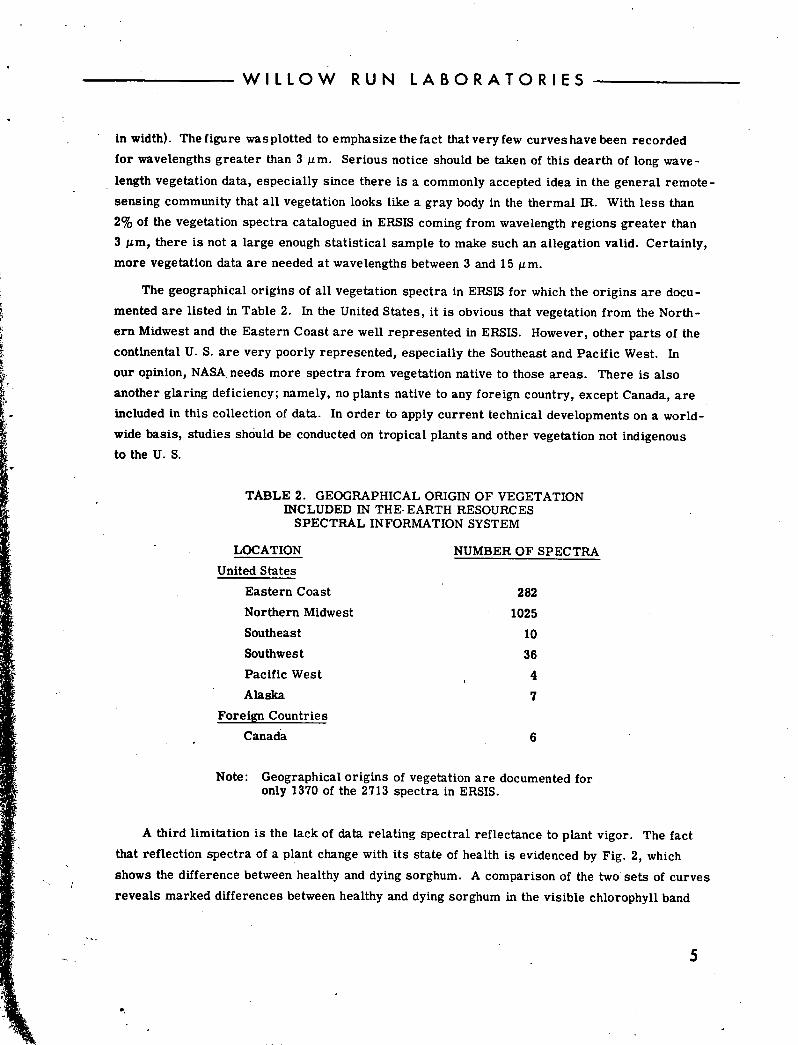
Figure 1 is a histogram showing the number of spectra which are recorded in each 1-jim
wide wavelength interval (except for the two shortest wavelength regions, which are 0.4 and 0.6 Am
3000,-
OIii i i i i i i i i i i t P1 0.4 1 2 3 4 5 6 7 8 9 10 11 12 13 14 15
WAVELENGTH (Am)
FIGURE 1. NUMBER OF VEGETATION SPECTRA VERSUS WAVELENGTH
4
WILLOW RUN LABORATORIES
in width). The figure was plotted to emphasize the fact that very few curves have been recorded
for wavelengths greater than 3 ,im. Serious notice should be taken of this dearth of long wave-
length vegetation data, especially since there is a commonly accepted idea in the general remote-
sensing community that all vegetation looks like a gray body in the thermal JR. With less than
2% of the vegetation spectra catalogued in ERSIS coming from wavelength regions greater than
3 jum, there is not a large enough statistical sample to make such an allegation valid. Certainly,
more vegetation data are needed at wavelengths between 3 and 15 Mm.
The geographical origins of all vegetation spectra in ERSIS for which the origins are docu-
mented are listed in Table 2. In the United States, it is obvious that vegetation from the North-
ern Midwest and the Eastern Coast are well represented in ERSIS. However, other parts of the
continental U. S. are very poorly represented, especially the Southeast and Pacific West. In
our opinion, NASA , needs more spectra from vegetation native to those areas. There is also
another glaring deficiency; namely, no plants native to any foreign country, except Canada, are
included in this collection of data. In order to apply current technical developments on a world-
wide basis, studies should be conducted on tropical plants and other vegetation not indigenous
to the U. S.
TABLE 2. GEOGRAPHICAL ORIGIN OF VEGETATION INCLUDED IN THE EARTH RESOURCES
SPECTRAL INFORMATION SYSTEM
LOCATION TT..1.4 Q4-s4.,..
Eastern Coast
Northern Midwest
Southeast
Southwest
Pacific West
Alaska
Foreign Countries
Canada
NUMBER OF SPECTRA
282
1025
10
36
4
7
6
Note: Geographical origins of vegetation are documented for only 1370 of the 2713 spectra in ERSIS.
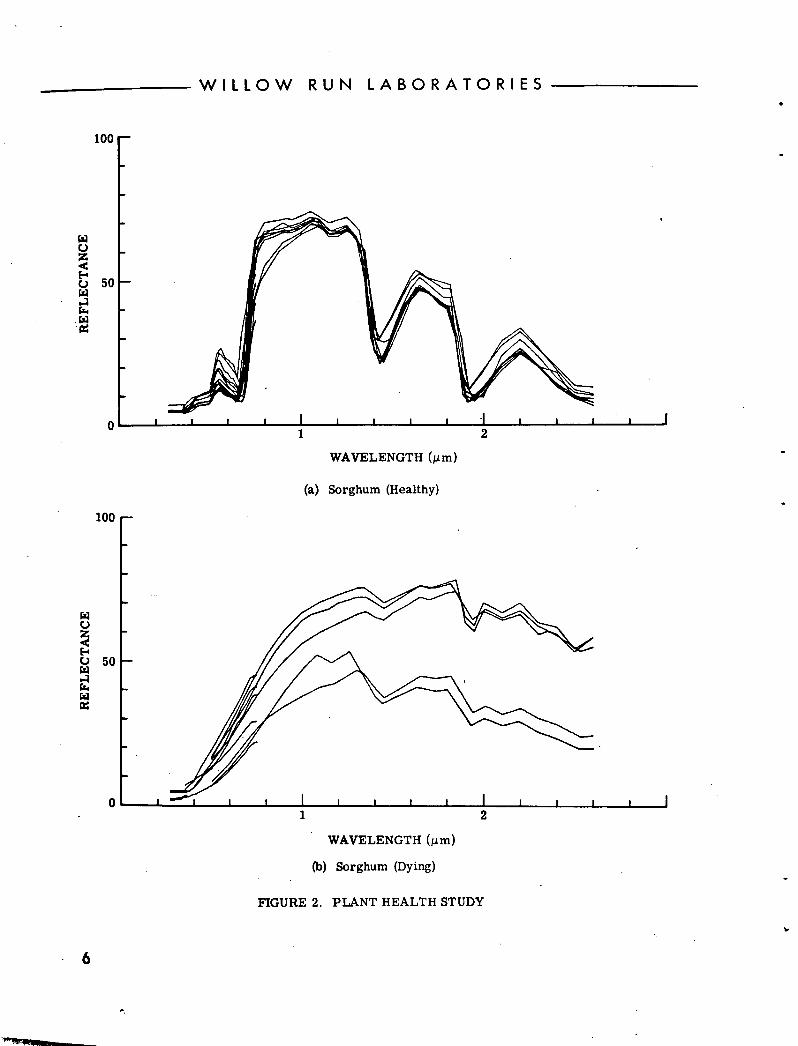
A third limitation is the lack of data relating spectral reflectance to plant vigor. The fact
that reflection spectra of a plant change with its state of health is evidenced by Fig. 2, which
shows the difference between healthy and dying sorghum. A comparison of the two sets of curves
reveals marked differences between healthy and dying sorghum in the visible chlorophyll band
0 z
o 50
WILLOW RUN LABORATORIES
100
01 2
WAVELENGTH (tim)
(a) Sorghum (Healthy)
100
0
0 50
01 2
WAVELENGTH (tim)
(b) Sorghum (Dying)
FIGURE 2. PLANT HEALTH STUDY
1.
6
WILLOW RUN LABORATORIES
and in the near-IR cellulose band. Diseased plants should exhibit band reflectances which are
intermediate to these two extremes of plant health. Currently, there are only three plant-health
studies represented in the vegetation spectra. More of these studies need to be conducted be-
fore remote sensing can yield its optimum assistance to agriculturalists and foresters.
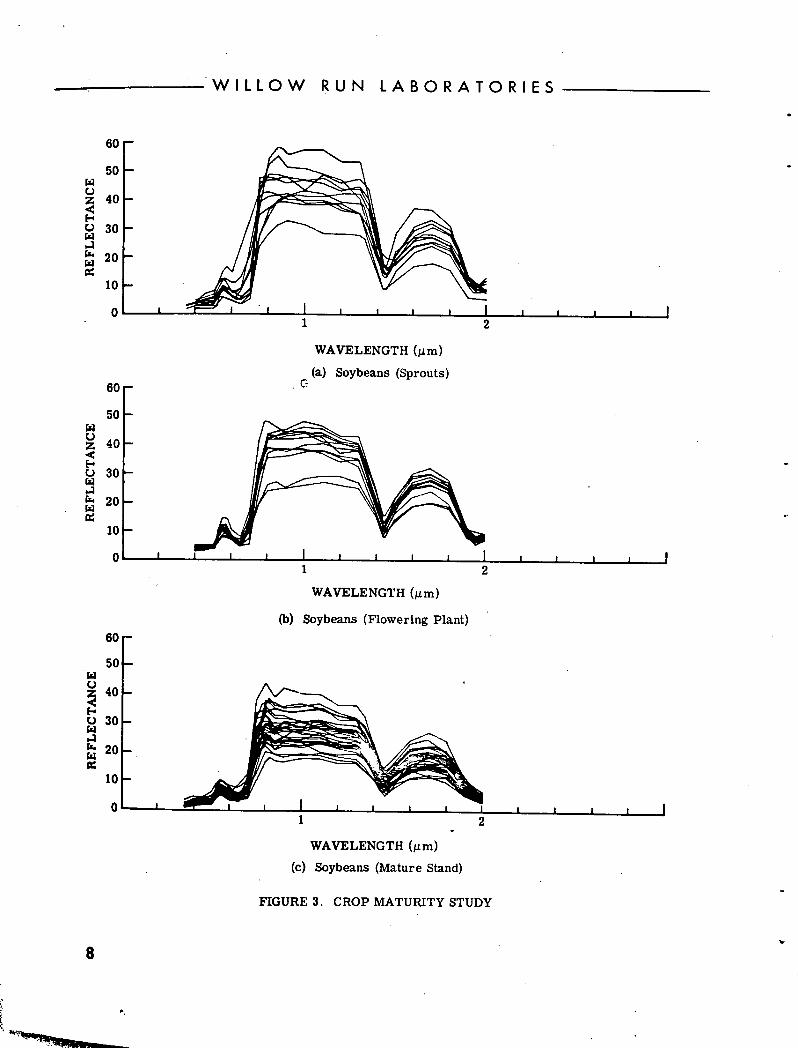
Finally, more crop-maturity studies are needed of the type shown in Fig. 3, which displays
reflectances for three sets of soybeans in various stages of maturity. As the soybean matures,
the reflectance decreases. Studies of this nature have been completed for many of the deciduous
tree specimens, but there have been few such studies for crops relating stage-of-growth to re-
flectance. This is another type of information which can be quite important for agricultural re-
mote sensing.
3 GAPS IN ROCK AND MINERAL DATA
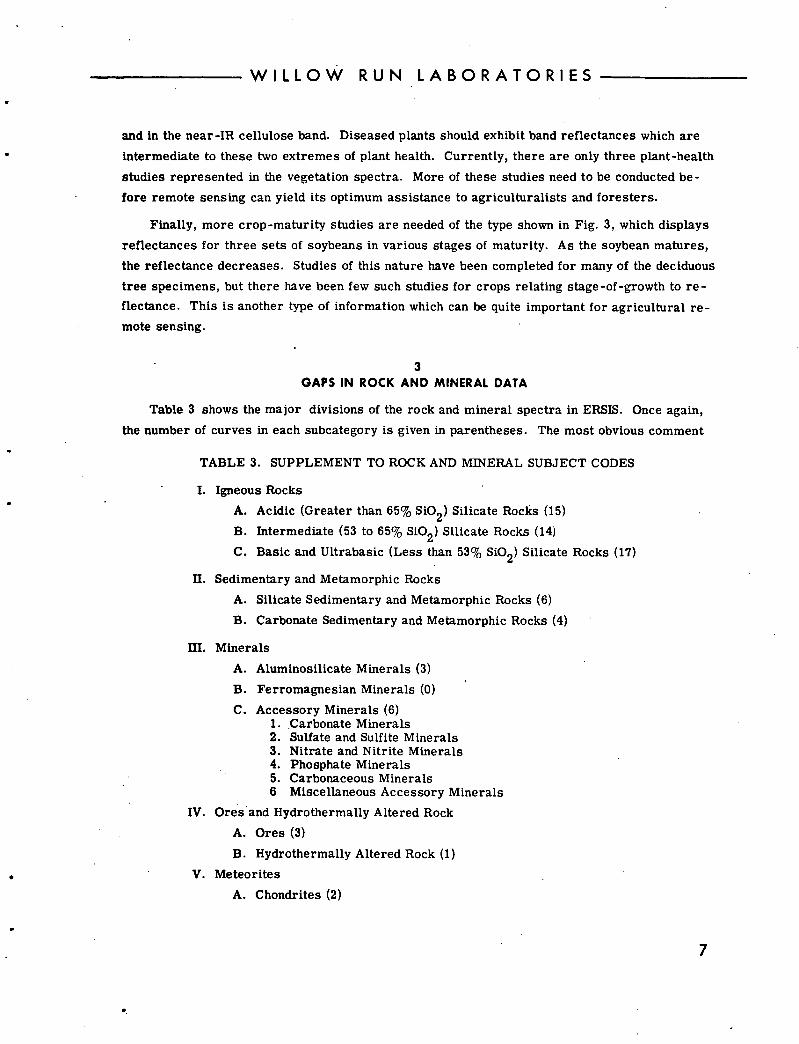
Table 3 shows the major divisions of the rock and mineral spectra in ERSIS. Once again,
the number of curves in each subcategory is given in parentheses. The most obvious comment
TABLE 3. SUPPLEMENT TO ROCK AND MINERAL SUBJECT CODES
I. Igneous Rocks
A. Acidic (Greater than 65% Si0 2 ) Silicate Rocks (15)
B. Intermediate (53 to 65% SiO2 ) Silicate Rocks (14)
C. Basic and Ultrabasic (Less than 53% Si0 2 ) Silicate Rocks (17)
H. Sedimentary and Metamorphic Rocks
A. Silicate Sedimentary and Metamorphic Rocks (6)
B. Carbonate Sedimentary and Metamorphic Rocks (4)
Ill. Minerals
A. Aluminosilicate Minerals (3)
B. Ferromagnesian Minerals (0)
C. Accessory Minerals (6) 1. Carbonate Minerals 2. Sulfate and Sulfite Minerals 3. Nitrate and Nitrite Minerals 4. Phosphate Minerals 5. Carbonaceous Minerals 6 Miscellaneous Accessory Minerals
IV. Ores and Hydrothermally Altered Rock
A. Ores (3)
B. Hydrothermally Altered Rock (1)
V. Meteorites
A. Chondrites (2)
7
60
50
0 z 40
30
10
01 2
WILLOW RUN LABORATORIES
WAVELENGTH (nm)
(a) Soybeans (Sprouts) 60
50
0 Z 40
030
20
10
01 2
WAVELENGTH (gm)
(b) Soybeans (Flowering Plant)
60
50 F4 0 40 Eq 0 30
20
10
01 2
WAVELENGTH (gm)
(c) Soybeans (Mature Stand)
FIGURE 3. CROP MATURITY STUDY
8
WILLOW RUN LABORATORIES
about these data is that none of the groups listed in the figure is very complete. There are only
about 100 rock spectra in ERSIS, and many more spectra are needed of all rock types. In an
effort to find more data, a literature search was made in Chemical Abstracts for all of the re-
cent emission data made on rocks, minerals, and soils. Appendix I gives the results of that
search. Most of this data is already in ERSIS, and that quantitative data which has not been added
to date will be incorporated in next year's work. The search did not include infrared-reflection
measurements. The conclusion derived from this search is that not enough spectra are being
measured for rocks, minerals, and soils in the laboratory.
Besides this general need for more curves of all the rocks and minerals, there are four
more specific gaps in the data compilation. First, only 9 mineral spectra are presently in
ERSIS. This is woefully inadequate for many research applications. Since minerals are the
basic units of rock composition, it is imperative that an understanding of the mineral spectra
be first understood; then we can determine the meaning of the various rock spectra from a com-
positional standpoint. Although there has been a nominal amount of research into the absorp-
tion spectra of minerals, the nature of remote-sensing problems dictates that emissivity and
reflection spectra of the minerals be known, since these are the physical properties actually measured in a remote-sensing situation.
Second, there is a need for rock and mineral data in the ultraviolet, visible, and near-JR
wavelength regions. All but about 15 of the spectra listed in Table 3 are in the thermal-JR re-
gion, the reverse of the situation concerning the vegetation data. Although the thermal IR con-
tains the reststrahlen bands of rocks and minerals, there is still important information to be
gained in the shorter wavelength regions. For instance, there are strong electronic transitions
in the ultraviolet spectra of many rocks and minerals, and these transitions are only recently
being exploited by remote sensors. Also, the visible and near-JR regions are important be-cause the reflectances of most rocks exhibit a fairly predictable dependence on surface rough-
ness (or gain size) in these regions.
Thirdly, there should be more information in ERSIS showing the effect of grain size (or
surface roughness) on reflection and emission spectra. Only a few curves presently in ERSIS
represent spectra of powders or sands, and most of the rocks have spectra for only one surface
condition.
Finally, there is a need for data in the infrared wavelength region on the spectral refractive
indices of the minerals. Presently, the indices of only two minerals, quartz and calcite, are
known in the JR. In most of the theoretical models used to determine the effects of gram size,
composition, and temperature gradients on the spectra of powdered or granulated target sur-
faces, the indices of refraction of minerals play an essential role. Although a determination of
the complex indices of natural mineral crystals is more difficult than direct emission or re-
9
WILLOW RUN LABORATORIES
fiection measurements, the results are needed before field spectra of rocks and minerals can
be understood to the point at which these effects can be separated according to their influence
on the spectra.
4 GAPS IN SOIL AND WATER DATA
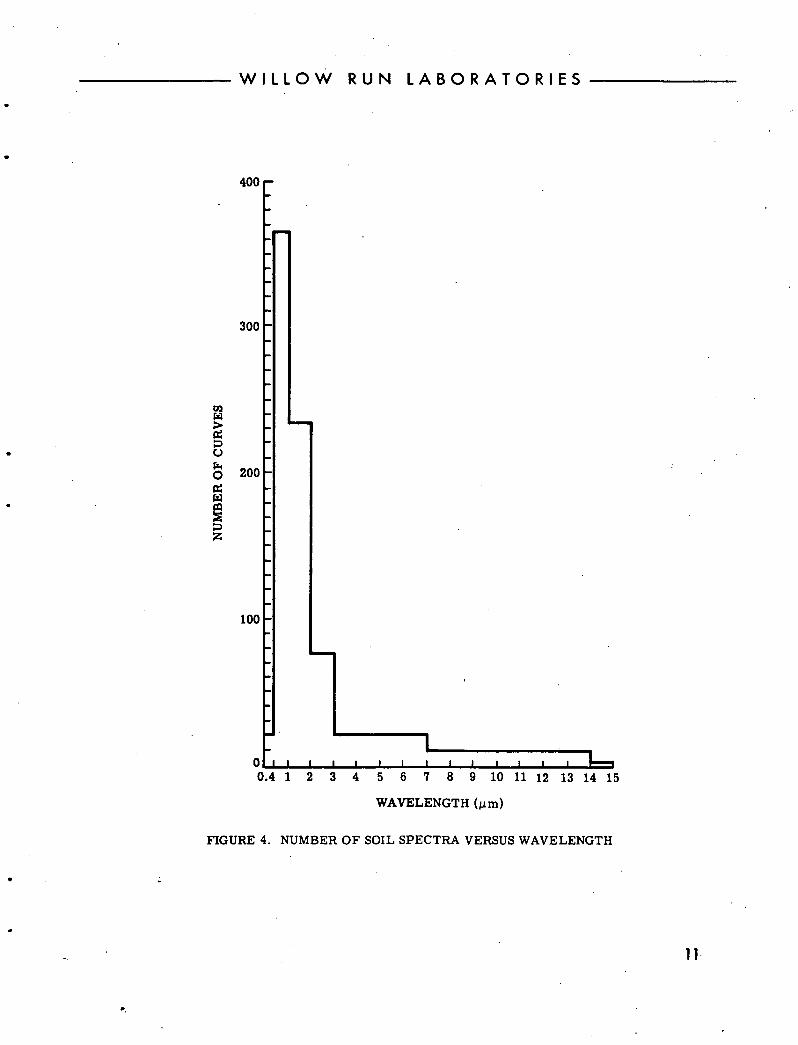
Table 4 lists the categories into which the soils are divided. The serious gap in these soil
spectra is thermal-infrared data. Figure 4 shows a breakdown of the number of soil spectra
vs. 1-.Lm wavelength intervals, from which the lack of information for wavelengths greater than
3 Am is obvious. The nine curves which do extend from 7 to 14 urn are infrared reflection
spectra. As can be seen from the emission bibliography in Appendix I, no soil emission spec-
trahave been found in the open literature. Although measurement of emission spectra for par-
ticulate media is more difficult than for solids (primarily because of temperature gradients),
this data would be a welcome addition to ERSIS.
Concerning the status of water spectra in ERSIS there is a need for almost any well-
documented water curves. Most of the spectra now included are field data and are generally
not of good quality. More literature searches are planned to update ERSIS with more recent
publications on water, ice, and snow. The spectral index of refraction of water is known and
will be incorporated into the system. The spectral index of ice is not known, however, and
should be determined, since ice is a frequent remote-sensing target.
TABLE 4. SUPPLEMENT TO SOIL SUBJECT CODES
I. Soil Series
H. Soil Texture A. Coarse Texture
1. Sand 2. Loamy Sand
B. Moderately Coarse Textured 1. Sandy Loam 2. Fine Sandy Loam
C. Medium Textured 1. Loam 2. Silt Loam 3. Silt
D. Moderately Fine Textured 1. Clay Loam 2. Sandy Clay Loam 3. Silty Clay Loam
E. Fine Textured 1. Sandy Clay 2. Silty Clay 3. Clay
Ill. Moisture Content
A. Dry
B. Damp
C. Saturated
IV. Soil Chemicals
V. Other Soil Constituents
A. Organic Material
B. Gravel (less than 3 in. diameter)
C. Cobbles (3 to 10 in. diameter)
D. Stones (Greater than 10 in. diameter)
VI. State of Cultivation
A. Cultivated
B. Uncultivated
10
Go
C)
200
z
400
300
100
rl
WILLOW RUN LABORATORIES
0.4 1 2 3 4 5 6 7 8 9 10 11 12 13 14 15
WAVELENGTH (gm)
FIGURE 4. NUMBER OF SOIL SPECTRA VERSUS WAVELENGTH
WILLOW RUN LABORATORIES
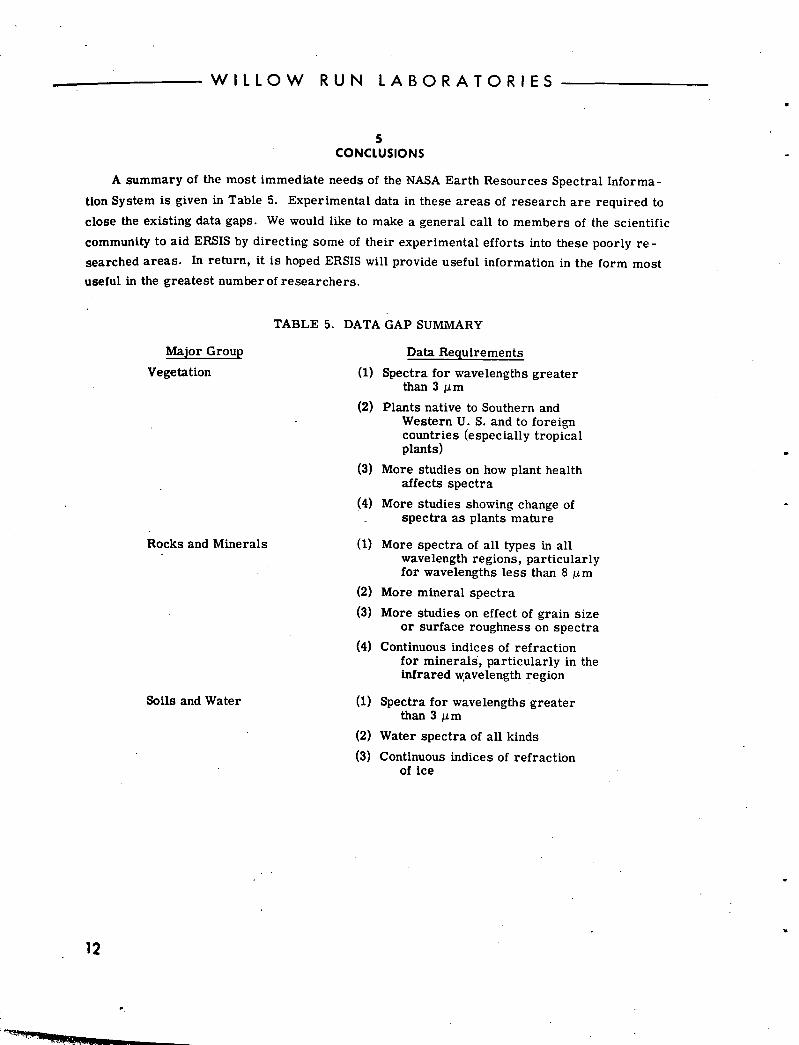
5 CONCLUSIONS
A summary of the most immediate needs of the NASA Earth Resources Spectral Informa-
tion System is given in Table 5. Experimental data in these areas of research are required to
close the existing data gaps. We would like to make a general call to members of the scientific
community to aid ERSIS by directing some of their experimental efforts into these poorly re-
searched areas. In return, it is hoped ERSIS will provide useful information in the form most
useful in the greatest number of researchers.
TABLE 5. DATA GAP SUMMARY
Major Group
Vegetation (1)
(2)
(3)
(4)
Rocks and Minerals (1)
(2)
(3)
(4)
Soils and Water (1)
(2)
(3)
Data Requirements
Spectra for wavelengths greater than 3 jim
Plants native to Southern and Western U. S. and to foreign countries (especially tropical plants)
More studies on how plant health affects spectra
More studies showing change of spectra as plants mature
More spectra of all types in all wavelength regions, particularly for wavelengths less than 8 gm
More mineral spectra
More studies on effect of grain size or surface roughness on spectra
Continuous indices of refraction for minerals, particularly in the infrared wavelength region
Spectra for wavelengths greater than 3 gm
Water spectra of all kinds
Continuous indices of refraction of Ice
WILLOW RUN LABORATORIES
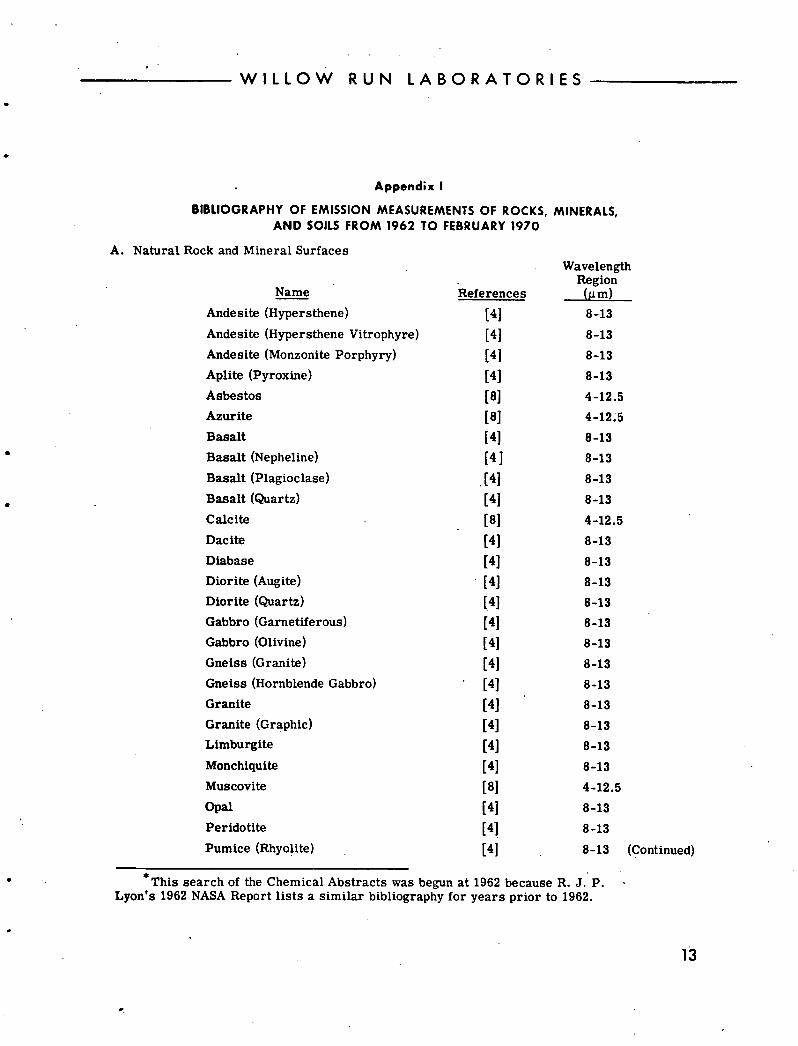
Appendix I
BIBLIOGRAPHY OF EMISSION MEASUREMENTS OF ROCKS, MINERALS,
AND SOILS FROM 1962 TO FEBRUARY 1970
A. Natural Rock and Mineral Surfaces Wavelength
Region Name References (,m)
Andesite (Hypersthene) [4] 8-13 Andesite (Hypersthene Vitrophyre) [4] 8-13 Andesite (Monzonite Porphyry) [4] 8-13 Aplite (Pyroxine) [4] 8-13 Asbestos [8] 4-12.5 Azurite [8] 4-12;5 Basalt [4] 8-13
• Basalt (Nepheline) [4] 8-13 Basalt (Plagioclase) [4] 8-13 Basalt (Quartz) [4] 8-13 Calcite [8] 4-12.5 Daclte [4] 8-13 Dlabase [4] 8-13 Diorite (Augite) [4] 8-13 Diorite (Quartz) [4] 8-13 Gabbro (Garnetiferous) [4] 8-13 Gabbro (Olivine) [4] 8-13 Gneiss (Granite) [4] 8-13 Gneiss (Hornblende Gabbro) [4] 8-13 Granite [4] 8-13 Granite (Graphic) [4] 8-13 Limburgite [4] 8-13 Monchiquite [4] 8-13 Muscovite [8] 4-12.5 Opal [4] 8-13 Peridotite [4] 8-13 Pumice (Rhyolite) [4] 8-13 (Continued)
* This search of the Chemical Abstracts was begun at 1962 because R. J. P.Lyon's 1962 NASA Report lists a similar bibliography for years prior to 1962.
13
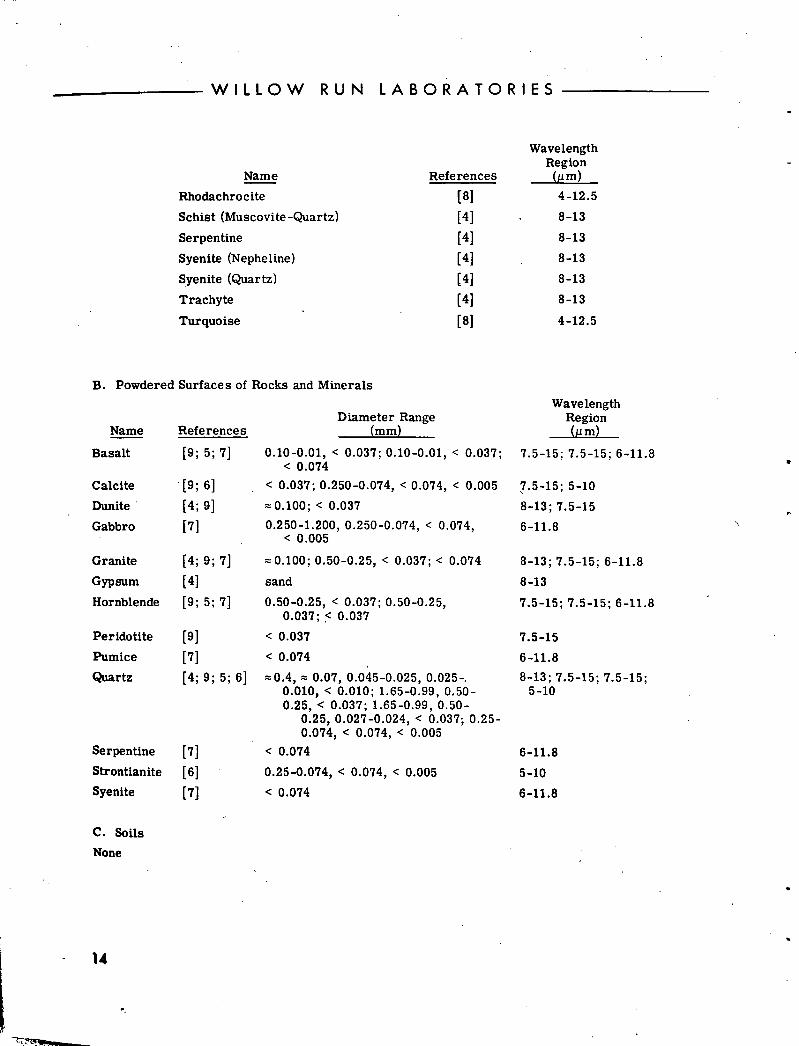
WILLOW RUN LABORATORIES
Wavelength Region
Name References (jim)
Rhodachrocite (8] 4-12.5
Schist (Muscovite-Quartz) [4] . 8-13 Serpentine [4] 8-13
Syenite (Nepheline) [4] 8-13
Syenite (Quartz) [4] 8-13
Trachyte [4] 8-13
Turquoise [8] 4-12.5
B. Powdered Surfaces of Rocks and MineralsWavelength
Diameter Range Region Name References (mm) (jim)
Basalt [9; 5; 71 0.10-0.01, < 0.037; 0.10-0.01, < 0.037; 7.5-15; 7.5-15; 6-11.8 < 0.074
Calcite [9; 6] < 0.037; 0.250-0.074, <0.074, < 0.005 7.5-15; 5-10 Dunite [4; 91 0.100; < 0.037 8-13; 7.5-15 Gabbro [7] 0.250-1.200, 0.2500.074, < 0.074, 6-11.8
< 0.005
Granite [4; 9; 7] 0.100; 0.50-0.25, < 0.037; < 0.074 8-13; 7.5-15; 6-11.8 Gypsum [4] sand 8-13
Hornblende [9; 5; 7] 0.50-0.25, < 0.037; 0.50-0.25, 7.5-15; 7.5-15; 6-11.8 0.037; < 0.037
Peridotite [9] < 0.037 7.5-15 Pumice [7] < 0.074 6-11.8
Quartz [4; 9; 5; 6] 0.4, 0.07, 0.045-0.025, 0.025-, 8-13; 7.5-15; 7.5-15; 0.010, < 0.010; 1.65-0.99, 0.50- 5-10 0.25, < 0.037; 1.65-0.99, 0.50-
0.25, 0.027-0.024, < 0.037; 0.25-0.074, < 0.074, < 0.005
Serpentine [7] < 0.074 6-11.8 Strontianite [6] 0.25-0.074, < 0.074, < 0.005 5-10 Syenite [7] < 0.074 6-11.8
C. Soils None
14
WILLOW RUN LABORATORIES
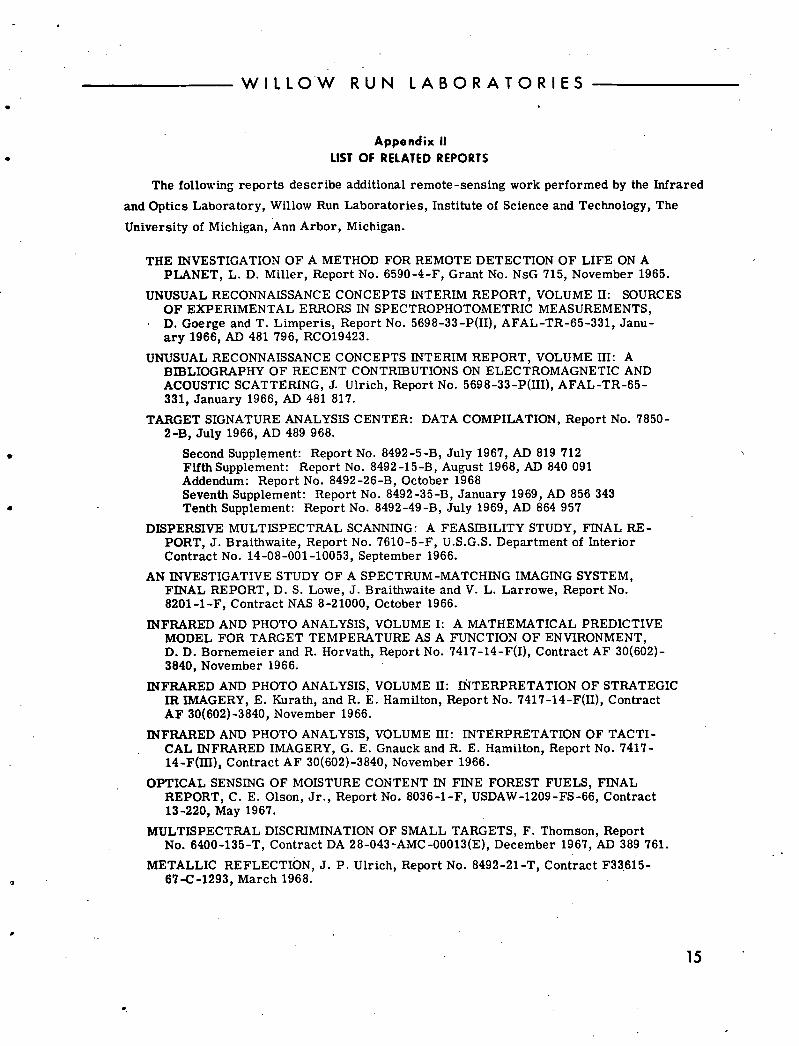
Appendix II
LIST OF RELATED REPORTS
The following reports describe additional remote-sensing work performed by the Infrared
and Optics Laboratory, Willow Run Laboratories, Institute of Science and Technology, The
University of Michigan, Ann Arbor, Michigan.
THE INVESTIGATION OF A METHOD FOR REMOTE DETECTION OF LIFE ON A PLANET, L. D. Miller, Report No. 6590-4-F, Grant No. NsG 715, November 1965.
UNUSUAL RECONNAISSANCE CONCEPTS INTERIM REPORT, VOLUME II: SOURCES OF EXPERIMENTAL ERRORS IN SPECTROPHOTOMETRIC MEASUREMENTS, D. Goerge and T. Limperis, Report No. 5698-33-P(II), AFAL-TR-65-331, Janu-ary 1966, AD 481 796, RCO19423.
UNUSUAL RECONNAISSANCE CONCEPTS INTERIM REPORT, VOLUME III: A BIBLIOGRAPHY OF RECENT CONTRIBUTIONS ON ELECTROMAGNETIC AND ACOUSTIC SCATTERING, J. Ulrich, Report No. 5698-33-P(III), AFAL-TR-65-331, January 1966, AD 481 817.
TARGET SIGNATURE ANALYSIS CENTER: DATA COMPILATION, Report No. 7850-2-B, July 1966, AD 489 968.
Second Supplement: Report No. 8492-5-B, July 1967, AD 819 712 Fifth Supplement: Report No. 8492-15-B, August 1968, AD 840 091 Addendum: Report No. 8492-26-B, October 1968 Seventh Supplement: Report No. 8492-35-B, January 1969, AD 856 343 Tenth Supplement: Report No. 8492-49-B, July 1969, AD 864 957
DISPERSIVE MULTISPECTRAL SCANNING: A FEASIBILITY STUDY, FINAL RE-PORT, J. Braithwaite, Report No. 7610-5-F, U.S.G.S. Department of Interior Contract No. 14-08-001-10053, September 1966.
AN INVESTIGATIVE STUDY OF A SPECTRUM-MATCHING IMAGING SYSTEM, FINAL REPORT, D. S. Lowe, J. Braithwaite and V. L. Larrowe, Report No. 8201-1-F, Contract NAS 8-21000, October 1966.
INFRARED AND PHOTO ANALYSIS, VOLUME I: A MATHEMATICAL PREDICTIVE MODEL FOR TARGET TEMPERATURE AS A FUNCTION OF ENVIRONMENT, D. D. Bornemeier and R. Horvath, Report No. 7417-14-F(I), Contract AF 30(602)-3840, November 1966.
INFRARED AND PHOTO ANALYSIS, VOLUME II: INTERPRETATION OF STRATEGIC m IMAGERY, E. Kurath, and R. E. Hamilton, Report No. 7417-14-F(II), Contract AF 30(602) -3840, November 1966.
INFRARED AND PHOTO ANALYSIS, VOLUME ifi: INTERPRETATION OF TACTI-CAL INFRARED IMAGERY, G. E. Gnauck and R. E. Hamilton, Report No. 7417-14-F(m), Contract AF 30(602)-3840, November 1966.
OPTICAL SENSING OF MOISTURE CONTENT IN FINE FOREST FUELS, FINAL REPORT, C. E. Olson, Jr., Report No. 8036-1-F, USDAW-1209-FS-66, Contract 13-220, May 1967.
MULTISPECTRAL DISCRIMINATION OF SMALL TARGETS, F. Thomson, Report No. 6400-135-T, Contract DA 28-043-AMC-00013(E), December 1967, AD 389 761.
METALLIC REFLECTION, J. P. Ulrich, Report No. 8492-21-T, Contract F33615-67-C-1293, March 1968.
15
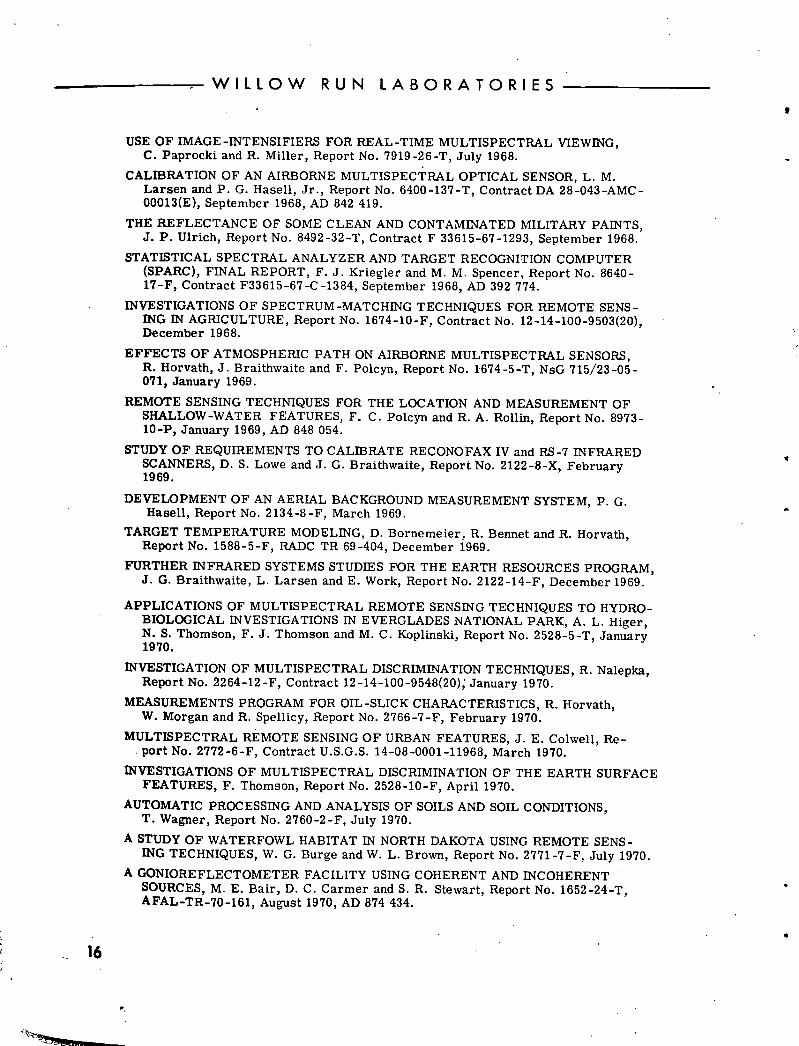
WILLOW RUN LABORATORIES
USE OF IMAGE-INTENSIFIERS FOR REAL-TIME MULTISPECTRAL VIEWING, C. Paprocki and R. Miller, Report No. 7919-26-T, July 1968.
CALIBRATION OF AN AIRBORNE MULTISPECTRAL OPTICAL SENSOR, L. M. Larsen and P. G. Hasell, Jr., Report No. 6400-137-T, Contract DA 28-043-AMC-00013(E), September 1968, AD 842 419.
THE REFLECTANCE OF SOME CLEAN AND CONTAMINATED MILITARY PAINTS, J. P. Ulrich, Report No. 8492-32-T, Contract F 33615-67-1293, September 1968.
STATISTICAL SPECTRAL ANALYZER AND TARGET RECOGNITION COMPUTER (SPARC), FINAL REPORT, F. J. Kriegler and M. M. Spencer, Report No. 8640-17-F, Contract F33615-67-C-1384, September 1968, AD 392 774.
INVESTIGATIONS OF SPECTRUM-MATCHING TECHNIQUES FOR REMOTE SENS-ING IN AGRICULTURE, Report No. 1674-10-F, Contract No. 12-14-100-9503(20), December 1968.
EFFECTS OF ATMOSPHERIC PATH ON AIRBORNE MULTISPECTBAL SENSORS, R. Horvath, J. Braithwaite and F. Polcyn, Report No. 1674-5-T, NsG 715/23-05-071, January 1969.
REMOTE SENSING TECHNIQUES FOR THE LOCATION AND MEASUREMENT OF SHALLOW-WATER FEATURES, F. C. Polcyn and R. A. Rollin, Report No. 8973-10-P, January 1969, AD 848 054.
STUDY OF REQUIREMENTS TO CALIBRATE RECONOFAX IV and RS-7 INFRARED SCANNERS, D. S. Lowe and J. G. Braithwaite, Report No. 2122-8-X, February 1969.
DEVELOPMENT OF AN AERIAL BACKGROUND MEASUREMENT SYSTEM, P. G. Hasell, Report No. 2134-8-F, March 1969.
TARGET TEMPERATURE MODELING, D. Bornemeier, R. Bennet and R. Horvath, Report No. 1588-5-F, RADC TR 69-404, December 1969.
FURTHER INFRARED SYSTEMS STUDIES FOR THE EARTH RESOURCES PROGRAM, J. G. Braithwaite, L. Larsen and E. Work, Report No. 2122-14-F, December 1969.
APPLICATIONS OF MULTISPECTRAL REMOTE SENSING TECHNIQUES TO HYDRO-BIOLOGICAL INVESTIGATIONS IN EVERGLADES NATIONAL PARK, A. L. Higer, N. S. Thomson, F. J. Thomson and M. C. Koplinski, Report No. 2528-5-T, January 1970.
INVESTIGATION OF MULTISPECTRAL DISCRIMINATION TECHNIQUES, R. Nalepka, Report No. 2264-12-F, Contract 12-14-100-9548(20); January 1970.
MEASUREMENTS PROGRAM FOR OIL-SLICK CHARACTERISTICS, R. Horvath, W. Morgan and R. Spellicy, Report No. 2766-7-F, February 1970.
MULTISPECTRAL REMOTE SENSING OF URBAN FEATURES, J. E. Colwell, Re-. port No. 2772-6-F, Contract U.S.G.S. 14-08-0001-11968, March 1970.
INVESTIGATIONS OF MULTISPECTRAL DISCRIMINATION OF THE EARTH SURFACE FEATURES, F. Thomson, Report No. 2528-10-F, April 1970.
AUTOMATIC PROCESSING AND ANALYSIS OF SOILS AND SOIL CONDITIONS, T. Wagner, Report No. 2760-2-F, July 1970.
A STUDY OF WATERFOWL HABITAT IN NORTH DAKOTA USING REMOTE SENS-ING TECHNIQUES, W. G. Burge and W. L. Brown, Report No. 2771-7-F, July 1970.
A GONIOREFLECTOMETER FACILITY USING COHERENT AND INCOHERENT SOURCES, M. E. Bair, D. C. Carmer and S. R. Stewart, Report No. 1652-24-T, A FAL-TR-70-161, August 1970, AD 874 434.
16
WILLOW RUN LABORATORIES
ATMOSPHERIC EFFECTS ON INFRARED MULTISPECTRAL SENSING OF SEA-SURFACE TEMPERATURE FROM SPACE, D. Anding and R. Kauth, Report No. 2676-4-P, August 1970.
ANALYSTS OF POLARIZATION AND THERMAL PROPERTIES OF TARGETS AND BACKGROUNDS, Report No. 3221-11-P, Contract No. F33615-70-C -1123, August 1970.
REPORTS ON CONTRACT NAS9 -9784
OPTICAL TRANSFER TECHNIQUES FOR OPTICAL SCANNERS, J. Braithwaite, E. Work, Report No. 3165-21-T, in publication.
STUDIES OF SPECTRAL DISCRIMINATION, W. A. Malila, R. Turner, R. Crane, C. Omarzu, Report No. 3165-22-T, in publication.
DETECTOR UTILIZATION IN LINE SCANNERS, L. Larsen, Report No. 3165-29-T, in publication.
A PROTOTYPE HYBRID MULTISPECTRAL PROCESSOR WITH HIGH THROUGHPUT CAPABILITY, F. Kriegler, R. Marshall, Report No. 3165-23-T, in publication.
DATA PROCESSING DISPLAYS OF MULTISPECTRAL DATA, F. Kriegler, R. Marshall, Report No. 3165-28-T, in publication.
CALIBRATION OF MULTISPECTRAL SCANNERS, J. Braithwaite, Report No. 3165-27-L, in publication.
INVESTIGATIONS OF MULTISPECTRAL SENSING OF CROPS, R. Nalepka, et al., Report No. 3165-30-T, in publication.
INVESTIGATION OF SHALLOW WATER FEATURES, F. Polcyn, et al., Report No. 3165-31-T, in publication.
THE NASA EARTH RESOURCES SPECTRAL INFORMATION SYSTEM: A DATA COMPILATION, V. Leeman, et al., Report No. 3165-24-T, in publication.
RETRIEVAL-ANALYSIS PROCEDURES FOR THE NASA EARTH RESOURCES SPECTRAL INFORMATION SYSTEM, V. Leeman, et al., Report No. 3165-32-T, in publiction.
REMOTE SENSING DATA ANALYSIS PROJECTS ASSOCIATED WITH THE NASA EARTH RESOURCES SPECTRAL INFORMATION SYSTEM, R. Vincent, et al., Report No. 3165-26-T, in publication.
INVESTIGATIONS RELATED TO MULTISPECTRAL IMAGING SYSTEMS FOR RE-MOTE SENSING, J. Erickson, Report No. 3165-17-P, in publication.
17
WILLOW RUN LABORATORIES
REFERENCES
1. V. Leeman, D. Earing, and R. Vincent, Description and Contents of the NASA Earth Resources Spectral Information System: Data Compilation, Report No. 3165-24-T, Willow Run Laboratories of the Institute of Science and Technology, The University of Michigan, Ann Arbor (in preparation).
2. V. Leeman and D. Earing, Expanded Retrieval Analysis System for the NASA Earth Resources Spectral Information System, Report No. 3165-32--T, Willow Run Laboratories of the Institute of Science and Technology, The University of Michi-gan, Ann Arbor (in preparation).
3. R. K. Vincent, et al., Remote Sensing Data Analysis Projects Associated with The NASA Earth Resources Spectral Information System, Report No. 3165-26-T, Willow Run Laboratories of the Institute of Science and Technology, The University of Michigan, Ann Arbor (in preparation).
4. R. J. P. Lyon, Evaluation of IR Spectrophotometry for Compositional Analysis of Lunar and Planetary Soils: Rough and Powdered Surfaces, Final Report Part II, NASA Contract NASr-49(04), Stanford Research Institute, Stanford University, California, 1964.
5. J. E. Conel, J. of Geophys. Res., Vol. 74. 1969, p. 1614.
6. G. R. Hunt and R. K. Vincent, J. of Geophys. Res., Vol. 73, 1968, p. 6039.
7. L. M. Logan and G. R. Hunt, Air Force Cambridge Research Laboratories, submitted to J. of Geophys. Res., 1970.
8. M. J. D. Low, Nature, Vol. 208, 1965, p. 1089.
9. J. E. Conel, Emission Spectra of Silicates in the Spectral Region 8-14 Am and Application to Remote Compositional Analysis of the Moon's Surface, presented at Joint Conference of Amer. Chem. Soc. and Soc. for Applied Spectros., Anaheim, California, 1967.
I
18
WILLOW RUN LABORATORIES
DISTRIBUTION LIST
NASA Manned Spacecraft Center Dr. Charles E. Poulton Earth Resources Division Range Management Houston, Texas 77058 School of Agriculture
ADFN: L. B. York lIT, Contract: HAS 9-9784 4 Oregon State University Corvallis, Oregon 97331
NASA Manned Spacecraft Center Mr. Robert MacDonald Space Sciences Procurement Branch Laboratories of Agricultural Remote Sensing Houston, Texas 77058 McClure Research Park ATTN: R. F. LaMere B8321 (S55), Contract: HAS 9-9784 1 1220 Potter Drive
West Lafayette, Indiana 47906 Dr. Archibald Park Chief, Earth Resources Survey Program Mr. H. C. Heller/Dr. P. Weber NASA Headquarters Pacific Southwest Forest and Range Experiment Station Washington, D. C. 1 U. S. Forest Service
Dr. Robert MillerP.O. Box 245 Berkeley, California 94701
U. S. Dept. of Agriculture Washington, D. C. 1 Mr. Sid Whitley
NASA Manned Spacecraft Center Dr. Craig Wiegand Houston, Texas 77001 U. S. Dept. of Agriculture Agricultural Research Service Mr. Victor I. Myers Soil and Water Conservation Research Division Director, Remote Sensing Institute P.O. Box 267 South Dakota State University Weslaco, Texas 78596 1 Agriculture Engineering Building
Brookings, S. D. 57006 Dr. Arch C. Gerlach U. S. Dept. of Interior Mr. Marvin Bolter Geological Survey Chief, Earth Observations Division Washington, D.C. 20242 1 NASA Manned Spacecraft Center
Houston, Texas 77058 Dr. William Hemphill USGS Harvey K. Nelson Branch of Theoretical Geophysics U. S. Department of Interior 2221 Jefferson Davis Highway Arlington, Virginia 22202 1
Fish and Wildlife Service Bureau of Sport Fisheries and Wildlife Northern Prairie Wildlife Research Center
Mr. C. J. Robinove Jamestown, N. D. 58401 Code 4032 0001 Water Resources Division Richard Driscoll U. S. Geological Survey Forest Service Washington, D. C. 20242 1 U. S. Dept. of Agriculture
240 West Prospect St. Dr. Raymond W. Fary Fort Collins, Colorado U. S. Dept. of Interior Geological Survey 801 19th Street, N. W. Room 1032
A. E. Coker U. S. Dept. of Interior, Geological Survey
Washington, D. C. 20242 1 Water Resources Division
Mr. Charles Withington500 Sack Street Tampa, Florida 33602
U. S. Dept. of Interior Geological Survey Kenneth Watson 801 19th Street, N. W. U. S. Geological Survey Washington, D. C. 20242 1 Branch of Regional Geophysics
Denver Federal Center, Bldg 25
Mr. U. Deutsch Denver, Colorado 80225 U. S. Dept. of Interior Geological Survey Mr. Edward 0. Zeitler TF/12 801 19th Street, N. W. Chief, Earth Resources Washington, D. C. 20242 1 Research Data Facility
NASA Manned Spacecraft Center Dr. Jules D. Friedman Houston, Texas 77058 12
U. S. Geological Survey 601 19th Street, N. W. Room 1030 NASA Manned Spacecraft Center Washington, D. C. 20242 1 Science Missions Support Division
Houston, Texas 77058 Dr. A. Campbell/Dr. Harry W. Smedes ATI'N: W. E. Hensley/TF, Contract: NA-9784 U. S. Dept. of Interior Geological Survey NASA Manned Spacecraft Center Federal Center
1 Earth Observations DivisionDenver, Colorado 80225 Houston, Texas 77058
Mr. Aaron L. Niger/Mr. Milton Kolipinski ATTN: D. E. Evans/IT, Contract: NA-9784 U. S. Dept. of Interior Geological Survey Mr. J. W. Sherman, III Water Resources Division HAVOC EANO, Code 7001 Room 730, 51 S. W. First Avenue Naval Research Laboratory Miami, Florida 33130 1 Washington, D. C. 20390
Dr. Robert Colwell University of California School of Forestry 1 Berkeley, California 94720
.5:
19
Related Documents