Welcome message from author
This document is posted to help you gain knowledge. Please leave a comment to let me know what you think about it! Share it to your friends and learn new things together.
Transcript

Scientia Iranica A (2017) 24(2), 497{511
Sharif University of TechnologyScientia Iranica
Transactions A: Civil Engineeringwww.scientiairanica.com
Data Envelopment Analysis (DEA) approach formaking the bid/no-bid decision: A case study in aTurkish construction contracting company
G. Polat� and B.N. Bingol
Department of Civil Engineering, Istanbul Technical University, Maslak, 34469, Istanbul, Turkey.
Received 29 May 2015; received in revised form 26 November 2015; accepted 30 January 2016
KEYWORDSBidding decision;Bid/no-bid decision;Contractingcompanies;Construction projects;Data envelopmentanalysis;Case study.
Abstract. Construction contracting companies face two critical decisions in competitivebidding environment, which include: the bid/no-bid decision and the mark-up selectiondecision. Making the right bid/no-bid decision is critical to the survival, sustainability, andsuccess of the contractors in the industry. There are many factors that a�ect this decision.This makes the bidding decisions complex and complicated. Therefore, it is not an easy taskfor managers to consider the combined impact of all these factors on the bid/no-bid decisionwithin a limited time frame with limited capacity of information they have for every singlebidding opportunity. This study proposes a Data Envelopment Analysis (DEA) approachfor making the bid/no-bid decision. DEA is a robust non-parametric linear programmingapproach, which is mostly used for benchmarking, performance measurement, and decisionmaking problems. The applicability of the proposed approach was demonstrated in a realcase study conducted in a Turkish construction contracting company. In the case study,49 bidding opportunities formerly faced by the studied company were evaluated via thedeveloped DEA model. The accuracy rate of the proposed approach was 92%. Companymanagement found the proposed approach satisfactory and implementable in future bid/no-bid decision problems.© 2017 Sharif University of Technology. All rights reserved.
1. Introduction
In general, construction projects are awarded to con-tractors via competitive bidding. When a new contractis announced, willing contractors mainly have to decideon: (i) Whether they will bid or not bid for thecontract, and (ii) How much they will o�er as the bidprice, which consists of the base estimate (i.e., directand indirect costs), and bid mark-up (i.e., generaloverhead cost, pro�t, and contingency) [1-3]. In acompetitive business environment, contractors shouldprepare their bids wisely in order to be successful [1].
*. Corresponding author. Tel.: +90 212 285 3737Email addresses: [email protected] (G. Polat);[email protected] (B.N. Bingol)
In this respect, deciding whether to bid for a job ornot has a signi�cant in uence on the situation of thecompany in the future [3,4]. To decide not to bid fora project may bring about losing an opportunity tomake a sizable pro�t, enhance strength and position inthe industry, and develop a good relationship with aclient [3,5]. On the other hand, bidding on all projectsis not feasible and blindly bidding has several negativee�ects [1,5]. A construction company may decide to bidfor a great number of contracts in order to increase thechances to win [3]. However, bidding is a very costlyand time consuming process as it requires �nancialdeposits for bidding documents, employees' hours, sitevisits, risk analysis, market analysis, etc. [1,3,6]. In-deed, recent studies revealed that the cost of preparinga bid estimate is approximately 0.25%-1% of the total
498 G. Polat and B.N. Bingol/Scientia Iranica, Transactions A: Civil Engineering 24 (2017) 497{511
bid price [7]. Since the construction companies havelimited resources, they should plan wisely to makethe maximum pro�t [2,5]. Moreover, in most cases,bidding for a contract does not mean the win. In theconstruction industry, the losses are more frequent thanthe wins [8]. If the losses are more frequent than thewins, the contractor's reputation in the market maybe harmed [1,3,9]. Similarly, bidding for a projectthat does not comply with short and long-term strate-gies, capacity, and competency of the contractor maybring about a substantial waste of valuable time andresources, an adversarial relationship with the client,and possible arbitration or litigation [10], which in turnmay result in interruption in the business continuity,growth, and success of the contractor [11].
Therefore, contractors should carefully eliminatelosing proposals and thoroughly select the winningones, which will assist them in achieving the shortand long-term strategies, in order to stay in business,prevent waste of time and money, and enhance theirreputation in the market [8].
It is commonly acknowledged that the bid/no-bid decision is a complex and highly unstructuredprocess that is a�ected by numerous interrelated fac-tors concerning the contractor, the client, the contractand project characteristics, and the business environ-ment (i.e., company's short and long-term strategies,competency, experience, resources, �nancial status,risk attitudes, management skills, the need of work,client pro�le, contract conditions, type of work, sizeof project, risk of project, economic conditions, com-petitors, available job opportunities, etc.) [3,9,12-17].Therefore, it is not an easy task for a contractor toconsider and assess the potential impacts of all thesehighly interrelated factors, in a limited amount of timewith limited capacity of information, and to make asound decision [4,18-19].
Over the years, the bid/no-bid decision has at-tracted the attention of numerous researchers and sev-eral methods have been developed to assist contractorsin making bidding decisions. Most of these methodshave primarily focused on optimizing the contractors'probability of winning contracts and determining theright bid mark-up size [4]. Undoubtedly, all thesestudies have considerably improved the bid/no-biddecision process. However, some of these models aretoo complex and impractical to be widely accepted, ap-plied, and operated by construction professionals sincethey are based on complex computational and mathe-matical models and require much time to learn [20,21].Indeed, Li and Love [22] argued that bidding decisionswere simply made without much elaboration or deepreasoning. It is commonly acknowledged that con-tractors tend to make bidding decisions based on theintuition derived from a mixture of gut feeling, experi-ence, and guesswork [13,16,18,19,23-25]. Egemen and
Mohamed [16] emphasized that developing a realisticmodel, which captured the complexity and uncertaintyinherent in the bidding process, was very di�cult.They also claimed that development of a systematicmodel would assist contractors in achieving businessobjectives, increasing productivity, and improving thequality of decision making.
The main objective of this study is to demonstratehow Data Envelopment Analysis (DEA) technique canbe used as a decision support tool by constructioncontracting companies in their bid/no-bid decisions.DEA is a robust non-parametric linear programmingapproach, which is mostly used for benchmarking, per-formance measurement, and decision making problems.In this technique, several bidding factors, which can beeither quantitative or qualitative, are simultaneouslyconsidered. One of the most important superioritiesof DEA is that it can be easily employed by anyconstruction company. In order to illustrate how DEAtechnique can be used for modeling the bid/no-biddecision in a construction company, a case study is alsopresented.
In addition to the studies most of which will bediscussed in the next section, El-Mashaleh [9] and El-Mashaleh [17] proposed DEA approach for the bid/no-bid decision, which enables contractors to evaluateseveral bidding factors simultaneously and can be easilyemployed by any construction company. Althoughthese studies made great contributions to the bid/no-bid decision problem, they had some limitations. Forinstance, El-Mashaleh [9] deployed the DEA modelon a hypothetical data set. On the other hand, El-Mashaleh [17] proposed an empirical framework thatwas based on DEA. The suggested framework consistedof two major steps, which were identi�cation of keyfactors that were considered by contractors when evalu-ating bid opportunities and utilization of DEA to makethe bid/no-bid decision. In the �rst step of this study,62 factors that might a�ect the bid/no-bid decisionwere identi�ed based on the information gathered fromthe literature review; these factors were examined bya panel of four experts in the Jordanian constructionindustry who were top managers and had more than 27years of experience; these 62 factors were modi�ed toinclude 53 factors based on the panel's input; these 53factors were categorized into 7 groups; a questionnairewas designed in order to identify the importance levelsof these 53 factors; the questionnaire survey wasadministered to 43 Class I contractors operating inJordan; the relative importance index of 53 factorswas calculated and top 20 factors were included in theproposed DEA model. In the second step of this study,the proposed DEA model was practically illustratedbased on the actual data of 39 bids obtained from 8Jordanian contractors. Since these contractors werenot able to supply 20 factors for their bids, 7 of them

G. Polat and B.N. Bingol/Scientia Iranica, Transactions A: Civil Engineering 24 (2017) 497{511 499
were excluded. Although this study is very valuable, ithas some limitations. First, the factors included in theDEA model were selected based on the �ndings of aquestionnaire survey conducted among 43 Jordaniancontractors. However, the factors considered in thebid/no-bid decision greatly varied from company tocompany because of the di�erences in their strategiesand capabilities. Therefore, every contractor had toidentify the factors they considered during the bid/no-bid decision. Second, the proposed framework wasdeployed based on the data collected from 8 Jordaniancontractors. However, the bidding behavior also variedfrom company to company. Thus, every contractorhad to develop his/her own DEA model based on thedatabase, which contained the numerical assessmentof the determined factors for all previously consideredbids. Third, the bid/no-bid decision for new biddingopportunities was not made using the developed DEAmodel and the �ndings were not discussed. Fourth,validity and usability of the developed DEA modelwere not checked. This study aims to overcome thelimitations of these two studies.
2. Previous studies on bid/no-bid decision inthe construction industry
In the construction management literature, the bid/no-bid decision problem has been studied by numerousresearchers since the mid-1950s. These studies havedi�erent focuses. While a relatively large number ofstudies attempted to identify the most important fac-tors a�ecting the contractors' bid/no-bid decision, fewstudies introduced bidding decision support systemsbased on various techniques.
Several studies have been conducted in di�erentcountries in order to identify the factors that havethe largest in uence on this decision. Ahmad andMinkarah [23] identi�ed 31 factors and carried out aquestionnaire survey in the USA. Shash [26] foundthat 55 potential factors in uenced the bid/no-bid andmark-up decisions of top UK contractors and rankedtop 5 factors as: need for work, number of competitorstendering, experience in such projects, current work-load, and owner/promoter client identity. Wanous etal. [20] identi�ed 38 factors, conducted a questionnairesurvey among Syrian contractors, and concluded thatful�lling the tendering conditions, �nancial capabilityof the client, relation with/reputation of the client,project size, and availability of time for tendering werethe most important factors. Chua and Li [14] identi�ed51 factors and categorized them into two main groups,which were: internal (i.e., capabilities and resources ofthe contractor) and external (i.e., characteristics of theproject and environment). They carried out a surveyof 153 top contractors in Singapore and developed ahierarchy, which contributed to 4 goals: competition,
risk, need for work, and company's position in biddingprocess. Lowe and Parvar [27] identi�ed 21 factorsand categorized them into 7 main groups, which in-cluded: opportunities, resources, project relationships,project procedures, project characteristics, risks, andcompetitive advantage. They found that only 8 of these21 factors had a linear relationship with the bid/no-bid decision. Egemen and Mohamed [16] identi�ed 83factors and conducted a questionnaire survey among 80small- to medium-sized contracting organizations fromNorthern Cyprus and Turkish construction markets.They discarded 33 of them as their importance levelswere very low. The remaining 50 factors were classi�edinto 3 main groups, which were: �rm-related factors,project-related factors, and market conditions/demand& strategic considerations. Bageis and Fortune [28]summarized 6 di�erent studies and identi�ed 87 fac-tors. They carried out a survey of 91 contractorsin Saudi Arabia and ranked top 5 factors as: theclient's �nancial capacity, project cash ow, abilityto do the project, availability of required cash, andwork capital required to start the job. Enshassi etal. [12,29] investigated the factors a�ecting bid/no-biddecisions in the Palestinian and Gaza Strip construc-tion industries. They found that �nancial capability ofcontractors, the reputation and �nancial capability ofclients, �nancial values of projects, availability of rawmaterials in the local market, and the stability of theconstruction industry were the most important factors.Ravanshadnia et al. [6] developed a bid/no-bid decisionhierarchy, which included: organizational considera-tions in bidding; project characteristics; risk; �nancialconsiderations; and project synergy, correlation, andportfolio e�ects. El-Mashaleh [17] identi�ed 53 factors,categorized them into 7 groups (i.e., project character-istics, project bidding and contracting, project require-ments, project expected bene�ts, client characteristics,consultant characteristics, �rm and environmental fac-tors), administered a questionnaire survey to 43 Class Icontractors operating in Jordan, and ranked top 20factors. Jarkas et al. [5] identi�ed 43 factors andcategorized them into 5 major groups, which were:employer-related, project-related, bidding situation-related, contract-related, and contractor-related fac-tors. They conducted a questionnaire survey among 92Qatari contractors and found that previous experiencewith the employer, need for work, current workload,previous experience in similar projects, and size ofproject were the most important factors. Hwang andKim [30] identi�ed 22 factors and collected actualdata of 182 cases from a speci�c Korean constructioncompany. They found that completeness of drawingand speci�cations, size of the project, relationship withclient's professional advisors, client reliability, clarity ofbidding and contract procedure, and additional orderscale were the most in uential factors. Le�sniak and

500 G. Polat and B.N. Bingol/Scientia Iranica, Transactions A: Civil Engineering 24 (2017) 497{511
Plebankiewicz [3] identi�ed 16 factors, conducted aquestionnaire survey among 61 Polish contractors, andranked top 3 factors as: type of work, experience insimilar projects, and contractual terms.
There are a number of studies that have intro-duced bidding decision support systems. The �rstattempt was by Ahmad [18]. He proposed a procedurebased on a decision analysis technique, which assistedcontractors in deciding whether to bid or not tobid for the contract under consideration. Wanouset al. [20] introduced a parametric bidding model,which was based on positive and negative biddingfactors determined by contractors. Cagno et al. [31]described a simulation approach based on the analytichierarchy process to assess the probability of winningin a competitive bidding process. Wanous et al. [32]described the development and testing of a bid/no-bid model using the arti�cial neural network technique.Lin and Chen [15] proposed an assessment tool for con-tractors using fuzzy linguistic approach. Egemen andMohamed [33] presented the development of practicalknowledge-based system software, which systematicallydealt with di�erent bidding situations and assisted thecontractors in reaching \strategically correct" bid/no-bid decisions. Oo et al. [34] proposed a linear mixedmodel, which formulated bidding strategies accordingto project size, work sector, work nature, and numberof bidders. Cheng et al. [24] proposed a multi-criteriaprospect model for bidding decisions. Ravandshadniaet al. [6] developed a logical decision making frame-work, which covered organizational, environmental,risky, and �nancial considerations. Abbasianjahromiand Rajaie [2] presented a hybrid model accordingto the fuzzy case-based reasoning for prescreening ofprojects according to the factors generating risk inthe construction industry and the historical records ofthe company, also allocating the most appropriate pre-screened projects to the portfolio of company with theuse of zero-one linear goal programming. Shafahi andHaghani [1] developed a customized genetic algorithmmodel, which took into account the importance ofeminence and previous works. Polat et al. [35] proposedthe use of adaptive neuro fuzzy inference method formodelling of the bid/no-bid decision. Le�sniak and Ple-bankiewicz [3] developed a model, which incorporatedfuzzy set theory. Hwang and Kim [30] proposed amodel, which utilized logistic regression method.
3. Data Envelopment Analysis (DEA)
DEA, originally developed by Charnes et al. [36-38], is a very powerful technique. It is extensivelyused in benchmarking, performance measurement, anddecision making across di�erent industries such asmanufacturing, computing, banking, education, healthcare, etc. [17]. Several researchers [39-54] have suc-
cessfully employed DEA in the construction industryfor di�erent purposes such as evaluation of contractors,selection of project location, evaluation of productivityand e�ciency, assessment of credit scoring, purchaseof construction materials, evaluation of design alter-natives, benchmarking, assessment of performance,evaluation of contractors for bonding, etc. Despite thewide usage area of DEA in the construction industry,this technique has been utilized to make the bid/no-biddecision only in a limited number of studies (i.e. [9,17]).Therefore, DEA is selected as a decision support toolin this study.
Nonparametric linear programming is the under-lying methodology of DEA, which makes it powerfulwhen compared with other techniques [55]. DEA isbased on an input-output framework, which aims tomaximize the ratio of weighted outputs to the weightedinputs. In this method, inputs are minimized andoutputs are maximized, and the relative e�cienciesare evaluated via linear programming. There are 4alternative models in DEA, which are CCR (Charnes-Cooper-Rhodes) ratio model, BCC (Banker-Charnes-Cooper) model, the multiplicative models, and theadditive model [56]. The orientations of these modelsare categorized into 3 main groups, namely, input-oriented, output-oriented, and constant return scale.In input-oriented models, inputs are minimized whileoutputs are kept at their current values. On the otherhand, in output-oriented models, outputs are maxi-mized whereas inputs are kept at their current values.
In DEA, a Decision Making Unit (DMU) is usedas an organizational unit [9,17]. The relative e�ciencyof DMU is measured based on the available data set forinput and output variables [53]. In other words, DEAis a method to determine the e�ciency by using linearprogramming, whose results evaluate the performancesof DMUs.
The main idea behind DEA is to compare a cer-tain number of DMUs carrying out similar tasks. Sincethe relative e�ciency is measured without any assump-tions, DEA is considered as nonparametric [17]. Thestrengths of DEA can be summarized as follows; (1) Itis able to use large number of variables (inputs and out-puts); (2) The input and output variables can be usedin di�erent measurement methods or units; and (3)There is no prior assumption, hence the weights of in-put and output variables are derived from the data [17].
An e�cient frontier is a mathematical space,formed by the e�cient DMUs, whose e�ciency scoresare equal to 1. This frontier envelops all data pointsand it is determined by several computations of DEA.E�ciency score of each DMU is evaluated relative to ane�ciency frontier. E�ciency score of each DMU rangesbetween 0 and 1 (i.e., 0 � e�ciency score �1). If DMUis located on the e�ciency frontier, it has an e�ciencyscore of 1 (or 100%). If e�ciency score of DMU
G. Polat and B.N. Bingol/Scientia Iranica, Transactions A: Civil Engineering 24 (2017) 497{511 501
is less than 1 (< 100%), then it is called ine�cientDMU and its capacity needs to be improved for futureperformance. The e�cient DMUs require fewer inputsto generate higher output [17]. Generally, ine�cientDMUs use more inputs to produce lower output.
The mathematical form of DEA can be explainedas follows; assume a set of n DMUs (j = 1; :::; n) eachconsuming m inputs xi;j (i = 1; :::;m) to produce soutputs yr;j (r = 1; :::; s). The relative e�ciency of aDMUj can be computed with the following mathemat-ical programming model (Eqs. (1)-(4)) by applying noptimizations:
Max�j =Psr=1 ur � yr;jPmi=1 vi � xi;j : (1)
Subject to:Psr=1 ur � yr;jPmi=1 vi � xi;j � 1 j = 1; :::; n; (2)
i = 1; :::;m r = 1; :::; s; (3)
ur; vi � 0; (4)
where �j is e�ciency score of the jth DMU, r thenumber of output, s the total number of outputs, ithe number of input, m the total number of inputs, jthe number of DMU, n the total number of DMUs, urweight of the rth output, vi weight of the ith input, yr;jthe rth output of the jth DMU, and xi;j the ith inputof the jth DMU. The objective function of the mathe-matical programming relies on maximization of the e�-ciency of DMUj ; and this is done by maximizing sum ofnumerator (outputs of DMUj) part divided by the sumof denominator (inputs of DMUj) part of the objectivefunction (Eq. (1)). The e�ciency scores of all DMUshave to be � 1:0 according to Eq. (2). Thus, all DMUsare located either on or below the e�cient frontier [17].
4. Proposed approach
This study proposes an approach based on DEA, whichcan be easily employed by any construction contractingcompany for making the bid/no-bid decision. Theproposed approach includes �ve main stages, which are:(1) Forming the decision making team and identifyingthe key factors that may a�ect the bid/no-bid decisionin the construction contracting company in question;(2) Determining the inputs and outputs of the DEAmodel for the bid/no-bid decision; (3) Collecting data;(4) Performing DEA analysis on the collected data inorder to measure the performance of the developedmodel; and (5) Making the bid/no-bid decision for newbidding opportunities.
4.1. Forming the decision making team andidentifying the key factors that may a�ectthe bid/no-bid decision
The decision making team, whose members are re-sponsible for evaluating available job opportunities andmaking the bid/no-bid decisions in the constructioncontracting company in question, is formed. Thisteam determines the factors that will be used by thiscompany in the bid/no-bid decision. Since these factorsgreatly vary from company to company dependingon the company's short- and long-term strategies;capacity; and bidding behavior, which is predominantlya�ected by market and economic conditions; numberof competitors; type, size, location, and client ofthe project; contract conditions; contractor's �nancialstatus; opportunities and reputation that the projectmay provide; etc. [e.g. [16,19,35]), every constructioncompany should determine these factors consideringthe prevailing conditions.
4.2. Determining the inputs and outputs of theDEA model for the bid/no-bid decision
The key factors that may a�ect the bid/no-bid decision,which are identi�ed in the �rst stage, are categorizedas inputs and outputs depending on whether theyneed to be minimized or maximized. The factors thatneed to be minimized should be categorized as inputsand the factors that need to be maximized should becategorized as outputs [9]. Then, the measurementmethods of the factors are decided by the decisionmaking team.
4.3. Collecting dataIn this stage, the values of the variables (i.e., factors),which are categorized as inputs and outputs in thesecond stage, are determined for the previous biddingopportunities of the company in question. If themeasurement method is determined to be subjectivefor any variable, the decision making team is re-quested to evaluate the variable(s) numerically on apre-determined scale. If the measurement method isdetermined to be non-subjective for any variable, thenthe actual values of the variable(s) are used. Afterdetermining the values of the variables of the developedbid/no-bid decision model, a database is established.
4.4. Performing DEA analysis on thecollected data in order to measure theperformance of the developed model
DEA analysis is performed on the collected data andthe e�ciency scores for the bidding opportunities arecalculated. In this stage, the actual decisions of thecompany in question and the decisions predicted bythe developed DEA model on the previous bidding op-portunities are compared, and the accuracy rate of thedeveloped DEA model is calculated. If the calculatedaccuracy rate is satisfactory, then the developed model
502 G. Polat and B.N. Bingol/Scientia Iranica, Transactions A: Civil Engineering 24 (2017) 497{511
can be used for making the bid/no-bid decision for newbidding opportunities. If the calculated accuracy rateis not satisfactory, then the decision making team isrequested to re-identify the key bidding factors untilthe accuracy rate becomes satisfactory.
4.5. Making the bid/no-bid decision for newbidding opportunities
In this stage, the decision makers determine the valuesof the inputs and outputs for new bidding opportunitiesand these values are added to the existing database.Then, the developed DEA model is re-run and thee�ciency scores for the new bidding opportunities arecalculated. If the e�ciency score is found to be 1for any of these opportunities, then the company maydecide to bid. Otherwise, the company may decide notto bid.
5. A numerical application of the proposedapproach: A case study in a Turkishconstruction contracting company
A case study is presented in order to illustrate how theproposed approach can be applied in a real situation.In this study, a large-scale Turkish construction con-structing company, which predominantly undertakesinternational projects and is ranked among Top 225International Contractors, is selected as a case study.The studied company is mainly specialized in marineworks, infrastructure, industrial, and building projects,and undertakes projects in di�erent countries such as,Azerbaijan, Bosnia and Herzegovina, Georgia, Libya,Qatar, and Turkey.
5.1. Forming the decision making team andidentifying the key factors that may a�ectthe bid/no-bid decision in the studiedcompany
First, the decision making team was formed. This teamconsisted of three civil engineers, who were working inthe contracting department of the studied company,had at least 20 years of experience in the constructionindustry, and were in charge of evaluating available jobopportunities and making the bid/no-bid decisions. Inorder to identify the key factors that might a�ect thebid/no-bid decision in this company, these professionalswere interviewed. Based on these interviews, 16 keyfactors were taken into account during the bid/no-bid decision process in the studied company, whichincluded: (1) Complexity of bidding documents (i.e.,drawings, speci�cations); (2) Unfamiliarity with thespeci�c type of work; (3) Cash ow requirements ofthe project; (4) Technological di�culty of the project;(5) Unsatisfactory terms of payment; (6) Percent-age of retention money; (7) Project's contribution tothe strength of company brand and reputation; (8)Project's contribution to the increase in the interna-
tional market share of the company; (9) Project's con-tribution to the development of long-term relationshipswith other companies; (10) Project's contribution tothe improvement of the employees; (11) Potential forgaining similar projects in the future; (12) Potentialfor gaining long-term pro�t; (13) Contract price; (14)Project duration; (15) Percentage of advance payment;and (16) Tender preparation time.
5.2. Determining the inputs and outputs ofthe DEA model for the bid/no-biddecision in the studied company
After identifying the key factors that might a�ectthe bid/no-bid decision in the studied company, thesefactors were categorized as inputs or outputs. Thefactors that needed to be minimized were categorizedas inputs and the factors that needed to be maximizedwere categorized as outputs [9]. In the proposed DEAmodel, the �rst 6 factors (i.e., NF1-NF6), namely,(NF1) complexity of bidding documents (i.e., drawings,speci�cations), (NF2) unfamiliarity with this speci�ctype of work, (NF3) cash ow requirements of theproject, (NF4) technological di�culty of the project,(NF5) unsatisfactory terms of payment, (NF6) percent-age of retention money, which had negative e�ects onthe bid decision, were quanti�ed as inputs. The re-maining 10 factors (PF1-PF10), namely (PF1) project'scontribution to the strength of company brand andreputation, (PF2) project's contribution to the increasein the international market share of the company,(PF3) project's contribution to the development oflong-term relationships with other companies, (PF4)project's contribution to the improvement of the em-ployees, (PF5) potential for gaining similar projectsin the future, (PF6) potential for gaining long-termpro�t, (PF7) contract price, (PF8) project duration,(PF9) percentage of advance payment, (PF10) tenderpreparation time, were quanti�ed as outputs as theyhad positive e�ects on the bid decision and needed tobe maximized.
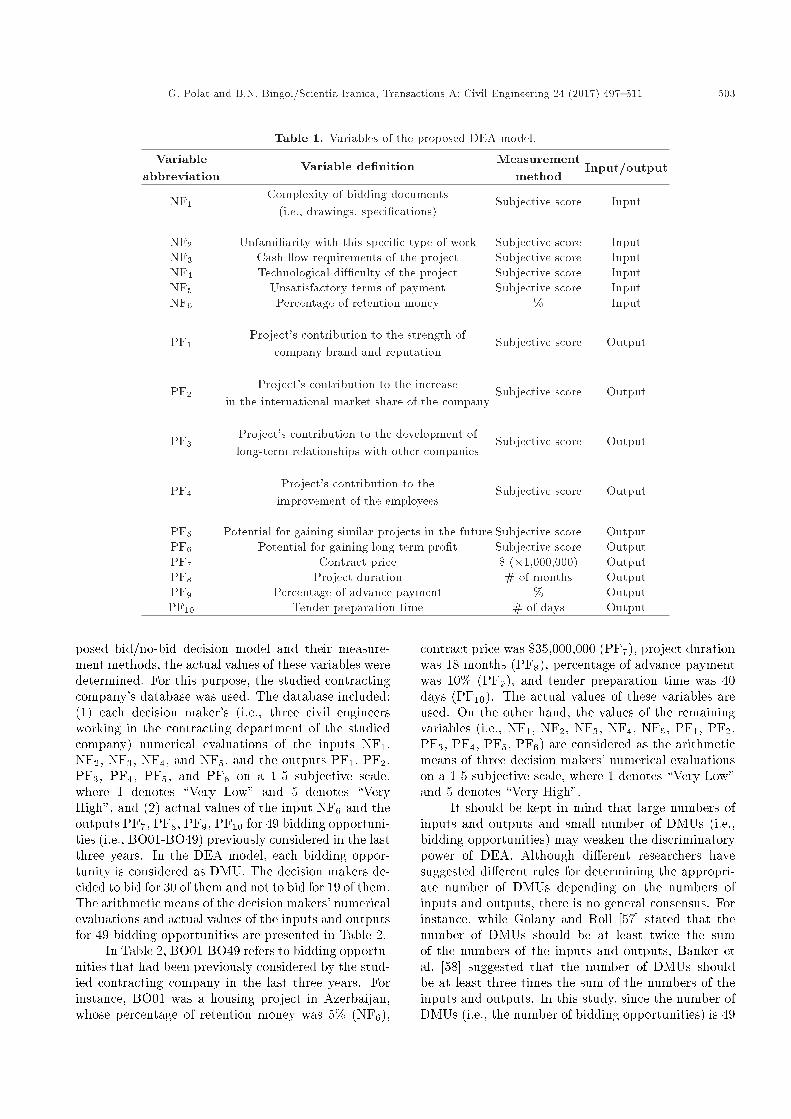
The variables' abbreviations, de�nitions, andtheir measurement methods are presented in Table 1.
As seen in Table 1, the measurement methodof the variables, i.e. percentage of retention money(NF6), contract price (PF7), project duration (PF8),percentage of advance payment (PF9), and tenderpreparation time (PF10), is numerical and the actualvalues of these variables are used as inputs or outputs.On the other hand, the measurement method of theremaining variables is not numerical. The decisionmakers individually and subjectively evaluate thesevariables on a 1-5 scale, where 1 denotes \Very Low"and 5 denotes \Very High".
5.3. Collecting data in the studied companyAfter determining the inputs and outputs of the pro-
G. Polat and B.N. Bingol/Scientia Iranica, Transactions A: Civil Engineering 24 (2017) 497{511 503
Table 1. Variables of the proposed DEA model.
Variableabbreviation
Variable de�nition Measurementmethod
Input/output
NF1Complexity of bidding documents
(i.e., drawings, speci�cations)Subjective score Input
NF2 Unfamiliarity with this speci�c type of work Subjective score InputNF3 Cash ow requirements of the project Subjective score InputNF4 Technological di�culty of the project Subjective score InputNF5 Unsatisfactory terms of payment Subjective score InputNF6 Percentage of retention money % Input
PF1Project's contribution to the strength of
company brand and reputationSubjective score Output
PF2Project's contribution to the increase
in the international market share of the companySubjective score Output
PF3Project's contribution to the development oflong-term relationships with other companies
Subjective score Output
PF4Project's contribution to the
improvement of the employeesSubjective score Output
PF5 Potential for gaining similar projects in the future Subjective score OutputPF6 Potential for gaining long-term pro�t Subjective score OutputPF7 Contract price $ (�1,000,000) OutputPF8 Project duration # of months OutputPF9 Percentage of advance payment % OutputPF10 Tender preparation time # of days Output
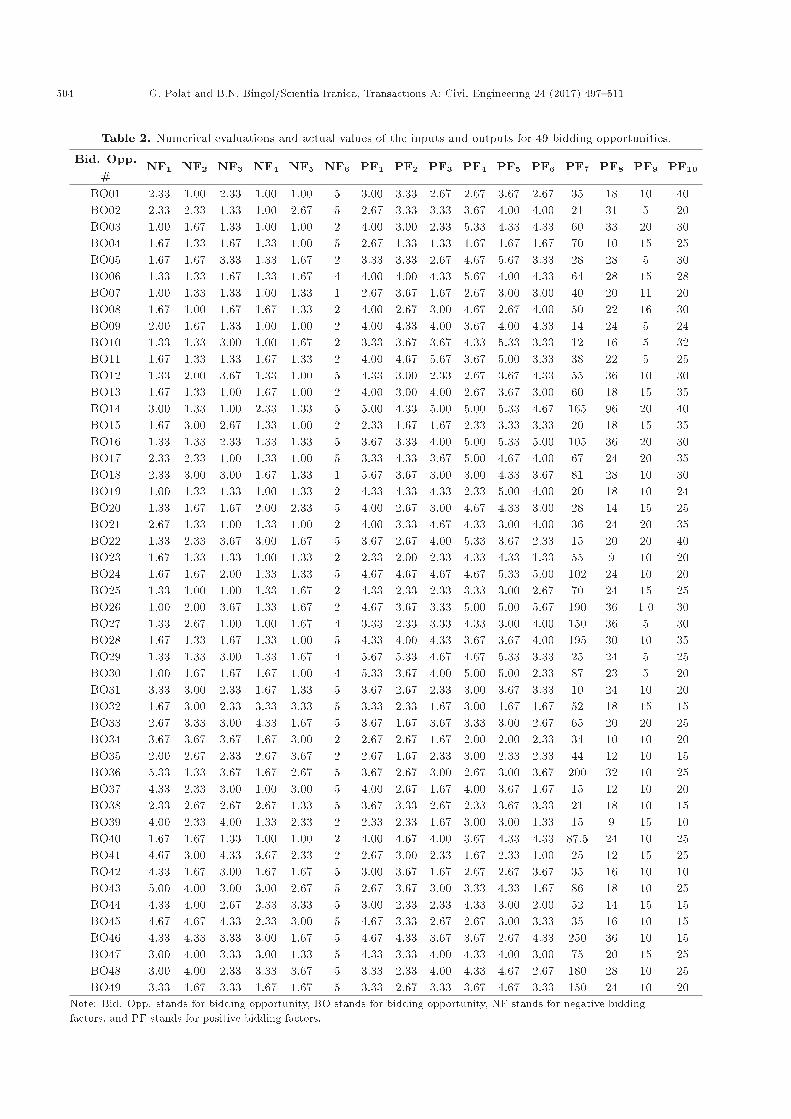
posed bid/no-bid decision model and their measure-ment methods, the actual values of these variables weredetermined. For this purpose, the studied contractingcompany's database was used. The database included:(1) each decision maker's (i.e., three civil engineersworking in the contracting department of the studiedcompany) numerical evaluations of the inputs NF1,NF2, NF3, NF4, and NF5, and the outputs PF1, PF2,PF3, PF4, PF5, and PF6 on a 1-5 subjective scale,where 1 denotes \Very Low" and 5 denotes \VeryHigh", and (2) actual values of the input NF6 and theoutputs PF7, PF8, PF9, PF10 for 49 bidding opportuni-ties (i.e., BO01-BO49) previously considered in the lastthree years. In the DEA model, each bidding oppor-tunity is considered as DMU. The decision makers de-cided to bid for 30 of them and not to bid for 19 of them.The arithmetic means of the decision makers' numericalevaluations and actual values of the inputs and outputsfor 49 bidding opportunities are presented in Table 2.
In Table 2, BO01-BO49 refers to bidding opportu-nities that had been previously considered by the stud-ied contracting company in the last three years. Forinstance, BO01 was a housing project in Azerbaijan,whose percentage of retention money was 5% (NF6),
contract price was $35,000,000 (PF7), project durationwas 18 months (PF8), percentage of advance paymentwas 10% (PF9), and tender preparation time was 40days (PF10). The actual values of these variables areused. On the other hand, the values of the remainingvariables (i.e., NF1, NF2, NF3, NF4, NF5, PF1, PF2;PF3, PF4, PF5, PF6) are considered as the arithmeticmeans of three decision makers' numerical evaluationson a 1-5 subjective scale, where 1 denotes \Very Low"and 5 denotes \Very High".
It should be kept in mind that large numbers ofinputs and outputs and small number of DMUs (i.e.,bidding opportunities) may weaken the discriminatorypower of DEA. Although di�erent researchers havesuggested di�erent rules for determining the appropri-ate number of DMUs depending on the numbers ofinputs and outputs, there is no general consensus. Forinstance, while Golany and Roll [57] stated that thenumber of DMUs should be at least twice the sumof the numbers of the inputs and outputs, Banker etal. [58] suggested that the number of DMUs shouldbe at least three times the sum of the numbers of theinputs and outputs. In this study, since the number ofDMUs (i.e., the number of bidding opportunities) is 49
504 G. Polat and B.N. Bingol/Scientia Iranica, Transactions A: Civil Engineering 24 (2017) 497{511
Table 2. Numerical evaluations and actual values of the inputs and outputs for 49 bidding opportunities.
Bid. Opp.#
NF1 NF2 NF3 NF4 NF5 NF6 PF1 PF2 PF3 PF4 PF5 PF6 PF7 PF8 PF9 PF10
BO01 2.33 1.00 2.33 1.00 1.00 5 3.00 3.33 2.67 2.67 3.67 2.67 35 18 10 40BO02 2.33 2.33 1.33 1.00 2.67 5 2.67 3.33 3.33 3.67 4.00 4.00 21 31 5 20BO03 1.00 1.67 1.33 1.00 1.00 2 4.00 3.00 2.33 5.33 4.33 4.33 60 33 20 30BO04 1.67 1.33 1.67 1.33 1.00 5 2.67 1.33 1.33 1.67 1.67 1.67 70 10 15 25BO05 1.67 1.67 3.33 1.33 1.67 2 3.33 3.33 2.67 4.67 5.67 3.33 28 28 5 30BO06 1.33 1.33 1.67 1.33 1.67 4 4.00 4.00 4.33 5.67 4.00 4.33 64 28 15 28BO07 1.00 1.33 1.33 1.00 1.33 1 2.67 3.67 1.67 2.67 3.00 3.00 40 20 11 20BO08 1.67 1.00 1.67 1.67 1.33 2 4.00 2.67 3.00 4.67 2.67 4.00 50 22 16 30BO09 2.00 1.67 1.33 1.00 1.00 2 4.00 4.33 4.00 3.67 4.00 4.33 14 24 5 24BO10 1.33 1.33 3.00 1.00 1.67 2 3.33 3.67 3.67 4.33 5.33 3.33 12 16 5 32BO11 1.67 1.33 1.33 1.67 1.33 2 4.00 4.67 5.67 3.67 5.00 3.33 38 22 5 25BO12 1.33 2.00 3.67 1.33 1.00 5 4.33 3.00 2.33 2.67 3.67 4.33 55 36 10 30BO13 1.67 1.33 1.00 1.67 1.00 2 4.00 3.00 4.00 2.67 3.67 3.00 60 18 15 35BO14 3.00 1.33 1.00 2.33 1.33 5 5.00 4.33 5.00 5.00 5.33 4.67 165 96 20 40BO15 1.67 3.00 2.67 1.33 1.00 2 2.33 1.67 1.67 2.33 3.33 3.33 20 18 15 35BO16 1.33 1.33 2.33 1.33 1.33 5 3.67 3.33 4.00 5.00 5.33 5.00 105 36 20 30BO17 2.33 2.33 1.00 1.33 1.00 5 3.33 4.33 3.67 5.00 4.67 4.00 67 24 20 35BO18 2.33 3.00 3.00 1.67 1.33 1 5.67 3.67 3.00 3.00 4.33 3.67 81 28 10 30BO19 1.00 1.33 1.33 1.00 1.33 2 4.33 4.33 4.33 2.33 5.00 4.00 20 18 10 24BO20 1.33 1.67 1.67 2.00 2.33 5 4.00 2.67 3.00 4.67 4.33 3.00 28 14 15 25BO21 2.67 1.33 1.00 1.33 1.00 2 4.00 3.33 4.67 4.33 3.00 4.00 36 24 20 35BO22 1.33 2.33 3.67 3.00 1.67 5 3.67 2.67 4.00 5.33 3.67 2.33 15 20 20 40BO23 1.67 1.33 1.33 1.00 1.33 2 2.33 2.00 2.33 4.33 4.33 1.33 55 9 10 20BO24 1.67 1.67 2.00 1.33 1.33 5 4.67 4.67 4.67 4.67 5.33 5.00 102 24 10 20BO25 1.33 1.00 1.00 1.33 1.67 2 4.33 2.33 2.33 3.33 3.00 2.67 70 24 15 25BO26 1.00 2.00 3.67 1.33 1.67 2 4.67 3.67 3.33 5.00 5.00 5.67 190 36 1 0 30BO27 1.33 2.67 1.00 1.00 1.67 4 3.33 2.33 3.33 4.33 3.00 4.00 150 36 5 30BO28 1.67 1.33 1.67 1.33 1.00 5 4.33 4.00 4.33 3.67 3.67 4.00 195 30 10 35BO29 1.33 1.33 3.00 1.33 1.67 4 5.67 5.33 4.67 4.67 5.33 3.33 25 24 5 25BO30 1.00 1.67 1.67 1.67 1.00 4 5.33 3.67 4.00 5.00 5.00 2.33 87 23 5 20BO31 3.33 3.00 2.33 1.67 1.33 5 3.67 2.67 2.33 3.00 3.67 3.33 10 24 10 20BO32 1.67 3.00 2.33 3.33 3.33 5 3.33 2.33 1.67 3.00 1.67 1.67 52 18 15 15BO33 2.67 3.33 3.00 4.33 1.67 5 3.67 1.67 3.67 3.33 3.00 2.67 65 20 20 25BO34 3.67 3.67 3.67 1.67 3.00 2 2.67 2.67 1.67 2.00 2.00 2.33 34 10 10 20BO35 2.00 2.67 2.33 2.67 3.67 2 2.67 1.67 2.33 3.00 2.33 2.33 44 12 10 15BO36 5.33 1.33 3.67 1.67 2.67 5 3.67 2.67 3.00 2.67 3.00 3.67 200 32 10 25BO37 4.33 2.33 3.00 1.00 3.00 5 4.00 2.67 1.67 4.00 3.67 1.67 15 12 10 20BO38 2.33 2.67 2.67 2.67 1.33 5 3.67 3.33 2.67 2.33 3.67 3.33 21 18 10 15BO39 4.00 2.33 4.00 1.33 2.33 2 2.33 2.33 1.67 3.00 3.00 1.33 15 9 15 10BO40 1.67 1.67 1.33 1.00 1.00 2 4.00 4.67 4.00 3.67 4.33 4.33 87.5 24 10 25BO41 4.67 3.00 4.33 3.67 2.33 2 2.67 3.00 2.33 1.67 2.33 1.00 25 12 15 25BO42 4.33 1.67 3.00 1.67 1.67 5 3.00 3.67 1.67 2.67 2.67 3.67 35 16 10 10BO43 5.00 4.00 3.00 3.00 2.67 5 2.67 3.67 3.00 3.33 4.33 1.67 86 18 10 25BO44 4.33 4.00 2.67 2.33 3.33 5 3.00 2.33 2.33 4.33 3.00 2.00 52 14 15 15BO45 4.67 4.67 4.33 2.33 3.00 5 4.67 3.33 2.67 2.67 3.00 3.33 35 16 10 15BO46 4.33 4.33 3.33 3.00 1.67 5 4.67 4.33 3.67 3.67 2.67 4.33 250 36 10 15BO47 3.00 4.00 3.33 3.00 1.33 5 4.33 3.33 4.00 4.33 4.00 3.00 75 20 15 25BO48 3.00 4.00 2.33 3.33 3.67 5 3.33 2.33 4.00 4.33 4.67 2.67 180 28 10 25BO49 3.33 1.67 3.33 1.67 1.67 5 3.33 2.67 3.33 3.67 4.67 3.33 150 24 10 20
Note: Bid. Opp. stands for bidding opportunity, BO stands for bidding opportunity, NF stands for negative biddingfactors, and PF stands for positive bidding factors.

G. Polat and B.N. Bingol/Scientia Iranica, Transactions A: Civil Engineering 24 (2017) 497{511 505
and the sum of the numbers of the inputs and outputsis 16, the suggested rules are satis�ed.
5.4. Performing DEA analysis on the collecteddata in order to measure the performanceof the developed model in the studiedcompany
The framework of the proposed bid/no-bid decisionmodel is shown in Figure 1. As seen in Figure 1,the database includes the values of the inputs (i.e.,NF1�6) and outputs (i.e., PF1�10) for each biddingopportunity (i.e., DMU). DEA analysis is conductedon 49 DMUs and the e�ciency scores are calculated. Ifthe e�ciency score is equal to 1, this means that thisbidding opportunity belongs to the e�cient frontierand the decision for this bidding opportunity shouldbe \bid". Otherwise, the decision should be \no bid".
Having collected the data presented in Table 2from the studied company's database, the proposedDEA model was run via OSDEA software. In order tocalculate the e�ciency scores of 49 bidding opportuni-ties, the following equations (Eqs. (5)-(8)) were used:
Max�j =Psr=1 ur � PFr;jPmi=1 vi �NFi;j
: (5)
Subject to :Psr=1 ur � PFr;jPmi=1 vi �NFi;j
� 1; j = 1; :::; n; (6)
i = 1; :::;m; r = 1; :::; s; (7)
ur; vi � 0; (8)
where �j is e�ciency score of the jth DMU (i.e.,bidding opportunity), r the number of output (i.e.,PF), s the total number of outputs (i.e., 10), i thenumber of input (i.e., NF), m the total number ofinputs (i.e., 6), j the number of DMU, n the totalnumber of DMUs (i.e., 49), ur weight of the rth output,
vi weight of the ith input, PFr;j the rth PF of the jthDMU, and NFi;j the ith NF of the jth DMU.
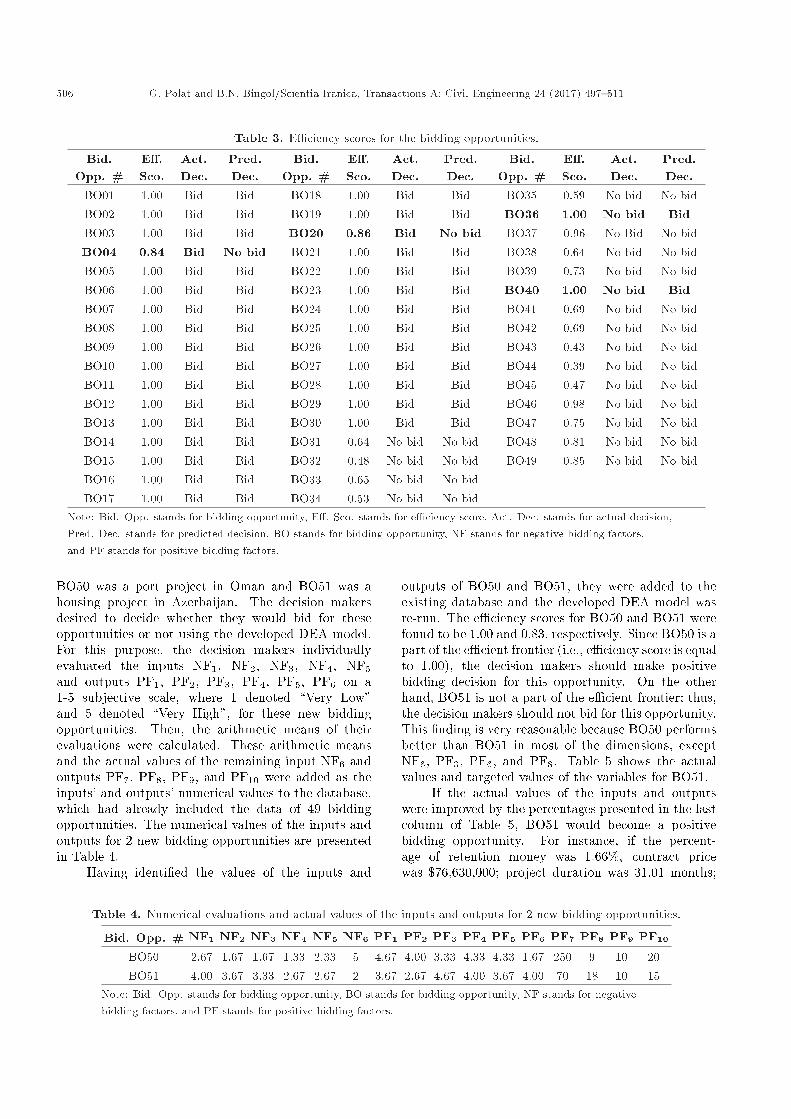
The e�ciency scores calculated according toEqs. (5)-(8), actual decisions of the studied company,and the decisions predicted by the developed DEAmodel for 49 bidding opportunities are displayed inTable 3.
As seen in Table 3, the e�cient frontier of thedeveloped model includes 30 bidding opportunities,which are BO01, BO02, BO03, BO05, BO06, BO07,BO08, BO09, BO10, BO11, BO12, BO13, BO14,BO15, BO16, BO17, BO18, BO19, BO21, BO22,BO23, BO24, BO25, BO26, BO27, BO28, BO29,BO30, BO36, and BO40 as their e�ciency scores areequal to 1.00. On the other hand, the e�ciency scoresfor the remaining 19 bidding opportunities are foundto be lower than 1.00, which indicates that thesebidding opportunities do not belong to the e�cientfrontier and the studied company should have notbidden for these opportunities. In real life, the studiedcontracting company made a positive bidding decisionfor the bidding opportunities on the e�cient frontier,except BO36 and BO40. The studied company made apositive bidding decision for the bidding opportunitiesBO04 and BO20, although they were not a part of thee�cient frontier. It can be concluded that the actualdecisions of the decision makers and the decisionspredicted by the developed DEA model are consistentfor 45 bidding opportunities out of 49 biddingopportunities, which corresponds to an accuracy rateof 92%. When the decision makers were asked toevaluate the �ndings of the developed DEA model,they stated that they had made wrong decisions forthese 4 bidding opportunities and the results of thedeveloped DEA model were very reasonable.
5.5. Making the bid/no-bid decision for newbidding opportunities in the studiedcompany
The studied construction contracting company hadtwo new bidding opportunities (i.e., BO50 and BO51).
Figure 1. Framework of the proposed bid/no-bid decision model.
506 G. Polat and B.N. Bingol/Scientia Iranica, Transactions A: Civil Engineering 24 (2017) 497{511
Table 3. E�ciency scores for the bidding opportunities.
Bid.Opp. #
E�.Sco.
Act.Dec.
Pred.Dec.
Bid.Opp. #
E�.Sco.
Act.Dec.
Pred.Dec.
Bid.Opp. #
E�.Sco.
Act.Dec.
Pred.Dec.
BO01 1.00 Bid Bid BO18 1.00 Bid Bid BO35 0.59 No bid No bidBO02 1.00 Bid Bid BO19 1.00 Bid Bid BO36 1.00 No bid BidBO03 1.00 Bid Bid BO20 0.86 Bid No bid BO37 0.96 No Bid No bidBO04 0.84 Bid No bid BO21 1.00 Bid Bid BO38 0.64 No bid No bidBO05 1.00 Bid Bid BO22 1.00 Bid Bid BO39 0.73 No bid No bidBO06 1.00 Bid Bid BO23 1.00 Bid Bid BO40 1.00 No bid BidBO07 1.00 Bid Bid BO24 1.00 Bid Bid BO41 0.69 No bid No bidBO08 1.00 Bid Bid BO25 1.00 Bid Bid BO42 0.69 No bid No bidBO09 1.00 Bid Bid BO26 1.00 Bid Bid BO43 0.43 No bid No bidBO10 1.00 Bid Bid BO27 1.00 Bid Bid BO44 0.39 No bid No bidBO11 1.00 Bid Bid BO28 1.00 Bid Bid BO45 0.47 No bid No bidBO12 1.00 Bid Bid BO29 1.00 Bid Bid BO46 0.98 No bid No bidBO13 1.00 Bid Bid BO30 1.00 Bid Bid BO47 0.75 No bid No bidBO14 1.00 Bid Bid BO31 0.64 No bid No bid BO48 0.81 No bid No bidBO15 1.00 Bid Bid BO32 0.48 No bid No bid BO49 0.85 No bid No bidBO16 1.00 Bid Bid BO33 0.65 No bid No bidBO17 1.00 Bid Bid BO34 0.53 No bid No bid
Note: Bid. Opp. stands for bidding opportunity, E�. Sco. stands for e�ciency score, Act. Dec. stands for actual decision,Pred. Dec. stands for predicted decision, BO stands for bidding opportunity, NF stands for negative bidding factors,and PF stands for positive bidding factors.
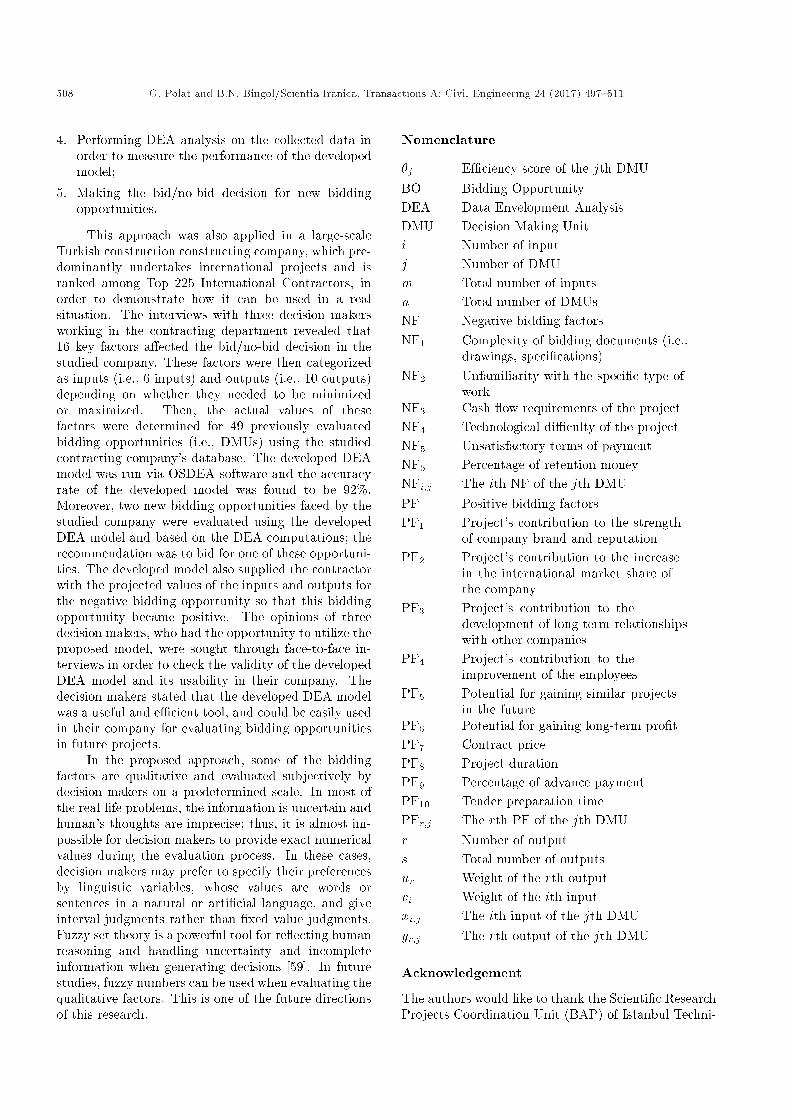
BO50 was a port project in Oman and BO51 was ahousing project in Azerbaijan. The decision makersdesired to decide whether they would bid for theseopportunities or not using the developed DEA model.For this purpose, the decision makers individuallyevaluated the inputs NF1, NF2, NF3, NF4, NF5and outputs PF1, PF2, PF3, PF4, PF5, PF6 on a1-5 subjective scale, where 1 denoted \Very Low"and 5 denoted \Very High", for these new biddingopportunities. Then, the arithmetic means of theirevaluations were calculated. These arithmetic meansand the actual values of the remaining input NF6 andoutputs PF7, PF8, PF9, and PF10 were added as theinputs' and outputs' numerical values to the database,which had already included the data of 49 biddingopportunities. The numerical values of the inputs andoutputs for 2 new bidding opportunities are presentedin Table 4.
Having identi�ed the values of the inputs and
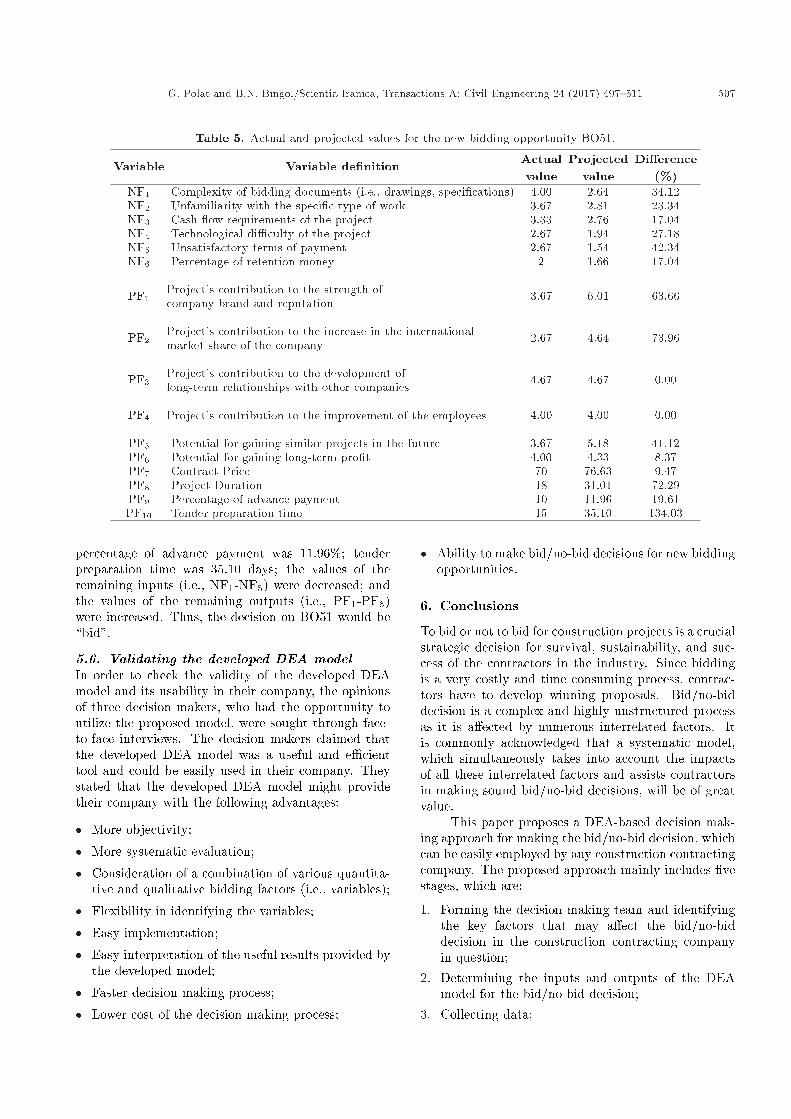
outputs of BO50 and BO51, they were added to theexisting database and the developed DEA model wasre-run. The e�ciency scores for BO50 and BO51 werefound to be 1.00 and 0.83, respectively. Since BO50 is apart of the e�cient frontier (i.e., e�ciency score is equalto 1.00), the decision makers should make positivebidding decision for this opportunity. On the otherhand, BO51 is not a part of the e�cient frontier; thus,the decision makers should not bid for this opportunity.This �nding is very reasonable because BO50 performsbetter than BO51 in most of the dimensions, exceptNF6, PF3, PF6, and PF8. Table 5 shows the actualvalues and targeted values of the variables for BO51.
If the actual values of the inputs and outputswere improved by the percentages presented in the lastcolumn of Table 5, BO51 would become a positivebidding opportunity. For instance, if the percent-age of retention money was 1.66%, contract pricewas $76,630,000; project duration was 31.01 months;
Table 4. Numerical evaluations and actual values of the inputs and outputs for 2 new bidding opportunities.
Bid. Opp. # NF1 NF2 NF3 NF4 NF5 NF6 PF1 PF2 PF3 PF4 PF5 PF6 PF7 PF8 PF9 PF10
BO50 2.67 1.67 1.67 1.33 2.33 5 4.67 4.00 3.33 4.33 4.33 1.67 250 9 10 20BO51 4.00 3.67 3.33 2.67 2.67 2 3.67 2.67 4.67 4.00 3.67 4.00 70 18 10 15
Note: Bid. Opp. stands for bidding opportunity, BO stands for bidding opportunity, NF stands for negativebidding factors, and PF stands for positive bidding factors.
G. Polat and B.N. Bingol/Scientia Iranica, Transactions A: Civil Engineering 24 (2017) 497{511 507
Table 5. Actual and projected values for the new bidding opportunity BO51.
Variable Variable de�nition Actualvalue
Projectedvalue
Di�erence(%)
NF1 Complexity of bidding documents (i.e., drawings, speci�cations) 4.00 2.64 34.12NF2 Unfamiliarity with the speci�c type of work 3.67 2.81 23.34NF3 Cash ow requirements of the project 3.33 2.76 17.04NF4 Technological di�culty of the project 2.67 1.94 27.18NF5 Unsatisfactory terms of payment 2.67 1.54 42.34NF6 Percentage of retention money 2 1.66 17.04
PF1Project's contribution to the strength ofcompany brand and reputation 3.67 6.01 63.66
PF2Project's contribution to the increase in the internationalmarket share of the company 2.67 4.64 73.96
PF3Project's contribution to the development oflong-term relationships with other companies 4.67 4.67 0.00
PF4 Project's contribution to the improvement of the employees 4.00 4.00 0.00
PF5 Potential for gaining similar projects in the future 3.67 5.18 41.12PF6 Potential for gaining long-term pro�t 4.00 4.33 8.37PF7 Contract Price 70 76.63 9.47PF8 Project Duration 18 31.01 72.29PF9 Percentage of advance payment 10 11.96 19.61PF10 Tender preparation time 15 35.10 134.03
percentage of advance payment was 11.96%; tenderpreparation time was 35.10 days; the values of theremaining inputs (i.e., NF1-NF5) were decreased; andthe values of the remaining outputs (i.e., PF1-PF6)were increased. Thus, the decision on BO51 would be\bid".
5.6. Validating the developed DEA modelIn order to check the validity of the developed DEAmodel and its usability in their company, the opinionsof three decision makers, who had the opportunity toutilize the proposed model, were sought through face-to-face interviews. The decision makers claimed thatthe developed DEA model was a useful and e�cienttool and could be easily used in their company. Theystated that the developed DEA model might providetheir company with the following advantages:
� More objectivity;
� More systematic evaluation;
� Consideration of a combination of various quantita-tive and qualitative bidding factors (i.e., variables);
� Flexibility in identifying the variables;
� Easy implementation;
� Easy interpretation of the useful results provided bythe developed model;
� Faster decision making process;
� Lower cost of the decision making process;
� Ability to make bid/no-bid decisions for new biddingopportunities.
6. Conclusions
To bid or not to bid for construction projects is a crucialstrategic decision for survival, sustainability, and suc-cess of the contractors in the industry. Since biddingis a very costly and time consuming process, contrac-tors have to develop winning proposals. Bid/no-biddecision is a complex and highly unstructured processas it is a�ected by numerous interrelated factors. Itis commonly acknowledged that a systematic model,which simultaneously takes into account the impactsof all these interrelated factors and assists contractorsin making sound bid/no-bid decisions, will be of greatvalue.
This paper proposes a DEA-based decision mak-ing approach for making the bid/no-bid decision, whichcan be easily employed by any construction contractingcompany. The proposed approach mainly includes �vestages, which are:
1. Forming the decision making team and identifyingthe key factors that may a�ect the bid/no-biddecision in the construction contracting companyin question;
2. Determining the inputs and outputs of the DEAmodel for the bid/no-bid decision;
3. Collecting data;
508 G. Polat and B.N. Bingol/Scientia Iranica, Transactions A: Civil Engineering 24 (2017) 497{511
4. Performing DEA analysis on the collected data inorder to measure the performance of the developedmodel;
5. Making the bid/no-bid decision for new biddingopportunities.
This approach was also applied in a large-scaleTurkish construction constructing company, which pre-dominantly undertakes international projects and isranked among Top 225 International Contractors, inorder to demonstrate how it can be used in a realsituation. The interviews with three decision makersworking in the contracting department revealed that16 key factors a�ected the bid/no-bid decision in thestudied company. These factors were then categorizedas inputs (i.e., 6 inputs) and outputs (i.e., 10 outputs)depending on whether they needed to be minimizedor maximized. Then, the actual values of thesefactors were determined for 49 previously evaluatedbidding opportunities (i.e., DMUs) using the studiedcontracting company's database. The developed DEAmodel was run via OSDEA software and the accuracyrate of the developed model was found to be 92%.Moreover, two new bidding opportunities faced by thestudied company were evaluated using the developedDEA model and based on the DEA computations; therecommendation was to bid for one of these opportuni-ties. The developed model also supplied the contractorwith the projected values of the inputs and outputs forthe negative bidding opportunity so that this biddingopportunity became positive. The opinions of threedecision makers, who had the opportunity to utilize theproposed model, were sought through face-to-face in-terviews in order to check the validity of the developedDEA model and its usability in their company. Thedecision makers stated that the developed DEA modelwas a useful and e�cient tool, and could be easily usedin their company for evaluating bidding opportunitiesin future projects.
In the proposed approach, some of the biddingfactors are qualitative and evaluated subjectively bydecision makers on a predetermined scale. In most ofthe real-life problems, the information is uncertain andhuman's thoughts are imprecise; thus, it is almost im-possible for decision makers to provide exact numericalvalues during the evaluation process. In these cases,decision makers may prefer to specify their preferencesby linguistic variables, whose values are words orsentences in a natural or arti�cial language, and giveinterval judgments rather than �xed value judgments.Fuzzy set theory is a powerful tool for re ecting humanreasoning and handling uncertainty and incompleteinformation when generating decisions [59]. In futurestudies, fuzzy numbers can be used when evaluating thequalitative factors. This is one of the future directionsof this research.
Nomenclature
�j E�ciency score of the jth DMUBO Bidding OpportunityDEA Data Envelopment AnalysisDMU Decision Making Uniti Number of inputj Number of DMUm Total number of inputsn Total number of DMUsNF Negative bidding factorsNF1 Complexity of bidding documents (i.e.,
drawings, speci�cations)NF2 Unfamiliarity with the speci�c type of
workNF3 Cash ow requirements of the projectNF4 Technological di�culty of the projectNF5 Unsatisfactory terms of paymentNF6 Percentage of retention moneyNFi;j The ith NF of the jth DMUPF Positive bidding factorsPF1 Project's contribution to the strength
of company brand and reputationPF2 Project's contribution to the increase
in the international market share ofthe company
PF3 Project's contribution to thedevelopment of long-term relationshipswith other companies
PF4 Project's contribution to theimprovement of the employees
PF5 Potential for gaining similar projectsin the future
PF6 Potential for gaining long-term pro�tPF7 Contract pricePF8 Project durationPF9 Percentage of advance paymentPF10 Tender preparation timePFr;j The rth PF of the jth DMUr Number of outputs Total number of outputsur Weight of the rth outputvi Weight of the ith inputxi;j The ith input of the jth DMUyr;j The rth output of the jth DMU
Acknowledgement
The authors would like to thank the Scienti�c ResearchProjects Coordination Unit (BAP) of Istanbul Techni-
G. Polat and B.N. Bingol/Scientia Iranica, Transactions A: Civil Engineering 24 (2017) 497{511 509
cal University for partial funding of this study with theproject number 37672.
References
1. Shafahi, A. and Haghani, A. \Modeling contractors'project selection and markup decisions in uenced byeminence", International Journal of Project Manage-ment, 32(8), pp. 1481-1493 (2014).
2. Abbasianjahromi, H.R. and Rajaie, H. \Applicationof fuzzy CBR and MODM approaches in the projectportfolio selection in construction companies", IranianJournal of Science and Technology, Transactions ofCivil Engineering, 37(C1), pp. 143-155 (2013).
3. Le�sniak, A. and Plebankiewicz, E. \Modeling thedecision-making process concerning participation inconstruction bidding", Journal of Management in En-gineering, 31(2), 04014032, pp. 1-9 (2015).
4. Pekuri, A., Pekuri, H. and Haapasalo, H. \Businessmodels and project selection in construction compa-nies", Construction Innovation, 15(2), pp. 180-197(2015).
5. Jarkas, A.M., Mubarek, S.A. and Kadri, C.Y. \Criticalfactors determining bid/no bid decisions of contractorsin Qatar", Journal of Management in Engineering,30(4), 05014007, pp. 1-11 (2014).
6. Ravanshadnia, M., Rajaie, H. and Abbasian, H. \Acomprehensive bid/no-bid decision making frameworkfor construction companies", Iranian Journal of Sci-ence and Technology, Transactions of Civil and Envi-ronmental Engineering, 35(C1), pp. 95-103 (2011).
7. Halpin, D., Construction Management, John Wileyand Sons, Inc. Hoboken, NJ (2006).
8. Kerzner, H. and Thamhain, H. \Project manage-ment operating guidelines: Directives", Procedures andForms, Van Nostrand Reinhold, NY (1986).
9. El-Mashaleh, M. \Decision to bid or not to bid: A dataenvelopment analysis approach", Canadian Journal ofCivil Engineering, 37(1), pp. 37-44 (2010).
10. Tan, Y., Shen, L. and Langston, C. \Contractors'competition strategies in bidding: Hong Kong study",Journal of Construction Engineering and Manage-ment, 136(10), pp. 1069-1077 (2010).
11. Gido, J. and Clements, J. Successful Project Manage-ment, South Western College Publishing, Ohio (1999).
12. Enshassi, A., Mohamed, S. and El Karriri, A. \Factorsa�ecting the bid/no bid decision in the Palestinianconstruction industry", Journal of Financial Manage-ment of Property and Construction, 15(2), pp. 118-142(2010).
13. Fayek, A., Ghoshal, I. and AbouRizk, S. \A surveyof bidding practices of Canadian civil engineeringconstruction contractors", Canadian Journal of CivilEngineering, 26(1), pp. 13-25 (1999).
14. Chua, D.K.S. and Li, D. \Key factors in bid reason-ing model", Journal of Construction Engineering andManagement, 126(5), pp. 349-357 (2000).
15. Lin, C. and Chen, Y. \Bid/no bid decision making -a fuzzy linguistic approach", International Journal ofProject Management, 22(7), pp. 585-593 (2004).
16. Egemen, M. and Mohamed, A. \A framework for con-tractors to reach strategically correct bid/no bid andmark-up size decisions", Building and Environment,42(3), pp. 1373-1385 (2007).
17. El-Mashaleh, M. \Emprical framework for making tobid or not to bid decision", Journal of Management inEngineering, 29(3), pp. 200-205 (2013).
18. Ahmad, I. \Decision-support system for modeling thebid/no bid decision problem", Journal of ConstructionEngineering and Management, 116(4), pp. 595-607(1990).
19. Chua, D., Li, D. and Chan, W. \Case-based reasoningapproach in bid decision making", Journal of Con-struction Engineering and Management, 127(1), pp.35-45 (2001).
20. Wanous, M., Boussabaine, A.H. and Lewis, J. \Tobid or not to bid: A parametric solution", Construc-tion Management and Economics, 18(4), pp. 457-466(2000).
21. Tan, Y. and Shen, L. \A fuzzy competence require-ment (FCR) model for competitive bidding strategy",Construction Innovation, 10(1), pp. 75-88 (2010).
22. Li, H. and Love, P.E.D. \Combining rule-based expertsystems and arti�cial neural networks for mark-up es-timation", Construction Management and Economics,17(2), pp. 169-176 (1999).
23. Ahmad, I. and Minkarah, I. \Questionnaire surveyon bidding on construction", Journal Management inEngineering, 4(3), pp. 229-243 (1988).
24. Cheng, M., Hsiang, C., Tsai, H. and Do, H. \Biddingdecision making for construction company using amulti-criteria prospect model", Journal of Civil Engi-neering and Management, 17(3), pp. 424-436 (2011).
25. Chen, Y., Zhang, S.J., Liu, L.S. and Hu, J. \Risk per-ception and propensity in bid/no-bid decision-makingof construction projects", Engineering, Constructionand Architectural Management, 22(1), pp. 2-20 (2015).
26. Shash, A. \Factors considered in tendering decisions bytop UK contractors", Construction Management andEconomics, 11(2), pp. 111-118 (1993).
27. Lowe, D.J. and Parvar, J. \A logistic regression ap-proach to modelling the contractor's decision to bid",Construction Management and Economics, 22(6), pp.643-653 (2004).
28. Bageis, A.S. and Fortune, C. \Factors a�ecting thebid/no bid decision in the Saudi Arabian construc-tion contractors", Construction Management and Eco-nomics, 27(1), pp. 53-71 (2009).
29. Enshassi, A., Mohamed, S. and El Karriri, A. \Factorsa�ecting bid/no bid decision in the Gaza stripcontrac-tors' perspectives", Revista ingenier��a de construcci�on,26(1), pp. 41-60 (2011).
510 G. Polat and B.N. Bingol/Scientia Iranica, Transactions A: Civil Engineering 24 (2017) 497{511
30. Hwang, J. and Kim, Y. \A bid decision-making modelin the initial bidding phase for overseas constructionprojects", KSCE Journal of Civil Engineering, 20(4),pp. 1189-1200 (2016).
31. Cagno, E., Caron, F. and Perego, A. \Multi-criteriaassessment of the probability of winning in the compet-itive bidding process", International Journal of ProjectManagement, 19(6), pp. 313-324 (2001).
32. Wanous, M., Boussabaine, H.A. and Lewis, J. \A neu-ral network bid/no bid model: the case for contractorsin Syria", Construction Management and Economics,21(7), pp. 737-744 (2003).
33. Egemen, M. and Mohamed, A. \SCBMD: A know-ledge-based system software for strategically correctbid/no bid and mark-up size decisions", Automationin Construction, 17(7), pp. 864-872 (2008).
34. Oo, B., Drew, D. and Runeson, G. \Competitoranalysis in construction bidding", Construction Man-agement and Economics, 28(12), pp. 1321-1329 (2010).
35. Polat, G., Bingol, B.N. and Uysalol, E. \Modelingbid/no bid decision using adaptive neuro fuzzy infer-ence system (ANFIS): A case study", ConstructionResearch Congress, Atlanta, GA, pp. 1083-1092 (2014).
36. Charnes, A., Cooper, W. and Rhoes, E. \Measuringthe e�ciency of decision making units", EuropeanJournal of Operational Research, 2(6), pp. 429-444(1978).
37. Charnes, A., Cooper, W. and Rhodes, E. \Shortcommunication: Measuring the e�ciency of decisionmaking units", European Journal of Operational Re-search, 3(4), pp. 429-444 (1979).
38. Charnes, A., Cooper, W. and Rhodes, E. \Evaluatingprogram and managerial e�ciency: An application ofdata envelopment analysis to program follow through",Management Science, 27(6), pp. 668-697 (1981).
39. Pilateris, P. and McCabe, B. \Contractor �nancialevaluation model (CFEM)", Canadian Journal of CivilEngineering, 30(3), pp. 487-499 (2003).
40. Cheng, E. and Li, U. \Exploring quantitative methodsfor project location selection", Building and Environ-ment, 39(12), pp. 1467-1476 (2004).
41. McCabe, B., Tran, V. and Ramani, J. \Construc-tion prequali�cation using data envelopment analysis",Canadian Journal of Civil Engineering, 32(1), pp. 183-193 (2005).
42. El-Mashaleh, M., O'Brien, W. and Edward Minchin,R., Jr. \Firm performance and information technologyutilization in the construction industry", Journal ofConstruction Engineering and Management, 132(5),pp. 499-507 (2006).
43. Vitner, G., Rozenes, S. and Spragget, S. \Using dataenvelop analysis to compare project e�ciency in amulti-project environment", International Journal ofProject Management, 24(4), pp. 323-329 (2006).
44. Cheng, E., Chaing, Y. and Tang, B. \Alternativeapproach to credit scoring by DEA: Evaluating bor-rowers with respect to PFI projects", Building andEnvironment, 42(4), pp. 1752-1760 (2007).
45. El-Mashaleh, M., Edward Minchin, R., Jr. andO'Brien, W. \Management of construction �rm perfor-mance using benchmarking", Journal of Managementin Engineering, 23(1), pp. 10-17 (2007).
46. Castro-Lacouture, D., Medaglia, A.L. and Skibniewski,M. \Supply chain optimization tool for purchasingdecisions in B2B construction marketplaces", Automa-tion in Construction, 16(5), pp. 569-575 (2007).
47. Gariaga, I., El-Diraby, T. and Osman, H. \Integratingvalue analysis and quality function deployment forevaluating design alternatives", Journal of Construc-tion Engineering and Management, 133(10), pp. 761-770 (2007).
48. Xue, X., Shen, Q., Wang, Y. and Lu, J. \Mea-suring the productivity of the construction industryin China using DEA-based malmquist productivityindices", Journal of Construction Engineering andManagement, 134(1), pp. 64-71 (2008).
49. El-Mashaleh, M., Rababeh, S. and Hyari, K. \Utilizingdata envelopment analysis to benchmark safety per-formance of construction contractors", InternationalJournal of Project Management, 28(1), pp. 61-67(2010).
50. Horta, I., Camanho, A. and Da Costa, J. \Performanceassessment of construction companies integrating keyperformance indicators and data envelopment analy-sis", Journal of Construction Engineering and Man-agement, 136(5), pp. 581-594 (2010).
51. Lin, C. and Huang, H. \Improved baseline productivityanalysis technique", Journal of Construction Engi-neering and Management, 136(3), pp. 367-376 (2010).
52. Horta, I., Camanho, A. and Lima, A. \Design of per-formance assessment system for selection of contrac-tors in construction industry e-marketplaces", Jour-nal of Construction Engineering and Management,139(8), pp. 910-917 (2013).
53. Abbasian-Hosseini, S., Hsiang, S., Leming, M. andLiu, M. \From social network to data envelopmentanalysis: Identifying benchmarks at the site manage-ment level", Journal of Construction Engineering andManagement, 140(8), p. 04014028 (2014).
54. El-Mashaleh, M.S. and Horta, I.M. \Evaluating con-tractors for bonding: DEA decision making modelfor surety underwriters", Journal of Management inEngineering, 32(1), pp. 1-7 (2016).
55. Sherman, H.D. and Zhu, J., Service Productivity Man-agement Improving Service Performance Using DataEnvelopment Analysis (DEA), Springer (2006).
56. Charnes, A., Cooper, W.W., Lewin, A.Y. and Seiford,L.M., Data Envelopment Analysis: Theory, Method-ology, and Applications, Springer Science & BusinessMedia (2013).
57. Golany, B. and Roll, Y. \An application procedure forDEA", Omega, 17(3), pp. 237-250 (1989).
58. Banker, R.D., Charnes, A. and Cooper, W.W. \Modelsfor the estimation of technical and scale ine�cienciesin data envelopment analysis", Management Science,30, pp. 1078-1092 (1984).
G. Polat and B.N. Bingol/Scientia Iranica, Transactions A: Civil Engineering 24 (2017) 497{511 511
59. Wong, B.K. and Lai, V.S. \A survey of the applicationof fuzzy set theory in production and operations man-agement 1998-2009", International Journal of Produc-tion Economics, 129(1), pp. 157-168 (2011).
Biographies
Gul Polat is an Associate Professor of Civil Engineer-ing at Istanbul Technical University, where she alsoserves as the Director of the Construction ManagementGraduate Program. She conducted her PhD studies atIstanbul Technical University and Illinois Institute ofTechnology in Chicago. Her main areas of researchinterest include decision support techniques, biddingstrategies, resource management, marketing manage-ment, risk management, precast concrete systems, andmost aspects of construction management. She hasbeen involved with several research projects fundedby The Scienti�c and Technological Research Councilof Turkey (TUBITAK), Istanbul Technical University
(ITU), Feyzi Akkaya Fund for Supporting Scienti�cActivities (FABED), and other construction industryagencies. Her research work over the years has resultedin 86 technical papers in refereed journals and proceed-ings.
She has served over the years on several organizingcommittees of national and international conferences.Dr. Polat is currently serving on the editorial board ofan international journal and routinely reviews papersfor several scholarly publications.
Befrin Neval Bingol is a Research Assistant in theDepartment of Civil Engineering at Istanbul TechnicalUniversity. She is currently a PhD candidate in theStructural Engineering program. She has been involvedwith two research projects funded by The Scienti�c andTechnological Research Council of Turkey (TUBITAK)and Istanbul Technical University (ITU). Her researchwork over the years has resulted in 19 technical papersin refereed journals and proceedings.
Related Documents