Scorecard Spot Check Evaluation BENAZIR INCOME SUPPORT PROGRAM (BISP) DATA ENTRY SPOT CHECK PHASE FOUR REPORT August 29, 2012

Welcome message from author
This document is posted to help you gain knowledge. Please leave a comment to let me know what you think about it! Share it to your friends and learn new things together.
Transcript
Scorecard Spot Check Evaluation
BENAZIR INCOME SUPPORT PROGRAM (BISP)
DATA ENTRY SPOT CHECK
PHASE FOUR REPORT
August 29, 2012

Table of Contents Introduction ................................................................................................................................ 1
Background ............................................................................................................................ 1
Methodology .......................................................................................................................... 1
Sample Size ............................................................................................................................ 2
Analysis tools ......................................................................................................................... 3
Implementation .......................................................................................................................... 4
Work Schedule ....................................................................................................................... 4
Logistics ................................................................................................................................. 4
Data Base Development and Data Entry ............................................................................... 4
Monitoring and Supervision of Data Entry ............................................................................ 5
Hiring and Training of Staff ...................................................................................................... 6
Hiring of Staff ........................................................................................................................ 6
Training .................................................................................................................................. 6
Analysis and Findings ................................................................................................................ 7
NADRA’s Data Entry Methodology ..................................................................................... 7
Usable Sample Size................................................................................................................ 7
Discrepant Households .......................................................................................................... 8
Frequency of Errors ............................................................................................................. 10
Calculation of PMT Score ................................................................................................... 12
PMT Score Discrepancy ...................................................................................................... 13
Discrepancy in PMT Scores of Non-Discrepant Households .............................................. 15
Findings.................................................................................................................................... 16
Conclusion ............................................................................................................................... 17
Annex 1: DEO wise discrepancy in questions ......................................................................... 18
List of Tables
Table 1: Data Entry Spot Check Phase 2 Sample ...................................................................... 2
Table 2: Data Entry Spot Check Phase 2 Sample-DEO Wise ................................................... 2
Table 3: Usable Sample ............................................................................................................. 7
Table 4: Usable Sample-DEO Wise .......................................................................................... 8
Table 5: Number of Discrepant Households .............................................................................. 9
Table 6: Number of Non Discrepant Households ...................................................................... 9
Table 7: Number of Discrepant Questions............................................................................... 10
Table 8: Number of Errors per Question ................................................................................. 11
Table 9: DEO Wise PMT Score Calculation ........................................................................... 12
Table 10: Reasons for not Calculating Score ........................................................................... 13
Table 11: PMT score Discrepancy ........................................................................................... 14
Table 12: Score Difference Range ........................................................................................... 14
Table 13: DEO wise Difference in Score Range ..................................................................... 15
Table 14: Non-discrepant households with Discrepancy in PMT scores ................................ 15
Table 15: Difference in data entry for the DEOs ..................................................................... 16
List of Figures
Figure 1 Discrepant Households ................................................................................................ 8
Figure 2 PMT Score Calculated by NADRA .......................................................................... 12
Figure 3 Reasons for Score not Calculated by NADRA.......................................................... 13

Data Entry Spot Check- Phase 4 Report
1
Introduction
Background The Benazir Income Support Program (BISP) was launched in 2008 by the Government of
Pakistan as the country’s primary social safety net. The idea behind this initiation is to
counter the effects of rising food and energy prices on poorer households. The BISP intends
to give a cash grant of PKR 1,000 per month to deserving poor families. Since an additional
purpose of the program is to empower women, therefore only the adult (above 18) female(s)
in a household are eligible to receive the cash grant. Eligibility is determined through the
calculation of Proxy Mean Test (PMT) score. Those falling below a predetermined cut off
point are determined as eligible to receive benefits through the program.
For this purpose households are surveyed by Partner Organizations (POs). The POs hand over
all collected information (T1 forms) to NADRA Headquarters, Islamabad. These are scanned
and sent for data entry across the country to the contracted Data Entry Organizations (DEOs).
The forms are entered in a MIS developed specifically for this program. This MIS allows for
entries such as names, CNIC, address, etc to be verified with NADRA’s database. The
software calculates the PMT scores of households and houses below the agreed PMT score
are identified.
Methodology IDS has been contracted by BISP to assess the accuracy of data entry conducted by NADRA.
This study evaluates the performance of the DEOs contracted by NADRA for data entry. For
this purpose a sample (batches) of scorecards selected from those completed by various
Partner Organizations (POs) who have been contracted to collect the scorecard information
by BISP, are entered for each of NADRA’s Data Entry Organization (DEO), by IDS into a
MIS system developed specifically for this purpose. This data is then compared with the
DEO entered data, to establish accuracy of data entry. The purpose of this component of the
spot check evaluation is to determine the performance of the DEO and the MIS. Batches
which fall within a pre-defined error margin are deemed to be accepted. Those that do not,
will be re-entered by the DEO.
The whole activity is to be divided over eight different phases. Phase 1 was completed in
August 2011. The second, third and fourth phase for the Data Entry spot check began when
IDS was provided scanned copies of the 8,800 forms by BISP on February 2, 2012.
The specific objectives of the data entry spot check are as follows:
Test the accuracy of data entry: determine the frequency of incorrect entries
Evaluate the performance of the DEOs1
Check to see if there are systematic errors e.g. if the frequency of error is higher for
particular questions or if frequency of errors are higher in particular offices of the DEOs
Identify the reasons behind discrepancy in data entry
1 Performance of DEO refers to how accurately the data entry stations enter data so that a comparison can be
made between them.

Data Entry Spot Check- Phase 4 Report
2
Sample Size The total sample size for the Data Entry Spot Check is 22,000 households. These were to be
divided equally among 8 phases, i.e. 2,750 households in each phase. However, it was
decided through discussion between IDS and BISP Project team to change the sample size to
2,200 households for the first phase. This sample was divided into three segments: Test
Phase, Initial Roll Out (Baluchistan) and National Roll Out. The remaining 550 households
from Phase 1 have been covered in Phase 2 and 3.
The sample size for the Data Entry Spot Check phase 2, 3 and 4,i.e 8,800 households, was
drawn from the 20,185 matched households of the Targeting Survey Spot Check Phase
1.These phases compare the performance of the different DEOs. The sample for Phase 4 of
the Data Entry Spot Check has been drawn from matched households from the following
districts, as shown in Table 1.
Table 1: Data Entry Spot Check Phase 2 Sample
District Number of Households
PESHAWAR 840
LARKANA 636
BADIN 791
ATTOCK 477
Total 2,744 Note: The remaining 5 households were covered in Data Entry Spot Check Phase 3. The sample size of the
households covered in Phase 2, 3 and 4 adds up to 8,800.
NADRA provided IDS with the sample divided over 7 DEOs for comparison of performance
across the different DEOs. The sample size of each DEO was selected in proportion to the
number of questionnaire each had entered from the matched Targeting Survey Spot Check
Phase 1 households.
Table 2: Data Entry Spot Check Phase 2 Sample-DEO Wise
DEO Sample Questionnaires
Deloitee 461
DPS 507
Information Architect 437
NIFT Islamabad 552
NIFT Karachi 3
System Limited 611
Others* 145
Total 2,744
*Others represent several DEOs with a very small sample size. These include NADRA Headquarters, PHQ Islamabad,
PHQ Peshawar, PHQ Karachi, PHQ Quetta, PHQ Lahore, RHQ Multan, RHQ Sukkur, RHQ Sargodha, VIP Headquarters,
Mayasco 360 Technology, Advance Technologies, NCBMS

Data Entry Spot Check- Phase 4 Report
3
Analysis tools Data entered by IDS is matched and compared with data entered by the DEOs. Indicators
have been formulated to measure the extent of discrepancies/incorrect entries and identify
their source. Analysis is conducted using indicators that look for systematic errors and
variability in accuracy across offices (DEOs). As such, the following indicators are used:
Question Indicator: This indicator measures the percentage of incorrect entries to
determine if particular questions have heightened inaccuracy.
DEO Indicator: This indicator measures the percentage of incorrect entries by each
DEO in order to identify DEOs with higher errors.
PMT Score Indicator: The percentage of households with difference in score
calculated by IDS and NADRA/DEO.
This is the Data Entry Spot Check Phase 4 Report which is provided as part of the overall
deliverables which are proceeding as scheduled.
Data Entry Spot Check- Phase 4 Report
4
Implementation
Work Schedule Each phase has a three month duration and follows a laid down work plan. During the first
month and halfway into the second month, the data is processed, cleaned and entered into
IDS’s software for data entry. For this purpose, a database has been created at IDS using SQL
Server 2000. From the end of the second month and into the third month the data is analyzed
and prepared for a report. By the end of the third month, a report is generated with key
findings and a conclusion.
However, the start-date for each phase of the Data Entry spot check is dependent on when the
sample questionnaires are made available. The start date proposed is when the data entry by
the DEOs and validation at NADRA is expected to be completed for any cluster. Scanned
copies of forms of the selected beneficiaries for this phase were received on February 2,
2012.
Logistics Project Coordinator (Operations) is the overall in charge of the whole of Data Entry Spot
Check activity. All communication with BISP Headquarters and NADRA including transfer
of data, reports at required interval and other deliverables take place through the Project
Coordinator (Operations). The IDS head office supervises the overall activity and
performance of the team members. The MIS Manager is responsible for managing all tasks
that involve data at various stages. His major responsibilities include: receiving data from the
BISP office, development of software for data entry and processing, testing of software,
supervising the key punch operators (KPOs) and data editors in data entry and cleaning
process, processing data to ensure accuracy and readability to carry out further analysis
including the indicators defined in the preceding section.
Key Punch Operators (KPOs) are responsible for data entry into the software specially
designed for this activity. KPOs work in close coordination with data editors and MIS
Manager. The KPOs hired for Phase 2 were the same as in Phase 1. These KPOs had already
gone through the three days training workshop in the first phase and had been tested by
holding a mock data entry exercise using the developed software in order to qualify for the
real task. Since the KPOs had already attended the training sessions, they went through a one
day refresher for this phase. Software data editors are responsible for reviewing and cleaning
data entered by the KPOs and providing them feedback on their performance in order to rule
out human error at data entry stage at IDS. Data analysts work in close coordination with the
MIS Manager and department in generating the indicators defined and report writing.
Data Base Development and Data Entry
A database has been created at IDS using SQL Server 2000. Data entry is carried out on the
basis of double entry and checked carefully to ensure near perfect accuracy providing a
strong base against which to compare the DEOs’ data entry. When a form is entered once by
a KPO, a unique key is generated, and a colored tag is placed on the form which has
information about the name of the KPO, identification code of the KPO who entered the form
Data Entry Spot Check- Phase 4 Report
5
into the software, source of data (office) which in this case is NADRA, number of times the
form has been entered into the software i.e., first or second entry, unique key generated by the
software on completion of each form, survey phase, quarter number and date of data entry.
This is to ensure that each form is entered twice and the unique key ensures traceability of the
form in case errors during the data entry need to be corrected. The forms entered twice, as
indicated by the information completed on the tag are passed on to the MIS department.
Monitoring and Supervision of Data Entry
Once the data had been entered into the software, editors in the MIS department review the
data entered of each part of the T1 form in order to clean data of any data entry errors. For
further verification, both data sets are transferred to SPSS (at random intervals) in order to
allow for a comparison of the software. This allows any bugs in the software to be detected.
Once the data is verified, it is made available for analysis. The MIS manager then works in
close coordination with the data analysts to get the required outputs for the reports.
Data Entry Spot Check- Phase 4 Report
6
Hiring and Training of Staff
Hiring of Staff All staff hired for the Data Entry Spot Check had at least a bachelor degree; preference was
given to staff from IDS’s existing roster. A total of 20 Key Punch Operators (KPOs) worked
on a full time basis for the period under report. Additionally, IDS hired Quality Control
Officers (software) who were responsible for cleaning the data entered by the KPOs and
providing feedback on performance in order to minimize human error.
Training As already stated IDS organized a one day refresher session for the KPOs and Quality
Control Officers (QCOs) at the IDS head office in March, 2011. The KPOs hired for this
phase were the same as the previous phase and were familiar with the questionnaire and the
software. The purpose of the one day refresher was to review the understanding of the
questionnaire, data entry software and different quality/security protocols for data entry.
Data Entry Spot Check- Phase 4 Report
7
Analysis and Findings
NADRA’s Data Entry Methodology NADRA calculates the age of household members according to the rule:
“If Date of birth is given then age is calculated with following formula DOB –
Current Fiscal Year (2011-07-01), otherwise given age is considered”
IDS was not issued these instructions by the World Bank or BISP and hence had previously
calculated the age of household members as per the date of interview. This has an implication
on the number of dependents and children’s education.
Room Ratio is a ratio of the number of rooms to the number of household members. As per
instructions issued by The World Bank, the total number of household members was to be
calculated from the household roster. However, as confirmed, NADRA considers the number
of household members as entered for question 24(back side of the questionnaire) when
calculating the room ratio2.
The analysis in this report is based on NADRA’s data entry methodology.
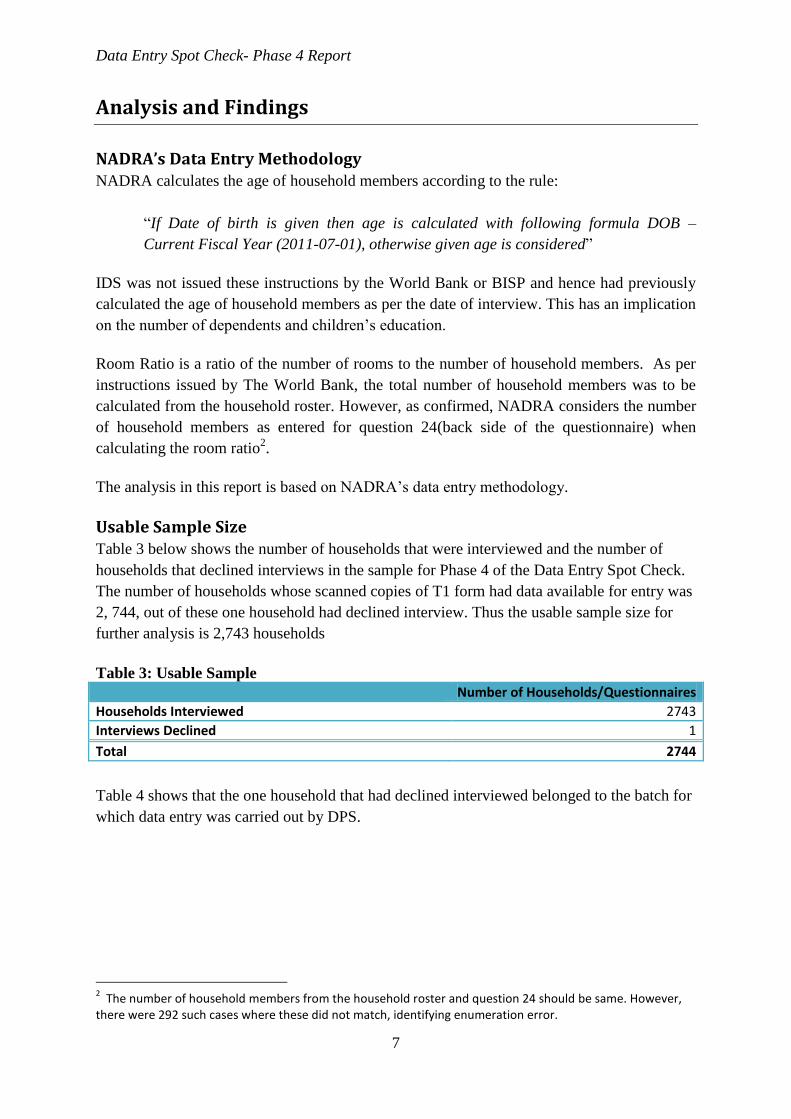
Usable Sample Size Table 3 below shows the number of households that were interviewed and the number of
households that declined interviews in the sample for Phase 4 of the Data Entry Spot Check.
The number of households whose scanned copies of T1 form had data available for entry was
2, 744, out of these one household had declined interview. Thus the usable sample size for
further analysis is 2,743 households
Table 3: Usable Sample
Number of Households/Questionnaires
Households Interviewed 2743
Interviews Declined 1
Total 2744
Table 4 shows that the one household that had declined interviewed belonged to the batch for
which data entry was carried out by DPS.
2 The number of household members from the household roster and question 24 should be same. However,
there were 292 such cases where these did not match, identifying enumeration error.

Data Entry Spot Check- Phase 4 Report
8
Table 4: Usable Sample-DEO Wise
DEO Sample Size Households Interviewed Interviews Declined
Deloitee 461 461 0
DPS 507 506 1
Information Architect 437 437 0
NIFT Islamabad 552 552 0
NIFT Karachi 31 31 0
System Limited 611 611 0
Others 145 145 0
Total 2744 2743 1
Discrepant Households A discrepancy is identified when there is a difference between data entered for a question by
NADRA/DEO and data entered for the same question by IDS. A discrepant household is a
household for which there is a discrepancy in at least one question. As the figure 1 below
shows, overall there were 5% discrepant households.
Figure 1 Discrepant Households
Table 5 shows the DEO wise percentage of data entry errors. For all DEOs except DPS and
System Limited the percentage of this error was more than 3 percent. It was the highest for
NIFT Islamabad, i.e. 10.7% of its respective sample with errors in data entry.
95%
5%
Non-Discrepant Household Discrepant Household
Data Entry Spot Check- Phase 4 Report
9
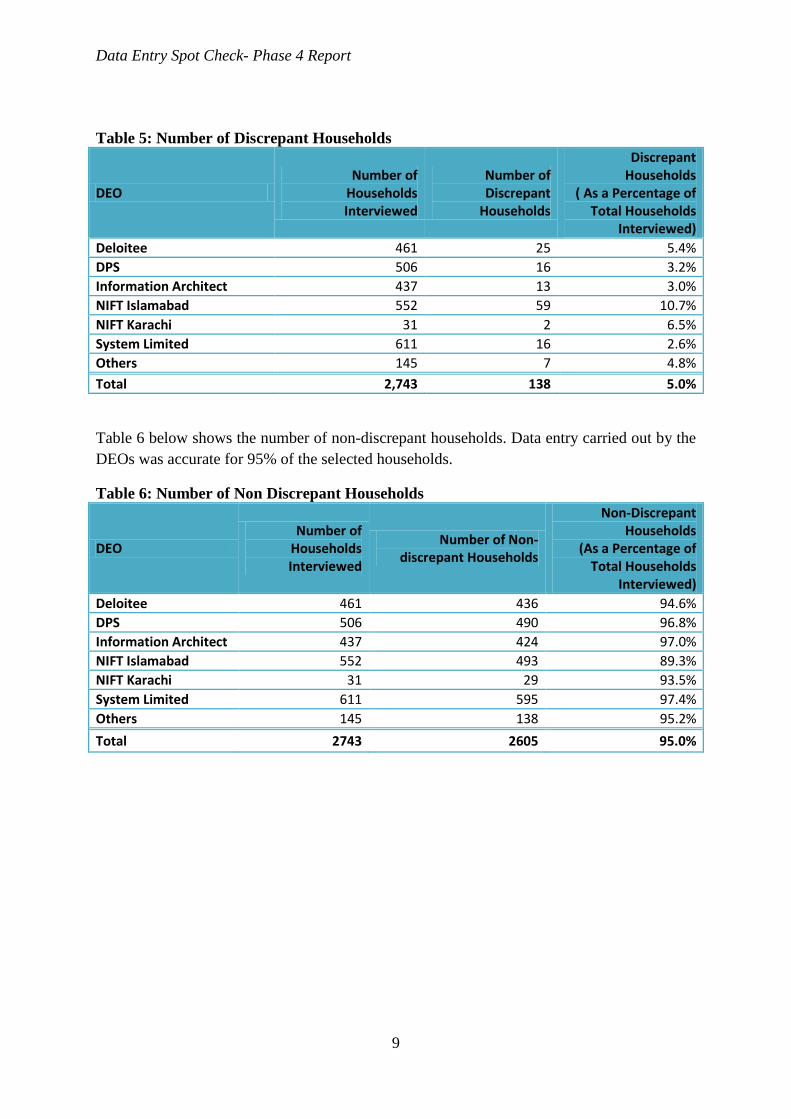
Table 5: Number of Discrepant Households
DEO Number of
Households Interviewed
Number of Discrepant
Households
Discrepant Households
( As a Percentage of Total Households
Interviewed)
Deloitee 461 25 5.4%
DPS 506 16 3.2%
Information Architect 437 13 3.0%
NIFT Islamabad 552 59 10.7%
NIFT Karachi 31 2 6.5%
System Limited 611 16 2.6%
Others 145 7 4.8%
Total 2,743 138 5.0%
Table 6 below shows the number of non-discrepant households. Data entry carried out by the
DEOs was accurate for 95% of the selected households.
Table 6: Number of Non Discrepant Households
DEO Number of
Households Interviewed
Number of Non-discrepant Households
Non-Discrepant Households
(As a Percentage of Total Households
Interviewed)
Deloitee 461 436 94.6%
DPS 506 490 96.8%
Information Architect 437 424 97.0%
NIFT Islamabad 552 493 89.3%
NIFT Karachi 31 29 93.5%
System Limited 611 595 97.4%
Others 145 138 95.2%
Total 2743 2605 95.0%

Data Entry Spot Check- Phase 4 Report
10
Frequency of Errors The frequency of errors is measured by the number of questions with erroneous data entry.
Table 7 below summarizes the number of households for different number of errors. Majority
of the discrepant households had errors in the data entry of one question. The maximum
number of data entry errors for a household was in eight questions. There was only one such
case.
Table 7: Number of Discrepant Questions
DEO Number of Discrepant Questions In Each Household
1 2 3 4 5 6 7 8
Deloitee 18 4 2 1 0 0 0 0
DPS 13 1 1 0 1 0 0 0
Information Architect 8 5 0 0 0 0 0 0
NIFT Islamabad 42 14 0 1 0 0 1 1
NIFT Karachi 2 0 0 0 0 0 0 0
System Limited 16 0 0 0 0 0 0 0
Others 6 1 0 0 0 0 0 0
Total 105 25 3 2 1 0 1 1
Table 8 shows the number of errors for each question. Most of the differences identified
were in the data entry of the number of dependents and children’s education. The number of
dependents and children’s education did not match for 28% and 26%, respectively, of the 138
discrepant households. Both of these are not directly taken from the questionnaire but depend
on the age calculated of the household members listed in the roster3. IDS followed the
methodology as shared by NADRA for the calculation of age. Hence, the discrepancy in
these variables can be attributed to errors in data entry.
3 For questionnaires following the old format children’s education was taken from the back side and did not
depend on the age calculation.

Data Entry Spot Check- Phase 4 Report
11
Table 8: Number of Errors per Question
Question Number of Errors
Discrepancy in Number of Dependents 39
Discrepancy in Children Education 36
Discrepancy in Household Head Education 15
Discrepancy in TV Ownership 10
Discrepancy in Room Ratio 9
Discrepancy in Number of Rooms 9
Discrepancy in Washing Machine Ownership 7
Discrepancy in Cooking Stove Ownership 6
Discrepancy in Sheep Ownership 5
Discrepancy in Number of Household Members (as per roster) 5
Discrepancy in Cow Ownership 5
Discrepancy in Buffalo Ownership 4
Discrepancy in Bull Ownership 4
Discrepancy in Tractor Ownership 4
Discrepancy in Refrigerator Ownership 4
Discrepancy in Goat Ownership 3
Discrepancy in Number of Household Members( Based on Part B) 3
Discrepancy in Heater Ownership 3
Discrepancy in Air Cooler Ownership 3
Discrepancy in Freezer Ownership 3
Discrepancy in Motorcycle Ownership 2
Discrepancy in Cooking Range Ownership 2
Discrepancy in Scooter Ownership 2
Discrepancy in Microwave Oven Ownership 2
Discrepancy in Toilet Ownership 2
Discrepancy in Land Unit 1
Discrepancy in Car Ownership 1
Discrepancy in AC Ownership 1
Discrepancy in Geyser Ownership 1
Discrepancy in Land Area 1
Total 192
When analyzed across DEOs, number of dependents and children’s education remain
questions with the most discrepancies. (See Annex 1 for DEO wise results)

Data Entry Spot Check- Phase 4 Report
12
Calculation of PMT Score Figure 2 below shows that PMT scores were not calculated by NADRA for 11% of the total
households interviewed. Thus, the PMT score calculation has been compared for the
remaining 89% of the households interviewed.
Figure 2 PMT Score Calculated by NADRA
Of the total households interviewed for each DEO, Information Architect had the higher
proportion of households for which PMT scores were not calculated, i.e. 18.8%. For all other
DEOs this percentage was higher than 4 %. See table 9 below.
Table 9: DEO Wise PMT Score Calculation
DEO Number of
Households Interviewed
PMT Score Calculated by NADRA
Percentage of Total
Households Interviewed
PMT Score Not
Calculated by NADRA
Percentage of Total
Households Interviewed
Deloitee 461 421 91.3% 40 8.7%
DPS 506 461 91.1% 45 8.9%
Information Architect 437 355 81.2% 82 18.8%
NIFT Islamabad 552 500 90.6% 52 9.4%
NIFT Karachi 31 29 93.5% 2 6.5%
System Limited 611 546 89.4% 65 10.6%
Others 145 138 95.2% 7 4.8%
Total 2,743 2,450 89.3% 293 10.7%
NADRA does not calculate the PMT scores for households that are marked as empty,
annulled or discrepant. As per NADRA a discrepant household is defined as a household for
which there are enumeration errors in the questionnaire, for example, a response was not
selected for one or more questions or multiple responses were chosen for a single response
11%
89%
Score Not Calculated by NADRA Score Calculated byNADRA
Data Entry Spot Check- Phase 4 Report
13
question. In this case it is not possible to determine the true answer. Thus, the household is
marked as discrepant and the score is not calculated.
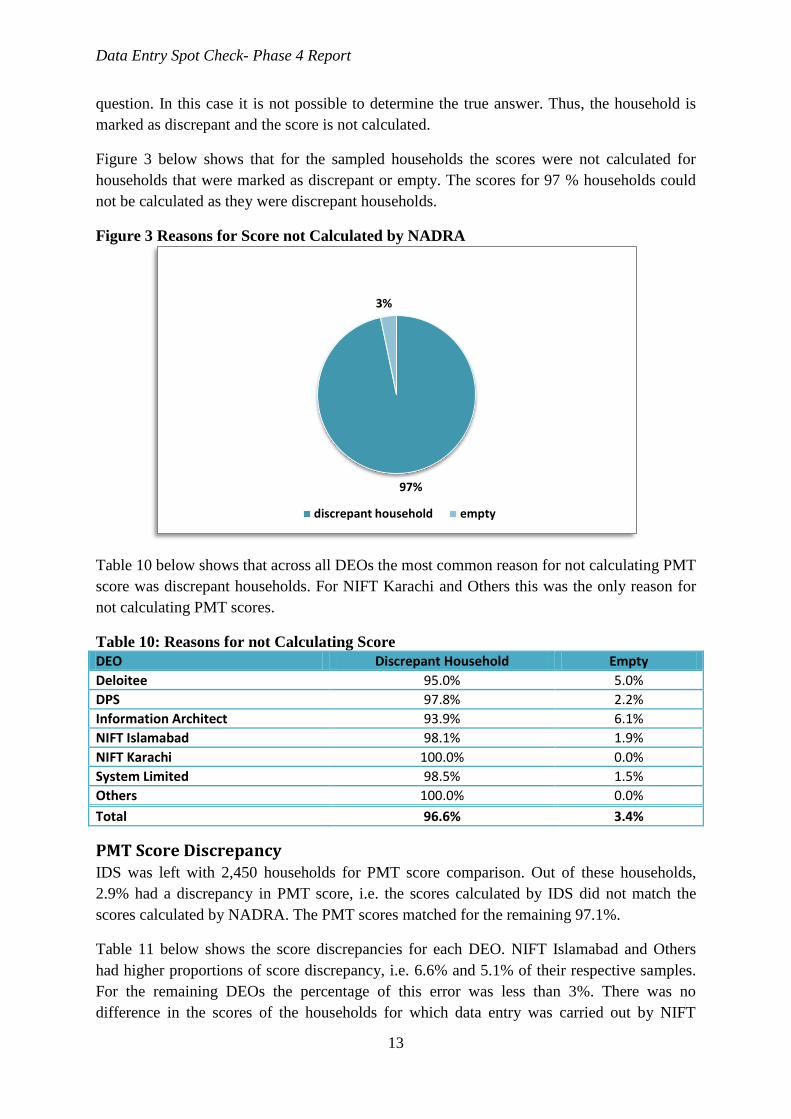
Figure 3 below shows that for the sampled households the scores were not calculated for
households that were marked as discrepant or empty. The scores for 97 % households could
not be calculated as they were discrepant households.
Figure 3 Reasons for Score not Calculated by NADRA
Table 10 below shows that across all DEOs the most common reason for not calculating PMT
score was discrepant households. For NIFT Karachi and Others this was the only reason for
not calculating PMT scores.
Table 10: Reasons for not Calculating Score
DEO Discrepant Household Empty
Deloitee 95.0% 5.0%
DPS 97.8% 2.2%
Information Architect 93.9% 6.1%
NIFT Islamabad 98.1% 1.9%
NIFT Karachi 100.0% 0.0%
System Limited 98.5% 1.5%
Others 100.0% 0.0%
Total 96.6% 3.4%
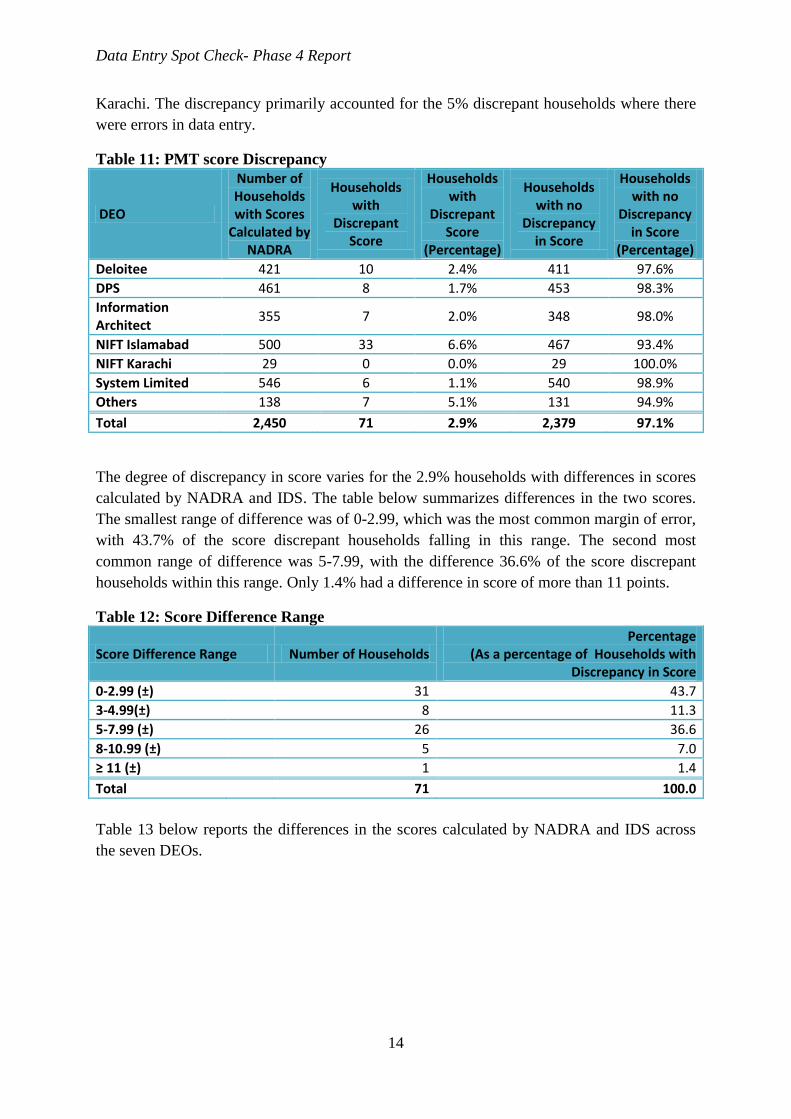
PMT Score Discrepancy IDS was left with 2,450 households for PMT score comparison. Out of these households,
2.9% had a discrepancy in PMT score, i.e. the scores calculated by IDS did not match the
scores calculated by NADRA. The PMT scores matched for the remaining 97.1%.
Table 11 below shows the score discrepancies for each DEO. NIFT Islamabad and Others
had higher proportions of score discrepancy, i.e. 6.6% and 5.1% of their respective samples.
For the remaining DEOs the percentage of this error was less than 3%. There was no
difference in the scores of the households for which data entry was carried out by NIFT
97%
3%
discrepant household empty
Data Entry Spot Check- Phase 4 Report
14
Karachi. The discrepancy primarily accounted for the 5% discrepant households where there
were errors in data entry.
Table 11: PMT score Discrepancy
DEO
Number of Households with Scores
Calculated by NADRA
Households with
Discrepant Score
Households with
Discrepant Score
(Percentage)
Households with no
Discrepancy in Score
Households with no
Discrepancy in Score
(Percentage)
Deloitee 421 10 2.4% 411 97.6%
DPS 461 8 1.7% 453 98.3%
Information Architect
355 7 2.0% 348 98.0%
NIFT Islamabad 500 33 6.6% 467 93.4%
NIFT Karachi 29 0 0.0% 29 100.0%
System Limited 546 6 1.1% 540 98.9%
Others 138 7 5.1% 131 94.9%
Total 2,450 71 2.9% 2,379 97.1%
The degree of discrepancy in score varies for the 2.9% households with differences in scores
calculated by NADRA and IDS. The table below summarizes differences in the two scores.
The smallest range of difference was of 0-2.99, which was the most common margin of error,
with 43.7% of the score discrepant households falling in this range. The second most
common range of difference was 5-7.99, with the difference 36.6% of the score discrepant
households within this range. Only 1.4% had a difference in score of more than 11 points.
Table 12: Score Difference Range
Score Difference Range Number of Households Percentage
(As a percentage of Households with Discrepancy in Score
0-2.99 (±)
31 43.7
3-4.99(±)
8 11.3
5-7.99 (±)
26 36.6
8-10.99 (±)
5 7.0
≥ 11 (±)
1 1.4
Total
71 100.0
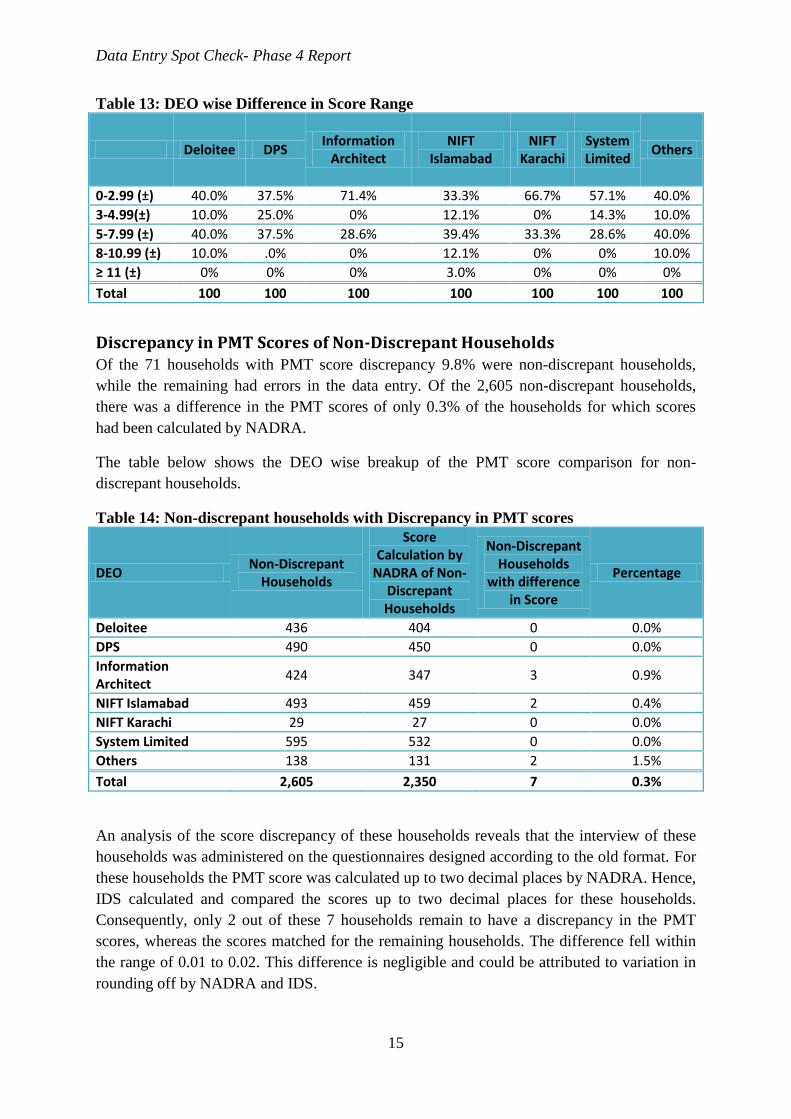
Table 13 below reports the differences in the scores calculated by NADRA and IDS across
the seven DEOs.
Data Entry Spot Check- Phase 4 Report
15
Table 13: DEO wise Difference in Score Range
Deloitee DPS Information
Architect NIFT
Islamabad NIFT
Karachi System Limited
Others
0-2.99 (±) 40.0% 37.5% 71.4% 33.3% 66.7% 57.1% 40.0%
3-4.99(±) 10.0% 25.0% 0% 12.1% 0% 14.3% 10.0%
5-7.99 (±) 40.0% 37.5% 28.6% 39.4% 33.3% 28.6% 40.0%
8-10.99 (±) 10.0% .0% 0% 12.1% 0% 0% 10.0%
≥ 11 (±) 0% 0% 0% 3.0% 0% 0% 0%
Total 100 100 100 100 100 100 100
Discrepancy in PMT Scores of Non-Discrepant Households Of the 71 households with PMT score discrepancy 9.8% were non-discrepant households,
while the remaining had errors in the data entry. Of the 2,605 non-discrepant households,
there was a difference in the PMT scores of only 0.3% of the households for which scores
had been calculated by NADRA.
The table below shows the DEO wise breakup of the PMT score comparison for non-
discrepant households.
Table 14: Non-discrepant households with Discrepancy in PMT scores
DEO Non-Discrepant
Households
Score Calculation by
NADRA of Non-Discrepant Households
Non-Discrepant Households
with difference in Score
Percentage
Deloitee 436 404 0 0.0%
DPS 490 450 0 0.0%
Information Architect
424 347 3 0.9%
NIFT Islamabad 493 459 2 0.4%
NIFT Karachi 29 27 0 0.0%
System Limited 595 532 0 0.0%
Others 138 131 2 1.5%
Total 2,605 2,350 7 0.3%
An analysis of the score discrepancy of these households reveals that the interview of these
households was administered on the questionnaires designed according to the old format. For
these households the PMT score was calculated up to two decimal places by NADRA. Hence,
IDS calculated and compared the scores up to two decimal places for these households.
Consequently, only 2 out of these 7 households remain to have a discrepancy in the PMT
scores, whereas the scores matched for the remaining households. The difference fell within
the range of 0.01 to 0.02. This difference is negligible and could be attributed to variation in
rounding off by NADRA and IDS.

Data Entry Spot Check- Phase 4 Report
16
Findings
• One interview was declined from the scanned copies of T1 forms received. This
reduced the usable sample size to 2,743.
• Despite the numerous safeguards such as the double entry system, inbuilt checks and
rigorous monitoring systems, used by the DEOs, data entry errors exist
• Discrepancy in data entry was found to be 5% in the sample analyzed
• For all DEOs except System Limited and Information Architect the percentage of this
error was more than 3 percent. . It was highest for NIFT Islamabad with 10.7%
discrepant households.
• Data entry errors were only in 1 question for 76% of the total discrepant households
• Two questions in which discrepancy is larger are: 1) Number of dependents – 28%
and 2) Children’s education - 26%,
• NADRA for reasons specified earlier has been unable to calculate the PMT score of
11% of the sample households.
• Of the remaining 89 %( 2,450) households whose PMT score was calculated, 97.1%
of the PMT scores calculated by NADRA and IDS matched. In case of 2.9% or 71
households the PMT Score did not match. This is primarily because of the 5%
discrepant households where data entry errors were committed.
• Of the 2,605 non-discrepant households, the PMT scores did not match for 0.3%( 7
households).
• The scores of these 7 households were calculated by BISP up to two decimal places
while scores for all other households and score by IDS were calculated up to 7
decimal places. Score discrepancy remained for only 2 of these households even when
compared to 2 decimal places. The difference fell within the range of 0.01 to 0.02.
This difference in negligible and could be attributed to variation in rounding off by
NADRA and IDS.
• The discrepancy in data entry and PMT score calculation is summarized below
Table 15: Difference in data entry for the DEOs
DEO Errors in Data Entry PMT score not
calculated by NADRA Discrepancy in
PMT Score
Deloitee 5.4% 8.7% 2.4%
DPS 3.2% 8.9% 1.7%
Information Architect 3.0% 18.8% 2.0%
NIFT Islamabad 10.7% 9.4% 6.6%
NIFT Karachi 6.5% 6.5% 0.0%
System Limited 2.6% 10.6% 1.1%
Others 4.8% 4.8% 5.1%
Total 5.0% 10.7% 2.9%

Data Entry Spot Check- Phase 4 Report
17
Conclusion
Like the previous two phases of the Data Entry Spot Check, the fourth phase was carried out
to give a detailed outline of the quality of the data entry in the seven DEO’s that were
mentioned earlier. This analysis shows us that System Limited had errors below 3%, which
made them the DEO’s with the lowest number of errors; they also had the lowest difference
in PMT scores. On the other hand, NIFT Islamabad and those DEOs that came under the title
of ‘Other’, showed the greatest errors in data entry as well as the greatest difference in PMT
scores.

Data Entry Spot Check- Phase 4 Report
18
Annex 1: DEO wise discrepancy in questions
Question
De
loit
ee
DP
S
Info
rmat
ion
Arc
hit
ect
NIF
T Is
lam
abad
NIF
T K
arac
hi
Oth
ers
Syst
em
Lim
ite
d
Tota
l
Discrepancy in Number of Dependents 5 5 5 13 1 3 7 39
Discrepancy in Children Education 5 9 6 6 0 4 6 36
Discrepancy in Household Head Education 3 1 1 9 0 0 1 15
Discrepancy in TV Ownership 1 2 0 7 0 0 0 10
Discrepancy in Room Ratio 5 0 1 3 0 0 0 9
Discrepancy in Number of Rooms 5 0 1 3 0 0 0 9
Discrepancy in Washing Machine Ownership 1 0 0 6 0 0 0 7
Discrepancy in Cooking Stove Ownership 1 0 0 5 0 0 0 6
Discrepancy in Sheep Ownership 0 0 1 4 0 0 0 5
Discrepancy in Number of Household Members (as per roster) 1 1 0 2 0 0 1 5
Discrepancy in Cow Ownership 3 0 0 1 1 0 0 5
Discrepancy in Buffalo Ownership 1 0 1 2 0 0 0 4
Discrepancy in Bull Ownership 1 0 1 1 0 1 0 4
Discrepancy in Tractor Ownership 0 0 1 3 0 0 0 4
Discrepancy in Refrigerator Ownership 2 0 0 2 0 0 0 4
Discrepancy in Goat Ownership 1 0 0 2 0 0 0 3
Discrepancy in Number of Household Members( Based on Part B) 0 0 0 2 0 0 1 3
Discrepancy in Heater Ownership 0 0 0 3 0 0 0 3
Discrepancy in Air Cooler Ownership 0 0 0 3 0 0 0 3
Discrepancy in Freezer Ownership 0 2 0 1 0 0 0 3
Discrepancy in Motorcycle Ownership 1 0 0 1 0 0 0 2
Discrepancy in Cooking Range Ownership 0 0 0 2 0 0 0 2
Discrepancy in Scooter Ownership 0 1 0 1 0 0 0 2
Discrepancy in Microwave Oven Ownership 0 1 0 1 0 0 0 2
Discrepancy in Toilet Ownership 0 0 0 2 0 0 0 2
Discrepancy in Land Unit 0 0 0 1 0 0 0 1
Discrepancy in Car Ownership 0 0 0 1 0 0 0 1
Discrepancy in AC Ownership 0 1 0 0 0 0 0 1
Discrepancy in Geyser Ownership 0 0 0 1 0 0 0 1
Discrepancy in Land Area 0 0 0 1 0 0 0 1
Total 36 23 18 89 2 8 16 192
Related Documents