Andrew Patricio | T 571.216.2003 | www.dataeffectiveness.com Data Effectiveness The Consistency, Accuracy, Relevancy cycle Council of Great City Schools Annual Academic, Information Technology and Research Conference 11 July 2016

Data Effectiveness: How to build a Data Driven and Reporting infrastructure
Apr 15, 2017
Welcome message from author
This document is posted to help you gain knowledge. Please leave a comment to let me know what you think about it! Share it to your friends and learn new things together.
Transcript

Andrew Patricio | T 571.216.2003 | www.dataeffectiveness.com
Data EffectivenessThe Consistency, Accuracy, Relevancy cycle
Council of Great City SchoolsAnnual Academic, Information Technology and Research Conference11 July 2016

Introduction
2

Agenda
IntroductionWhat is Data Effectiveness?Data Reporting IssuesData Quality CultureConsistency, Relevancy, Accuracy Reporting PlatformManaging Data RequestsSelf Service ReportingSummary
Data Effectiveness
Data Effectiveness CGCS Annual Academic, Information Technology and Research Conference 3

DCPS FactsLed by Chancellor Kaya Henderson since 201048000+ students (steady increase for the past 5 years) in 111 schools• 60 Elementary Schools• 11 Middle Schools• 18 Education Campuses (usually Preschool through 8th grade)• 15 High Schools• 7 other (Special Ed etc)
6800+ school staff (3600+ teachers)600+ central office staff
Data Effectiveness
Data Effectiveness CGCS Annual Academic, Information Technology and Research Conference 4
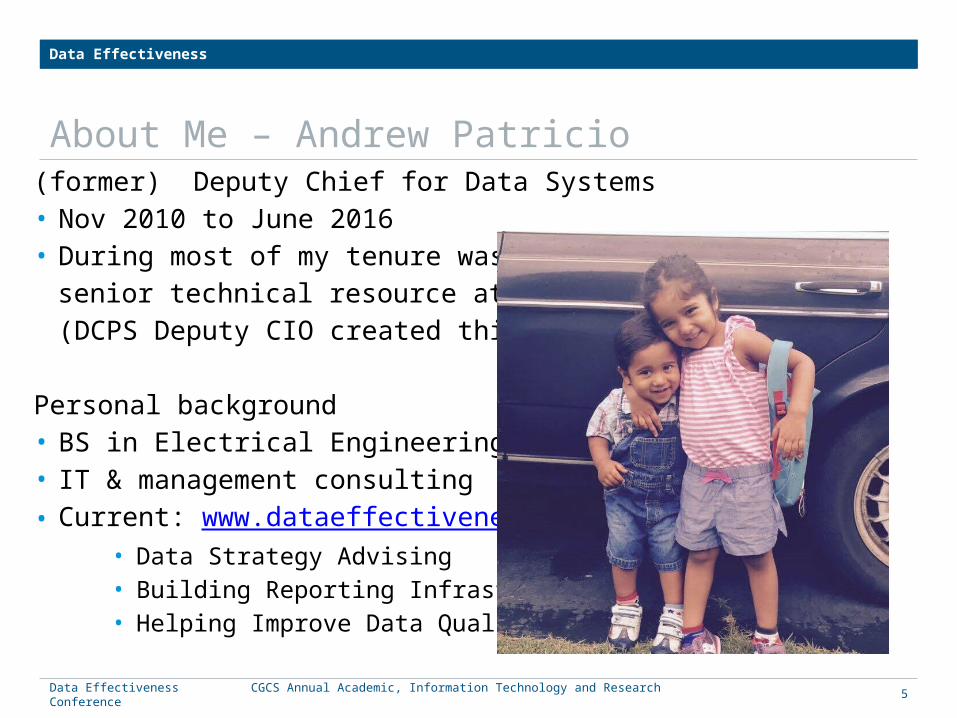
About Me – Andrew Patricio (former) Deputy Chief for Data Systems• Nov 2010 to June 2016• During most of my tenure was the most
senior technical resource at DCPS(DCPS Deputy CIO created this year)
Personal background• BS in Electrical Engineering• IT & management consulting• Current: www.dataeffectiveness.com
• Data Strategy Advising• Building Reporting Infrastructure• Helping Improve Data Quality
Data Effectiveness
Data Effectiveness CGCS Annual Academic, Information Technology and Research Conference 5

Data Effectiveness
6

Data Driven Decision MakingAll organizations seek to make decisions based on data
Data Effectiveness
Data Effectiveness CGCS Annual Academic, Information Technology and Research Conference 7

Data Reality
But the reality is that the data we have available is often in poor shape
Data Effectiveness
Data Effectiveness CGCS Annual Academic, Information Technology and Research Conference 8

Getting to Data Driven – Data PrepChallenge is usually not analysis, it is getting the data ready to analyze76% of data scientists find data prep the least enjoyable data science task
Source:http://www.forbes.com/sites/gilpress/2016/03/23/data-preparation-most-time-consuming-least-enjoyable-data-science-task-survey-says/#7ee06c277f75
Getting the data is 90% of the work
Data Effectiveness
Data Effectiveness CGCS Annual Academic, Information Technology and Research Conference 9

Getting to Data Driven – Reporting vs Analytics
Steve Levitt, Freakonomics Podcast, 26 June 2014“Yeah, I think the hardest single thing is that even if you have the desire … to be data driven, that the existing systems…I never would have thought this before I started working with companies. I never would have imagined that it is an I.T. problem that you simply cannot get the data you want, and the data are held in 27 different data sets that have different identifiers … the I.T. support and the complexity in these big firms blows your mind about how hard it is to do the littlest, simple things.”
Data analysts are NOT necessarily technologists
Data Effectiveness
Data Effectiveness CGCS Annual Academic, Information Technology and Research Conference 10

Survey results – Reporting vs Analytics structure
80% have dedicated reporting team with analytics function distributed throughout organization
Data Effectiveness
Data Effectiveness CGCS Annual Academic, Information Technology and Research Conference 11

DCPS Structure
Data Effectiveness
12District of Columbia Public Schools | 2015 CGCS CIO Conference
Data Reporting Team
Data and Strategy
data analysts
How to handle workload and deal with varying levels of data quality?Data Effectiveness
Program data analyst
Program data analyst
…
Central Data reporting team pulls student data from backend systems
• Complicated data pulls• Data reporting self-service support
Data and Strategy data analysts collaborate with data analysis in different offices• Assists in vetting data requests• Volume of requests means capacity is an issue
DCPS is very data driven so reporting tends to be bottleneck

Data Driven Decision MakingHigh performance data analytics…
Data Effectiveness
Data Effectiveness CGCS Annual Academic, Information Technology and Research Conference 13
Requires pragmatic data reporting
…in the real world of data

Data Driven Pipeline
Data Effectiveness
Data Effectiveness CGCS Annual Academic, Information Technology and Research Conference 14
Data Reporting
Data Analytics
Effective data
Programs / Business
Effective decisions
Effective outcomes
Product of business is Effective Outcomes Product of analytics is Effective DecisionsProduct of reporting is Effective Data

What is Data Effectiveness?
Data Effectiveness is primary responsibility of reporting
Data Effectiveness
Data Effectiveness CGCS Annual Academic, Information Technology and Research Conference 15
Data Reporting
Effective data
Data Analytics
Programs / Business
Effective decisions
Effective outcomes
Being effectively data driven starts with Data Effectiveness:
Getting good data, when it is needed, to who needs it

Data Reporting Issues
Data Effectiveness CGCS Annual Academic, Information Technology and Research Conference 16
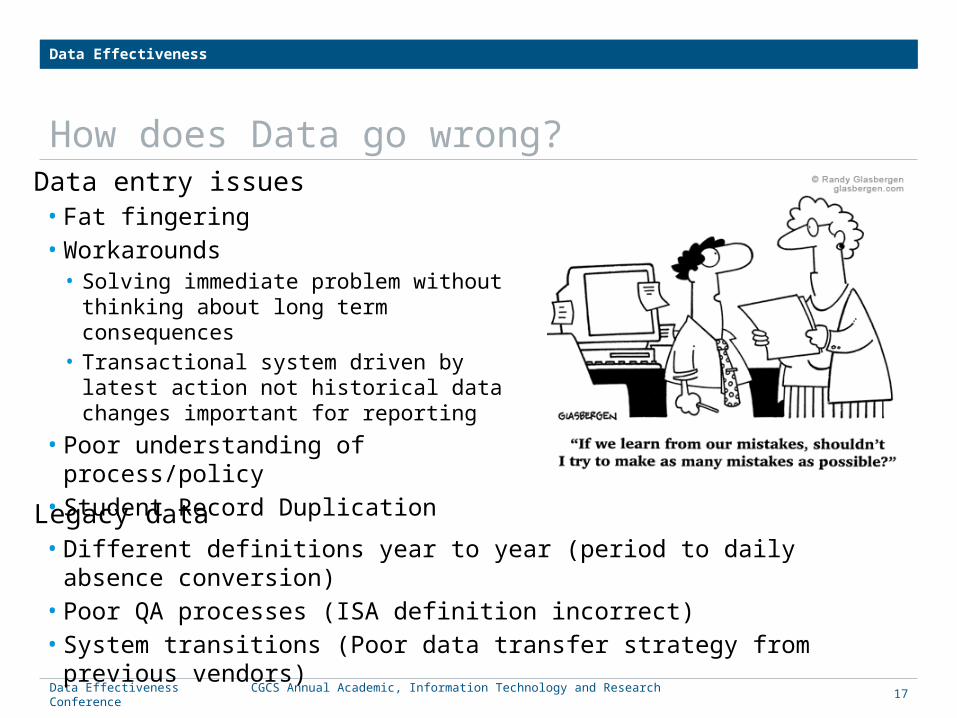
How does Data go wrong?Data entry issues• Fat fingering• Workarounds
• Solving immediate problem without thinking about long term consequences
• Transactional system driven by latest action not historical data changes important for reporting
• Poor understanding of process/policy• Student Record Duplication
Data Effectiveness
Data Effectiveness CGCS Annual Academic, Information Technology and Research Conference 17
Legacy data • Different definitions year to year (period to daily absence conversion)• Poor QA processes (ISA definition incorrect)• System transitions (Poor data transfer strategy from previous vendors)

Data Issues 1End of year attendance example (1 particular school)
Data Effectiveness
Data Effectiveness CGCS Annual Academic, Information Technology and Research Conference 18
Date report run SY13-14 End of year Average Daily Attendance (ADA)
July 2014 95%
October 2014 92%
• How could attendance for the year change after the year is over?! • Initially assumed that there was a bug in second report• Turns out reason behind nonsensical error was that school registrar was changing
enrollment date from Aug 2013 to Aug 2014 so that those kids did not look like they were enrolled in the 2013-2014 school year any longer
Result:• Students who were present in SY13-14 data in June were missing in October,
severely skewing the data

Data Issues 2Example: Enrollment overlapsStudent Information System (SIS) is transactional system, only tracks current state
• For enrollment it doesn’t care about data values in enrollment history• Only cares about latest enrollment action (admit or withdrawal) and school• Actual enrollment history in system is merely log of events • Users can willy-nilly adjust enrollment history with no effect on current status
Data Effectiveness
Data Effectiveness CGCS Annual Academic, Information Technology and Research Conference 19

Data Issues 3School Dashboard vs Weekly reports
Idea was to get more regularly updated data to schoolsInconsistencies reduced trust in data
Data Effectiveness
Data Effectiveness CGCS Annual Academic, Information Technology and Research Conference 20
Two different queries implementing the same metric but poor data quality meant slightly different answers. Example:
• “Current School” on student table used for dashboard queries• Didn’t always match school based on enrollment history used in reports

Survey Results – data issuesChallenges to data reporting at your district (11 responses)
Data Effectiveness
Data Effectiveness CGCS Annual Academic, Information Technology and Research Conference 21
Area total max min avg stddevRequirements - business rules are communicated clearly 36 5 2 3.27 0.96Siloed data - correlating data from different systems 36 5 1 3.27 1.29Validity - keeping number of data entry errors low 35 5 1 3.18 1.27Capacity - managing the number of report requests 33 5 2 3.00 1.35Efficiency - quick delivery of report when requested 32 4 1 2.91 0.90Complexity - reports requests easily coded 30 4 1 2.73 1.05Repeatability - recreating same metric in various reports 28 5 1 2.55 1.44Veracity - data values match reality 27 3 1 2.45 0.78Reliability - data reports do not often need rework 26 4 1 2.36 0.88Utility - data reports are useful and relevant 25 3 1 2.27 0.86

Fixing Data QualityHow do we make our data more effective given these challenges?
Data Effectiveness
Data Effectiveness CGCS Annual Academic, Information Technology and Research Conference 22
Improve Data Quality long term?
Make data driven decisions today?

Long term – Data Quality Culture
Data Effectiveness CGCS Annual Academic, Information Technology and Research Conference 23

Legacy issues – Once you’ve identified and fixed these, they will not returnOngoing issue is data entry problem
• Need to balance flexibility/freedom of entry with validation checks• Most systems can validate based on patterns or entries but do not have enough flexibility to
differentiate between other valid and invalid entries
Data Entry - Front End Validation?
Data Effectiveness
Data Effectiveness CGCS Annual Academic, Information Technology and Research Conference 24
At DCPS, when a school doesn’t have the access to make a needed data change they enter a data modification request for the tech team to handle
• strictness of data entry check needs to balance against technical team capacity

Reporting relationship to schoolsAll central office teams support schoolsDifference with reporting team is that schools are really our "data entry team" rather than our “users”
• Successful data reporting intimately tied to their effectiveness• Perfect system which schools are not comfortable with will still have bad data quality
Data Effectiveness
Data Effectiveness CGCS Annual Academic, Information Technology and Research Conference 25
Data Analytics
Programs / Business
Effective decisions
Effective outcomes
Data Reporting
Effective data
Data
Entry

“Data Entry Team” rather than “Users”“Data Entry Team” is a part of things, “Users” are on the other side
Data Effectiveness
Data Effectiveness CGCS Annual Academic, Information Technology and Research Conference 26
Taking this point of view automatically fosters more collaboration• Connecting the dots for schools by tracing the pathway from a specific data entry error to specific
issue on data report instead of just mandating behavior top down• Eg duplicate Attendance Intervention entries make situation look worse because of double counting
• Data error reports include step by step how to’s specifying how issue can be fixed• Working to include direct link to relevant student in SIS to minimize context switching
• Focus groups, feedback sessions• Getting school staff input on how to make data entry more efficient
Users Data Entry Team

Fixing DataError Correction Cycle• Feed back errors to schools for them to correct• Central office team looks for other common data entry errors to either prevent through
front-end validation or add to error reports going to schools
Data Effectiveness
Data Effectiveness CGCS Annual Academic, Information Technology and Research Conference 27
Data Integrity Management System (soon to be Certica Certify)
Data Error Report
Reporting Platform
Aspen (SIS)
Central office reporting and data analyst teams
Improved SIS Validations
Additional Error Patterns
Fix Data Errors

Data Integrity Management System
Data Effectiveness
Data Effectiveness CGCS Annual Academic, Information Technology and Research Conference 28

Today – C.A.R. cycle
Data Effectiveness CGCS Annual Academic, Information Technology and Research Conference 29

Being Data Driven requires a C.A.R.Problem is how to build a train as it’s moving down the track. Even when data quality is not so good you still have to provide reports and make decisions, you cannot wait until everything is perfect because that’s a moving target
Good enough is good enough but what is good enough?
Data Effectiveness
Data Effectiveness CGCS Annual Academic, Information Technology and Research Conference 30
Consistency
Accuracy
Relevancy

Consistency, Accuracy, Relevancy cycleGoal is to have accurate metrics aligned with business goal• Cannot talk about accuracy if there isn’t agreement on the value being
reported• Once the value is consistent, you can talk about if it’s accurate• Once it’s accurate you can talk about whether it’s relevant to business goal
Data Effectiveness
Data Effectiveness CGCS Annual Academic, Information Technology and Research Conference 31
Metric AReport 1: 90Report 2: 81Report 3: 87
Metric AReport 1: 87Report 2: 87Report 3: 87
Consistent
Metric AReport 1: 85Report 2: 85Report 3: 85
Metric aligned with
goal
NotRelevant
Determine proposed change and go through cycle again
Accurate Relevant
DATA INFORMATION KNOWLEDGE
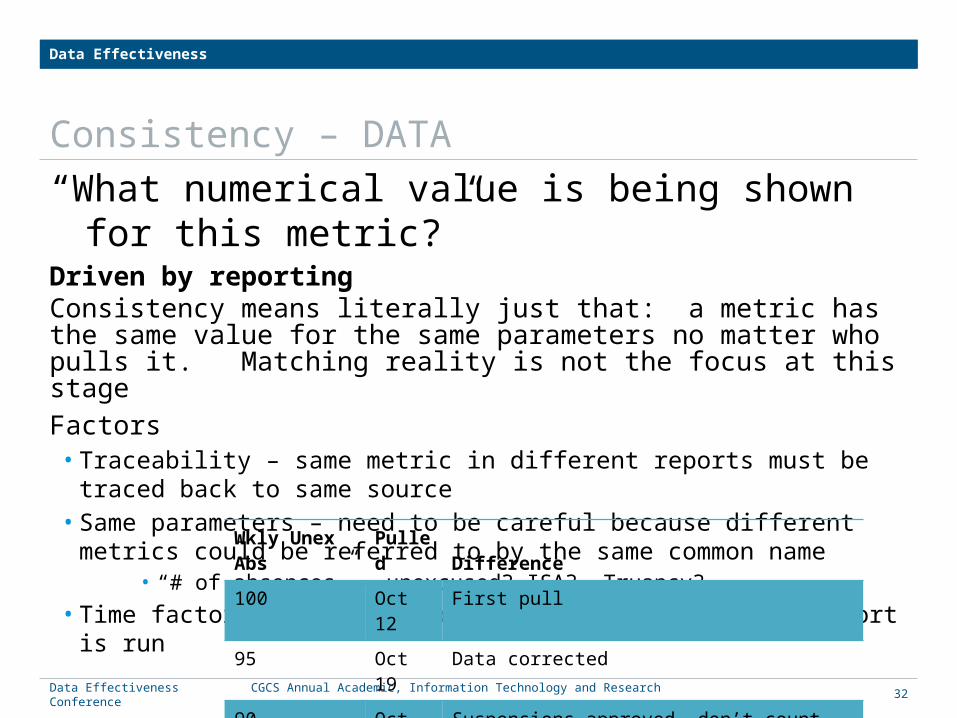
Consistency – DATA “What numerical value is being shown for this metric?”Driven by reporting Consistency means literally just that: a metric has the same value for the same parameters no matter who pulls it. Matching reality is not the focus at this stageFactors• Traceability – same metric in different reports must be traced back to same source• Same parameters – need to be careful because different metrics could be referred to by
the same common name • “# of absences” – unexcused? ISA? Truancy?
• Time factor – legitimate changes can be made after report is run
Data Effectiveness
Data Effectiveness CGCS Annual Academic, Information Technology and Research Conference 32
Wkly Unex Abs Pulled Difference100 Oct 12 First pull
95 Oct 19 Data corrected
90 Oct 26 Suspensions approved, don’t count as unexcused

Accuracy – INFORMATION “Is the numerical value shown for this metric correct?”Driven by AnalyticsOnce you have consistency, you can work on accuracy, ie does the value reflect what is actually happening in reality
verify by comparing against manually calculated metric or physical audits
Metric could be “inaccurate” because • Bug in query – fix • Wrong or inconsistent business rules – nail down definitions, two different sets of
business rules for same metric could be appropriate (eg one school year vs another) • Data quality – identify source and reason for poor data quality, make sure to verify
calculations using only good data quality data
Data Effectiveness
Data Effectiveness CGCS Annual Academic, Information Technology and Research Conference 33

Relevancy – KNOWLEDGE “Is this metric helping to meet our goal?”Driven by businessOnce you have accuracy, then you can determine whether that metric is useful. With consistency and accuracy, it may be that you are not measuring what you thought you were. Or what you are measuring doesn’t really impact outcome. If not, then either business goal or metric needs to change• Changing metric
• Use new metric – longer to get consistency, cycle could be just as long or longer• Refine business rules of existing metric – less effort to get consistency, shorter cycle
• Changing business goal• Effective data in hand is worth two in the bush• Tail could be wagging the dog but unmeasurable business goal is just a wish
Data Effectiveness
Data Effectiveness CGCS Annual Academic, Information Technology and Research Conference 34

CycleAs data becomes information becomes knowledge, the data sophistication of the
process grows which requires more/different metrics
Data Effectiveness
Data Effectiveness CGCS Annual Academic, Information Technology and Research Conference 35
Different metrics could be at different points in the cycle
Accuracy
Relevancy
Consistency
Accuracy
RelevancyConsistency
Accuracy
RelevancyConsistency
Acc
RelCons
Acc
RelCons
Acc
RelCons
Acc
RelCons

Reporting Platform
Data Effectiveness CGCS Annual Academic, Information Technology and Research Conference 36

Single system for operations and reportingPreviously used SIS as reporting data store and transactional system• Made querying a bear due to complex data model for transactional system• All reports required technical team capacity, even simple ones• Highly normalized = even simple information was stored in a very complicated way• All business rules were implemented in query code created by contractor
• Difficult to change when rules changed• Often query code itself was only “documentation”
Example: find Residency Verificationselect decode (afv.value,null,'N',438,'N','Y') end as "Residency
Verification SY13-14", from students p, adhoc_fields_values afv, adhoc_fields_drop_downs afddwhere p.pupil_number = afv.pupil_number(+) and
afv.adhoc_fields_def_ID(+) = 109 and AFV.ADHOC_FIELDS_DEF_ID = AFDD.ADHOC_FIELDS_DEF_ID(+)and afv.value = AFDD.FIELD_KEY_VALUE(+)
Data Effectiveness
Data Effectiveness CGCS Annual Academic, Information Technology and Research Conference 37

Reporting platform - SpeedData model focused on reporting, not on transactions• space vs speed tradeoff highly biased towards speed
• Virtually unlimited disk space• Batch processing not real time
• Complete flexibility to organize data optimally for ease of reporting• Central store for all siloed data (data-warehouse lite)
Data Effectiveness
Data Effectiveness CGCS Annual Academic, Information Technology and Research Conference 38
Student Demographics
Enrollment
Attendance Base
Assessment
Course Credits
Example Transactional Data Model
Grad Progress
Simplified Reporting Data Model
Course TeachersSchool Stats

Reporting platform – Ease of UseReally nothing more than a dedicated reporting database, not data warehouseData model can be tailored for reporting• Keeps track of all changes, not just latest data (valid from, valid to)• Super flat, highly denormalized = easily understood data model• Redundancy okay so long as we have data traceability• Same base data stored in multiple formats/structures for different uses• Fewer joins so can shift technical capacity to more complex business rules• Can be exposed more directly to data analysts for increased self-service
Data Effectiveness
Data Effectiveness CGCS Annual Academic, Information Technology and Research Conference 39
select decode (afv.value,null,'N',438,'N','Y') end "Residency Verification", from students p, adhoc_fields_values afv, adhoc_fields_drop_downs afdd where p.pupil_number = afv.pupil_number(+) and afv.adhoc_fields_def_ID(+) = 109 and AFV.ADHOC_FIELDS_DEF_ID = AFDD.ADHOC_FIELDS_DEF_ID(+) and afv.value = AFDD.FIELD_KEY_VALUE(+)
select [Residency Verification] from student_demographics_snapshot

Reporting platform - ConsistencyCommon processing• Common query code centralized • Batch ETL so can make multiple passes to pre-calculate higher order metrics
Consistent business rules• Can have old and new metrics back-calculated as well (eg old vs new truancy rules)• Calculate metric in one place so one number, right or wrong, is reported
Data Traceability • Data path from systems of record to reports fully documented
Data Effectiveness
Data Effectiveness CGCS Annual Academic, Information Technology and Research Conference 40
Herding Kittens One Easy Powerful Cat

SSIS, SQL Server, Perl on Virtual Machine servers
Data Effectiveness
Data Effectiveness CGCS Annual Academic, Information Technology and Research Conference 41
STARS (legacy SIS)
SpEd Data Sys
Assessment data dump
Assessment data dumpAssessment data dump
Assessment data files
Assessment data dump
Assessment data dumpAssessment data dump
Misc Data Files
ELL data system
Misc SystemMisc SystemMisc System
ETLSQL Server Integration Services (SSIS),Perl,Manual loads
Reporting Platform (MS SQL Server)
Aspen (Current SIS)
Data Mart(MS SQL Server)
Direct SQL (SQL Server Management Studio)
Reporting Platform Architecture

42
Reporting Platform Examples – Attendance base table
Based on weekly attendance reportUpdated dailyCalculates individual student attendance metricsUse values from this table whenever reporting on attendance
Data Effectiveness
Data Effectiveness CGCS Annual Academic, Information Technology and Research Conference
Metric DetailsTruancy Calculates truancy based on old rules and new rules
so can compare trends
Absence Counts Period and Daily; Unexcused, Excused, In Seat Attendance, Suspension
Attendance Interventions
3, 5, 10, 20 day intervention letters needed and sentChild & Family Service/Court referrals, Police Pickups

Reporting Platform Examples – enrollment matchingEnrollment admit withdraw matching• SIS stores enrollment as separate admit and withdraw events• Need to match admits to withdrawals for the same enrollment period and school
Data Effectiveness
Data Effectiveness CGCS Annual Academic, Information Technology and Research Conference 43
Admit Date Withdraw Date School24 August 2011 24 June 2012 123
24 June 2012 10 October 2012 456
11 October 2012 1 January 3030 789
Date Type School24 August 2011 Admit 12324 June 2012 Withdrawal 12324 June 2012 Admit 45610 October 2012 Withdrawal 45611 October 2012 Admit 789
Currently enrolled students have “withdrawal date” in the far future (1/1/3030) so that there is an actual date and not a null to compare against:(today() < [withdraw date]) as “currently enrolled”

Reporting Platform Examples - AssessmentGenerally two ways we need to analyze assessments• Single view of all assessments for a student – data in columns
• Each row is a single student for a particular school year
Data Effectiveness
Data Effectiveness CGCS Annual Academic, Information Technology and Research Conference 44
Student Assessment SY Score123 A1 Q1 SY1415 90
123 A1 Q2 SY1415 80
123 A1 Q3 SY1415 70
123 A1 Q4 SY1415 100
456 A1 Sem 1 SY1415 65
Student A1 Q1 A1 Q1 A1 Q3 A1 Q4 A2 Sem 1 A2 Sem 2 SY123 90 80 70 100 76 87 SY1415456 60 70 80 90 65 86 SY1415
• Comparing one run of an assessment with another – data in rows• Each row is a single assessment for a single student for a particular school year
Key is that both are processed from the exact same data sets at the same time so contain the same data stored in two different structures

Reporting Platform Development
Biggest challenge was how to develop system when we had poor data qualityHow could we avoid introducing more errors?
Solution• Prioritize – Start with standard re-occurring reports (eg attendance weekly)• Compartmentalize – Run reports using only students with no data quality issues
Data Effectiveness
Data Effectiveness CGCS Annual Academic, Information Technology and Research Conference 45
Aspen (Current SIS)

Reporting Platform DevelopmentNeed to ensure that reporting platform is not introducing new errors. How?Use only known good data to validate:
Data Effectiveness
Data Effectiveness CGCS Annual Academic, Information Technology and Research Conference 46
Report validated
Fix any issues with Reporting platform
No discrepancies
discrepancies
Filter out students with bad data into exceptions table
Reporting Platform
Report query
Standard Report
Sample ReportWhy?
Compare
Bad data students
Good data students

Reporting Platform Development1. Create Sample Report and compare to Standard Report (eg attendance
weekly)2. Check for discrepancies
1. If discrepancy is due to mistake in reporting platform or query, fix it2. If discrepancy is due to bad data, store student id in exceptions table
3. Pull Sample Report again, filtering out exception students so that only “Good Data” is included in report
4. Continue until no discrepancies
Example “Bad Data” exceptions:5. Overlapping enrollments6. Absences outside of enrollment7. Missing data
Data Effectiveness
Data Effectiveness CGCS Annual Academic, Information Technology and Research Conference 47

Managing Data Requests
Data Effectiveness CGCS Annual Academic, Information Technology and Research Conference 48

Survey results – requestors of reportsWho is asking for data and most often with what frequency?Counts are number of districts who report that frequency for that requester type
Data Effectiveness
Data Effectiveness CGCS Annual Academic, Information Technology and Research Conference 49
Who N/A Yearly Monthly Weekly Daily Ad-hocParents/community 3 4 0 0 1 3Students 6 1 0 0 2 2Teachers 0 1 1 3 4 2School administrators 0 0 2 4 4 1Central office program staff 0 0 3 3 2 3District leadership 0 0 3 5 3 0State/Fed Dept of Ed or other external org
1 3 2 1 2 2
Counts are number of districts who report that frequency for that requester type

Capacity vs DemandDemand for data is ever increasing, people are hungry for dataNeeded to do more with the same size teamTwo Tracks• Increase reporting efficiency •Reduce demand on reporting team
Data Effectiveness
Data Effectiveness CGCS Annual Academic, Information Technology and Research Conference 50

Increase EfficiencyUsers make requests via online “Data Request Tool” (DRT)• Central point of communication with requestors for clarifications• Tracks implementation notes and report writer assignments• Report files attached to request along with query code• One report can be attached to multiple requests to allow for reuse• “Student Data Current” report available on front end
• Updated daily with common student metrics (absences, GPA, grade level, school, etc)• User can customize columns/filters to download for themselves• Example of some columns available:
Data Effectiveness
Data Effectiveness CGCS Annual Academic, Information Technology and Research Conference 51
Student_ID YTD_Unexcused_Absences Total SBT Suspension_DaysSchool_Name YTD_Excused_Absences Truant - still be truant?ELL_Status YTD_ISA_Average_Attendance Truant_>=10_daysFARM_Status Membership_days Current_School_Average_AttendanceStudent_Race Absences_Towards_Truancy Current_School_Excused_AbsencesSPED_Status Suspension_Absences_Days Current_School_ISA_Average_Attendance

Increase Efficiency“Data Request Tool” (DRT)
Data Effectiveness
Data Effectiveness CGCS Annual Academic, Information Technology and Research Conference 52

Increase EfficiencyData Librarian is first point of contact for requests to reporting team• Dedicated FTE position• Clarifies request requirements• Is there an already completed report that can fulfill this request?• Acts as gatekeeper to qualify requests before they hit reporting capacity
Data Effectiveness
Data Effectiveness CGCS Annual Academic, Information Technology and Research Conference 53
Program needs data
Standard Report? Student Data Current?
Program Enters Data Request
Data Librarian clarifies request
Report Created
Report Writer assigned
Report Reviewed
Existing report available?
Report Delivered

Self Service Reporting
Data Effectiveness CGCS Annual Academic, Information Technology and Research Conference 54

Self Service ReportingGoal was to provide self-service reporting to analysts while ensuring consistency• Giving them raw access to reporting platform is too overwhelming
• Analysts are not database developers/DBAs• Requires SQL skills: eg would still need joins, aggregations to get meaningful data
• Creating dedicated pull of custom data would mean another thing to maintain
Data Effectiveness
Data Effectiveness CGCS Annual Academic, Information Technology and Research Conference 55
Crawl before we can we walk,Walk before we can run,Run before we can fly

Self Service ReportingSolution was to rely on already existing standard reports• Enrollment Daily, Attendance Weekly, ACGR, Student Data Current
Weekly snapshot of each report was saved into a dedicated “data mart”• Analysts were already used to seeing these reports so no learning curve• These were official reports so data was guaranteed to match our official numbers• Added benefit of saving historically reported official numbers
Data Effectiveness
Data Effectiveness CGCS Annual Academic, Information Technology and Research Conference 56
Not quite flying yet, but closer…

“Data Mart” example - EnrollmentReport #1612 is a daily report of the enrollment for every student in DCPS • Forms the basis of how enrollment is monitored throughout the year• Especially important during pre-enrollment for upcoming school year• Also forms basis for denominator when calculating “percent of total students” metrics• Data mart data model has exact same columns as DRT with addition of “report date”
Data Effectiveness
Data Effectiveness CGCS Annual Academic, Information Technology and Research Conference 57
Enrollment Daily report
Reporting Platform
Direct SQL
Enrollment Data Mart
Enrollment DR 8/24Enrollment DR 8/31Enrollment DR 9/7Enrollment DR 9/14
Enrollment DR 6/13
…
Data Analyst

Report requests hitting report writers
Data Effectiveness
Data Effectiveness CGCS Annual Academic, Information Technology and Research Conference 58
Aug Sep Oct Nov Dec Jan Feb Mar Apr May Jun Jul0
20
40
60
80
100
120
Report Writer Data Requests per Month
SY12-13 SY13-14 SY14-15 SY15-16
More self-service reporting and standardized reports• Fewer ad-hoc requests for standard data• Reporting capacity can be spent on more complex requests

Summary
District of Columbia Public Schools | 2015 CGCS CIO Conference 59

Data Effectiveness
Data Effectiveness
Data Effectiveness CGCS Annual Academic, Information Technology and Research Conference 60
Data Reporting
Effective data
Data Analytics
Programs / Business
Effective decisions
Effective outcomes
Data Driven Decision Making starts with Data Effectiveness

How to make data more effectiveConsistency first, then Accuracy, then Relevancy
Data Effectiveness
District of Columbia Public Schools | 2015 CGCS CIO Conference 61
Metric AReport 1: 90Report 2: 81Report 3: 87
Metric AReport 1: 87Report 2: 87Report 3: 87
Consistent
Metric AReport 1: 85Report 2: 85Report 3: 85
Metric aligned with
goal Accurate Relevant
Improve data quality by seeing School Staff as "data entry team" instead of “users”
Users Data Entry Team

Take Aways Meet your data where it is today and build to where you want to be
Data Effectiveness
Data Effectiveness CGCS Annual Academic, Information Technology and Research Conference 62
Take some time to do the work today that will help you tomorrow…
• Data Quality Culture• C.A.R. Cycle• Data Request Process
There’s flying and then there’s flying. Good enough is probably good enough.
• Reporting Platform• Data Marts

@dataeffectivelyblog.dataeffectiveness.com
Data Effectiveness
Data Effectiveness CGCS Annual Academic, Information Technology and Research Conference 63

Appendicies
Data Effectiveness CGCS Annual Academic, Information Technology and Research Conference 64

State of Data at DCPS
Data Effectiveness CGCS Annual Academic, Information Technology and Research Conference 65

DCPS Data Systems Evolution
Data Effectiveness
Data Effectiveness CGCS Annual Academic, Information Technology and Research Conference 66
10+ years ago•Critical data tracked poorly or not at all
•Heavy manual effort in using data to support operations
•Very difficult to pull ad hoc reports or change existing reports
•Only way to do trend reporting was via excel
5 years ago•Systems of record exist but data flow is both one way and not easy
•All critical data is tracked somewhere but in separate systems
•Very Ad-hoc reporting, every request was it’s own query, “reuse” is copy-paste
•Trend reporting done from yearly snapshots
Today•Consolidated view of student, employee, and school data
•Robust reporting infrastructure increases capacity
•More self-service reporting available
•Data quality better•All changes tracked means trend reporting much easier
Evolution from poor data capture to
Mainframe replaced by Oracle forms System(AAL eSIS)
SIS upgraded (Follett Aspen)Separate reporting databasecreated
Data Capture
Data Quality
Reporting ROI

Reporting requests – Example 1Average of 80 complex data reporting data requests per monthAttendance Weekly • Summarizes weekly and YTD attendance for every student at DCPS• Absence stats: In Seat Attendance (ISA), Truancy, Unexcused Absences• Intervention: 3, 5, 10, 15, 20 day attendance letters/meetings/etc• Also includes behavior stats: Suspension, Suspension days
Data Effectiveness
Data Effectiveness CGCS Annual Academic, Information Technology and Research Conference 67

Reporting requests – Example 2Adjusted Cohort Graduation Rate – calculates individual graduation progress per credit for all high school students, flags degree of being off track• Tracks 4 year cohorts across all high schools at DCPS • Looks at grades in currently scheduled courses as well as credits received
Data Effectiveness
Data Effectiveness CGCS Annual Academic, Information Technology and Research Conference 68
On Grade Level On-Track 4 Core Subjects Enrolled in English IIIGrade On-Track English Passing English IIIOn Potential Grad List On-Track Math Enrolled in English IVTotal # Credits On-Track Science Passing English IVCredits Needed to Graduate On-Track Social Studies Enrolled in MathEnglish Cumulative Math Cumulative Passing Math
Example Columns

Survey Demographics
Data Effectiveness CGCS Annual Academic, Information Technology and Research Conference 69

Survey results – District SizesSurvey conducted via CGCS CIO Mailing list: 11 Responses Total
Data Effectiveness
Data Effectiveness CGCS Annual Academic, Information Technology and Research Conference 70

Data Sophistication
Data Effectiveness CGCS Annual Academic, Information Technology and Research Conference 71
Data Sophistication CycleResults oriented incompatible with data driven?
• In a results-oriented organization the push is to “get things done” and the velocity of the need often makes it difficult for data systems to keep up.
• And as a result the data driven aspect gets starved of food
Data Effectiveness
Data Effectiveness CGCS Annual Academic, Information Technology and Research Conference 72

Data Sophistication CycleData capture system evolves along with process sophisticationReporting sophistication should keep pace with data quality
Data Effectiveness
Data Effectiveness CGCS Annual Academic, Information Technology and Research Conference 73
Example Data Entry System
Key Data structure
Process Sophistication
Data Quality
Reporting Sophistication
Notepad Open entry
Excel Data cellsMS Access Data recordsStudent Information System (SIS)
Normalized data model
Reporting system separate from SIS
Reporting data model
Don’t build a formal data warehouse for excel “data systems”!

Data Effectiveness.
Don’t over engineer tracking system, should lead but not exceed process maturity.
Example• Relative vs Absolute metrics• High stakes (IMPACT) vs experimental (RTI)
Different groups or initiatives in the same organization could be at different points in the cycle
Make sure you identify what level a particular need is at, no need for data tracking or reporting to be more sophisticated than the business process in question
Data Effectiveness
Data Effectiveness CGCS Annual Academic, Information Technology and Research Conference 74
Related Documents


![Data-Driven and Keyword-Driven Test[1]](https://static.cupdf.com/doc/110x72/577ce76d1a28abf103951d8d/data-driven-and-keyword-driven-test1.jpg)