Data-Driven Utilization-Aware Trip Advisor for Bike-sharing Systems Ji Hu Zhejiang University [email protected] Zidong Yang Zhejiang University [email protected] Yuanchao Shu Microsoft Research Asia [email protected] Peng Cheng Zhejiang University [email protected] Jiming Chen Zhejiang University [email protected] Abstract—Rapid development of bike-sharing systems has brought people enormous convenience during the past decade. On the other hand, high transport flexibility comes with dynamic distribution of shared bikes, leading to an unbalanced bike usage and growing maintenance cost. In this paper, we consider to rebalance bicycle utilization by means of directing users to different stations. For the first time, we devise a trip advisor that recommends bike check-in and check-out stations with joint consideration of service quality and bicycle utilization. From historical data, we firstly identify that biased bike usage is rooted from circumscribed bicycle circulation among few active stations. Therefore, with defined station activeness, we optimize the bike circulation by leading users to shift bikes between highly active stations and inactive ones. We extensively evaluate the performance of our design through real-world datasets. Evaluation results show that the percentage of frequent used bikes decreases by 33.6% on usage number and 28.6% on usage time. I. I NTRODUCTION With the development of the economy, pollution and destruction caused by human activities to natural environment was becoming more and more serious in recent years, and therefore sustainable development has become a consensus of the international community [1, 2]. In this circumstance, bike-sharing systems (BSS) are developed as a replacement for short vehicle journeys due to its low pollution, low energy consumption and high flexibility. In addition to the reduce of need for personal vehicle trips, public bike-sharing systems can not only help extend the reach of transit and walking trips, providing people with a healthy transportation option, but also trigger greater interest in cycling, and increase cycling ridership. By the end of 2016, over 1,100 cities actively operate automated bike-sharing systems deploying an estimate of 2,000,000 public bicycles worldwide [3]. With bike-sharing systems, a user can easily rent a bike by a smart card at a nearby station, use it for a short journey, and return it at another station. Despite high convenience and flexibility, a notable problem in bike-sharing systems is unbalanced bike usage, which means a small part of bikes are used much more frequently than others. Bikes that are used too much are vulnerable and hence increase repair bills and lead to potential service denied. In 2012, the very first bicycle from Hangzhou bike-sharing system became a permanent exhibit in the Low-Carbon Technologies Museum in China. This bicycle is reported to be rented for over 6,000 times and ridden for more than 20,000 kilometers in 3 years. Similarly, the most tireless bicycle from 2016 has been rented for 5,616 times, over 15 times on average each day. According to Hangzhou public bike-sharing company, the average life of their bicycles is less than 4 years due to longtime high load operation and lack of timely renewal and maintenance. On the contrary, average life of private bicycles is 10 years and above. Meanwhile, the cost of repair and labor accounts for a large proportion in overall operating expenses. In 2012, the repair cost of Hangzhou bike-sharing system was near 6 million yuan [4]. In Washington, D.C., the annual maintenance cost was $200 to $300 per bike in the year of 2012 [5]. The bike shops in New York completed 5,604 bike repairs in April 2017 with a total number of 9,367 bikes in the system [6]. Intuitively, operators can balance bike usage by leading users to use those unpopular bikes based on usage counts of each bike. However, leading users to rent a specific bike is not practical. Based on our analysis on real bike-sharing dataset from Hangzhou, we observe that bikes located in some stations are much more likely to be used and moved to another active station. Hence, by introducing the station property of activeness, we transform the original problem of picking bikes to recommending check-in and check-out stations. By using the proposed trip advisor, we aim to guide users to ride bicycles between stations with different levels of activeness, therefore avoiding circumscribed circulation among active stations. For users, an advisor can not only help them choose stations with adequate bicycles, but also ensure a higher success rate when returning bikes. Also, different incentive mechanisms can be leveraged to better prompt the balancing process. In this paper, we propose a trip advisor that recommends the optimal pair of stations to rent and return bikes. Through guiding the actions of users, it can help balance bike usage, reduce operation cost and enhance user experience. Firstly, to make sure users can find bikes and available lockers, success rates of rental and return should be predicted for each station. Different from traditional demand prediction methods, we present probabilistic forecast methods on a minute timescale instead of predicting the exact stock number on sub-hour granularity. Secondly, in order to balance bike usage through station recommendation, a station property must be associated with bike usage frequency. We define activeness for each station by exploiting the idea of PageRank. These two parts constitute the core content of the trip advisor framework.

Welcome message from author
This document is posted to help you gain knowledge. Please leave a comment to let me know what you think about it! Share it to your friends and learn new things together.
Transcript
Data-Driven Utilization-Aware Trip Advisorfor Bike-sharing Systems
Ji HuZhejiang University
Zidong YangZhejiang [email protected]
Yuanchao ShuMicrosoft Research Asia
Peng ChengZhejiang University
Jiming ChenZhejiang University
Abstract—Rapid development of bike-sharing systems hasbrought people enormous convenience during the past decade.On the other hand, high transport flexibility comes with dynamicdistribution of shared bikes, leading to an unbalanced bikeusage and growing maintenance cost. In this paper, we considerto rebalance bicycle utilization by means of directing users todifferent stations. For the first time, we devise a trip advisorthat recommends bike check-in and check-out stations with jointconsideration of service quality and bicycle utilization. Fromhistorical data, we firstly identify that biased bike usage isrooted from circumscribed bicycle circulation among few activestations. Therefore, with defined station activeness, we optimizethe bike circulation by leading users to shift bikes betweenhighly active stations and inactive ones. We extensively evaluatethe performance of our design through real-world datasets.Evaluation results show that the percentage of frequent usedbikes decreases by 33.6% on usage number and 28.6% on usagetime.
I. INTRODUCTION
With the development of the economy, pollution anddestruction caused by human activities to natural environmentwas becoming more and more serious in recent years, andtherefore sustainable development has become a consensusof the international community [1, 2]. In this circumstance,bike-sharing systems (BSS) are developed as a replacementfor short vehicle journeys due to its low pollution, low energyconsumption and high flexibility. In addition to the reduce ofneed for personal vehicle trips, public bike-sharing systemscan not only help extend the reach of transit and walkingtrips, providing people with a healthy transportation option,but also trigger greater interest in cycling, and increase cyclingridership. By the end of 2016, over 1,100 cities activelyoperate automated bike-sharing systems deploying an estimateof 2,000,000 public bicycles worldwide [3].
With bike-sharing systems, a user can easily rent a bike bya smart card at a nearby station, use it for a short journey,and return it at another station. Despite high convenienceand flexibility, a notable problem in bike-sharing systems isunbalanced bike usage, which means a small part of bikes areused much more frequently than others. Bikes that are used toomuch are vulnerable and hence increase repair bills and leadto potential service denied. In 2012, the very first bicycle fromHangzhou bike-sharing system became a permanent exhibit inthe Low-Carbon Technologies Museum in China. This bicycleis reported to be rented for over 6,000 times and riddenfor more than 20,000 kilometers in 3 years. Similarly, the
most tireless bicycle from 2016 has been rented for 5,616times, over 15 times on average each day. According toHangzhou public bike-sharing company, the average life oftheir bicycles is less than 4 years due to longtime high loadoperation and lack of timely renewal and maintenance. On thecontrary, average life of private bicycles is 10 years and above.Meanwhile, the cost of repair and labor accounts for a largeproportion in overall operating expenses. In 2012, the repaircost of Hangzhou bike-sharing system was near 6 millionyuan [4]. In Washington, D.C., the annual maintenance costwas $200 to $300 per bike in the year of 2012 [5]. The bikeshops in New York completed 5,604 bike repairs in April 2017with a total number of 9,367 bikes in the system [6].
Intuitively, operators can balance bike usage by leadingusers to use those unpopular bikes based on usage countsof each bike. However, leading users to rent a specific bikeis not practical. Based on our analysis on real bike-sharingdataset from Hangzhou, we observe that bikes located insome stations are much more likely to be used and movedto another active station. Hence, by introducing the stationproperty of activeness, we transform the original problemof picking bikes to recommending check-in and check-outstations. By using the proposed trip advisor, we aim to guideusers to ride bicycles between stations with different levelsof activeness, therefore avoiding circumscribed circulationamong active stations. For users, an advisor can not only helpthem choose stations with adequate bicycles, but also ensurea higher success rate when returning bikes. Also, differentincentive mechanisms can be leveraged to better prompt thebalancing process.
In this paper, we propose a trip advisor that recommendsthe optimal pair of stations to rent and return bikes. Throughguiding the actions of users, it can help balance bike usage,reduce operation cost and enhance user experience. Firstly, tomake sure users can find bikes and available lockers, successrates of rental and return should be predicted for each station.Different from traditional demand prediction methods, wepresent probabilistic forecast methods on a minute timescaleinstead of predicting the exact stock number on sub-hourgranularity. Secondly, in order to balance bike usage throughstation recommendation, a station property must be associatedwith bike usage frequency. We define activeness for eachstation by exploiting the idea of PageRank. These two partsconstitute the core content of the trip advisor framework.
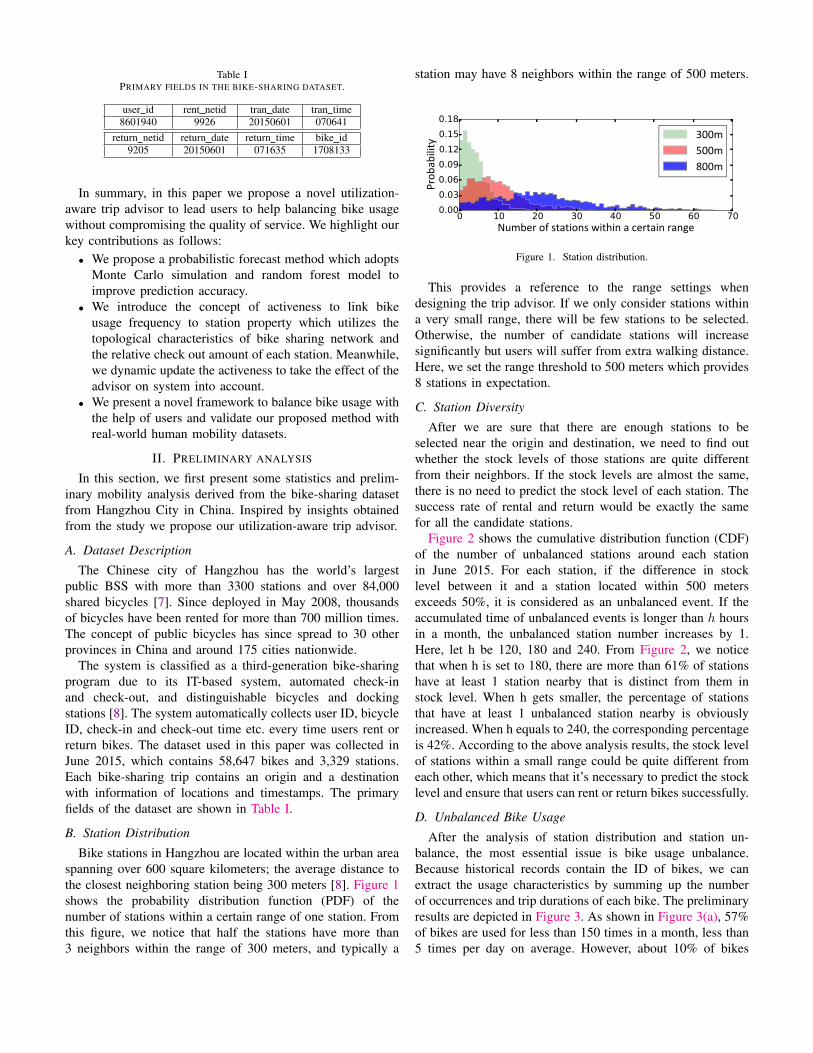
Table IPRIMARY FIELDS IN THE BIKE-SHARING DATASET.
user id rent netid tran date tran time8601940 9926 20150601 070641
return netid return date return time bike id9205 20150601 071635 1708133
In summary, in this paper we propose a novel utilization-aware trip advisor to lead users to help balancing bike usagewithout compromising the quality of service. We highlight ourkey contributions as follows:• We propose a probabilistic forecast method which adopts
Monte Carlo simulation and random forest model toimprove prediction accuracy.
• We introduce the concept of activeness to link bikeusage frequency to station property which utilizes thetopological characteristics of bike sharing network andthe relative check out amount of each station. Meanwhile,we dynamic update the activeness to take the effect of theadvisor on system into account.
• We present a novel framework to balance bike usage withthe help of users and validate our proposed method withreal-world human mobility datasets.
II. PRELIMINARY ANALYSIS
In this section, we first present some statistics and prelim-inary mobility analysis derived from the bike-sharing datasetfrom Hangzhou City in China. Inspired by insights obtainedfrom the study we propose our utilization-aware trip advisor.
A. Dataset Description
The Chinese city of Hangzhou has the world’s largestpublic BSS with more than 3300 stations and over 84,000shared bicycles [7]. Since deployed in May 2008, thousandsof bicycles have been rented for more than 700 million times.The concept of public bicycles has since spread to 30 otherprovinces in China and around 175 cities nationwide.
The system is classified as a third-generation bike-sharingprogram due to its IT-based system, automated check-inand check-out, and distinguishable bicycles and dockingstations [8]. The system automatically collects user ID, bicycleID, check-in and check-out time etc. every time users rent orreturn bikes. The dataset used in this paper was collected inJune 2015, which contains 58,647 bikes and 3,329 stations.Each bike-sharing trip contains an origin and a destinationwith information of locations and timestamps. The primaryfields of the dataset are shown in Table I.
B. Station Distribution
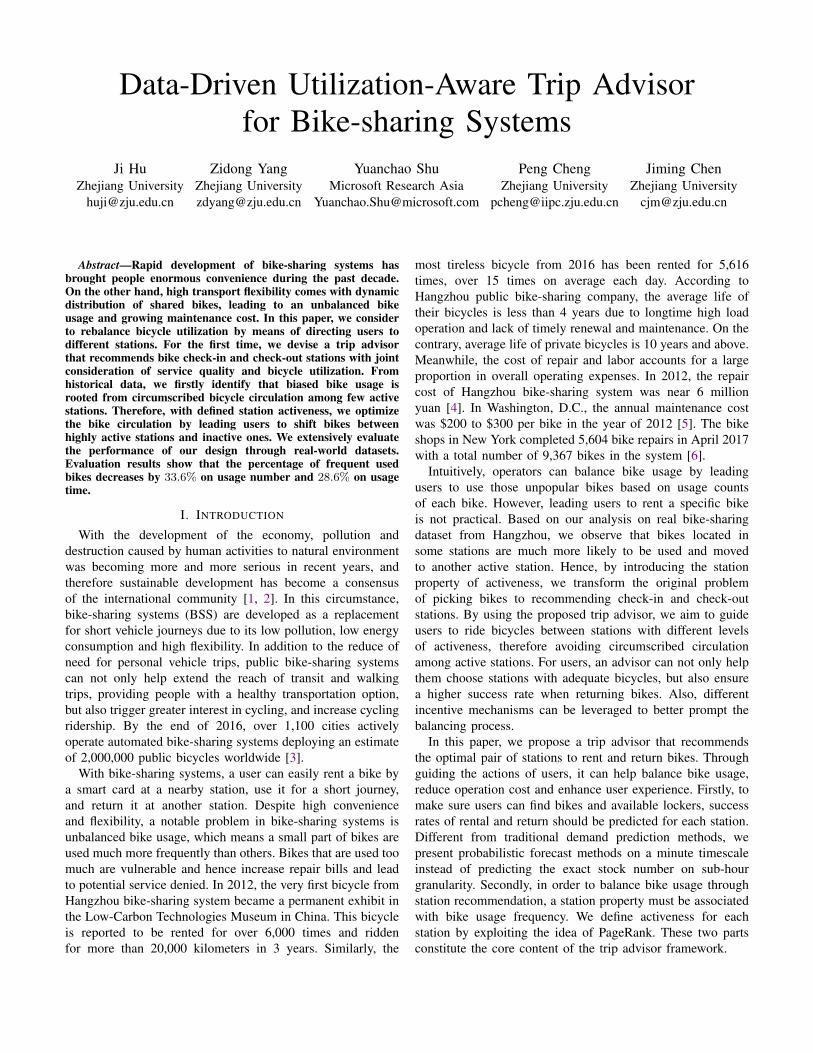
Bike stations in Hangzhou are located within the urban areaspanning over 600 square kilometers; the average distance tothe closest neighboring station being 300 meters [8]. Figure 1shows the probability distribution function (PDF) of thenumber of stations within a certain range of one station. Fromthis figure, we notice that half the stations have more than3 neighbors within the range of 300 meters, and typically a
station may have 8 neighbors within the range of 500 meters.
Figure 1. Station distribution.
This provides a reference to the range settings whendesigning the trip advisor. If we only consider stations withina very small range, there will be few stations to be selected.Otherwise, the number of candidate stations will increasesignificantly but users will suffer from extra walking distance.Here, we set the range threshold to 500 meters which provides8 stations in expectation.
C. Station Diversity
After we are sure that there are enough stations to beselected near the origin and destination, we need to find outwhether the stock levels of those stations are quite differentfrom their neighbors. If the stock levels are almost the same,there is no need to predict the stock level of each station. Thesuccess rate of rental and return would be exactly the samefor all the candidate stations.
Figure 2 shows the cumulative distribution function (CDF)of the number of unbalanced stations around each stationin June 2015. For each station, if the difference in stocklevel between it and a station located within 500 metersexceeds 50%, it is considered as an unbalanced event. If theaccumulated time of unbalanced events is longer than h hoursin a month, the unbalanced station number increases by 1.Here, let h be 120, 180 and 240. From Figure 2, we noticethat when h is set to 180, there are more than 61% of stationshave at least 1 station nearby that is distinct from them instock level. When h gets smaller, the percentage of stationsthat have at least 1 unbalanced station nearby is obviouslyincreased. When h equals to 240, the corresponding percentageis 42%. According to the above analysis results, the stock levelof stations within a small range could be quite different fromeach other, which means that it’s necessary to predict the stocklevel and ensure that users can rent or return bikes successfully.
D. Unbalanced Bike Usage
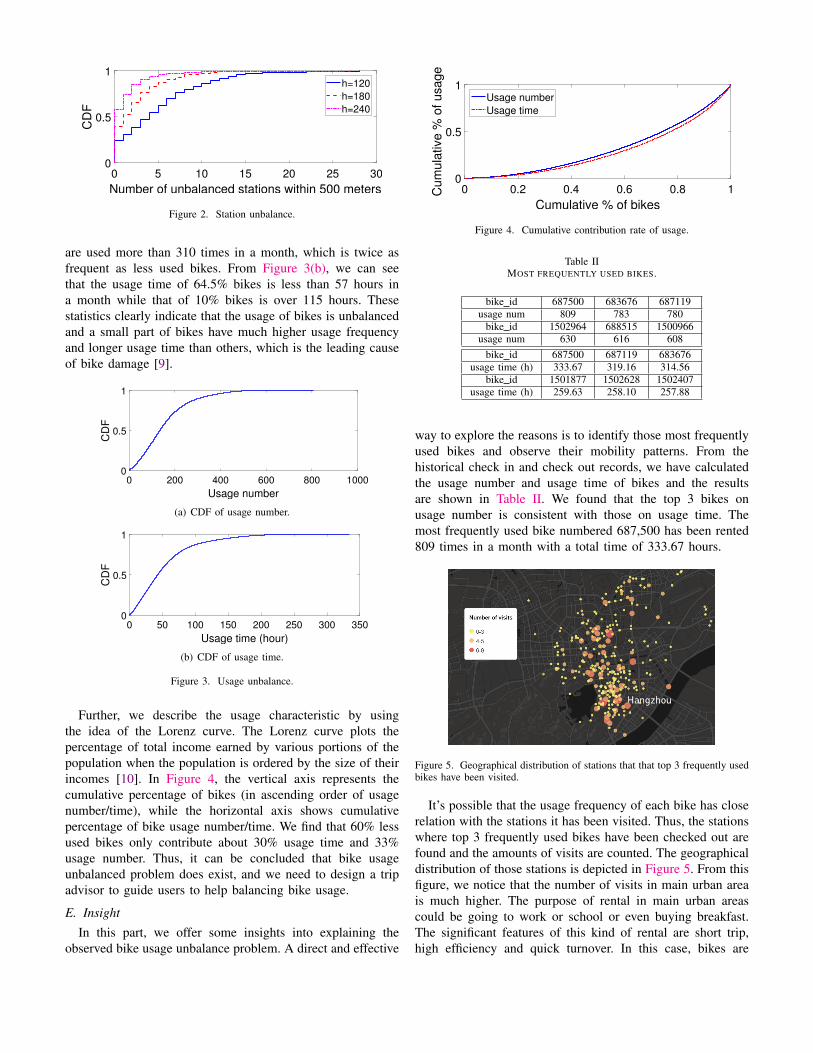
After the analysis of station distribution and station un-balance, the most essential issue is bike usage unbalance.Because historical records contain the ID of bikes, we canextract the usage characteristics by summing up the numberof occurrences and trip durations of each bike. The preliminaryresults are depicted in Figure 3. As shown in Figure 3(a), 57%of bikes are used for less than 150 times in a month, less than5 times per day on average. However, about 10% of bikes
0 5 10 15 20 25 30
Number of unbalanced stations within 500 meters
0
0.5
1
CD
Fh=120
h=180
h=240
Figure 2. Station unbalance.
are used more than 310 times in a month, which is twice asfrequent as less used bikes. From Figure 3(b), we can seethat the usage time of 64.5% bikes is less than 57 hours ina month while that of 10% bikes is over 115 hours. Thesestatistics clearly indicate that the usage of bikes is unbalancedand a small part of bikes have much higher usage frequencyand longer usage time than others, which is the leading causeof bike damage [9].
0 200 400 600 800 1000
Usage number
0
0.5
1
CD
F
(a) CDF of usage number.
0 50 100 150 200 250 300 350
Usage time (hour)
0
0.5
1
CD
F
(b) CDF of usage time.
Figure 3. Usage unbalance.
Further, we describe the usage characteristic by usingthe idea of the Lorenz curve. The Lorenz curve plots thepercentage of total income earned by various portions of thepopulation when the population is ordered by the size of theirincomes [10]. In Figure 4, the vertical axis represents thecumulative percentage of bikes (in ascending order of usagenumber/time), while the horizontal axis shows cumulativepercentage of bike usage number/time. We find that 60% lessused bikes only contribute about 30% usage time and 33%usage number. Thus, it can be concluded that bike usageunbalanced problem does exist, and we need to design a tripadvisor to guide users to help balancing bike usage.
E. InsightIn this part, we offer some insights into explaining the
observed bike usage unbalance problem. A direct and effective
0 0.2 0.4 0.6 0.8 1
Cumulative % of bikes
0
0.5
1
Cu
mu
lative
% o
f u
sa
ge
Usage number
Usage time
Figure 4. Cumulative contribution rate of usage.
Table IIMOST FREQUENTLY USED BIKES.
bike id 687500 683676 687119usage num 809 783 780
bike id 1502964 688515 1500966usage num 630 616 608
bike id 687500 687119 683676usage time (h) 333.67 319.16 314.56
bike id 1501877 1502628 1502407usage time (h) 259.63 258.10 257.88
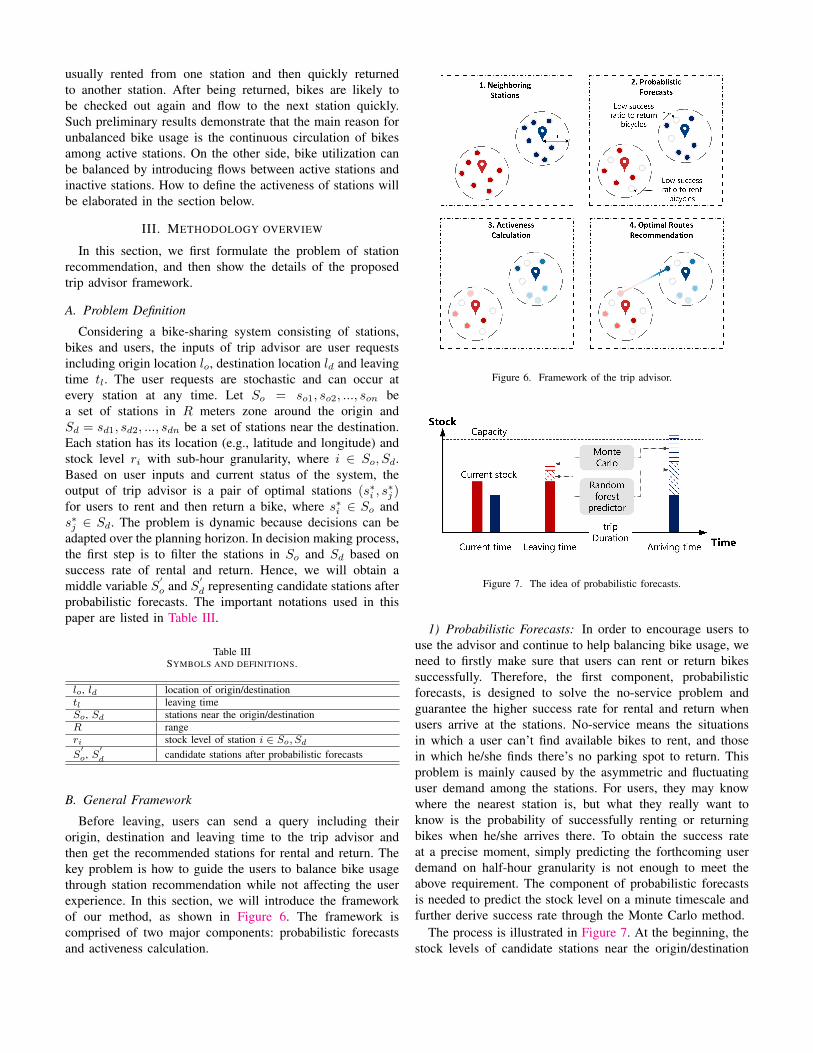
way to explore the reasons is to identify those most frequentlyused bikes and observe their mobility patterns. From thehistorical check in and check out records, we have calculatedthe usage number and usage time of bikes and the resultsare shown in Table II. We found that the top 3 bikes onusage number is consistent with those on usage time. Themost frequently used bike numbered 687,500 has been rented809 times in a month with a total time of 333.67 hours.
Figure 5. Geographical distribution of stations that that top 3 frequently usedbikes have been visited.
It’s possible that the usage frequency of each bike has closerelation with the stations it has been visited. Thus, the stationswhere top 3 frequently used bikes have been checked out arefound and the amounts of visits are counted. The geographicaldistribution of those stations is depicted in Figure 5. From thisfigure, we notice that the number of visits in main urban areais much higher. The purpose of rental in main urban areascould be going to work or school or even buying breakfast.The significant features of this kind of rental are short trip,high efficiency and quick turnover. In this case, bikes are
usually rented from one station and then quickly returnedto another station. After being returned, bikes are likely tobe checked out again and flow to the next station quickly.Such preliminary results demonstrate that the main reason forunbalanced bike usage is the continuous circulation of bikesamong active stations. On the other side, bike utilization canbe balanced by introducing flows between active stations andinactive stations. How to define the activeness of stations willbe elaborated in the section below.
III. METHODOLOGY OVERVIEW
In this section, we first formulate the problem of stationrecommendation, and then show the details of the proposedtrip advisor framework.
A. Problem Definition
Considering a bike-sharing system consisting of stations,bikes and users, the inputs of trip advisor are user requestsincluding origin location lo, destination location ld and leavingtime tl. The user requests are stochastic and can occur atevery station at any time. Let So = so1, so2, ..., son bea set of stations in R meters zone around the origin andSd = sd1, sd2, ..., sdn be a set of stations near the destination.Each station has its location (e.g., latitude and longitude) andstock level ri with sub-hour granularity, where i ∈ So, Sd.Based on user inputs and current status of the system, theoutput of trip advisor is a pair of optimal stations (s∗i , s
∗j )
for users to rent and then return a bike, where s∗i ∈ So ands∗j ∈ Sd. The problem is dynamic because decisions can beadapted over the planning horizon. In decision making process,the first step is to filter the stations in So and Sd based onsuccess rate of rental and return. Hence, we will obtain amiddle variable S
′
o and S′
d representing candidate stations afterprobabilistic forecasts. The important notations used in thispaper are listed in Table III.
Table IIISYMBOLS AND DEFINITIONS.
lo, ld location of origin/destinationtl leaving timeSo, Sd stations near the origin/destinationR rangeri stock level of station i ∈ So, Sd
S′o, S
′d candidate stations after probabilistic forecasts
B. General Framework
Before leaving, users can send a query including theirorigin, destination and leaving time to the trip advisor andthen get the recommended stations for rental and return. Thekey problem is how to guide the users to balance bike usagethrough station recommendation while not affecting the userexperience. In this section, we will introduce the frameworkof our method, as shown in Figure 6. The framework iscomprised of two major components: probabilistic forecastsand activeness calculation.
Figure 6. Framework of the trip advisor.
Figure 7. The idea of probabilistic forecasts.
1) Probabilistic Forecasts: In order to encourage users touse the advisor and continue to help balancing bike usage, weneed to firstly make sure that users can rent or return bikessuccessfully. Therefore, the first component, probabilisticforecasts, is designed to solve the no-service problem andguarantee the higher success rate for rental and return whenusers arrive at the stations. No-service means the situationsin which a user can’t find available bikes to rent, and thosein which he/she finds there’s no parking spot to return. Thisproblem is mainly caused by the asymmetric and fluctuatinguser demand among the stations. For users, they may knowwhere the nearest station is, but what they really want toknow is the probability of successfully renting or returningbikes when he/she arrives there. To obtain the success rateat a precise moment, simply predicting the forthcoming userdemand on half-hour granularity is not enough to meet theabove requirement. The component of probabilistic forecastsis needed to predict the stock level on a minute timescale andfurther derive success rate through the Monte Carlo method.
The process is illustrated in Figure 7. At the beginning, thestock levels of candidate stations near the origin/destination
are known. The forecasts consist of two parts. The first partis coarse-grained prediction using random forest model, thesecond part is fine-grained prediction based on Monte Carlomethod.
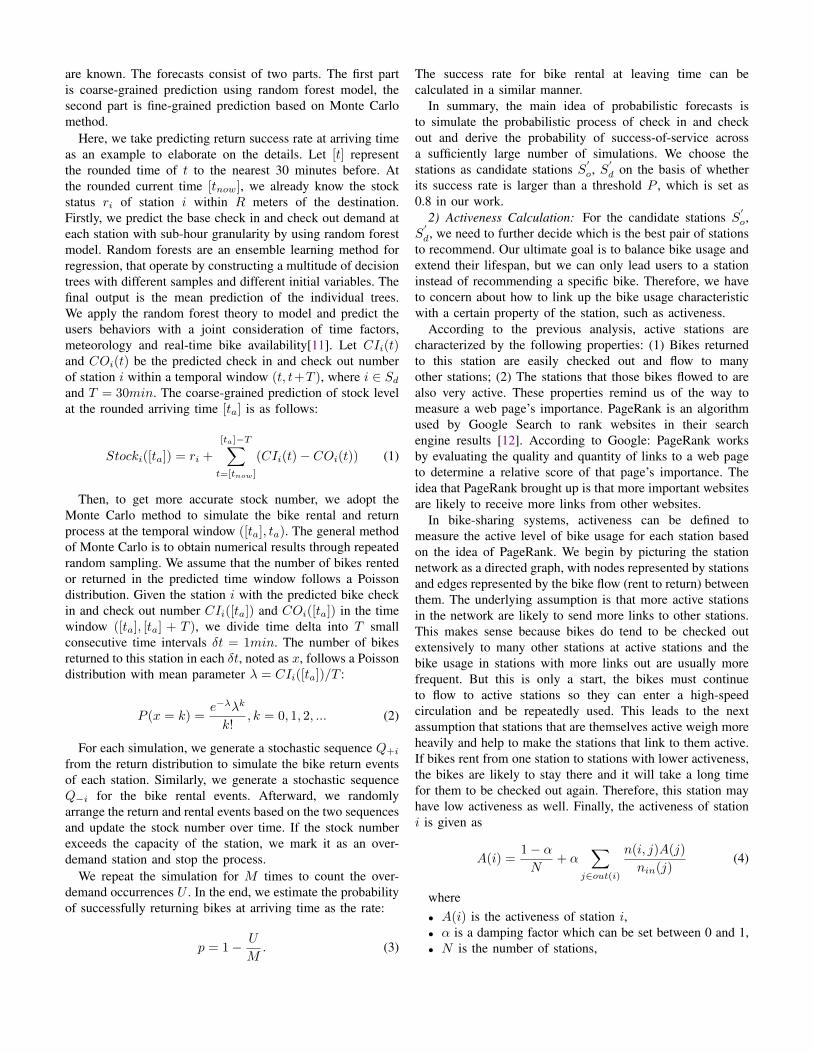
Here, we take predicting return success rate at arriving timeas an example to elaborate on the details. Let [t] representthe rounded time of t to the nearest 30 minutes before. Atthe rounded current time [tnow], we already know the stockstatus ri of station i within R meters of the destination.Firstly, we predict the base check in and check out demand ateach station with sub-hour granularity by using random forestmodel. Random forests are an ensemble learning method forregression, that operate by constructing a multitude of decisiontrees with different samples and different initial variables. Thefinal output is the mean prediction of the individual trees.We apply the random forest theory to model and predict theusers behaviors with a joint consideration of time factors,meteorology and real-time bike availability[11]. Let CIi(t)and COi(t) be the predicted check in and check out numberof station i within a temporal window (t, t+T ), where i ∈ Sdand T = 30min. The coarse-grained prediction of stock levelat the rounded arriving time [ta] is as follows:
Stocki([ta]) = ri +
[ta]−T∑t=[tnow]
(CIi(t)− COi(t)) (1)
Then, to get more accurate stock number, we adopt theMonte Carlo method to simulate the bike rental and returnprocess at the temporal window ([ta], ta). The general methodof Monte Carlo is to obtain numerical results through repeatedrandom sampling. We assume that the number of bikes rentedor returned in the predicted time window follows a Poissondistribution. Given the station i with the predicted bike checkin and check out number CIi([ta]) and COi([ta]) in the timewindow ([ta], [ta] + T ), we divide time delta into T smallconsecutive time intervals δt = 1min. The number of bikesreturned to this station in each δt, noted as x, follows a Poissondistribution with mean parameter λ = CIi([ta])/T :
P (x = k) =e−λλk
k!, k = 0, 1, 2, ... (2)
For each simulation, we generate a stochastic sequence Q+i
from the return distribution to simulate the bike return eventsof each station. Similarly, we generate a stochastic sequenceQ−i for the bike rental events. Afterward, we randomlyarrange the return and rental events based on the two sequencesand update the stock number over time. If the stock numberexceeds the capacity of the station, we mark it as an over-demand station and stop the process.
We repeat the simulation for M times to count the over-demand occurrences U . In the end, we estimate the probabilityof successfully returning bikes at arriving time as the rate:
p = 1− U
M. (3)
The success rate for bike rental at leaving time can becalculated in a similar manner.
In summary, the main idea of probabilistic forecasts isto simulate the probabilistic process of check in and checkout and derive the probability of success-of-service acrossa sufficiently large number of simulations. We choose thestations as candidate stations S
′
o, S′
d on the basis of whetherits success rate is larger than a threshold P , which is set as0.8 in our work.
2) Activeness Calculation: For the candidate stations S′
o,S
′
d, we need to further decide which is the best pair of stationsto recommend. Our ultimate goal is to balance bike usage andextend their lifespan, but we can only lead users to a stationinstead of recommending a specific bike. Therefore, we haveto concern about how to link up the bike usage characteristicwith a certain property of the station, such as activeness.
According to the previous analysis, active stations arecharacterized by the following properties: (1) Bikes returnedto this station are easily checked out and flow to manyother stations; (2) The stations that those bikes flowed to arealso very active. These properties remind us of the way tomeasure a web page’s importance. PageRank is an algorithmused by Google Search to rank websites in their searchengine results [12]. According to Google: PageRank worksby evaluating the quality and quantity of links to a web pageto determine a relative score of that page’s importance. Theidea that PageRank brought up is that more important websitesare likely to receive more links from other websites.
In bike-sharing systems, activeness can be defined tomeasure the active level of bike usage for each station basedon the idea of PageRank. We begin by picturing the stationnetwork as a directed graph, with nodes represented by stationsand edges represented by the bike flow (rent to return) betweenthem. The underlying assumption is that more active stationsin the network are likely to send more links to other stations.This makes sense because bikes do tend to be checked outextensively to many other stations at active stations and thebike usage in stations with more links out are usually morefrequent. But this is only a start, the bikes must continueto flow to active stations so they can enter a high-speedcirculation and be repeatedly used. This leads to the nextassumption that stations that are themselves active weigh moreheavily and help to make the stations that link to them active.If bikes rent from one station to stations with lower activeness,the bikes are likely to stay there and it will take a long timefor them to be checked out again. Therefore, this station mayhave low activeness as well. Finally, the activeness of stationi is given as
A(i) =1− αN
+ α∑
j∈out(i)
n(i, j)A(j)
nin(j)(4)
where• A(i) is the activeness of station i,• α is a damping factor which can be set between 0 and 1,• N is the number of stations,
• n(i, j) is the number of bikes rent from i and return toj,
• nin(j) is total number of bikes return to j and• out(i) is the set of stations that have bikes rent from i.So we can see that the activeness of station i is recursively
defined by the activeness of those stations which are linked toby station i. If station i links to a lot of stations, the commonbelief is that station i is active. The activeness of station jwhich station i links to does not influence the activeness ofstation i uniformly. Within this algorithm, the activeness ofa station j is always weighted by n(i, j)/nin(j). This meansthat the more return bikes station j has, the less will stationi benefit from the link to station j. In addition, if a node hasno ingoing edges, it cannot transfer its activeness to any otherstations. Therefore, a damping factor is added for giving eachnode a probability that a bike can be returned to this stationfrom any other station, each station has 1/N probability to bethe source.
In the above formula, flow patterns in the station networkis the main consideration, but the rental scale of each stationhas to be concerned as well. Stations with large amount ofrentals will certainly affect the mobility of more bikes. Bikesin those stations are usually easier to spread to more stationswhich is an expression of high activeness. So we adopt thenormalized relative check out number to indicate the rentalscale and suppose that stations with large rental scale are moreactive. Therefore, we rewrite the activeness of station i asfollowing:
A(i) = (1− α)ri + α∑
j∈out(i)
nin(i, j)A(j)
n(j)
ri =nout(i)/c(i)∑Nj=1 nout(j)/c(j)
(5)
where c(i) is the capacity of station i and nout(i) is theabsolute check out number of station i. In this way, bikes aremore likely to come from stations with higher relative checkout number. By introducing this prior distribution, this methodprovides a more comprehensive measure of the activeness ofstations.
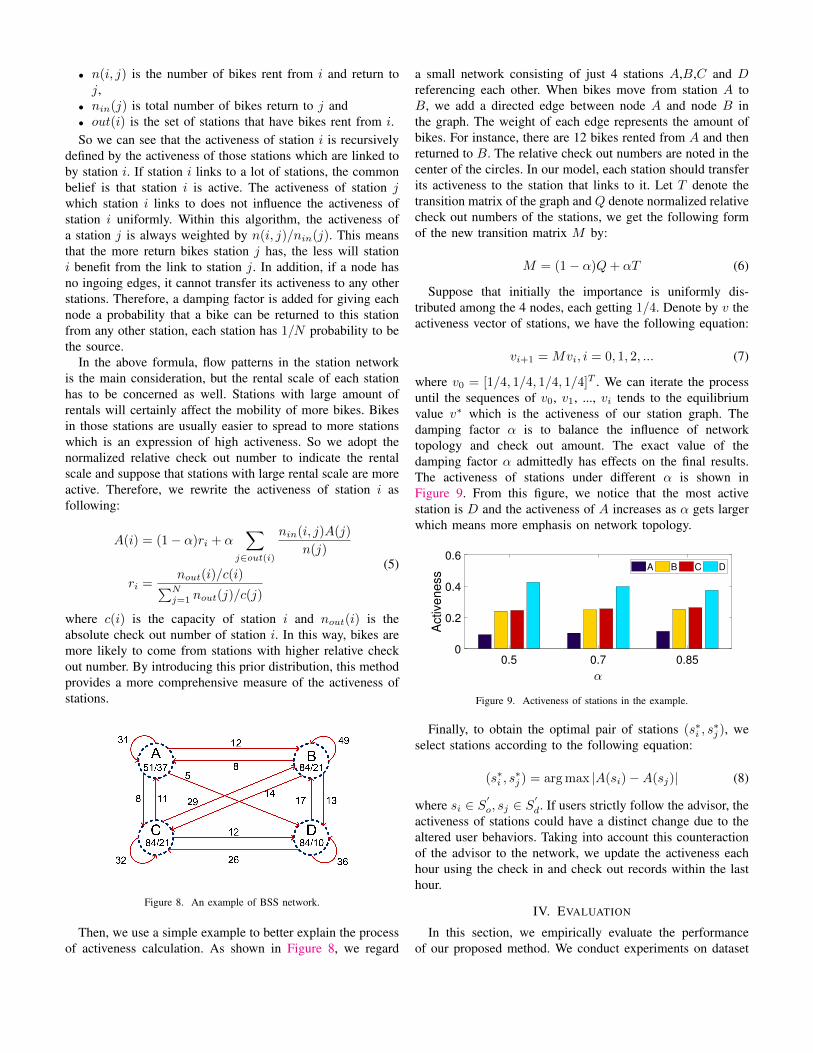
Figure 8. An example of BSS network.
Then, we use a simple example to better explain the processof activeness calculation. As shown in Figure 8, we regard
a small network consisting of just 4 stations A,B,C and Dreferencing each other. When bikes move from station A toB, we add a directed edge between node A and node B inthe graph. The weight of each edge represents the amount ofbikes. For instance, there are 12 bikes rented from A and thenreturned to B. The relative check out numbers are noted in thecenter of the circles. In our model, each station should transferits activeness to the station that links to it. Let T denote thetransition matrix of the graph and Q denote normalized relativecheck out numbers of the stations, we get the following formof the new transition matrix M by:
M = (1− α)Q+ αT (6)
Suppose that initially the importance is uniformly dis-tributed among the 4 nodes, each getting 1/4. Denote by v theactiveness vector of stations, we have the following equation:
vi+1 =Mvi, i = 0, 1, 2, ... (7)
where v0 = [1/4, 1/4, 1/4, 1/4]T . We can iterate the processuntil the sequences of v0, v1, ..., vi tends to the equilibriumvalue v∗ which is the activeness of our station graph. Thedamping factor α is to balance the influence of networktopology and check out amount. The exact value of thedamping factor α admittedly has effects on the final results.The activeness of stations under different α is shown inFigure 9. From this figure, we notice that the most activestation is D and the activeness of A increases as α gets largerwhich means more emphasis on network topology.
0.5 0.7 0.850
0.2
0.4
0.6
Activeness
A B C D
Figure 9. Activeness of stations in the example.
Finally, to obtain the optimal pair of stations (s∗i , s∗j ), we
select stations according to the following equation:
(s∗i , s∗j ) = argmax |A(si)−A(sj)| (8)
where si ∈ S′
o, sj ∈ S′
d. If users strictly follow the advisor, theactiveness of stations could have a distinct change due to thealtered user behaviors. Taking into account this counteractionof the advisor to the network, we update the activeness eachhour using the check in and check out records within the lasthour.
IV. EVALUATION
In this section, we empirically evaluate the performanceof our proposed method. We conduct experiments on dataset
of Hangzhou bike-sharing system in June 2015. There are10,190,841 records, which contains 58,647 bikes and 3,329stations. The data format is presented in Table I. The recordsthat check out and check in at the same station with a tripduration less than 2 minutes are considered as noise data andremoved from the original records.
A. Probabilistic Forecasts
In our experiments, we use the results of probabilisticforecasts as a condition for filtering stations, so we evaluatethe probabilistic forecasts step as a classification problem andthe metrics is as follows:
Precision and Recall: Given the results of whether stationswill be over-demand, precision and recall are defined as:
Precision =|Npre−od| ∩ |Nreal−od|
|Npre−od|(9)
Recall =|Npre−od| ∩ |Nreal−od|
|Nreal−od|(10)
where Npre−od represents the number of events that arepredicted to be over-demand, and Npre−od represents thenumber of events that are really over-demand.
F-measure: F-measure is a weighted average of theprecision and recall. We use Fβ which weighs precision higherthan recall by setting β = 0.5:
Fβ = (1 + β)2Precision ·Recall
β2Precision+Recall(11)
We compare our proposed probabilistic forecasts methodwith the following three algorithms:• Historical average (HA) predicts the usage demand by
averaging the historical values for the same day andtime [13]. For instance, the check out number of Monday08:00 a.m. equals to the average of check out numbers ofMonday 08:00 a.m. in the history and check out numberof 08:00 a.m. last day.
• Auto-Regressive and Moving Average (ARMA) be-longs to time series analysis methods and has beenapplied in demand prediction in [14]. It captures thetemporal patterns of rental and return by leveraging checkin/out information of the most recent p time windows.
• Random forest (RF) is the basic model where fine-grained prediction is not considered. Therefore, thismethod directly gives prediction of stock number insteadof probabilistic results for each station.
For the experiment setup, we divide the historical recordsinto two parts: the first 20 days for training and last 10 daysfor testing. We extract over-demand events by comparing thepredicted stock with the threshold β multiplying the capacity.β equals to 0.2 for check out prediction and 0.8 for check inprediction.
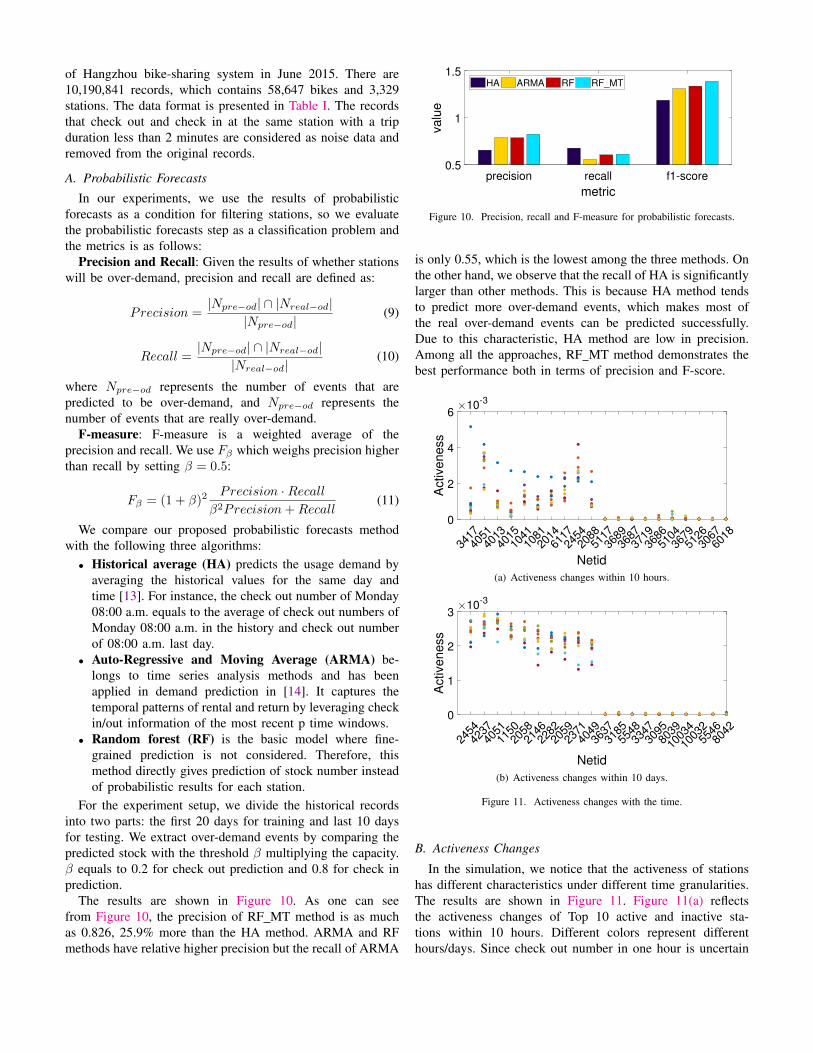
The results are shown in Figure 10. As one can seefrom Figure 10, the precision of RF MT method is as muchas 0.826, 25.9% more than the HA method. ARMA and RFmethods have relative higher precision but the recall of ARMA
precision recall f1-score
metric
0.5
1
1.5
valu
e
HA ARMA RF RF_MT
Figure 10. Precision, recall and F-measure for probabilistic forecasts.
is only 0.55, which is the lowest among the three methods. Onthe other hand, we observe that the recall of HA is significantlylarger than other methods. This is because HA method tendsto predict more over-demand events, which makes most ofthe real over-demand events can be predicted successfully.Due to this characteristic, HA method are low in precision.Among all the approaches, RF MT method demonstrates thebest performance both in terms of precision and F-score.
3417
4051
4013
4015
1041
1081
2014
6117
2454
2088
5117
3689
3687
3719
3686
5104
3679
5126
3067
6018
Netid
0
2
4
6
Active
ne
ss
10-3
(a) Activeness changes within 10 hours.
2454
4237
4051
1150
2058
2146
2282
2059
2371
4049
3637
3185
5548
3347
3095
8039
10034
10032
5546
8042
Netid
0
1
2
3
Activeness
10-3
(b) Activeness changes within 10 days.
Figure 11. Activeness changes with the time.
B. Activeness Changes
In the simulation, we notice that the activeness of stationshas different characteristics under different time granularities.The results are shown in Figure 11. Figure 11(a) reflectsthe activeness changes of Top 10 active and inactive sta-tions within 10 hours. Different colors represent differenthours/days. Since check out number in one hour is uncertain
and random, the activeness of active stations fluctuates wildly.Meanwhile, the difference between active and inactive stationlooks rather small due to the short time interval. Figure 11(b)reflects the activeness changes of Top 10 active and inactivestations within 10 days. It shows relatively smooth changes ofactiveness for active stations and there are deep gaps betweenactive and inactive ones. In the simulation, we update theactiveness of stations for each hour because the activenesschanges can be more obvious among hours especially whenonly small part of users follow the advisor.
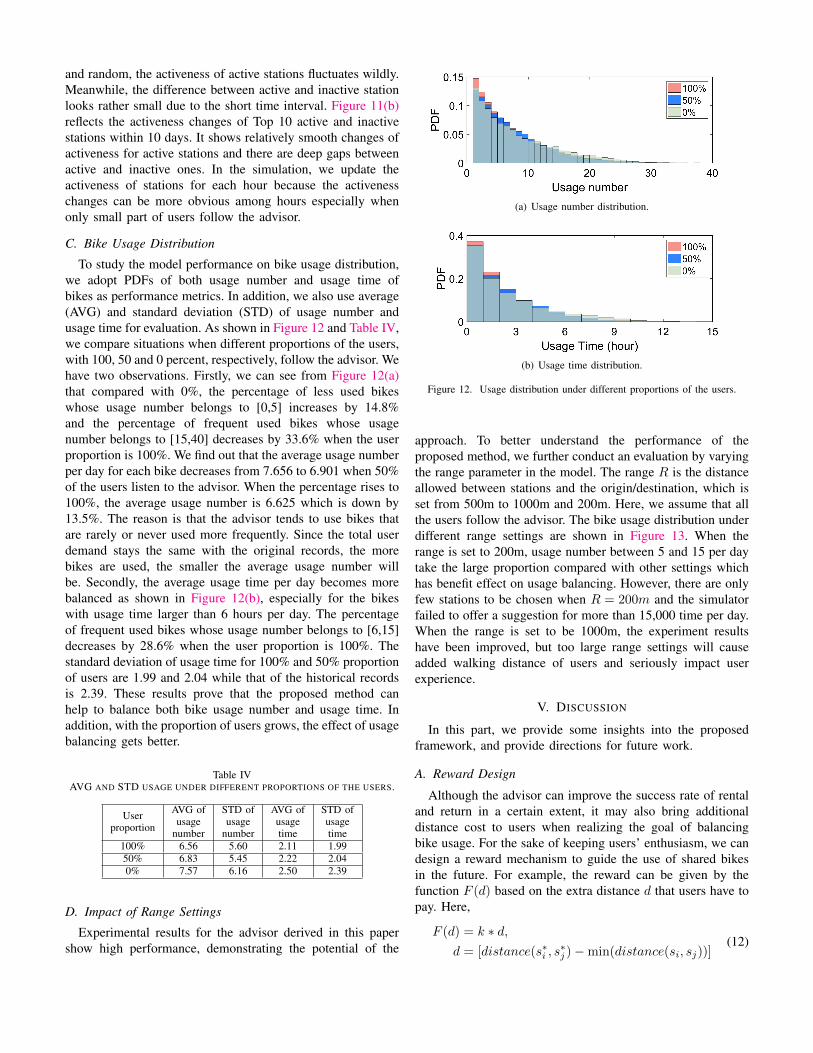
C. Bike Usage Distribution
To study the model performance on bike usage distribution,we adopt PDFs of both usage number and usage time ofbikes as performance metrics. In addition, we also use average(AVG) and standard deviation (STD) of usage number andusage time for evaluation. As shown in Figure 12 and Table IV,we compare situations when different proportions of the users,with 100, 50 and 0 percent, respectively, follow the advisor. Wehave two observations. Firstly, we can see from Figure 12(a)that compared with 0%, the percentage of less used bikeswhose usage number belongs to [0,5] increases by 14.8%and the percentage of frequent used bikes whose usagenumber belongs to [15,40] decreases by 33.6% when the userproportion is 100%. We find out that the average usage numberper day for each bike decreases from 7.656 to 6.901 when 50%of the users listen to the advisor. When the percentage rises to100%, the average usage number is 6.625 which is down by13.5%. The reason is that the advisor tends to use bikes thatare rarely or never used more frequently. Since the total userdemand stays the same with the original records, the morebikes are used, the smaller the average usage number willbe. Secondly, the average usage time per day becomes morebalanced as shown in Figure 12(b), especially for the bikeswith usage time larger than 6 hours per day. The percentageof frequent used bikes whose usage number belongs to [6,15]decreases by 28.6% when the user proportion is 100%. Thestandard deviation of usage time for 100% and 50% proportionof users are 1.99 and 2.04 while that of the historical recordsis 2.39. These results prove that the proposed method canhelp to balance both bike usage number and usage time. Inaddition, with the proportion of users grows, the effect of usagebalancing gets better.
Table IVAVG AND STD USAGE UNDER DIFFERENT PROPORTIONS OF THE USERS.
Userproportion
AVG ofusage
number
STD ofusage
number
AVG ofusagetime
STD ofusagetime
100% 6.56 5.60 2.11 1.9950% 6.83 5.45 2.22 2.040% 7.57 6.16 2.50 2.39
D. Impact of Range Settings
Experimental results for the advisor derived in this papershow high performance, demonstrating the potential of the
(a) Usage number distribution.
(b) Usage time distribution.
Figure 12. Usage distribution under different proportions of the users.
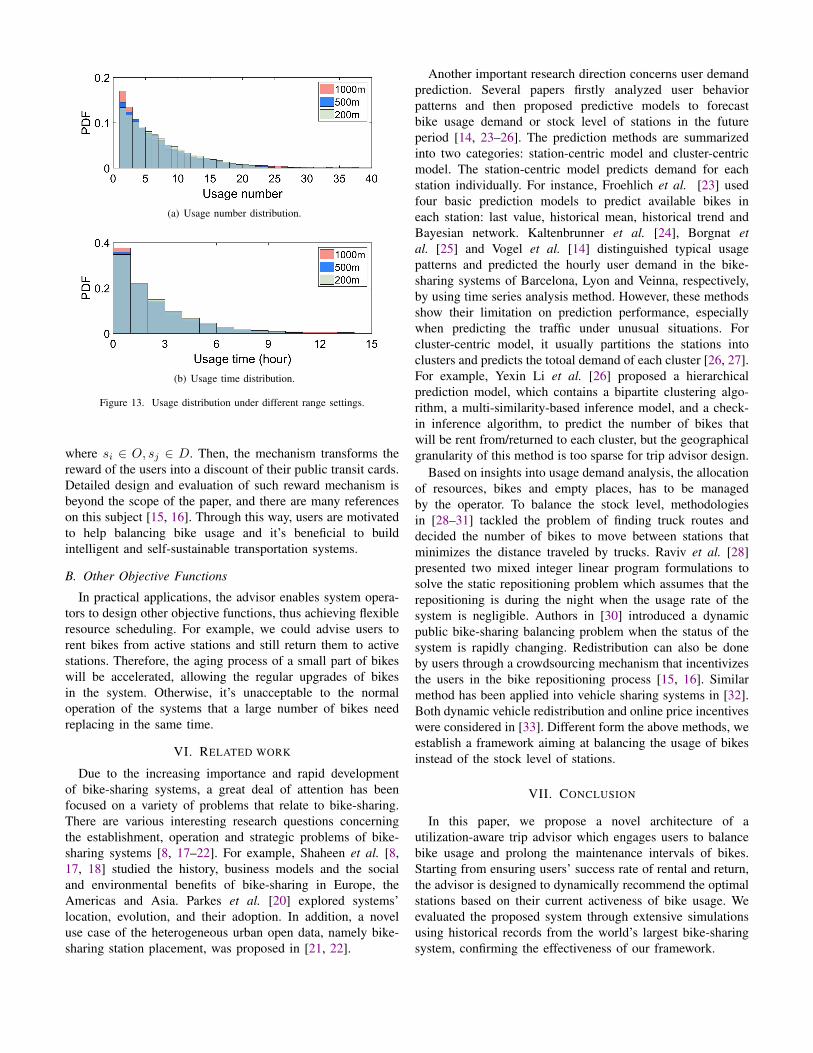
approach. To better understand the performance of theproposed method, we further conduct an evaluation by varyingthe range parameter in the model. The range R is the distanceallowed between stations and the origin/destination, which isset from 500m to 1000m and 200m. Here, we assume that allthe users follow the advisor. The bike usage distribution underdifferent range settings are shown in Figure 13. When therange is set to 200m, usage number between 5 and 15 per daytake the large proportion compared with other settings whichhas benefit effect on usage balancing. However, there are onlyfew stations to be chosen when R = 200m and the simulatorfailed to offer a suggestion for more than 15,000 time per day.When the range is set to be 1000m, the experiment resultshave been improved, but too large range settings will causeadded walking distance of users and seriously impact userexperience.
V. DISCUSSION
In this part, we provide some insights into the proposedframework, and provide directions for future work.
A. Reward Design
Although the advisor can improve the success rate of rentaland return in a certain extent, it may also bring additionaldistance cost to users when realizing the goal of balancingbike usage. For the sake of keeping users’ enthusiasm, we candesign a reward mechanism to guide the use of shared bikesin the future. For example, the reward can be given by thefunction F (d) based on the extra distance d that users have topay. Here,
F (d) = k ∗ d,d = [distance(s∗i , s
∗j )−min(distance(si, sj))]
(12)
(a) Usage number distribution.
(b) Usage time distribution.
Figure 13. Usage distribution under different range settings.
where si ∈ O, sj ∈ D. Then, the mechanism transforms thereward of the users into a discount of their public transit cards.Detailed design and evaluation of such reward mechanism isbeyond the scope of the paper, and there are many referenceson this subject [15, 16]. Through this way, users are motivatedto help balancing bike usage and it’s beneficial to buildintelligent and self-sustainable transportation systems.
B. Other Objective Functions
In practical applications, the advisor enables system opera-tors to design other objective functions, thus achieving flexibleresource scheduling. For example, we could advise users torent bikes from active stations and still return them to activestations. Therefore, the aging process of a small part of bikeswill be accelerated, allowing the regular upgrades of bikesin the system. Otherwise, it’s unacceptable to the normaloperation of the systems that a large number of bikes needreplacing in the same time.
VI. RELATED WORK
Due to the increasing importance and rapid developmentof bike-sharing systems, a great deal of attention has beenfocused on a variety of problems that relate to bike-sharing.There are various interesting research questions concerningthe establishment, operation and strategic problems of bike-sharing systems [8, 17–22]. For example, Shaheen et al. [8,17, 18] studied the history, business models and the socialand environmental benefits of bike-sharing in Europe, theAmericas and Asia. Parkes et al. [20] explored systems’location, evolution, and their adoption. In addition, a noveluse case of the heterogeneous urban open data, namely bike-sharing station placement, was proposed in [21, 22].
Another important research direction concerns user demandprediction. Several papers firstly analyzed user behaviorpatterns and then proposed predictive models to forecastbike usage demand or stock level of stations in the futureperiod [14, 23–26]. The prediction methods are summarizedinto two categories: station-centric model and cluster-centricmodel. The station-centric model predicts demand for eachstation individually. For instance, Froehlich et al. [23] usedfour basic prediction models to predict available bikes ineach station: last value, historical mean, historical trend andBayesian network. Kaltenbrunner et al. [24], Borgnat etal. [25] and Vogel et al. [14] distinguished typical usagepatterns and predicted the hourly user demand in the bike-sharing systems of Barcelona, Lyon and Veinna, respectively,by using time series analysis method. However, these methodsshow their limitation on prediction performance, especiallywhen predicting the traffic under unusual situations. Forcluster-centric model, it usually partitions the stations intoclusters and predicts the totoal demand of each cluster [26, 27].For example, Yexin Li et al. [26] proposed a hierarchicalprediction model, which contains a bipartite clustering algo-rithm, a multi-similarity-based inference model, and a check-in inference algorithm, to predict the number of bikes thatwill be rent from/returned to each cluster, but the geographicalgranularity of this method is too sparse for trip advisor design.
Based on insights into usage demand analysis, the allocationof resources, bikes and empty places, has to be managedby the operator. To balance the stock level, methodologiesin [28–31] tackled the problem of finding truck routes anddecided the number of bikes to move between stations thatminimizes the distance traveled by trucks. Raviv et al. [28]presented two mixed integer linear program formulations tosolve the static repositioning problem which assumes that therepositioning is during the night when the usage rate of thesystem is negligible. Authors in [30] introduced a dynamicpublic bike-sharing balancing problem when the status of thesystem is rapidly changing. Redistribution can also be doneby users through a crowdsourcing mechanism that incentivizesthe users in the bike repositioning process [15, 16]. Similarmethod has been applied into vehicle sharing systems in [32].Both dynamic vehicle redistribution and online price incentiveswere considered in [33]. Different form the above methods, weestablish a framework aiming at balancing the usage of bikesinstead of the stock level of stations.
VII. CONCLUSION
In this paper, we propose a novel architecture of autilization-aware trip advisor which engages users to balancebike usage and prolong the maintenance intervals of bikes.Starting from ensuring users’ success rate of rental and return,the advisor is designed to dynamically recommend the optimalstations based on their current activeness of bike usage. Weevaluated the proposed system through extensive simulationsusing historical records from the world’s largest bike-sharingsystem, confirming the effectiveness of our framework.
ACKNOWLEDGMENT
The paper was partially supported by the National Basic Re-search Program (973 Program) under Grant 2015CB352500,and National Program for Special Support of Top Notch YoungProfessionals.
REFERENCES
[1] P. DeMaio, “Bike-sharing: History, Impacts, Models ofProvision, and Future,” Journal of Public Transportation,vol. 12, no. DeMaio 2004, pp. 41–56, 2009.[Online]. Available: http://www.transitinformatics.org/test/nctr/wp-content/uploads/2010/03/JPT12-4DeMaio.pdf
[2] P. Midgley, “Bicycle-sharing schemes: enhancing sustainablemobility in urban areas,” United Nations, Department ofEconomic and Social Affairs, pp. 1–12, 2011.
[3] L. MetroBike, “2016 Year-end wrap-up will appear at the end ofJanuary,” http://bike-sharing.blogspot.com/2017/01/2016-year-end-wrap-up-will-appear-at.html.
[4] Z. Online, “Hangzhou will add three public bicycle main-tenance bases,” http://zjnews.zjol.com.cn/system/2013/09/23/019608857.shtml.
[5] MSA, “BIKE SHARE PROGRAM,” http://www.michigansuburbsalliance.org/wp-content/uploads/MSA-CAP-Strategy-Library Bike-Share-Program 20211017.pdf.
[6] CitiBike, “Citi Bike Monthly Operating Reports,” https://www.citibikenyc.com/system-data/operating-reports.
[7] Wikipedia, “Hangzhou Public Bicycle,” https://en.wikipedia.org/wiki/Hangzhou Public Bicycle.
[8] S. Shaheen, H. Zhang, E. Martin, and S. Guzman, “China’shangzhou public bicycle: Understanding early adoption andbehavioral response to bikesharing,” Transportation ResearchRecord: Journal of the Transportation Research Board, no.2247, pp. 33–41, 2011.
[9] dayoo, “Difficulty of renting public bicycles due to manydamaged bikes,” http://hainan.ifeng.com/news/detail 2014 06/18/2451605 0.shtml.
[10] J. L. Gastwirth, “A general definition of the lorenz curve,”Econometrica: Journal of the Econometric Society, pp. 1037–1039, 1971.
[11] Z. Yang, J. Hu, Y. Shu, P. Cheng, J. Chen, and T. Moscibroda,“Mobility modeling and prediction in bike-sharing systems,” inProceedings of the 14th Annual International Conference onMobile Systems, Applications, and Services, ser. MobiSys ’16.New York, NY, USA: ACM, 2016, pp. 165–178. [Online].Available: http://doi.acm.org/10.1145/2906388.2906408
[12] S. Brin and L. Page, “Reprint of: The anatomy of a large-scalehypertextual web search engine,” Computer networks, vol. 56,no. 18, pp. 3825–3833, 2012.
[13] N. Gast, G. Massonnet, D. Reijsbergen, and M. Tribastone,“Probabilistic forecasts of bike-sharing systems for journeyplanning,” in ACM CIKM, 2015.
[14] P. Vogel and D. C. Mattfeld, “Strategic and OperationalPlanning of Bike-Sharing Systems by Data Mining - A CaseStudy,” in Computational Logistics, 2011, pp. 127–141.
[15] A. Singla, M. Santoni, G. Bartok, P. Mukerji, M. Meenen,and A. Krause, “Incentivizing users for balancing bike sharingsystems.” in AAAI, 2015, pp. 723–729.
[16] C. Fricker and N. Gast, “Incentives and redistribution inhomogeneous bike-sharing systems with stations of finitecapacity,” Euro journal on transportation and logistics, vol. 5,no. 3, pp. 261–291, 2016.
[17] S. a. Shaheen, S. Guzman, and H. Zhang, “Bikesharing inEurope, the Americas, and Asia,” Transportation ResearchRecord: Journal of the Transportation Research Board, vol.2143, pp. 159–167, 2010.
[18] S. a. Shaheen, A. P. Cohen, and E. W. Martin, “PublicBikesharing in North America: Early Operator Understandingand Emerging Trends,” Transportation Research Record:Journal of the Transportation Research Board, vol. 2387,pp. 83–92, 2013. [Online]. Available: http://trb.metapress.com/openurl.asp?genre=article&id=doi:10.3141/2387-10
[19] E. W. Martin and S. A. Shaheen, “Evaluating Public TransitModal Shift Dynamics in Response to Bikesharing: ATale of Two U.S. Cities,” Journal of Transport Geography,vol. 41, pp. 315–324, 2014. [Online]. Available: http://linkinghub.elsevier.com/retrieve/pii/S0966692314001409
[20] S. D. Parkes, G. Marsden, S. A. Shaheen, and A. P.Cohen, “Understanding the Diffusion of Public BikesharingSystems: Evidence from Europe and North America,”Journal of Transport Geography, vol. 31, pp. 94–103, 2013.[Online]. Available: http://linkinghub.elsevier.com/retrieve/pii/S0966692313001130
[21] L. Chen, D. Zhang, G. Pan, X. Ma, D. Yang, K. Kushlev,W. Zhang, and S. Li, “Bike Sharing Station PlacementLeveraging Heterogeneous Urban Open Data,” in ACMUbicomp, 2015.
[22] J. Liu, Q. Li, M. Qu, W. Chen, J. Yang, H. Xiong, H. Zhong,and Y. Fu, “Station site optimization in bike sharing systems,”in Data Mining (ICDM), 2015 IEEE International Conferenceon. IEEE, 2015, pp. 883–888.
[23] J. Froehlich, J. Neumann, and N. Oliver, “Sensing andPredicting the Pulse of the City through Shared Bicycling,” inIJCAI, 2009.
[24] A. Kaltenbrunner, R. Meza, J. Grivolla, J. Codina, andR. Banchs, “Urban Cycles and Mobility Patterns: Exploring andPredicting Trends in a Bicycle-based Public Transport System,”Pervasive and Mobile Computing, vol. 6, no. 4, pp. 455–466,2010.
[25] P. Borgnat, E. Fleury, C. Robardet, and A. Scherrer, “SpatialAnalysis of Dynamic Movements of Velo’v, Lyon’s SharedBicycle Program,” in European Conference on Complex Systems(ECCS), 2009.
[26] Y. Li, Y. Zheng, H. Zhang, and L. Chen, “Traffic Prediction ina Bike Sharing System,” in ACM SIGSPATIAL, 2015.
[27] E. O. Mahony and D. B. Shmoys, “Data Analysis andOptimization for (Citi) Bike Sharing,” in AAAI, 2015.
[28] T. Raviv, M. Tzur, and I. Forma, “Static Repositioning ina Bike-sharing System: Models and Solution Approaches,”EURO Journal on Transportation and Logistics, vol. 2, no. 3,pp. 187–229, 2013. [Online]. Available: http://dx.doi.org/10.1007/s13676-012-0017-6
[29] J. Shu, M. C. Chou, Q. Liu, C.-P. Teo, and I.-L. Wang, “Modelsfor Effective Deployment and Redistribution of Bicycles WithinPublic Bicycle-Sharing Systems,” Operations Research, vol. 61,no. 6, pp. 1346–1359, 2013.
[30] Contardo, Claudio, C. Morency, and L.-M. Rousseau, “Balanc-ing a Dynamic Public Bike-sharing System,” Tech. Rep., 2012.
[31] J. Schuijbroek, R. Hampshire, and W.-J. van Hoeve, “InventoryRebalancing and Vehicle Routing in Bike Sharing Systems,”Tech. Rep., 2013.
[32] A. Waserhole and V. Jost, “Pricing in vehicle sharing systems:Optimization in queuing networks with product forms,” EUROJournal on Transportation and Logistics, vol. 5, no. 3, pp. 293–320, 2016.
[33] J. Pfrommer, J. Warrington, G. Schildbach, and M. Morari,“Dynamic vehicle redistribution and online price incentivesin shared mobility systems,” IEEE Transactions on IntelligentTransportation Systems, vol. 15, no. 4, pp. 1567–1578, 2014.
Related Documents