Juha Hurstinen Data-Driven Marketing: Impacting a Revolution in the Marketing Industry Using data-driven marketing to improve profitability Metropolia University of Applied Sciences Bachelor of Business Administration International Business & Logistics Thesis 28 April 2020

Welcome message from author
This document is posted to help you gain knowledge. Please leave a comment to let me know what you think about it! Share it to your friends and learn new things together.
Transcript

Juha Hurstinen
Data-Driven Marketing: Impacting a Revolution in the Marketing Industry
Using data-driven marketing to improve profitability
Metropolia University of Applied Sciences
Bachelor of Business Administration
International Business & Logistics
Thesis
28 April 2020

Abstract
Author(s) Title
Juha Hurstinen Data-driven marketing: Impacting a revolution in the mar-keting industry
Number of Pages Date
50 pages + 1 appendices 28 April 2020
Degree Bachelor of Business Administration
Degree Programme International Business & Logistics
Specialisation option Marketing
Instructor(s) John Greene, Senior Lecturer
Living in a digitised global community induces a combination of instantaneous con-nectivity with accessible data. Unbeknownst to the consumers who have thrived from data solutions, data analytics on a more advanced level succeeds the digital market-ing trend. Marketers with a competitive edge now use the evolved data-driven market-ing. The purpose of this thesis is to highlight this revolutionary change and its effect on in-dustry identity, how marketers operate, and whether this adaptation of marketing teams combined with data science, specifically IT utilising analytics, improve customer experience (CX) optimisation. This study consisted of exploratory research so analyses were made with qualitative methods in the form of primary data consisting of three interviews surrounding the top-ics of: executive decision-making, the marketing process and customer journey, and data analytics with its relation to CX optimisation and investment metrics. Further case studies relied on a semi-structured framework of primary sources and secondary data to validate the research. One of the respondents is a chief commercial officer (CCO) with over ten years of marketing experience and education while the other two re-spondents are highly educated in computational physics and data analytics with one being a chief science officer (CSO) and other being a senior data scientist. Results further prove that this approach narrowed the scope of decision-making to uti-lise data analytics to realign marketing investments appropriately. In doing so, market-ing decisions have a lower risk factor with marketing investment management and a higher quality of performance measurements from previously analysed marketing campaigns. It is recommended by the author that to enhance the marketing impact, trial demonstrations of analytic solutions to business-to-business (B2B) leads would increase satisfaction, speed up the process of sales funnelling, and lead to product purchasing much faster. Also, adhering to a pricing strategy that is subscription-based would provide a more concrete continuous service as opposed to consultancy pro-jects. The accumulation of these facets would increase the chance of improving the customer experience.
Keywords Data-driven marketing; customer experience; data analytics; measurement; impact

Contents
1 Introduction 1
1.1 Topic and objectives of study 1
1.2 Scope & structure 2
2 Literature Review 2
2.1 Sustainable prospects through marketing processes 3
2.1.1 Marketing decision-making 4
2.1.2 Creative marketing process 6
2.2 Customer experience 10
2.2.1 Customer journey 11
2.3 Big data revolution 13
2.4 Importance of metrics 15
2.4.1 Return on marketing investment 17
2.5 Marketing approaches 20
2.5.1 Digital marketing 20
2.5.2 Data-driven marketing 21
2.6 Marketing development toward customer centricity 23
3 Methodology 24
3.1 Research background 24
3.2 Research design 25
3.2.1 Qualitative research 25
3.2.2 Interviews 25
3.2.3 Quantitative research 26
3.3 Data collection method 27
3.3.1 Qualitative data collection 28
3.3.2 Conducting interviews 28
3.3.3 Quantitative data collection 30
3.4 Data analysis 30
3.5 Limitations 31
4 Software-as-a-service (SaaS) 31
5 Results: Opportunities to improve profitability 32
5.1 Background information 32
5.2 Return on marketing investment analytic solutions 33
5.2.1 Case introduction & positioning 33
5.2.2 Analytics 34
5.3 Consumer insights 38
5.3.1 Customer Archetypes 38
5.3.2 Case study: Telecommunications 39
5.3.3 Case study: Grocery retail 40
5.4 A growth mindset toward customer centricity 41
5.5 Optimising the support beams of decision-making 42
6 Analysis 42
6.1 Business impact 42
6.2 Analytical oversight 43
6.3 Marketing investment management 44
6.4 Conclusion 44
7 References 46
Appendix 1. Face-To-Face Interviews

List of Figures and Tables
Figure 1. Customer-driven marketing strategy. 4
Figure 2. The decision-making process. 4
Figure 3. Core marketing system model. 5
Figure 4. Process of an input-output (IPO) model. 6
Figure 5. Creative marketing breakthrough model. 8
Figure 6. The Marketing Funnel. 9
Figure 7. Sales Funnel. 9
Figure 8. The Services Marketing Triangle. 10
Figure 9. B2B Marketing Funnel vs. Sales Funnel. 11
Figure 10. The New Marketing & Sales Funnel. 13
Figure 11. The Chain of Marketing Productivity. 16
Figure 12. Return on marketing investment formula. 17
Figure 13. Total, incremental, and marginal ROMI. 19
Figure 14. Qualitative vs. quantitative methodology. 27
Table 1. Transformative human-to-digital interactive customer journey. 12
Table 2. Marketing return levels. 18
Table 3. Motivation and succession – Fixed Mindset vs. Growth Mindset. 22
Table 4. Face-to-face interviews: Background information. 29

Table 5. How to perceive data and ROMI modelling: Questions 1-3. 29
Table 6. ROMI analytics: Questions 4-7. 30
Table 7. Service model applications 32
Table 8. Sales on a weekly basis. 35
Table 9. Isolated sales impact. 36
Table 10. Marketing Activities over a monthly period. 36
Table 11. Sales over a monthly period. 36
Table 12. Sales decomposed per activity. 37
Table 13. Short-term tactical marketing impact. 37
Table 14. Long-term, brand-building marketing. 38
Table 15. Campaign uplift categories. 40
Table 16. Marginal ROMI. 41

List of abbreviations
AI Artificial Intelligence. Computer science that is focused on intelligent ma-
chines that work and react like humans.
B2B Business-to-Business. Marketing that is directed at other businesses.
B2C Business-to-Consumer. Marketing that is directed at consumers.
BoFu Bottom of the Funnel. Also known as the Decision Stage, BoFu is the bot-
tom of the sales funnel. The buyer has recognised their problem, found a
solution, and is ready to purchase a product or service. The company has
narrowed down the audience to these buyers and the content showcases
this product or service that will help the sales team close the deal with
them.
CE Customer Equity. The accumulation of a company’s customer base
(value, brand, and retention equity).
CPL Cost Per Lead. An advertising pricing model where the advertiser pays for
explicit sign-ups from a consumer interested in an advert.
CR Conversion Rate. A percentage of people who completed a desired action
on a single website. A high conversion rate means that your website is
performing well while a low conversion rate means that it is performing
poorly.
CRM Customer relationship management. An approach to manage a com-
pany’s interactions, data, and relationship throughout the customer jour-
ney.
CX Customer experience. The overall interactions between an organisation
or entity and consumer over the duration of their relationship. See Chap-
ter 2.2: ‘Customer experience’ for more.
F2F Face-to-Face. An interaction that is normally conducted in person as op-
posed to interacting via (electronic) mediator.

IPO Input-Output Model. A model used for identifying the functions that pro-
cess the inputs and outputs of a given matrix.
IT Information Technology. Virtually anything and everything relating to com-
puting technology.
KPI Key Performance Indicator. A form of measurement to track the perfor-
mance and progress of an objective.
MMM Marketing Mix Model. A technique of variations of marketing tactics used
to optimise a marketing strategy.
MarTech Marketing Technology. Technology that is utilised by marketers to facili-
tate and carry out marketing activities for the purpose of working more ef-
fectively.
ML Machine Learning. A scientific study using algorithms and statistics to de-
velop and improve computer programming experiences via AI.
Modelling Representation of a system or practice to assist the user in quantifying
certain actions and executions.
MoFu Middle of the Funnel. Also known as the Consideration Stage, MoFu is
the middle of the sales funnel. Content has a focus on who their target
audience is, establishing the buyer persona criteria while offering moder-
ate value (solutions that they are looking for). This stage usually picks up
lead generation.
OKR Objective Key Result. Depicted as a strategic framework for identifying a
goal and one or more specific metrics used to track the performance and
achieve it.
ROMI Return on Marketing Investment. A trending sub-metric that is highly fa-
voured by marketing directors because it reveals the overall effectiveness
of a marketing activity. The formula for ROMI is to subtract the marketing
investment by the incremental sales and divide that total by the marketing
investment.

SaaS Software as a Service. A software technology that is sold by a company
to provide services. Accessibility to this software distribution model can
be via subscription on a cloud base.
SEM Search Engine Marketing. Internet-based marketing that assists in in-
creasing visibility in search engine result pages via paid advertising.
SEO Search Engine Optimisation. A sub-set of SEM services, SEO is the pro-
cess of increasing the quality and quantity of traffic to a specific website
through organic search engine results.
SKU Stock Keep Unit. A type of item for sale. This unit can be tracked for in-
ventory, help figure out the lead-time on products, and value sales data.
SMART Specific, Measurable, Attainable, Relevant, & Time-bound. This acronym
is a guide to help create a setting for development in project manage-
ment, strategic planning, development, etc.
ROI Return on Investment. A metric that illustrates the efficiency of an invest-
ment relative to the efficiency of different investments. The basic formula
for ROI is subtracting the cost of an investment by the current value of the
investment, then dividing the total by the cost of the investment.
ToFu Top of the Funnel. Also known as the Awareness Stage, ToFu is the top
of the sales funnel. The content contains the widest audience because it
is the most general. It is the lowest value, which is least ready to convert
but, illuminates the audience of the company’s interests.
TRP Target Rating Point. A percentage of a company’s target audience that
views commercials or advertisements.
UI User interface. The front dashboard from which the user can interact
with the computer system/software

1
1 Introduction
1.1 Topic and objectives of study
Innovative solutions in a global community have shifted market dominance from com-
panies and sellers to consumers and buyers. This unpredictive nature in buying behav-
iour incentivises that the wants and needs of the consumer mandate profitability in a
global economy (Bloching, et al. 2012: 131-134). This ‘new age’ market strategy would
parallel with the growing availability of technology and information in the digital age;
however, it would be presumptuous to imply that the seemingly instantaneous market-
ing communications would match with profitable business goals. Business-to-business
(B2B) relationships and the value proposition which they aim to achieve may still be a
work in progress. Then it stands to reason that improving marketing efforts to adapt
B2B in a consumer-dominated market would capsulate a customer-centric strategy.
(Louth, 2966).
Looking toward productivity and marketing efficiency, technological advancements
would not preclude marketers from remaining stagnant, but take risk factors in market-
ing investment management (MIM). To base their marketing decisions accurately from
the appropriate metrics, another level of investment and strategic thinking is needed in
the marketing process to properly analyse their strategy (Powell, 2003). The usage of
data analytics and collecting and measuring big data is a relatively new concept and
can be seen as a current trend in digital marketing, however, to veterans in the market-
ing industry who have an adaptive growth mindset, it is the pioneering age of data-
driven marketing (Grossberg, 2016).
By adopting a growth mindset and observing each stage of the customer journey, the
challenge begins to form in places where MIM can possibly be optimised, and if so, de-
termine the results as a level of impact unique to the marketing strategy or revolution-
ised in a data-driven society. As a reintroduction to return on marketing investment
(ROMI), originally taking popularity in its infancy during the 1970s along with the “wide-
spread use of ROI to measure firm and strategic business unit (SBU) profitability” (Far-
ris 2015: 269), data analytics are able to assess to improve marketing productivity with
a better precision by measuring ROMI (Farris, et al. 2015).

2
1.2 Scope & structure
The aim of this thesis is to study the developmental stages of digital marketing and de-
termine whether marketing teams can combine creativity with data science to improve
the customer experience (CX). Gaining insight on current marketing decision-models
and understanding the core of data science which utilises analytics to measure ROMI
would act as a catalyst for improving CX optimisation. As the latter part of study will
suggest, CX optimisation will occur from large business impacts that derive from mar-
keting activity reallocation.
The criteria for this thesis consist the following: (1) Introduction – summarising the re-
search topic its objectives, its focus, significance to the reader’s interest. (2) Literature
Review – existing knowledge relevant to the focus of the study so that the reader can
grasp an understanding of the research topic and build context around the researching
findings. (3) Methodology – also known as research design, methodology gains insight
for the reader of the procedures conducted to discover the research findings. (4) Re-
sults – collected and analysed information that was conducted from primary research
with secondary sources to boost validation within a narrative format, results contain
practical knowledge and case studies from the literature review. (5) Discussion – en-
capsulating the research findings and forming an evaluation of the research topic.
2 Literature Review
To understand the impact of technology and the accessible wealth of data that aids the
marketing process, it is important to review the basic marketing theories, practices, and
defining stages that parallel with innovative solutions of technological advancement for
the benefit of customer experience (CX) optimisation. With a growing economy and in-
creasing demand in global (consumer dominated) markets (Louth, 1966), successful
companies have adapted their marketing strategies for the purpose of creating a sus-
tainable competitive advantage. This sustainable competitive advantage is the footnote
in innovation, inspiration for growth [in the private sector] and drive for maximising busi-
ness goals (Kanagal, 2018). For a company to improve upon expanding their business
goals, current marketing trends (MarTech) relating to long-term profitability have shown
to have more customer-centric valuations that help marketers identify methods for
aligning themselves with the right customer. As such, successful marketers that have

3
virtually always been on the cusp of what is trending have identified the trending para-
digm as technology-driven marketing that supports the infrastructure of customer-cen-
tricity (Shah et al. 2006: 115).
In business-to-business (B2B) markets, where a company’s marketing strategy is struc-
tured to target other businesses as customers, technology that supports customer cen-
tricity would publicise organisational culture of transparency and impact financial meas-
urement and marketing processes. And as the cornerstone of all business, financial
metrics facilitate a heavy weight of importance for any change, so technological appli-
cations improving accuracy of financial metrics that would aid decision-making would
potentially be seen as an investment for financial impact (Shah et al. 2006: 188). B2B
innovations in a digitised world would consist of value-based selling with the main drive
behind it being the implementation of data.
2.1 Sustainable prospects through marketing processes
As an activity or set of processes, marketing acts as a prism to better connect an entity
with its customers, clients, partners, and audience. These activities can be seen by cre-
ating, communicating, and exchanging offerings to provide or improve value for their
target (AMA, 2020). Marketing strategies that not only adhere to product, promotion,
price, and placement, but also to the perceptions of the players who interact with these
marketing activities. This means that by having a company that strengthens their mar-
keting processes and communication methods, marketers can opt for meeting the
needs of the customer at a profit (Louth, 1966).
As illustrated in Figure 1, the customer is at the heart of the managing marketing strate-
gies, creating customer value and building profitable customer relationships. As Kotler
& Armstrong (2012: 48) illustrates, the layers that encircle each other are processes
that strengthen the inner models and consequently achieve profitable relationships that
align the needs of the targeted customer and value proposition.

4
Figure 1: Customer-driven marketing strategy (Kotler & Armstrong, 2012: 48).
By aligning these marketing goals with the customer journey (see Chapter 2.2.1), mar-
keters can adapt and refine their marketing strategies and decision-making to nurture
leads, personalise their experience, and optimise customer satisfaction. Through cus-
tomer satisfaction and retention, executives can then calculate decisions for further
growth.
So, as marketing is in a constant state of adaptation, evolving to increase inhouse effi-
ciency, these marketing strategies are always under development and are questioned
regularly in order to help maintain a competitive advantage and continually optimise
customer value. By addressing specific marketing methods that have been affected by
current marketing trends, case study analysis can detect a positive or negative impact
on the customer.
2.1.1 Marketing decision-making
When implementing a course of action for company growth, very important decisions
need to take place that depend on the future of the company. The steps that follow
consist of the decision-making process that every leader uses and repeats as a cycle
to ensure that the decision they made created the best possible outcome.

5
Figure 2: The decision-making process (Dartmouth, 2020).
When it comes to marketing decisions, models are built to categorise marketing plan-
ning and operations. The two categories are strategic and tactical marketing. Strategic
marketing and the decisions behind it are focussed on an innovative approach that dive
into achieving the goals of the company. This can be from changing the pricing model
of an organisation to adjusting the marketing mix model (MMM) (Kotler, 1970:139-140).
Tactical marketing and the decisions behind it are the detailed operations that work to
achieve the strategic goals (Kotler, 1970:139-140). As strategic decisions build the
models to achieve company success, tactical decisions operate marketing activities to
promote strategic actions. A core marketing system model charting the areas where
strategic and tactical decisions are made within the market is listed below in Figure 3.
Figure 3: Core marketing system model (Kotler, 1970: 137).
Identify decision
Gather information
Identify alternatives
Weigh the evidence
Select among alternatives
Take actionReview
decision and consequences

6
To enhance a system model of strategic and tactical decision-making, input-output
models are placed to present current marketing strategies, short-term and long-term,
as well as forecast external factors that may affect company goals. The input-output
(IPO) model represents a flow of data and materials and how it is transformed as a
given product alongside its effect on various factors (Schembri, 2012). Figure 4 illus-
trates the categorisation of data and how marketing decisions allocate them into differ-
ent sectors.
Figure 4: Process of an input-output (IPO) model (Kotler, 1970: 140).
As the transformation of information specifically gears marketing decisions as being a
vital aspect, it is important to analyse the process that has a direct effect on the con-
sumer and customer experience. Understanding the information that correlate to mar-
keting decisions and ensuring accuracy can indirectly lead to better quality decisions.
2.1.2 Creative marketing process
A method of marketing that has driven the industry to be world-renowned for applying
‘soft skills’ (such as being emotionally intelligent, out-going, and having people skills),
creative marketing frames an outline for sending a message which is articulated in im-
aginative forms. Creative marketers held a lot of sway and control for many decades

7
before the digitalisation boomed as their campaigns were a prominent method of com-
municating to mass audiences. Traditional marketing, which is a marketing methodol-
ogy of using mediums that are nondigital like pamphlets, billboards, print advertise-
ments, radio ads, etc., nurtured the creative marketing process, mostly used creative
campaigns and benefited immensely (Marketing-schools, 2012). So, from using crea-
tive talent and artistic skills, creative marketing governs areas like design, music, archi-
tecture, advertising campaigns, etc. alongside the industrialisation, creative marketing
has grown throughout the decades to the point of commoditising products as an amaz-
ing experience.
Creative preparation
Titus (2007, as quoted in Mednick 1962: 263) suggests that the ability to harvest crea-
tive solutions are dependent on variables that help build the theoretical framework
shown in Figure 5. As a creative marketer, these four elements factor in a "desired goal
of an incremental creative process" (Titus, 2007). (1) Task motivation – empirically cat-
egorised by intrinsic and extrinsic motivation, the individual is determined to complete
the task by means of personal response to the creative task (intrinsically) or is com-
pelled by external factors to complete the creative task (extrinsically) (Titus, 2007). (2)
Cognitive flexibility – the counter argument of functional fixedness (the limited mental
block of using an object or performing a task only for its specific purpose) (Camarda, et
al. 2018). An essential aspect for creative marketers to promote innovative thinking. (3)
Serendipity – pertaining to chance or random occurrence that would reveal a personal
impact on creativity. And (4) disciplinary knowledge – surrounding oneself in a level of
association that implies the individual has a certain discipline for the industry and can
make connections where they seem relevant to a creative solution (Titus, 2007: 266).
Applying this model of eliminating mental blocks and promoting creative solutions pro-
duces results on an individual level as well as on a team level and the shaded areas of
uncertainty in Figure 5 that resembles creative doubt and analytical thinking diminish

8
with teamwork and collective effort; therefore, this model minimises the cracks in com-
munication between company and targeted customer.
Figure 5: Creative marketing breakthrough model (Titus, 2007: 264).
Creative Marketing & Business-To-Business (B2B) Customer Advocacy
Though creative marketing is, in fact, heavily represented through external marketing
(shown in Figure 8), creativity itself is a crucial asset in in all variations of service mar-
keting (EPM, 2019). Open-mindedness, inventiveness, and being able to take balanced
risks are seen as strong character traits for any company seeking to expand their mis-
sion.
In driving a customer-centric strategy, the process that companies use in business-to-
business (B2B) markets for reaching a targeted audience and cultivating a long-term
profitable relationship lies with customisation and impact (Mittal, 2018) which can be
enhanced with communication (Ballantyne, et al. 2011). For companies to better com-
municate with their audience, marketers who procedurally follow the stages of the mar-
keting as depicted in Figure 6 would need to adapt to current marketing technology
(MarTech) (technology that trends in the marketing industry to boost marketing effi-
ciency) to increase their chances of recurring revenue and retention.
The marketing funnel is a step-by-step process in which marketers advertise methods
to attract leads (who are potential customers) and nurture those who remain interested

9
through the purchasing decision in order to narrow down the candidates for the sales
team to focus on actionable insights that would prospect leads into customers. The rea-
soning behind these stages is to educate leads, create a memorable impact, and give
them a reason why this product and/or service should be desired (Stemler, 2019).
Figure 6: The Marketing Funnel (Stemler, 2019).
Parallel to the visualisation of the marketing funnel in Figure 6, the sales funnel quanti-
fies the conversion rate of prospects (targeted audience) and narrows it down the
scope as funnel descends, making proposals, setting meetings, and converting those
leads into customers as shown in Figure 7.
Figure 7: Sales Funnel (Goldstein, 2019).

10
Consequently, creative development apropos to the commercial process, the marketing
and sales funnel unification presents a foundational internal marketing guild for a
higher quality of external and interactive marketing methods toward the customers, a
demonstration which is shown in Figure 8. From advertising and branding to customer
benefits and product development, creative teams are valued in their company to com-
municate with the target market. Just as marketing is the epitome for communication,
creative marketing invites pushing the boundaries of conformity with a unique way to
connect and send a message.
Figure 8: The Services Marketing Triangle (EPM, 2019).
Now with digitalisation drastically changing the way marketing is perceived, viewed,
and used, creative leaders are taking another leap to gain that competitive edge. In a
society that has access to instantaneous connectivity, sharing experiences and story-
telling becomes an important referral for customer satisfaction. So, for marketing teams
surpass their competitors, improving customer experiences becomes a necessity (Mit-
tal, 2018).
2.2 Customer experience
The customer experience (CX) can be viewed as an illustrative example of creative
marketing; however, it consists of much more than that. It is an interaction between an
organisation and a consumer over the duration of their relationship (Deloitte, 2016). In
other words, it is the epitome of a company’s offering – adhering to the provide quality
care for the customer via product and/or service. Depending on the customer, the CX
11
will vary to some extent. For business-to-customer (B2C) markets, where the products
being sold are ‘over-the-counter,’ the CX may be focussed more on the individual con-
sumer basis. But, as for business-to-business (B2B) markets, there are more consider-
ations with CX. For instance, provided that a B2B company offers software-as-a-ser-
vice (SaaS), their customers would be companies who would purchase their software.
And given the need for the company to sell and the customer to (re)purchase, it would
be profitable to improve the overall ‘customer’ experience which includes the employ-
ees who are the end users. This overall customer experience is also known as the cus-
tomer journey. It provides more detailed specifics of nurturing leads (potential custom-
ers) and optimising their CX from the beginning of their interaction, onward.
2.2.1 Customer journey
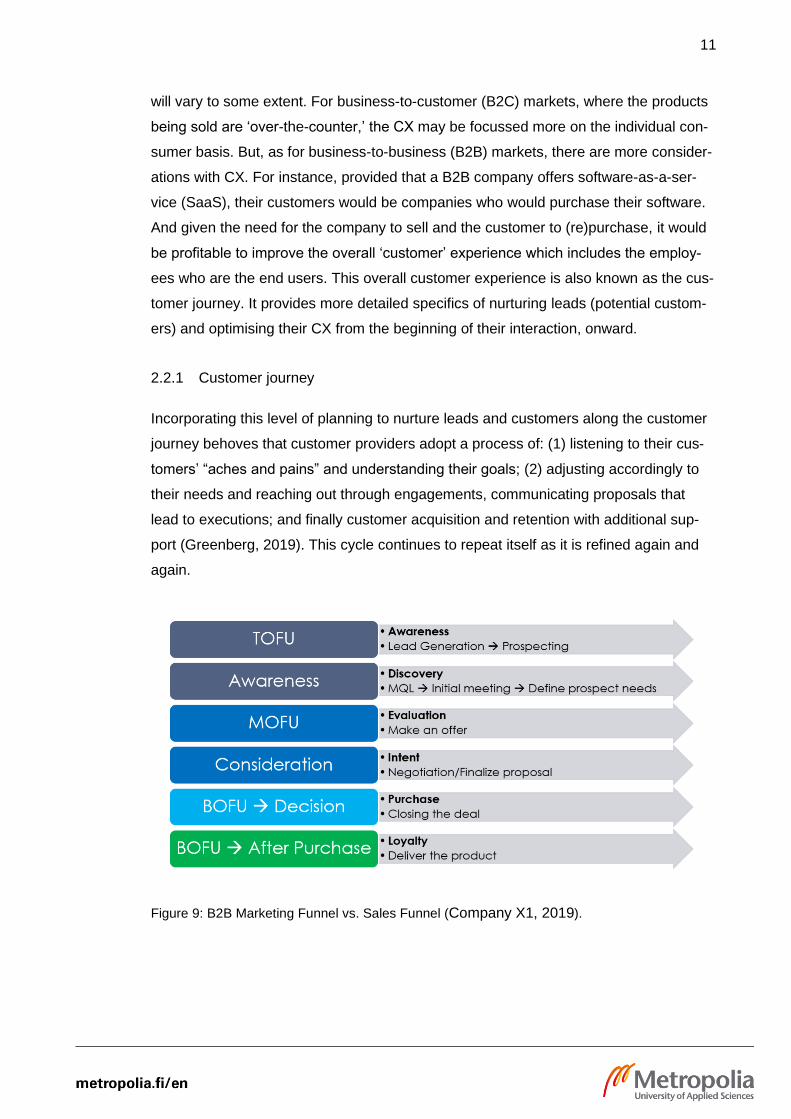
Incorporating this level of planning to nurture leads and customers along the customer
journey behoves that customer providers adopt a process of: (1) listening to their cus-
tomers’ “aches and pains” and understanding their goals; (2) adjusting accordingly to
their needs and reaching out through engagements, communicating proposals that
lead to executions; and finally customer acquisition and retention with additional sup-
port (Greenberg, 2019). This cycle continues to repeat itself as it is refined again and
again.
Figure 9: B2B Marketing Funnel vs. Sales Funnel (Company X1, 2019).

12
Just as Figure 9 integrates commercial processes with providing leads and customers
(unique) experiences, the underlying element is strengthening a relationship by max-
imising business goals. Shapiro (2002) states that to reach high altitudes of customer
satisfaction, companies would need to involve marketing to create a customer-centric
team. However, to prove the value of this integration for the benefit of customer cen-
tricity via profitability, research needs to be conducted on the company’s internal pro-
cesses and track its financial performance. Digitalisation demonstrates a vast amount
of information in a growing innovative society that hyperboles intensive competitive-
ness as a flattening curvature of normalcy; ergo, determining the financial performance
to meet the demand of the consumer-dominated market becomes a requirement
(Kanagal, 2018: 93-94; Maechler, et al. 2017). Organisations that have picked up on
this and are changing their business strategies embark a high demand of balancing au-
tomated marketing activities (marketing automation) and optimising customer satisfac-
tion with a level of human interaction.
Table 1: Transformative human-to-digital interactive customer journey (Maechler, et al. 2017).

13
For instance, B2B companies that are goal-oriented toward customer centricity would
adopt the decision-making process with two opposing factors (such as human interac-
tions and fully digital self-services) that aim to provide optimal experiences. Just as Ta-
ble 1 illustrates, there are variations of customer interactions which marketers respond
to. From identification to customisation and actual utilisation of an AI-powered software
service system, this information is collected in the form of data sets and is measured
using marketing automation and artificial intelligent (AI) systems. Gathering the data to
reveal its value can determine whether B2B companies need to improve on their cus-
tomer centric strategy and at what point during the B2B journey.
2.3 Big data revolution
In order to improve the customer experience, current practices need to be put into con-
text so that areas of development can be uncovered and highlighted. For achieving the
business goal of reaching customer centricity, Shah, et al. (2006, as quoted in Venka-
tesan & Kumar 2004: 118) suggested that the versatile nature of financial impact
spreading across all corners of the company (from managerial decision-making to allo-
cating company resources) may factor as a transformative state to determine what in-
vestment(s) would be best. This financial impact has become apparent with the shift in
marketing growth over the last few decades as shown in Figure 10.
Figure 10: The New Marketing & Sales Funnel (Patrizi, 2012.)

14
The overwhelming amount of accessible information and usage of data has caused the
marketing team to take a larger role in the customer journey and incorporating a more
tailored or ‘customised’ experience at each stage to not only better secure the purchas-
ing decision, but to satisfy the (potential) customer with their decision, strengthen the
closing sales proposal, and employ an increase in customer retention & brand loyalty.
(Stemler, 2019).
The underlying factor that led to the lack of dissonance in marketing and sales funnels
and increase in customer base value and overall customer experience (CX) was revo-
lutionised by data, more specifically, big data that has enabled more detailed reporting
for how to meet customer needs (Bloching, et al. 2012).
Big Data
Big data revolutionising the customer experience commonly relates to structured or un-
organised collected data that is too large to be dealt with by conventional processing
data software. The misconception of big data is the quantity of it, however that is only a
factor to the term. The support beams that hold big data are volume, data velocity, and
data variety (Baumann & Riedel 2018). (1) Volume is normally regarded by the global
community for big data stands off; the amount of data in a specific form whether it is
data sets in excel cell rows, transactions, files, etc. (2) Velocity refers to the time that is
taken to gather and analyse data. And lastly, (3) data variety means the type of data
collected. This in turn, can take the heaviest toll on data scientists who utilise big data
because the speed and volume of data is only regulated by how structured the data-
base is and determines the amount of manual labour required to convert (properly
termed as clean) data into one format for company use (Lotame, 2019).
Big Data Analytics (BDA)
With digitalisation creating more opportunities for growth in many industries, especially
in the information technology (IT) sector, advanced algorithms powered by artificial in-
telligence (AI) and machine learning systems have improved drastically in order to con-
sume data at a faster, more accurate rate (Iafrate, 2018). Using big data analytics
(BDA) to collect and analyse data at a higher quality rate compared to humans
changes the way knowledge is consumed today. As a by-product of knowledge con-
sumption, marketing in the digital era (digital marketing) quickly grew from a marketing

15
trend to a revolutionary component in the industry that shifted the need of labour from
creative to analytical (Cvitanovic, 2020). In a B2B market, it is paramount to understand
this paradigm shift, striving to working alongside the trending technology. However, the
problem is how to monetise big data and determine its value. Because the relevance of
big data ‘intelligence’ is what organisations do with the data, the common challenge is
forming a strategy, infrastructure, or data collection method utilise it properly. Aside
from the organisations who dominate the market and have a plethora of resources, an
evaluation of company status, size, and resources may depict which course of action to
take to undergo the BDA shift.
Big data can be found in multiple forms of raw data that offers zero value until it is
cleaned and converted into appropriate data sets for a specific company (Sciforce,
2019). From understanding the data given and what is means to a company, its spe-
cific value, B2B companies can pool investments into allocated areas of their company
to innovate solutions to improve customer experiences through analytical methods.
2.4 Importance of metrics
Determining whether a specific unit or system has relevant value takes quantification,
calculation, and comparative analysis. Utilising measurement tactics give strategies
and planning their mass, weighing in what is to be allocated and what is not. Systems
of measurements give order and structure to virtually everything and is the backbone
for optimising quantifiable actions. Generally, organisations use metrics for determining
value prospects, tracking performance, and operational forecasts. Managing met-
rics can be tedious for organisations as there are a whole slew of measurements that
often have a large variety of methods (Young. J. 2020). [Marketing] managers would
often build a strategic framework with clear goals in mind with plans on how to achieve
them. This systematic strategy is often referred to as objective key results (OKRs). By
opting to achieve the OKR model, specific activities are targeted to be accomplished.
Set to monitor the objectives’ progress, key performance indicators (KPIs) are tactical
measure values to help achieve OKRs.
Managers review metrics to find efficiency in their investment. Particularly with return
on investment (ROI), return on marketing investment (ROMI) determines the effective-
ness of marketing activities and return on advertising spend (ROAS) investigates me-
dia effectiveness. Overall, the ratios of these measurements that get reported help with

16
the decision-making process and whether budget allocation should be adjusted or re-
main the same. Although, not all campaigns can be measured to the fullest of its ex-
tent, which leads to inaccurate reports and wrongful decisions that are based on them.
For instance, marketing directors who have difficulties with increasing their media
spend may not be able to communicate financial evidence to justify their claims of a
successful leaflet campaign because its offline media does not have the tangible meas-
urements to report.
Aiming to use the best quality metrics that would cause a reaction that will trickle
throughout the marketing processes, customer decision journey, and impact the overall
value of the organisation (Rust, et al. 2004: 77). Figure 11 details the accounts of how
financial performance (in the form of metrics) evaluate relative returns.
Figure 11: The Chain of Marketing Productivity (Rust, et al. 2004: 77).

17
However, traditionally speaking, as Rust, et al. (2004: 79) states, “short-term ROI is of-
ten prejudicial against marketing expenditures.” This means that to improve the impact
on the customer end via financial impact, the company would need to improve return
on marketing investment (ROMI) and generate not only a short-term impact but fore-
cast long-term impacts as well. And implementing big data analytics (BDA) to enhance
the financial impact of ROMI would help back up successful campaigns and optimise
marketing which would lead to better decision-making (Grossberg, 2016).
2.4.1 Return on marketing investment
Return on marketing investment (ROMI) is a sub-metric to return on investment (ROI).
Just as ROI evaluates the efficiency of an investment and directly measures the
amount of return on a particular investment, relative to the investment’s cost – ROMI
measures the overall effectiveness of a marketing [campaign] activity and helps mar-
keters with deciding the best course of action.
Figure 12: Return on marketing investment formula (Farris, et al. 2015).
The quotient following Figure 12 would be able to determine the increase (positive) or
decrease (negative) in sales and gross margin generated and would view the market-
ing decision as a viable investment or not. (Chen, 2020). Moreover, ROMI is seen a fi-
nancial metric that spans across departments from purchasing, finance, sales, and
marketing and it is important to acknowledge that ROMI can be measured for a variety
of evaluations such as conversion rates, cost savings, and marketing assets (Farris, et
al. 2015).
Broadcasted as an essential marketing metric, marketers who adopt ROMI calculations
can offer an increase in revenue and profit when the appropriate mix of data and ana-
lytics are implemented. A more detailed return on marketing investment is relative to
the predictive behaviour that analytics uncovers from collecting data sets along the
customer journey (Bloching, et al. 2012: 129-132). This strategy is already understood
among C-level executives who know how to utilise customer information in terms of
purchasing decisions, brand-building, and segmentation and aim to achieve a higher

18
level of marketing effectiveness (Powell, 2003). A great level of care is considered
when reflecting on estimated returns because marketing expenditures come from liquid
funds (Farris, et al. 2015) so before applying specific marketing decisions, the sources
of variations that calculate ROMI need to be evaluated (Farris, et al. 2015).
Valuation of marketing returns
The first source of variation is valuation of marketing returns. This valuation consists of
many forms, however the valuation forms that will be discussed and further studied re-
late to when the sales lift is unknown as well as forms that contribute toward long-term
financial health. The frontmost valuation when considering marketing returns is base-
line-lift: profit margin generated by incremental sales. In regard to unknown sales lift,
there are two forms to consider. The being form being funnel conversion: forecasting
incremental sales based off historical conversion rates (CR) and the second form being
comparable cost valuation: when opportunity cost differs from the marketing investment
in question. When concerning oneself with valuation of marketing returns that contrib-
ute to long-term financial health, ROMI measures customer equity (CE) and marketing
assets (Farris, et al 2015).
Table 2: Marketing return levels: (Farris, et al. 2015).
Granularity of spending evaluated
The second source of variation is granularity of spending evaluated. This source evalu-
ates what seems to be opposing thought experiments as a modeller can use ROMI to
measure either a single marketing campaign at a granular level – specificity to the sub-
ject’s choice (i.e. cold-call advertisement, email campaign, etc.) or a combination of
marketing activities and ROMI can measure the whole marketing mix model (MMM)
19
(Farris, et al. 2015). The scope can appear to evaluate a given impact from which it
had been measured.
Range from which ROMI is calculated
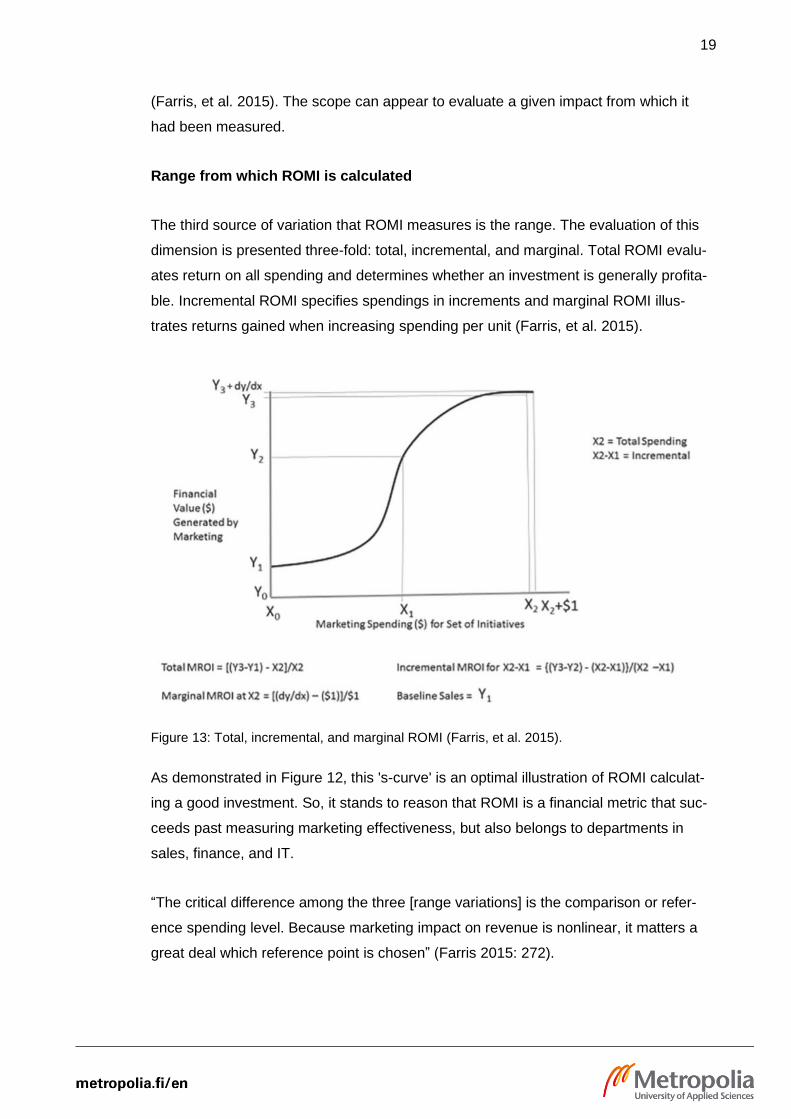
The third source of variation that ROMI measures is the range. The evaluation of this
dimension is presented three-fold: total, incremental, and marginal. Total ROMI evalu-
ates return on all spending and determines whether an investment is generally profita-
ble. Incremental ROMI specifies spendings in increments and marginal ROMI illus-
trates returns gained when increasing spending per unit (Farris, et al. 2015).
Figure 13: Total, incremental, and marginal ROMI (Farris, et al. 2015).
As demonstrated in Figure 12, this 's-curve' is an optimal illustration of ROMI calculat-
ing a good investment. So, it stands to reason that ROMI is a financial metric that suc-
ceeds past measuring marketing effectiveness, but also belongs to departments in
sales, finance, and IT.
“The critical difference among the three [range variations] is the comparison or refer-
ence spending level. Because marketing impact on revenue is nonlinear, it matters a
great deal which reference point is chosen” (Farris 2015: 272).

20
2.5 Marketing approaches
Advancements in accessibility peaks and continues to rise with constant innovations in
technology, communication, and strategy. The evolution of society has collectively
grown because of this and globalisation reaches a new era in the Information Age
(Clark, 2012). For value to be recognised, corporate gears to continue turning, and sus-
tainable growth to pursue onwards, acknowledgement of trending marketing technol-
ogy (MarTech) and its correlation to marketing strategies need to be evaluated to un-
derstand the following marketing approaches (Clark, 2012).
2.5.1 Digital marketing
Outbound method
Specificity and buying behaviour are acutely challenged with technological interference
that B2B companies need to have an adaptive strategy with current marketing trends
(Veronica, et al. 2018). Traditionally, marketing strategies offered little-to-no engage-
ment with leads and customers in terms of approach. This outbound approach was
only sending information rather than accepting and receiving information as well does
little for marketing efficiency within a customer-centric strategy. Because this linear ap-
proach is very one-sided, outbound marketing has an internal perception of success
where the is more product-centred (Shah, et al. 2007). As previously mentioned in
Chapter 2.1.2. ‘Creative marketing process,’ traditional marketing often relied on crea-
tive marketing campaigns which comprised outbound methodology. As a result, there is
a lack of information via customer engagement, feedback, etc., which now gives hind-
sight into the limitedness of technology during that time. Even with the digital boom,
outbound campaigns abused this direct touch to customers with an overflow of adver-
tisements and commercials, missing the overall purpose of centring around the target
audience (Havenga, et al. 2004). Of course, it does not discredit the outbound ap-
proach today, but perhaps adopting a balance of an outbound approach with new age
adaptation can opt for customer experience optimisation.
Inbound method
Perceived as an over-correction with marketers now going from being “soft” to being
‘too technical’ (Moorman, 2019; Albee, 2015), This perceptive look within the industry
may derive from the dependency on online marketing and how marketers can easily
21
gain measurements on such an enterprise level (Albee, 2015). The value of digital mar-
keting lies within its ability to tell stories to directly reach specific audiences for the pur-
pose of conveying a message via internet and online technological tools & platforms
(Albee, 2015). This process is on an ongoing learning curve, constantly improving
alongside digital adaptation. While the digital era was on the rise and connectivity be-
comes relatively convenient, innovative practices in nonlinear approaches proved to
not only improve customer satisfaction, but also profitability and brand loyalty with the
introduction of customer relationship management (Clark, 2012). The inbound ap-
proach adheres to the innovative practices that attract leads and customers and bring
quality content to the marketing funnel. (Clark, 2012). Advancements in customer sup-
port and inbound marketing techniques increased the customer experience; however,
there was still a void in digital marketing that would combine creative marketing teams
with online marketing strategies. The technical perception of how marketers were oper-
ating became realised with the abundance of web design, SEO material and internet
marketing which has allowed marketers to lose sight of truly personalising customer UI
and maximising the customer journey.
Lacking the ability to accurately measure both online and offline media under one mod-
elling system and having technical short-sightedness are symptoms of a void that de-
rives from lack of knowledge, capability, and vision. If innovative leaders are able to
combine their IT department and data science expertise with creative marketing, per-
haps inducing the new age thinking of being “data-driven,” marketers would use data
analytics at face value with optimising their operations and subsequently increase cus-
tomer experience, ergo profitability.
2.5.2 Data-driven marketing
As the pursuit of digital marketing progresses, trends in digital technology have been in
a frantic state, climbing over each other for innovative superiority. This could be due to
the “new is always better” mentality that many marketers have. The large appeal in
MarTech software platforms (marketing automation) is that the attitude of “working
smarter, not harder” may motivate companies to opt for what is trending (SingleGrain,
2019). Digitalisation has clearly made an impact in forming a global society with readily
instant communication. For organisations to maintain that competitive edge, the search
for innovative solutions becomes more of a priority (i.e. following the current marketing
trends to optimise marketing effectiveness) (Fossacecco, 2015). More than just a trend,

22
data-driven marketing has shaped industries and left a major impact on businesses
(Grossberg, 2016). Utilising online marketing tools and combining the creativity of mar-
keting teams with data science to measure the quantities of big data will be a game-
changer for organisations optimising their portfolios creating an opportunity for change.
All that is required is a different kind of mindset. There are two basic mindsets that
shape and define the way people invest and live (Dweck, C. 2006: 48-50).
Table 3: Motivation and succession – Fixed Mindset vs. Growth Mindset (Dweck, 2006).
The growth mindset of personalising customer experiences with the use of big data an-
alytics (BDA) is the backbone of data-driven marketing, it is the main component that
differentiates itself from other marketing methods and modernises digitalisation in the
marketing world (Gordon, et al. 2015).
From simple in-house analytics to more advanced analytics, a data-driven mindset en-
visions a more futuristic approach toward measuring and analysing data & business in-
telligence. With more improved metrics, data science has the capabilities to analyse
and optimise the data further. In this case, data science can help marketers understand
their consumers better, allow more accurate reports for better decision-making and in-
vestment management, and push the era of marketing into a new frontier that encom-
passes customer centricity. The potential challenges that data-driven marketing faces
ahead are the uphill battles with competition that work on an enterprise level in the
growing digital economy. Conducting an in-depth audit of the company status and mar-
keting activities would determine if inhouse marketing is possible with the available re-
sources or does outsourcing offer a higher ROI.
23
2.6 Marketing development toward customer centricity
Adaptation and maintaining a competitive edge are the main elements of survival in
marketing and business (Kanagal, 2018). For organisations to be profitable and grow,
marketing evolves to be era appropriate. During the rise of industrialisation, Mass tar-
geting through direct mail and advertising and outbound methods were successful.
With the digital era, marketers still survived with outbound methods, but also needed to
adjust to inbound marketing, engaging with their customers and receiving feedback –
leading to incremental improvements in customer service and satisfaction. To fill in the
areas where there is a current void, big data analytics (BDA) can gather the vast
amount of data and utilise its knowledge for the benefit of marketers and marketing di-
rectors to make higher quality decisions. These decisions range from increasing the
marketing budget, optimising the customer experience (CX) for leads and nurturing
them more intensely along the customer journey, acquiring more resources, etc.
(Braverman, 2015). The challenges of improving CX with the utilisation of metrics
would come from the consensus of using AI-powered data analytics to analyse the data
from which metrics derive from. Before the time of BDA, digital information was unfil-
tered, unorganised, and not utilised properly. Either data was not accessible because
of the complexity of receiving information or the potential for nurturing data was over-
looked, but now technological achievements in AI change that (Bichler, et al, 2016). Ex-
ecutive leaders in B2B companies for instance, see the innovative solution for tapping
into data knowledge and uncovering its value for prioritising data management on a
consistent basis, organising company infrastructure, re-adjusting performance
measures, and allocating expenditures for full optimisation (Braverman, 2015). Just as
digitalisation has attributed to the popularisation of marketing and data science as re-
spective industries, the interdisciplinary field of combining departments would maximise
operations on all angles, from a consumer knowledge basis and understanding the
wants and needs of the consumer to analysing that data, planning on the best course
of action, and executing the decision with the goal of opting for win-win situations
(Grossberg, 2016).

24
3 Methodology
3.1 Research background
The methodology or research design directly parallels as the backbone of the study
and sets the tone of what content will be produced. Given the nature of the study, the
combination of creative marketing and data science offer a mixed structure of literature-
based research and analytical thinking to properly identify and analyse the problem
statement. Empirical values that derive from relevant experience and measured
knowledge drive the purpose of research and research design. Following the approach
of a problem, research design mandates a methodology of either exploratory, descrip-
tive, or causal research – each that may have data that overlap into one another.
Exploratory research is an initial set of questioning that develops research objectives
and helps define and identify the problem at hand. Exploring related topics, existing
data, and conversing with professional exploratory research aims to narrow down the
problem statement from a slew of unanswered questions to one. (Sreejesh, Mohapatra
and Anusree, 2014: 31-35)
Descriptive research explains the reasoning behind the study. It simply describes a
given situation for what it is rather than describing what caused it. For these reasons,
descriptive research is limited to surveys and observational methods within quantitative
and qualitative data analyses (Sreejesh, Mohapatra and Anusree, 2014: 58-59).
Causal research aims to identify the relationship between variables and how they influ-
ence each other. It may support projects that favour more problem-centred theories on
a more experimental basis. Causal relationships which can be seen by three types:
symmetrical, reciprocal, and asymmetrical. (Sreejesh, Mohapatra and Anusree, 2014:
82-83).
Symmetrical conditions usually occur when the two variables become alternate indicators of another cause or independent variable. For instance, the low attend-ance of youth in martial art clubs and active participation in discotheques and par-ties is the result of (dependent on) another factor such as lifestyle prefer-ences…When two variables mutually influence or reinforce each other, we can say that there is an existence of a reciprocal relationship. For instance, a recipro-cal relationship exists when a person goes through a particular advertisement, which leads him to buy that brand of product…Asymmetrical relationship exists, when changes in one variable (independent variable) are responsible for changes

25
in another variable (dependent variable) (Sreejesh, Mohapatra and Anusree, 2014: 82-83).
3.2 Research design
3.2.1 Qualitative research
Qualitative research refers to an inception of theory that conceptualises diverse per-
spectives toward a focused analysis. Sonyel Oflazoglu (2017: ix) characterises qualita-
tive method “as a naturalistic, interpretative approach, concerned with exploring the
phenomena ‘from the interior.’” Quality content is an essential aspect of qualitative re-
search with results being more descriptive than predictive. Uncovering descriptive data
differ as there are many methods to qualitative research: (1) one-on-one interviews,
conducting in-depth F2F interviews with experts and collecting authentic data on a
given topic; (2) focus groups; collecting data from selected respondents regarding un-
answered questions to better understand a specific target market; (3) case studies,
contextualising and understanding inferring data; (4) observational methods, using sub-
jective methodology to collect specific data; and (5) record keeping, rely on existing
documents as a data source. In congruence with qualitative subject matter, primary
and secondary data provides evidence to support theories for quantitative projections
(Sreejesh, Mohapatra and Anusree, 2014: 47-57).
3.2.2 Interviews
A qualitative approach primarily conducted on an individual basis, interviews present the
opportunity for the researcher and interviewer to elaborate more deeply about a particu-
lar topic. Depth interviews are better diagnosed as a preliminary setting for quantitative
research with an analytical questionnaire. In-depth interview on the other hand, are cat-
egorised into three types (Sreejesh, Mohapatra and Anusree, 2014).
Unstructured Interviews
Dependable on the allowance of informal interaction because there is no prepared
questionnaire, the interviewer would need to establish a level of rapport to ensure co-
operation and show the interviewee there is a level of freedom amongst them and that
the interview can take various directions. Unstructured interviews are flexible to the sit-
uation at hand and are successful when the interviewer is able to still have a certain
26
level of control and reprise relevant topics. Unstructured interviews range from five
minutes to two hours, depending on the interviewee (Sreejesh, Mohapatra and
Anusree, 2014: 48)
Semi-structured interviews
Semi-structure interviews are flexible yet are subject to a more formal setting in terms
of language, time, and discretion. Preparation is important for the interviewer because
the level of questioning may possess complex answers from the interviewee (or at least
knowledge that surpasses the average person). Semi-structured interviews have pre-
pared questions, but the interviewer is also opened to ask follow-up questions in order
to get a better understanding (Sreejesh, Mohapatra and Anusree, 2014: 48).
Standardised open-ended interviews
Suggested as the term implications, standardised open-ended interviews contain an
elaborate set of questions, specifically worded to leave open-ended answers. This
technique is made for systematic data collection, ultimately helping to compare results
analytically.
3.2.3 Quantitative research
Contrary to qualitative research, quantitative research generates numerical data and
highly focuses on measurements to support hypothetical claims that were made prior
(Oflazoglu, eds. 2017). In opposition to qualitative research supporting systematic
questioning and interpretation, quantitative methodology dictates objectivity and prag-
matism with mathematical precision (Oflazoglu, eds. 2017). In a more layered, struc-
tured format, applying a quantitative methodology means that the quantifiable opinions
and research predetermine a set research design. All research that contains numerical
results and operate under scientific review are quantitative methods (such as surveys
and experiments).

27
Figure 14 Qualitative and quantitative methodology (Oflazoglu, eds. 2017: 5).
Despite the differences between qualitative and quantitative research, data sets can
very much support the primary analysis in a deductive or inductive manner, as shown
in Figure 14.
3.3 Data collection method
As the problem statement questions how marketing teams can combine creativity with
data science to improve the customer experience, empirical values take precedent and
govern this study with a mixed structure of experience, expertise (in a qualitative man-
ner) and quantitative data. Exploratory research is to be conducted first so that related
secondary data can be collected from all relevant angles and various perspectives in
the fields of marketing and data science. This will lay out a framework of determining
the scope of qualitative and quantitative data needed. Research will be conducted by
utilising qualitative methods will narrow the purpose further with quantitative data to
support the variables in question. More specifically, as there is a substantial amount of
literature relating to [data-driven] marketing, primary will help narrow the focus in a
more subjective tone.

28
Collecting and measuring data is a vital aspect of data-driven marketing. So, in pursu-
ing this new approach, the only way it would be approved is if it improved the organisa-
tional support levels. But, how? Research in this area will be done through face-to-face
interviews with chief executives and secondary sources pertaining to organisation-
structural change. Consequently, this leads toward its importance in the marketing in-
dustry and a list of the opportunities that allowed such popularity.
3.3.1 Qualitative data collection
Initial data sets will derive from primary and secondary research from different points of
view. Qualitative research via exploratory research will be conducted through face-to-
face (F2F) interviews as primary sources. The interviews are made to be both semi-
structured so that the interactions between the interviewer and interviewee are more
relaxed and flexible (Sreejesh, Mohapatra and Anusree, 2014: 48-49). Limited to the
research topic, the questions are designed in an open-ended manner so that there is
more room for information to flow that also generate additional questions and further
explanation.
Secondary research will be conducted via existing documents pertaining to the topic at
hand: articles, research reports, books, etc.
3.3.2 Conducting interviews
The research was conducted by using semi-structured interviews. This way, there was
a level of flexibility in which the interviewees had freedom to answer however detailed
they desired. As a semi-structured interview, there needed to be careful terminology
and the questions related to each topic needed to have a general targeted direction. As
the interviewees in question were two chief executives and one senior supervisor, the
time frame for each related topic needed to be taken into account as well. All within
preparation, the respondents were still given the flexibility to cover as much as they
deemed relevant to the topic.
Due to there being three separate in-depth interviews, the first three questions of each
interview begin the same, as shown in Table 4.

29
Table 4: Face-to-face interviews: Background information (Appendix 1).
As each interviewee begins, they are enabling themselves in an interactive method of
introducing themselves, providing value toward the research topic in practice, and of-
fering a powerful statement about themselves which transitions each interviewee to the
core of the questionnaire. As there is one interviewee covering the topic ‘how to per-
ceive data and ROMI modelling’ and two interviewees covering the other topic ‘ROMI
analytics,’ the beginning of the interview remains the same, then two sets of questions
were presented, tailored to each research topic.
The theme pertaining to the perception of data from a marketing point of view enables
a line of questioning that starts off with an insightful communicative process, which has
the goal of making an abstract challenge transition toward a tangible solution, as de-
picted in Table 5.
Table 5: How to perceive data and ROMI modelling: Questions 1-3 (Appendix 1).

30
In contrast to the interview “How to perceive data and ROMI modelling,” the second in-
terview topic titled: “ROMI analytics” transitions with more analytical questioning with
flexibility to provide examples, case studies, and comparisons.
Table 6: ROMI analytics: Questions 4-7 (Appendix 1).
The detailed questionnaires for these in-depth interviews can be found in Appendix 1.
3.3.3 Quantitative data collection
Marketing, more specifically data-driven marketing, is dependable on collecting and
measuring data. As the study is not subject to experimental or causal research, quanti-
tative data will be collected by secondary sources to support the qualitative research.
3.4 Data analysis
The study will be conducted from extensive research on issues that plague marketing
productivity and the innovative process of how using data analytics to measure ROMI
optimises its marketing activities and consequently improves the customer experience
(CX). In unison with a literature study simulating full optimisation with various cases
and the procedures that lead to them, from its abstract form to factual case studies.
There will be a road map of the journey that data analytics, more specifically ROMI
SaaS, will take as the results of its services render across industries and branch
throughout data-driven marketing, metrics, and customer success.

31
3.5 Limitations
Approaching research shows that the main limitations are two-pronged. The first being
the subject matter and the data collection of related topics and the second being time
limitations and its correspondence to early development.
Data collection methods of related topics demand that the target sampling to be limited
in size as the topics may oversee the focus of the study. With the problem statement
concerning areas in marketing development, business analytics, and customer experi-
ence; a substantial amount of questions in each field overlap and may possibly re-route
the focus. With each topic being large enough to be its own thesis, targeted sampling
needs to be limited to narrow the scope.
The second factor that restricts research are time limitations. Due to the increasing
competition in a new market to upscale the demand for B2B communications, the rela-
tively new concept draws an issue of concern pertaining to B2B companies’ privacy
which would make collecting primary source material restricted. Moreover, given the
early stages of development within the market to improve CX by optimising metrics,
secondary sources would be limited, and research indicates that B2B companies will
be competing to work toward developing better SaaS products and optimising ROMI in
the near future.
4 Software-as-a-service (SaaS)
Starting from the inception of communication networks practising innovative solutions
over the decades, cloud computing has grown over many industries reaching a multi-
tude of customer touchpoints.
[Cloud computing is] a model for enabling convenient, on-demand net-work access to a shared pool of configurable computing resources (e.g., networks, servers, storage, applications, and services) that can be rapidly provisioned and released with minimal management effort or service pro-vider interaction ((National Institute for Standards and Technology (NIST) cited in Nayyar, 2019: 4)).
With technological advancements, cloud computing became clearly identified and com-
mon practise with digitalisation, "via resource sharing and transforming end-user com-
puting" (Nayyar, et al. 2019). Companies and individuals alike use cloud computing as

32
a means for different service models. “Infrastructure as a Service (IaaS): providing
hardware, software, storage, and servers, Software as a Service (SaaS): to access
cloud applications and other software, Platform as a Service (PaaS): the platform to
code, run, and deploy apps” (Nayyar, et al. 2019). In business-to-business (B2B) mar-
kets, SaaS is sold to other businesses as a means for customers to use the online ap-
plications of the software on a subscription-based model (Grant, 2020). This way, the
factors laid out in Table 7 can be met real-time via online.
Table 7: Service model applications (Nayyar, et al. 2019: 11).
As opposed to other service models, SaaS is structured to tailor company interactions
with B2B clients as a customer relationship management (CRM) system. Moreover, as
a cloud service, adapting to customer needs would strengthen the marketing funnel,
improve customer retention, and cause a financial impact.
5 Results: Opportunities to improve profitability
5.1 Background information
Company X is a data science start-up company that provides software-as-a-service
(SaaS) to business-to-business (B2B) customers. Operating on an enterprise-level,
Company X competes in the global market for providing businesses with a continuous
service of optimising their marketing activities. The three respondents selected for in-
terviewing are colleagues of one another and as previously indicated in Chapter 3.3.3.
‘Conducting interviews,’ the position of each respondent correlates to subtopics of the
research question. Beginning with definitive explanations that strengthen the narrative
of the research question, analytical solutions are provided with deeper insights by the
two respondents with data science expertise. The first respondent is the chief science
officer (CSO) of Company X who possesses an extensive educational background in

33
engineering & computational physics while the second respondent is one of the senior
data scientists, also possessing a professional background in computational physics
and retail analytics. The third respondent is the chief commercial officer (CCO) of Com-
pany X who has over ten years of marketing experience and education. This respond-
ent will provide insight regarding the perceptive nature of ‘the modern marketer’ and
solutions that would enable a more fulfilling customer-centric strategy. The conducted
interviews collectively hold detailed accounts of modern issues, how competitors ad-
here to these challenges, and how companies who opt for more customer-centric val-
ues attain higher ROI.
5.2 Return on marketing investment analytic solutions
5.2.1 Case introduction & positioning
The usage of data science to proliferate software-as-a-service (SaaS) and increase the
quality of the customer journey not only creates business opportunities for a competi-
tive global market, but also builds stronger business-to-business (B2B) relationships. It
is in these B2B relationships where the accumulation of big data, AI, and marketing
teams improve the customer experience (CX). As a B2B client, the company in ques-
tion needs to evaluate the level of need for ROMI solutions and to what cost. As a com-
petitive player, B2B companies that focus on exemplifying transparency and building
customer relationships would optimise the unison of creative marketing and data sci-
ence, positioning themselves at the frontier of advanced analytics and high-quality ser-
vice.
Simple Analytics
Often attributed to organisations who choose not to invest in advanced analytics, the
internal system that is meant for measuring the correlation between sales data (daily
receipts, receipt value, or sales data) and different marketing activities and ROMI de-
rive from inhouse data analytics. For reasons of budget allocation or mindset as a com-
modity rather than necessity, a small organisation may have requisition of one or two
data analysts/ scientists at hand to build a model or perhaps utilise a template which is
online based. However, other means of creating an inhouse marketing analytics team
(for a middle-large sized organisation with an annual turnover of +50 million – 10,000
million) would require a large budget for an entire analytics department and years of

34
R&D to rationalise the vast amount of complex data sets that come from big (market-
ing) campaigns. The developmental stage for this would need a substantial amount of
resources to measure the marketing effectiveness and implement customisation costs.
Consultancies
Many organisations that do not have the expertise or resources to manage their own
campaigns, let alone measure them, seek aid from a third party. These specialists
model projects that give them proven credentials alongside years of experience. This
B2B relationship is built from the organisation’s weak marketing team, operational
health, and/or need for strategic advice. As the average lead time for advising on a
campaign on model ranges from two to three months, the clear implementation is best
tailored toward middle-sized companies who can justify a small mix of advertising cam-
paigns and marketing activities. Investments in powerful advanced analytic software
would also be unnecessary as middle-sized companies would not necessarily carry
heavy offline media investments. The downside for these B2B relationships is that with
the labour-intensive projects that consultants (and media agencies) oversee, security
matters reputably result in poor (financial) transparency and there is relative vendor de-
pendency.
Advanced analytics
With the usage of software-as-a-service (SaaS), this AI-powered customer relationship
management (CRM) system incorporates machine learning models at higher compu-
ting power which collects and analyses sales and marketing data in real-time (for more
accurate results), expedites lead time, and forecasts predictive behaviour based on in-
dividual purchasing data and external factors. With the intensive capabilities of compu-
ting power being able to process millions of rows of data, advanced analytics are sug-
gested for organisations with a large turnover (+150 million to 10,000 million euros an-
nually).
5.2.2 Analytics
Without the right service model, actual sales and investments are poorly channelled.
This puts a strain on the customer journey and the company itself and it stands to rea-
son that a non-digital method would be less favoured as a marketing strategy in the
digital age; consequently, leading to an incremental increase of investments in online

35
marketing. One of the advancements that rectifies this is by engineering a ROMI model
via SaaS to highly prioritise sales and media data. These models generate higher pre-
cision and create opportunities for better decision-making. Although, depending on
level of analytics, computing power may not be able to fit enough available data into a
model, hence, generating bad media decomposition and poor forecasts. To tackle
these challenges, the top-of-the-line modelling techniques utilise statistical methods,
specifically Bayesian hierarchical methods. By using Bayesian inference, (a statistical
method used for revising probabilities as more information comes to light), one can
conveniently introduce prior distributions for a model to enter in the correct amount of
data. Basically, one can utilise the same principles that are found in data to improve the
results and prevent overfitting [data into a model] so that the updated reports made for
marketers are accurate with all available data.
Reliable results
Optimising marketing on every level derives from ROMI analyses, and even more so,
data quality. Attaining more granular data provides opportunities for information to im-
prove results. For instance, a weekly marketing campaign contains a different item
from a given category. As Table 8 indicates, the sales uplift is shown in item level fig-
ures, but the category level describing which items are sold remain still.
Table 8: Sales on a weekly basis.
The importance of granularity presents quantifiable signals once the sales impact is
isolated on a specific product set level. This acknowledges reliability when analysing
ROMI and offers higher quality insights into decision-models.

36
Table 9: Isolated sales impact.
This level of granularity with Bayesian inference statistics is able to measure individual
excel rows of data and project offline media activity success – reallocating a B2B cus-
tomer’s offline media spend toward a more customisable, cost effective media spend.
Marketing activity regression
Many marketing activities operate simultaneously on a daily basis. This makes measur-
ing each marketing activity difficult as are not isolated and overlap each other.
Table 10: Marketing Activities over a monthly period.
The challenge for B2B customer who would review these overlapping offline and online
measurements, would not be able isolate and compare the most successful from the
least successful activities. So, sales would generate a graph similar to Table 11.
Table 11: Sales over a monthly period.

37
As there are a number of methods that organisations use to solve this, from linear re-
gression (relationship between a dependent variable and independent variable) to
Bayesian statistical modelling, it is typically simpler to show the correlation rather than
the actual causality. Advanced analytics that utilises Bayesian statistical modelling for
measuring ROMI uncovers causal links between marketing and sales and is able to
proxy sales decompose per activity.
Table 12: Sales decomposed per activity.
Short-term impact
The impacts illustrated in Table 13 demonstrate the baseline uplifts in sales with a
small response time. Regarding long-term strategies, this high uplift carries no impact,
however, is helpful in short-term tactical marketing when reviewing campaigns.
Table 13 Short-term tactical marketing impact.
Impacts like these are often attributed to promoted products and this model helps
demonstrate a customer’s purchase cycle and conversion rate (CR).
Long-term impact
Long-term marketing strategies that centre around a customer-centric strategy usually
would involve brand-building. The effects of monitoring the long-term impacts over a

38
fixed period can be measured to gradually increase with each short-term impact elevat-
ing the standard baseline. Modelling ROMI over this period of time can evidently prove
to show performance increases.
Table 14: Long-term, brand-building marketing.
By tracking key performance indicators (KPIs) such as brand awareness and brand
building gauge a further understanding of long-term development of base sales and
margin, while the media investments explain the evolution of brand metrics.
5.3 Consumer insights
5.3.1 Customer Archetypes
Understanding the behaviour and mindset of the buyer personas help an organisation
set appropriate objectives to plan a suitable course of action to meet the demands of
their customer and uncover ways to improve their experience.
Marketing Managers
For marketing managers, it is an on-going pursuit to monitor different media channels
and discover which ones are performing best or which campaigns are performing best.
For a marketing manager to achieve, goals like being on top of the latest trends and
have easy high-quality reports will lead to success. At the bottom of the managerial hi-
erarchy, marketing managers to strive to impress and have a goal setting of keeping on
top the latest trends and becoming “the next CMO.”
Commercial Director

39
It is the duty of the commercial director to build cooperation between sales and market-
ing functions to capsulate the whole commercial process. The commercial director is
basically the catalyst for bridging profitability and customer success management. This
includes finding out ways to increase sales and how different sales channels are per-
forming along with improving brand loyalty and customer retention.
Chief Executive Officer
Depending on the size of the company, the CEO struggles with thoughts of growth,
risk, and divestment. When it comes to presenting to the company’s stakeholders, the
CEO must prove profitability and that the company is succeeding in its endeavours.
With misconceptions of marketing and what is proven to be shown in with the market-
ing department, CEO’s also struggle with how to view marketing, an expense or invest-
ment.
Marketing Director
Similar to the commercial director, the marketing director is constantly searching for
methods to bridge the gap between marketing and sales. However, one of the biggest
challenges faced is the fixed perception the business world has on marketing. It hin-
ders the marketing director’s abilities to perform optimally and it strengthens the barri-
ers of vertical silos between sales and purchasing. So, finding a way to communicate
with the other departments who speak with financial reports is a goal set along with
budgeting accordingly for appropriate investments. All of which is one of the biggest
struggles because being perceived as “soft” will not gain any accountability.
5.3.2 Case study: Telecommunications
A B2B customer, telecommunications Company Y had no structure for cross-sales be-
tween products, no marginal view for analytics, nor a dashboard for long-term brand-
building and sales channelling (i.e. online channels, stores, etc.). However, Company Y
seemed to possess plenty of analyses of marketing activities. With a decline in store
traffic as well as having disorganised space in data storage, Company Y had been
sought out to audit themselves and agree to position themselves as a company deserv-
ing of advanced analytics. Now subscribed to a service model that regularly updates in
real-time, BDA was able to analyse millions of rows of their receipt data and generate a
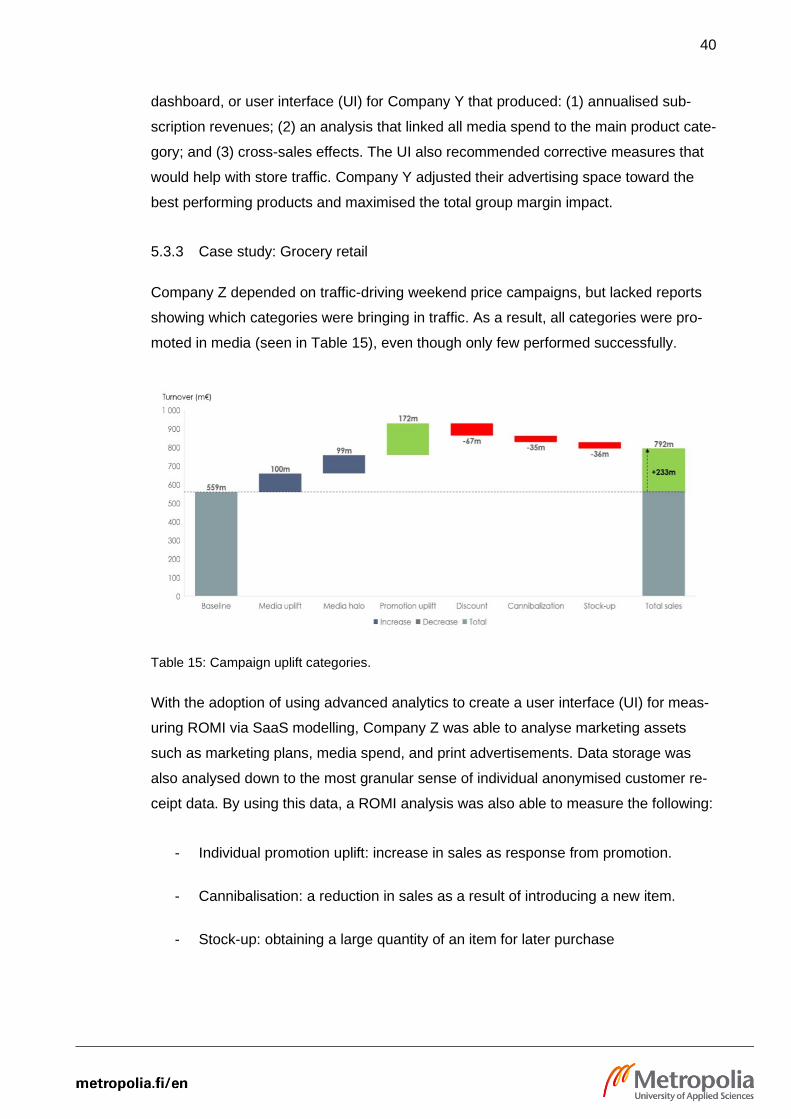
40
dashboard, or user interface (UI) for Company Y that produced: (1) annualised sub-
scription revenues; (2) an analysis that linked all media spend to the main product cate-
gory; and (3) cross-sales effects. The UI also recommended corrective measures that
would help with store traffic. Company Y adjusted their advertising space toward the
best performing products and maximised the total group margin impact.
5.3.3 Case study: Grocery retail
Company Z depended on traffic-driving weekend price campaigns, but lacked reports
showing which categories were bringing in traffic. As a result, all categories were pro-
moted in media (seen in Table 15), even though only few performed successfully.
Table 15: Campaign uplift categories.
With the adoption of using advanced analytics to create a user interface (UI) for meas-
uring ROMI via SaaS modelling, Company Z was able to analyse marketing assets
such as marketing plans, media spend, and print advertisements. Data storage was
also analysed down to the most granular sense of individual anonymised customer re-
ceipt data. By using this data, a ROMI analysis was also able to measure the following:
- Individual promotion uplift: increase in sales as response from promotion.
- Cannibalisation: a reduction in sales as a result of introducing a new item.
- Stock-up: obtaining a large quantity of an item for later purchase

41
- Vendor funding: a company lending money for the purpose of resale at a sepa-
rate outlet.
- Halo: an upsell of an item as a by-product of promoting another item.
As a result, it was revealed that Company Z’s best performing media were newspapers
and consequently found which holidays and seasons gave the best ROMI.
5.4 A growth mindset toward customer centricity
The common challenge for marketers has been measuring marketing in terms of bal-
ancing different media into one KPI, granted, online marketing has dominated market-
ing activities today as digital MarTech trends alongside digitalisation, but It is under-
standable because of how reliable and accurate generating long-term customers are
from original point of sale (POS) to checkout and further repurchase. However, it does
not mean companies should discredit offline media. It has become increasingly difficult
to measure marginal ROMI of offline media effectiveness as there are no cookie track-
ing methods to trace and analyse. For organisations opting for a fix, there have been
an array of solutions that were previously mentioned in Chapter 5.2.1.: ‘Case introduc-
tion & positioning.’ It does become evident though, that measuring ROMI via granular
spending with advanced analytics learns to analyse sales receipt data, marketing data,
and external data to report the optimal investment. As Table 16 describes, measuring
marginal ROMI curve shows how much an addition unit of media investment is ex-
pected to generate incremental margin at a certain level.
Table 16: Marginal ROMI.

42
Marketing executives almost invariably report marketing activities in euros so being
able to project the optimal investment as a result of granular ROMI analysis proves that
using AI practises to automate detailed analyses generates a financial impact.
5.5 Optimising the support beams of decision-making
By using the input-output model that was described in Chapter 2.1.1: ‘Marketing deci-
sion-making’ and applying ROMI models into strategic and tactical marketing strate-
gies, inputting ROMI metrics would assist strategic planning in a manner of: emphasise
brand-building or sales focussed activities and reallocate media investments with the
highest expected return rate. Inputting ROMI metrics into tactical operations would: re-
allocate campaigns and prioritise them according to the most cost effective; segregate
the optimal media channels traffic; and subject media spend at the most profitable time
periods. As a result, the output model presents incremental sales and margin for the
SaaS provider and in turn, recurring revenue. Recurring revenue in the form of incre-
mental sales and margin implies that the customer is happy and the objective of the
long-term strategy of brand-building increases brand loyalty from the customer. Strate-
gically, taking into account loyalty data by trending customer segments allows the B2B
vendor to not only witness the customer impact, but also the latest trends by that spe-
cific segment which will help find trends before competitors. By including the competi-
tor’s media investment information into modelling ROMI as an external factor, ad-
vanced analytics will be able to benchmark actions that perform and present the correct
level of investment.
6 Analysis
6.1 Business impact
As this study started off as deciphering a method of combining creative marketing and
data science to improve the customer experience, it became apparent that data-driven
marketing via measuring big data was the heart of gaining perspective on how to gain a
competitive advantage. The values pertaining toward a competitive advantage today
appear to share a similar value system as using ROMI as a SaaS for B2B customers. It
is using innovative methods to place the B2B vendor around the customer’s wants and
needs. As the cases studies have shown, implementing SaaS allows transparency and
organisation for the customer’s inhouse systems as well as integration that may be

43
subject for continual improvement. As a result, this customer-centric strategy increases
brand loyalty and customer retention. With understanding the customer archetypes and
the challenges they face, it is important that when marketers communicate the many
solutions that big data has to offer, that specificity plays a role into appropriately classi-
fying the right solutions to the right potential customers (prospects). As a SaaS model
that fully integrates into a company, it is able to be optimised on a multitude of cus-
tomer touchpoints and create a customer impact (with a level of satisfaction of market-
ing effectiveness) and allocating marketing assets from poor marketing actions. Also,
the market impact generated by measuring ROMI on a granular level to isolate market-
ing activities and reallocate media spend for optimal investment optimises revenue and
sales margins. This ultimately creates a financial impact that entices customers to re-
purchase and/or pay their subscription. And so, the recurring revenue for the B2B ven-
dor acts as the output nurturing the bottom of the funnel (BOFU) of the customer jour-
ney.
6.2 Analytical oversight
Growing in popularity in the digitised world, big data research has expanded to many
industries in the public and private sector. By also creating opportunities to improve
services, big data and analytics are continuously creating innovative methods to opti-
mise business relationships and the overall customer experience (CX). Nowadays,
whether a company is using inhouse sourcing methods or hiring outsourcing avenues
to apply measurements of big data, predictive analytics suggest that the company who
is able to communicate to the customer they that possess the most relevant up-to-date
technology will gain the competitive advantage. For B2B markets, the competitive ad-
vantage is retention via applying creative solutions to adhere the customer journey. Us-
ing analytics to measure the three sources of ROMI and find solutions for B2B custom-
ers does strengthen marketing efficiencies and closes the gaps of the communicative
process for B2B customers. Big data analytics (BDA) has optimised the source of what
maintains a strong marketing investment management. The MarTech that is constantly
being innovated pushes marketers to interchange between different systems, search-
ing for optimal technology that would give the solutions desired. Every modern mar-
keter needs the skills that trend in today’s world in order to work in a proactive behav-
iour. For instance, methods of proactive behaviour for improving marketing effective-
ness are adjusting by simply shifting the perspective of marketing expenditures from
44
budgets to investments and constantly searching for ways to enhance the CRM sys-
tem.
6.3 Marketing investment management
When it comes to short-term tactics that require more focus and attention, marketing
effectiveness has been shown to have a higher impact, represented by ROI. Long-term
strategies strengthen the marketing management guild, building trust and value for the
B2B customer as well as covering security for the on-going future. It may not be as im-
pactful as short-term strategies, but over time, one can illustrate the incremental
growth. Marketing executives with a clear motivation for breaking down departmental
silos, allowing more communication and integration within a company, and pursuing a
growth mindset in the direction of customer centricity persist on improving marketing
investment management to show sales and purchasing departments that investments
in these strategies will be justified with either high or slow incremental impact.
6.4 Conclusion
Concerning the relevance of data and how it affects optimisation, research and results
determine that measuring data provides actionable insight into various functions of an
organisation as well as spanning across different industries. Such actionable insights
vary depending on the level of technology advancement. For instance, in B2B markets,
IT departments use AI and analytics for the purpose of measuring data and improving
operations based on the analyses derived from data. Using real-time data can generate
a predictive analysis on challenges that customers may face. These challenges that
companies faced are filtered through the customer archetypes who represent as B2B
customers (the target audience). Through deduction, the author recommends that to
improve the CX along the customer journey, the B2B vendors would benefit from pro-
ceeding to optimise on the relationship stages, combining the elements of utilising digi-
tally enabled services and engaging further in human interaction throughout the aware-
ness stage and consideration stage, (the top and middle of the funnel) to educate and
nurture those leads. In doing so, this qualifies them further along the customer journey
and strengthens the bottom of the funnel (BOFU). Further customisation of these trial
demonstrations for the qualified leads would strengthen the marketing impact and pos-
sibly shorten the response time between stages of the funnel, bringing leads closer to-
ward purchase. Along with measuring ROMI as part of a SaaS, planning the pricing

45
strategy to be subscription-based would not only bring recurring revenue, but entice a
certain self-image for the B2B vendor to continually optimise their product and as a re-
sult, increase retention.
However, for B2B companies to invest in this campaign and justify CX optimisation, a
growth mindset toward being more data-driven needs to be established. A data-driven
growth mindset values transparency as all available data is not only collected and
stored, but also analysed and used for the benefit of an objective analysis.
Indicated in Figure 9, the 'after purchase' stage in BOFU shows a level of loyalty as the
product is delivered. As decision-models for brand-building vary, it can be assumed
that with B2B companies selling SaaS there are higher risks of investment manage-
ment due to company-wide integration and so adhering to the (assumed) subscription-
based model of SaaS, provides a relative brand loyalty. Incremental increases in
brand-building further provide an analysis of after purchase retention and continued
loyalty by advancements in this technological field.

46
7 References
Albee, A., 2015. Digital Relevance: Developing Marketing Content and Strategies that Drive Results, New Hampshire: Macmillan Publishers Ltd. 109-112. AMA., 2020. American Marketing Association. [Online] Available at: <https://www.ama.org/> [Accessed 15 March 2020]. Amadeo, K., 2018. What Is Competitive Advantage? Three Strategies That Work. [Online] Available at: <https://www.thebalance.com/what-is-competitive-advantage-3-strategies-that-work-3305828> [Accessed 8 October 2019]. Ballantyne, D., Frow, P., Varey, R., and Payne, A., 2011. Industrial Marketing Manage-ment. [Online] Available at: <https://www.researchgate.net/publica-tion/223409896_Value_propositions_as_communication_practice_Tak-ing_a_wider_view> [Accessed 25 April 2020]. 40 (1) 202-210. Barnett, J., 2018. The Future of Feedback: How AI Fosters A Human Connection at Work [Online] Available at: <https://www.forbes.com/sites/jimbarnett/2018/08/07/the-future-of-feedback-how-ai-fosters-a-human-connection-at-work/#36a0b5873f65> [Ac-cessed 16 September 2019]. Barta, T. 2019. To fix marketing’s perception problem, we must overcome three issues. [Online] Available at: <https://www.marketingweek.com/thomas-barta-marketing-per-ception-problem/> [Accessed 16 September 2019]. Baumann, P. and Riedel, M. 2018. Research Data Alliance: Data for Development IG: Big Data: Big Data – Definition, Importance, Examples & Tools. [Online] Available at: < https://www.rd-alliance.org/group/big-data-ig-data-development-ig/wiki/big-data-defini-tion-importance-examples-tools> [Accessed 25 March 2020]. BCG, 2019. Big Data & Advanced Analytics [Online] Available at: <https://www.bcg.com/capabilities/big-data-advanced-analytics/default.aspx> [Ac-cessed 20 September 2019]. Bichler, M. Heinzl, A., and Aalst, W., 2016. Business Analytics and Data Science: Once Again? [Article] Available at: < https://link.springer.com/article/10.1007/s12599-016-0461-1> Bus Inf Syst Eng 59(2). 77–79. [Accessed 24 March 2020]. BlackwoodSeven, 2019. [Online] Available at: <https://blackwoodseven.com/platform/> [Accessed 11 October 2019]. Bloching, B., Luck, L., and Ramge, T., 2012. In Data We Trust: How Customer Data Is Revolutionizing Our Economy. United Kingdom: Bloomsbury Publishing Plc. Braverman, S., 2015. Journal of Direct, Data and Digital Marketing Practice. Business Intelligence: Global Review of Data-Driven Marketing and Advertising. [Article] Macmil-lan Publishers Ltd. 1746-0166. Vol. 16 No. 3. 181–183. Camarda, A., Salvia, É., Vidal, J., Weil, B., Poirel, N., Houde, O., Borst, G., and Cas-sotti, M., 2018. Neuropsychologia, Neural basis of functional fixedness during creative idea generation: An EEG study, [Article]

47
Available at: <http://doi.org/10.1016/j.neuropsychologia.2018.03.009> [Accessed 24 April 2020]. 118 (A) 4-12. Carrico, S., 2019. To Make or Buy AI: Two Often Overlooked Factors [Online] Available at: <https://www.forbes.com/sites/forbestechcouncil/2019/01/30/to-make-or-buy-ai-two-often-overlooked-factors/#2c1a9c006cae> [Accessed 16 September 2019]. Chen, J., 2020. Investopedia.com. Corporate Finance & Accounting: Financial Ratios: Return on Investment (ROI). [Online] Available at: <https://www.in-vestopedia.com/terms/r/returnoninvestment.asp> [Accessed 30 April 2020]. Clark, D., 2012. Forbes. The End of the Expert: Why No One in Marketing Knows What They're Doing [Online] Available at: < https://www.forbes.com/sites/do-rieclark/2012/11/11/the-end-of-the-expert-why-no-one-in-marketing-knows-what-theyre-doing/#246a37e029f1> Accessed 10 April 2020]. Company X1. 2019. Chief Commercial Officer. Company X, Espoo. Interview on How to perceive data and ROMI modelling _ by Hurstinen, J. 20 September 2019. Company X2. 2019. Chief Science Officer. Company X, Espoo. Interview on ROMI An-alytics by Hurstinen, J. 23 September 2019. Company X3. 2019. Senior Data Scientist. Company X, Espoo. Interview on ROMI An-alytics by Hurstinen, J. 23 September 2019.
Court, D., 2007. McKinsey Quarterly. The evolving role of the CMO [Online] Available at: <https://www.mckinsey.com/business-functions/marketing-and-sales/our-in-sights/the-evolving-role-of-the-cmo#> [Accessed 30 March 2020]. Cvitanovic, P., 2020. International Journal of Marketing Science. Digital Marketing Benchmarks Leveraged by Marketing Analytics Tools, 3(1), 82-97. Dartmouth, 2020. UMass Dartmouth Academics: First Year Course Modules: Decision making: Decision-making process [Online] Available at: <https://www.umassd.edu/fycm/decision-making/process/> [Accessed 18 April 2020]. Deloitte. 2016. The Deloitte Consumer Review. CX marks the spot: Rethinking the customer experience to win [Online] Available at: < https://www2.deloitte.com/con-tent/dam/Deloitte/uk/Documents/consumer-business/deloitte-uk-consumer-review-cus-tomer-experience.pdf> [Accessed 18 March 2020]. Dweck, C. 2006. Mindset, The New Psychology of Success. New York: Ballantine. EPM. 2019. Expert Program Management: Services Marketing Triangle [Online] Availa-ble at: < https://expertprogrammanagement.com/2018/03/services-marketing-triangle/> [Accessed 18 March 2020]. Farris, P., Hanssens, D., Lenskold, J., and Reibstein, D., 2015. Applied Marketing Ana-lytics, The Peer-Reviewed Journal: Marketing return on investment: Seeking clarity for concept and measurement, 1(3): 267-282. Fossacecco, D. 2015. Traditional marketing vs data marketing – getting the right share of voice. [Online] Available at: <https://transunion.co.uk/press-office/thought-leader-ship/2015/11/traditional-marketing-vs-data-marketing> [Accessed 13 October 2019].

48
Fung, T., 2008. Journal of Electronic Commerce Research. Banking with a personal-ized touch: Examining the impact of website customization on commitment. 9 (4) 296-309. Greenberg, O., 2019. Kurve. Marketing Funnel vs. Customer Journey. [Online] Availa-ble at: <https://kurve.co.uk/blog/marketing-funnel-vs-customer-journey/> [Accessed 25 April 2020]. Goldstein, B., 2020. Nutshell.com. CRM | Sell to win. Do you know the difference be-tween a sales pipeline and a sales funnel? [Online] Available at: < https://www.nut-shell.com/blog/sales-pipeline-vs-funnel/> [Accessed 25 April 2020]. Gordon, J. and Perrey, J., 2015. McKinsey Quarterly: The dawn of marketing’s new golden age. [Online] Available at: < https://www.mckinsey.com/business-functions/mar-keting-and-sales/our-insights/the-dawn-of-marketings-new-golden-age> [Accessed 30 March 2020]. Grant, M., 2020. Investopedia.com. Business Essentials, Software-as-a-Service (SaaS). [Online] Available at: <https://www.investopedia.com/terms/s/software-as-a-service-saas.asp> [Accessed April 26 April]. Grossberg, K. 2016. Strategy & Leadership. Emerald Group Publishing Limited Vol. 44 No.3, 20-26. Grove, A. 1983. High Output Management. New York: Random House. Havenga, J. Hobbs, I, 2004. A Practical Guide to Strategy: Making strategic thinking, development, and implementation accessible. Stellenbosch: Sun Press. 99-107, 139-142. Iafrate, F. 2018. Artificial Intelligence and Big Data: The Birth of a New Intelligence. London: ISTE Ltd. 21- 24. Idrysheva, Z., Tovma, N., Abisheva K., Murzagulova, M., and Mergenbay, N., 2019. Marketing communications in the digital age, [Online] Available at: < https://www.re-searchgate.net/publication/337737760_Marketing_communications_in_the_digi-tal_age> [Accessed 18 April 2020]. Kanagal, N., 2018. International Journal of Marketing Studies. Building Competitive Edge, 10 (3) 91-100. India: Canadian Center of Science and Education. Kotler, P., 1970. Harvard Business Review. Corporate Models: Better marketing plans, 48 (4) 135-149. Kotler, P. and Armstrong, G., 2012. Principles of Marketing, USA: Pearson Prentice Hall. Lotame, 2019. Why is Data Quality Important? [Online] Available at: <https://www.lo-tame.com/why-is-data-quality-important/> [Accessed 30 March 2020]. Louth, J., 1966. McKinsey Quarterly: The changing face of marketing. [Online] Availa-ble at: < https://www.mckinsey.com/business-functions/marketing-and-sales/our-in-sights/the-changing-face-of-marketing#> [Accessed 19 April 2020].

49
Maechler, N., Poenaru, A., Collenberg, T., and Schulze, P., 2017. McKinsey & Com-pany. Marketing & Sales: Finding the right digital balance in B2B customer experience [Online] Available at: https://www.mckinsey.com/business-functions/marketing-and-sales/our-insights/finding-the-right-digital-balance-in-b2b-customer-experience> [Ac-cessed 21 April 2020]. Marketing-schools, 2012. Marketing-schools.org, Educational options in the creative field of marketing. Traditional marketing: Explore the strategy of traditional marketing. [Online] Available at: <https://www.marketing-schools.org/types-of-marketing/tradi-tional-marketing.html> [ Accessed 24 April 2020]. Mittal, V., 2018. AMA. Forget Delight, Customers Just Want Their Expectations Met. [Online] Available at: <https://www.ama.org/marketing-news/forget-delight-customers-just-want-their-expectations-met/> [Accessed 25 April 2020]. Moorman, C. 2019. The CMO Survey: Highlights & Insights Report. Technical Report February, World Market Watch LLC, Durham, North Carolina. Available at: <https://cmosurvey.org/results/february-2019/> [Accessed 12 October 2019]. Nayyar, A., Jain, R., Goel, S., Bachlety, S., Singh, S., Tanwar, S., and Tyagi, S. 2019. Handbook of Cloud Computing. India: BPB Publication. Oflazoglu, S., eds. 2017. IntechOpen. Qualitative vs. Quantitative Research. Croatia. National and University Library in Zagreb. Patrizi, S., 2012. Steve Patrizi: My thoughts on marketing, positioning, social media, SaaS, leadership, and related topics. The New Marketing & Sales Funnel. [Online] Avail-able at: https://stevepatrizi.com/2012/10/23/the-new-marketing-sales-funnel/#more-4> [Accessed 25 April 2020]. Powell, G., 2003. Return on Marketing Investment: Demand More from your Marketing and Sales Investments. USA: RPI Press. Rethink Robotics, 2014. Artificial intelligence is a tool, not a threat [Online] Available at: <https://www.rethinkrobotics.com/blog/artificial-intelligence-tool-threat/> [Accessed 17 January 2019]. Rivard, J. 2019. Why your marketing needs to be data-driven [Online] Available at: <https://marketinginsidergroup.com/content-marketing/marketing-needs-data-driven/> [Accessed 13 October 2019]. Rust., R., Ambler, T., Carpenter, G., Kumar, V., and Srivastava, R., 2004. Journal of Marketing. Measuring Marketing Productivity: Current Knowledge and Future Direc-tions, [Article] Available at: <https://www.researchgate.net/publica-tion/228800307_Measuring_Marketing_Productivity_Current_Knowledge_and_Fu-ture_Directions> [Accessed 25 April 2020]. 68 (4): 76-89. Schembri, J., 2012. Sixsigmadaily.com. Input Output Model [Online] Available at: <https://www.sixsigmadaily.com/input-output-model/> [Accessed 18 April 2020]. Sciforce, 2019. Medium.com. Data Cleaning and Preprocessing for Beginners. [Online] Available at: <https://medium.com/sciforce/data-cleaning-and-preprocessing-for-begin-ners-25748ee00743> [Accessed 30 May 2020].

50
Shah, D., Rust, R., Parasuraman, A., Staelin, R., and Day, G., Journal of Service Re-search. The Path to Customer Centricity, Maryland: Sage. 9 (2) 113-124. Shapiro, B. 2002. Harvard Business School. Working Knowledge: Business Research for Business Leaders. Want a Happy Customer? Coordinate Sales and Marketing. [Online] Available at: <https://hbswk.hbs.edu/item/want-a-happy-customer-coordinate-sales-and-marketing> [Accessed 24 April 2020]. SingeGrain, 2019. Single Grain: Case Studies: About Twenty20 [Online] Available at: <https://www.singlegrain.com/about-us/case-studies/> [Accessed 7 October 2019]. Stemler, S., 2019. Web Ascender, Marketing. 37 ToFu, MoFu, and BoFu Content Types for Your Sales Funnel Stages. [Online] Available at: < https://www.webas-cender.com/blog/27-tofu-mofu-and-bofu-content-types-for-your-sales-funnel-stages/> [Accessed 25 April 2020]. Sreejesh, S., Mohapatra, S. and Anusree, M. R. (2014) Business Research Methods - An Applied Orientation. New York: Springer. Titus, P., 2007. Journal of Marketing Education, Applied Creativity: The Creative Mar-keting Breakthrough Model, Pennsylvania: Sage. [Online] Available at: <http://jmd.sagepub.com/cgi/content/abstract/29/3/262> [Accessed 24 April 2020]. 29 (3) 262-272 UCLA Anderson School of Management, 2019. Marketing: Faculty: Hanssens [Online] Available at: < https://www.anderson.ucla.edu/faculty-and-research/marketing/fac-ulty/hanssens> [Accessed 20 September 2019]. Veronica, P. and Silvia, M., 2018. Traditional versus Online Marketing for B2B Organi-zations: Where the Line Blurs, [Article] Available at: <http://stec.univ-ovidius.ro/html/an-ale/RO/wp-content/uploads/2018/08/20-1.pdf> [Accessed 25 March 2020]. Weber, L., Feintzeig, R,. 2014. WallStreet Journal. Companies Say No to Having an HR Department: Employers Come Up with New Ways to Manage Hiring, Firing and Benefits [Online] Available at: <https://www.wsj.com/articles/companies-say-no-to-hav-ing-an-hr-department-1396994461> [Accessed 13 October 2019]. World Economic Forum, 2019. What is big data? [Online] Available at: <https://www.youtube.com/watch?v=eVSfJhssXUA> [Accessed 14 October 2019]. Young, J. 2020. Investopedia. Investing: Fundamental Analysis: Metrics [Online] Avail-able at: <https://www.investopedia.com/terms/m/metrics.asp> [Accessed 30 March 2020].

Appendix 1
1 (2)
Face-To-Face Interviews
Interviewer: Juha Hurstinen
I. Background information
1. What is your name, title, and role within the company you work for?
2. What day-to-day activities do you operate that are vital to the company’s busi-
ness goals?
3. What is your educational background and professional history that led to you
being an expert in your respected field?
II. How to perceive data and ROMI modelling
1. Can you shed some light on the average CMO’s mindset when it comes to:
a. communicating with other C-level executives?
b. battling the stereotype of marketers being lightweight businesspeople?
c. spending vs. investing or budgets vs. investments?
2. Can you briefly define return on marketing investment (ROMI) and describe
what ROMI modelling is?
3. What is the mindset or purpose behind measuring ROMI?
4. Does ROMI modelling allow a more holistic and granular view of the customer
journey? How so?
5. Can you demonstrate how ROMI modelling can help shift a CMO’s focus to re-
tention investment with an example or two?
6. Can you provide some consumer insights and the marketing point of view of uti-
lising ROMI modelling?

Appendix 1
2 (2)
7. What do you mean by marketing impact? What does that mean to marketing
executives?
8. How does using data analytics affect decision-making?
III. ROMI Analytics
1. Can you define return on marketing investment (ROMI) and how it can be
measured and optimised?
2. What is important in ROMI Modelling (that makes it so important in business)?
3. How is it possible to accurately measure huge amounts of data?
4. How can a start-up optimise on ROMI metrics as opposed to a large corpora-
tion using the same metrics?
5. How do these metrics optimise the customer journey?
6. How does ROMI provide reliable results?
7. What is the business impact when organisations adopt ROMI modelling?
Related Documents