DATA, DATA DATA, DATA EVERYWHERE EVERYWHERE BRINGING ALL THE DATA TOGETHER FOR CONTINUOUS SCHOOL IMPROVEMENT VICTORIA L. BERNHARDT Executive Director, Education for the Future [email protected] http://eff.csuchico.edu Teachers and administrators must believe that all children can learn. Schools must honestly review their data. There must be one vision. There needs to be one plan to implement the vision. Staff need to collaborate and use student, classroom, and school level data. Staff need professional development to work differently. Schools need to rethink their current structures, and avoid add-ons. THINGS THAT NEED TO HAPPEN THINGS THAT NEED TO HAPPEN OUTCOMES OUTCOMES What data are important for continuous school improvement. How to analyze all types of data for continuous school improvement. How to measure school processes. How to know if efforts are resulting in the changes you need and want. Everyone understands— NESA Fall Leadership Conference, "Data, Data Everywhere," Victoria L. Bernhardt, Education for the Future (http://eff.csuchico.edu) Page 1 of 39

Welcome message from author
This document is posted to help you gain knowledge. Please leave a comment to let me know what you think about it! Share it to your friends and learn new things together.
Transcript
DATA, DATADATA, DATAEVERYWHEREEVERYWHERE
BRINGING ALL THE DATATOGETHER FOR CONTINUOUS
SCHOOL IMPROVEMENT
VICTORIA L. BERNHARDTExecutive Director, Education for the [email protected]://eff.csuchico.edu
Teachers and administrators must believe thatall children can learn.
Schools must honestly review their data. There must be one vision. There needs to be one plan to implement
the vision. Staff need to collaborate and use student,
classroom, and school level data. Staff need professional development to work
differently. Schools need to rethink their current structures,
and avoid add-ons.
THINGS THAT NEED TO HAPPENTHINGS THAT NEED TO HAPPEN
OUTCOMESOUTCOMES
What data are important for continuousschool improvement.
How to analyze all types of datafor continuous schoolimprovement.
How to measure school processes.
How to know if efforts are resulting in thechanges you need and want.
Everyone understands—
NESA Fall Leadership Conference, "Data, Data Everywhere," Victoria L. Bernhardt, Education for the Future (http://eff.csuchico.edu) Page 1 of 39
NESA Fall Leadership Conference, "Data, Data Everywhere," Victoria L. Bernhardt, Education for the Future (http://eff.csuchico.edu) Page 2 of 39
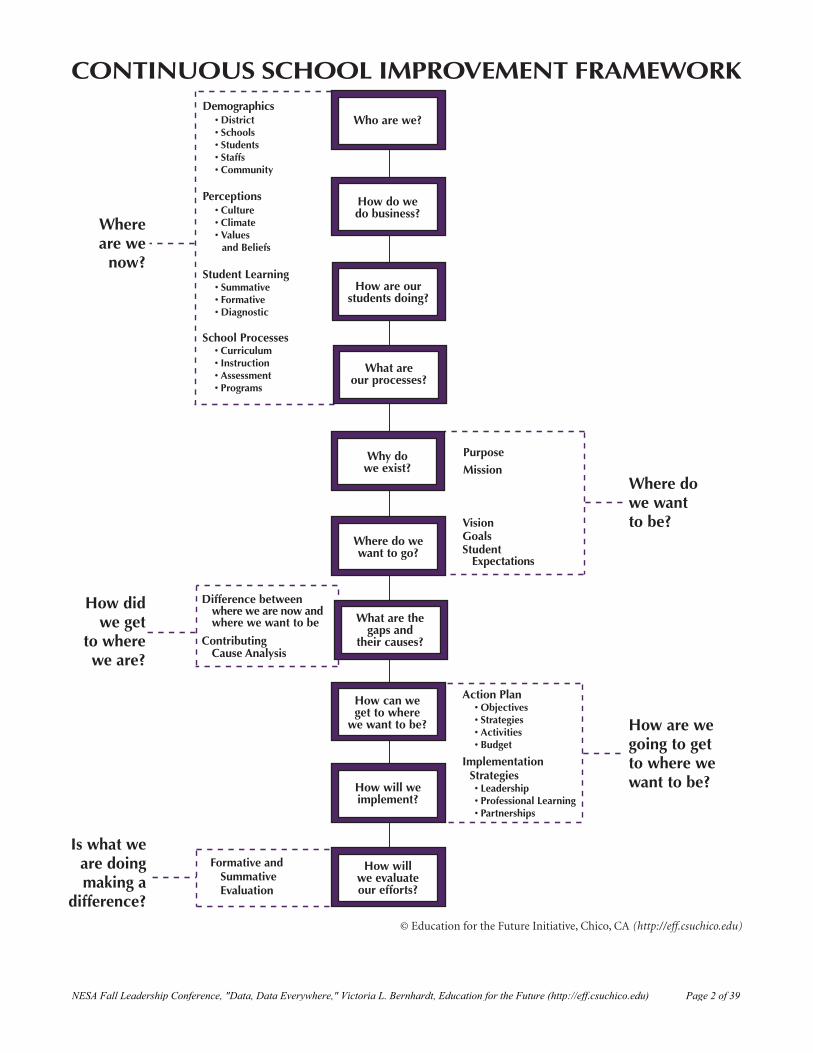
Multiple Measures of Data
© Education for the Future, Chico, CA (http://eff.csuchico.edu)
Over time,student learning datagive information aboutstudent performance ondifferent measures.
Tells us:The impact of the program onstudent learning based uponperceptions of the programand on the processes used.
Over time,perceptionscan tellus aboutenvironmentalimprovements.
Tells us:What processes/programs work bestfor different groupsof students with respectto student learning.
Tells us:If a program is makinga difference in studentlearning results.
Tells us:The impact ofstudent perceptionsof the learningenvironment onstudent learning.
Over time,school processesshow howclassroomschange.
Tells us:Student participationin different programs andprocesses.
Tells us:What processes/programsdifferent groups ofstudents like best.
Allows the prediction ofactions/processes/programsthat best meet the learningneeds of all students.
Over time,demographicdata indicatechanges in thecontext ofthe school.
Tells us:The impact ofdemographic factorsand attitudes about thelearning environmenton student learning.
Tells us:If groups of studentsare “experiencingschool” differently.
DEMOGRAPHICS
PER
CEP
TIO
NS
STUDENT LEARNING
SCH
OO
L P
RO
CES
SES
Enrollment, Attendance,Drop-Out Rate
Ethnicity, Gender,Grade Level
Des
crip
tion
ofSc
hool
Pro
gram
san
d Pr
oces
ses
Standardized TestsNorm/Criterion-Referenced TestsTeacher Observations of Abilities
Formative Assessments
Perceptions of Learning Environment
Values and B
eliefsA
ttitudesO
bservations
NESA Fall Leadership Conference, "Data, Data Everywhere," Victoria L. Bernhardt, Education for the Future (http://eff.csuchico.edu) Page 3 of 39
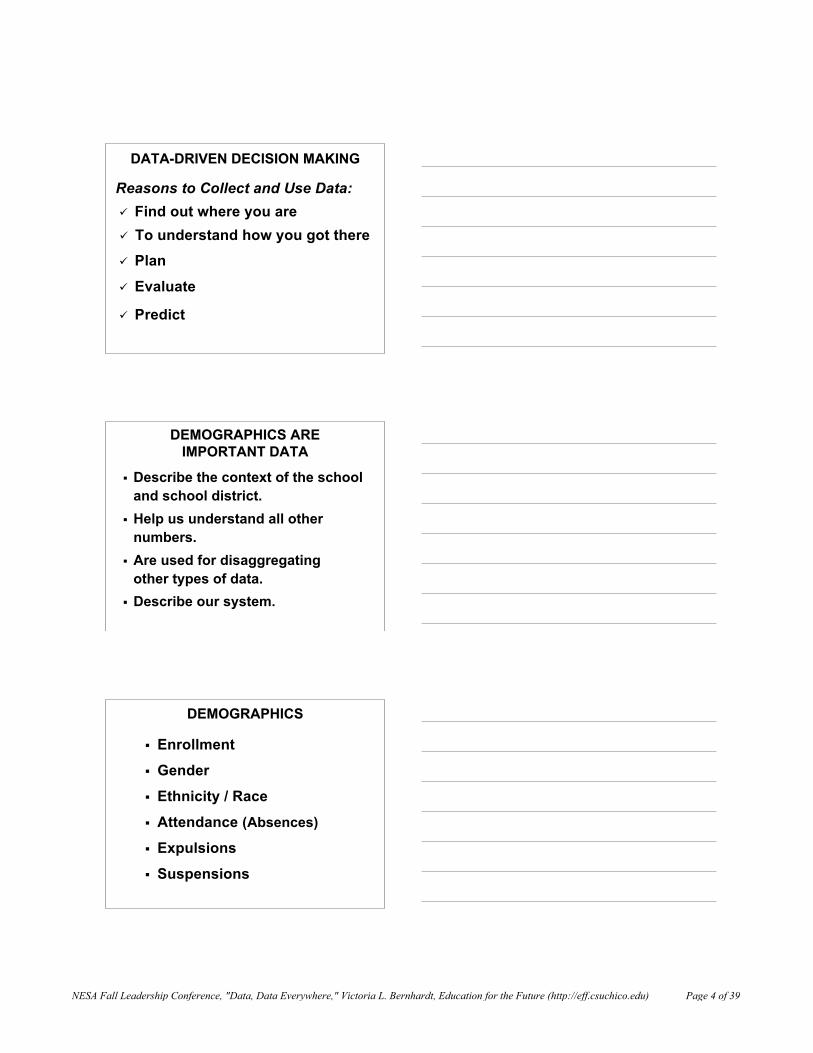
Reasons to Collect and Use Data: Find out where you are
Plan
Evaluate
To understand how you got there
Predict
DATA-DRIVEN DECISION MAKINGDATA-DRIVEN DECISION MAKING
Describe the context of the schooland school district.
Help us understand all othernumbers.
Are used for disaggregatingother types of data.
Describe our system.
DEMOGRAPHICS AREDEMOGRAPHICS AREIMPORTANT DATAIMPORTANT DATA
Enrollment
Gender
Ethnicity / Race
Attendance (Absences)
Expulsions
Suspensions
DEMOGRAPHICSDEMOGRAPHICS
NESA Fall Leadership Conference, "Data, Data Everywhere," Victoria L. Bernhardt, Education for the Future (http://eff.csuchico.edu) Page 4 of 39
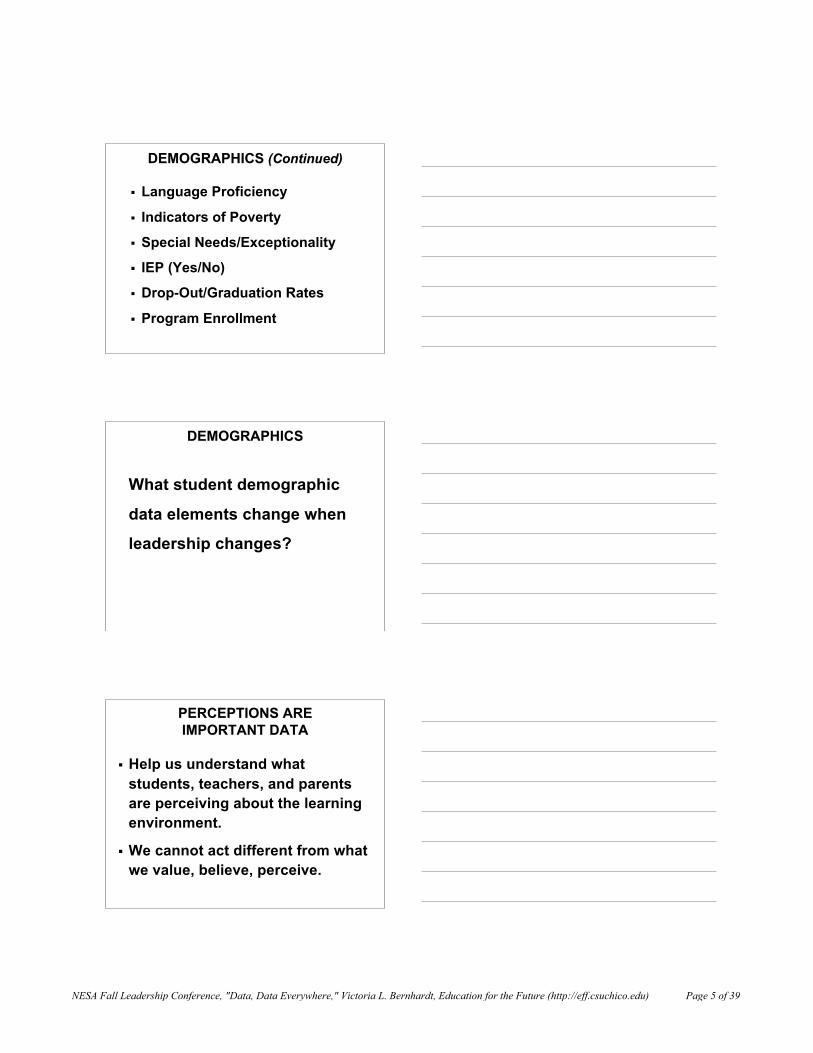
Language Proficiency
Indicators of Poverty
Special Needs/Exceptionality
IEP (Yes/No)
Drop-Out/Graduation Rates
Program Enrollment
DEMOGRAPHICS DEMOGRAPHICS (Continued)(Continued)
What student demographic
data elements change when
leadership changes?
DEMOGRAPHICSDEMOGRAPHICS
Help us understand whatstudents, teachers, and parentsare perceiving about the learningenvironment.
We cannot act different from whatwe value, believe, perceive.
PERCEPTIONS AREPERCEPTIONS AREIMPORTANT DATAIMPORTANT DATA
NESA Fall Leadership Conference, "Data, Data Everywhere," Victoria L. Bernhardt, Education for the Future (http://eff.csuchico.edu) Page 5 of 39
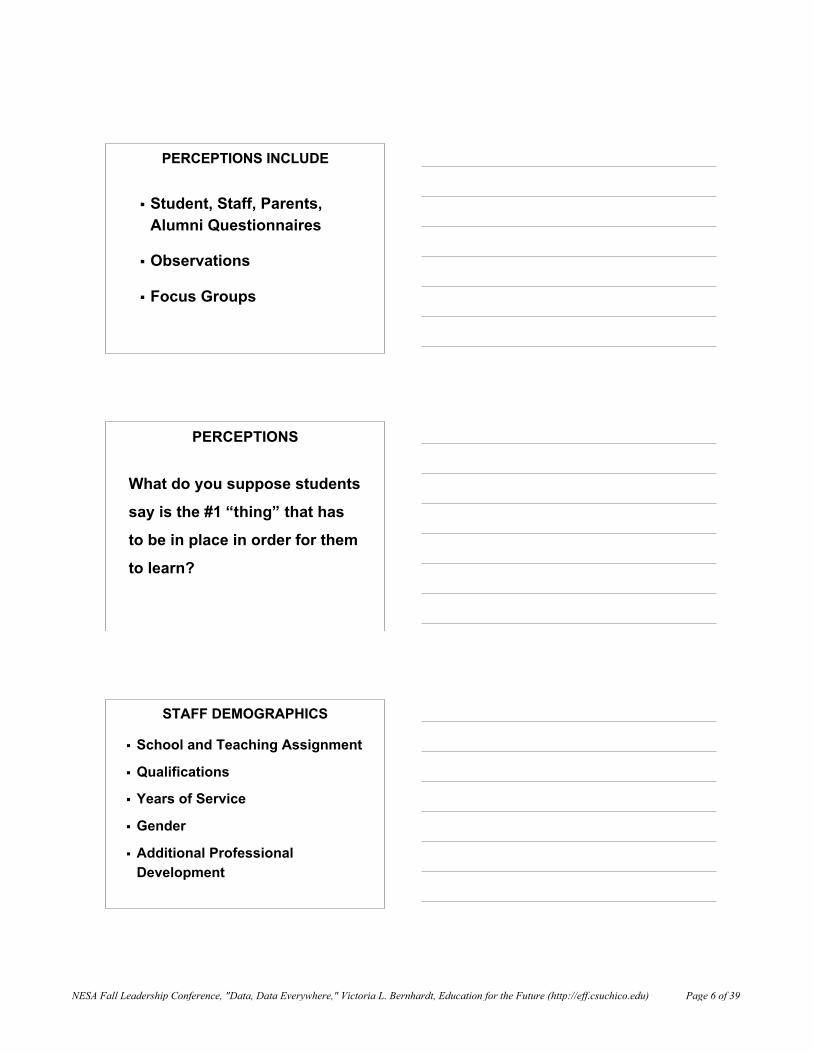
Student, Staff, Parents,Alumni Questionnaires
Observations
Focus Groups
PERCEPTIONS INCLUDEPERCEPTIONS INCLUDE
PERCEPTIONSPERCEPTIONS
What do you suppose students
say is the #1 “thing” that has
to be in place in order for them
to learn?
School and Teaching Assignment
Qualifications
Years of Service
Gender
Additional ProfessionalDevelopment
STAFF DEMOGRAPHICSSTAFF DEMOGRAPHICS
NESA Fall Leadership Conference, "Data, Data Everywhere," Victoria L. Bernhardt, Education for the Future (http://eff.csuchico.edu) Page 6 of 39
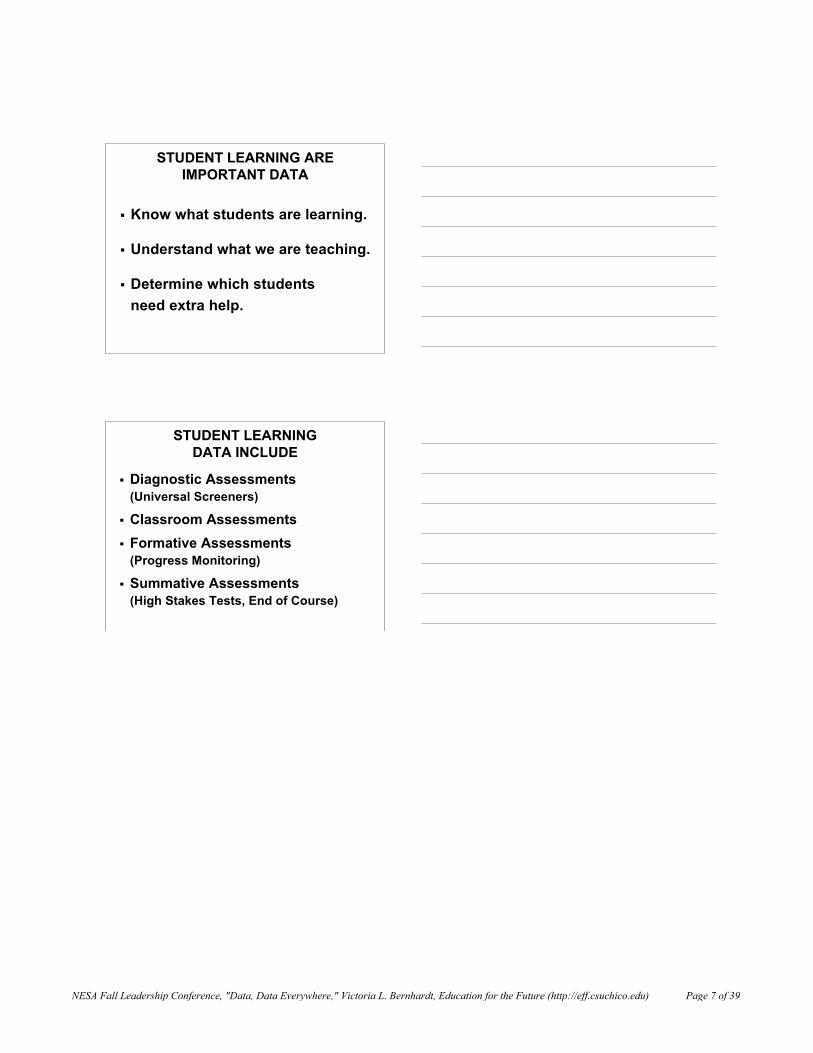
Know what students are learning.
Understand what we are teaching.
Determine which studentsneed extra help.
STUDENT LEARNING ARESTUDENT LEARNING AREIMPORTANT DATAIMPORTANT DATA
STUDENT LEARNINGSTUDENT LEARNINGDATA INCLUDEDATA INCLUDE
Diagnostic Assessments(Universal Screeners)
Classroom Assessments Formative Assessments
(Progress Monitoring)
Summative Assessments(High Stakes Tests, End of Course)
NESA Fall Leadership Conference, "Data, Data Everywhere," Victoria L. Bernhardt, Education for the Future (http://eff.csuchico.edu) Page 7 of 39
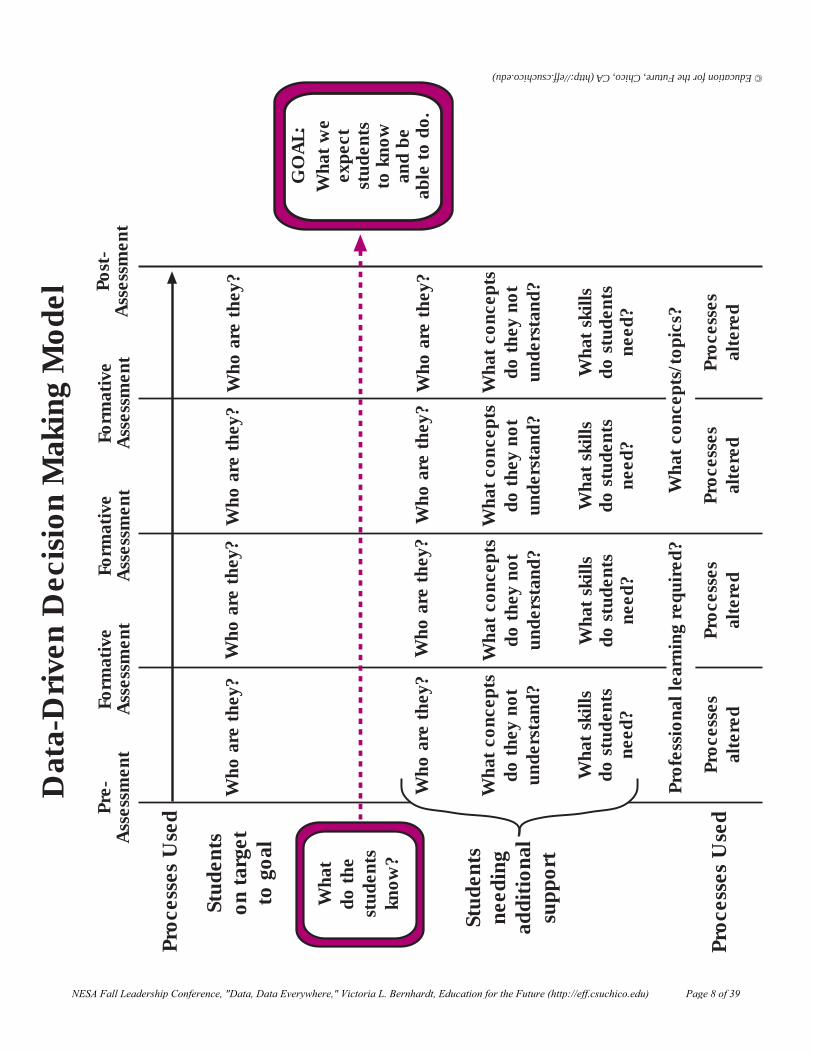
Dat
a-D
rive
n D
ecis
ion
Mak
ing
Mod
elPr
e-A
sses
smen
tFo
rmat
ive
Ass
essm
ent
Form
ativ
eA
sses
smen
tFo
rmat
ive
Ass
essm
ent
Post
-A
sses
smen
t
Proc
esse
s U
sed
Stud
ents
on t
arge
tto
goa
l
Who
are
the
y?W
ho a
re t
hey?
Who
are
the
y?W
ho a
re t
hey?
Wha
tdo
the
stud
ents
kno w
?
Stud
ents
need
ing
addi
tion
alsu
ppor
t
Proc
esse
s U
sed
Who
are
the
y?W
ho a
re t
hey?
Who
are
the
y?W
ho a
re t
hey?
Wha
t co
ncep
tsdo
the
y no
tun
ders
tand
?
Wha
t co
ncep
tsdo
the
y no
tun
ders
tand
?
Wha
t co
ncep
tsdo
the
y no
tun
ders
tand
?
Wha
t co
ncep
tsdo
the
y no
tun
ders
tand
?
Wha
t sk
ills
do s
tude
nts
need
?
Wha
t sk
ills
do s
tude
nts
need
?
Wha
t sk
ills
do s
tude
nts
need
?
Wha
t sk
ills
do s
tude
nts
need
?
Proc
esse
sal
tere
dPr
oces
ses
alte
red
Proc
esse
sal
tere
dPr
oces
ses
alte
red
GO
AL:
Wha
t w
eex
pect
stud
ents
to k
now
and
beab
le t
o do
.
Prof
essi
onal
lear
ning
req
uire
d?W
hat
conc
epts
/top
ics?
© Education for the Future, Chico, CA (http://eff.csuchico.edu)
NESA Fall Leadership Conference, "Data, Data Everywhere," Victoria L. Bernhardt, Education for the Future (http://eff.csuchico.edu) Page 8 of 39
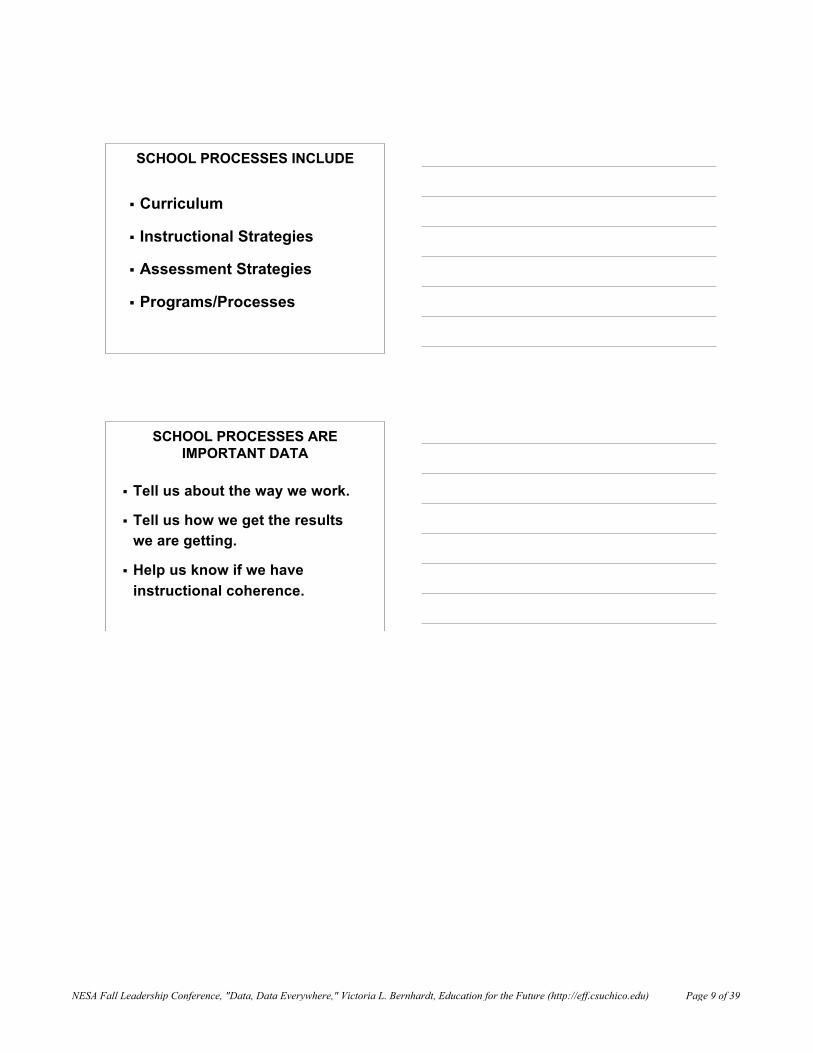
Curriculum
Instructional Strategies
Assessment Strategies
Programs/Processes
SCHOOL PROCESSES INCLUDESCHOOL PROCESSES INCLUDE
Tell us about the way we work.
Tell us how we get the resultswe are getting.
Help us know if we haveinstructional coherence.
SCHOOL PROCESSES ARESCHOOL PROCESSES AREIMPORTANT DATAIMPORTANT DATA
NESA Fall Leadership Conference, "Data, Data Everywhere," Victoria L. Bernhardt, Education for the Future (http://eff.csuchico.edu) Page 9 of 39
© E
duca
tion
for
the
Futu
re, C
hic
o, C
A (
http
://e
ff.c
such
ico.
edu)
MEA
SUR
ING
PR
OG
RA
MS
AN
D P
RO
CES
SES
TEM
PLA
TE
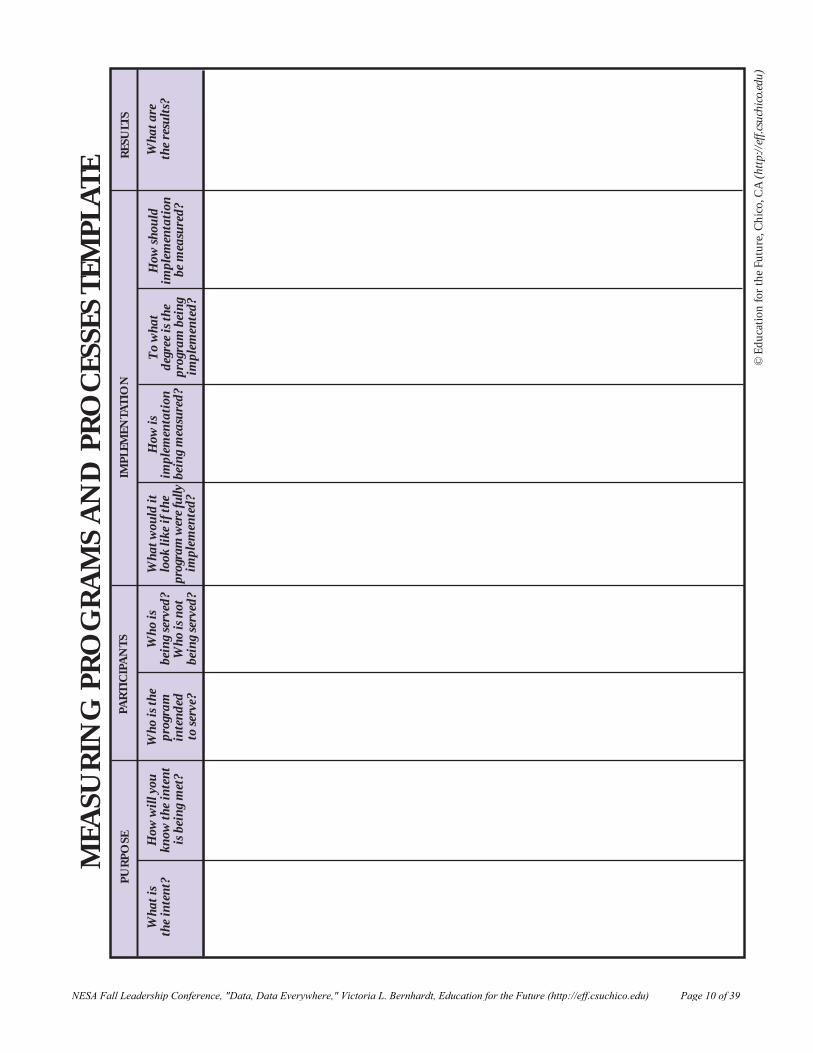
Wha
t w
ould
itlo
ok li
ke if
the
prog
ram
wer
e fu
llyim
plem
ente
d?
Who
is t
hepr
ogra
min
ten
ded
to s
erve
?
How
wil
l you
know
the
inte
nt
is b
ein
g m
et?
Wha
t is
the
inte
nt?
Who
isbe
ing
serv
ed?
Who
is n
otbe
ing
serv
ed?
How
isim
plem
enta
tion
bein
g m
easu
red?
PUR
POSE
IMPL
EMEN
TATI
ON
Wha
t ar
eth
e re
sult
s?T
o w
hat
degr
ee is
the
prog
ram
bei
ng
impl
emen
ted?
PART
ICIP
AN
TSR
ESU
LTS
How
sho
uld
impl
emen
tati
onbe
mea
sure
d?
NESA Fall Leadership Conference, "Data, Data Everywhere," Victoria L. Bernhardt, Education for the Future (http://eff.csuchico.edu) Page 10 of 39
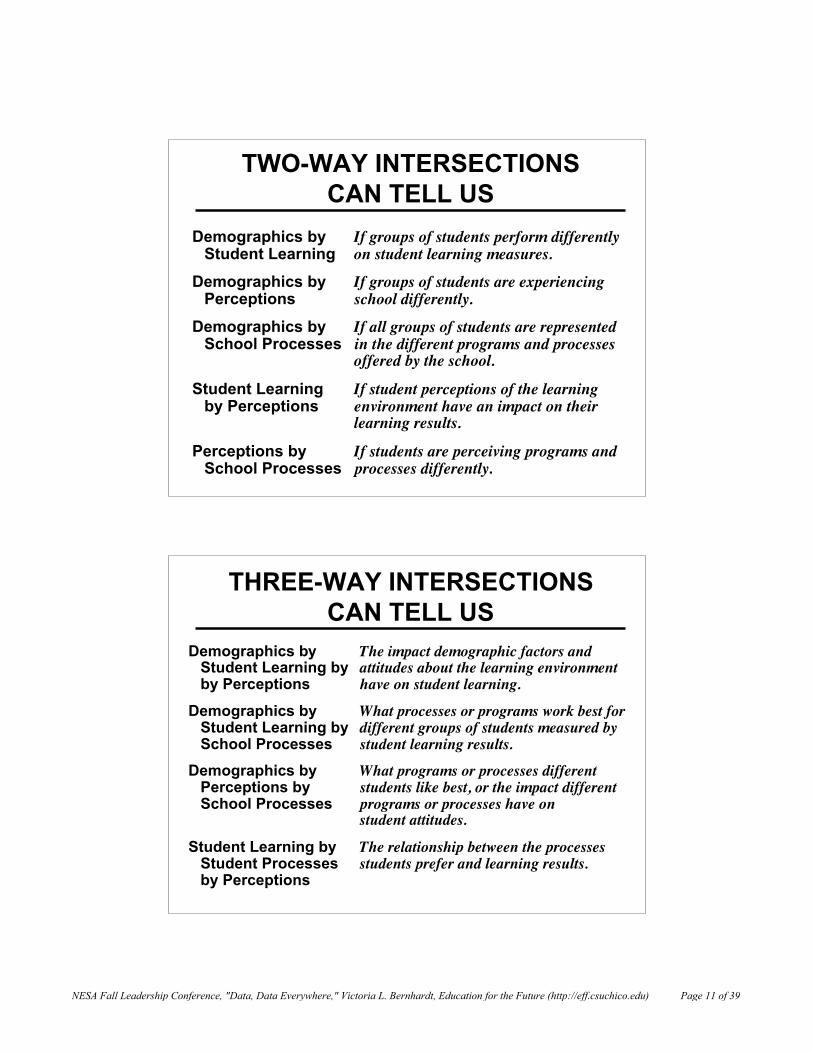
Demographics by If groups of students perform differentlyStudent Learning on student learning measures.
Demographics by If groups of students are experiencingPerceptions school differently.
Demographics by If all groups of students are representedSchool Processes in the different programs and processes
offered by the school.
Student Learning If student perceptions of the learningby Perceptions environment have an impact on their
learning results.
Perceptions by If students are perceiving programs andSchool Processes processes differently.
TWO-WAY INTERSECTIONSCAN TELL US
Demographics by The impact demographic factors andStudent Learning by attitudes about the learning environmentby Perceptions have on student learning.
Demographics by What processes or programs work best forStudent Learning by different groups of students measured bySchool Processes student learning results.
Demographics by What programs or processes differentPerceptions by students like best, or the impact differentSchool Processes programs or processes have on
student attitudes.
Student Learning by The relationship between the processesStudent Processes students prefer and learning results.by Perceptions
THREE-WAY INTERSECTIONSCAN TELL US
NESA Fall Leadership Conference, "Data, Data Everywhere," Victoria L. Bernhardt, Education for the Future (http://eff.csuchico.edu) Page 11 of 39
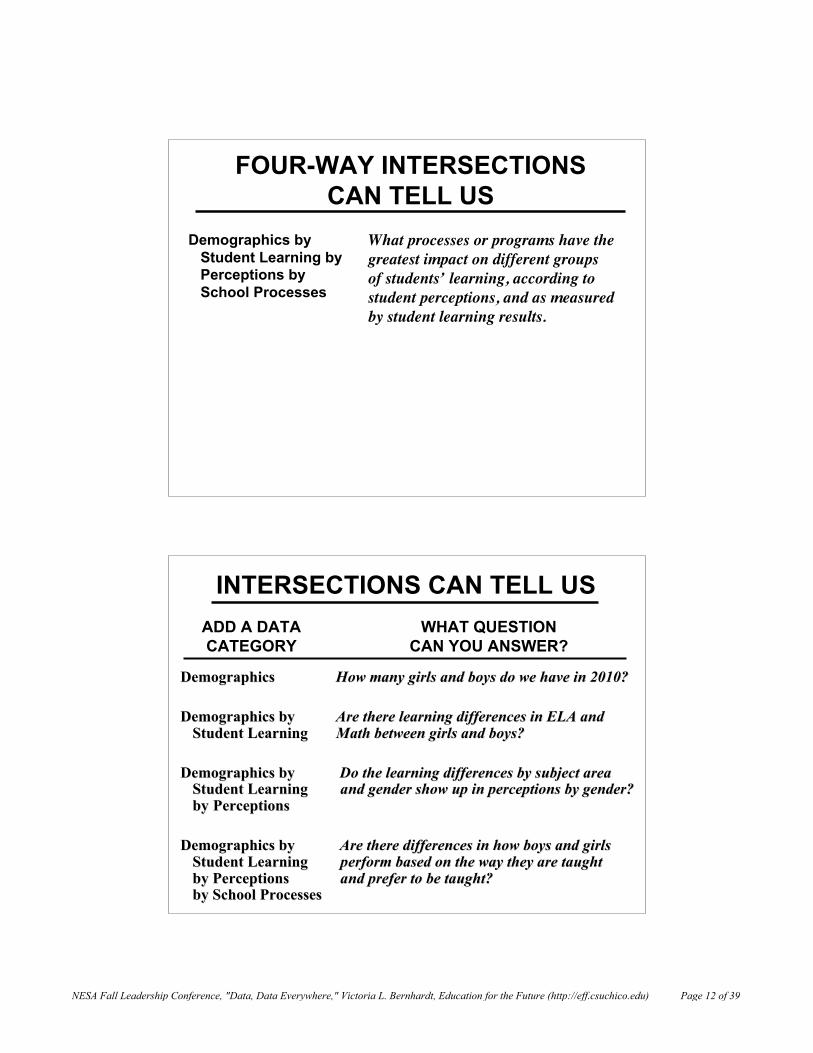
FOUR-WAY INTERSECTIONSCAN TELL US
What processes or programs have thegreatest impact on different groupsof students’ learning, according tostudent perceptions, and as measuredby student learning results.
Demographics byStudent Learning byPerceptions bySchool Processes
DemographicsDemographics How many girls and boys do we have in 2010?How many girls and boys do we have in 2010?
Demographics byDemographics by Are there learning differences in ELA andAre there learning differences in ELA andStudent LearningStudent Learning MathMath between girls and boys?between girls and boys?
Demographics byDemographics by Do the learning differences by subject areaDo the learning differences by subject areaStudent LearningStudent Learning and gender show up in perceptions by gender?and gender show up in perceptions by gender?byby PerceptionsPerceptions
Demographics byDemographics by Are there differences in how boys and girlsAre there differences in how boys and girlsStudent LearningStudent Learning perform based on the way they are taughtperform based on the way they are taughtby Perceptionsby Perceptions and prefer to be taught?and prefer to be taught?by School Processesby School Processes
INTERSECTIONS CAN TELL USADD A DATACATEGORY
WHAT QUESTIONCAN YOU ANSWER?
NESA Fall Leadership Conference, "Data, Data Everywhere," Victoria L. Bernhardt, Education for the Future (http://eff.csuchico.edu) Page 12 of 39
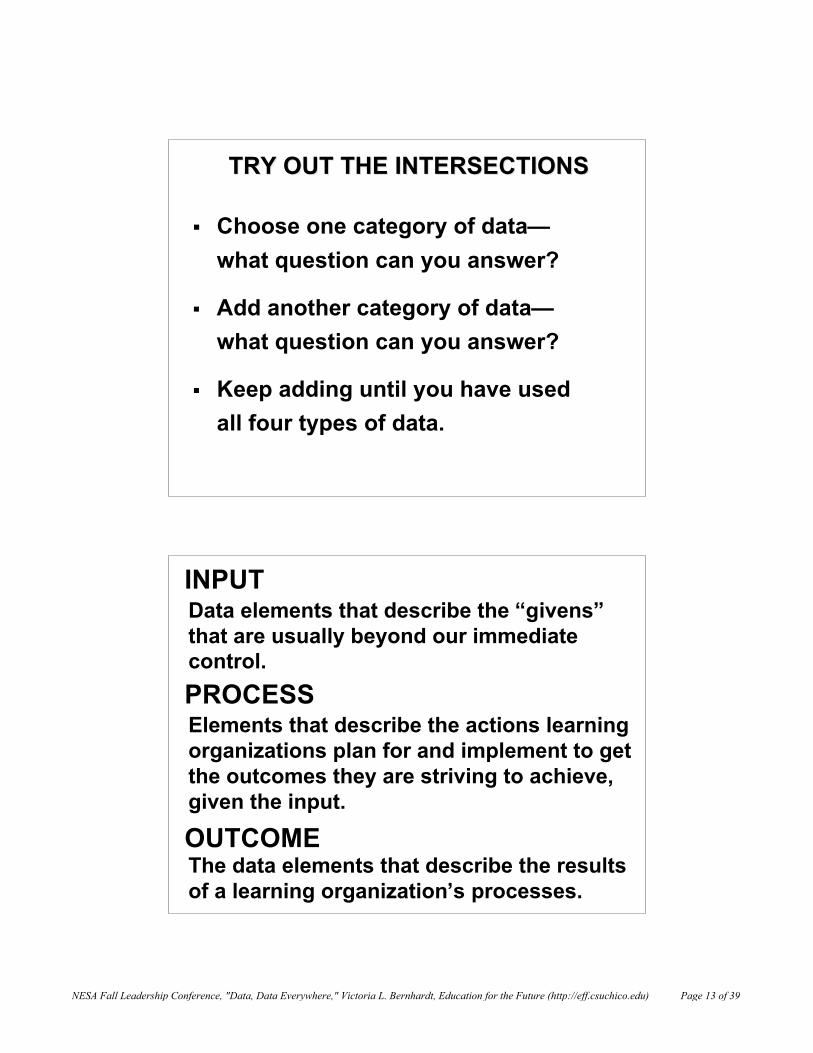
TRY OUT THE INTERSECTIONSTRY OUT THE INTERSECTIONS
Choose one category of data—what question can you answer?
Add another category of data—what question can you answer?
Keep adding until you have usedall four types of data.
INPUTData elements that describe the “givens”that are usually beyond our immediatecontrol.
Elements that describe the actions learningorganizations plan for and implement to getthe outcomes they are striving to achieve,given the input.
The data elements that describe the resultsof a learning organization’s processes.
PROCESS
OUTCOME
NESA Fall Leadership Conference, "Data, Data Everywhere," Victoria L. Bernhardt, Education for the Future (http://eff.csuchico.edu) Page 13 of 39
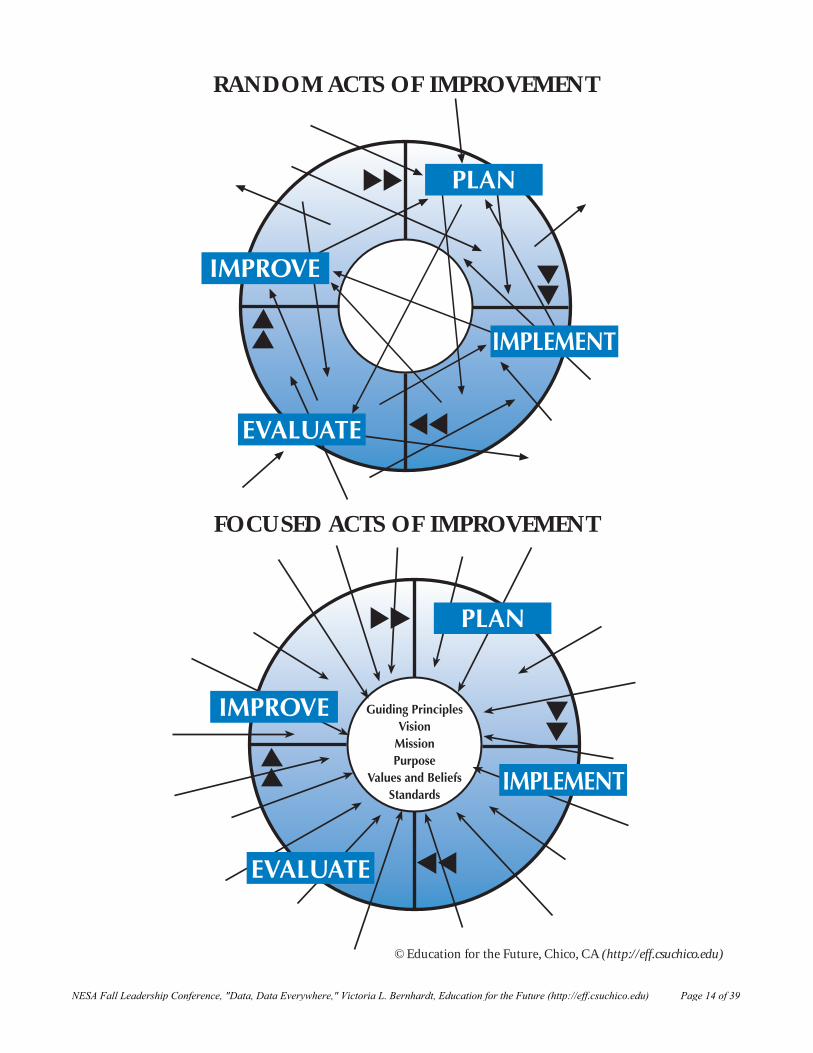
RANDOM ACTS OF IMPROVEMENT
FOCUSED ACTS OF IMPROVEMENT
© Education for the Future, Chico, CA (http://eff.csuchico.edu)
NESA Fall Leadership Conference, "Data, Data Everywhere," Victoria L. Bernhardt, Education for the Future (http://eff.csuchico.edu) Page 14 of 39
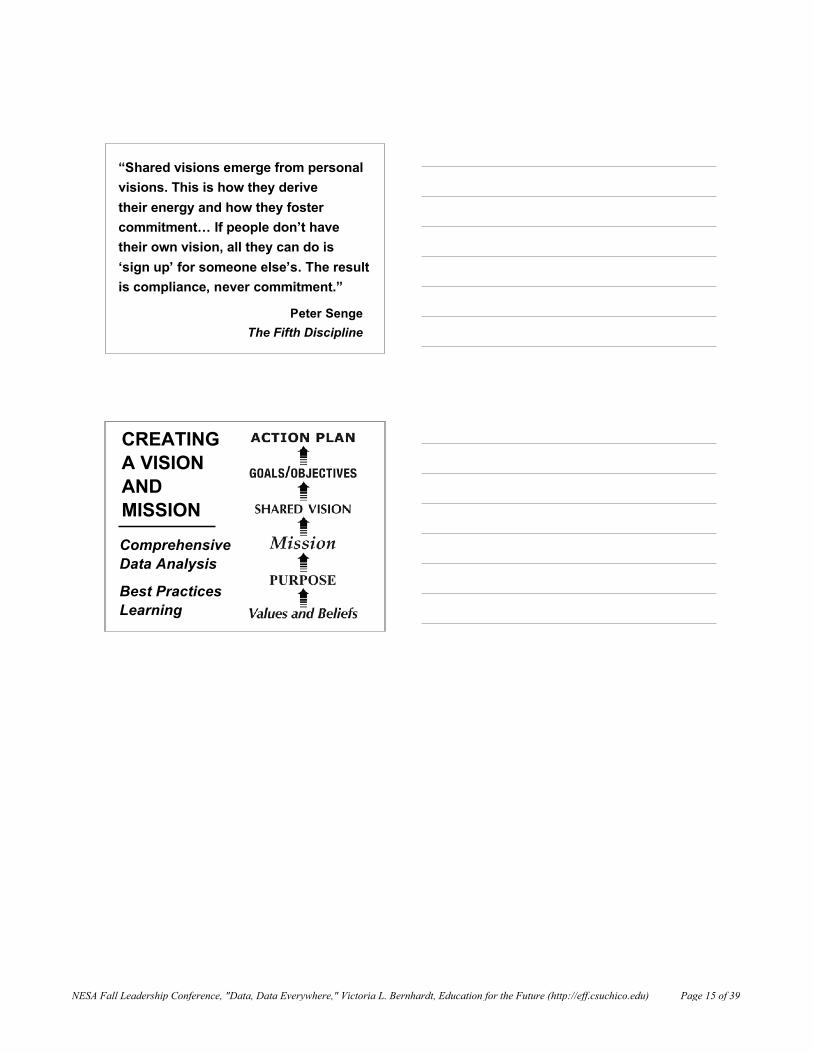
“Shared visions emerge from personalvisions. This is how they derivetheir energy and how they fostercommitment… If people don’t havetheir own vision, all they can do is‘sign up’ for someone else’s. The resultis compliance, never commitment.”
Peter SengeThe Fifth Discipline
CREATINGA VISIONANDMISSION
ComprehensiveData Analysis
Best PracticesLearning
NESA Fall Leadership Conference, "Data, Data Everywhere," Victoria L. Bernhardt, Education for the Future (http://eff.csuchico.edu) Page 15 of 39
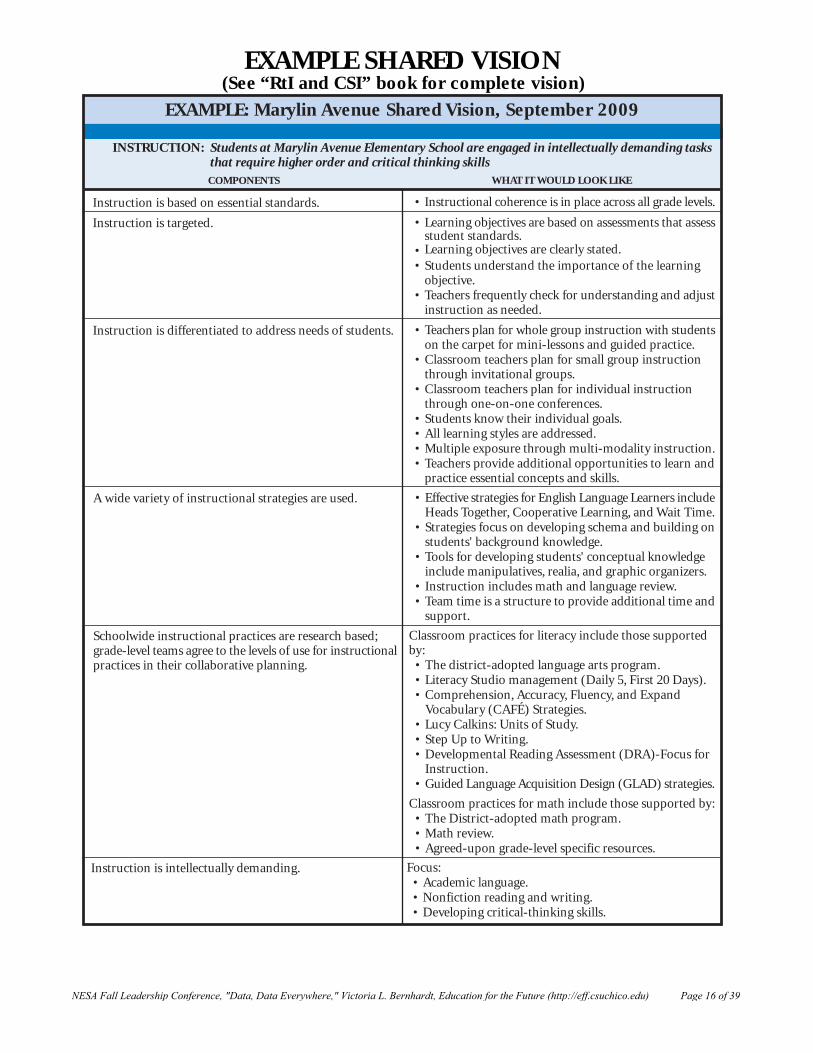
• Instructional coherence is in place across all grade levels.
EXAMPLE: Marylin Avenue Shared Vision, September 2009
Instruction is based on essential standards.
COMPONENTS WHAT IT WOULD LOOK LIKE
INSTRUCTION: Students at Marylin Avenue Elementary School are engaged in intellectually demanding tasksthat require higher order and critical thinking skills
• Learning objectives are based on assessments that assessstudent standards.
• Learning objectives are clearly stated.• Students understand the importance of the learning
objective.• Teachers frequently check for understanding and adjust
instruction as needed.
Instruction is targeted.
• Teachers plan for whole group instruction with studentson the carpet for mini-lessons and guided practice.
• Classroom teachers plan for small group instructionthrough invitational groups.
• Classroom teachers plan for individual instructionthrough one-on-one conferences.
• Students know their individual goals.• All learning styles are addressed.• Multiple exposure through multi-modality instruction.• Teachers provide additional opportunities to learn and
practice essential concepts and skills.
Instruction is differentiated to address needs of students.
• Effective strategies for English Language Learners includeHeads Together, Cooperative Learning, and Wait Time.
• Strategies focus on developing schema and building onstudents' background knowledge.
• Tools for developing students' conceptual knowledgeinclude manipulatives, realia, and graphic organizers.
• Instruction includes math and language review.• Team time is a structure to provide additional time and
support.
A wide variety of instructional strategies are used.
Classroom practices for literacy include those supportedby:
• The district-adopted language arts program.• Literacy Studio management (Daily 5, First 20 Days).• Comprehension, Accuracy, Fluency, and Expand
Vocabulary (CAFÉ) Strategies.• Lucy Calkins: Units of Study.• Step Up to Writing.• Developmental Reading Assessment (DRA)-Focus for
Instruction.• Guided Language Acquisition Design (GLAD) strategies.
Classroom practices for math include those supported by:• The District-adopted math program.• Math review.• Agreed-upon grade-level specific resources.
Schoolwide instructional practices are research based;grade-level teams agree to the levels of use for instructionalpractices in their collaborative planning.
Focus:• Academic language.• Nonfiction reading and writing.• Developing critical-thinking skills.
Instruction is intellectually demanding.
EXAMPLE SHARED VISION(See “RtI and CSI” book for complete vision)
NESA Fall Leadership Conference, "Data, Data Everywhere," Victoria L. Bernhardt, Education for the Future (http://eff.csuchico.edu) Page 16 of 39
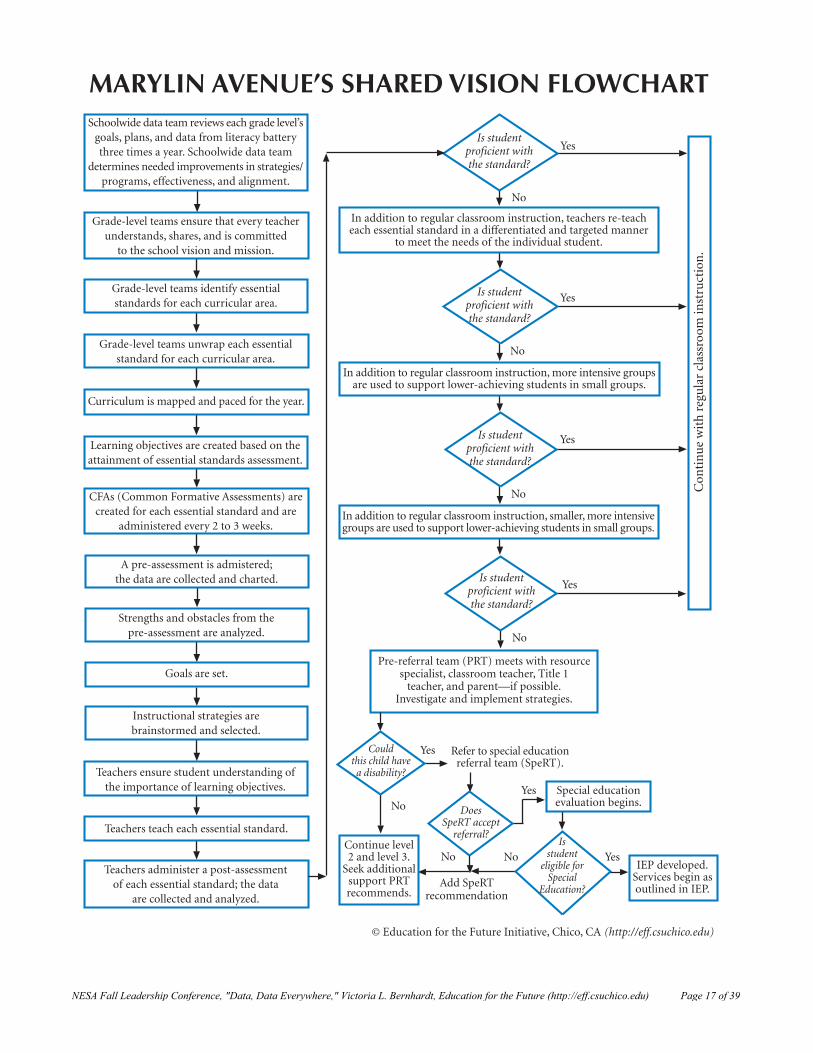
NESA Fall Leadership Conference, "Data, Data Everywhere," Victoria L. Bernhardt, Education for the Future (http://eff.csuchico.edu) Page 17 of 39
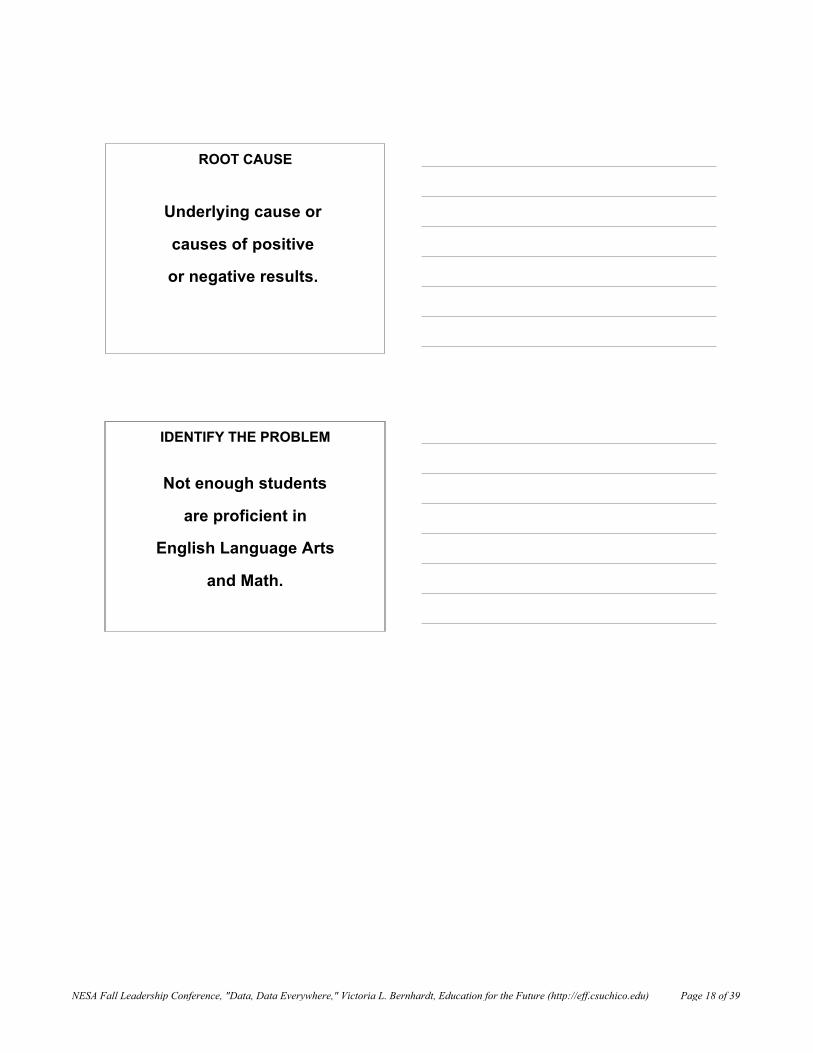
Underlying cause or
causes of positive
or negative results.
ROOT CAUSEROOT CAUSE
Not enough students
are proficient in
English Language Arts
and Math.
IDENTIFY THE PROBLEMIDENTIFY THE PROBLEM
NESA Fall Leadership Conference, "Data, Data Everywhere," Victoria L. Bernhardt, Education for the Future (http://eff.csuchico.edu) Page 18 of 39
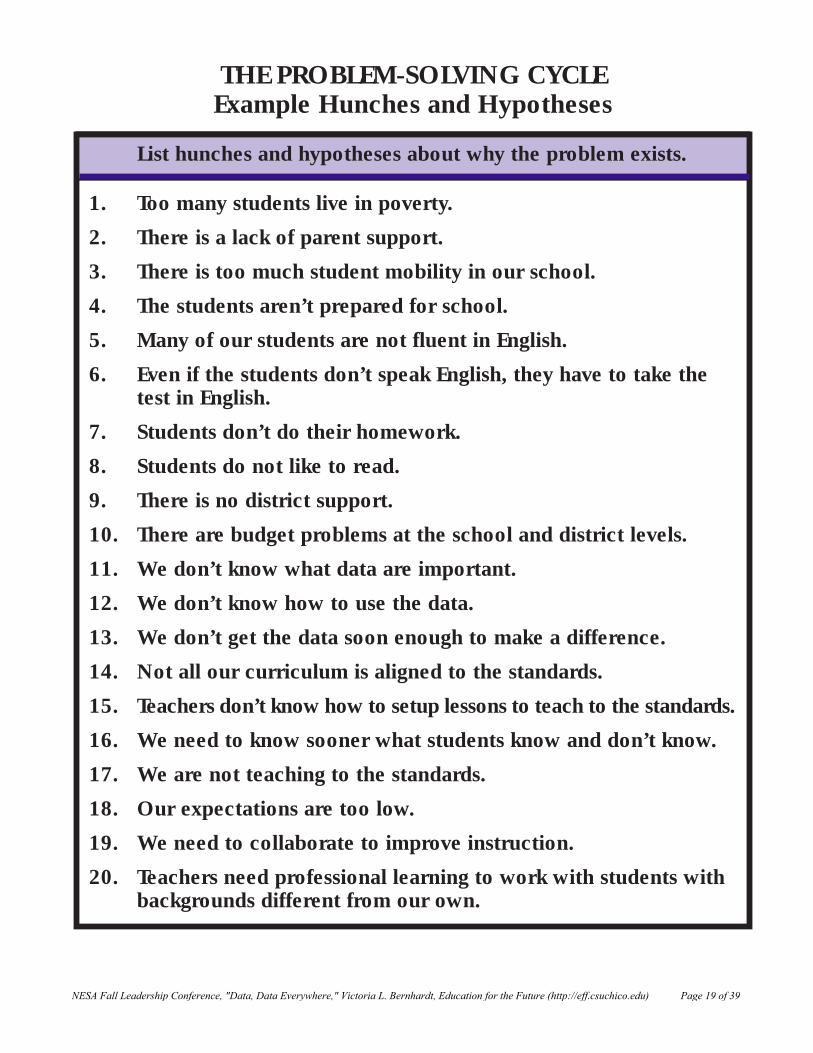
List hunches and hypotheses about why the problem exists.
1. Too many students live in poverty.
2. There is a lack of parent support.
3. There is too much student mobility in our school.
4. The students aren’t prepared for school.
5. Many of our students are not fluent in English.
6. Even if the students don’t speak English, they have to take thetest in English.
7. Students don’t do their homework.
8. Students do not like to read.
9. There is no district support.
10. There are budget problems at the school and district levels.
11. We don’t know what data are important.
12. We don’t know how to use the data.
13. We don’t get the data soon enough to make a difference.
14. Not all our curriculum is aligned to the standards.
15. Teachers don’t know how to setup lessons to teach to the standards.
16. We need to know sooner what students know and don’t know.
17. We are not teaching to the standards.
18. Our expectations are too low.
19. We need to collaborate to improve instruction.
20. Teachers need professional learning to work with students withbackgrounds different from our own.
THE PROBLEM-SOLVING CYCLEExample Hunches and Hypotheses
NESA Fall Leadership Conference, "Data, Data Everywhere," Victoria L. Bernhardt, Education for the Future (http://eff.csuchico.edu) Page 19 of 39
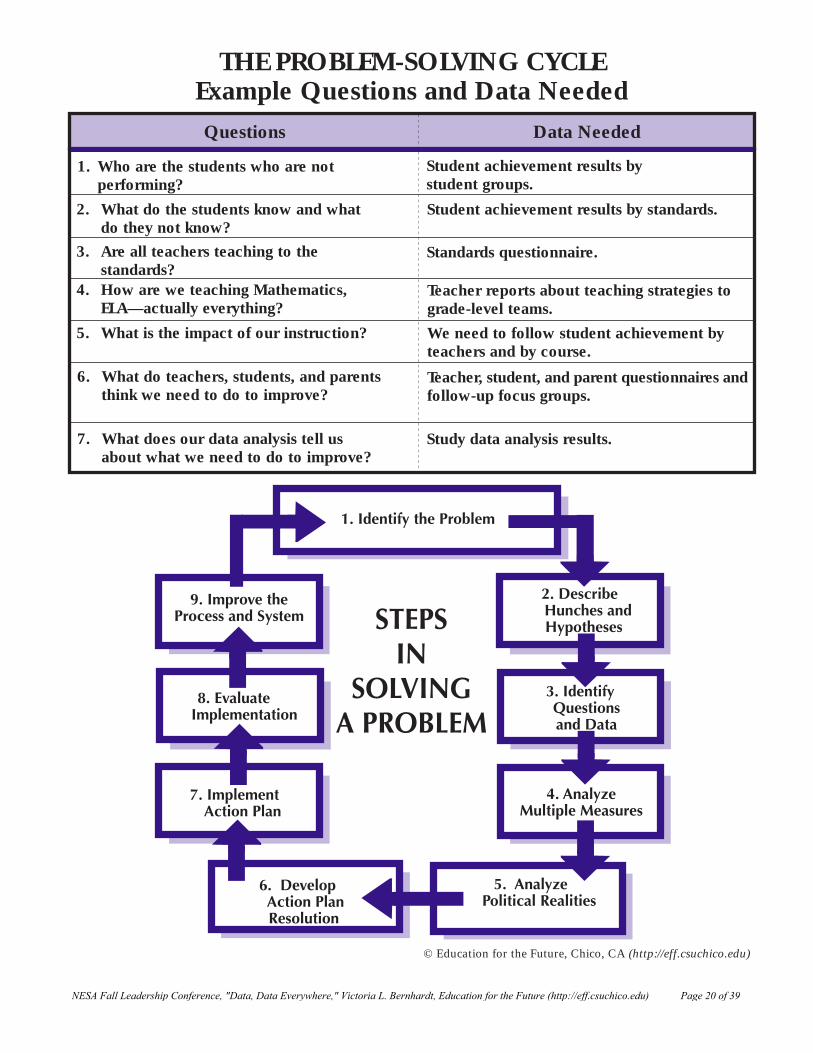
THE PROBLEM-SOLVING CYCLEExample Questions and Data Needed
© Education for the Future, Chico, CA (http://eff.csuchico.edu)
1. Who are the students who are notperforming?
Questions Data Needed
Student achievement results bystudent groups.
2. What do the students know and whatdo they not know?
Student achievement results by standards.
3. Are all teachers teaching to thestandards?
Standards questionnaire.
4. How are we teaching Mathematics,ELA—actually everything?
Teacher reports about teaching strategies tograde-level teams.
5. What is the impact of our instruction? We need to follow student achievement byteachers and by course.
6. What do teachers, students, and parentsthink we need to do to improve?
Teacher, student, and parent questionnaires andfollow-up focus groups.
7. What does our data analysis tell usabout what we need to do to improve?
Study data analysis results.
NESA Fall Leadership Conference, "Data, Data Everywhere," Victoria L. Bernhardt, Education for the Future (http://eff.csuchico.edu) Page 20 of 39
List hunches and hypotheses about why the problem exists.
Identify the problem:
1.
2.
3.
4.
5.
6.
7.
8.
9.
10.
11.
12.
13.
14.
15.
16.
17.
18.
19.
20.
NESA Fall Leadership Conference, "Data, Data Everywhere," Victoria L. Bernhardt, Education for the Future (http://eff.csuchico.edu) Page 21 of 39

What questions do you need to answer to know more about theproblem, and what data do you need to gather?
Questions Data Needed
NESA Fall Leadership Conference, "Data, Data Everywhere," Victoria L. Bernhardt, Education for the Future (http://eff.csuchico.edu) Page 22 of 39
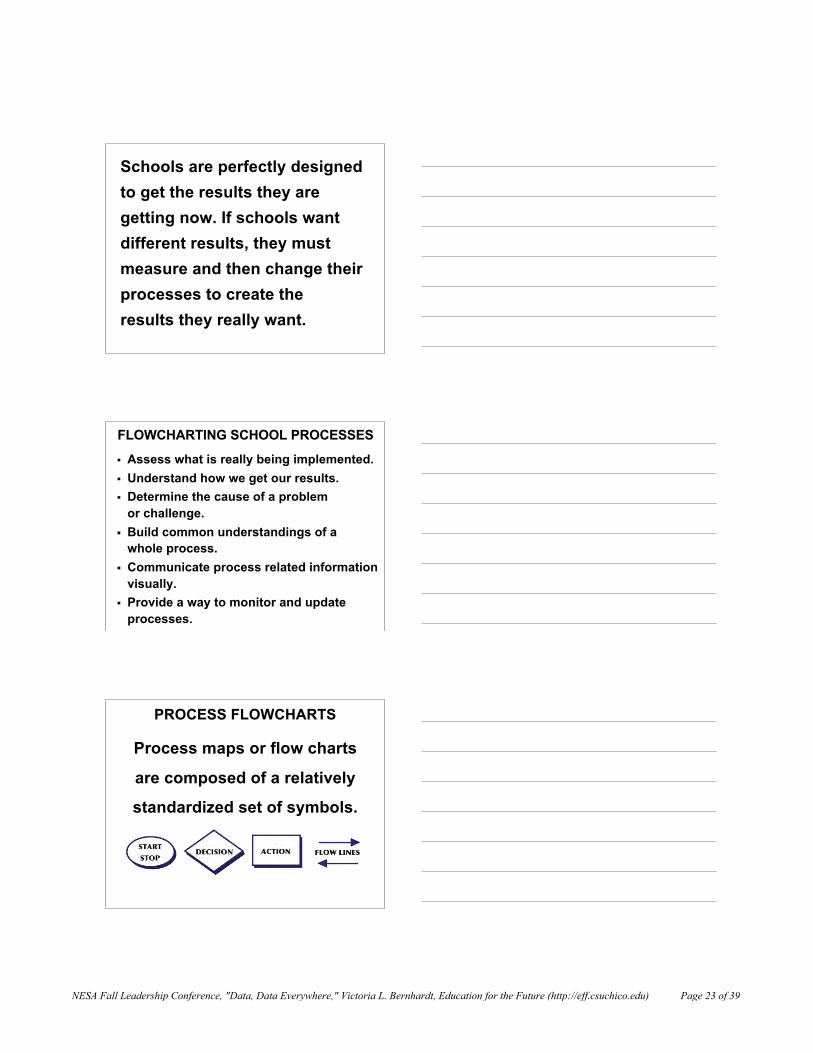
Schools are perfectly designedto get the results they aregetting now. If schools wantdifferent results, they mustmeasure and then change theirprocesses to create theresults they really want.
Assess what is really being implemented. Understand how we get our results. Determine the cause of a problem
or challenge. Build common understandings of a
whole process. Communicate process related information
visually. Provide a way to monitor and update
processes.
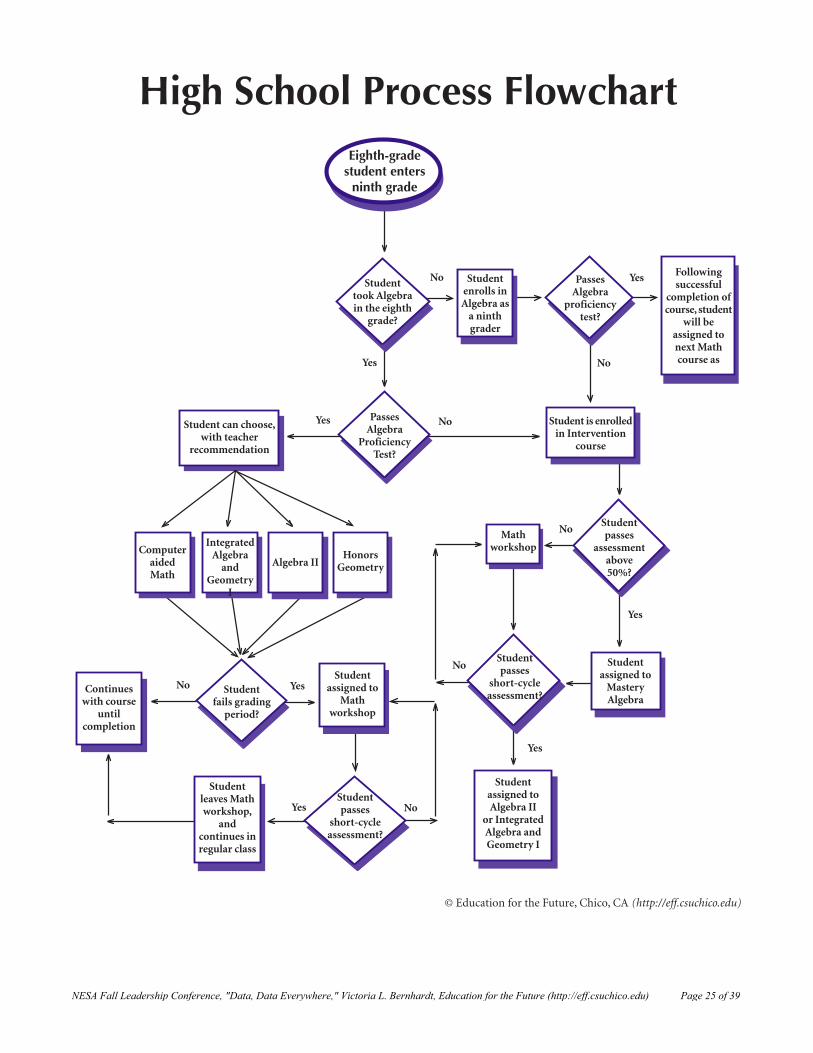
FLOWCHARTING SCHOOL PROCESSESFLOWCHARTING SCHOOL PROCESSES
PROCESS FLOWCHARTSPROCESS FLOWCHARTS
Process maps or flow charts
are composed of a relatively
standardized set of symbols.
NESA Fall Leadership Conference, "Data, Data Everywhere," Victoria L. Bernhardt, Education for the Future (http://eff.csuchico.edu) Page 23 of 39
NESA Fall Leadership Conference, "Data, Data Everywhere," Victoria L. Bernhardt, Education for the Future (http://eff.csuchico.edu) Page 24 of 39
NESA Fall Leadership Conference, "Data, Data Everywhere," Victoria L. Bernhardt, Education for the Future (http://eff.csuchico.edu) Page 25 of 39
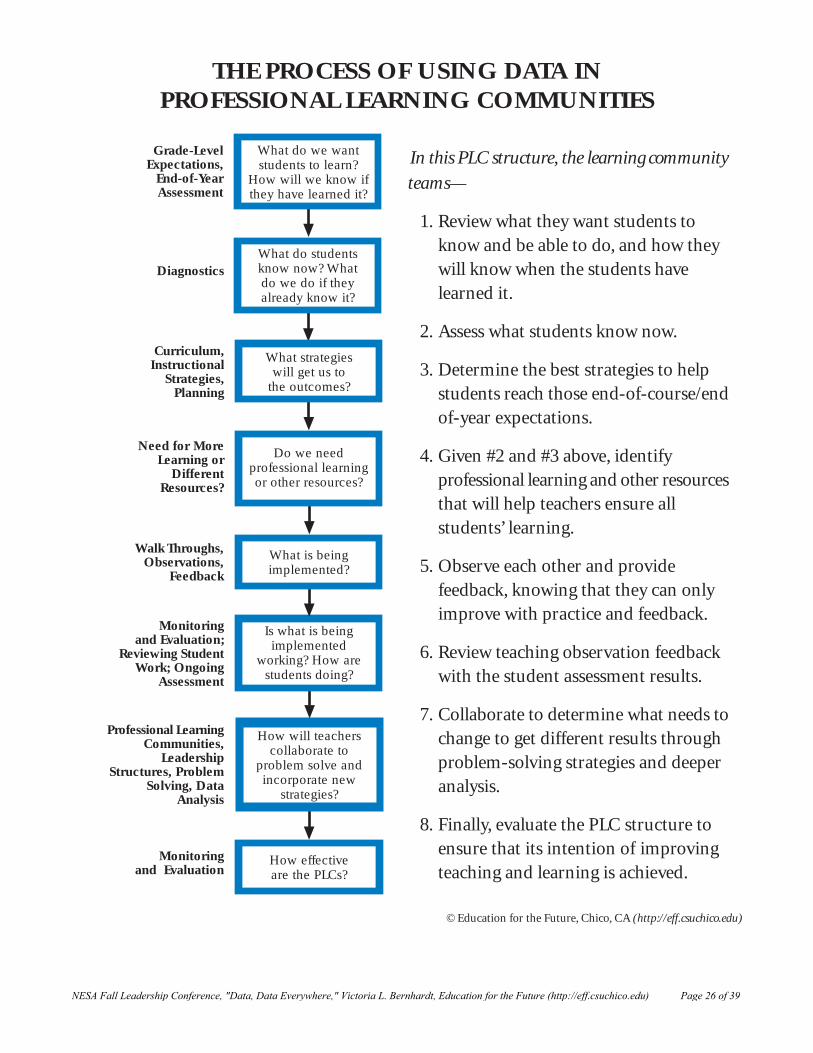
In this PLC structure, the learning community
teams—
1. Review what they want students toknow and be able to do, and how theywill know when the students havelearned it.
2. Assess what students know now.
3. Determine the best strategies to helpstudents reach those end-of-course/endof-year expectations.
4. Given #2 and #3 above, identifyprofessional learning and other resourcesthat will help teachers ensure allstudents’ learning.
5. Observe each other and providefeedback, knowing that they can onlyimprove with practice and feedback.
6. Review teaching observation feedbackwith the student assessment results.
7. Collaborate to determine what needs tochange to get different results throughproblem-solving strategies and deeperanalysis.
8. Finally, evaluate the PLC structure toensure that its intention of improvingteaching and learning is achieved.
THE PROCESS OF USING DATA INPROFESSIONAL LEARNING COMMUNITIES
© Education for the Future, Chico, CA (http://eff.csuchico.edu)
How will teacherscollaborate to
problem solve andincorporate new
strategies?
Professional LearningCommunities,
LeadershipStructures, Problem
Solving, DataAnalysis
What do we wantstudents to learn?
How will we know ifthey have learned it?
What do studentsknow now? Whatdo we do if theyalready know it?
What strategieswill get us to
the outcomes?
Do we needprofessional learningor other resources?
Is what is beingimplemented
working? How arestudents doing?
How effectiveare the PLCs?
Grade-LevelExpectations,
End-of-YearAssessment
Diagnostics
Curriculum,Instructional
Strategies,Planning
Need for MoreLearning or
DifferentResources?
Monitoringand Evaluation;
Reviewing StudentWork; Ongoing
Assessment
Monitoringand Evaluation
What is beingimplemented?
Walk Throughs,Observations,
Feedback
NESA Fall Leadership Conference, "Data, Data Everywhere," Victoria L. Bernhardt, Education for the Future (http://eff.csuchico.edu) Page 26 of 39
Com
preh
ensi
ve D
ata
Ana
lysi
s to
Sch
ool I
mpr
ovem
ent I
mpl
emen
tatio
n
Shar
ed V
isio
n
Stre
ngth
s, C
halle
nges
,Im
plic
atio
ns, a
nd O
ther
Dat
aLo
ok fo
r Im
plic
atio
nC
omm
onal
itie
sA
ggre
gate
Im
plic
atio
nsfo
r th
e C
onti
nuou
s Sc
hool
Impr
ovem
ent
Plan
Prob
lem
-Sol
ving
Cyc
leC
onti
nuou
s Sc
hool
Im
prov
emen
t Pl
an
1. I
dent
ify th
ePr
oble
m
2. D
escr
ibe
H
unch
es a
nd H
ypot
hese
s
9. I
mpr
ove
the
Proc
ess a
nd S
yste
m
8. E
valu
ate
I
mpl
emen
tatio
n3.
Ide
ntify
Q
uest
ions
an
d D
ata
7. I
mpl
emen
t
Act
ion
Plan
4. A
naly
zeM
ultip
le M
easu
res
6. D
evel
op
Act
ion
Plan
Re
solu
tion
5. A
naly
ze
Pol
itica
lRe
aliti
es
Wh
at a
re s
ome
impl
icat
ion
s for
the
Mar
ylin
Ave
nu
e sc
hoo
l con
tin
uou
s im
prov
emen
t pla
n?
Mar
ylin
Ave
nue
staf
f nee
ds to
—•
Con
tinu
e us
ing
scho
olw
ide
data
as
they
hav
e in
the
past
to h
elp
them
kn
ow h
ow th
e sy
stem
is d
oin
g. G
et a
nd
keep
the
data
base
up-
to-d
ate
so s
taff
can
gau
ge p
rogr
ess.
•C
lari
fy th
e as
sess
men
t sys
tem
:
*B
alan
ce it
wit
h va
riet
y, in
clud
ing
perf
orm
ance
ass
essm
ents
an
d st
uden
t sel
f-as
sess
men
ts.
*M
ake
sure
the
asse
ssm
ents
that
are
use
d ar
e te
llin
g th
em w
hat t
hey
nee
d to
hea
r to
kn
ow h
ow to
en
sure
stud
ent p
rofi
cien
cy.
*Fo
r m
ath
and
beha
vior
.
*St
ream
line
the
Pre-
refe
rral
pro
cess
, esp
ecia
lly th
e fo
rm c
ompl
etio
n p
roce
ss.
*W
hat s
taff
doe
s w
hen
stu
den
ts a
re p
rofi
cien
t on
Ben
chm
arks
.
•Im
prov
e R
tI.
*U
nde
rsta
nd
why
stu
den
ts w
ho h
ave
been
thro
ugh
inte
rven
tion
s ar
e n
ot p
rofi
cien
t. D
o a
prob
lem
-sol
vin
gcy
cle
to b
ette
r un
ders
tan
d.
*C
onti
nue
to p
rovi
de p
rofe
ssio
nal
dev
elop
men
t for
all
staf
f so
eve
ryon
e ca
n u
nde
rsta
nd
it a
nd
impl
emen
tit
in th
e sa
me
way
.
*Im
plem
ent a
teac
her
self
-ass
essm
ent a
nd
grad
e le
vel s
elf
asse
ssm
ent s
yste
m to
hel
p im
plem
ent t
he v
isio
nan
d th
e R
tI s
yste
m w
ith
inte
grit
y an
d fi
delit
y th
roug
hout
the
scho
ol. I
den
tify
inte
rnal
qua
lity
mea
sure
s.
*C
lari
fy w
hat t
he v
isio
n a
nd
RtI
wou
ld lo
ok li
ke w
hen
impl
emen
ted.
*Im
prov
e ou
r pe
er c
oach
ing
syst
em: s
uppo
rt a
nd
prov
ide
guid
ance
for
new
inst
ruct
ion
an
d as
sess
men
tst
rate
gies
. Pro
vide
tim
e to
dev
elop
new
ski
lls a
nd
impr
ove
leve
l 1.
•U
pdat
e, im
prov
e, a
nd
follo
w th
e sc
hool
impr
ovem
ent p
lan
.
•Im
prov
e sh
ared
dec
isio
n m
akin
g an
d le
ader
ship
: Def
ine,
impl
emen
t, an
d co
mm
unic
ate.
•C
lari
fy w
in-w
in p
artn
ersh
ips
wit
h pa
ren
ts. M
ake
sure
par
tner
s kn
ow th
e vi
sion
an
d m
issi
on o
f th
e sc
hool
.
•E
nsu
re c
ross
-gra
de-l
evel
wor
k im
prov
es to
impl
emen
t the
vis
ion
an
d R
tI c
onsi
sten
tly,
an
d to
als
o en
sure
that
aco
nti
nuum
of
lear
nin
g is
in p
lace
an
d m
akes
sen
se fo
r th
e st
uden
ts.
•H
as th
e sp
read
of
data
cha
nge
d ov
er ti
me?
3.Lo
okin
g at
the
data
pre
sen
ted,
wh
at o
ther
Con
tin
uou
s Im
prov
emen
t Con
tin
uu
m d
ata
wou
ld y
ou w
ant
to a
nsw
er th
e qu
esti
on H
ow d
o w
e do
bu
sin
ess?
for
Mar
ylin
Ave
nu
e E
lem
enta
ry S
choo
l?
MA
RYLI
N A
VEN
UE
ELEM
ENTA
RY S
CH
OO
LST
REN
GTH
S, C
HA
LLEN
GES
, IM
PLIC
ATI
ON
S, A
ND
OTH
ER D
ATA
CO
NTI
NU
OU
S IM
PRO
VEM
ENT
CO
NTI
NU
UM
DA
TA
En
glis
h L
angu
age
Art
s (E
LA
)•
Gra
des
two
and
five
sh
owed
incr
ease
s in
th
epe
rcen
tage
s of
stu
den
ts P
rofic
ient
or
Adv
ance
d ov
eral
lan
d fo
r ev
ery
stu
den
t gr
oup,
wit
h t
he
exce
pti
on o
fC
auca
sian
s in
bot
h g
rade
leve
ls a
nd
mal
es in
gra
defi
ve.
Mat
h•
Ove
rall,
200
9-10
mat
h sc
ores
impr
oved
ove
r 20
08-0
9sc
ores
, exc
ept
wit
h g
rade
s tw
o an
d fi
ve m
ales
, gra
deth
ree
fem
ales
, Cau
casi
ans,
an
d en
glis
h o
nly
stu
den
ts,
exce
pt
at g
rade
tw
o.A
PI
•T
he
AP
I sc
ores
hav
e be
en g
oin
g u
p si
nce
200
5-06
—
En
glis
h L
angu
age
Art
s (E
LA
)•
2009
-10
was
a c
hal
len
gin
g ye
ar fo
r M
aryl
in A
ven
ue.
Th
e p
erce
nta
ges
of s
tude
nts
Pro
fici
ent o
r A
dvan
ced
decr
ease
d ov
eral
l in
gra
des
thre
e an
d fo
ur a
nd
for
ever
yst
ude
nt
grou
p.M
ath
•C
auca
sian
stu
den
ts.
AP
I•
Th
e A
PI
scor
es a
re d
own
acr
oss
the
boar
d th
is y
ear.
1. W
hat
are
Mar
ylin
Ave
nu
e’s
stu
den
t lea
rnin
g st
ren
gths
an
d c
hall
enge
s?St
ren
gths
Cha
llen
ges
•H
o w is
EL
A b
ein
g ta
ugh
t? H
ow is
EL
A b
ein
g m
easu
red
on a
n o
ngo
ing
basi
s?
•H
ow is
Mat
h b
ein
g ta
ugh
t? H
ow is
Mat
h b
ein
g m
easu
red
on a
n o
ngo
ing
basi
s?
•D
id t
each
ers
focu
s to
o m
uch
on
th
e st
ude
nts
not
pro
fici
ent?
Do
all t
each
ers
know
wh
at t
o do
wh
en s
tude
nts
are
2. W
hat
are
som
e im
plic
atio
ns
for
the
Mar
ylin
Ave
nu
e sc
hoo
l im
pro
vem
ent p
lan
?
3.L
ooki
ng
at th
e d
ata
pre
sen
ted
, wh
at o
ther
per
cep
tual
dat
a w
ould
you
wan
t to
answ
er th
equ
esti
on
•I n
div i
dual
stu
den
t gr
owth
dat
a—ar
e st
ude
nts
gro
win
g ov
er t
ime?
MA
RYLI
N A
VEN
UE
ELEM
ENTA
RY S
CH
OO
LST
REN
GTH
S, C
HA
LLEN
GES
, IM
PLIC
ATI
ON
S, A
ND
OTH
ER D
ATA
STU
DEN
T LE
AR
NIN
G D
ATA
•T
he s
taff
has
don
e a
won
derf
ul j
ob o
f ge
ttin
g st
ude
nt
resp
onse
s ea
ch y
ear
(98.
5% in
201
0).
•It
is g
reat
to s
ee fi
ve y
ears
of
data
.
•N
ot m
uch
has
cha
nge
d fo
r th
em o
ver
tim
e.
•O
n th
e ag
greg
ate,
all
K-1
stu
den
t res
pon
ses
wer
e in
agre
emen
t.•
Ove
rall,
the
stu
den
ts in
gra
des
2 th
rou
gh 5
are
in s
tron
gag
reem
ent w
ith
the
item
s on
the
ques
tion
nai
re.
•St
ude
nts
in g
rade
s 2
to 5
nam
ed te
ache
rs a
s w
hat t
hey
like
mos
t abo
ut th
eir
scho
ol in
the
past
4 y
ears
.•
Four
yea
rs a
go, s
tude
nts t
alke
d ab
out w
ishi
ng th
e pl
aygr
ound
and
lear
ning
wer
e di
ffer
ent.
In 2
009-
10, l
earn
ing
is n
otm
enti
oned
as
som
ethi
ng
they
wis
hed
was
dif
fere
nt.
•St
aff
ques
tion
nai
re r
esu
lts
show
that
sta
ff, f
or th
e m
ost
part
, con
tinu
e to
be
very
pos
itiv
e ab
out t
he s
choo
l. A
ll ite
ms
wer
e in
agr
eem
ent o
r st
ron
g ag
reem
ent.
Staf
f now
feel
that
the
scho
ol h
as a
goo
d pu
blic
imag
e. T
hey
also
feel
that
thei
rsc
hool
cu
ltu
re a
nd
staf
f co
llabo
rati
on a
re th
e bi
gges
tst
ren
gths
of
the
scho
ol. O
ne
can
see
pro
gres
s ov
er t
ime.
•St
aff i
ndic
ate
the
tale
nted
scho
ol st
aff a
nd st
aff c
olla
bora
tion
are
thei
r gr
eate
st s
tren
gths
.•
Ove
rall,
par
ents
con
tinu
e to
be
very
pos
itiv
e ab
out t
hesc
hool
.•
Pare
nts
, the
car
ing
lovi
ng
staf
f, an
d en
viro
nm
ent a
re th
e
•So
me o
ne
shou
ld fo
llow
-up
on th
e lo
wes
t sco
rin
g it
ems
(K-1
)—I
feel
like
I b
elon
g an
d I
know
wha
t I a
m s
uppo
sed
to b
e le
arni
ng in
my
clas
ses.
•T
he lo
wes
t ite
ms o
n th
e gr
ades
2-5
que
stio
nnai
re a
re re
late
dto
stu
den
ts t
reat
ing
each
oth
er w
ith
resp
ect a
nd
bein
gfr
ien
dly,
an
d ha
vin
g fr
eedo
m a
nd
choi
ces
at s
choo
l.•
Am
eric
an I
ndi
an s
tude
nts
(n=
8), g
rade
s 2-
5, w
ere
indi
sagr
eem
ent w
ith
the
item
s, S
tude
nts
at m
y sc
hool
are
frie
ndly
, Stu
dent
s at
my
scho
ol t
reat
me
wit
h re
spec
t, an
d I
am s
afe.
•T
here
wer
e 8
Am
eric
an I
ndi
an s
tude
nts
who
mar
ked
low
on s
ever
al it
ems;
how
ever
, the
re is
on
ly 1
Am
eric
an In
dian
stu
den
t res
pon
din
g to
dem
ogra
phic
. We
don
't kn
ow w
hoth
ese
othe
r st
ude
nts
are
. The
y m
ay h
ave
thou
ght t
hey
mar
ked
“Am
eric
an.”
•Se
ven
(7)
Afr
ican
-Am
eric
an s
tude
nts
wer
e in
dis
agre
emen
tto
: I h
ave
fun
lear
ning
, I li
ke th
is s
choo
l, T
his
scho
ol is
goo
d,I
have
free
dom
at s
choo
l, I
have
cho
ices
in w
hat I
lear
n,St
uden
ts a
re tr
eate
d fa
irly
by
teac
hers
, Stu
dent
s at m
y sc
hool
trea
t me
wit
h re
spec
t, St
uden
ts a
t my
scho
ol a
re fr
iend
ly, a
ndI
have
lots
of f
rien
ds.
•C
omm
unic
atio
n co
nti
nues
to b
e th
e m
ost w
ritt
en in
com
men
t of
wha
t nee
ds to
impr
ove,
from
the
pers
pect
ive
of s
taff
. Equ
ity
in id
eas
and
favo
rite
s ne
eds
to b
e re
view
ed.
1. W
hat
are
Mar
ylin
Ave
nu
e’s
per
cept
ual
str
engt
hs a
nd
chal
len
ges?
Stre
ngt
hsC
hall
enge
s
•T
he s
choo
l per
son
nel
mig
ht n
eed
prof
essi
onal
dev
elop
men
t in
beh
avio
r/re
spec
t an
d di
vers
ity
issu
es, a
nd
how
they
giv
est
ude
nts
free
dom
an
d ch
oice
s.
•C
omm
un
icat
ion
an
d sh
ared
lead
ersh
ip n
eed
to im
prov
e.
2. W
hat
are
som
e im
plic
atio
ns
for
the
Mar
ylin
Ave
nu
e sc
hoo
l im
prov
emen
t pla
n?
MA
RYLI
N A
VEN
UE
ELEM
ENTA
RY S
CH
OO
LST
REN
GTH
S, C
HA
LLEN
GES
, IM
PLIC
ATI
ON
S, A
ND
OTH
ER D
ATA
PER
CEP
TUA
L D
ATA
Cha
llen
ges
•So
meo
ne
shou
ld fo
llow
-up
on th
e lo
wes
t sco
rin
g it
ems
(K-1
)—I
feel
like
I b
elon
g an
d I
know
wha
t I a
m s
uppo
sed
to b
e le
arni
ngin
my
clas
ses.
•T
he
low
est
item
s on
th
e gr
ades
2-5
qu
esti
onn
aire
are
rel
ated
to
stu
den
ts tr
eati
ng
each
oth
er w
ith
resp
ect a
nd
bein
g fr
ien
dly,
an
dh
avin
g fr
eedo
m a
nd
choi
ces
at s
choo
l.•
Am
eric
an In
dian
stud
ents
(n=
8), g
rade
s 2-5
, wer
e in
dis
agre
emen
tw
ith
th
e it
ems,
Stu
dent
s at
my
scho
ol a
re fr
iend
ly, S
tude
nts
at m
ysc
hool
tre
at m
e w
ith
resp
ect,
and
I am
saf
e.•
Th
ere
wer
e 8
Am
eric
an I
ndi
an s
tude
nts
wh
o m
arke
d lo
w o
nse
vera
l ite
ms;
how
ever
, th
ere
is o
nly
1 A
mer
ican
In
dian
stu
den
tre
spon
din
g to
dem
ogra
phic
. We
don
't kn
ow w
ho
thes
e ot
her
stu
den
ts a
re. T
hey
may
hav
e th
ough
t th
ey m
arke
d “A
mer
ican
.”•
Seve
n (
7) A
fric
an-A
mer
ican
stu
den
ts w
ere
in d
isag
reem
ent
to:
I ha
ve fu
n le
arni
ng, I
like
this
sch
ool,
Thi
s sc
hool
is g
ood,
I h
ave
free
dom
at s
choo
l, I
have
cho
ices
in w
hat I
lear
n, S
tude
nts
are
trea
ted
fair
ly b
y te
ache
rs, S
tude
nts
at m
y sc
hool
tre
at m
e w
ith
resp
ect,
Stud
ents
at m
y sc
hool
are
frie
ndly
, an
d I h
ave
lots
of f
rien
ds.
•C
omm
unic
atio
n co
nti
nu
es t
o be
th
e m
ost
wri
tten
in c
omm
ent
of w
hat
nee
ds t
o im
prov
e, fr
om t
he
per
spec
tive
of
staf
f. E
quit
yin
idea
s an
d fa
vori
tes
nee
ds t
o be
rev
iew
ed.
•Pa
ren
ts w
ant m
ore
soci
al s
kills
for
stud
ents
an
d m
ore
supe
rvis
ion
befo
re/a
fter
sch
ool a
nd
duri
ng
rece
ss.
MA
RYLI
N A
VEN
UE
ELEM
ENTA
RY S
CH
OO
LST
REN
GTH
S, C
HA
LLEN
GES
, IM
PLIC
ATI
ON
S, A
ND
OTH
ER D
ATA
DEM
OG
RA
PHIC
DA
TA1.
Wh
at a
re M
aryl
in A
ven
ue’
s d
emog
rap
hic
str
engt
hs a
nd
cha
llen
ges?
Stre
ngt
hsC
hall
enge
s
2. W
hat
are
som
e im
plic
atio
ns
for
the
Mar
ylin
Ave
nu
e sc
hoo
l im
pro
vem
ent p
lan
?
3.L
ooki
ng
at th
e d
ata
pre
sen
ted
, wh
at o
ther
dem
ogra
ph
ic d
ata
wou
ld y
ou w
ant t
o an
swer
the
ques
tion
Who
are
we?
for
Mar
ylin
Ave
nu
e E
lem
enta
ry S
choo
l?
•T
he
med
ian
inco
me
in t
he
tow
n is
hig
her
th
an t
he
stat
e’s.
•M
aryl
in A
ven
ue
is a
div
erse
, med
ium
-siz
e sc
hoo
l ser
vin
ggr
ades
K-5
.•
Gra
de-l
evel
en
rollm
ents
see
m to
be
rela
tive
ly s
tead
y, a
lth
ough
decr
ease
s in
upp
er g
rade
s.•
Th
e m
obili
ty r
ate
is d
own
from
a c
oupl
e of
yea
rs a
go.
•St
ude
nt
atte
nda
nce
is h
igh
, alt
hou
gh d
own
th
is y
ear.
•T
her
e is
a d
ecre
ase
in t
he
nu
mbe
r of
stu
den
ts r
etai
ned
—on
ly2
kin
derg
arte
ner
s w
ere
reta
ined
in 2
009-
10.
•T
he
per
cen
tage
of
stu
den
ts b
y et
hn
icit
y id
enti
fied
for
spec
ial
educ
atio
n fo
r th
e D
istr
ict i
s co
mpa
tibl
e w
ith
the
over
all p
erce
nt
enro
llmen
t fo
r th
e di
stri
ct, a
s w
ell a
s fo
r th
e sc
hoo
l.•
Pre
-ref
erra
l tea
m (
PR
T)
and
SpE
RT
(sp
ecia
l edu
cati
on r
efer
ral
team
) se
ems
to b
e w
orki
ng
wel
l.•
Th
ere
has
bee
n a
sh
arp
decr
ease
in t
he
nu
mbe
r of
stu
den
tssu
spen
ded
over
tim
e.•
Th
e cl
ass
size
is lo
w.
•T
he
aver
age
nu
mbe
r of
yea
rs o
f te
ach
ing
has
incr
ease
d in
th
ela
st y
ears
, as
hav
e th
e n
um
ber
of t
each
ers.
•T
he
grad
es a
re p
rett
y ba
lan
ced
by n
um
ber
of y
ears
of
teac
hin
gex
per
ien
ce.
•T
he a
vera
ge n
um
ber
of y
ears
of
teac
hin
g is
gre
ater
for
Mar
ylin
Ave
nu
e th
an t
he
dist
rict
.
•M
aryl
in A
ven
ue
is e
xper
ien
cin
g de
clin
ing
enro
llmen
t.•
The
re is
dec
linin
g di
stri
ctw
ide
enro
llmen
t in
the
last
few
yea
rs—
up
slig
htly
in 2
009-
10.
•M
aryl
in A
ven
ue
is e
xper
ien
cin
g de
clin
ing
enro
llmen
t.
•T
her
e ar
e m
any
diff
eren
t et
hn
icit
ies
that
are
incr
easi
ng
as t
he
Cau
casi
anst
ude
nt
pop
ula
tion
is d
ecre
asin
g. I
n t
he
sch
ool,
the
His
pan
ic p
opu
lati
onh
as in
crea
sed
from
49%
to
over
75%
, an
d th
e C
auca
sian
pop
ula
tion
decr
ease
d fr
om 3
1% t
o 16
%.
Th
e H
ispa
nic
stu
den
t p
opu
lati
on o
f th
eD
istr
ict
incr
ease
d fr
om 1
8% t
o 25
%, w
hile
its
Cau
casi
an p
opu
lati
onde
crea
sed
from
alm
ost
40%
to
alm
ost
60%
.•
Mob
ility
rat
e is
hig
h a
t ab
out
28%
.
•A
lmos
t 61
% o
f th
e st
ude
nts
are
En
glis
h L
earn
ers;
th
is p
erce
nta
ge h
asst
eadi
ly in
crea
sed
over
the
year
s. M
aryl
in A
ven
ue
has
abou
t 4.5
tim
es m
ore
En
glis
h L
earn
ers
than
th
e di
stri
ct.
•T
her
e h
as b
een
a s
tead
y in
crea
se o
f st
ude
nts
qu
alif
yin
g fo
r Fr
ee/R
edu
ced
Lun
ch—
mu
ch h
ighe
r th
an th
e di
stri
ct—
82%
ver
sus
23%
—an
d ov
er tw
ice
as m
any
than
in 2
001-
02.
•T
he m
ajor
ity
of M
aryl
in A
venu
e pa
rent
s do
not
hav
e hi
gh s
choo
l edu
cati
ons.
•T
he
dist
rict
op
en e
nro
llmen
t p
olic
y co
uld
be
sett
ing
up
Mar
ylin
Ave
nu
efo
r a
mor
e ch
alle
ngi
ng
shar
e of
th
e st
ude
nt
pop
ula
tion
.•
Th
e p
erce
nta
ge o
f st
ude
nts
qu
alif
yin
g fo
r sp
ecia
l edu
cati
on is
abo
ut
12%
.T
he
maj
orit
y ar
e m
ale
and
His
pan
ic.
•T
he
hig
hes
t p
erce
nta
ge o
f sp
ecia
l edu
cati
on s
tude
nts
are
iden
tifi
ed fo
rsp
eech
/lan
guag
e (5
7.4%
).
•A
re t
each
ers
prep
ared
to
teac
h t
he
chan
gin
g p
opu
lati
on?
Do
teac
her
s kn
ow h
ow t
o te
ach
stu
den
ts w
ith
En
glis
h a
s a
seco
nd
lan
guag
e, a
nd
thos
e w
ho
live
in p
over
ty?
Wh
at a
re t
he
impl
icat
ion
s of
teac
hin
g st
ude
nts
livi
ng
in p
over
ty?
(Per
hap
s m
ore
mal
e an
d m
inor
ity
teac
her
s n
eed
to b
e re
cru
ited
?)•
How
are
cla
ss-s
ize
issu
es d
ealt
wit
h?
•D
oes
the
sch
ool k
now
why
th
e m
obili
ty r
ate
is h
igh
, an
d w
her
e st
ude
nts
go?
Do
they
sta
y in
th
e di
stri
ct?
•H
ow a
re n
ew s
tude
nts
an
d th
eir
pare
nts
wel
com
ed t
o th
e sc
hoo
l? H
ow d
o te
ach
ers
know
wh
at t
he
new
stu
den
ts k
now
an
d ar
e ab
le t
o do
?
•A
re m
ater
ials
, pro
gram
s, a
nd
libra
ry b
ooks
app
ropr
iate
for
the
stu
den
t p
opu
lati
on (
e.g.
, EL
, pov
erty
, mob
ile, s
pec
ial e
duca
tion
)? A
re t
her
eap
prop
riat
e ex
tra
curr
icu
lar
acti
viti
es, c
lubs
?•
How
doe
s th
e sc
hoo
l hel
p pa
ren
ts k
now
how
to
hel
p th
eir
child
ren
lear
n?
•H
ow a
re t
he
nee
ds o
f st
ude
nts
wh
o sp
eak
En
glis
h a
s a
seco
nd
lan
guag
e m
et?
•W
hy a
re s
o m
any
mal
es id
enti
fied
for
spec
ial e
duca
tion
? W
hat
is t
he
impl
emen
ted
inte
nti
on o
f sp
ecia
l edu
cati
on?
How
eff
ecti
ve is
th
e R
tIpr
oces
s? W
hy s
o m
any
stu
den
ts id
enti
fied
for
Spee
ch a
nd
Lan
guag
e?•
A p
osit
ive,
con
sist
ent
beh
avio
r sy
stem
is n
eede
d.
•W
hat
is t
he
hou
seh
old
inc o
me
of t
he
Mar
ylin
Ave
nu
e n
eigh
borh
ood?
•H
ow d
oes
the
dist
rict
op
en e
nro
llmen
t p
olic
y im
pact
Mar
ylin
Ave
nu
e E
lem
enta
ry S
choo
l.•
Wh
at is
th
e in
ten
t of
Sp
ecia
l Edu
cati
on a
nd
how
doe
s R
tI w
ork?
•M
ore
data
on
beh
avio
r—es
pec
ially
follo
win
g in
divi
dual
stu
den
ts o
ver
tim
e.
Dem
ogra
phic
s,Pe
rcep
tion
s,St
uden
t Lea
rnin
g,Sc
hool
Pro
cess
es
LOO
K FO
R IM
PLIC
ATIO
N C
OM
MO
NAL
ITIE
S FO
R M
ARYL
IN A
VEN
UE
ELEM
ENTA
RY S
CHO
OL
DEM
OG
RAPH
ICS
STU
DEN
T, S
TAFF
, PAR
ENT
QU
ESTI
ON
NAI
RES
PRO
CESS
DAT
A
♦Th
e sch
o ol p
erso
nnel
mig
ht n
eed
prof
essio
nal d
evel
opm
ent i
nbe
havi
or/r
espe
ct a
nd d
iver
sity
issue
s and
how
they
giv
e stu
dent
sfre
edom
and
choi
ces.
Staf
f mig
htal
so n
eed
to lo
ok in
to th
e iss
ues
of st
uden
ts b
eing
chal
leng
ed.
♦C
omm
unic
atio
n an
d sh
ared
lead
ersh
ip n
eeds
to im
prov
e.
♦H
ow is
EL A
bei
ng ta
ught
? How
isEL
A be
ing
mea
sure
d on
an
ongo
ing
basis
?.♦
How
is M
ath
bein
g ta
ught
? How
isM
ath
bein
g m
easu
red
on an
ong
oing
basis
?♦
Did
teac
hers
focu
s too
muc
h on
the
stud
ents
not
pro
ficie
nt? D
o al
lte
ache
rs k
now
wha
t to
do w
hen
stud
ents
are
pro
ficie
nt?
STU
DEN
T LE
ARN
ING
♦Ar
e te
ache
rs p
repa
red
tote
ach
the
chan
ging
popu
latio
n? D
o te
ache
rskn
ow h
ow to
teac
h st
uden
tsw
ith E
nglis
h as
a se
cond
lang
uage
, tho
se w
ho li
ve in
pove
rty?
Wha
t are
the
impl
icat
ions
of t
each
ing
stud
ents
livi
ng in
pov
erty
?(P
erha
ps m
ore
mal
e an
dm
inor
ity te
ache
rs n
eed
to b
ere
crui
ted?
)♦
Doe
s the
scho
ol k
now
why
the m
obili
ty ra
te is
hig
h, an
dw
here
stud
ents
go?
Do
they
stay
in th
e di
stric
t?♦
How
are
new
stud
ents
and
thei
r par
ents
wel
com
ed to
the s
choo
l? H
ow d
o te
ache
rskn
ow w
hat t
he n
ew st
uden
tskn
ow a
nd a
re a
ble
to d
o?♦
Are m
ater
ials,
pro
gram
s, an
dlib
rary
boo
ks ap
prop
riate
for
the s
tude
nt p
opul
atio
n (e
.g.,
EL, p
over
ty, m
obile
, spe
cial
educ
atio
n)?
♦W
hy ar
e the
re so
man
y mal
esid
entif
ied
for s
peci
aled
ucat
ion?
♦Is
a n
ew d
iscip
line
syst
emca
lled
for?
Mar
ylin
Ave
nue s
taff
need
s to—
♦Co
ntin
ue u
sing
scho
olw
ide d
ata
as th
ey h
ave i
n th
e pas
t to
help
them
kno
who
w th
e sy
stem
is d
oing
. Get
and
kee
p th
e da
taba
se u
p-to
-dat
e so
staf
f can
gaug
e pr
ogre
ss.
♦C
larif
y th
e as
sess
men
t sys
tem
:
*Ba
lanc
e it
with
var
iety
, inc
ludi
ng p
erfo
rman
ce a
sses
smen
ts a
nd st
uden
tse
lf-as
sess
men
ts.
*M
ake
sure
the
asse
ssm
ents
that
are
use
d ar
e te
lling
them
wha
t the
y ne
edto
hea
r to
know
how
to en
sure
stud
ent p
rofic
ienc
y.
*Fo
r mat
h an
d be
havi
or.
*St
ream
line t
he p
re-r
efer
ral p
roce
ss, e
spec
ially
the f
orm
com
plet
ion
proc
ess.
*W
hat s
taff
does
whe
n st
uden
ts a
re p
rofic
ient
on
benc
hmar
ks.
♦Im
prov
e Rt
I:
*U
nder
stan
d w
hy st
uden
ts w
ho h
ave
been
thro
ugh
inte
rven
tions
are
not
prof
icie
nt. D
o a
prob
lem
-sol
ving
cycl
e to
bet
ter u
nder
stan
d.
*C
ontin
ue to
pro
vide
pro
fess
iona
l dev
elop
men
t for
all
staf
f so
ever
yone
can
unde
rsta
nd it
and
impl
emen
t it i
n th
e sa
me
way
.
*Im
plem
ent a
teac
her s
elf-a
sses
smen
t and
gra
de le
vel s
elf a
sses
smen
t sys
tem
to h
elp
impl
emen
t the
visi
on an
d th
e RtI
syste
m w
ith in
tegr
ity an
d fid
elity
thro
ugho
ut th
e sc
hool
. Ide
ntify
inte
rnal
qua
lity
mea
sure
s.
*C
larif
y w
hat t
he v
ision
and
RtI
wou
ld lo
ok li
ke w
hen
impl
emen
ted.
*Im
prov
e our
pee
r coa
chin
g sy
stem
: sup
port
and
prov
ide g
uida
nce f
or n
ewin
stru
ctio
n an
d as
sess
men
t str
ateg
ies.
Prov
ide
time
to d
evel
op n
ew sk
ills
and
impr
ove
leve
l 1.
♦U
pdat
e, im
prov
e, an
d fo
llow
the
scho
ol im
prov
emen
t pla
n.♦
Impr
ove
shar
ed d
ecisi
on m
akin
g an
d le
ader
ship
: Def
ine,
impl
emen
t, an
dco
mm
unic
ate.
♦C
larif
y w
in-w
in p
artn
ersh
ips w
ith p
aren
ts. M
ake
sure
par
tner
s kno
w th
evi
sion
and
miss
ion
of th
e sc
hool
.♦
Ensu
re cr
oss-
grad
e-le
vel w
ork
impr
oves
to im
plem
ent t
he v
ision
and
RtI
cons
isten
tly, a
nd to
also
ensu
re th
at a
cont
inuu
m o
f lea
rnin
g m
akes
sens
efo
r the
stud
ents
.
MA
RYLI
N A
VEN
UE
ELEM
ENTA
RY S
CH
OO
L
INST
RUC
TIO
NA
SSES
SMEN
TPR
OFE
SSIO
NA
LLE
ARN
ING
•C
lari
fy a
bal
anc e
das
sess
men
t sys
tem
.
•W
e ne
ed to
mak
e su
rete
ache
rs k
now
wha
t the
new
stud
ents
kno
w a
nd a
re a
ble
to d
o w
hen
they
arr
ive,
sow
e do
not
lose
inst
ruct
iona
ltim
e.
•W
e ne
ed to
col
lect
mor
esy
stem
atic
form
ativ
e da
ta in
wri
ting
and
mat
h.
•C
o ntin
ue o
ur p
rofe
ssio
nal
lear
ning
in m
eetin
g th
ene
eds o
f our
stud
ents
,es
peci
ally
stud
ents
with
Engl
ish
as a
seco
ndla
ngua
ge, t
hose
who
live
inpo
vert
y, a
nd m
ales
,sp
ecifi
cally
in E
LA a
ndM
ath
lear
ning
, and
for R
tI.
•Sc
hool
per
sonn
el n
eed
cons
iste
nt tr
aini
ng a
ndim
plem
enta
tion
ofbe
havi
or a
nd m
otiv
atio
nst
rate
gies
.
VIS
ION
/ P
LAN
•Te
ache
rs n
eed
to st
reng
then
thei
r ins
truc
tiona
l str
ateg
ies
in E
LA a
nd M
ath.
•T
here
nee
ds to
be
deep
erim
plem
enta
tion
of R
tI.
•C
ontin
ue to
ens
ure
that
all
teac
hers
are
teac
hing
tost
anda
rds a
nd a
ll st
uden
tsar
e m
eetin
g st
anda
rds i
n al
lsu
bjec
t are
as.
•C
lari
fy w
hat s
taff
doe
s whe
nst
uden
ts a
re p
rofic
ient
.
CU
RRIC
ULU
MBE
HAV
IOR
•T
he v
isio
n ne
eds t
o be
fully
impl
emen
ted.
•St
aff n
eeds
to n
arro
w th
efo
cus o
f the
pla
n an
d st
ayfo
cuse
d on
it; a
lway
s hav
ene
xt st
eps i
n fr
ont o
f the
m;
crea
te a
nd p
ost a
gra
phic
orga
nize
r to
hel
p us
stay
focu
sed.
•W
e ne
ed to
syst
emat
ical
lyin
clud
e ou
r pa
rent
s in
qual
ity
plan
ning
.
•W
e ne
e d a
pos
itive
,co
nsis
tent
beh
avio
r sy
stem
scho
olw
ide.
•A
re m
ater
ials,
pro
gram
s, an
dlib
rary
boo
ks a
ppro
pria
te fo
rth
e st
uden
t pop
ulat
ion?
(EL,
pove
rty,
mob
ile, s
peci
aled
ucat
ion)
•W
e ne
ed to
doc
umen
t and
cont
inue
to im
prov
e R
tIim
plem
enta
tion.
CO
LLA
BORA
TIO
NLE
AD
ERSH
IPRt
I / S
PEC
IAL
EDU
CATI
ON
CLI
MAT
EPA
RTN
ERSH
IPS
DAT
A
•C
omm
unic
atio
n ne
eds t
oim
prov
e am
ong
staf
f and
with
par
ents
.
•Ev
eryo
ne n
eeds
to b
e a
part
of p
rofe
ssio
nal l
earn
ing
and
lead
ersh
ip.
•W
e ne
ed to
impr
ove
shar
edle
ader
ship
.
We
need
to:
•Lo
ok in
to sp
eech
and
lang
uage
refe
rral
s.•
Stre
amlin
e PR
T p
roce
ss.
•G
et a
ll st
aff
unde
rsta
ndin
g R
tI in
the
sam
e w
ay.
•St
reng
then
leve
l one
RtI
.•
Eval
uate
and
impr
ove
RtI
impl
emen
tatio
n.
•St
aff n
eed
to st
reng
then
pee
rco
achi
ng a
nd m
ake
it an
dth
e fe
edba
ck st
ruct
ure
mor
esy
stem
atic
and
def
ined
.
•W
e ne
ed to
sche
dule
scho
olw
ide
artic
ulat
ion
mor
e of
ten
and
mak
e cr
oss-
grad
e-le
vel a
rtic
ulat
ion
mee
tings
mor
e sy
stem
atic
.
•St
aff n
eed
to co
ntin
ue c
ross
-gr
ade-
leve
l art
icul
atio
n,in
clud
ing
agre
emen
ts a
bout
stud
ent b
ehav
ior
in te
rms
of m
otiv
atio
n, a
ttitu
de, a
ndef
fort
—al
so a
s rel
ated
toSt
uden
ts C
omm
itted
toEx
celle
nce.
•W
e ne
ed a
syst
em to
wel
com
e ne
w st
uden
ts a
ndth
eir
pare
nts t
o th
e sc
hool
.
•St
aff n
eed
to c
ontin
uecr
oss-
grad
e-le
vel
artic
ulat
ion,
incl
udin
gag
reem
ents
abo
ut st
uden
tbe
havi
or in
term
s of
mot
ivat
ion,
att
itude
, and
effo
rt—
also
as r
elat
ed to
Stud
ents
Com
mitt
ed to
Exce
llenc
e.•
Staf
f nee
d to
con
tinue
toco
mm
unic
ate
and
colla
bora
te.
•W
here
do
our
mob
ilest
uden
ts g
o? D
o th
ey st
ay in
the
dist
rict
?
•W
e ne
ed to
con
tinue
usi
ngsc
hool
wid
e da
ta te
ams.
•St
aff n
eed
to b
ecom
e as
tute
in k
now
ing
wha
t wor
ks so
they
can
pre
dict
and
ens
ure
succ
esse
s.
•St
aff a
cces
sibi
lity
to d
ata
tool
s nee
ds to
be
impr
oved
.
•W
e ne
ed to
con
nect
stud
ent
achi
evem
ent d
ata
topa
rtne
rshi
ps, a
nd lo
ok in
tore
latio
nshi
ps th
at m
ight
affe
ct st
uden
t ach
ieve
men
t,ba
sed
on o
urm
issi
on/v
isio
n/ p
lan.
•W
e ne
ed to
doc
umen
tdi
ffere
nt w
ays t
heco
mm
unit
y is
con
trib
utin
gto
the
scho
ol, a
nd h
owpa
rent
invo
lvem
ent a
ffect
sst
uden
t ach
ieve
men
t.
•W
e ne
ed to
mak
e su
repa
rent
s kno
w h
ow to
hel
pm
eet t
he le
arni
ng n
eeds
of
thei
r ch
ildre
n.
CU
RRIC
ULU
M♦
Stat
e an
d na
tiona
l sta
ndar
ds a
nd b
ench
mar
ks w
illbe
use
d to
rea
ch c
omm
on o
utco
mes
(st
anda
rds-
base
d)♦
Will
be
com
preh
ensi
ve K
-6♦
Effe
ctiv
enes
s w
ill b
e m
easu
red
♦W
ill a
ddre
ss a
ll le
arni
ng s
tyle
s♦
Rel
evan
t to
need
s of
toda
y an
d to
mor
row
♦U
p-to
-dat
e an
d gl
obal
♦Te
ache
rs a
ctiv
ely
teac
hing
to c
urri
culu
m st
anda
rds
and
benc
hmar
ks♦
Will
be
com
fort
able
eno
ugh
to th
e st
uden
ts th
atth
ey a
re n
ot a
frai
d to
try
for
fear
they
mig
ht fa
il,ye
t it i
s ch
alle
ngin
g—no
leve
ling—
all
hete
roge
neou
s gr
oupi
ng♦
Use
up-
to-d
ate
inst
ruct
iona
l mat
eria
ls, t
echn
olog
y,an
d en
rich
men
t act
ivit
ies
♦N
eeds
to s
pira
l and
be
inte
grat
ed♦
Kee
p ex
pect
atio
ns h
igh
♦St
uden
t-ce
nter
ed♦
Bas
ed o
n th
e le
vel o
f stu
dent
s in
the
clas
sroo
m♦
Fun
♦C
omm
unit
y ac
tive
ly p
arti
cipa
tes
♦Li
fe-l
earn
ing
skill
s♦
Inte
grat
e m
ulti
cult
ural
mat
eria
ls♦
Cle
arly
def
ined
—ea
sy to
follo
w a
nd u
nder
stan
d♦
Coo
rdin
ated
♦Se
quen
tial
♦C
aree
r aw
aren
ess
♦In
vest
igat
ive
♦
Cha
lleng
ing
♦En
gagi
ng
INST
RUC
TIO
N♦
Mul
tipl
e in
telli
genc
e/di
ffer
enti
ated
inst
ruct
iona
l str
ateg
ies
♦R
esea
rch-
base
d♦
Self-
refle
ctio
n by
inst
ruct
ors
♦D
rive
n by
stu
dent
nee
ds
A sh
ared
vis
ion
mus
t inc
lude
wha
t cur
ricu
lum
, ins
truc
tion
, ass
essm
ent,
and
envi
ronm
ent w
ill lo
oklik
e, s
ound
like
, and
feel
like
whe
n th
e m
issi
on o
f Lit
tle R
iver
Sch
ool i
s im
plem
ente
d.
INST
RUC
TIO
N (C
onti
nued
)♦
Teac
hing
to s
tude
nts’
stre
ngth
s♦
Att
ache
d to
pri
or k
now
ledg
e♦
Mak
e co
nnec
tion
s♦
Teac
h fo
r a
purp
ose
♦Fl
exib
le a
nd c
reat
ive
♦Fo
ster
ris
k-ta
king
♦Fu
n♦
Rel
ate
to li
felo
ng le
arni
ng♦
Act
ive
lear
ning
♦In
nova
tive
—m
otiv
atin
g♦
Peer
coa
chin
g an
d de
mon
stra
tion
less
ons
♦In
quir
y-ba
sed
♦H
ands
on
♦Te
ache
rs k
now
ledg
eabl
e ab
out t
heir
sub
ject
are
as♦
Inst
ruct
ion
base
d on
act
ive
invo
lvem
ent,
coop
erat
ive
lear
ning
, han
ds-o
n an
d no
isy,
wit
hlo
t of e
ngag
ed ti
me
on ta
sk♦
The
teac
her
as “
a gu
ide
on th
e si
de, n
ot a
sag
e on
the
stag
e”♦
Inve
stig
ativ
e ve
rsus
lect
ure/
teac
her-
cent
ered
♦C
oope
rati
ve le
arni
ng♦
Stud
ent r
espo
nsib
ility
and
ow
ners
hip
of le
arni
ng♦
Teac
h to
dif
fere
nt le
arni
ng s
tyle
s♦
Non
-int
erru
pted
lear
ning
tim
e
ASS
ESSM
ENT
♦O
ngoi
ng♦
Use
d fo
r im
prov
emen
t♦
Teac
h ab
ove
and
beyo
nd b
ench
mar
ks a
ndst
anda
rds
♦R
efle
ctio
n (t
each
er) “
wha
t did
I m
iss?
”♦
Tim
ely
stud
ent f
eedb
ack
♦Te
st h
ow s
tude
nts
are
taug
ht♦
Test
wha
t stu
dent
s ar
e le
arni
ng♦
Jour
nals
to s
how
stu
dent
s’ un
ders
tand
ing
♦Pe
riod
ic a
sses
smen
ts to
trac
k pr
ogre
ss a
ndde
term
ine
inst
ruct
iona
l nee
ds♦
Teac
her
obse
rvat
ions
Goa
ls
CU
RRIC
ULU
MM
ust—
♦U
se st
uden
t con
tent
stan
dard
s to
reac
h co
mm
on o
utco
mes
♦U
se u
p-to
-dat
e in
stru
ctio
nal m
ater
ials
, tec
hnol
ogy,
and
enri
chm
ent a
ctiv
itie
s♦
Spir
al a
nd b
e in
tegr
ated
♦K
eep
expe
ctat
ions
hig
h♦
Be
stud
ent-
cent
ered
♦B
e ba
sed
on th
e le
vel o
f stu
dent
s in
the
clas
sroo
m♦
Be
rele
vant
♦B
e fu
n♦
Hav
e th
e co
mm
unit
y ac
tive
ly p
arti
cipa
ting
♦In
clud
e lif
e-le
arni
ng s
kills
♦B
uild
a c
onti
nuum
of l
earn
ing
that
mak
es s
ense
for
all
stud
ents
♦In
tegr
ate
cult
ural
mat
eria
ls♦
Be
clea
rly
defi
ned
– ea
sy to
follo
w a
nd u
nder
stan
d♦
Be
impl
emen
ted
wit
h a
mea
ns o
f acc
ount
abili
ty
INST
RUC
TIO
NM
ust i
nclu
de th
e fo
llow
ing
elem
ents
—♦
Mul
tipl
e in
telli
genc
e st
rate
gies
♦D
iffe
rent
iate
d in
stru
ctio
n♦
Res
earc
h-ba
sed
stra
tegi
es♦
Self-
refle
ctio
n by
inst
ruct
ors
♦D
rive
n by
stu
dent
nee
ds♦
Teac
hing
to s
tude
nts’
stre
ngth
s♦
Att
ache
d to
pri
or k
now
ledg
e♦
Mak
e co
nnec
tion
s♦
Flex
ibili
ty a
nd c
reat
ivit
y♦
Fost
er r
isk-
taki
ng♦
Prof
essi
onal
♦Fu
n♦
Rel
ate
to li
felo
ng le
arni
ng♦
Act
ive
lear
ning
♦In
nova
tive
—m
otiv
atin
g♦
Mul
tifa
cete
d♦
Effe
ctiv
e m
odel
ing
♦Pe
er c
oach
ing
and
dem
onst
rati
on le
sson
s♦
Han
ds o
n♦
Teac
hers
kno
wle
dgea
ble
abou
t the
ir s
ubje
ct a
reas
ASS
ESSM
ENT
Mus
t—♦
Be
ongo
ing
♦Te
st h
ow s
tude
nts
are
taug
ht♦
Test
wha
t stu
dent
s ar
e le
arni
ng♦
Be
used
for
impr
ovem
ent
♦In
clud
e ti
mel
y fe
edba
ck♦
Use
a v
arie
ty o
f ass
essm
ents
The
follo
win
g ar
e th
e cu
rric
ulum
, ins
truc
tion
, ass
essm
ent,
and
envi
ronm
enta
l fac
tors
that
all
staf
f mem
bers
agr
eesu
ppor
t effe
ctiv
e le
arni
ng fo
r Li
ttle
Riv
er st
uden
ts, a
long
wit
h ho
w d
ata
will
supp
ort t
hese
fact
ors:
ASS
ESSM
ENT
(Con
tinu
ed)
Mus
t—♦
Incl
ude
clas
sroo
m a
sses
smen
ts th
at lo
ok li
ke a
nd p
redi
ctth
e st
ate
test
s♦
Hav
e hi
gh e
xpec
tati
ons
♦B
e ab
out t
each
ing
abov
e an
d be
yond
ben
chm
arks
and
stan
dard
s♦
Incl
ude
refle
ctio
n (t
each
er) “
wha
t did
I m
iss?
”♦
Supp
ort s
tude
nt fe
edba
ck♦
Incl
ude
peri
odic
ass
essm
ents
to tr
ack
prog
ress
and
dete
rmin
e in
stru
ctio
nal n
eeds
♦In
clud
e ti
mel
y fe
edba
ck♦
Incl
ude
teac
her
obse
rvat
ions
ENV
IRO
NM
ENT
Shal
l inc
lude
—♦
Opp
ortu
niti
es fo
r al
l stu
dent
s to
lear
n♦
Aw
aren
ess
of c
ultu
ral b
elie
fs♦
Team
wor
k♦
Alte
rnat
ive
inst
ruct
ion
and
even
loca
tion
to m
otiv
ate
all t
ole
arn
♦B
eing
saf
e/se
cure
♦R
elia
ble/
stru
ctur
ed fl
exib
ility
♦R
efle
ctio
n of
indi
vidu
alit
y♦
Com
fort
able
, em
otio
nally
and
phy
sica
lly s
afe,
app
ealin
gcl
assr
oom
s♦
Hon
est a
nd o
pen
com
mun
icat
ion
♦R
espe
ct: t
each
er-t
o-te
ache
r, st
uden
t-to
-stu
dent
, tea
cher
-to
-stu
dent
, stu
dent
-to-
teac
her,
teac
her-
to-p
aren
t, pa
rent
-to
-tea
cher
, tea
cher
-to-
adm
inis
trat
or, a
dmin
istr
ator
-to-
teac
her,
adm
inis
trat
or to
stu
dent
, adm
inis
trat
or to
par
ent
DAT
A U
SEW
ill in
clud
e—♦
Scho
olw
ide
data
to s
how
how
we
can
impr
ove
the
syst
em♦
Eval
uati
ons
that
will
sho
w u
s w
hat p
rogr
ams/
stra
tegi
es a
rew
orki
ng a
nd w
hat p
rogr
ams/
stra
tegi
es a
re n
ot w
orki
ng♦
Mon
itor
ing
of th
e de
gree
to w
hich
the
visi
on is
bei
ngim
plem
ente
d to
hel
p ev
eryo
ne st
ay fo
cuse
d an
d co
mm
itted
to th
e vi
sion
♦Te
ache
rs w
orki
ng to
geth
er in
col
legi
al g
roup
s to
reg
ular
lyre
view
stud
ent w
ork
and
stud
ent d
ata
to im
prov
e in
stru
ctio
nan
d he
lp e
ach
teac
her
reac
h al
l stu
dent
s♦
Stud
ent,
staf
f, an
d pa
rent
que
stio
nnai
res
com
plet
ed e
ach
year
, wit
h re
com
men
dati
ons
impl
emen
ted
to s
how
how
the
syst
em c
an b
e im
prov
ed♦
Dec
isio
ns b
ased
on
data
Val
ues
and
Bel
iefs
♦St
uden
ts a
re te
sted
so
thei
r te
ache
rs c
an d
esig
nle
arni
ng o
ppor
tuni
ties
app
ropr
iate
to m
eet t
heir
need
s♦
Invo
lve
stud
ents
in g
oal s
etti
ng♦
Bui
ld o
n st
uden
t per
form
ance
♦A
pplic
atio
n of
ski
lls a
nd k
now
ledg
e♦
Dif
fere
nt fo
rms/
vari
etie
s of
ass
essm
ents
♦V
arie
d an
d be
yond
sta
ndar
dize
d te
sts
♦St
uden
t inv
olve
men
t in
the
who
le p
roce
ss♦
Inqu
iry
and
perf
orm
ance
♦A
war
enes
s of
cul
tura
l bel
iefs
♦Te
amw
ork—
will
ingn
ess
to w
ork
toge
ther
♦M
otiv
atin
g♦
Safe
/sec
ure
♦R
elia
ble/
stru
ctur
ed fl
exib
ility
♦C
omfo
rtab
le, e
mot
iona
lly a
nd p
hysi
cally
saf
e,
The
Mis
sion
of M
aryl
in A
venu
e El
emen
tary
Sch
ool
is fo
r al
l to
deve
lop
the
conf
iden
ce to
ris
k, to
acc
ept c
halle
nges
,an
d to
suc
ceed
. We
wil
l lea
rn fr
om o
ur e
xper
ienc
es,
show
com
pass
ion
for
othe
rs, a
nd g
row
thro
ugh
the
joy
of d
isco
very
.Le
arni
ng a
t Mar
ylin
Ave
nue
Elem
enta
ry S
choo
l wil
l ena
ble
ALL
to a
chie
ve th
eir
pers
onal
bes
t and
to b
e re
spec
tful
,th
ough
tful
, and
inde
pend
ent l
earn
ers.
Mis
sion
♦St
uden
ts a
re te
sted
so
thei
r te
ache
rs c
an d
esig
nle
arni
ng o
ppor
tuni
ties
app
ropr
iate
to m
eet t
heir
need
s♦
Invo
lve
stud
ents
in g
oal s
etti
ng♦
Bui
ld o
n st
uden
t per
form
ance
♦A
pplic
atio
n of
ski
lls a
nd k
now
ledg
e♦
Dif
fere
nt fo
rms/
vari
etie
s of
ass
essm
ents
♦V
arie
d an
d be
yond
sta
ndar
dize
d te
sts
♦St
uden
t inv
olve
men
t in
the
who
le p
roce
ss♦
Inqu
iry
and
perf
orm
ance
♦A
war
enes
s of
cul
tura
l bel
iefs
♦Te
amw
ork—
will
ingn
ess
to w
ork
toge
ther
♦M
otiv
atin
g♦
Safe
/sec
ure
♦R
elia
ble/
stru
ctur
ed fl
exib
ility
♦C
omfo
rtab
le, e
mot
iona
lly a
nd p
hysi
cally
saf
e,
Vis
ion W
hat
it w
ould
look
like
Com
pone
nts
Cu
rric
ulu
m is
sta
nda
rds
base
d.
Cur
ricu
lum
:M
aryl
in A
ven
ue
teac
hers
pla
n in
stru
ctio
nal
con
ten
t an
dle
arn
ing
goal
bas
ed o
n C
alif
orn
ia S
tate
Sta
nda
rds.
Teac
her
s pl
an in
stru
ctio
n t
hat
mee
tsC
alif
orn
ia s
tate
sta
nda
rds
for
liter
acy,
mat
hem
atic
s, s
ocia
l stu
dies
, an
d sc
ien
ce.
Th
e co
llabo
rati
ve p
lan
nin
g of
inst
ruct
ion
, an
d th
eim
plem
enta
tion
of
inst
ruct
ion
, for
Mar
ylin
Ave
nu
est
ude
nts
is d
eep,
not
just
bro
ad.
All
grad
e-le
vel t
eam
s ha
ve d
efin
ed E
ssen
tial
Stan
dard
s an
d Su
per
-Pow
er S
tan
dard
s.
Th
e co
llabo
rati
ve p
lan
nin
g of
inst
ruct
ion
, an
d th
eim
plem
enta
tion
of
inst
ruct
ion
, for
Mar
ylin
Ave
nu
est
ude
nts
tak
es in
to a
ccou
nt
the
prer
equ
isit
e sk
ills
and
con
cept
s re
quir
ed fo
r su
cces
sfu
l lea
rnin
g (u
nwra
pped
stan
dard
s).
•All
grad
e le
vel t
eam
s h
ave
unw
rapp
edth
e E
ssen
tial
and
Sup
er-P
ower
Sta
ndar
dsto
feat
ure
th
e n
eede
d pr
ereq
uis
ite
skill
san
d co
nce
pts
.•A
s pa
rt o
f in
stru
ctio
n, t
each
ers
info
rmst
ude
nts
of
the
stan
dard
bei
ng
tau
ght,
the
obje
ctiv
e of
the
less
on th
at a
ddre
sses
the
stan
dard
, an
d th
e im
port
ance
of
the
stan
dard
.
Inst
ruct
ion
at
Mar
ylin
Ave
nu
e Sc
hoo
l is
hor
izon
tally
(agr
eem
ent
amon
g gr
ade
leve
l tea
m m
embe
rs)
and
vert
ical
ly (
agre
emen
t ac
ross
th
e gr
ades
) al
ign
ed.
•Gra
de-l
evel
tea
ms
com
e to
agr
eem
ent
abou
t th
e m
ean
ing
and
con
ten
t of
stan
dard
s; E
ssen
tial
Sta
nda
rds;
an
dSu
per
-Pow
er S
tan
dard
s.•C
ross
-gra
de-l
evel
tea
ms
hav
e al
ign
edth
e E
ssen
tial
Sta
nda
rds.
•Lit
erac
y Le
ads
act
as t
he
cros
s-gr
ade-
leve
l com
mu
nic
atio
n s
tru
ctu
re a
rou
nd
agre
emen
t in
rea
din
g an
d w
riti
ng
stan
dard
s.
Cu
rric
ulu
m is
map
ped
an
d pa
ced
for
the
sch
ool y
ear.
•Gra
de-l
evel
tea
ms
draf
t an
d ag
ree
onye
ar-l
ong
curr
icu
lum
map
s to
pac
ein
stru
ctio
n.
Cu
rric
ulu
m im
plem
enta
tion
is b
ased
on
res
earc
hed
-ba
sed
prog
ram
s an
d sy
stem
sL
iter
acy
prog
ram
s an
d re
sou
rces
incl
ude
:•D
istr
ict-
adop
ted
Lan
guag
e A
rts
prog
ram
.
•Dis
tric
t-ad
opte
d St
ep-U
p to
Wri
tin
gpr
ogra
m.
•Sys
tem
ic I
nst
ruct
ion
in P
hon
ics
and
Ph
onem
ic A
war
enes
s (S
IPP
S).
Mee
tin
g T
imes
for
Staf
fA
ll st
aff
mem
bers
hav
e co
mm
itte
d to
mee
t on
Wed
nes
days
aft
er s
choo
l, w
ith
th
e Le
ader
ship
Team
mee
tin
g ad
diti
onal
ly o
n th
e fi
rst T
ues
day
of e
ach
mon
th a
nd
the
thir
d W
edn
esda
y af
ter
the
grad
e-le
vel m
eeti
ng.
Ou
r fo
cus
is s
tand
ards
—le
arn
ing
them
, im
ple
men
tin
g, a
sses
sin
g,an
d u
nde
rsta
nd
ing
the
imp
act
of t
each
ing
to t
hem
. Sin
ce g
rade
leve
l an
d c
ross
-gra
de-l
evel
team
mee
tin
gs a
re o
ne
hou
r in
len
gth,
an
age
nda
will
be
prov
ided
bef
oreh
and.
The
dat
es a
nd
tim
es a
re a
s fo
llow
s:
Rol
es a
nd
Res
pon
sib
ilit
ies
It is
eac
h s
taff
mem
ber’
s re
spon
sibi
lity
to im
plem
ent
the
stan
dard
s in
her
/his
cla
ssro
om. A
llst
aff
mem
bers
wil
l mee
t in
gra
de
leve
l tea
ms,
cro
ss-g
rad
e le
vel s
ubj
ect-
area
tea
ms,
or
as a
wh
ole
staf
f ev
ery
wee
k. I
n a
dd
itio
n, s
ome
staf
f m
embe
rs w
ill p
arti
cip
ate
on t
he
Lead
ersh
ipTe
am. T
he
role
s an
d re
spon
sibi
litie
s of
eac
h t
eam
are
def
ined
bel
ow.
Gra
de-l
evel
Tea
ms
The
pur
pose
s of
gra
de-l
evel
team
s ar
e to
mai
nta
in u
nit
y of
cur
ricu
lum
, in
stru
ctio
n, a
sses
smen
t,an
d to
impl
emen
t th
e st
anda
rds
at e
ach
gra
de le
vel.
♦Ev
ery
teac
her
will
par
tici
pate
in m
eeti
ngs
wit
h h
er o
r h
is g
rade
leve
l.♦
Teac
her
s w
ill c
oach
an
d su
ppor
t th
e im
plem
enta
tion
of
the
stan
dard
s an
d th
e vi
sion
in e
ach
oth
er’s
cla
ssro
oms.
♦G
rade
-lev
el t
eam
s w
ill s
eek
supp
ort
from
th
e su
bjec
t-ar
ea t
eam
s.♦
Teac
her
s w
ill s
tudy
an
d su
ppor
t ea
ch o
ther
’s im
plem
enta
tion
of
best
pra
ctic
es.
♦Su
ppor
t st
aff
will
be
assi
gned
to
appr
opri
ate
grad
e le
vel t
eam
s.♦
Gra
de le
vel m
eeti
ngs
will
tak
e pl
ace
in t
he
grad
e le
ader
’s c
lass
room
.
Cro
ss-g
rade
-lev
el T
eam
sC
ross
-gra
de-l
evel
mee
tin
gs w
ill ta
ke p
lace
in th
e su
bjec
t are
a le
ader
’s cl
assr
oom
. The
pu
rpos
esof
the
cros
s-gr
ade-
leve
l tea
ms
are
to m
ain
tain
un
ity
of c
urri
culu
m, i
nst
ruct
ion
, an
d as
sess
men
tin
eac
h s
ubj
ect
area
, sp
ecif
ical
ly t
o:A
ll st
aff
mem
bers
hav
e co
mm
itte
d to
mee
t on
Wed
nes
days
aft
er s
choo
l, w
ith
th
e Le
ader
ship
Team
mee
tin
g ad
diti
onal
ly o
n th
e fi
rst T
ues
day
of e
ach
mon
th a
nd
the
thir
d W
edn
esda
y af
ter
the
grad
e-le
vel m
eeti
ng.
Ou
r fo
cus
is s
tand
ards
—le
arn
ing
them
, im
ple
men
tin
g, a
sses
sin
g,an
d u
nde
rsta
nd
ing
the
imp
act
of t
each
ing
to t
hem
. Sin
ce g
rade
leve
l an
d c
ross
-gra
de-l
evel
team
mee
tin
gs a
re o
ne
hou
r in
len
gth,
an
age
nda
will
be
prov
ided
bef
oreh
and.
The
dat
es a
nd
tim
es a
re a
s fo
llow
s:
Rol
es a
nd
Res
pon
sib
ilit
ies
It is
eac
h s
taff
mem
ber’
s re
spon
sibi
lity
to im
plem
ent
the
stan
dard
s in
her
/his
cla
ssro
om. A
llst
aff
mem
bers
wil
l mee
t in
gra
de
leve
l tea
ms,
cro
ss-g
rad
e le
vel s
ubj
ect-
area
tea
ms,
or
as a
Con
tinu
ous
Impr
ovem
ent
& E
valu
atio
n
Mee
tin
g T
imes
for
Staf
fA
ll st
aff
mem
bers
hav
e co
mm
itte
d to
mee
t on
Wed
nes
days
aft
er s
choo
l, w
ith
th
e Le
ader
ship
Team
mee
tin
g ad
diti
onal
ly o
n th
e fi
rst T
ues
day
of e
ach
mon
th a
nd
the
thir
d W
edn
esda
y af
ter
the
grad
e-le
vel m
eeti
ng.
Ou
r fo
cus
is s
tand
ards
—le
arn
ing
them
, im
ple
men
tin
g, a
sses
sin
g,an
d u
nde
rsta
nd
ing
the
imp
act
of t
each
ing
to t
hem
. Sin
ce g
rade
leve
l an
d c
ross
-gra
de-l
evel
team
mee
tin
gs a
re o
ne
hou
r in
len
gth,
an
age
nda
will
be
prov
ided
bef
oreh
and.
The
dat
es a
nd
tim
es a
re a
s fo
llow
s:
Rol
es a
nd
Res
pon
sib
ilit
ies
It is
eac
h s
taff
mem
ber’
s re
spon
sibi
lity
to im
plem
ent
the
stan
dard
s in
her
/his
cla
ssro
om. A
llst
aff
mem
bers
wil
l mee
t in
gra
de
leve
l tea
ms,
cro
ss-g
rad
e le
vel s
ubj
ect-
area
tea
ms,
or
as a
wh
ole
staf
f ev
ery
wee
k. I
n a
dd
itio
n, s
ome
staf
f m
embe
rs w
ill p
arti
cip
ate
on t
he
Lead
ersh
ipTe
am. T
he
role
s an
d re
spon
sibi
litie
s of
eac
h t
eam
are
def
ined
bel
ow.
Gra
de-l
evel
Tea
ms
The
pur
pose
s of
gra
de-l
evel
team
s ar
e to
mai
nta
in u
nit
y of
cur
ricu
lum
, in
stru
ctio
n, a
sses
smen
t,an
d to
impl
emen
t th
e st
anda
rds
at e
ach
gra
de le
vel.
♦Ev
ery
teac
her
will
par
tici
pate
in m
eeti
ngs
wit
h h
er o
r h
is g
rade
leve
l.♦
Teac
her
s w
ill c
oach
an
d su
ppor
t th
e im
plem
enta
tion
of
the
stan
dard
s an
d th
e vi
sion
in e
ach
oth
er’s
cla
ssro
oms.
♦G
rade
-lev
el t
eam
s w
ill s
eek
supp
ort
from
th
e su
bjec
t-ar
ea t
eam
s.♦
Teac
her
s w
ill s
tudy
an
d su
ppor
t ea
ch o
ther
’s im
plem
enta
tion
of
best
pra
ctic
es.
♦Su
ppor
t st
aff
will
be
assi
gned
to
appr
opri
ate
grad
e le
vel t
eam
s.♦
Gra
de le
vel m
eeti
ngs
will
tak
e pl
ace
in t
he
grad
e le
ader
’s c
lass
room
.
Cro
ss-g
rade
-lev
el T
eam
sC
ross
-gra
de-l
evel
mee
tin
gs w
ill ta
ke p
lace
in th
e su
bjec
t are
a le
ader
’s cl
assr
oom
. The
pu
rpos
esof
the
cros
s-gr
ade-
leve
l tea
ms
are
to m
ain
tain
un
ity
of c
urri
culu
m, i
nst
ruct
ion
, an
d as
sess
men
tin
eac
h s
ubj
ect
area
, sp
ecif
ical
ly t
o:♦
impr
ove
inst
ruct
ion
an
d st
ude
nt
ach
ieve
men
t re
sult
s sc
hoo
lwid
e♦
ensu
re th
e im
plem
enta
tion
of
stan
dard
s w
ithi
n s
ubj
ect a
reas
an
d ac
ross
the
grad
e le
vels
♦ad
vise
th
e le
ader
ship
tea
m o
f pr
ogre
ss a
nd
con
cern
s of
gra
de-l
evel
an
d cr
oss-
grad
e-le
vel
team
mee
tin
gs♦
coac
h a
nd
supp
ort
the
qual
ity
impl
emen
tati
on o
f su
bjec
t ar
eas
♦de
mon
stra
te t
he
impl
emen
tati
on o
f su
bjec
t st
anda
rds
for
teac
her
s in
eac
h s
ubj
ect
area
♦re
view
dat
a an
d pl
an fo
r im
prov
emen
t♦
diss
emin
ate
subj
ect i
nfo
rmat
ion
from
the
scho
ol, d
istr
ict,
stat
e, a
nd
fede
ral g
over
nm
ent
Part
ners
hip
Dev
elop
men
t
Au
gust
25
8:0
0 t
o 4
:00
PM
Au
gust
26
8:0
0 t
o 4
:00
PM
Au
gust
27
8:0
0 t
o 4
:00
PM
Sep
tem
ber
13
:30
to
5:0
0 P
M
Sep
tem
ber
23
:30
to
5:0
0 P
M
Sep
tem
ber
27
:00
to
8:3
0 P
M
Sep
tem
ber
73
:30
to
5:0
0 P
M
Sep
tem
ber
83
:30
to
5:0
0 P
M
Sep
tem
ber
93
:30
to
5:0
0 P
M
Sep
tem
ber
10
12
:00
to
1:0
0 P
M
Sep
tem
ber
13
3:3
0 t
o 5
:00
PM
Sep
tem
ber
14
3:3
0 t
o 5
:00
PM
Sep
tem
ber
15
3:3
0 t
o 5
:00
PM
Sep
tem
ber
16
3:3
0 t
o 5
:00
PM
Pro
fess
ion
alD
evel
op
men
t
Pro
fess
ion
alD
evel
op
men
t
Pro
fess
ion
alD
evel
op
men
t
Fac
ult
y M
eeti
ng
Pro
fess
ion
alD
evel
op
men
t
PT
A
Lea
der
ship
Tea
m
Dep
artm
ent
Mee
tin
gs
Cri
tica
l F
rien
ds
Gro
up
Smal
l G
rou
p T
eam
s
Sch
oo
l Im
pro
vem
ent
Co
mm
itte
e (S
IC)
Pro
fess
ion
alD
evel
op
men
t
Lea
der
ship
Tea
m
Fac
ult
y M
eeti
ng
Pro
fess
ion
alD
evel
op
men
t
Rev
iew
vis
ion
, sta
nd
ard
s, c
urr
icu
lum
art
icu
lati
on
, Ch
arac
ter
Ed
uca
tion
,an
d L
earn
ing
Foc
us
imp
lem
enta
tion
Rev
iew
vis
ion
, sta
nd
ard
s, c
urr
icu
lum
art
icu
lati
on
, Ch
arac
ter
Ed
uca
tion
,an
d L
earn
ing
Foc
us
imp
lem
enta
tion
Rev
iew
vis
ion
, sta
nd
ard
s, c
urr
icu
lum
art
icu
lati
on
, Ch
arac
ter
Ed
uca
tion
,an
d L
earn
ing
Foc
us
imp
lem
enta
tion
Pee
r o
bse
rvat
ion
an
d d
emo
nst
rati
on
les
son
sch
edu
lin
g
Ali
gnin
g o
ur
stan
dar
ds-
bas
ed c
urr
icu
lum
Par
tner
ship
pla
n
Shar
ed d
ecis
ion
mak
ing;
sta
nd
ard
s al
ign
men
t; p
artn
ersh
ips
Ch
eck
ali
gnm
ent
to s
tan
dar
ds;
sh
ared
dec
isio
n m
akin
g
Lea
rnin
g F
ocu
s st
rate
gies
an
d d
emo
nst
rati
on
les
son
s
Sch
oo
l P
lan
: D
evel
op
ing
a se
nse
of
com
mu
nit
y w
ith
in t
eam
s an
dgr
ade
leve
ls
Tec
hn
olo
gy:
e-n
ewsl
ette
rs a
nd
pla
cin
g in
form
atio
n o
n t
he
sch
oo
l w
ebsi
te
Stan
dar
ds
alig
nm
ent
and
im
ple
men
tati
on
Lea
rnin
g F
ocu
s— s
usp
ensi
on
s/d
isci
pli
ne/
Ch
arac
ter
Ed
uca
tion
Dif
fere
nti
atin
g st
and
ard
s-b
ased
in
stru
ctio
n
Dat
eTy
pe
of
Mee
tin
gTo
pic
s
Prof
essi
onal
Lea
rnin
gM
eeti
ng
Tim
es fo
r St
aff
All
staf
f m
embe
rs h
ave
com
mit
ted
to m
eet
on W
edn
esda
ys a
fter
sch
ool,
wit
h t
he
Lead
ersh
ipTe
am m
eeti
ng
addi
tion
ally
on
the
firs
t Tu
esda
y of
eac
h m
onth
an
d th
e th
ird
Wed
nes
day
afte
rth
e gr
ade-
leve
l mee
tin
g. O
ur
focu
s is
sta
nda
rds—
lear
nin
g th
em, i
mp
lem
enti
ng,
ass
essi
ng,
and
un
der
stan
din
g th
e im
pac
t of
tea
chin
g to
th
em. S
ince
gra
de
leve
l an
d c
ross
-gra
de-
leve
lte
am m
eeti
ngs
are
on
e h
our
in le
ngt
h, a
n a
gen
da w
ill b
e pr
ovid
ed b
efor
ehan
d. T
he
date
s an
dti
mes
are
as
follo
ws:
Day
T
ime
Tea
ms
1st
Tues
day
3:45
to
5:00
Lead
ersh
ip1s
t Wed
nes
day
3:45
to
4:45
Gra
de L
evel
2nd
Wed
nes
day
3:45
to
4:45
Cro
ss-g
rade
Lev
el b
y Su
bjec
t3r
d W
edn
esda
y3:
45 t
o 4:
45G
rade
Lev
el3r
d W
edn
esda
y4:
50 t
o 5:
30Le
ader
ship
4th
Wed
nes
day
3:45
to
4:45
Cro
ss-g
rade
Lev
el K
-65t
h W
edn
esda
y3:
45 t
o 4:
45C
eleb
rati
on o
f P
rogr
ess
Rol
es a
nd
Res
pon
sib
ilit
ies
It is
eac
h s
taff
mem
ber’
s re
spon
sibi
lity
to im
ple
men
t th
e st
and
ard
s in
her
/his
cla
ssro
om. A
llst
aff
mem
bers
wil
l m
eet
in g
rad
e le
vel
team
s, c
ross
-gra
de
leve
l su
bjec
t-ar
ea t
eam
s, o
r as
aw
hol
e st
aff
ever
y w
eek.
In
ad
dit
ion
, som
e st
aff
mem
bers
wil
l par
tici
pat
e on
th
e Le
ader
ship
Team
. Th
e ro
les
and
resp
onsi
bilit
ies
of e
ach
tea
m a
re d
efin
ed b
elow
.
Gra
de-l
evel
Tea
ms
The
pur
pose
s of
gra
de-l
evel
team
s ar
e to
mai
nta
in u
nit
y of
cur
ricu
lum
, in
stru
ctio
n, a
sses
smen
t,an
d to
impl
emen
t th
e st
anda
rds
at e
ach
gra
de le
vel.
♦Ev
ery
teac
her
will
par
tici
pate
in m
eeti
ngs
wit
h h
er o
r h
is g
rade
leve
l.♦
Teac
her
s w
ill c
oach
an
d su
ppor
t th
e im
plem
enta
tion
of
the
stan
dard
s an
d th
e vi
sion
inea
chot
her
’s c
lass
room
s.♦
Gra
de-l
evel
tea
ms
will
see
k su
ppor
t fr
om t
he
subj
ect-
area
tea
ms.
♦Te
ach
ers
will
stu
dy a
nd
supp
ort
each
oth
er’s
impl
emen
tati
on o
f be
st p
ract
ices
.♦
Supp
ort
staf
f w
ill b
e as
sign
ed t
o ap
prop
riat
e gr
ade
leve
l tea
ms.
♦G
rade
leve
l mee
tin
gs w
ill t
ake
plac
e in
th
e gr
ade
lead
er’s
cla
ssro
om.
Cro
ss-g
rade
-lev
el T
eam
sC
ross
-gra
de-l
evel
mee
tin
gs w
ill ta
ke p
lace
in th
e su
bjec
t are
a le
ader
’s c
lass
room
. The
pu
rpos
esof
the
cros
s-gr
ade-
leve
l tea
ms
are
to m
ain
tain
un
ity
of c
urri
culu
m, i
nst
ruct
ion
, an
d as
sess
men
t
Lea
ders
hip Le
ader
ship
Tea
mD
epar
tmen
tTe
ams
Smal
l Gro
upT e
ams
Pare
nt-
Teac
her
Ass
ocia
tion
Scho
olIm
prov
emen
tC
ounc
il
Port
folio
Lead
ersh
ipTe
am
Pers
on(s
)Re
spon
sible
Mea
sure
men
tSt
rate
gies
and
Act
iviti
esFu
ndin
gSo
urce
Impr
ovem
ent o
f ins
truc
tiona
l str
ateg
ies a
ndm
ater
ials:
1.A
ll te
ache
rs w
ill u
se th
e un
wra
pped
ess
entia
lst
anda
rds t
o ta
rget
inst
ruct
ion.
A.L
earn
ing
obje
ctiv
es w
ill b
e ba
sed
onas
sess
men
t dat
a.
B.Le
arni
ng o
bjec
tives
will
be
clea
rly
stat
ed.
C.S
tude
nts w
ill u
nder
stan
d th
e im
port
ance
of th
e le
arni
ng o
bjec
tive.
D.T
each
ers w
ill fr
eque
ntly
che
ck fo
run
ders
tand
ing
and
adju
st in
stru
ctio
n as
need
ed.
2.Ea
ch g
rade
leve
l use
s ass
essm
ents
that
are
com
mon
, for
mat
ive,
and
adm
inis
tere
dfr
eque
ntly
.
A.G
rade
leve
ls as
sess
eac
h es
sent
ial s
tand
ard,
and
cond
uct d
ata
team
mee
tings
for m
ost
of th
em.
B.G
rade
leve
ls an
d ou
r sch
oolw
ide-
data
team
look
at t
he d
ata
from
our
ass
essm
ents
tode
term
ine
the
effe
ctiv
enes
s of i
nstr
uctio
nal
stra
tegi
es a
nd p
rogr
ams.
Expe
nditu
res
Teac
hers
Ong
oing
Alig
nmen
t of i
nstru
ctio
n w
ith c
onte
nt st
anda
rds:
All g
rade
leve
ls ha
ve id
entif
ied
esse
ntia
l sta
ndar
ds fo
ral
l cur
ricul
ar ar
eas.
Each
esse
ntia
l sta
ndar
d ha
s bee
nun
wra
pped
(in
orde
r to
feat
ure n
eede
d pr
ereq
uisit
esk
ills a
nd co
ncep
ts), v
ertic
ally
alig
ned,
map
ped,
and
Estim
ated
Cos
t
Who
leSt
aff /
Gra
de-
Leve
lTe
ams
Ong
oing
Teac
hers
Ong
oing
Gra
de-L
evel
artic
ulat
ion
—tw
oar
ticul
atio
nda
ys p
ergr
ade
leve
l
$7,0
00Ti
tle I
/ Titl
eII
I
Lead
ersh
ipTe
am Stip
ends
$9,0
00Ti
tle I
/ QEI
A
$7,0
00Ti
tle I
Lite
racy
Lea
dsSt
ipen
ds
Esse
ntia
l sta
ndar
ds a
redo
cum
ente
d fo
r al
lcu
rric
ular
are
as fo
r al
lgr
ade
leve
ls. G
rade
-lev
elte
ams a
gree
on
the
stan
dard
s. C
ross
-gra
de-
leve
l tea
ms a
gree
on
the
Cla
ssro
om o
bser
vatio
nsth
at d
escr
ibe
wha
tin
stru
ctio
n an
d th
ecl
assr
oom
wou
ld lo
ok li
keif
RtI
impl
emen
ted
will
also
det
erm
ine
if te
ache
rsar
e:•u
sing
the
unw
rapp
edes
sent
ial s
tand
ards
tota
rget
inst
ruct
ion
•cre
atin
g cl
ear
lear
ning
obje
ctiv
es to
teac
h th
eun
wra
pped
ess
entia
lst
anda
rds a
nd to
mak
esu
re st
uden
ts u
nder
stan
dth
eir
impo
rtan
ce•c
heck
ing
for
unde
rsta
ndin
g an
dad
just
ing
inst
ruct
ion
asne
eded
•usi
ng g
rade
leve
las
sess
men
ts o
f eac
hes
sent
ial s
tand
ard
adm
inis
teri
ng C
FAs
ever
y 2-
3 w
eeks
•att
endi
ng d
ata
team
mee
tings
abo
ut th
eas
sess
men
t of e
ach
esse
ntia
l sta
ndar
d•u
sing
CA
FÉ/L
itera
cySt
udio
syst
em w
ithfid
elit
y
Act
ion
Plan
LOO
K FO
R IM
PLIC
ATIO
N C
OM
MO
NAL
ITIE
S FO
R M
ARYL
IN A
VEN
UE
ELEM
ENTA
RY S
CHO
OL
DEM
OG
RAPH
ICS
STU
DEN
T, S
TAFF
, PAR
ENT
QU
ESTI
ON
NAI
RES
PRO
CESS
DAT
AST
UD
ENT
LEAR
NIN
G
♦Th
e sch
ool p
erso
nnel
mig
ht n
eed
prof
essio
nal d
evel
opm
ent i
nbe
havi
or/r
espe
ct a
nd d
iver
sity
issue
s and
how
they
giv
e stu
dent
sfre
edom
and
choi
ces.
Staf
f mig
htal
so n
eed
to lo
ok in
to th
e iss
ues
of st
uden
ts b
eing
chal
leng
ed.
♦C
omm
unic
atio
n an
d sh
ared
lead
ersh
ip n
eeds
to im
prov
e.
♦Ar
e te
ache
rs p
repa
red
tote
ach
the
chan
ging
popu
latio
n? D
o te
ache
rskn
ow h
ow to
teac
h st
uden
tsw
ith E
nglis
h as
a se
cond
lang
uage
, tho
se w
ho li
ve in
pove
rty?
Wha
t are
the
impl
icat
ions
of t
each
ing
stud
ents
livi
ng in
pov
erty
?(P
erha
ps m
ore
mal
e an
dm
inor
ity te
ache
rs n
eed
tobe
recr
uite
d?)
♦D
oes t
he sc
hool
kno
w w
hyth
e mob
ility
rate
is h
igh,
and
whe
re st
uden
ts g
o? D
o th
eyst
ay in
the
dist
rict?
♦H
ow a
re n
ew st
uden
ts a
ndth
eir p
aren
ts w
elco
med
toth
e sch
ool?
How
do
teac
hers
know
wha
t the
new
stud
ents
know
and
are
abl
e to
do?
♦Ar
e mat
eria
ls, p
rogr
ams,
and
libra
ry b
ooks
app
ropr
iate
for t
he st
uden
t pop
ulat
ion
(e.g
., EL
, pov
erty
, mob
ile,
spec
ial e
duca
tion)
?♦
Why
are
ther
e so
man
ym
ales
iden
tifie
d fo
r spe
cial
educ
atio
n?♦
Is a
new
disc
iplin
e sy
stem
calle
d fo
r?
Mar
ylin
Ave
nue s
taff
need
s to—
♦Co
ntin
ue u
sing
scho
olw
ide d
ata
as th
ey h
ave i
n th
e pas
t to
help
them
kno
who
w th
e sy
stem
is d
oing
. Get
and
kee
p th
e da
taba
se u
p-to
-dat
e so
staf
f can
gaug
e pr
ogre
ss.
♦C
larif
y th
e as
sess
men
t sys
tem
:
*Ba
lanc
e it
with
var
iety
, inc
ludi
ng p
erfo
rman
ce a
sses
smen
ts a
nd st
uden
tse
lf-as
sess
men
ts.
*M
ake
sure
the
asse
ssm
ents
that
are
use
d ar
e te
lling
them
wha
t the
y ne
edto
hea
r to
know
how
to en
sure
stud
ent p
rofic
ienc
y.
*Fo
r mat
h an
d be
havi
or.
*St
ream
line t
he p
re-r
efer
ral p
roce
ss, e
spec
ially
the f
orm
com
plet
ion
proc
ess.
*W
hat s
taff
does
whe
n st
uden
ts a
re p
rofic
ient
on
benc
hmar
ks.
♦Im
prov
e Rt
I:
*U
nder
stan
d w
hy st
uden
ts w
ho h
ave
been
thro
ugh
inte
rven
tions
are
not
prof
icie
nt. D
o a
prob
lem
-sol
ving
cycl
e to
bet
ter u
nder
stan
d.
*C
ontin
ue to
pro
vide
pro
fess
iona
l dev
elop
men
t for
all
staf
f so
ever
yone
can
unde
rsta
nd it
and
impl
emen
t it i
n th
e sa
me
way
.
*Im
plem
ent a
teac
her s
elf-a
sses
smen
t and
gra
de le
vel s
elf a
sses
smen
t sys
tem
to h
elp
impl
emen
t the
visi
on an
d th
e RtI
syste
m w
ith in
tegr
ity an
d fid
elity
thro
ugho
ut th
e sc
hool
. Ide
ntify
inte
rnal
qua
lity
mea
sure
s.
*C
larif
y w
hat t
he v
ision
and
RtI
wou
ld lo
ok li
ke w
hen
impl
emen
ted.
*Im
prov
e our
pee
r coa
chin
g sy
stem
: sup
port
and
prov
ide g
uida
nce f
or n
ewin
stru
ctio
n an
d as
sess
men
t str
ateg
ies.
Prov
ide
time
to d
evel
op n
ew sk
ills
and
impr
ove
leve
l 1.
♦U
pdat
e, im
prov
e, an
d fo
llow
the
scho
ol im
prov
emen
t pla
n.♦
Impr
ove
shar
ed d
ecisi
on m
akin
g an
d le
ader
ship
: Def
ine,
impl
emen
t, an
dco
mm
unic
ate.
♦C
larif
y w
in-w
in p
artn
ersh
ips w
ith p
aren
ts. M
ake
sure
par
tner
s kno
w th
evi
sion
and
miss
ion
of th
e sc
hool
.♦
Ensu
re cr
oss-
grad
e-le
vel w
ork
impr
oves
to im
plem
ent t
he v
ision
and
RtI
cons
isten
tly, a
nd to
also
ensu
re th
at a
cont
inuu
m o
f lea
rnin
g m
akes
sens
efo
r the
stud
ents
.
♦H
ow is
ELA
bei
ng ta
ught
? How
isEL
A be
ing
mea
sure
d on
an
ongo
ing
basis
?.♦
How
is M
ath
bein
g ta
ught
? How
isM
ath
bein
g m
easu
red
on an
ong
oing
basis
?♦
Did
teac
hers
focu
s too
muc
h on
the
stud
ents
not
pro
ficie
nt? D
o al
lte
ache
rs k
now
wha
t to
do w
hen
stud
ents
are
pro
ficie
nt?
© E
duca
tion
for
the
Futu
re, C
hico
, CA
(ht
tp:/
/eff
.csu
chic
o.ed
u)
NESA Fall Leadership Conference, "Data, Data Everywhere," Victoria L. Bernhardt, Education for the Future (http://eff.csuchico.edu) Page 27 of 39
QUALITY PLANNINGQUALITY PLANNING
“Vision without action is merelya dream. Action without vision
just passes the time. Vision withaction can change the world”
Joel A. Barker
QUALITY PLANNINGQUALITY PLANNING
Mission, vision, goals.
One action plan to vision.
Budget matches action plan.
NESA Fall Leadership Conference, "Data, Data Everywhere," Victoria L. Bernhardt, Education for the Future (http://eff.csuchico.edu) Page 28 of 39
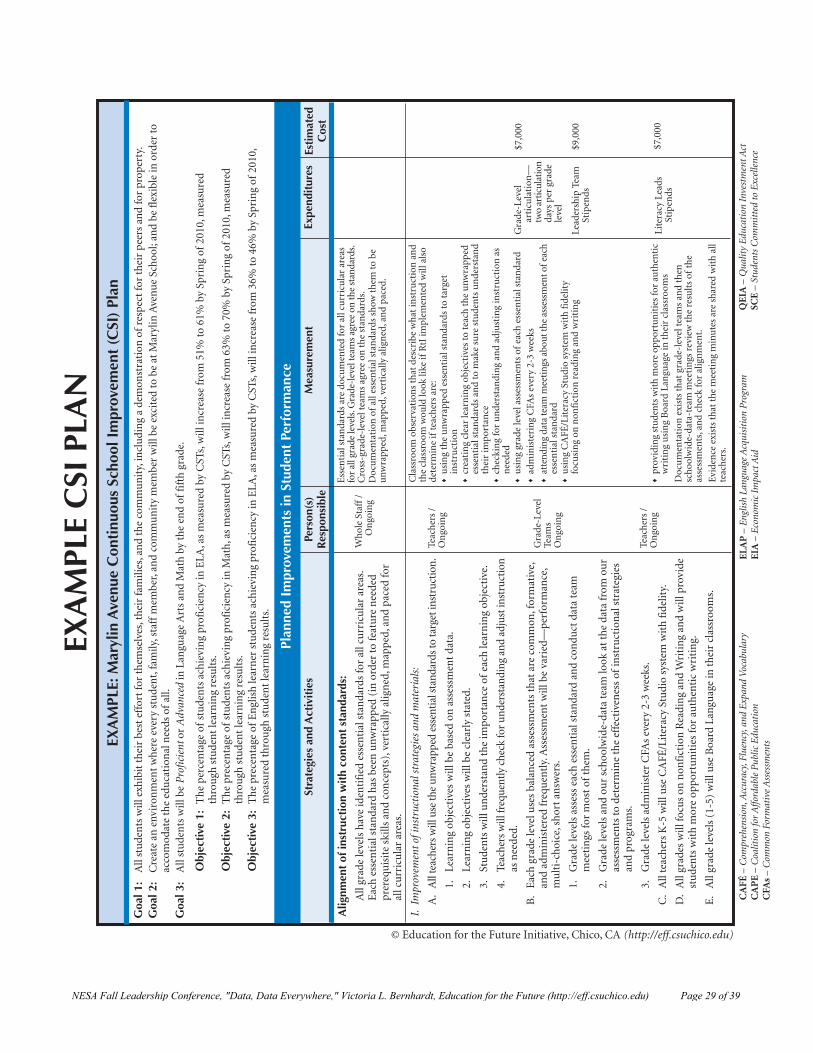
NESA Fall Leadership Conference, "Data, Data Everywhere," Victoria L. Bernhardt, Education for the Future (http://eff.csuchico.edu) Page 29 of 39
LEADERSHIPLEADERSHIP
“An essential factor in leadership
is the capacity to influence and
organize meaning for the
members of the organization.”
Tom Peters
LEADERSHIPLEADERSHIP
Assists everyone in theorganization in implementingthe vision.
Structures in alignment withthe vision.
Roles and responsibilities.
Effective meetings.
NESA Fall Leadership Conference, "Data, Data Everywhere," Victoria L. Bernhardt, Education for the Future (http://eff.csuchico.edu) Page 30 of 39
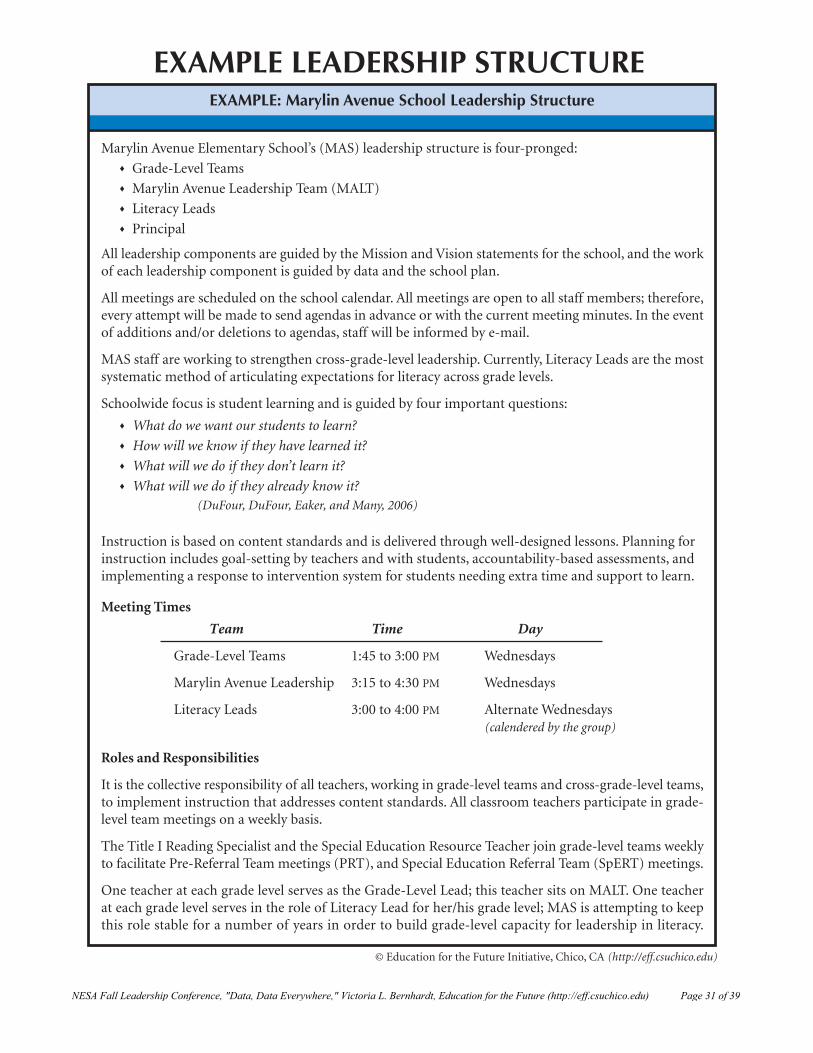
NESA Fall Leadership Conference, "Data, Data Everywhere," Victoria L. Bernhardt, Education for the Future (http://eff.csuchico.edu) Page 31 of 39
PROFESSIONAL LEARNINGPROFESSIONAL LEARNING
“It’s easy to get the players.
Getting ‘em to play together,
that’s the hard part.”
Casey Stengel
PROFESSIONAL LEARNINGPROFESSIONAL LEARNING
Includes everyone on the staff.
How to implement the vision.
Imbedded into the workweek.
NESA Fall Leadership Conference, "Data, Data Everywhere," Victoria L. Bernhardt, Education for the Future (http://eff.csuchico.edu) Page 32 of 39
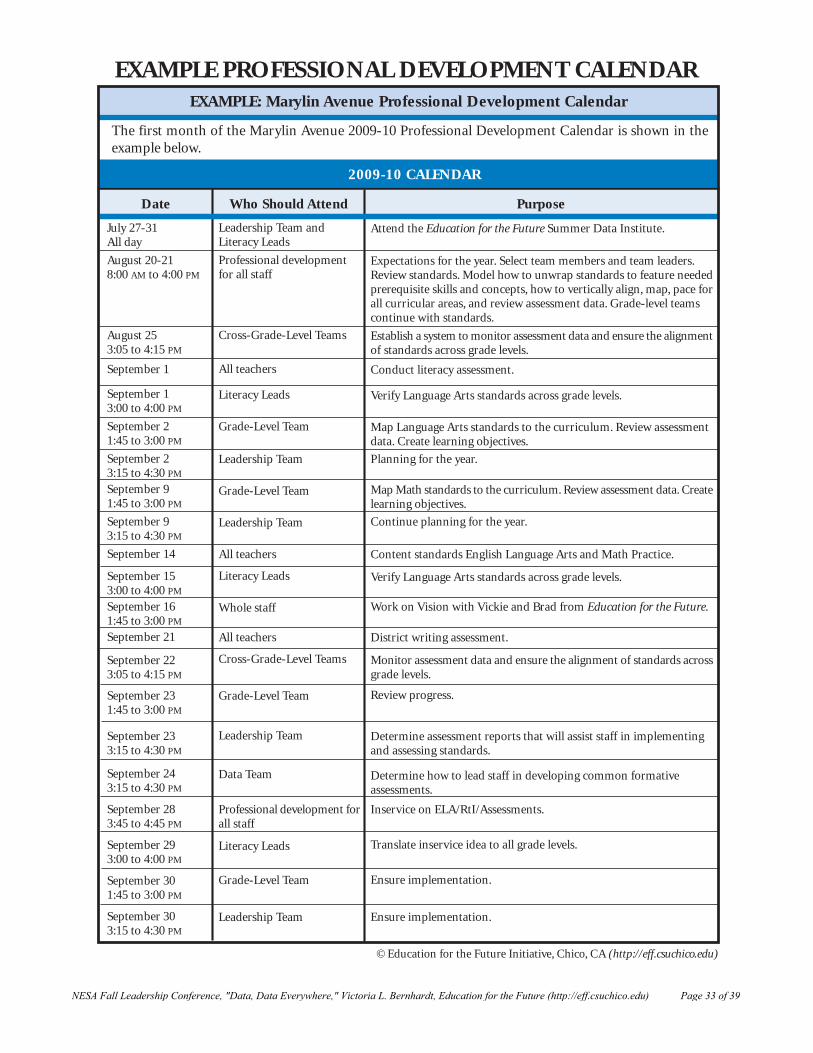
EXAMPLE: Marylin Avenue Professional Development Calendar
The first month of the Marylin Avenue 2009-10 Professional Development Calendar is shown in theexample below.
July 27-31All day
August 20-218:00 AM to 4:00 PM
August 253:05 to 4:15 PM
September 1
September 13:00 to 4:00 PM
September 21:45 to 3:00 PM
September 23:15 to 4:30 PM
September 91:45 to 3:00 PM
September 93:15 to 4:30 PM
September 14
September 153:00 to 4:00 PM
September 161:45 to 3:00 PM
September 21
September 223:05 to 4:15 PM
September 231:45 to 3:00 PM
September 233:15 to 4:30 PM
September 243:15 to 4:30 PM
September 283:45 to 4:45 PM
September 293:00 to 4:00 PM
September 301:45 to 3:00 PM
September 303:15 to 4:30 PM
Attend the Education for the Future Summer Data Institute.
Expectations for the year. Select team members and team leaders.Review standards. Model how to unwrap standards to feature neededprerequisite skills and concepts, how to vertically align, map, pace forall curricular areas, and review assessment data. Grade-level teamscontinue with standards.
Establish a system to monitor assessment data and ensure the alignmentof standards across grade levels.
Conduct literacy assessment.
Verify Language Arts standards across grade levels.
Map Language Arts standards to the curriculum. Review assessmentdata. Create learning objectives.
Planning for the year.
Map Math standards to the curriculum. Review assessment data. Createlearning objectives.
Continue planning for the year.
Content standards English Language Arts and Math Practice.
Verify Language Arts standards across grade levels.
Work on Vision with Vickie and Brad from Education for the Future.
District writing assessment.
Monitor assessment data and ensure the alignment of standards acrossgrade levels.
Review progress.
Determine assessment reports that will assist staff in implementingand assessing standards.
Determine how to lead staff in developing common formativeassessments.
Inservice on ELA/RtI/Assessments.
Translate inservice idea to all grade levels.
Ensure implementation.
Ensure implementation.
Leadership Team andLiteracy Leads
Professional developmentfor all staff
Cross-Grade-Level Teams
All teachers
Literacy Leads
Grade-Level Team
Leadership Team
Grade-Level Team
Leadership Team
All teachers
Literacy Leads
Whole staff
All teachers
Cross-Grade-Level Teams
Grade-Level Team
Leadership Team
Data Team
Professional development forall staff
Literacy Leads
Grade-Level Team
Leadership Team
Date Who Should Attend Purpose
2009-10 CALENDAR
EXAMPLE PROFESSIONAL DEVELOPMENT CALENDAR
© Education for the Future Initiative, Chico, CA (http://eff.csuchico.edu)
NESA Fall Leadership Conference, "Data, Data Everywhere," Victoria L. Bernhardt, Education for the Future (http://eff.csuchico.edu) Page 33 of 39
“The key to effective
partnerships—Both parties
must contribute and both
parties must benefit.”
Jere Jacobs
PARTNERSHIP DEVELOPMENTPARTNERSHIP DEVELOPMENT
PARTNERSHIP DEVELOPMENTPARTNERSHIP DEVELOPMENT
Start with what we expectstudents to know and be ableto do.
Collaborate with: Parents Community Businesses
NESA Fall Leadership Conference, "Data, Data Everywhere," Victoria L. Bernhardt, Education for the Future (http://eff.csuchico.edu) Page 34 of 39
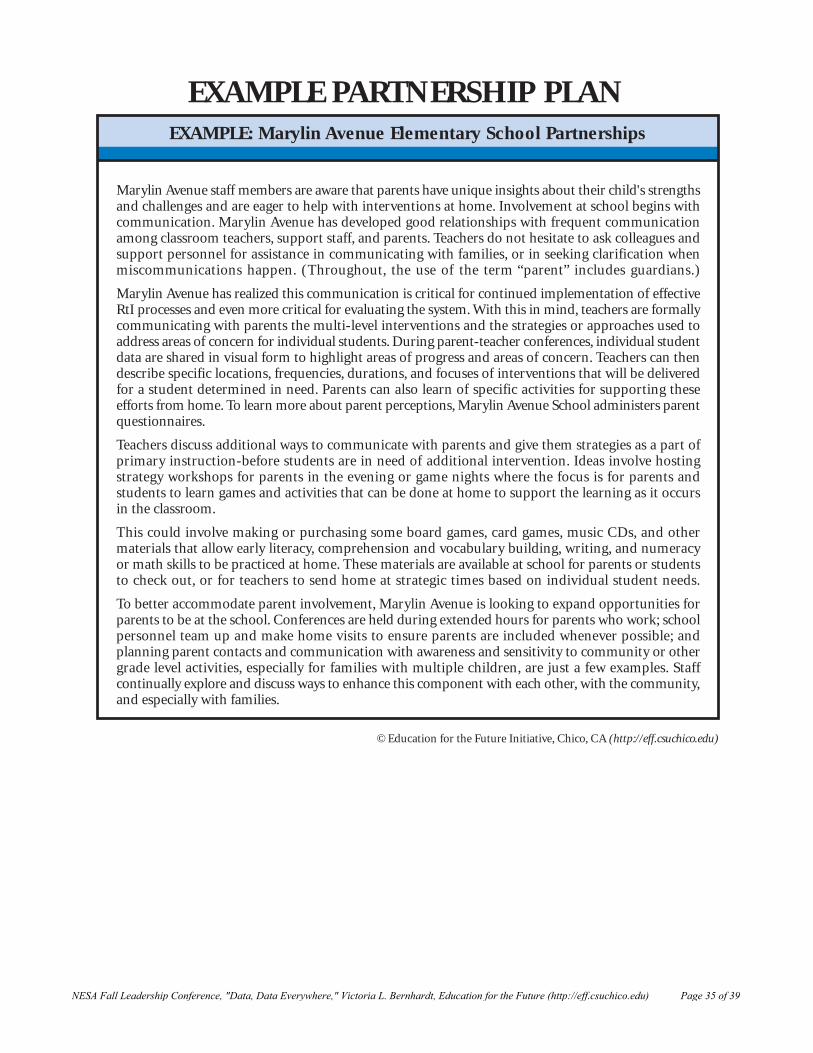
Marylin Avenue staff members are aware that parents have unique insights about their child's strengthsand challenges and are eager to help with interventions at home. Involvement at school begins withcommunication. Marylin Avenue has developed good relationships with frequent communicationamong classroom teachers, support staff, and parents. Teachers do not hesitate to ask colleagues andsupport personnel for assistance in communicating with families, or in seeking clarification whenmiscommunications happen. (Throughout, the use of the term “parent” includes guardians.)
Marylin Avenue has realized this communication is critical for continued implementation of effectiveRtI processes and even more critical for evaluating the system. With this in mind, teachers are formallycommunicating with parents the multi-level interventions and the strategies or approaches used toaddress areas of concern for individual students. During parent-teacher conferences, individual studentdata are shared in visual form to highlight areas of progress and areas of concern. Teachers can thendescribe specific locations, frequencies, durations, and focuses of interventions that will be deliveredfor a student determined in need. Parents can also learn of specific activities for supporting theseefforts from home. To learn more about parent perceptions, Marylin Avenue School administers parentquestionnaires.
Teachers discuss additional ways to communicate with parents and give them strategies as a part ofprimary instruction-before students are in need of additional intervention. Ideas involve hostingstrategy workshops for parents in the evening or game nights where the focus is for parents andstudents to learn games and activities that can be done at home to support the learning as it occursin the classroom.
This could involve making or purchasing some board games, card games, music CDs, and othermaterials that allow early literacy, comprehension and vocabulary building, writing, and numeracyor math skills to be practiced at home. These materials are available at school for parents or studentsto check out, or for teachers to send home at strategic times based on individual student needs.
To better accommodate parent involvement, Marylin Avenue is looking to expand opportunities forparents to be at the school. Conferences are held during extended hours for parents who work; schoolpersonnel team up and make home visits to ensure parents are included whenever possible; andplanning parent contacts and communication with awareness and sensitivity to community or othergrade level activities, especially for families with multiple children, are just a few examples. Staffcontinually explore and discuss ways to enhance this component with each other, with the community,and especially with families.
EXAMPLE: Marylin Avenue Elementary School Partnerships
EXAMPLE PARTNERSHIP PLAN
© Education for the Future Initiative, Chico, CA (http://eff.csuchico.edu)
NESA Fall Leadership Conference, "Data, Data Everywhere," Victoria L. Bernhardt, Education for the Future (http://eff.csuchico.edu) Page 35 of 39
CONTINUOUS IMPROVEMENTCONTINUOUS IMPROVEMENTAND EVALUATIONAND EVALUATION
“Continuous improvementcauses us to think about
upstream process improvement;not downstream damage control.”
Teams & Tools
CONTINUOUS IMPROVEMENTCONTINUOUS IMPROVEMENTAND EVALUATIONAND EVALUATION
Align elements to vision.
Systems thinking.
Next steps.
Evaluate all parts of the system.
NESA Fall Leadership Conference, "Data, Data Everywhere," Victoria L. Bernhardt, Education for the Future (http://eff.csuchico.edu) Page 36 of 39
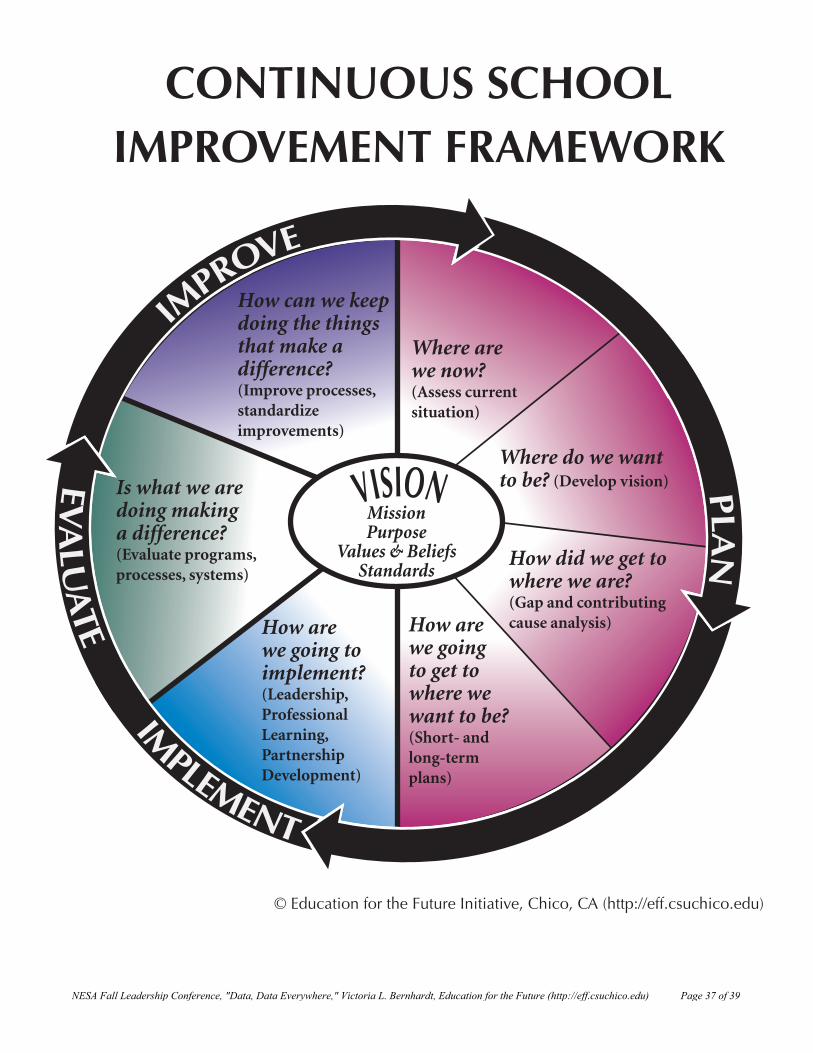
VISION
Where arewe now?(Assess current situation)
How arewe going to implement? (Leadership, Professional Learning, Partnership Development)
Is what we aredoing makinga difference?(Evaluate programs, processes, systems)
How can we keepdoing the things that make a difference?(Improve processes, standardize improvements)
MissionPurpose
Values & BeliefsStandards
Where do we wantto be? (Develop vision)
How did we get to where we are?(Gap and contributingcause analysis)How are
we goingto get to where we want to be? (Short- and long-term plans)
© Education for the Future Initiative, Chico, CA (http://eff.csuchico.edu)
CONTINUOUS SCHOOLIMPROVEMENT FRAMEWORK
PLAN
IMPROVE
IM
PLEMENT
EVA
LUA
TE
NESA Fall Leadership Conference, "Data, Data Everywhere," Victoria L. Bernhardt, Education for the Future (http://eff.csuchico.edu) Page 37 of 39
CONTINUOUS IMPROVEMENTCONTINUOUS IMPROVEMENTis the process of using
data to continually improveall aspects of the
learning organization.
Clarify whom they have as students. Understand where the learning organization
is right now on all measures. Consider processes, as well as results. Create a vision that will make a difference
for whom they have as students. Help everyone get on the same page with
understanding how to achieve a vision. Know if what the learning organization is
doing is making a difference.
CONTINUOUSLY IMPROVINGCONTINUOUSLY IMPROVINGSCHOOLS USE DATA TOSCHOOLS USE DATA TO——
If you are not monitoringand measuring program
implementation, theprogram probably
does not exist.
EVALUATING SCHOOLEVALUATING SCHOOLPROGRAMS AND PROCESSESPROGRAMS AND PROCESSES
NESA Fall Leadership Conference, "Data, Data Everywhere," Victoria L. Bernhardt, Education for the Future (http://eff.csuchico.edu) Page 38 of 39
Challenge current processes with data.
Inspire a shared vision.
Enable others to act.
Model the way.
Encourage the heart.
The Leadership Challenge
LEADERSHIPLEADERSHIP
THANK YOU!THANK YOU!Victoria L. Bernhardt, Ph.D.Victoria L. Bernhardt, Ph.D.Executive DirectorExecutive DirectorEducation for the FutureEducation for the [email protected]@csuchico.eduhttp://http://eff.csuchico.edueff.csuchico.edu
NESA Fall Leadership Conference, "Data, Data Everywhere," Victoria L. Bernhardt, Education for the Future (http://eff.csuchico.edu) Page 39 of 39
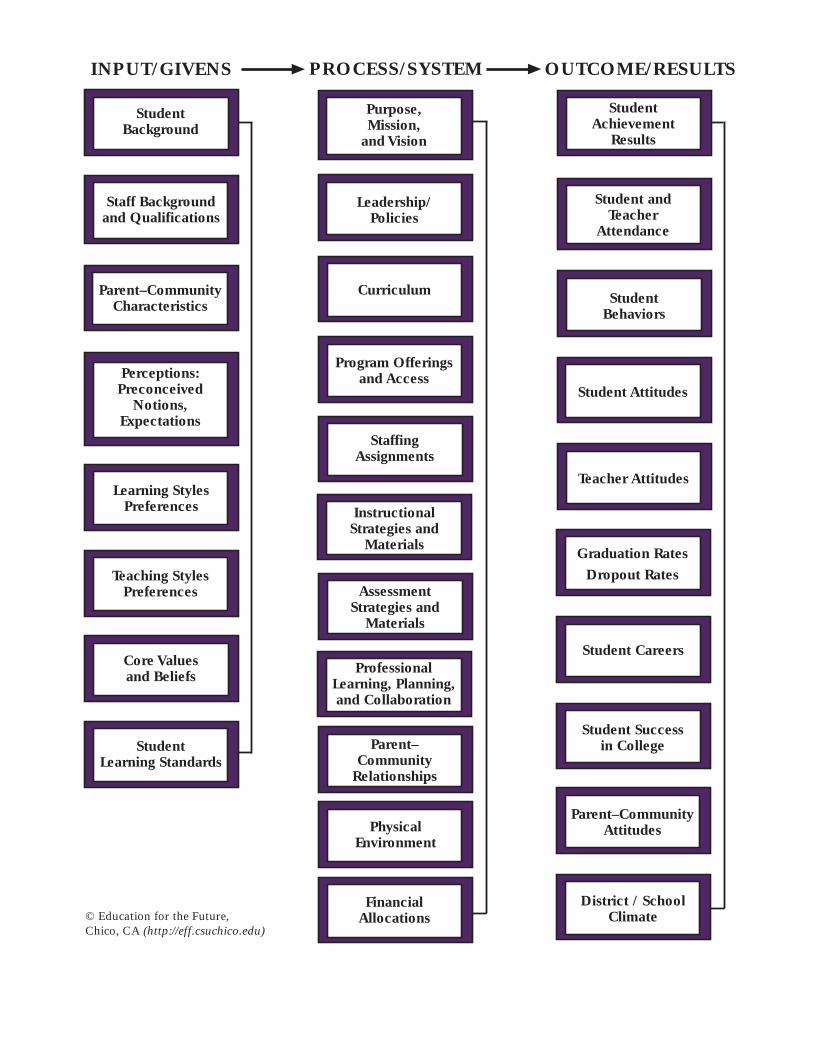
© Education for the Future,Chico, CA (http://eff.csuchico.edu)
PROCESS/SYSTEM OUTCOME/RESULTSINPUT/GIVENS
Leadership/Policies
Curriculum
Parent–Community
Relationships
Program Offeringsand Access
PhysicalEnvironment
StudentAchievement
Results
Student andTeacher
Attendance
StudentBehaviors
StudentBackground
Learning StylesPreferences
Teaching StylesPreferences
Staff Backgroundand Qualifications
Perceptions:Preconceived
Notions,Expectations
Student Attitudes
Graduation RatesDropout Rates
Teacher Attitudes
Student Careers
Student Successin College
Core Valuesand Beliefs
Purpose,Mission,
and Vision
Parent–CommunityCharacteristics
StudentLearning Standards
Parent–CommunityAttitudes
District / SchoolClimate
ProfessionalLearning, Planning,and Collaboration
StaffingAssignments
AssessmentStrategies and
Materials
InstructionalStrategies and
Materials
FinancialAllocations
Related Documents