2013-14 Fall RESA Training for School Counselors Linda H. Brannan NCDPI Consultant K-12 Student Support Services [email protected] Data! Data! Data! Find, Understand and Use Data to Develop Comprehensive School Counseling Programs

Data ! Data! Data!
Feb 22, 2016
Data ! Data! Data! Find, Understand and Use Data to Develop Comprehensive School Counseling Programs. 2013-14 Fall RESA Training for School Counselors Linda H. Brannan NCDPI Consultant K-12 Student Support Services [email protected]. School Counseling Wikispace. - PowerPoint PPT Presentation
Welcome message from author
This document is posted to help you gain knowledge. Please leave a comment to let me know what you think about it! Share it to your friends and learn new things together.
Transcript
2013-14 Fall RESA Training for School Counselors
Linda H. BrannanNCDPI Consultant
K-12 Student Support [email protected]
Data! Data! Data!
Find, Understand and Use Data to Develop Comprehensive School
Counseling Programs
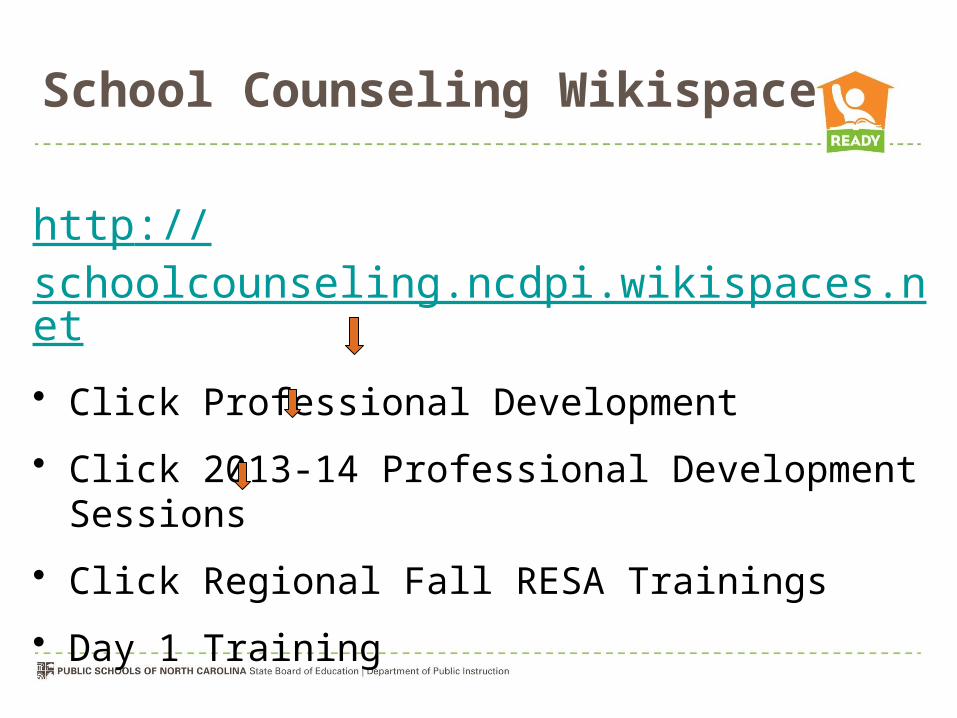
School Counseling Wikispace
http://schoolcounseling.ncdpi.wikispaces.net• Click Professional Development
• Click 2013-14 Professional Development Sessions
• Click Regional Fall RESA Trainings
• Day 1 Training
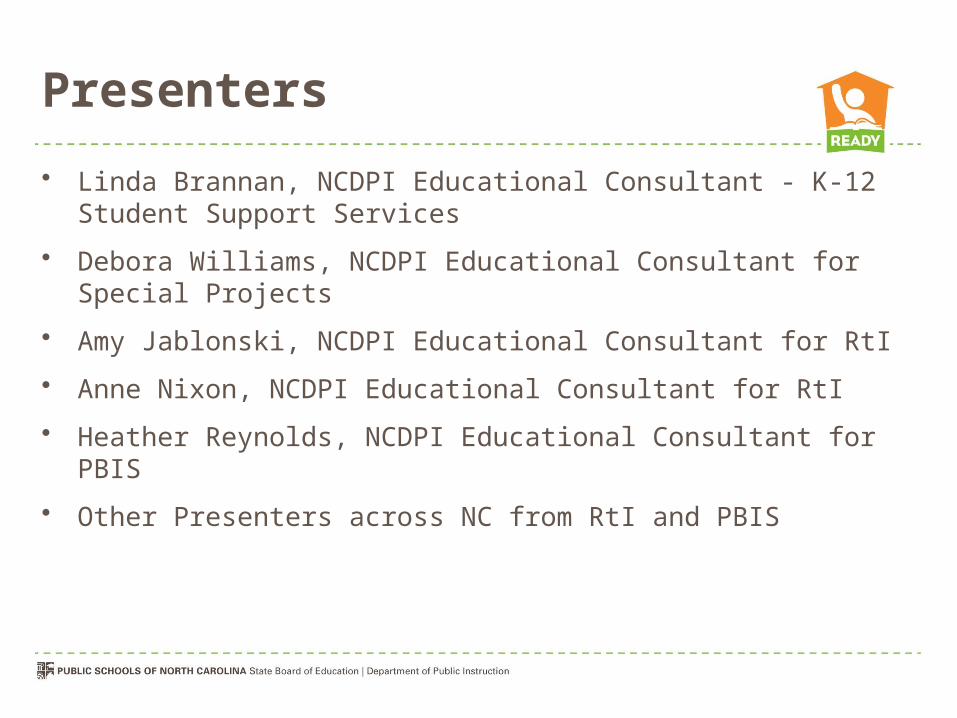
Presenters• Linda Brannan, NCDPI Educational Consultant - K-12 Student Support
Services
• Debora Williams, NCDPI Educational Consultant for Special Projects
• Amy Jablonski, NCDPI Educational Consultant for RtI
• Anne Nixon, NCDPI Educational Consultant for RtI
• Heather Reynolds, NCDPI Educational Consultant for PBIS
• Other Presenters across NC from RtI and PBIS
Training Purpose – Train the trainer
1. To understand how to develop a comprehensive school counseling program that meets the needs of all students using data-driven decisions
2. To move beyond simple collection of data to using the collected data to solve problems
3. To understand the tools within the NC Framework for School Counseling (ASCA National Model)
4. To understand the job description and the new School Counselor Evaluation
Now…. 21st Century School Counselor
Leadership
Advocacy
Collaboration“Implement a data driven, comprehensive, developmental school counseling program to promote systemic change to increase college and career readiness for all students.”

New Question for School Counselors
How are students different as a result of the School Counseling Program?
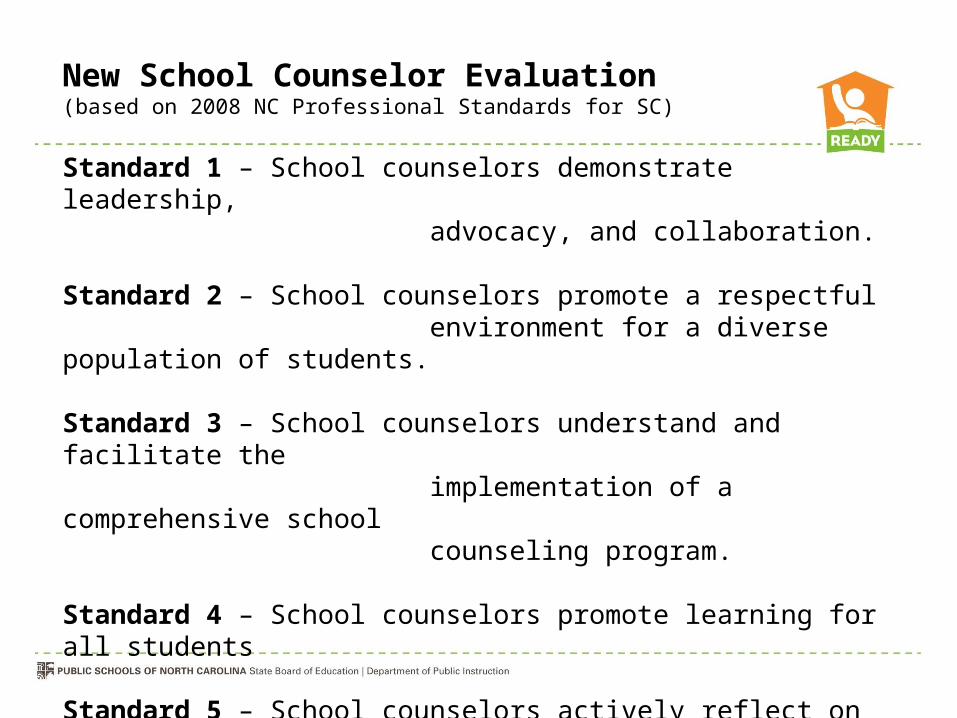
New School Counselor Evaluation (based on 2008 NC Professional Standards for SC)
Standard 1 – School counselors demonstrate leadership, advocacy, and collaboration.
Standard 2 – School counselors promote a respectful environment for a diverse population of students.
Standard 3 – School counselors understand and facilitate the implementation of a comprehensive school counseling program.
Standard 4 – School counselors promote learning for all students
Standard 5 – School counselors actively reflect on their practice.No Standard 6 or 8
School Counselor Job Description• Purpose – utilize leadership, advocacy and
collaboration to promote student success, provide preventive services, and respond to student needs
• Role – develop and deliver a comprehensive school counseling program that addresses academic, career and personal/social development for all students
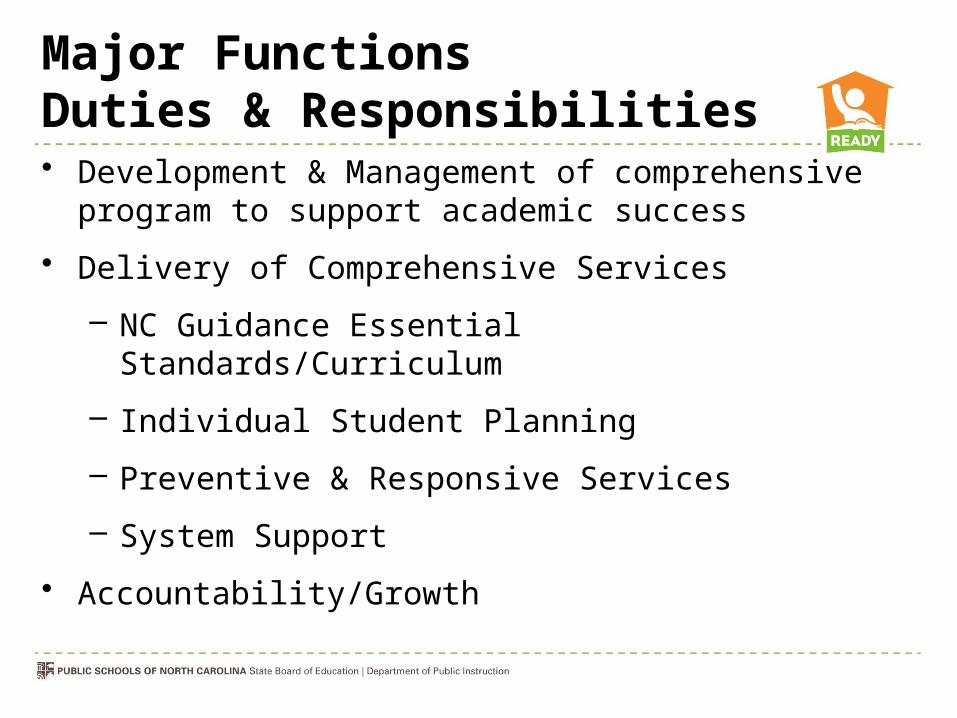
Major FunctionsDuties & Responsibilities • Development & Management of comprehensive program to
support academic success
• Delivery of Comprehensive Services
– NC Guidance Essential Standards/Curriculum
– Individual Student Planning
– Preventive & Responsive Services
– System Support
• Accountability/Growth
School Counselor Job Description
Think Time
• Review the Job Description
• Jot down a few “aha’s”
• Share with a colleague
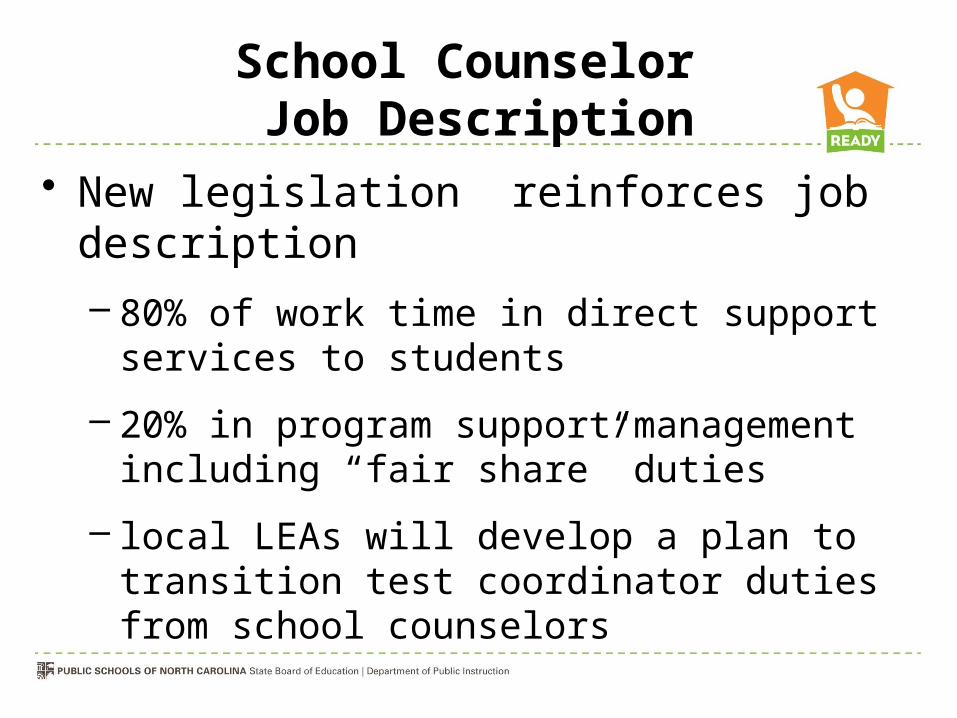
School Counselor Job Description
• New legislation reinforces job description– 80% of work time in direct support services to
students
– 20% in program support/management including “fair share” duties
– local LEAs will develop a plan to transition test coordinator duties from school counselors
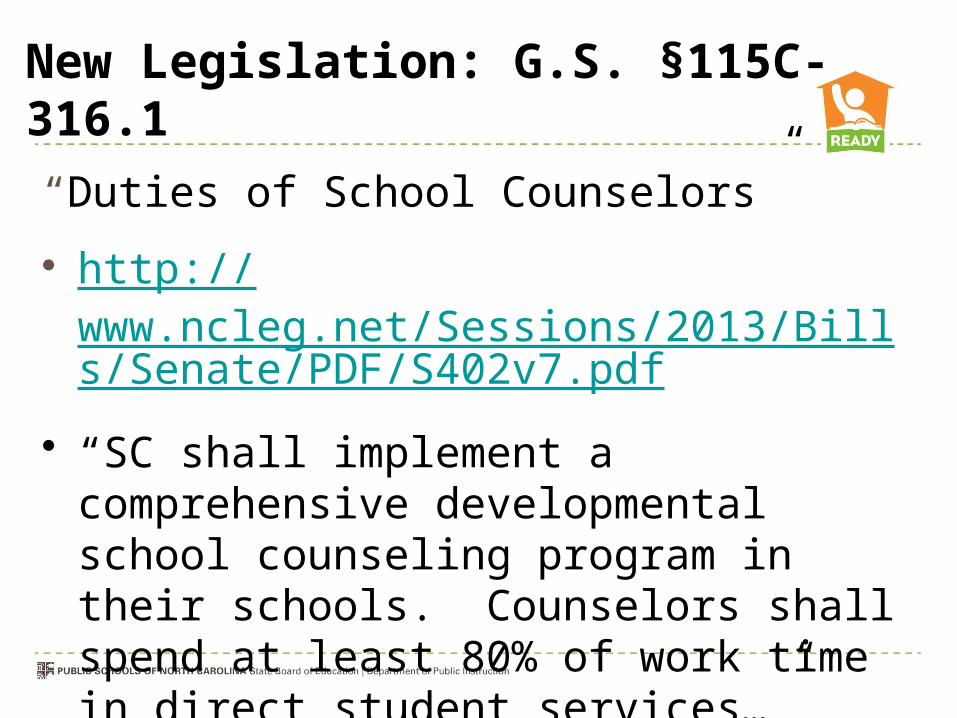
New Legislation: G.S. §115C-316.1 “Duties of School Counselors”
• http://www.ncleg.net/Sessions/2013/Bills/Senate/PDF/S402v7.pdf
• “SC shall implement a comprehensive developmental school counseling program in their schools. Counselors shall spend at least 80% of work time in direct student services…”

Framework for NC School Counseling
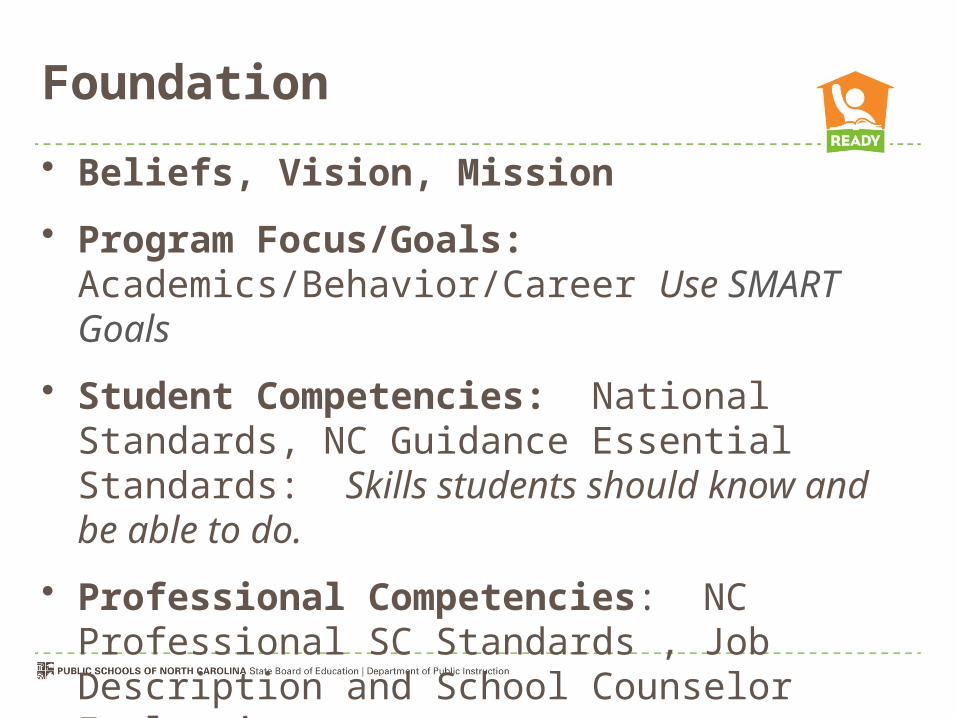
Foundation• Beliefs, Vision, Mission• Program Focus/Goals:
Academics/Behavior/Career Use SMART Goals • Student Competencies: National Standards, NC
Guidance Essential Standards: Skills students should know and be able to do.
• Professional Competencies: NC Professional SC Standards , Job Description and School Counselor Evaluation
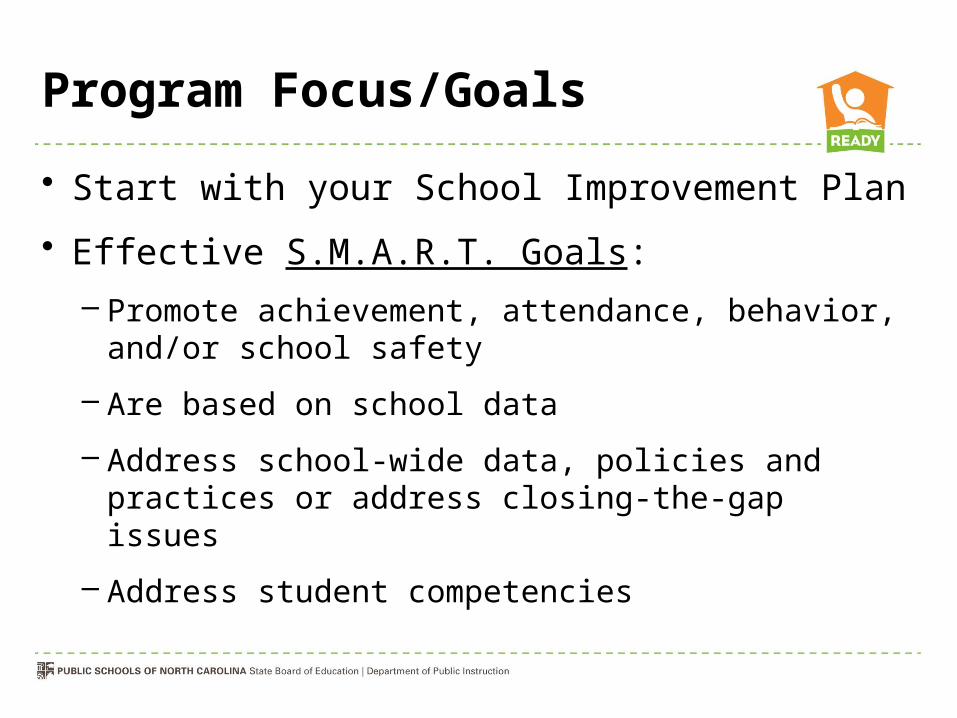
Program Focus/Goals
• Start with your School Improvement Plan
• Effective S.M.A.R.T. Goals:– Promote achievement, attendance, behavior,
and/or school safety
– Are based on school data
– Address school-wide data, policies and practices or address closing-the-gap issues
– Address student competencies
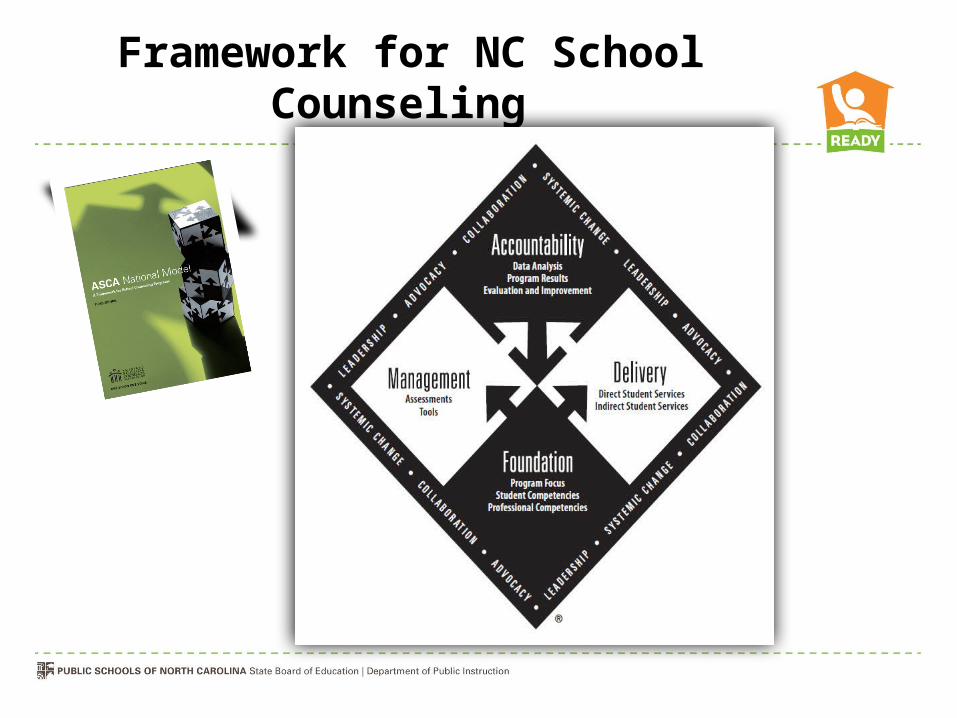
Framework for NC School Counseling
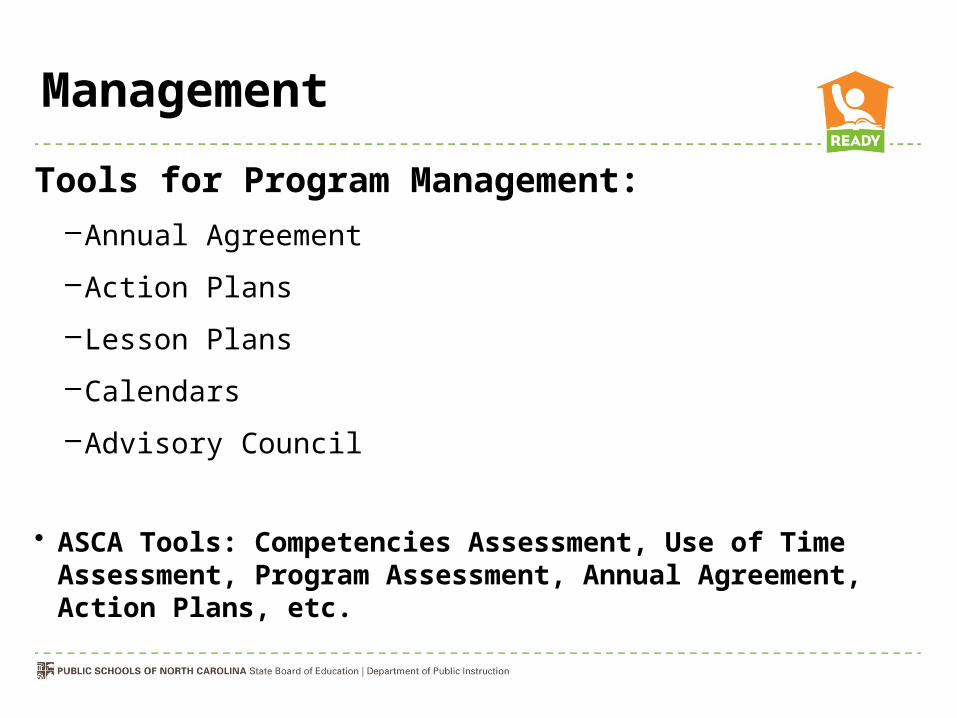
Management
Tools for Program Management:– Annual Agreement
– Action Plans
– Lesson Plans
– Calendars
– Advisory Council
• ASCA Tools: Competencies Assessment, Use of Time Assessment, Program Assessment, Annual Agreement, Action Plans, etc.
Calendars
• How detailed are your calendars?
• Can you see how you spend your time?
• Program Calendars - Monthly
• Individual Calendars - Weekly

Annual Agreement and Advisory Council
• Annual Agreement: – a tool to use with administrator/evaluator to
develop/refine the SC Program for the current year – use D3M
• Table Groups: Discuss how you may use this tool to communicate your program goals and meet criteria of SC Evaluation
• Advisory Council:– Group of stakeholders to INFORM your program
– This is your moment to SHINE
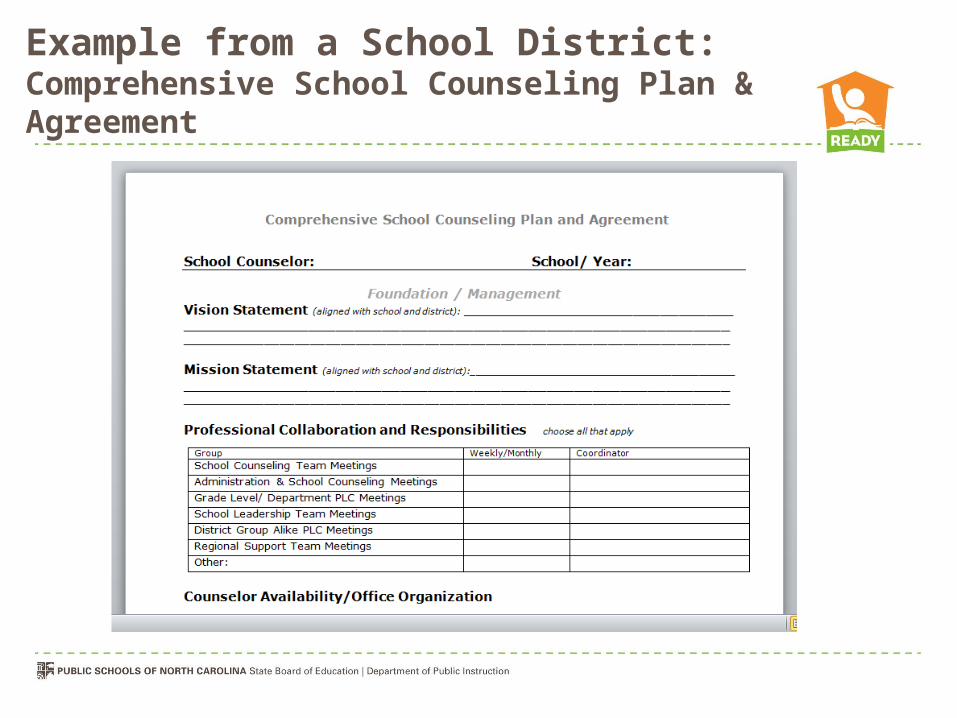
Example from a School District:Comprehensive School Counseling Plan & Agreement
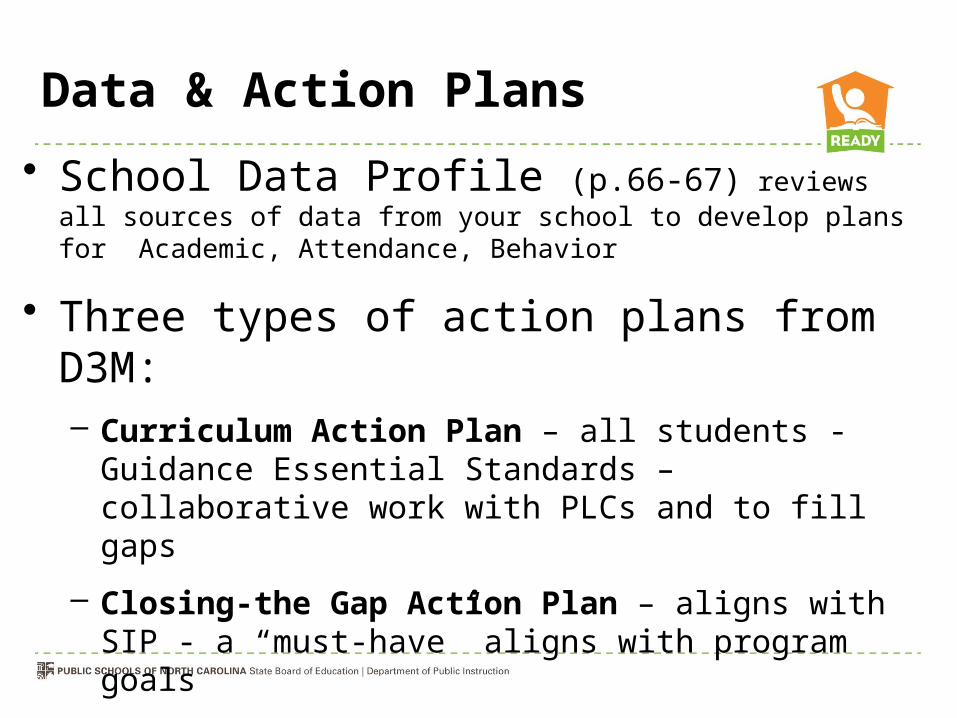
Data & Action Plans• School Data Profile (p.66-67) reviews all sources of data
from your school to develop plans for Academic, Attendance, Behavior
• Three types of action plans from D3M:– Curriculum Action Plan – all students - Guidance
Essential Standards – collaborative work with PLCs and to fill gaps
– Closing-the Gap Action Plan – aligns with SIP - a “must-have” aligns with program goals
– Small Group Plan – specific need(s) of a few
Data, Data, Data
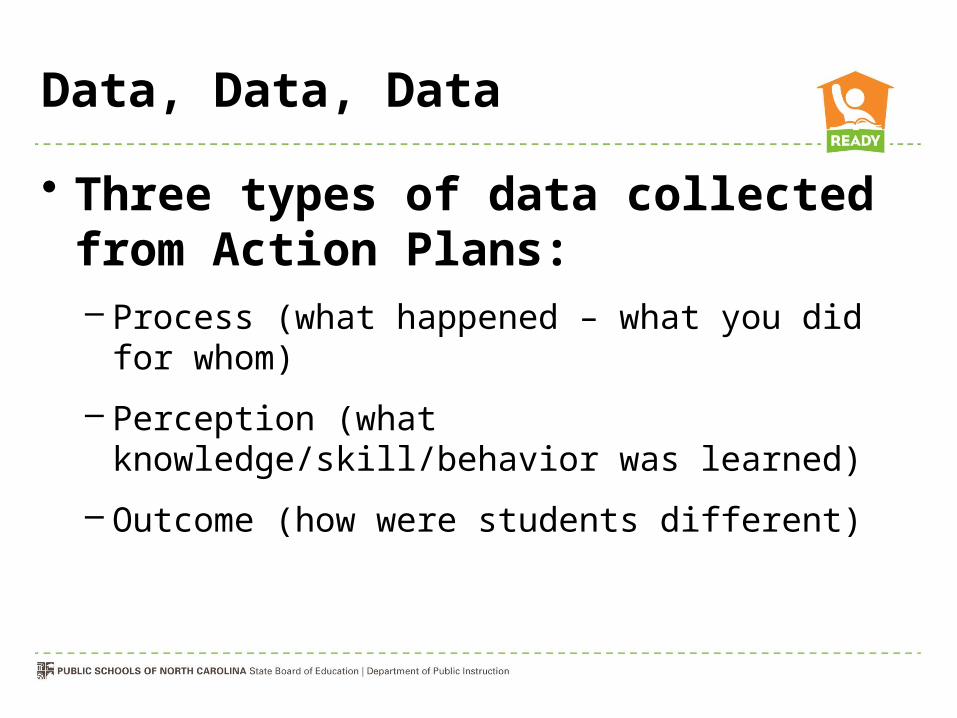
• Three types of data collected from Action Plans:– Process (what happened – what you did for
whom)
– Perception (what knowledge/skill/behavior was learned)
– Outcome (how were students different)

Framework for NC School Counseling
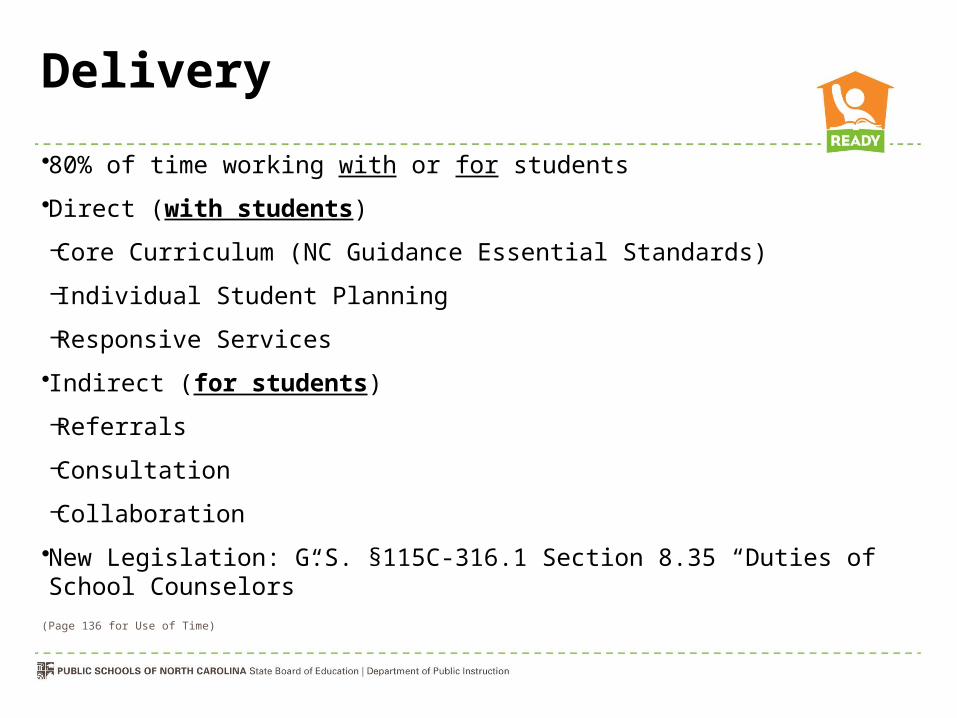
Delivery• 80% of time working with or for students
• Direct (with students)
– Core Curriculum (NC Guidance Essential Standards)
– Individual Student Planning
– Responsive Services
• Indirect (for students)
– Referrals
– Consultation
– Collaboration
• New Legislation: G.S. §115C-316.1 Section 8.35 “Duties of School Counselors”
(Page 136 for Use of Time)

Framework for NC School Counseling
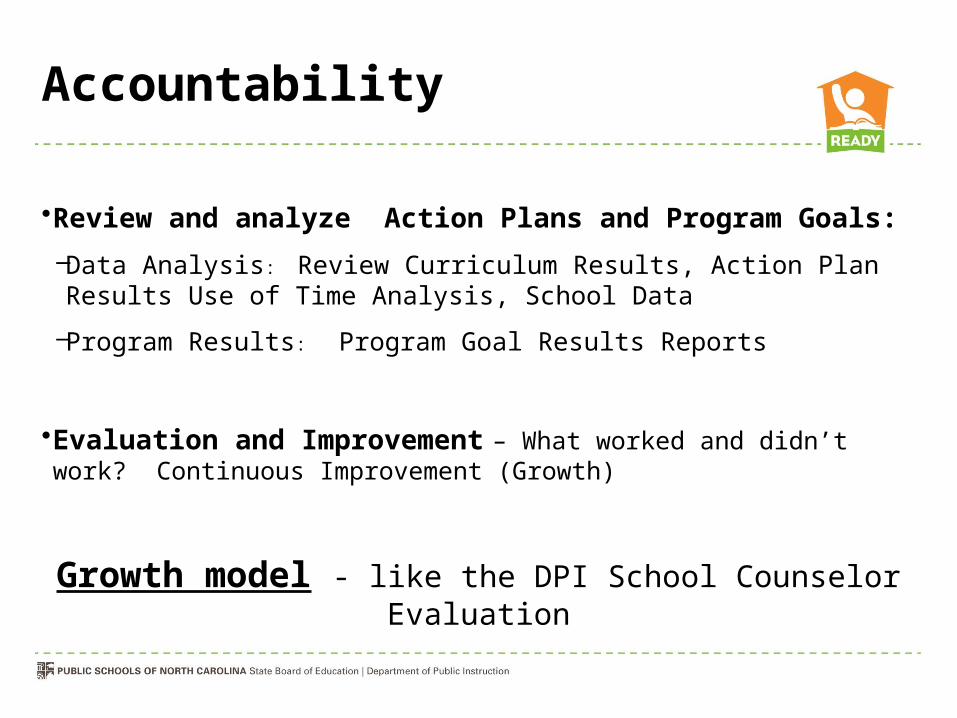
Accountability
• Review and analyze Action Plans and Program Goals:– Data Analysis: Review Curriculum Results, Action Plan Results
Use of Time Analysis, School Data
– Program Results: Program Goal Results Reports
• Evaluation and Improvement – What worked and didn’t work? Continuous Improvement (Growth)
Growth model - like the DPI School Counselor Evaluation

Types of Data
Data/Assessment Tool Choice
Measurement of student growth; assessment tool choice is dependent on the purpose and use of measurement results- RtI Action Network
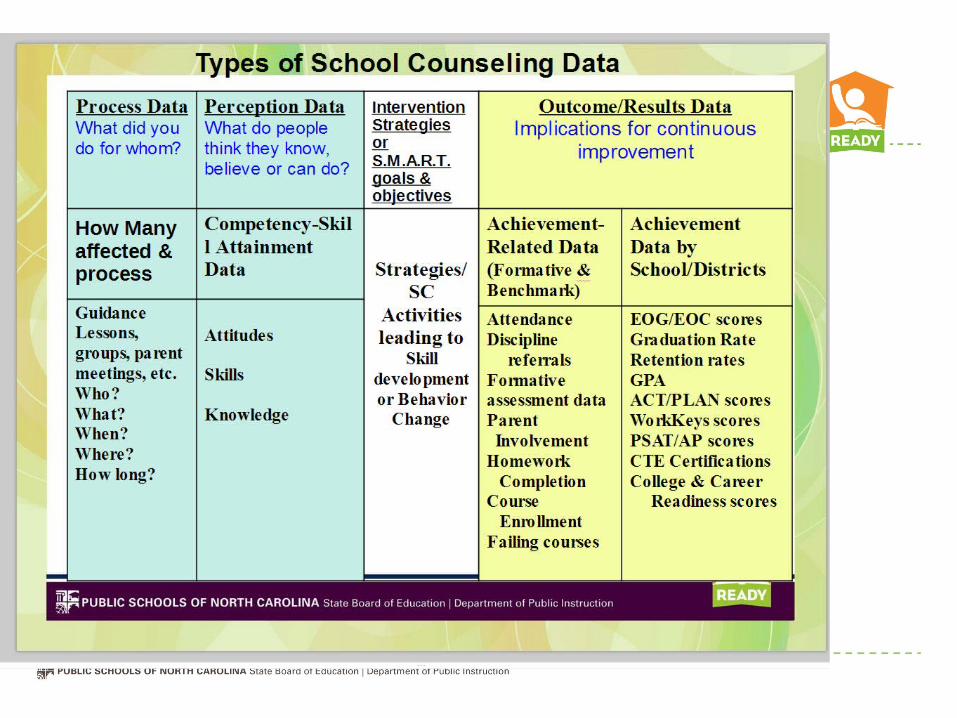
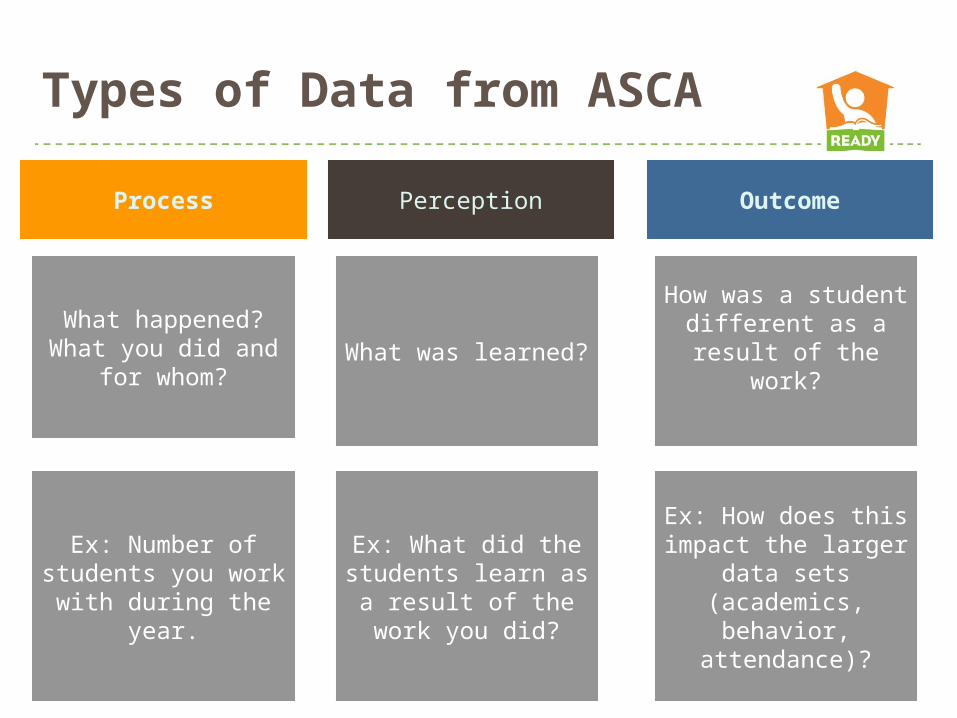
Types of Data from ASCA
Process Perception Outcome
What happened? What you did and for whom? What was learned?
How was a student different as a result of
the work?
Ex: Number of students you work with
during the year.
Ex: What did the students learn as a
result of the work you did?
Ex: How does this impact the larger data
sets (academics, behavior, attendance)?
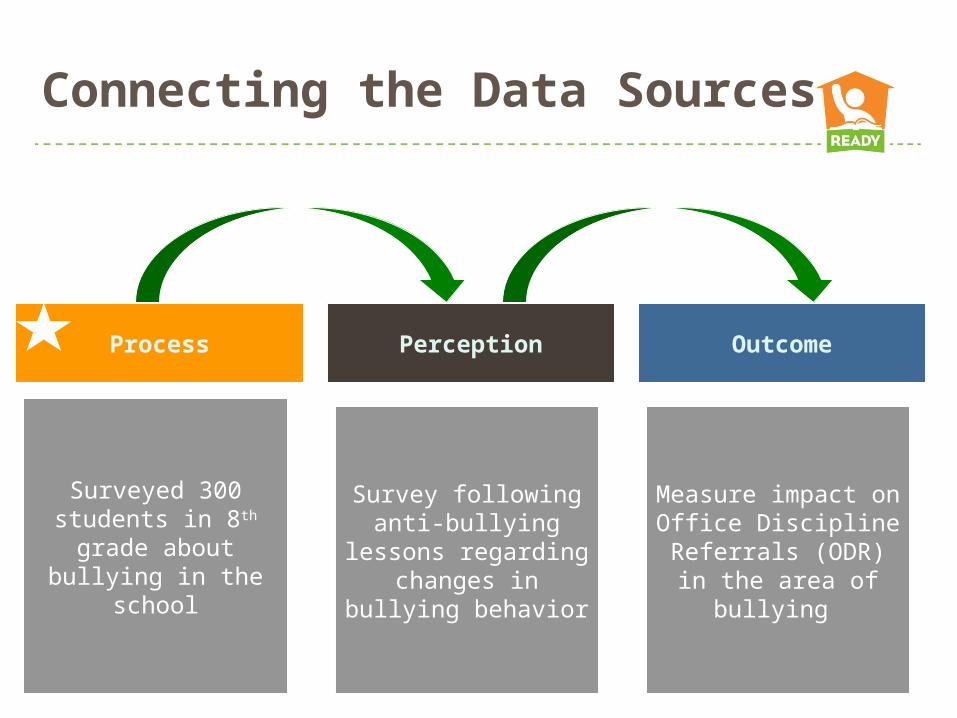
Connecting the Data Sources
Process Perception Outcome
Surveyed 300 students in 8th grade about
bullying in the school
Survey following anti-bullying lessons
regarding changes in bullying behavior
Measure impact on Office Discipline
Referrals (ODR) in the area of bullying
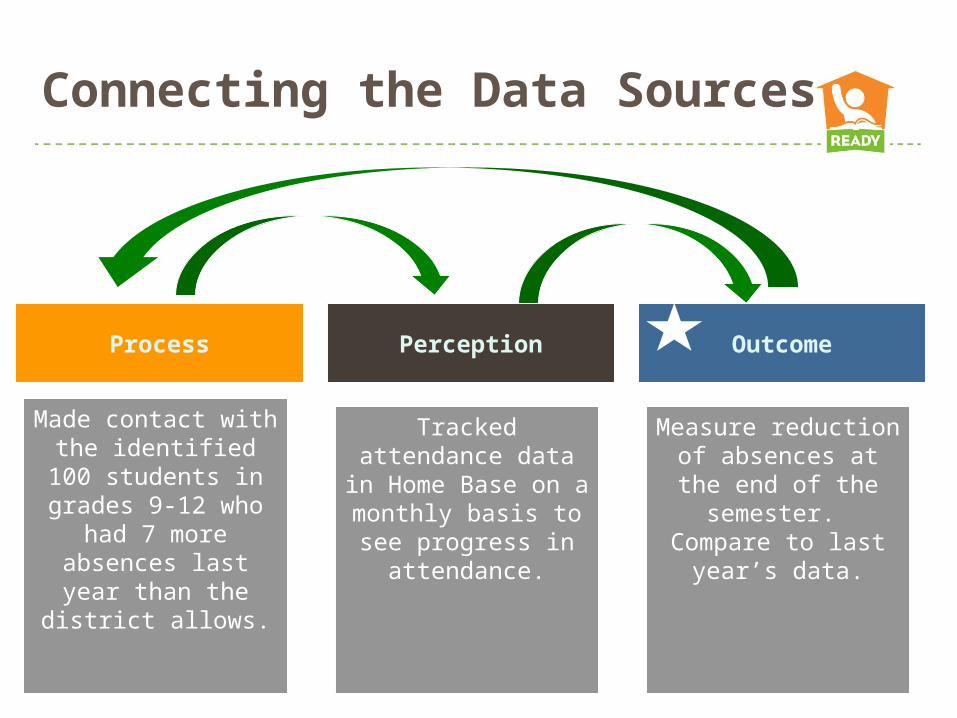
Connecting the Data Sources
Process Perception Outcome
Made contact with the identified 100 students
in grades 9-12 who had 7 more absences
last year than the district allows.
Tracked attendance data in Home Base on a monthly basis to see
progress in attendance.
School Improvement Plan (SIP) goal is to reduce number of absences by 50%.
Measure reduction of absences at the end of
the semester. Compare to last year’s
data.
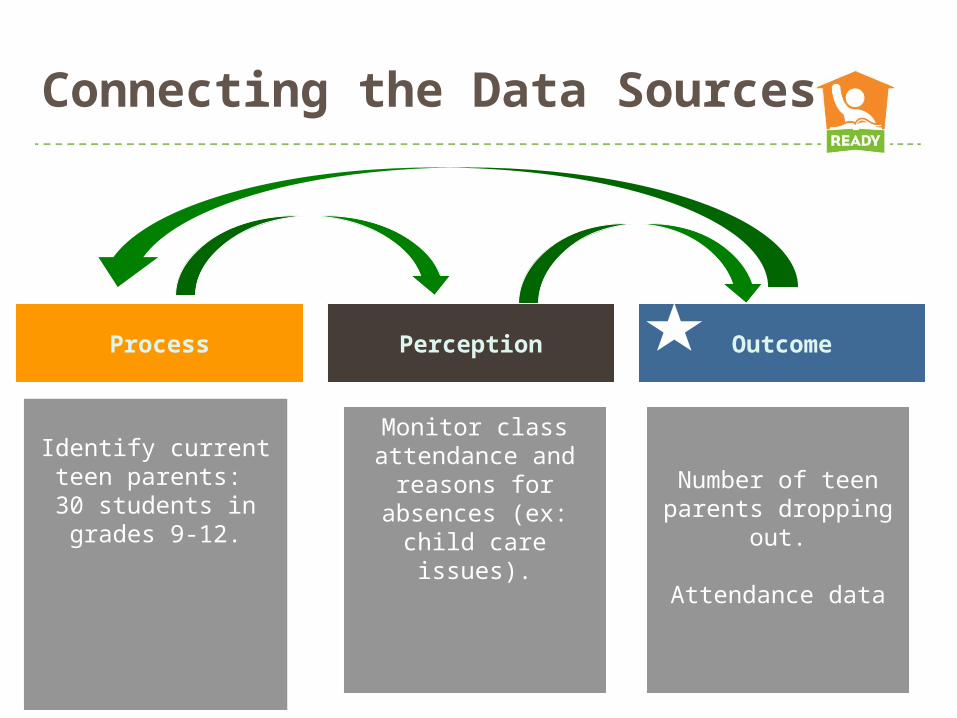
Connecting the Data Sources
Process Perception Outcome
Identify common reasons (ex: 90% of last year’s dropouts were teen parents).
Give survey to 30 teen parents to identify
barriers to completing school.
School Improvement Plan (SIP) goal is to
reduce number students dropping out
(ex: 40 students).
Number of teen parents dropping out.
Attendance data
Give survey after strategies/supports are
given to determine reduction of barriers .
Monitor class attendance and
reasons for absences (ex: child care issues).
Identify current teen parents:
30 students in grades 9-12.
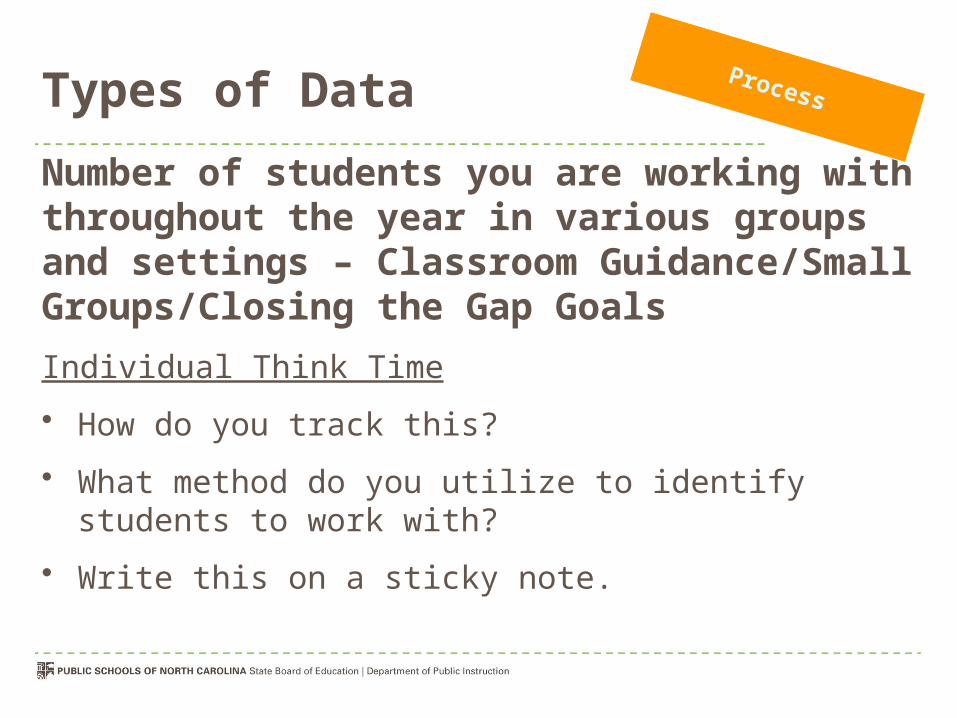
Types of DataNumber of students you are working with throughout the year in various groups and settings – Classroom Guidance/Small Groups/Closing the Gap GoalsIndividual Think Time
• How do you track this?
• What method do you utilize to identify students to work with?
• Write this on a sticky note.
Process
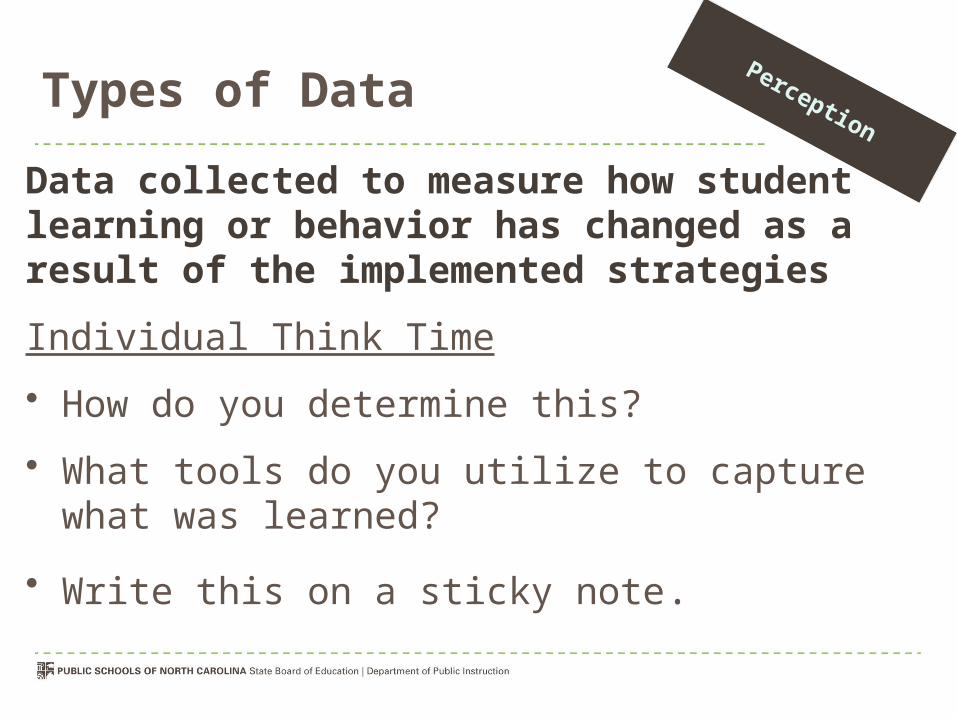
Types of Data
Data collected to measure how student learning or behavior has changed as a result of the implemented strategies
Individual Think Time
• How do you determine this?
• What tools do you utilize to capture what was learned?
• Write this on a sticky note.
Perception
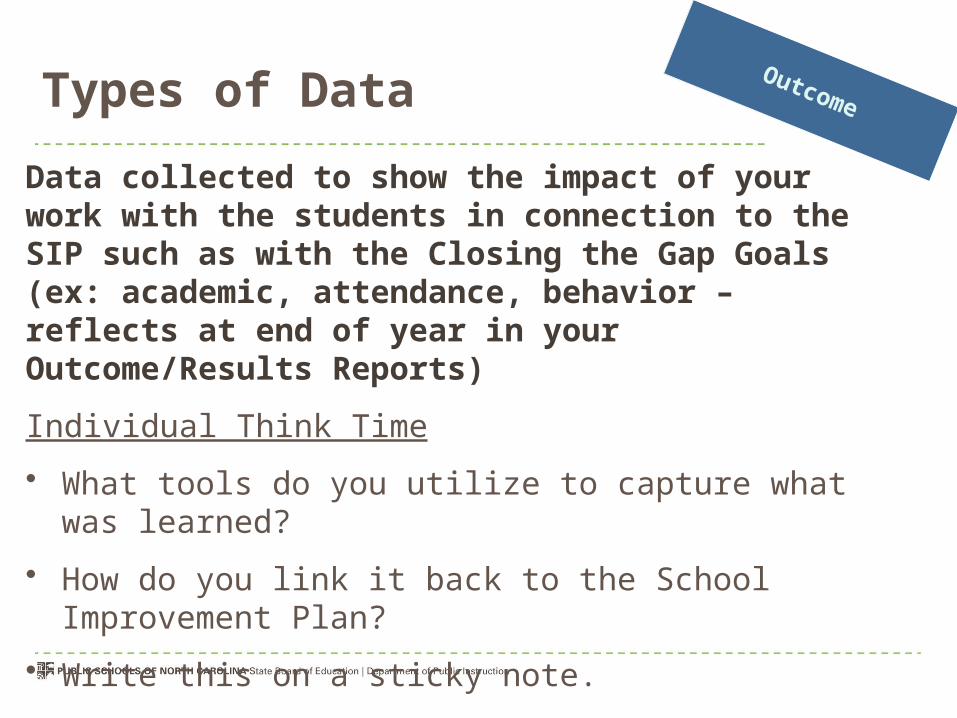
Types of DataData collected to show the impact of your work with the students in connection to the SIP such as with the Closing the Gap Goals(ex: academic, attendance, behavior – reflects at end of year in your Outcome/Results Reports)
Individual Think Time
• What tools do you utilize to capture what was learned?
• How do you link it back to the School Improvement Plan?
• Write this on a sticky note.
Outcome
Networking
• Find someone in the room from another school district
• Introduce yourselves and discuss process, perception, and outcome sticky notes and the connections between the three types of data
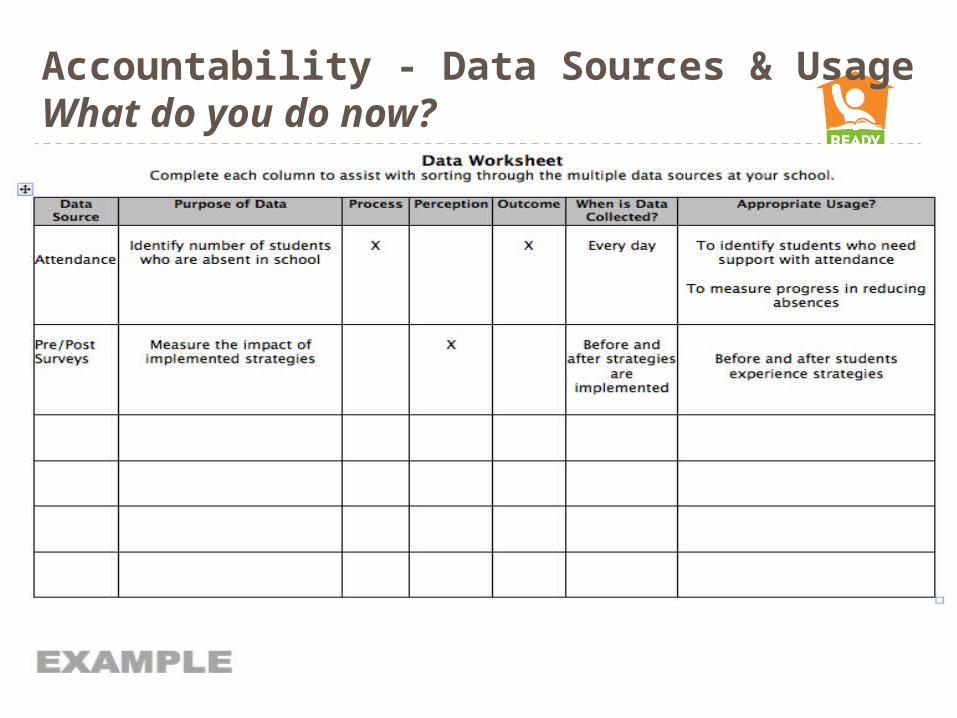
Accountability - Data Sources & UsageWhat do you do now?
Activity
• Utilize the blank data worksheet to list the data sources you utilize.
• Think about additional data sources you can use
Curriculum Action Plan
• Do you know what lessons you will be teaching at the beginning of the year?
• Do you plan a scope of learning for your program for the various grade levels?
• Use the curriculum action plan
At your table groups:– Pick ONE grade level and talk about how you could
collect process, perception, and outcome data over the course of the year.
Small Group
• The power of setting goals for your groups.
At your table groups:– Pick one type small group or that you run and
talk about the three types of data.
Types of Data

Graduation Rate = 82.5%
http://www.newsobserver.com/2013/08/08/3092325/nc-graduation-rate-rises-above.html
DROPOUT PREVENTION EARLY WARNING REPORTS
School Counseling/GuidanceFall Regional RESA Trainings
Presenters: Debora Williams and Betsy Baugess
Do You Know?
Annual Number of Dropouts in U.S.
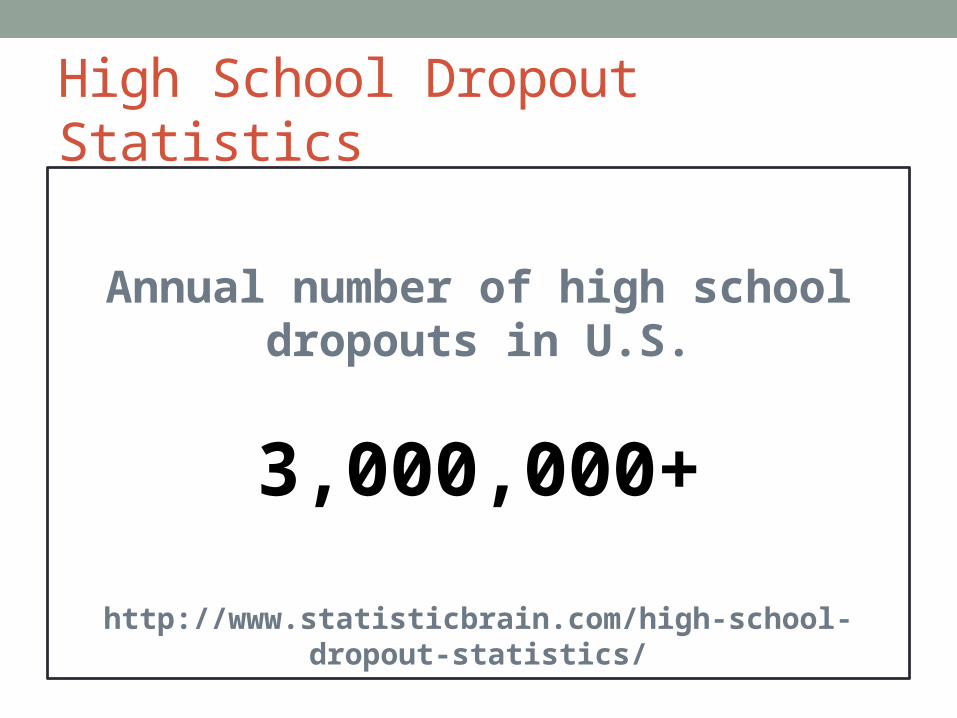
High School Dropout Statistics
Annual number of high school dropouts in U.S.
3,000,000+
http://www.statisticbrain.com/high-school-dropout-statistics/
Do You Know?
Number of dropouts in North Carolina (2012)
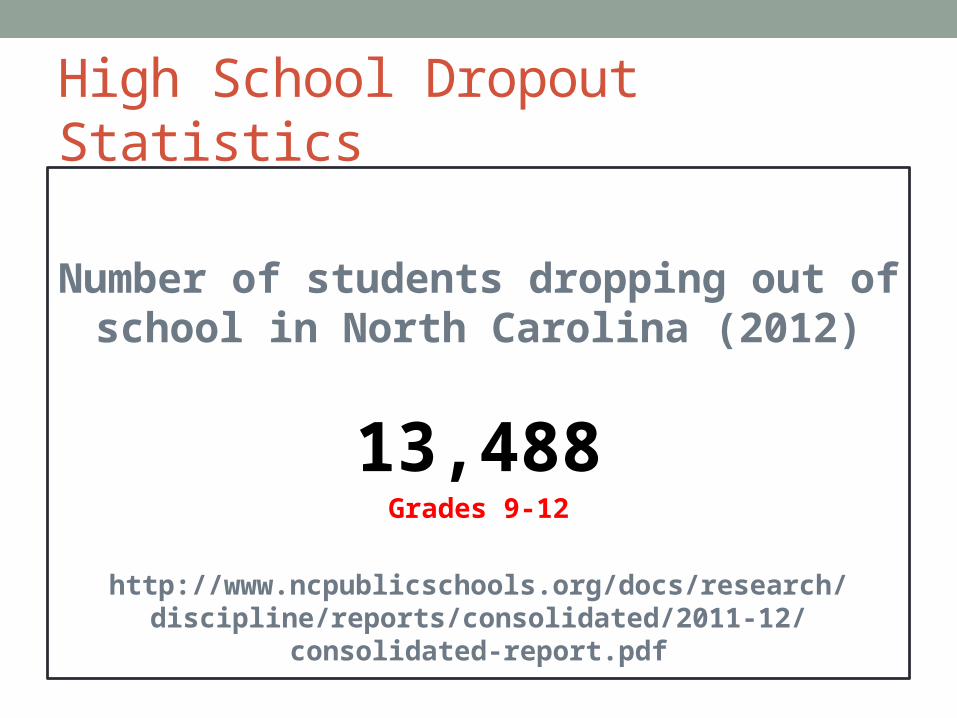
High School Dropout Statistics
Number of students dropping out of school in North Carolina (2012)
13,488Grades 9-12
http://www.ncpublicschools.org/docs/research/discipline/reports/consolidated/2011-12/consolidated-report.pdf
Do You Know?
Number of NC students retained in 3rd Grade
(2012)
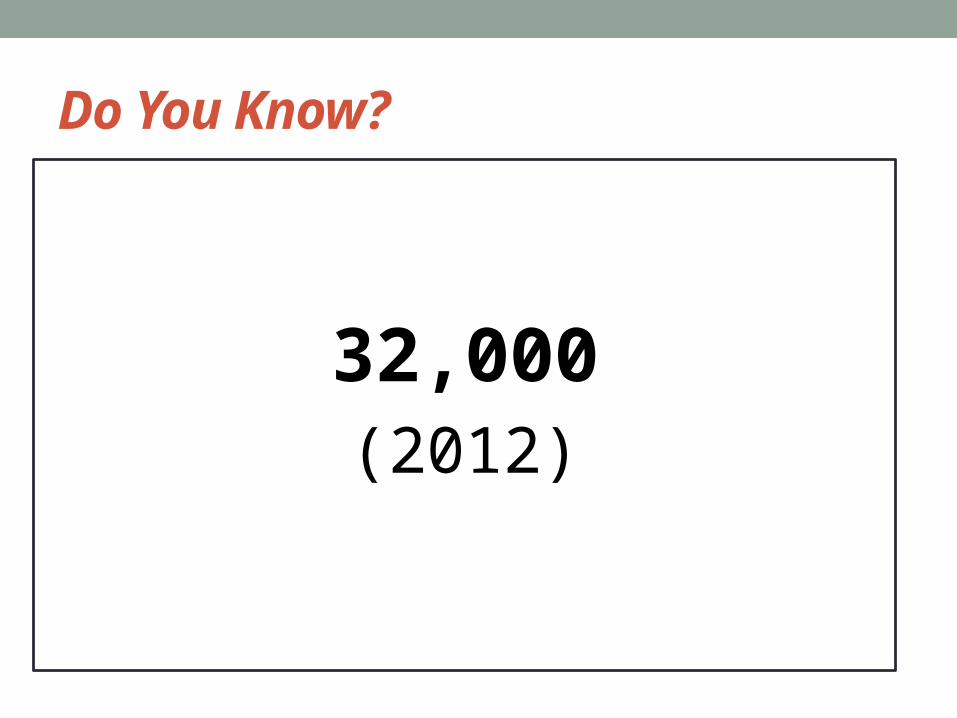
Do You Know?
32,000(2012)
PURPOSE
To facilitate an early warning system with research-based risk factors for identifying students who may be at risk of
dropping out of school.
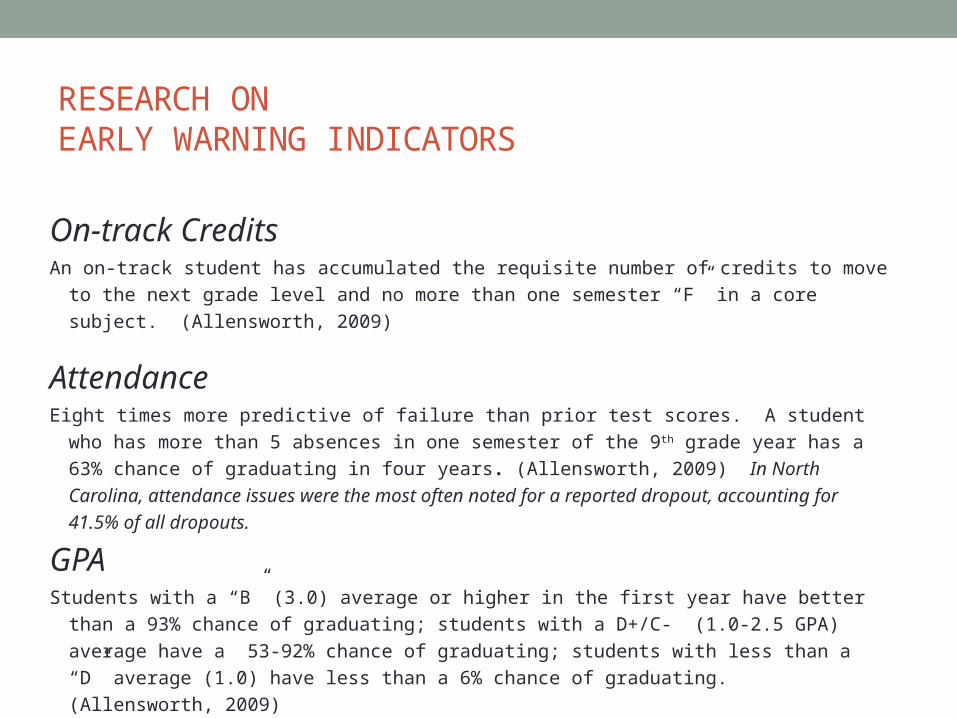
RESEARCH ONEARLY WARNING INDICATORS
On-track CreditsAn on-track student has accumulated the requisite number of credits to move to the next grade level
and no more than one semester “F” in a core subject. (Allensworth, 2009)
AttendanceEight times more predictive of failure than prior test scores. A student who has more than 5 absences
in one semester of the 9th grade year has a 63% chance of graduating in four years. (Allensworth, 2009) In North Carolina, attendance issues were the most often noted for a reported dropout, accounting for 41.5% of all dropouts.
GPAStudents with a “B” (3.0) average or higher in the first year have better than a 93% chance of
graduating; students with a D+/C- (1.0-2.5 GPA) average have a 53-92% chance of graduating; students with less than a “D” average (1.0) have less than a 6% chance of graduating. (Allensworth, 2009)
RELEVANT SIS DATA• Attendance data, both current and historical
• State assessment achievement level data
• Final marks for all middle school/high school courses
• Most recently calculated GPA (calculated at year-end for grades 9-12)
• Student name, pupil number, birth date, ninth-grade entry date

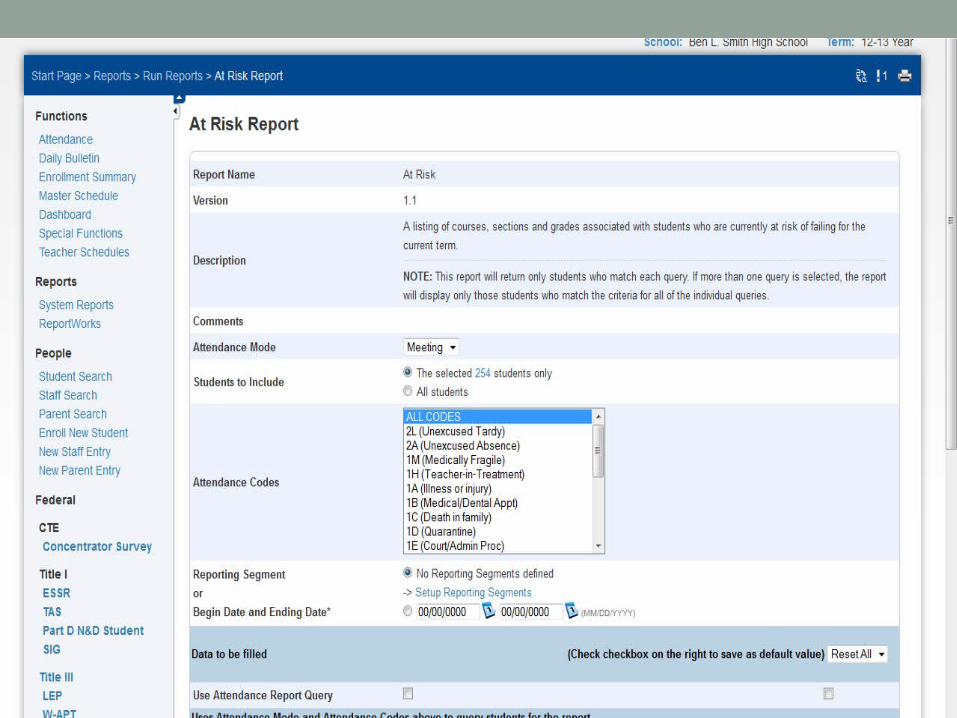
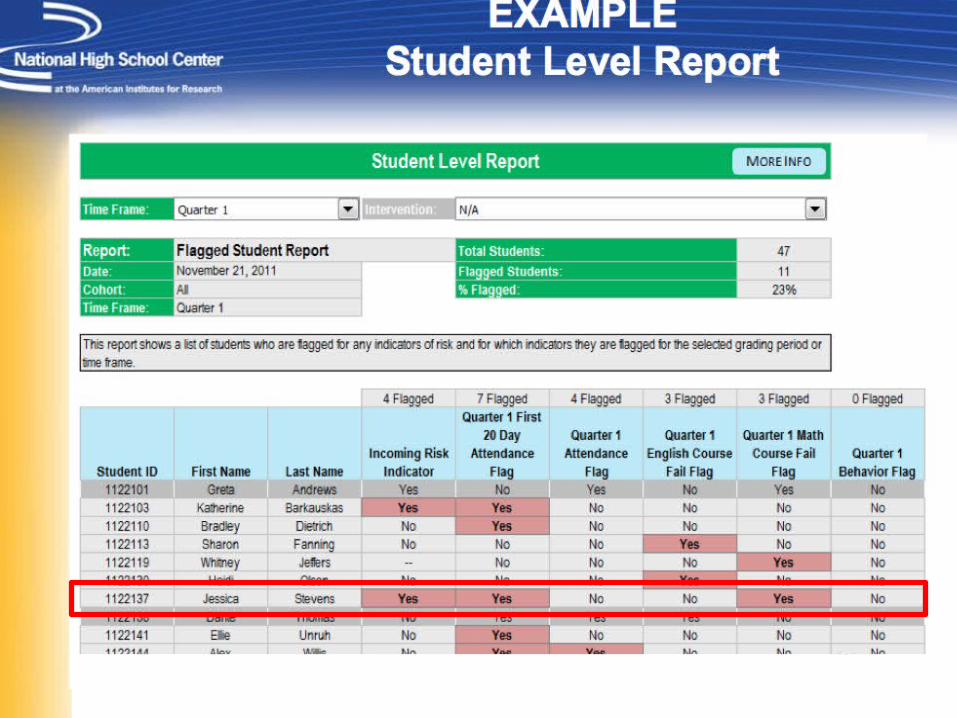
PowerSchool At Risk Report
The At Risk Report provides a listing of courses, sections,
and grades associated with students who are currently a
risk of failing for the current term.

PowerSchool At Risk Report
Allows administrators and teachers to take a proactive
approach to address potential issues and ensure student
accountability.
At Risk Report Fields
• Attendance Mode• Daily• Meeting• Time
• Students to Include• Selected students only• All students
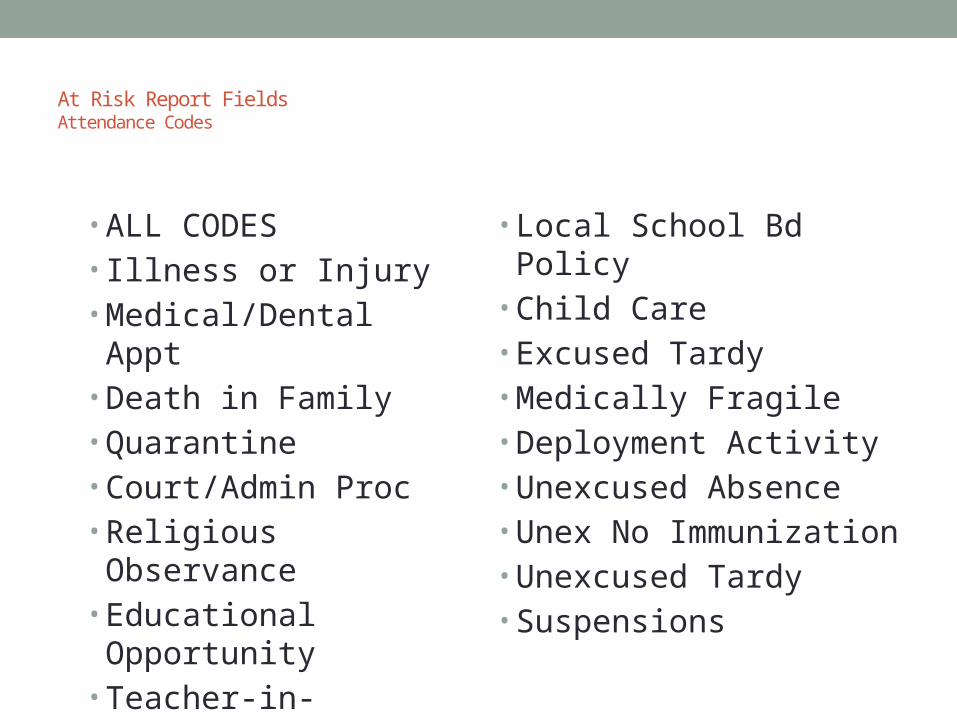
At Risk Report FieldsAttendance Codes
• ALL CODES• Illness or Injury• Medical/Dental Appt• Death in Family• Quarantine• Court/Admin Proc• Religious Observance• Educational Opportunity• Teacher-in-Treatment
• Local School Bd Policy• Child Care• Excused Tardy• Medically Fragile• Deployment Activity• Unexcused Absence• Unex No Immunization• Unexcused Tardy• Suspensions
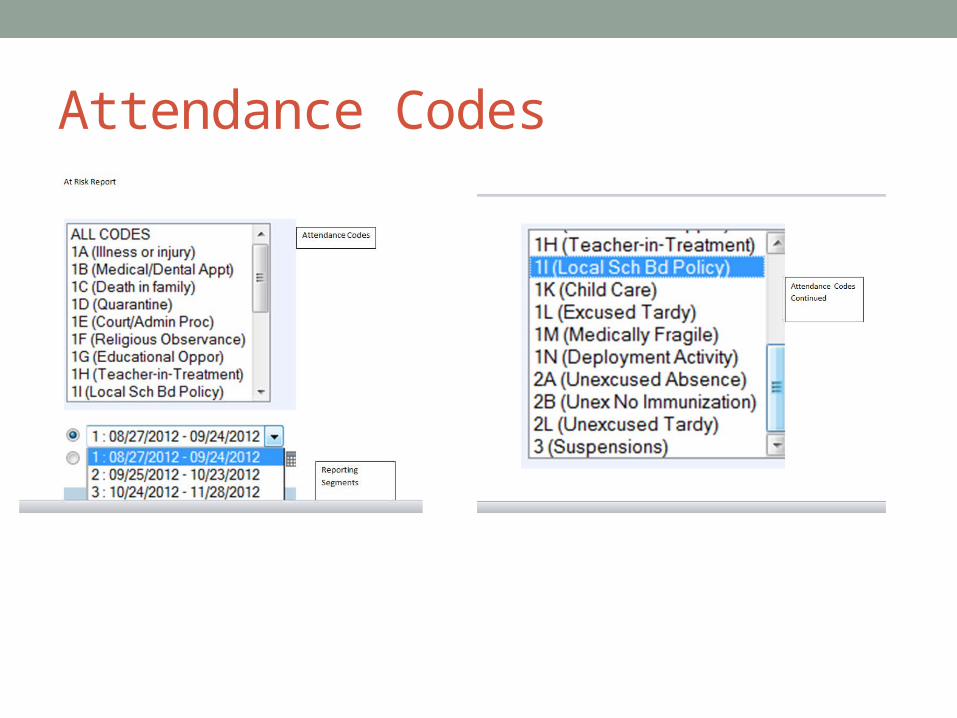
Attendance Codes
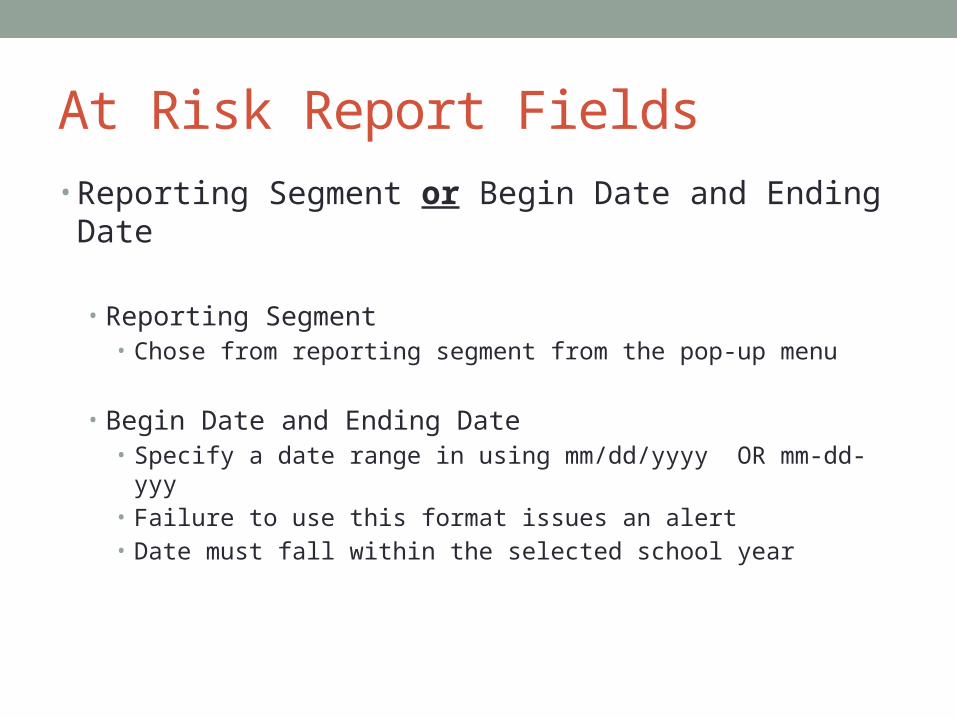
At Risk Report Fields• Reporting Segment or Begin Date and Ending Date
• Reporting Segment• Chose from reporting segment from the pop-up menu
• Begin Date and Ending Date• Specify a date range in using mm/dd/yyyy OR mm-dd-yyy• Failure to use this format issues an alert• Date must fall within the selected school year
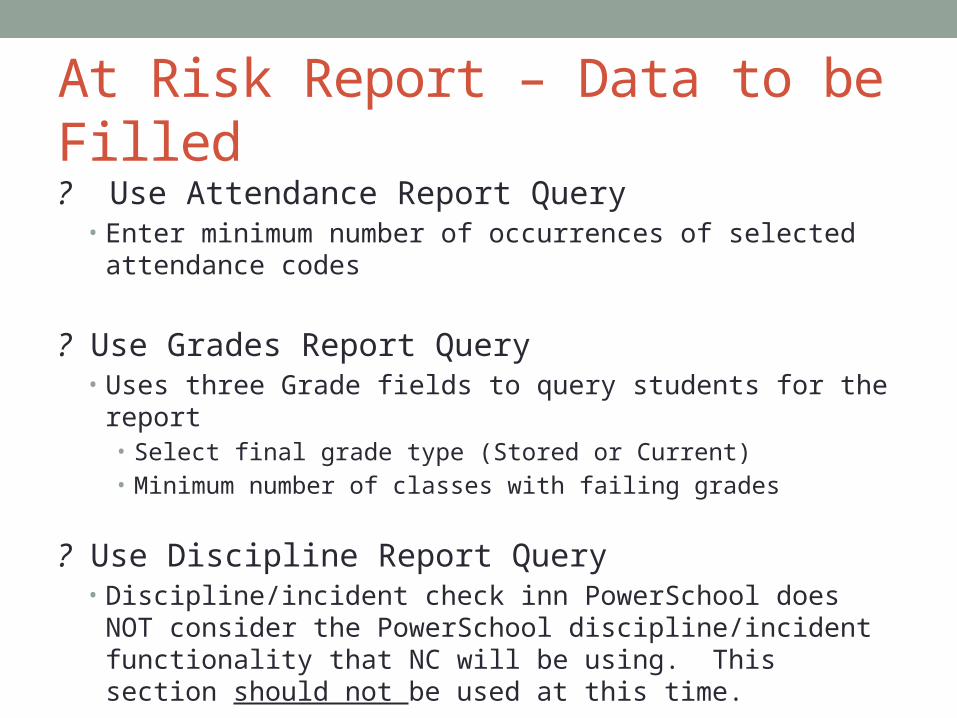
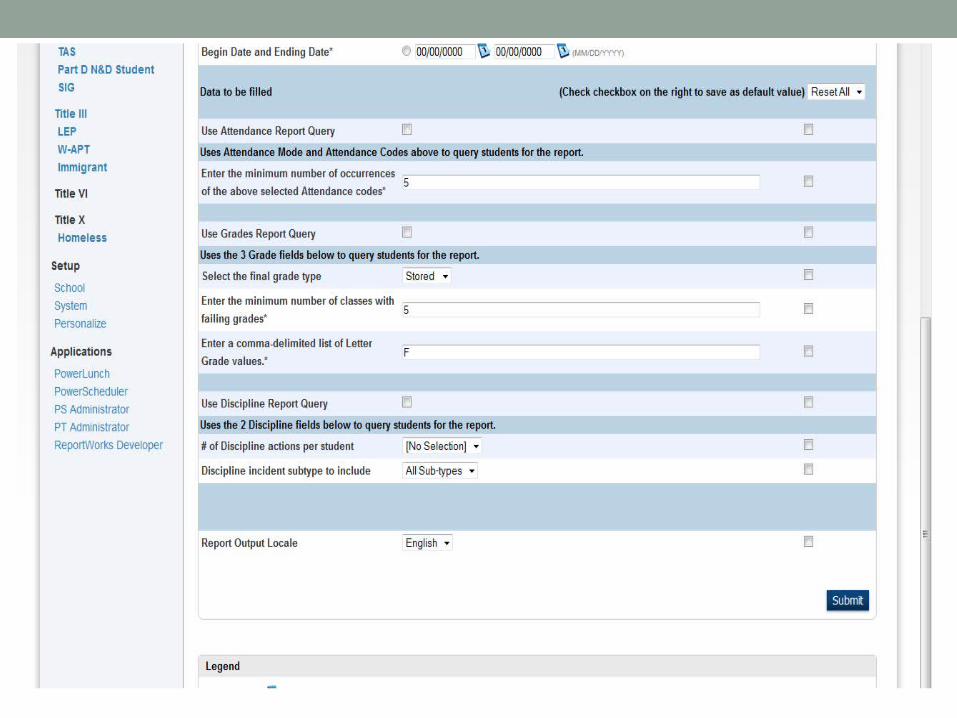
At Risk Report – Data to be Filled? Use Attendance Report Query
• Enter minimum number of occurrences of selected attendance codes
? Use Grades Report Query• Uses three Grade fields to query students for the report
• Select final grade type (Stored or Current)• Minimum number of classes with failing grades
? Use Discipline Report Query• Discipline/incident check inn PowerSchool does NOT consider the
PowerSchool discipline/incident functionality that NC will be using. This section should not be used at this time.
\
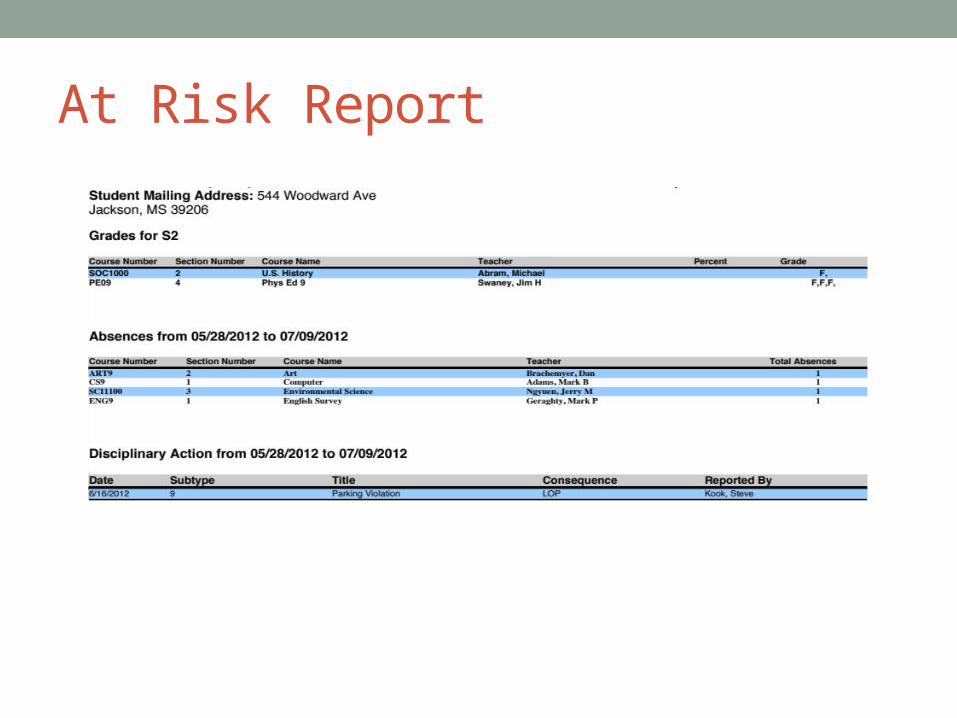
At Risk Report
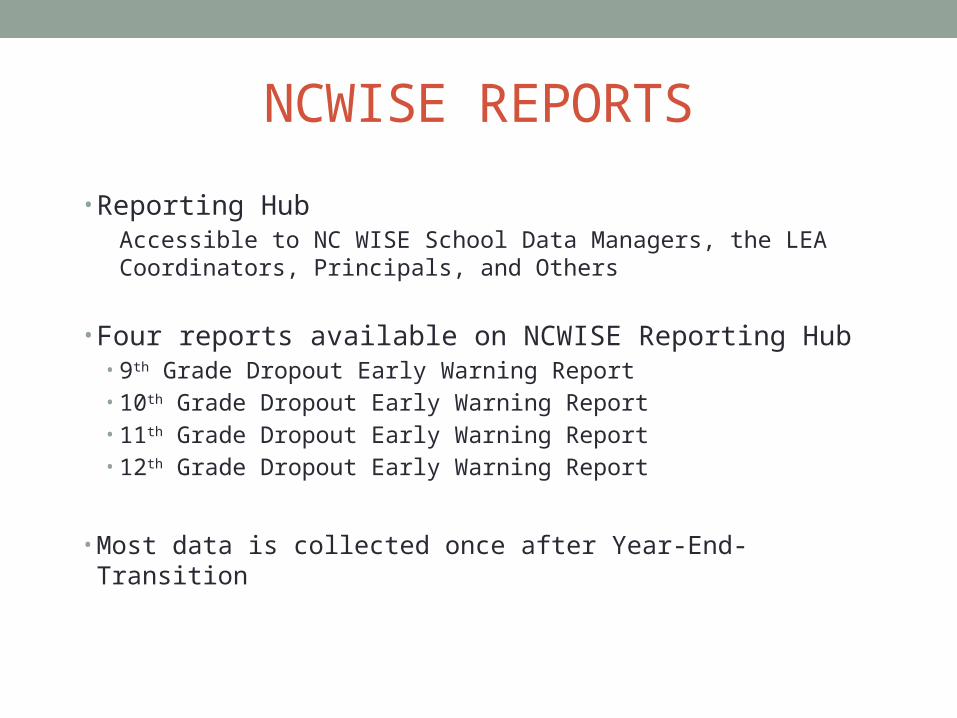
NCWISE REPORTS
• Reporting Hub Accessible to NC WISE School Data Managers, the LEA Coordinators, Principals, and Others
• Four reports available on NCWISE Reporting Hub• 9th Grade Dropout Early Warning Report • 10th Grade Dropout Early Warning Report• 11th Grade Dropout Early Warning Report• 12th Grade Dropout Early Warning Report
• Most data is collected once after Year-End-Transition
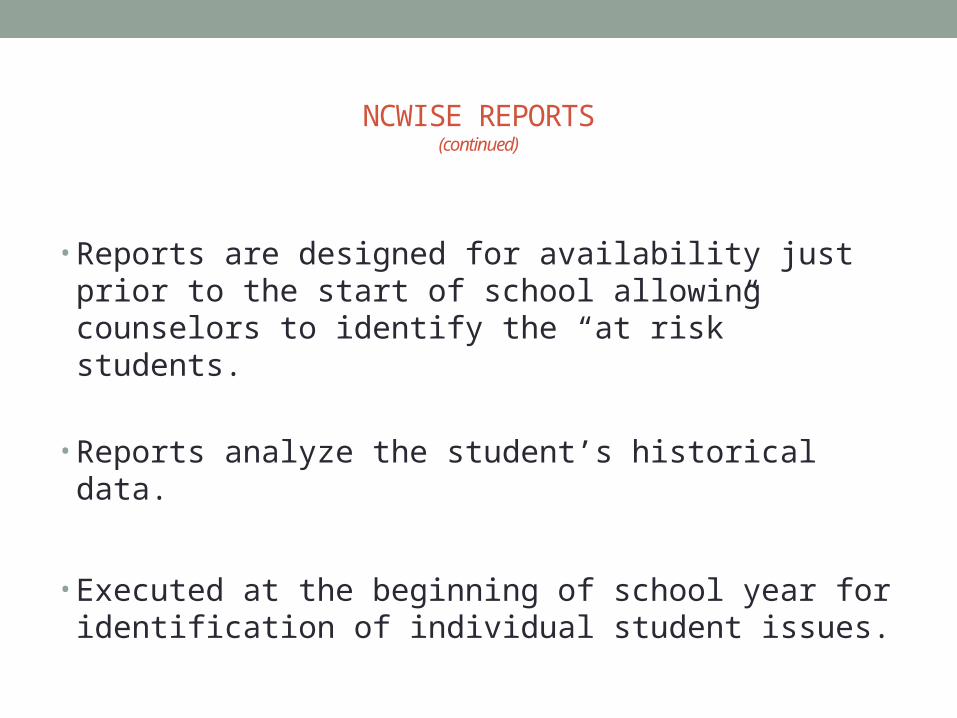
NCWISE REPORTS(continued)
• Reports are designed for availability just prior to the start of school allowing counselors to identify the “at risk” students.
• Reports analyze the student’s historical data.
• Executed at the beginning of school year for identification of individual student issues.
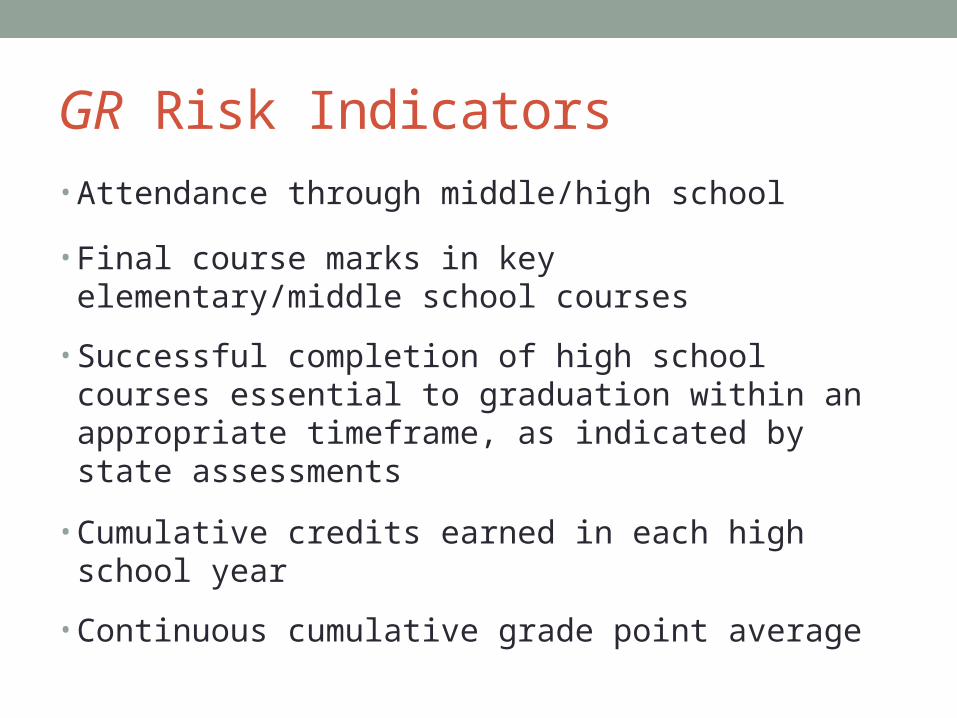
GR Risk Indicators• Attendance through middle/high school
• Final course marks in key elementary/middle school courses
• Successful completion of high school courses essential to graduation within an appropriate timeframe, as indicated by state assessments
• Cumulative credits earned in each high school year
• Continuous cumulative grade point average
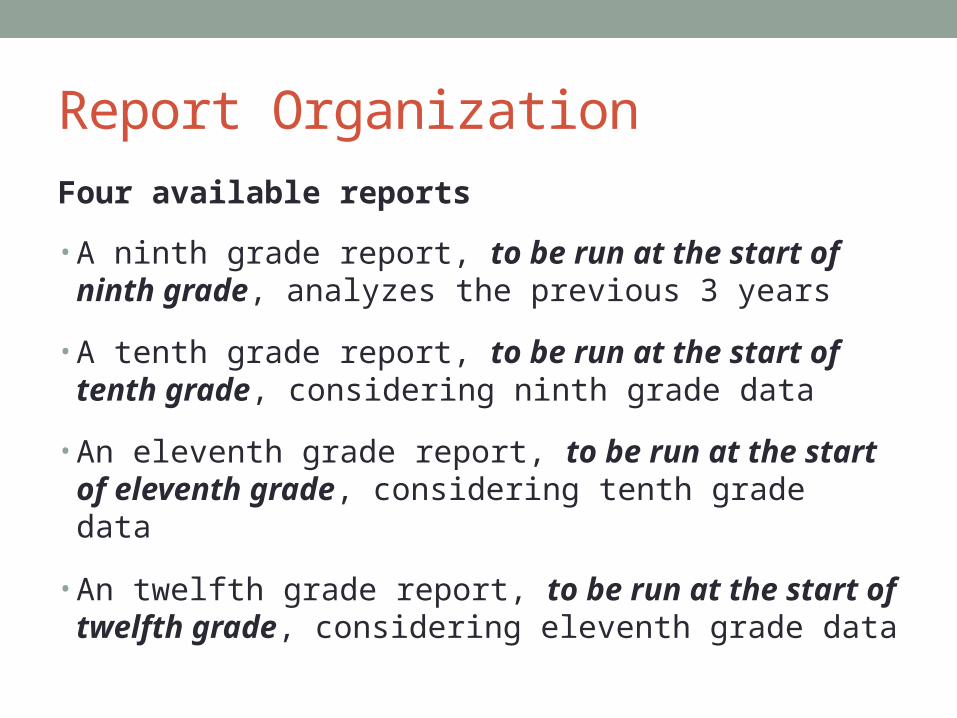
Report OrganizationFour available reports
• A ninth grade report, to be run at the start of ninth grade, analyzes the previous 3 years
• A tenth grade report, to be run at the start of tenth grade, considering ninth grade data
• An eleventh grade report, to be run at the start of eleventh grade, considering tenth grade data
• An twelfth grade report, to be run at the start of twelfth grade, considering eleventh grade data
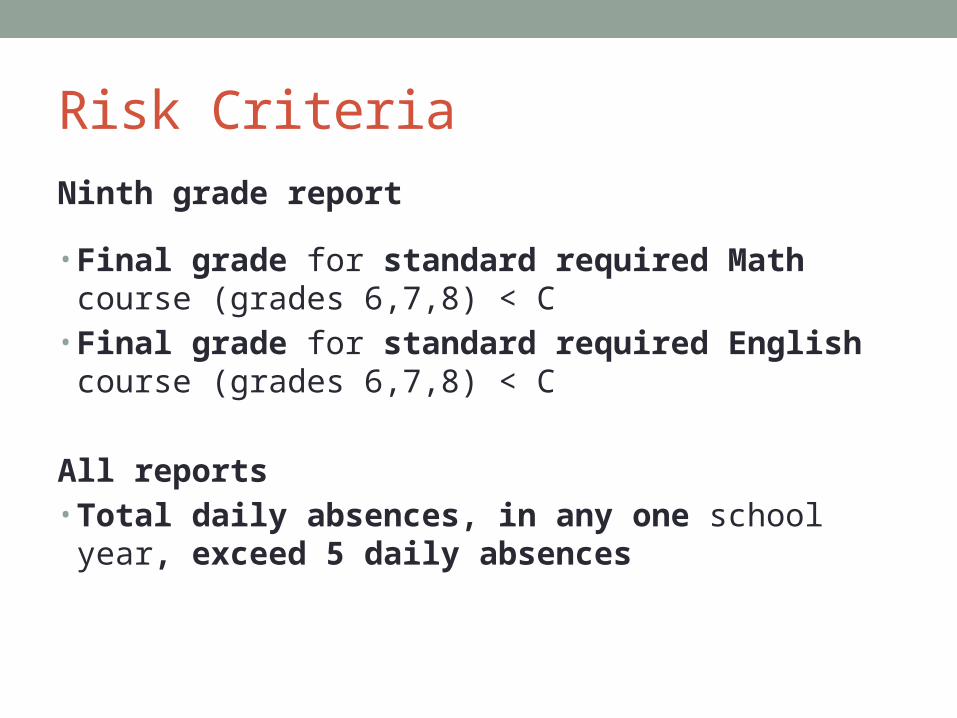
Risk CriteriaNinth grade report
• Final grade for standard required Math course (grades 6,7,8) < C
• Final grade for standard required English course (grades 6,7,8) < C
All reports• Total daily absences, in any one school year, exceed 5
daily absences
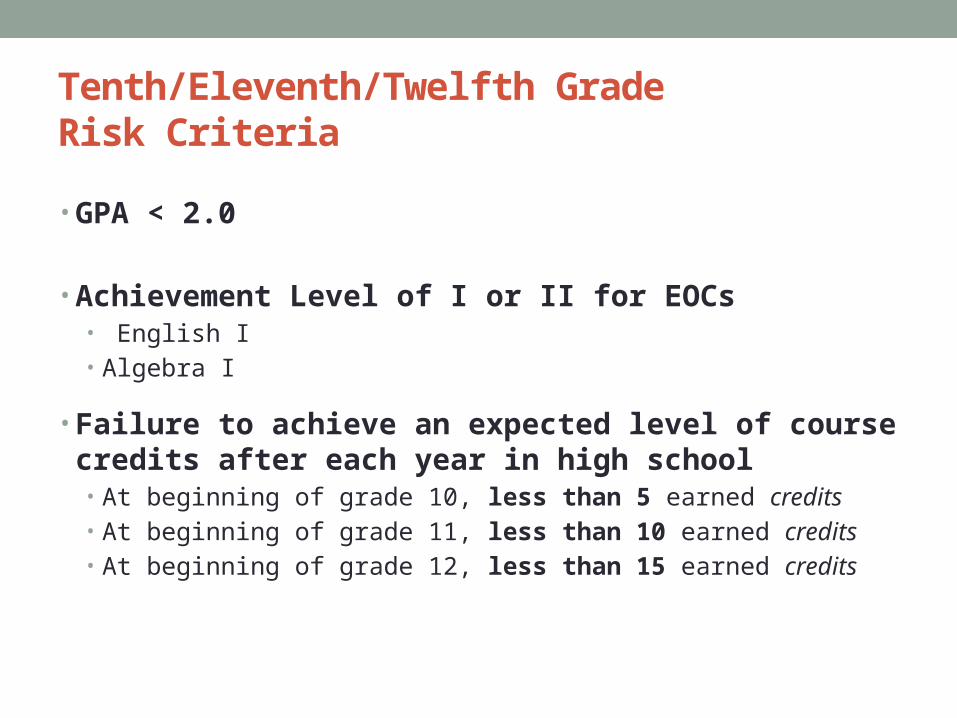
Tenth/Eleventh/Twelfth Grade Risk Criteria
• GPA < 2.0
• Achievement Level of I or II for EOCs • English I• Algebra I
• Failure to achieve an expected level of course credits after each year in high school• At beginning of grade 10, less than 5 earned credits• At beginning of grade 11, less than 10 earned credits• At beginning of grade 12, less than 15 earned credits
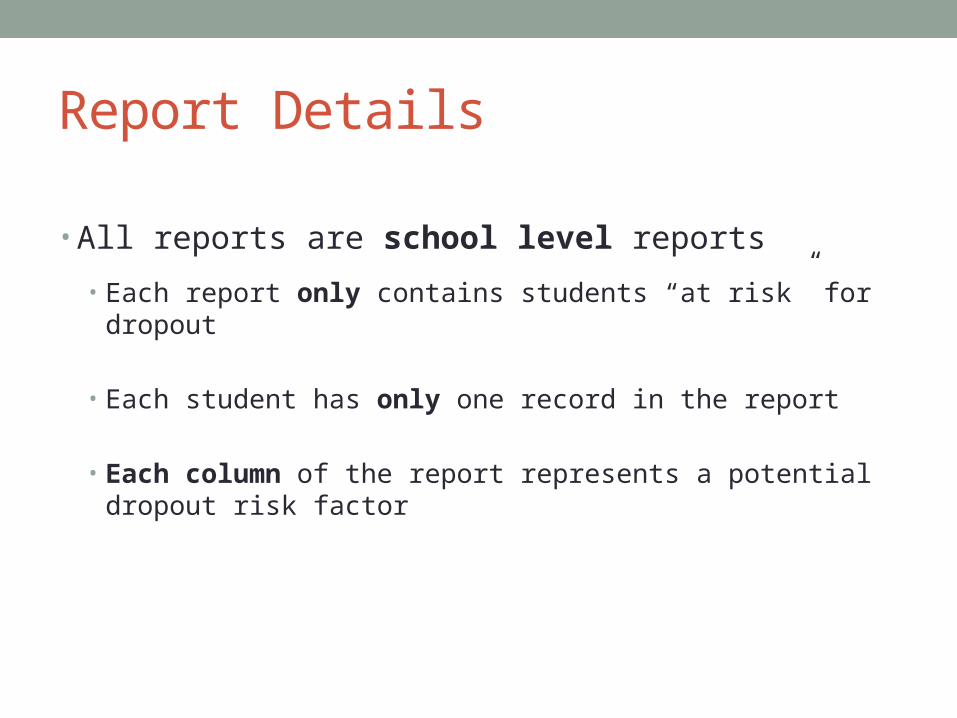
Report Details
• All reports are school level reports• Each report only contains students “at risk” for dropout
• Each student has only one record in the report
• Each column of the report represents a potential dropout risk factor
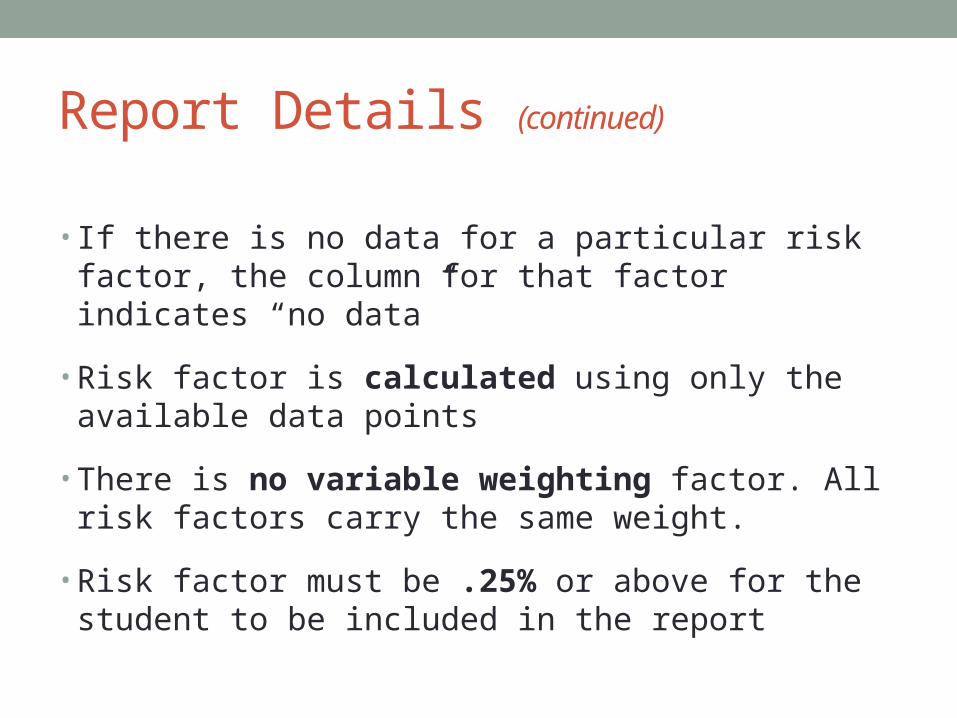
Report Details (continued)
• If there is no data for a particular risk factor, the column for that factor indicates “no data”
• Risk factor is calculated using only the available data points
• There is no variable weighting factor. All risk factors carry the same weight.
• Risk factor must be .25% or above for the student to be included in the report
Ninth Grade Sample ReportSCHOOL NAME
PUPIL#
9thGradeEntryDate
BIRTH_DATE
STUDENTName
SIXth _GrdABS
SEVNGrdABS
EIGHTGrdABS
SIXthGrdENGL
SEVNGrdENGL
EIGHTGrdENGL
SIXthGrdMATH
SEVNGrdMATH
EIGHTGrdMATH
RISK
NC WISE HS 1 7/1/2010 6/30/1995 Student1 2 8 5 C+ D F D- F D 0.67
NC WISE HS 2 7/1/2011 7/12/1996 Student2 14 3 28 no data C F 80 C D- 0.5
NC WISE HS 3 7/1/2011 9/20/1996 Student3 16 6 0 no data B A- no data B- A- 0.29
NC WISE HS 4 7/1/2010 8/29/1993 Student4 no data 6 18 no data no data F no data P F 0.8
NC WISE HS 5 7/1/2010 4/10/1995 Student5 9 24 no data D no data no data F no data no data 1
NC WISE HS 6 7/1/2010 8/18/1995 Student6 3 5 5 C+ D F C F D 0.44
NC WISE HS 7 7/1/2011 3/20/1996 Student7 1 4 13 A C- B- A C- C 0.33
NC WISE HS 8 7/1/2010 2/20/1995 Student8 5 9 13 C- B- F C+ B- D 0.56
NC WISE HS 9 7/1/2011 8/23/1996 Student9 7 6 6 A C D C C C 0.44
NC WISE HS 10 7/1/2011 2/18/1996 Student10 no data 9 7 no data 94 92 no data 94 92 0.33
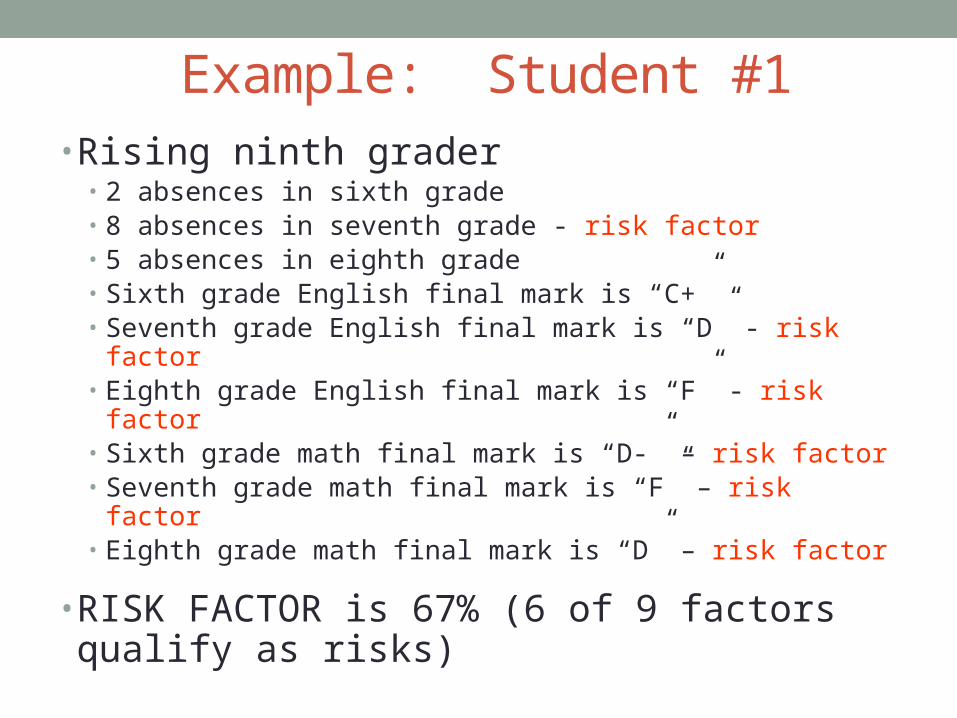
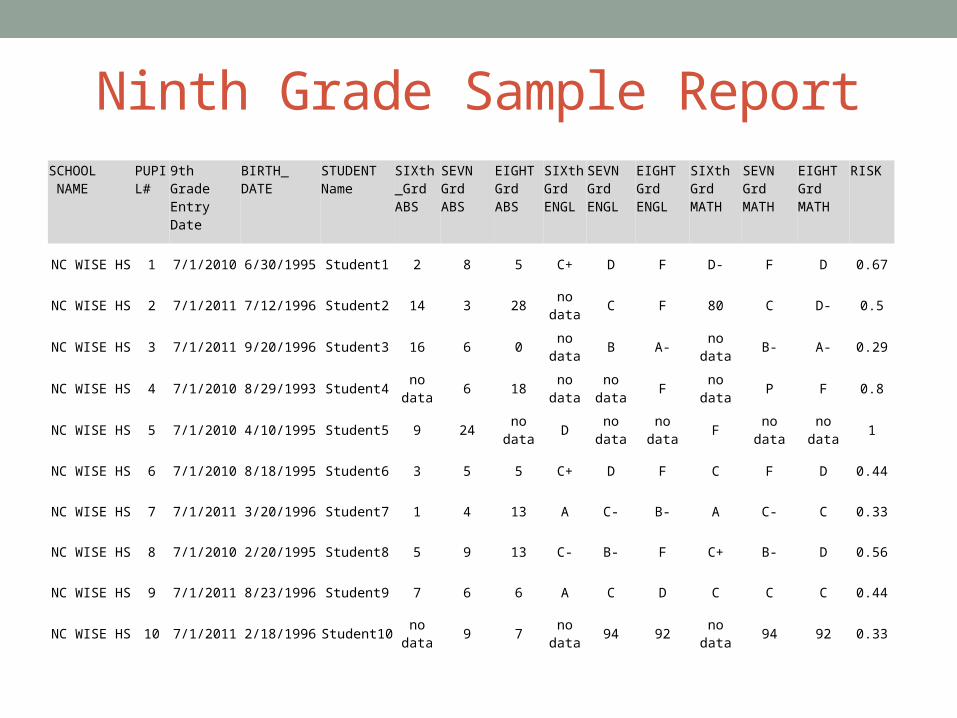
Example: Student #1• Rising ninth grader
• 2 absences in sixth grade • 8 absences in seventh grade - risk factor• 5 absences in eighth grade • Sixth grade English final mark is “C+”• Seventh grade English final mark is “D” - risk factor• Eighth grade English final mark is “F” - risk factor• Sixth grade math final mark is “D-” – risk factor• Seventh grade math final mark is “F” – risk factor• Eighth grade math final mark is “D” – risk factor
• RISK FACTOR is 67% (6 of 9 factors qualify as risks)
Twelfth Grade Sample Report
http://dpi.state.nc.us/docs/graduate/resiliency/sample-report.pdf
Contacts• Debora Williams, Special Assistant Graduation Initiatives (919) 807-3912 [email protected]
• Betsy Baugess, Manager Data/Software & Reporting (919) 807-3276 [email protected]
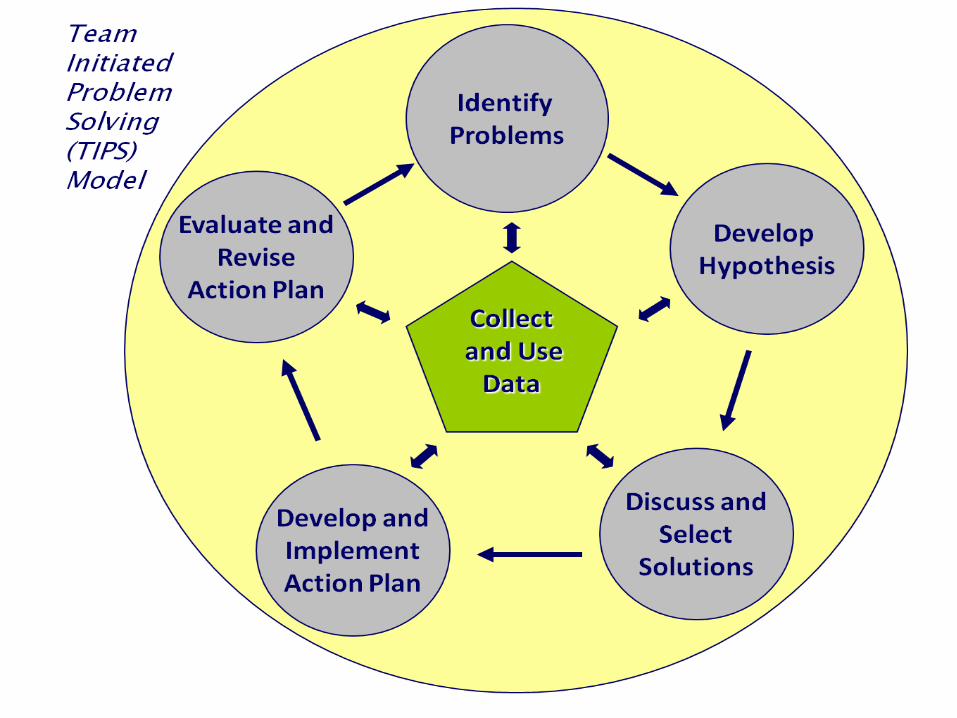
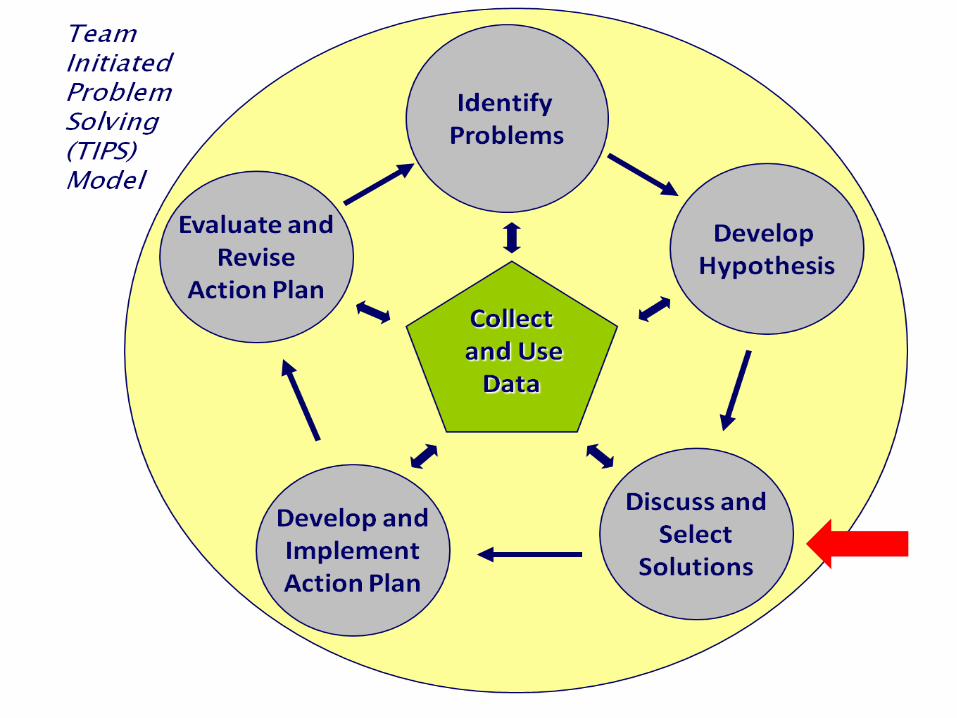
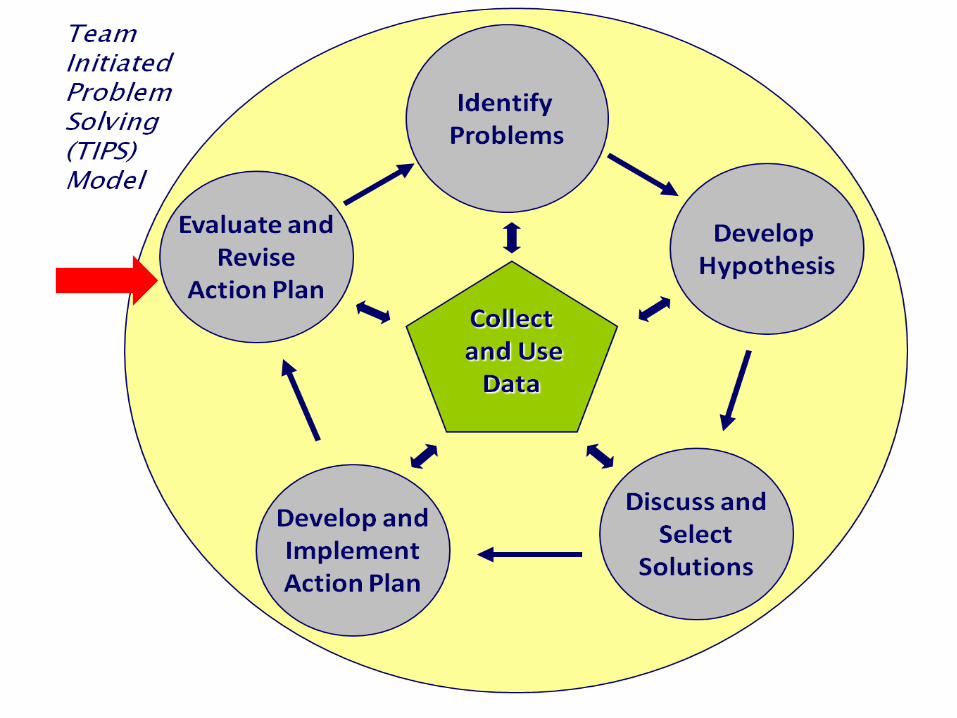
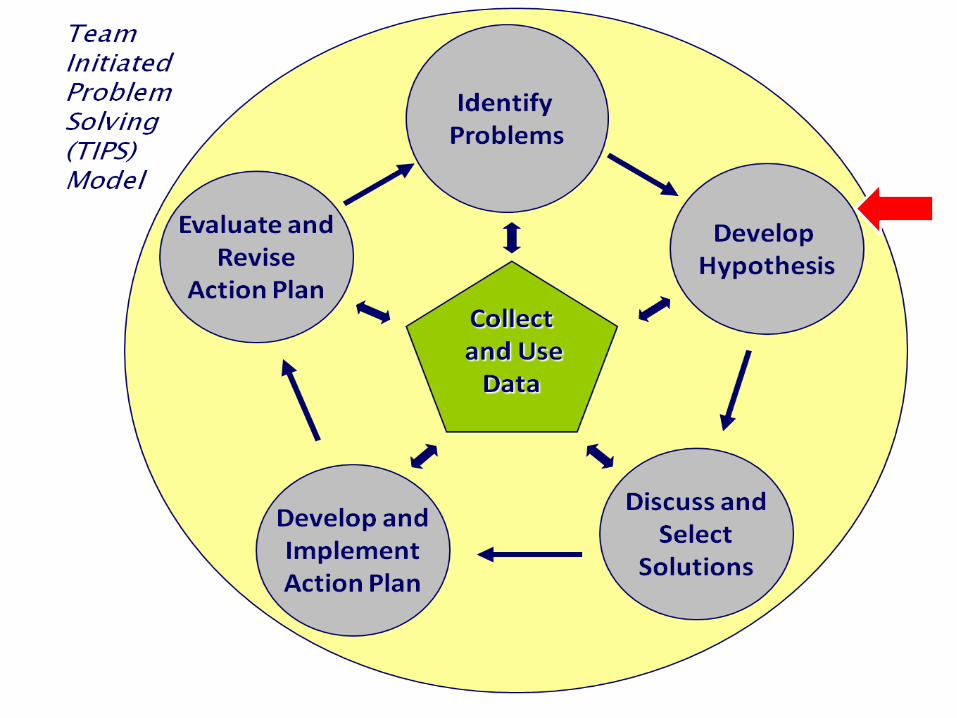
Data-Based Decision Making Using the TIPS model
Desired Outcomes
The goal of this training is to help schools move beyond simple collection of data to using the collected data to solve problems.
RationaleData should be used regularly to solve problems,
because it…
• provides a more objective viewpoint of the current state.
• increases efficiency by making needed action items clear.
• provides information about effectiveness of practices so modifications can be made in a timely manner.
• ensures that strategies and interventions are based on precise problem statements.
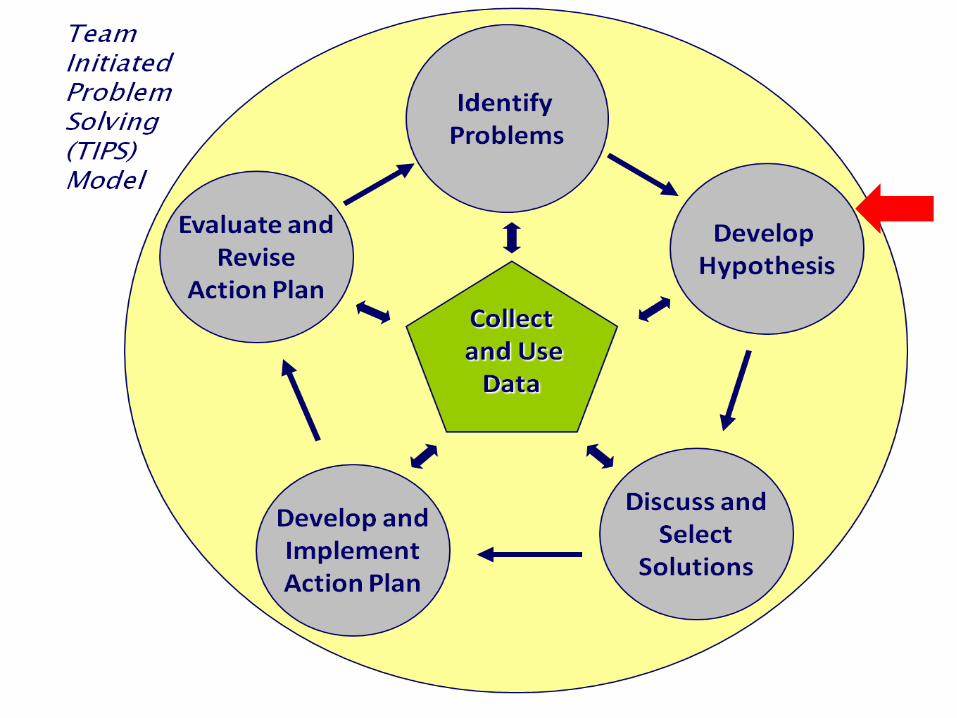
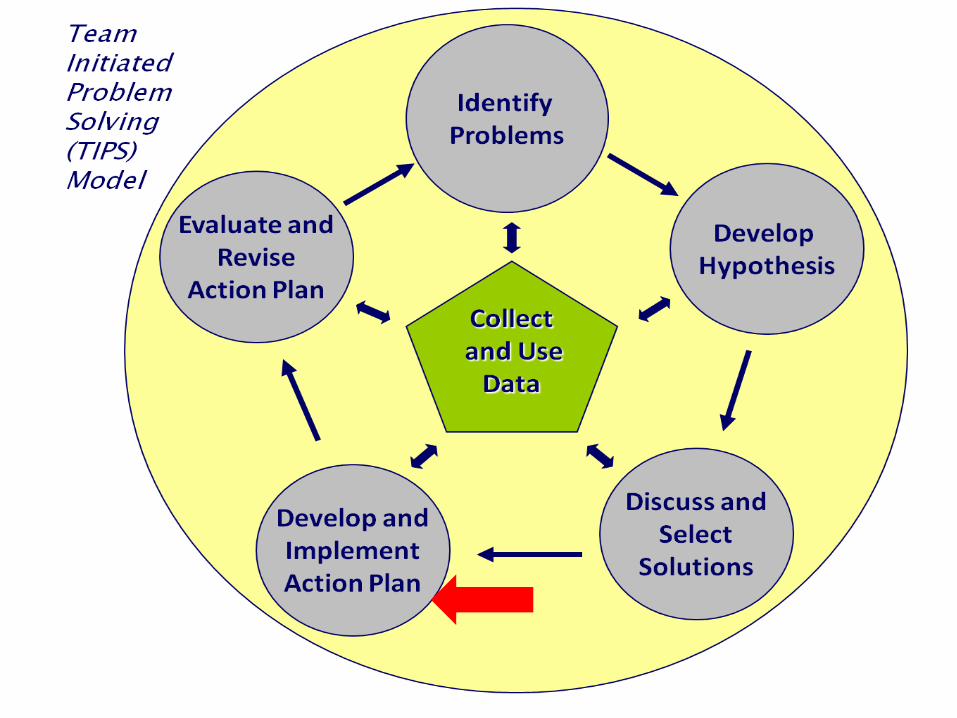
Data-Based Decision Making
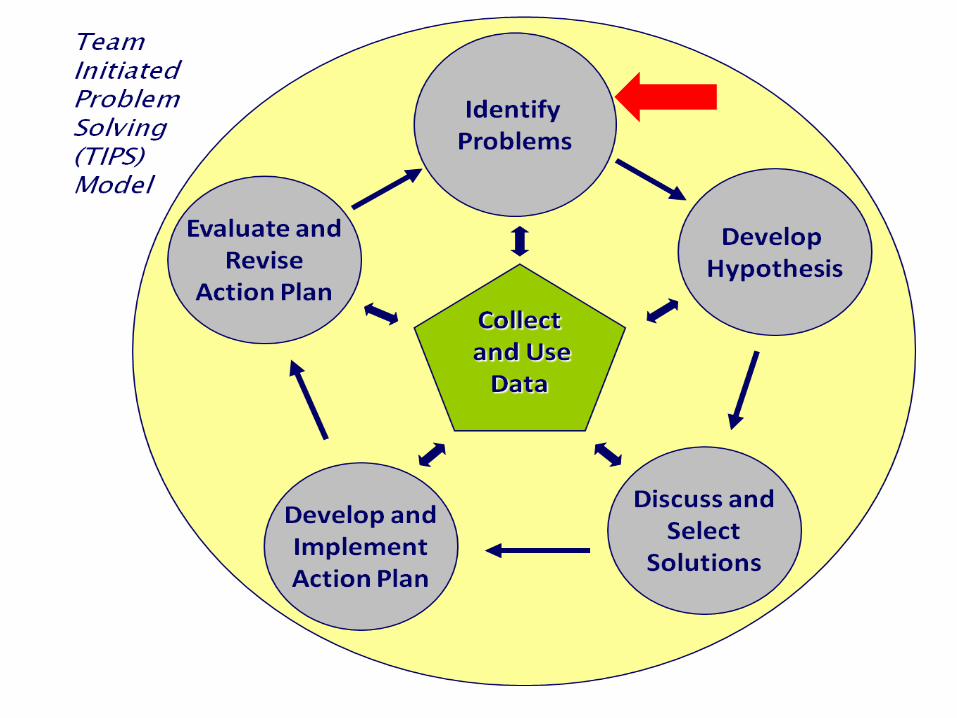
Problem-Solving Process
80
Problem-Solving Process: DefinitionsProblem: Difference exists between
expected/desired student behavior and current student behavior.
Problem identification: Difference is discovered and significance is determined.
Problem-solving: A plan is created to reduce or eliminate difference.
Data-Based Decision Making
Meeting Foundations
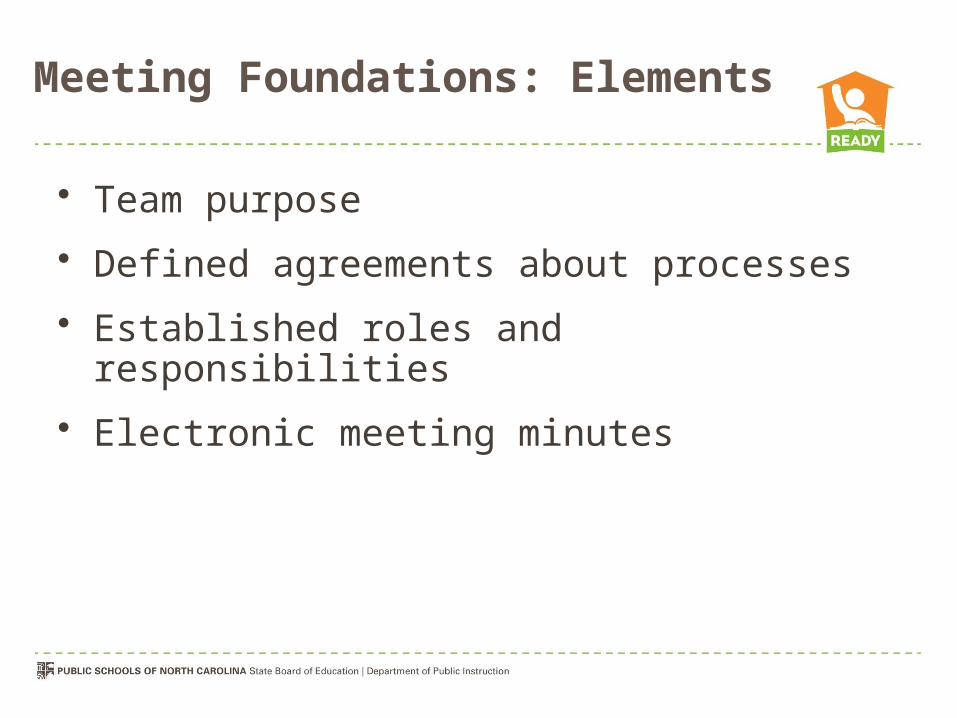
Meeting Foundations: Elements
• Team purpose • Defined agreements about processes• Established roles and responsibilities• Electronic meeting minutes
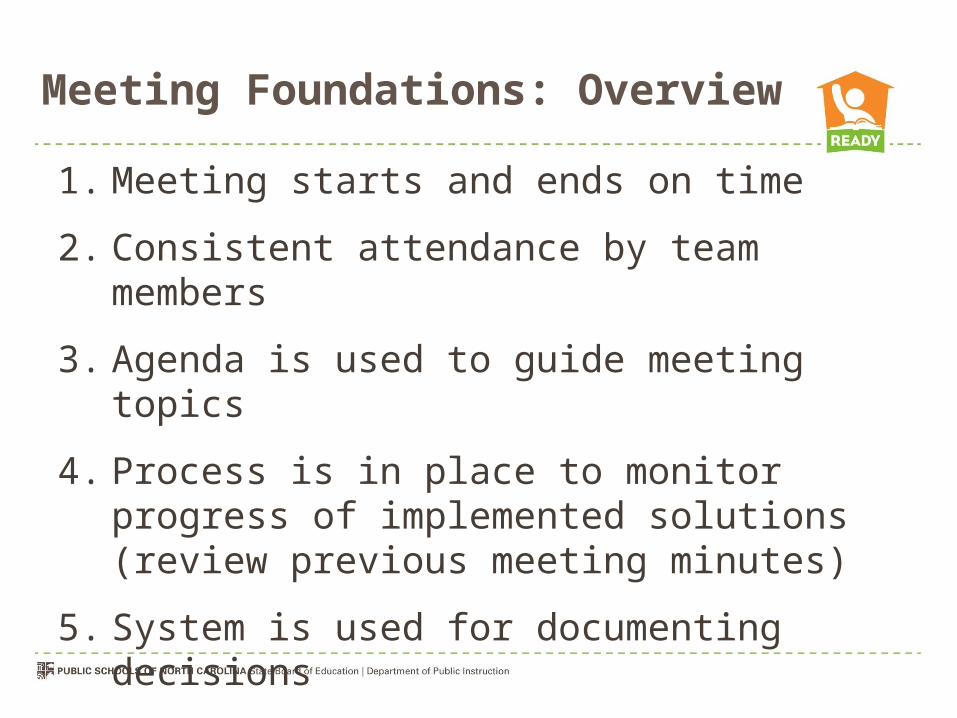
Meeting Foundations: Overview
1. Meeting starts and ends on time
2. Consistent attendance by team members
3. Agenda is used to guide meeting topics
4. Process is in place to monitor progress of implemented solutions (review previous meeting minutes)
5. System is used for documenting decisions
6. Next Meeting is scheduled
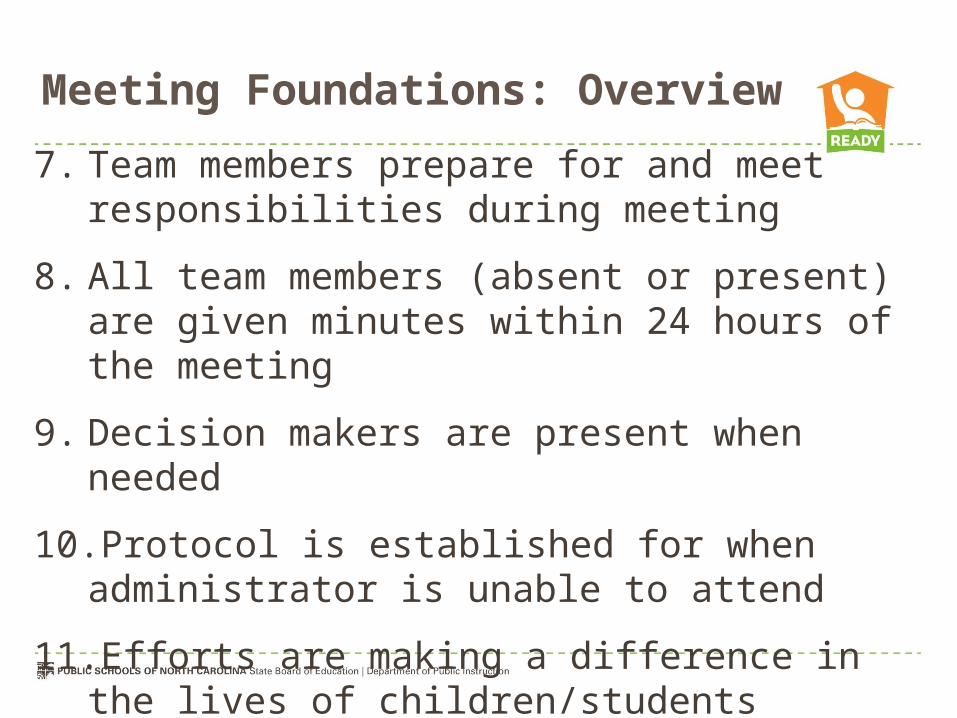
Meeting Foundations: Overview7. Team members prepare for and meet
responsibilities during meeting
8. All team members (absent or present) are given minutes within 24 hours of the meeting
9. Decision makers are present when needed
10.Protocol is established for when administrator is unable to attend
11.Efforts are making a difference in the lives of children/students
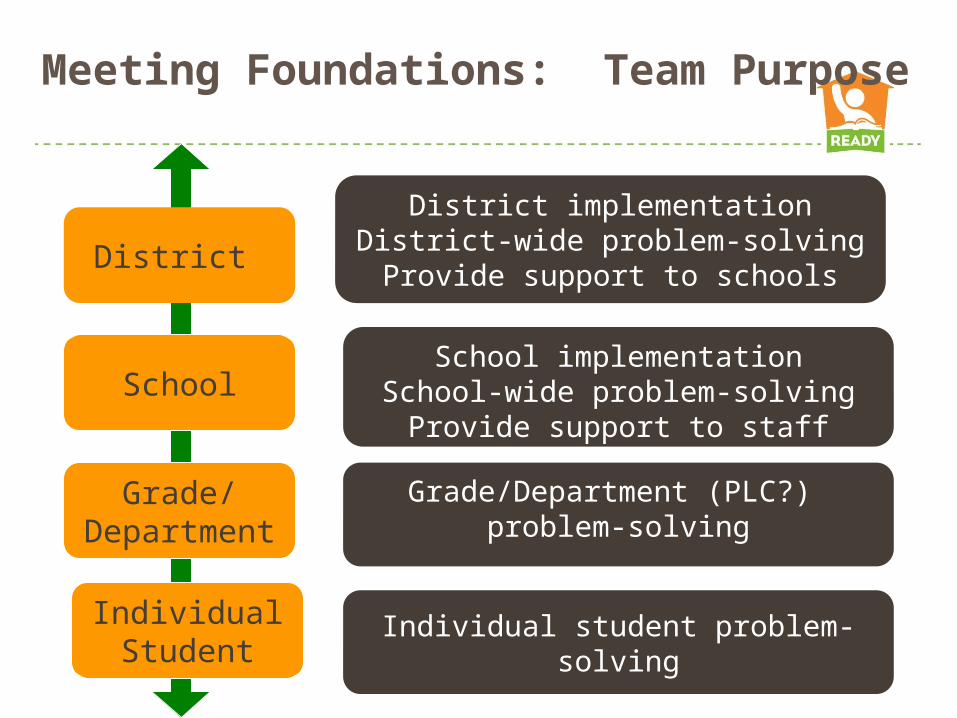
Meeting Foundations: Team Purpose
District
School
Grade/Department
Individual Student
District implementationDistrict-wide problem-solvingProvide support to schools
School implementationSchool-wide problem-solving
Provide support to staff
Grade/Department (PLC?) problem-solving
Individual student problem-solving
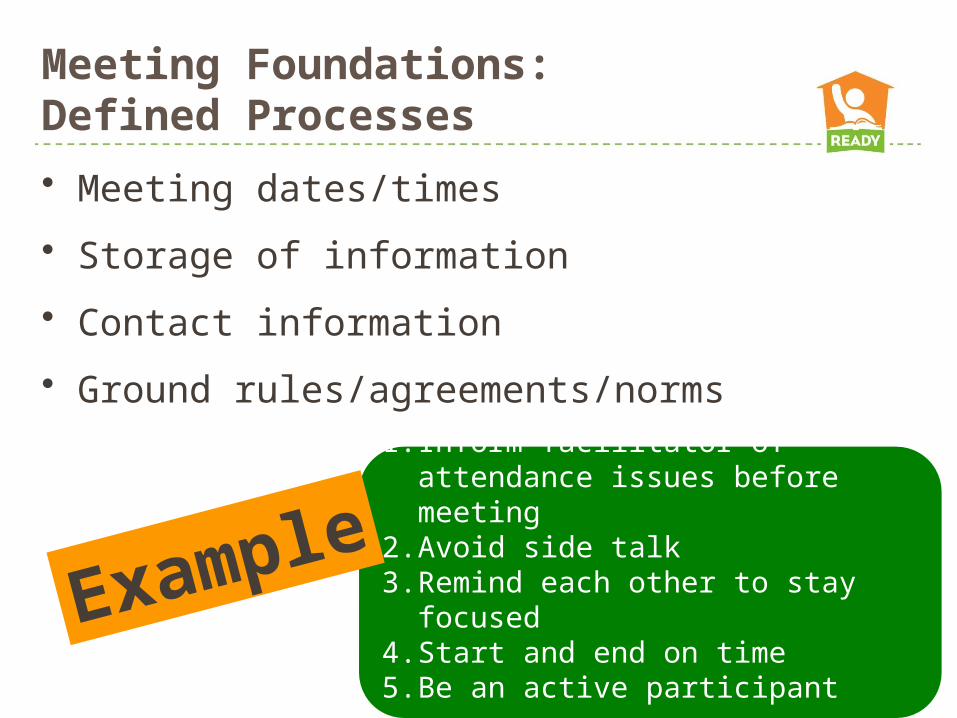
Meeting Foundations: Defined Processes • Meeting dates/times
• Storage of information
• Contact information
• Ground rules/agreements/norms
1. Inform facilitator of attendance issues before meeting
2. Avoid side talk3. Remind each other to stay focused4. Start and end on time5. Be an active participant
Example
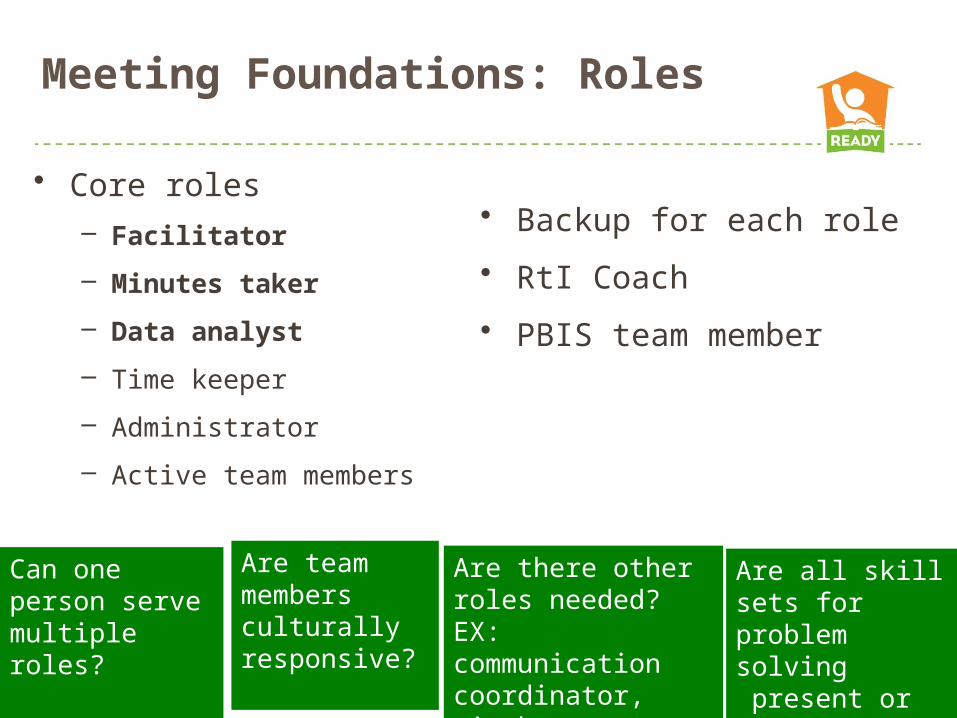
Meeting Foundations: Roles
• Core roles– Facilitator– Minutes taker– Data analyst– Time keeper
– Administrator
– Active team members
Are all skill sets for problem solving present or easily accessible?
Can one person serve multiple roles?
Are there other roles needed? EX: communication coordinator, timekeeper
Are team members culturally responsive?
• Backup for each role
• RtI Coach
• PBIS team member
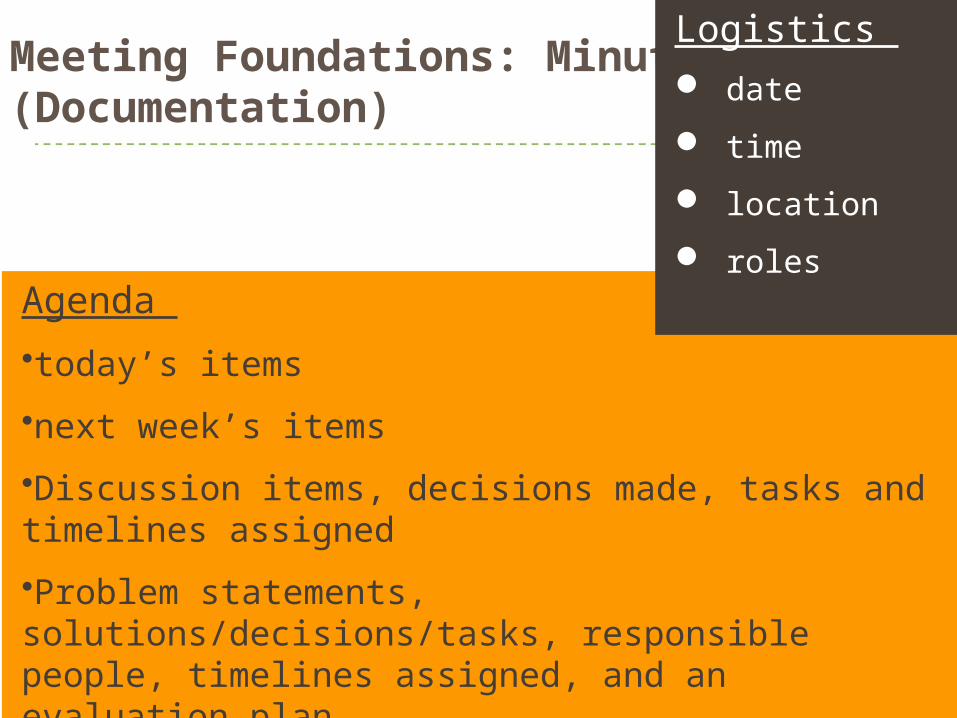
Meeting Foundations: Minutes (Documentation)
Agenda •today’s items
•next week’s items
•Discussion items, decisions made, tasks and timelines assigned
•Problem statements, solutions/decisions/tasks, responsible people, timelines assigned, and an evaluation plan
Logistics date
time
location
roles
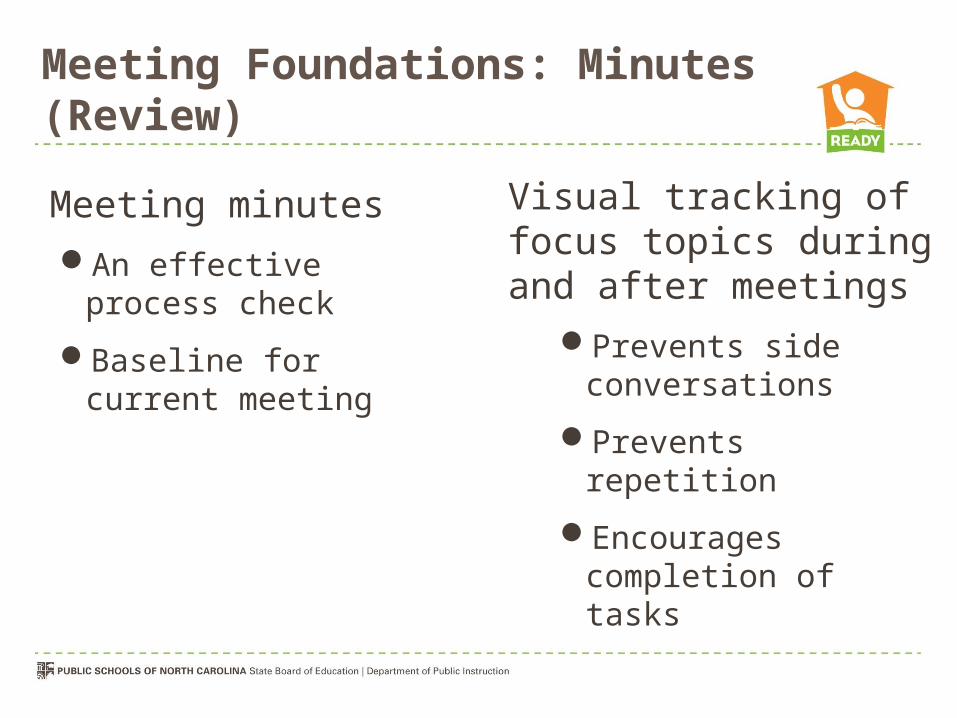
Meeting Foundations: Minutes (Review)
Meeting minutes An effective process
check
Baseline for current meeting
Visual tracking of focus topics during and after meetings
Prevents side conversations
Prevents repetition
Encourages completion of tasks
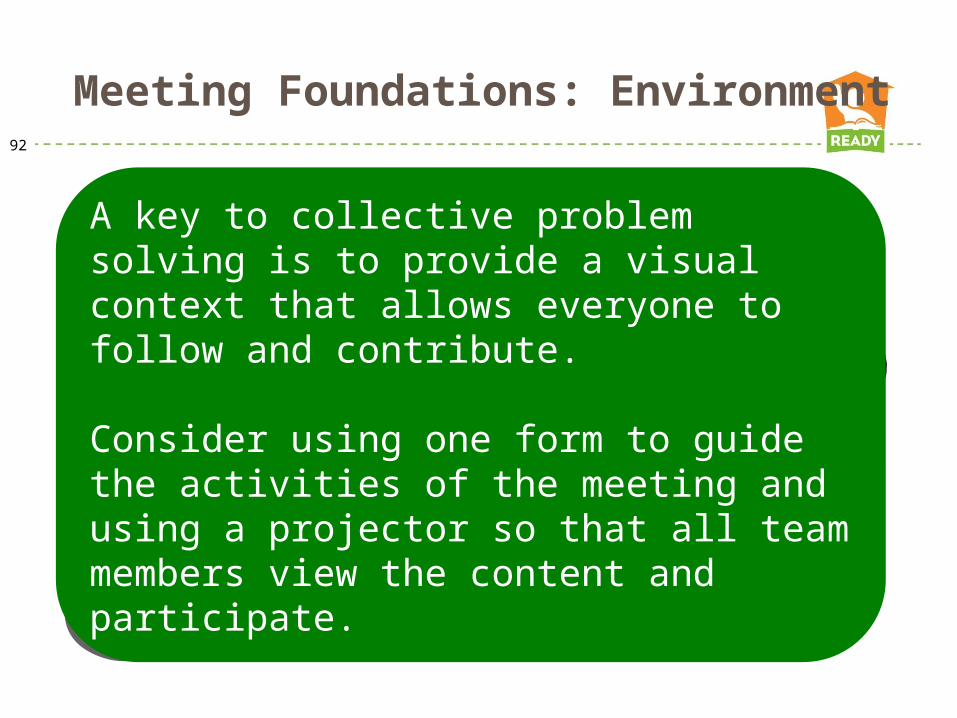
Meeting Foundations: Environment
92
Problem
SolutionOut of
Time
Use Data
A key to collective problem solving is to provide a visual context that allows everyone to follow and contribute.
Consider using one form to guide the activities of the meeting and using a projector so that all team members view the content and participate.
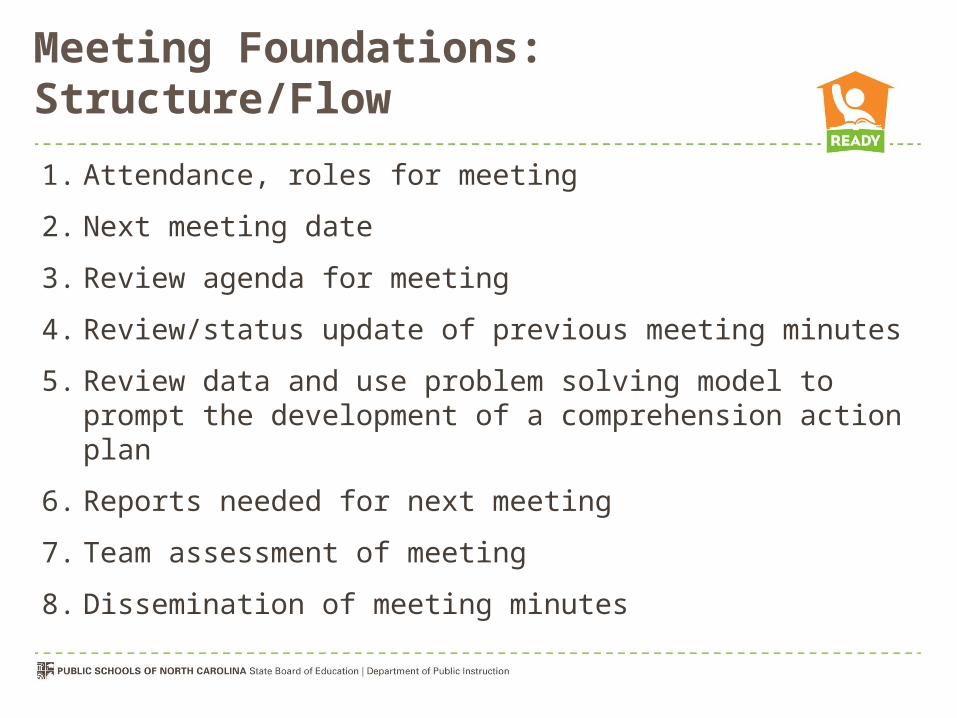
Meeting Foundations: Structure/Flow1. Attendance, roles for meeting
2. Next meeting date
3. Review agenda for meeting
4. Review/status update of previous meeting minutes
5. Review data and use problem solving model to prompt the development of a comprehension action plan
6. Reports needed for next meeting
7. Team assessment of meeting
8. Dissemination of meeting minutes
Data-Based Decision Making
Identify Problems

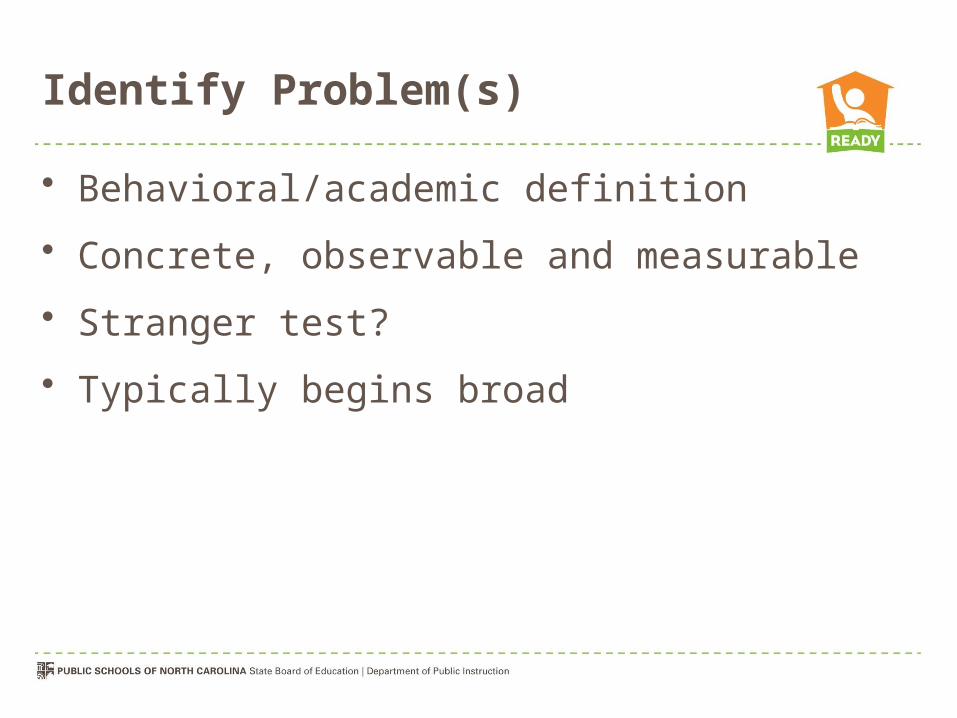
Identify Problem(s)
• Behavioral/academic definition
• Concrete, observable and measurable
• Stranger test?
• Typically begins broad
Data-Based Decision Baking
Develop Hypothesis
Develop and Test Hypothesis: Determine Cause of Problem
• Determining the cause, or uncovering why a problem is occurring, is essential to developing interventions.
• The goal is to help students be successful.
• When collecting data, it is important for staff to make their best, most informed guesses about why students are struggling.
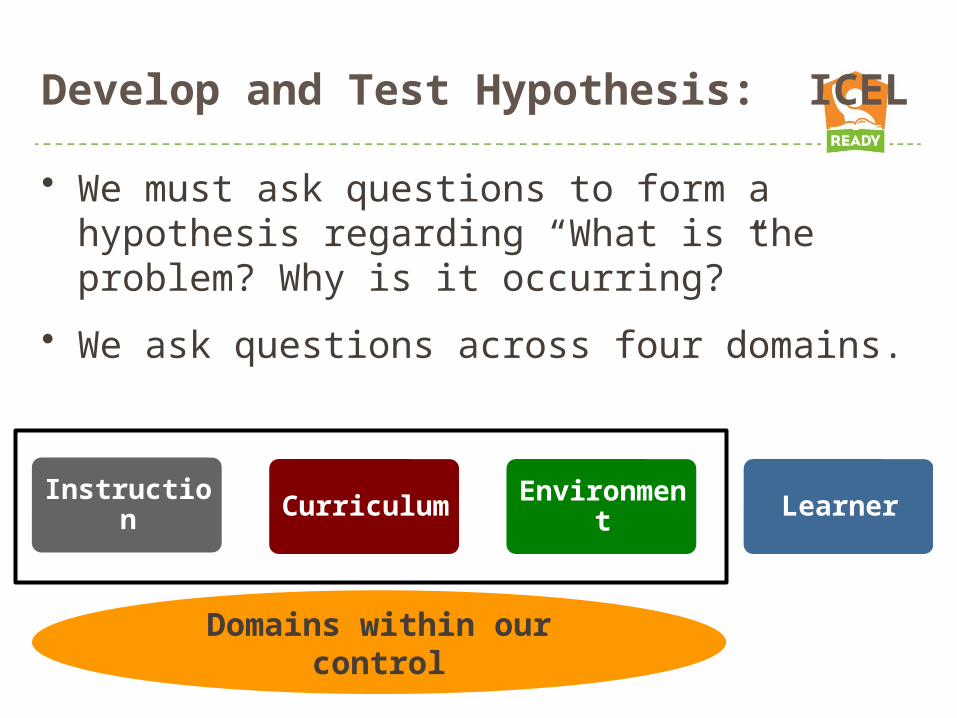
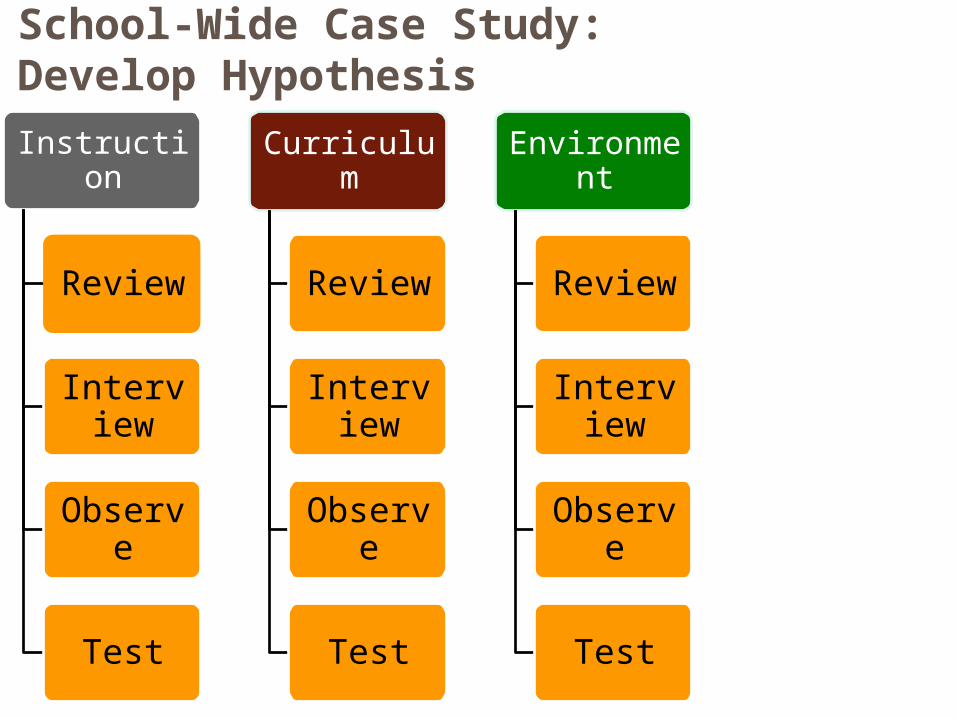
Develop and Test Hypothesis: ICEL
• We must ask questions to form a hypothesis regarding “What is the problem? Why is it occurring?”
• We ask questions across four domains.
Instruction Curriculum Environment Learner
Domains within our control
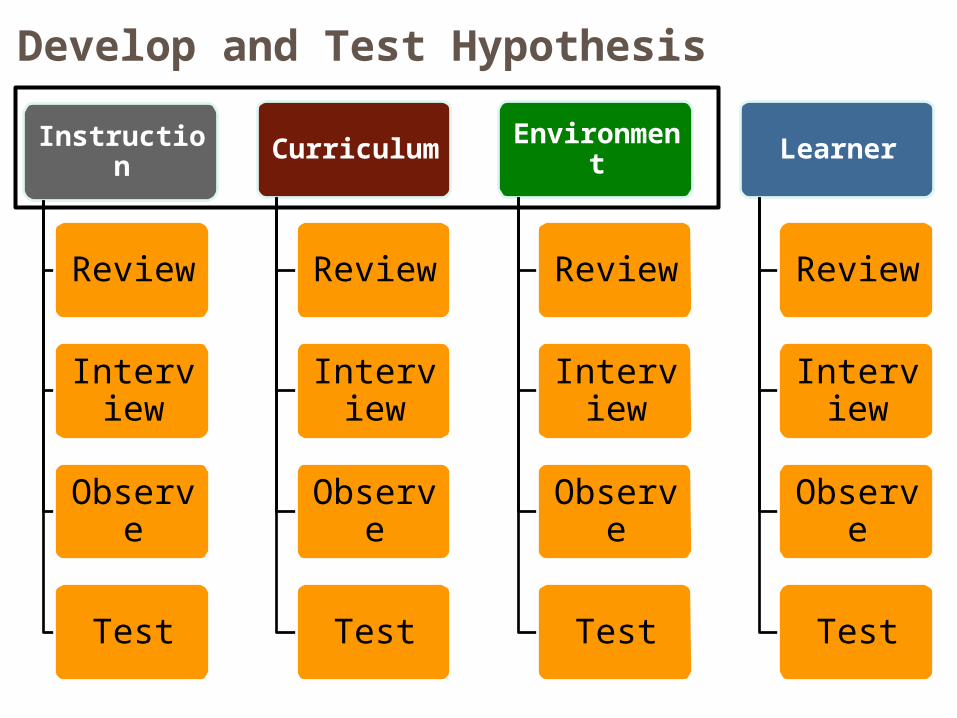
Instruction
Review
Interview
Observe
Test
Curriculum
Review
Interview
Observe
Test
Environment
Review
Interview
Observe
Test
Learner
Review
Interview
Observe
Test
Develop and Test Hypothesis
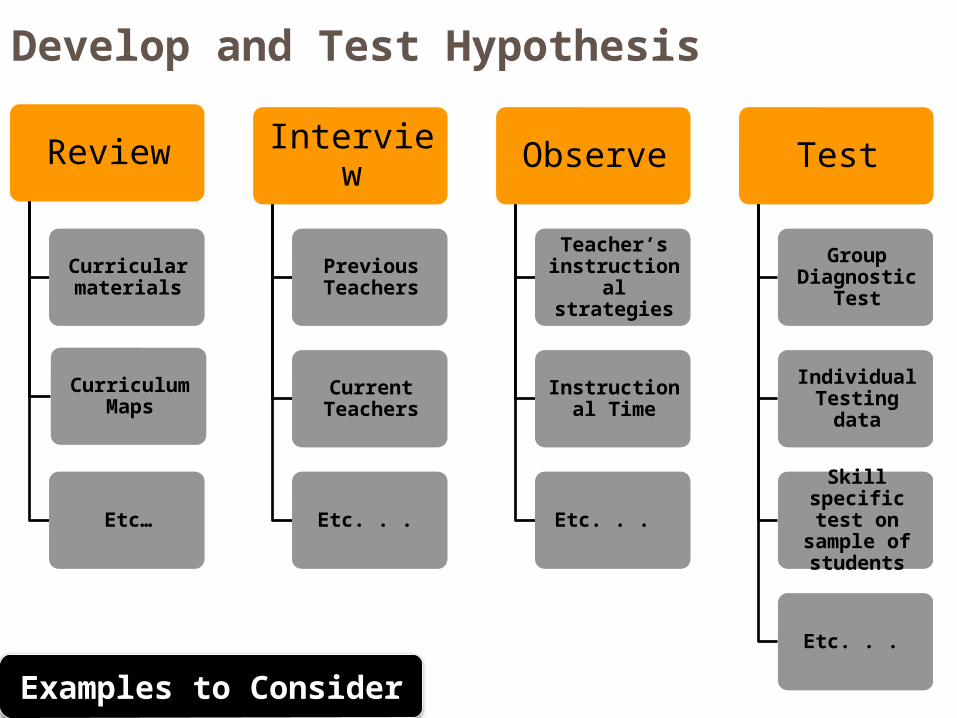
Develop and Test Hypothesis
Review
Curricular materials
Curriculum Maps
Etc…
Interview
Previous Teachers
Current Teachers
Etc. . .
Observe
Teacher’s instructional
strategies
Instructional Time
Etc. . .
Test
Group Diagnostic
Test
Individual Testing data
Skill specific test on sample
of students
Etc. . .
Examples to Consider
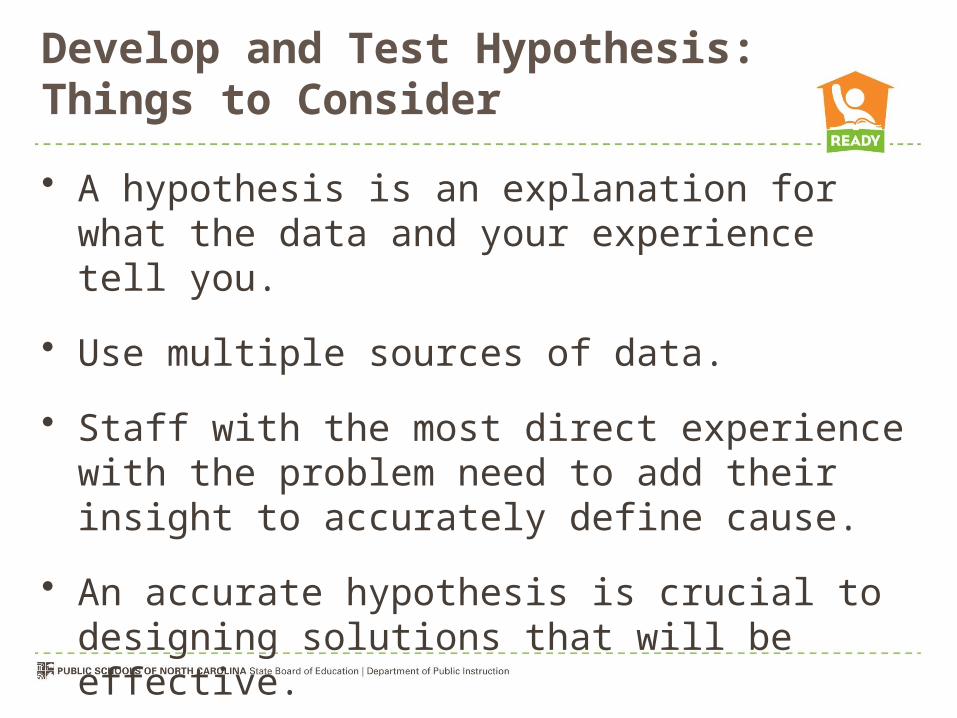
Develop and Test Hypothesis: Things to Consider• A hypothesis is an explanation for what the data
and your experience tell you.
• Use multiple sources of data.
• Staff with the most direct experience with the problem need to add their insight to accurately define cause.
• An accurate hypothesis is crucial to designing solutions that will be effective.
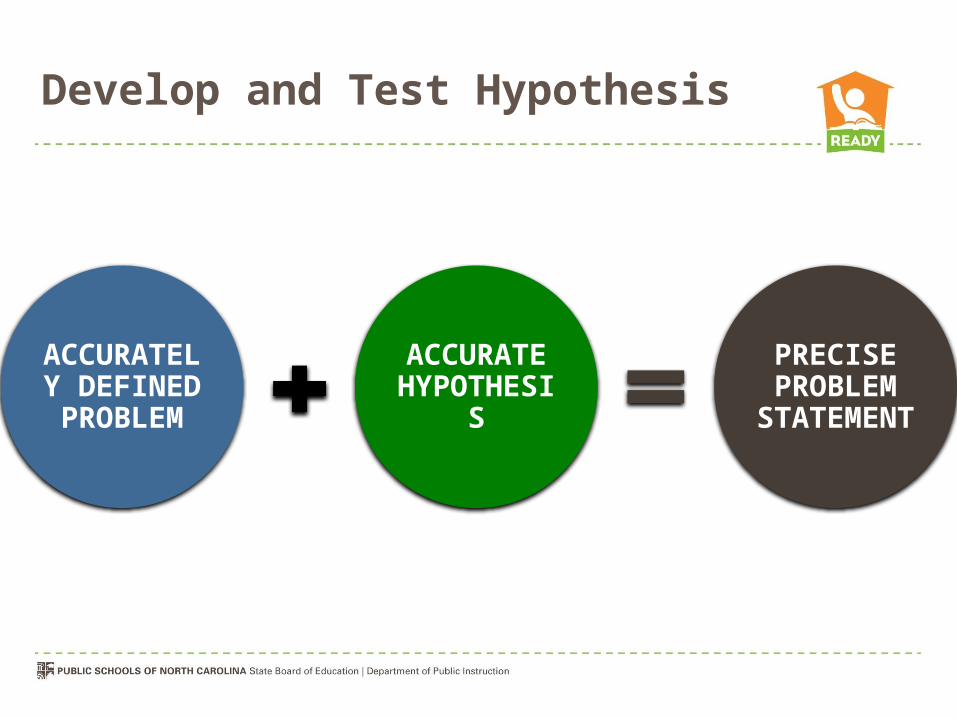
Develop and Test Hypothesis
ACCURATELY
DEFINED PROBLEM
ACCURATE HYPOTHES
IS
PRECISE PROBLEM STATEMEN
T
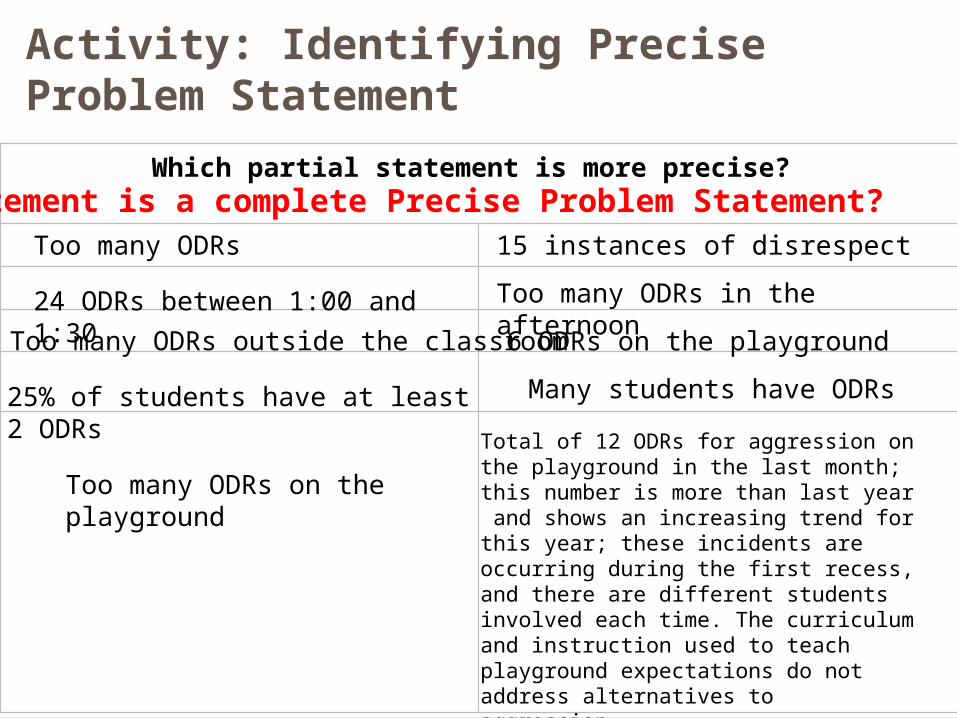
Activity: Identifying Precise Problem Statement
Which partial statement is more precise?
Too many ODRs 15 instances of disrespect
24 ODRs between 1:00 and 1:30 Too many ODRs in the afternoon
Too many ODRs outside the classroom
25% of students have at least 2 ODRs
Too many ODRs on the playground
6 ODRs on the playground
Many students have ODRs
Total of 12 ODRs for aggression on the playground in the last month; this number is more than last year and shows an increasing trend for this year; these incidents are occurring during the first recess, and there are different students involved each time. The curriculum and instruction used to teach playground expectations do not address alternatives to aggression.
Which statement is a complete Precise Problem Statement?
Data-Based Decision MakingDiscuss and Select Solutions

Discuss and Select Solutions
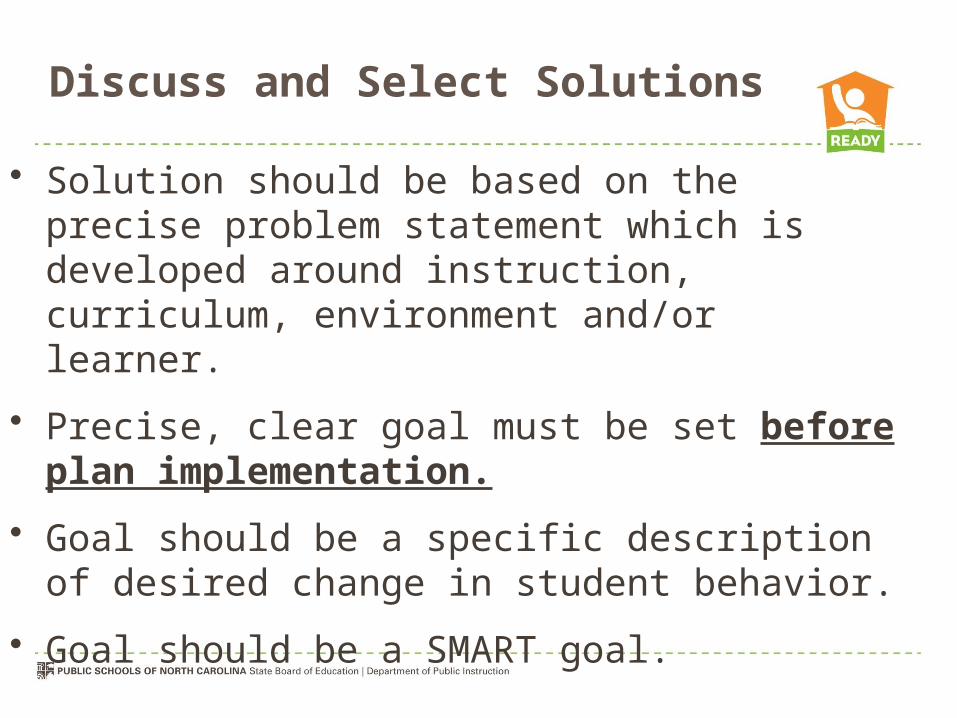
• Solution should be based on the precise problem statement which is developed around instruction, curriculum, environment and/or learner.
• Precise, clear goal must be set before plan implementation.
• Goal should be a specific description of desired change in student behavior.
• Goal should be a SMART goal.
Discuss and Select Solutions
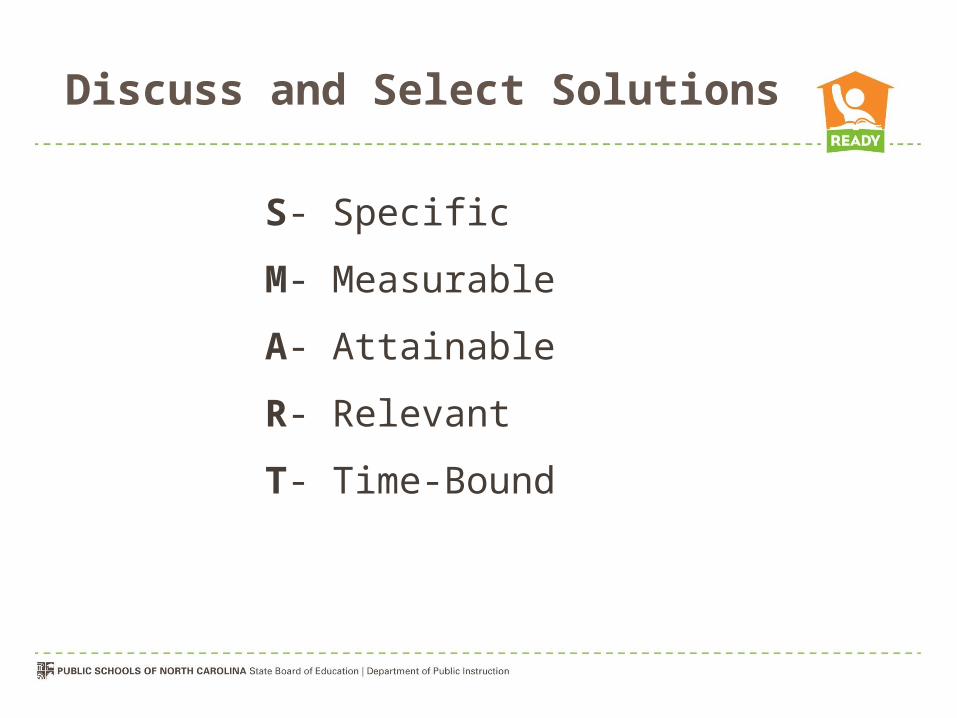
S- Specific
M- Measurable
A- Attainable
R- Relevant
T- Time-Bound
Activity: SMART Practice
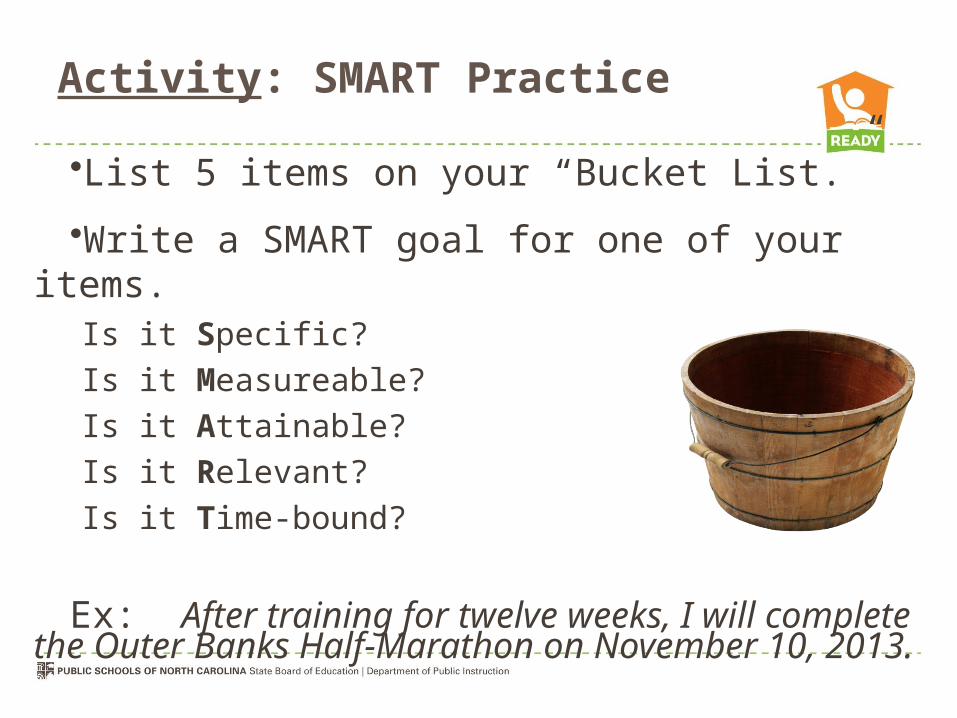
•List 5 items on your “Bucket List.”
•Write a SMART goal for one of your items.Is it Specific?Is it Measureable? Is it Attainable?Is it Relevant?Is it Time-bound?
Ex: After training for twelve weeks, I will complete the Outer Banks Half-Marathon on November 10, 2013.
Data-Based Decision MakingDevelop Action Plan

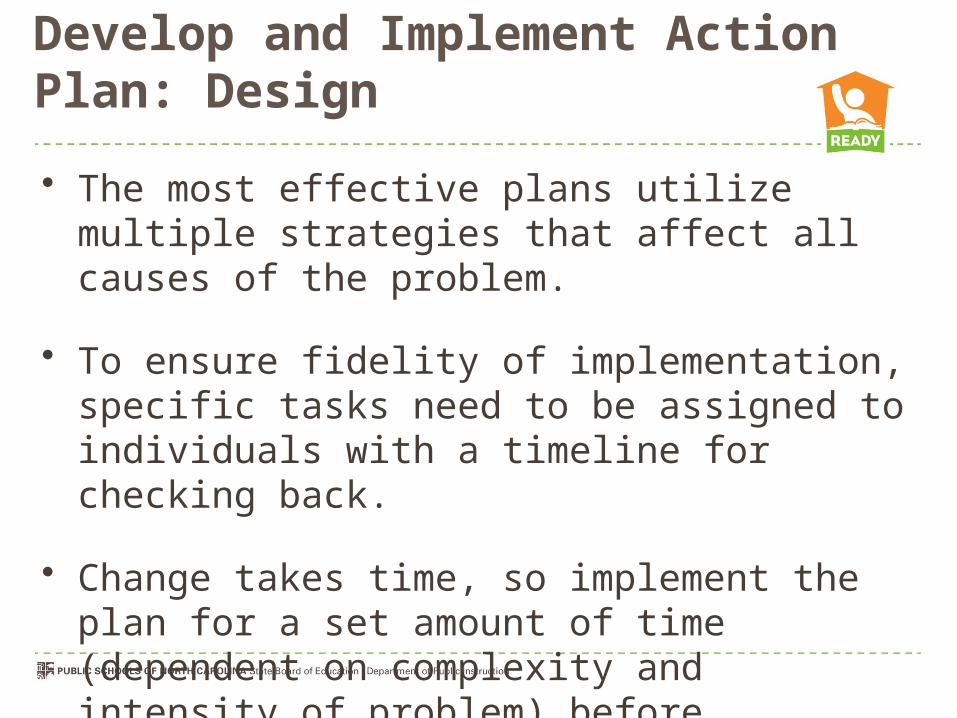
Develop and Implement Action Plan: Design• The most effective plans utilize multiple strategies
that affect all causes of the problem.
• To ensure fidelity of implementation, specific tasks need to be assigned to individuals with a timeline for checking back.
• Change takes time, so implement the plan for a set amount of time (dependent on complexity and intensity of problem) before evaluating.
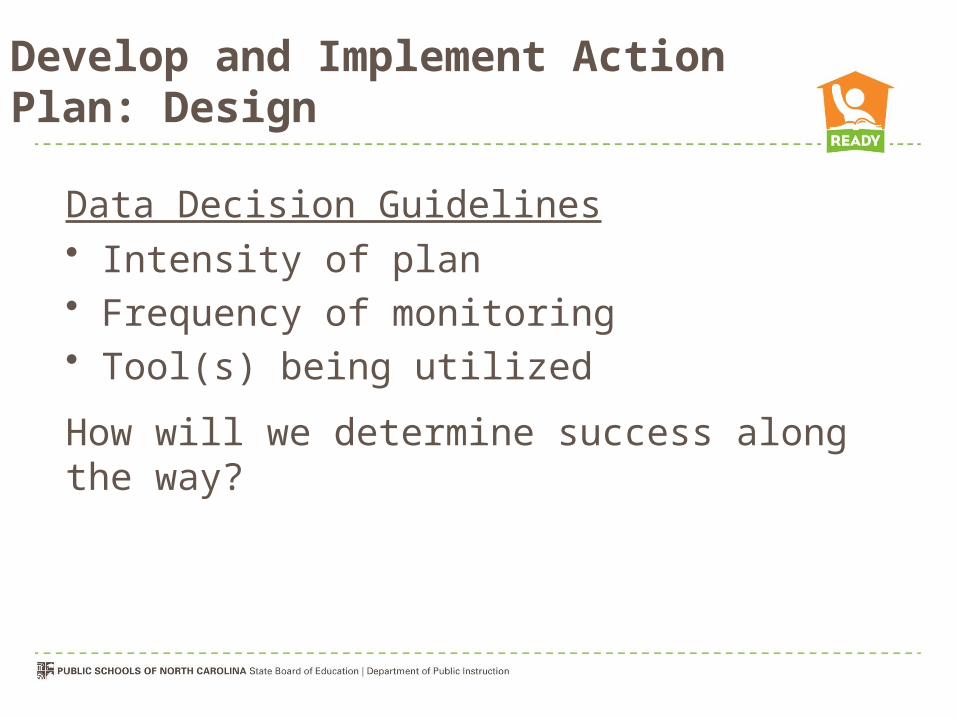
Develop and Implement Action Plan: Design
Data Decision Guidelines• Intensity of plan• Frequency of monitoring• Tool(s) being utilized
How will we determine success along the way?
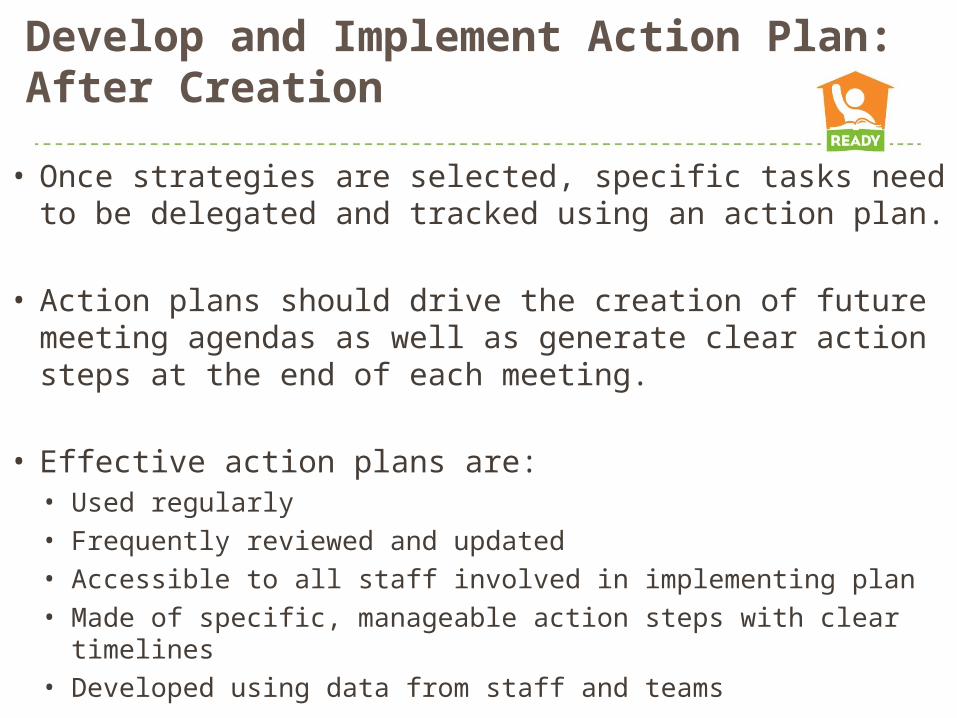
Develop and Implement Action Plan: After Creation
• Once strategies are selected, specific tasks need to be delegated and tracked using an action plan.
• Action plans should drive the creation of future meeting agendas as well as generate clear action steps at the end of each meeting.
• Effective action plans are:• Used regularly• Frequently reviewed and updated• Accessible to all staff involved in implementing plan• Made of specific, manageable action steps with clear timelines• Developed using data from staff and teams
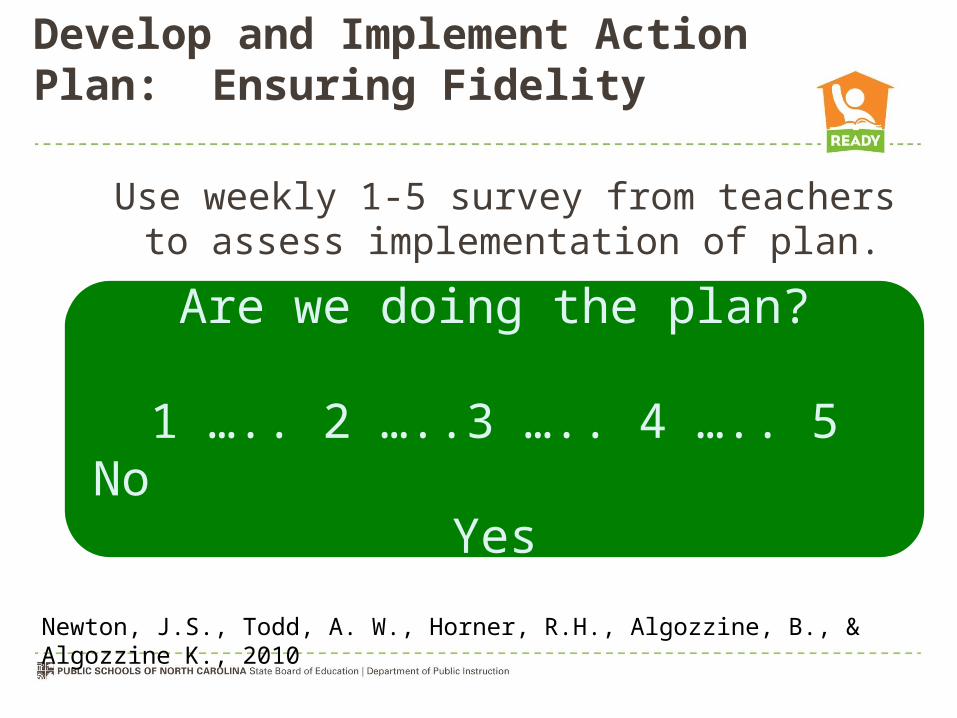
Fidelity
Use weekly 1-5 survey from teachers to assess implementation of plan.
Newton, J.S., Todd, A. W., Horner, R.H., Algozzine, B., & Algozzine K., 2010
Are we doing the plan?
1 ….. 2 …..3 ….. 4 ….. 5No Yes
Develop and Implement Action Plan: Ensuring Fidelity
Data-Based Decision MakingEvaluate and Revise Action Plan

Evaluate and Revise Action Plan
Review data to answer the following question:
Has the goal been met?
• If yes, explore the following options:
1. Increase goal for the same problem.
2. Choose another problem to address.
3. Gradually fade plan.
Evaluate and Revise Action Plan
Review data to answer the following question:
Has the goal been met?
•If no, explore the following options:
1. Evaluate fidelity of implementation.
2. Assess problem identification.
3. Consider the accuracy of the hypothesis.
4. Alter the timeline.
5. Find ways to adjust the solutions.
6. Review “like peer” data.
Making Connections• Evaluate
and Revise Action Plan
Connecting Types of Data within TIPS
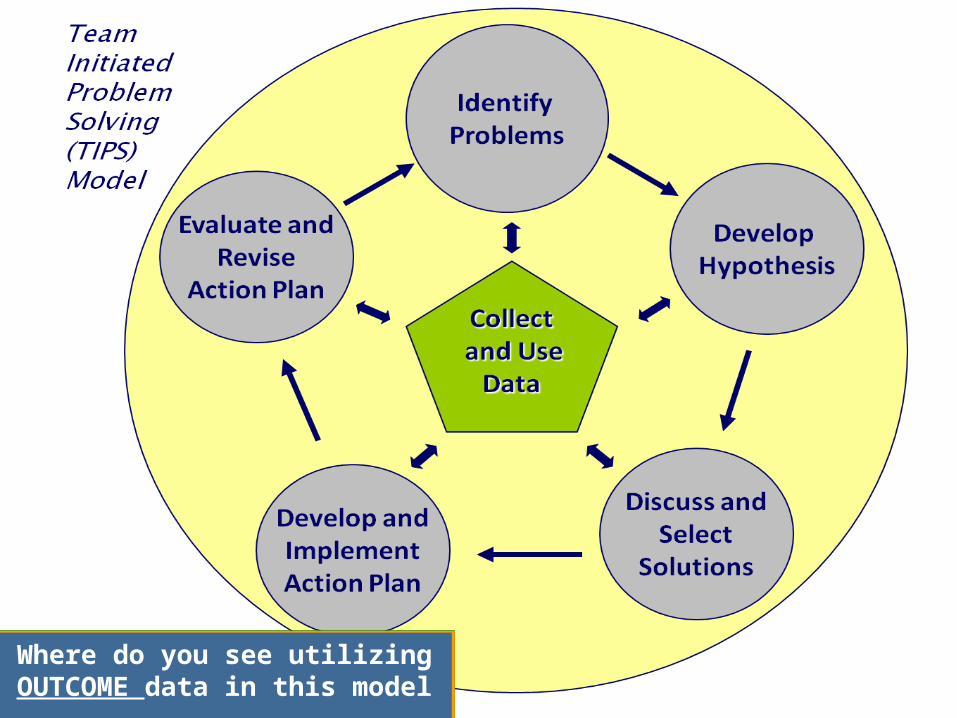
Where do you see utilizing PERCEPTION data in this model
Where do you see utilizing PROCESS data in this modelWhere do you see utilizing
OUTCOME data in this model
Data-Based Decision Making
School-Wide Case Study
The following activities work best when sitting in small groups based on building level (ex: elementary, middle, high school)
Case Study: Context
• Mid year school improvement team (SIP) meeting
• Academic and behavior outcome data is presented

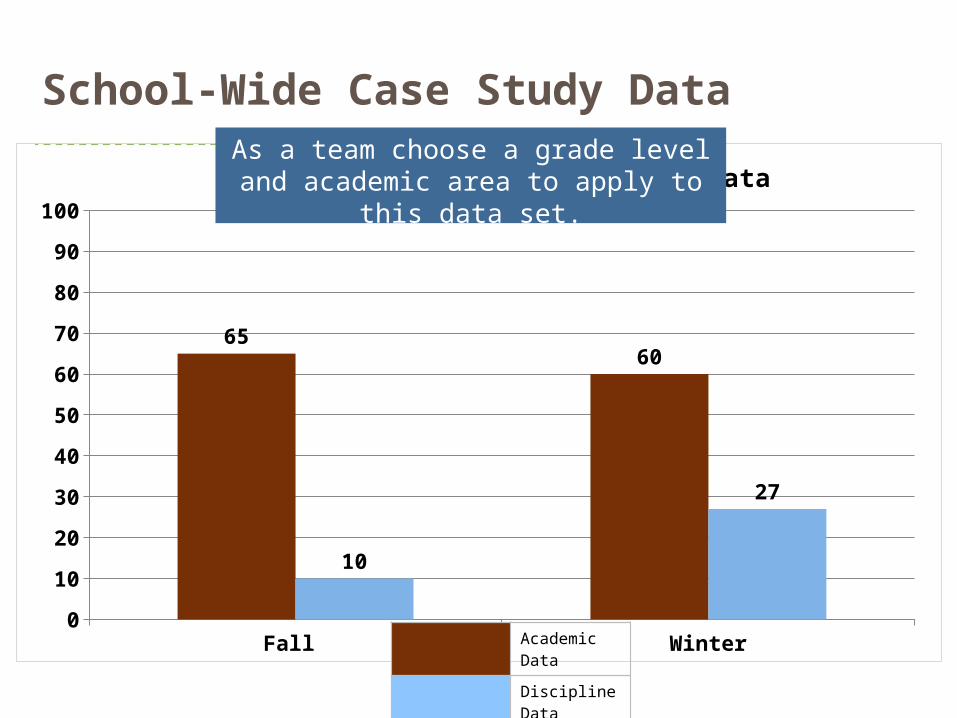
School-Wide Case Study Data
Fall Winter0
10
20
30
40
50
60
70
80
90
100
6560
10
27
Academic and Discipline Data
Academic Data
Discipline Data
As a team choose a grade level and academic area to apply to this data set.
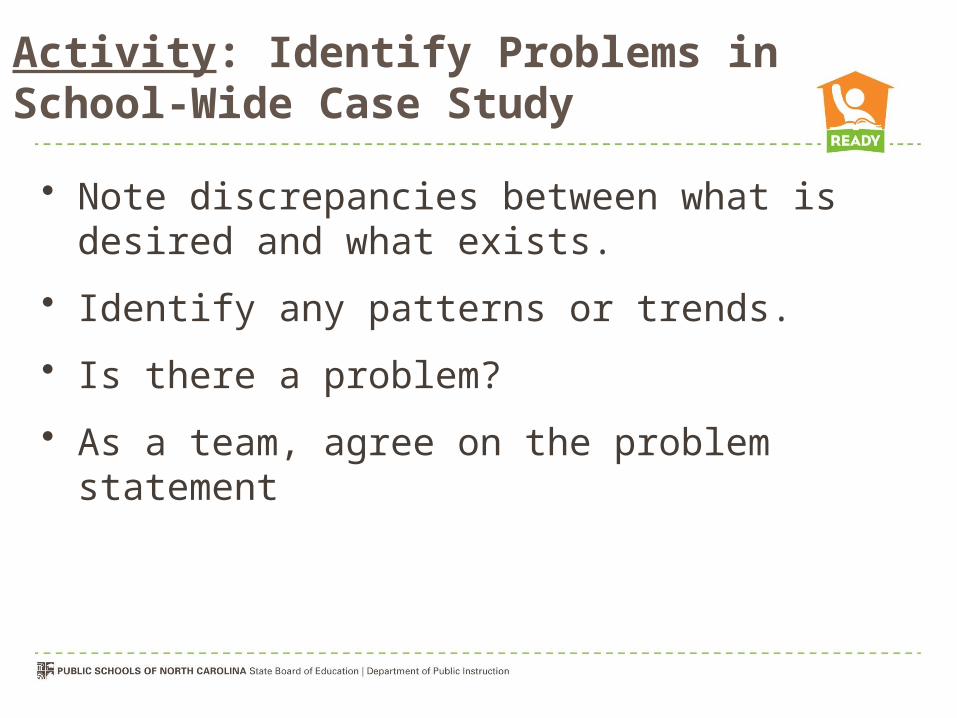
Activity: Identify Problems in School-Wide Case Study
• Note discrepancies between what is desired and what exists.
• Identify any patterns or trends.
• Is there a problem?
• As a team, agree on the problem statement

Instruction
Review
Interview
Observe
Test
Curriculum
Review
Interview
Observe
Test
Environment
Review
Interview
Observe
Test
Learner
Review
Interview
Observe
Test
School-Wide Case Study:Develop Hypothesis
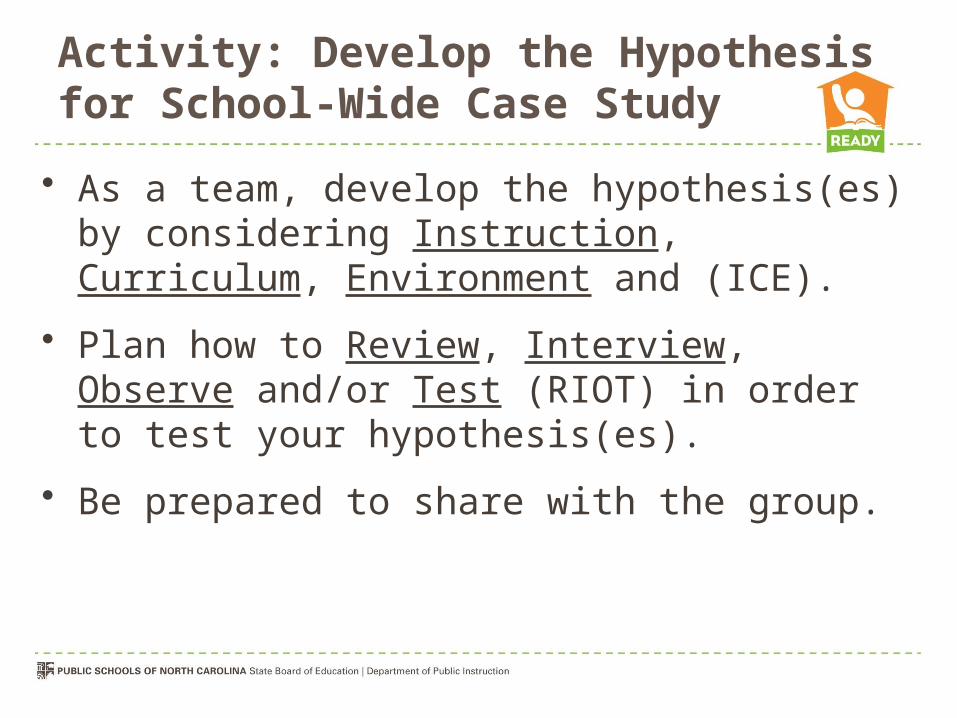
Activity: Develop the Hypothesis for School-Wide Case Study
• As a team, develop the hypothesis(es) by considering Instruction, Curriculum, Environment and (ICE).
• Plan how to Review, Interview, Observe and/or Test (RIOT) in order to test your hypothesis(es).
• Be prepared to share with the group.

School-Wide Case Study: Digging DeeperWhat questions do you have about instruction, curriculum and environment for this grade level?
Instruction
Curriculum
Environment
Handout
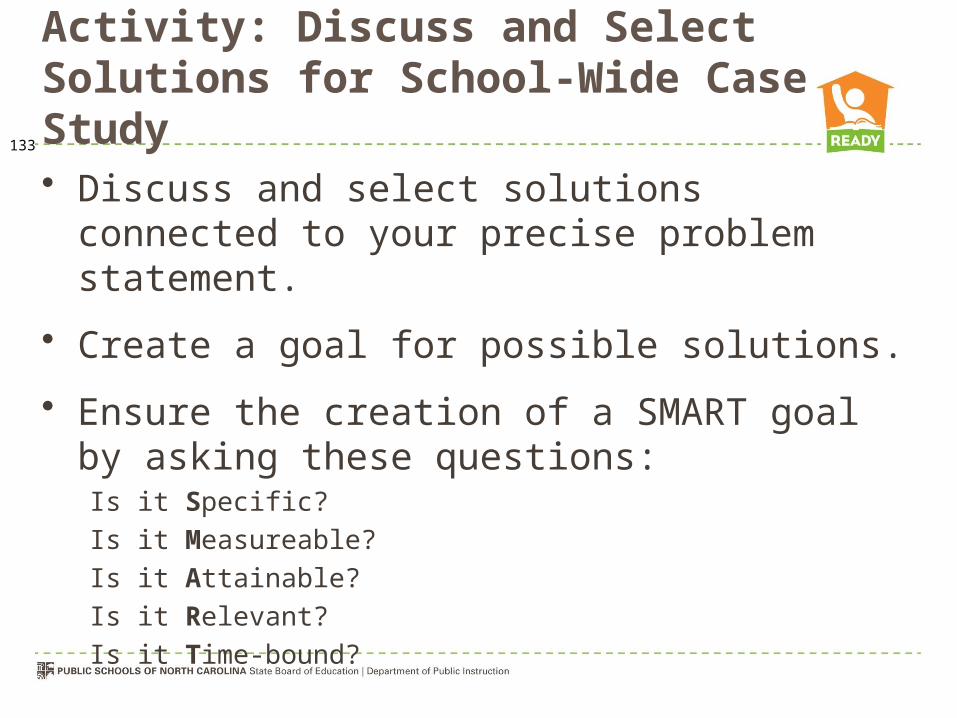
Activity: Discuss and Select Solutions for School-Wide Case Study133
• Discuss and select solutions connected to your precise problem statement.
• Create a goal for possible solutions.
• Ensure the creation of a SMART goal by asking these questions:Is it Specific?Is it Measureable? Is it Attainable?Is it Relevant?Is it Time-bound?

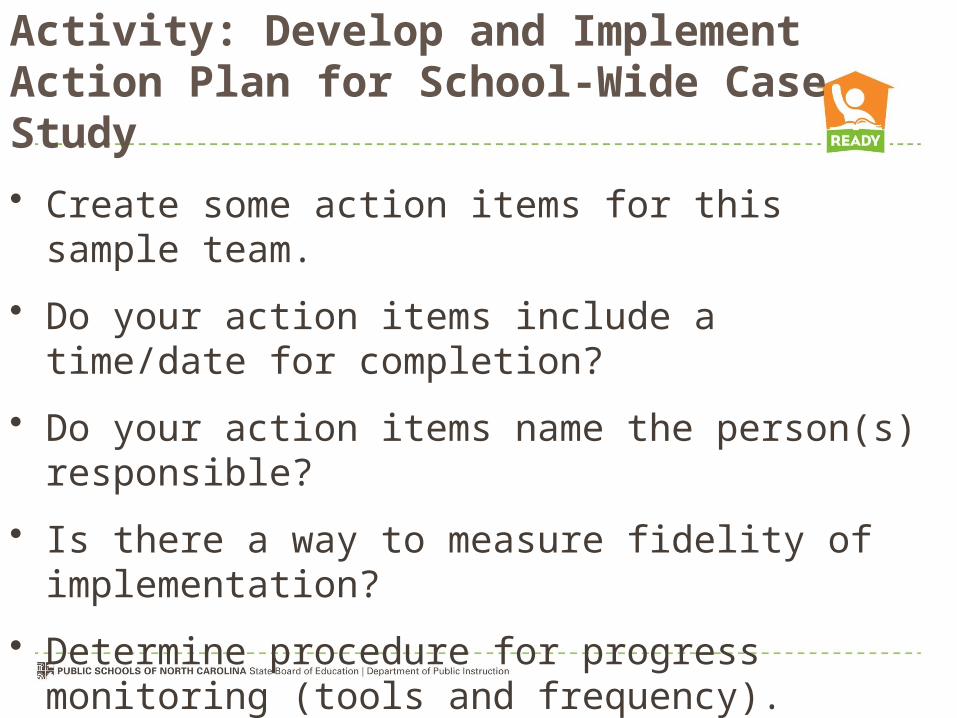
Activity: Develop and Implement Action Plan for School-Wide Case Study• Create some action items for this sample team.
• Do your action items include a time/date for completion?
• Do your action items name the person(s) responsible?
• Is there a way to measure fidelity of implementation?
• Determine procedure for progress monitoring (tools and frequency).
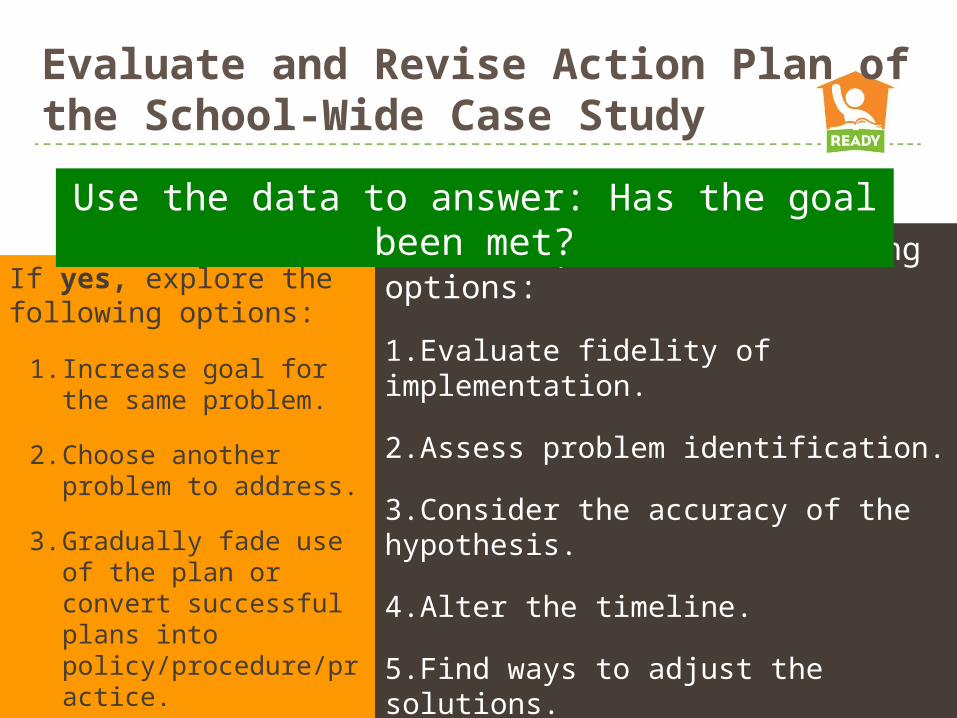
Evaluate and Revise Action Plan of the School-Wide Case Study
If yes, explore the following options:
1. Increase goal for the same problem.
2. Choose another problem to address.
3. Gradually fade use of the plan or convert successful plans into policy/procedure/practice.
If no, explore the following options:
1.Evaluate fidelity of implementation.
2.Assess problem identification.
3.Consider the accuracy of the hypothesis.
4.Alter the timeline.
5.Find ways to adjust the solutions.
6.Review “like peer” data.
Use the data to answer: Has the goal been met?
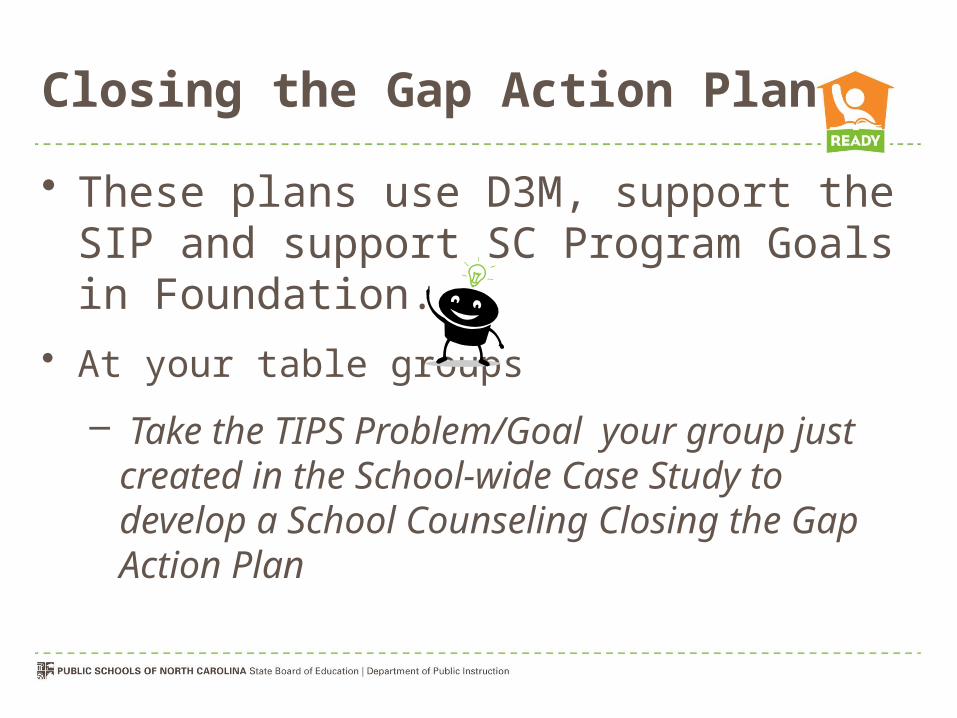
Closing the Gap Action Plan
• These plans use D3M, support the SIP and support SC Program Goals in Foundation.
• At your table groups
– Take the TIPS Problem/Goal your group just created in the School-wide Case Study to develop a School Counseling Closing the Gap Action Plan
Data-Based Decision Making
Individual Student Case Study
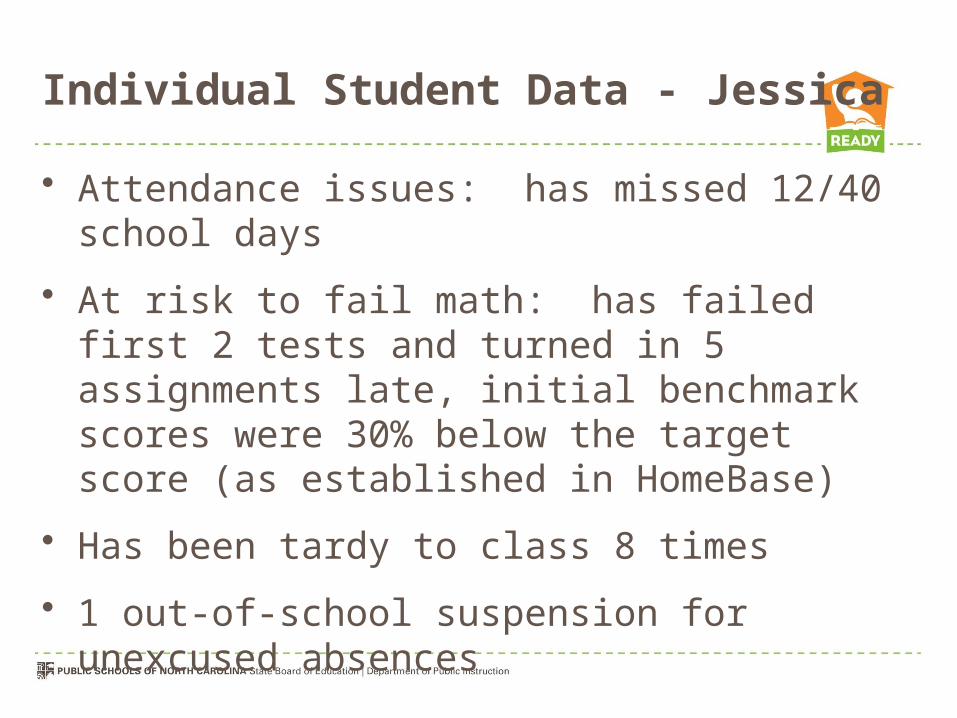
Individual Student Data - Jessica
• Attendance issues: has missed 12/40 school days
• At risk to fail math: has failed first 2 tests and turned in 5 assignments late, initial benchmark scores were 30% below the target score (as established in HomeBase)
• Has been tardy to class 8 times
• 1 out-of-school suspension for unexcused absences
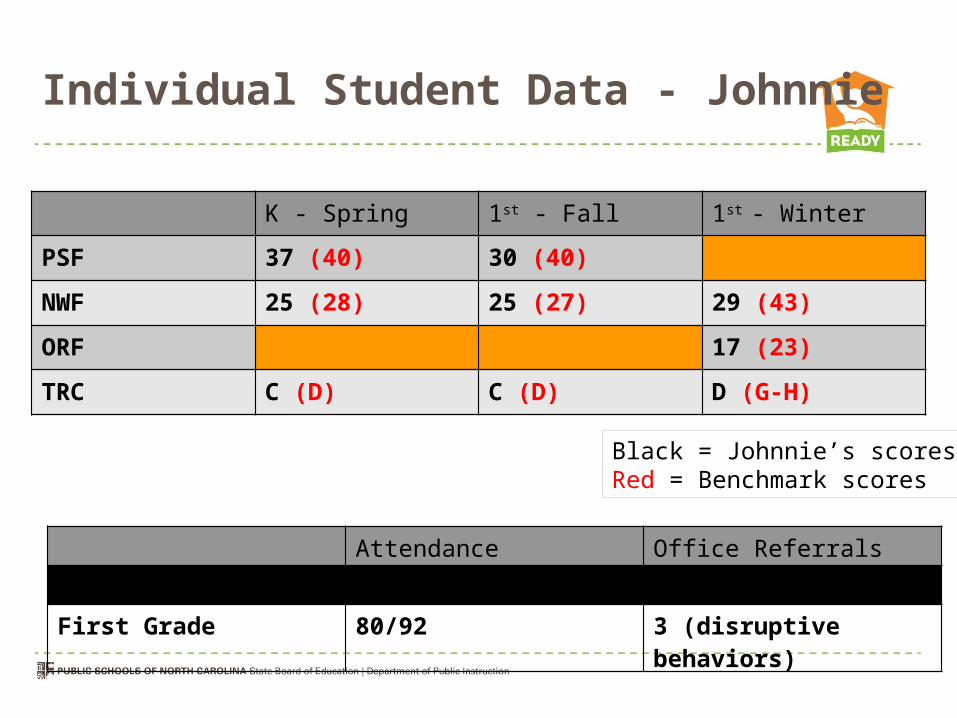
Individual Student Data - Johnnie
K - Spring 1st - Fall 1st - Winter
PSF 37 (40) 30 (40)
NWF 25 (28) 25 (27) 29 (43)
ORF 17 (23)
TRC C (D) C (D) D (G-H)
Black = Johnnie’s scoresRed = Benchmark scores
Attendance Office Referrals
Kindergarten 173/180 0First Grade 80/92 3 (disruptive behaviors)
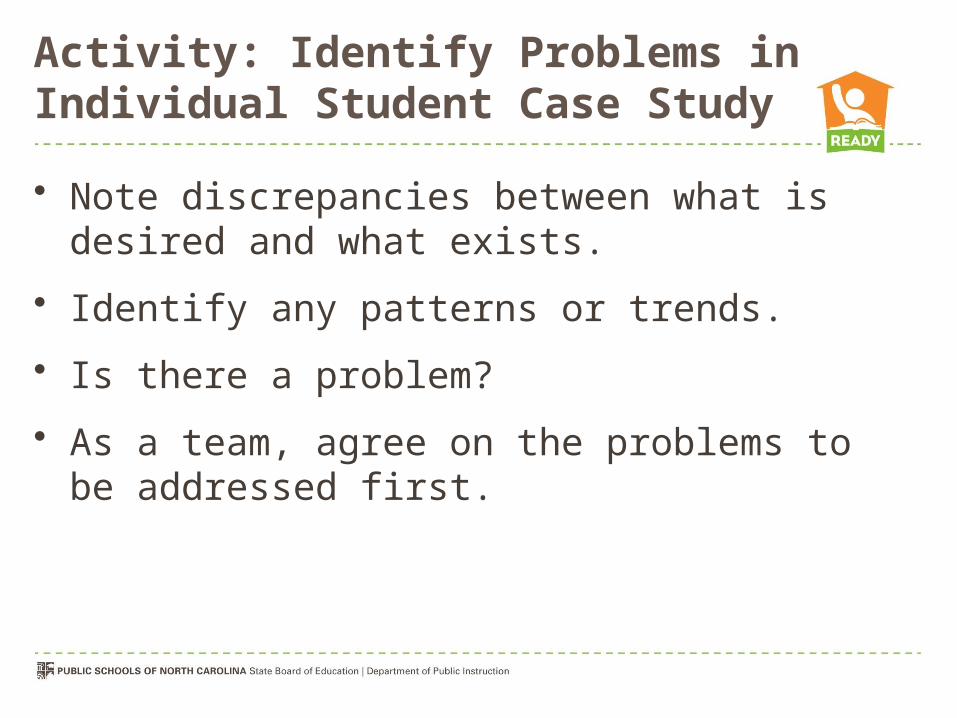
Activity: Identify Problems in Individual Student Case Study
• Note discrepancies between what is desired and what exists.
• Identify any patterns or trends.
• Is there a problem?
• As a team, agree on the problems to be addressed first.
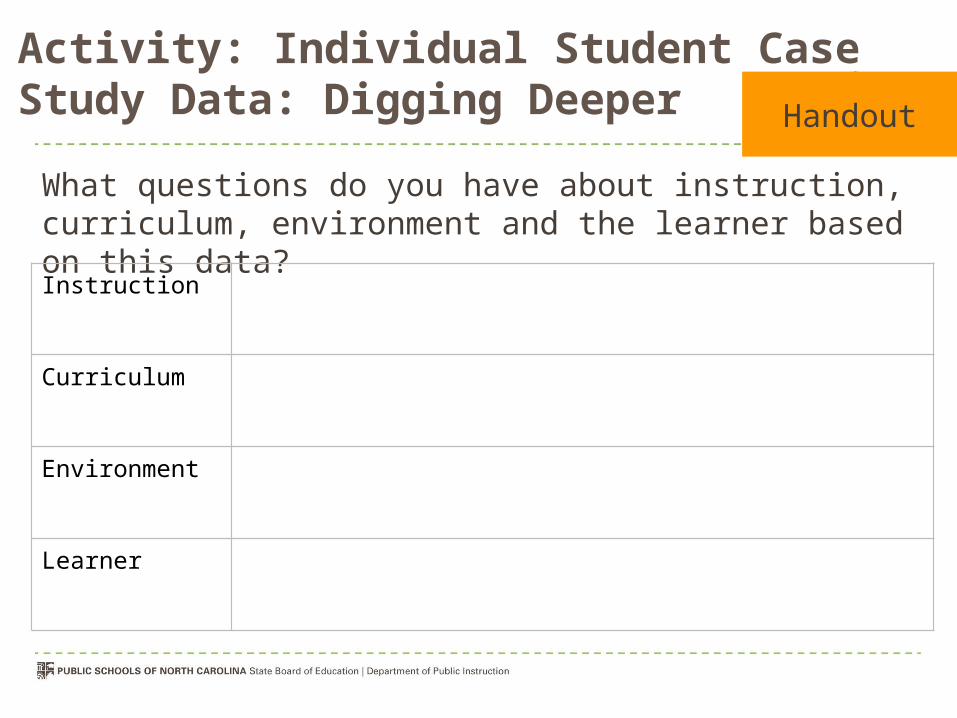
Activity: Individual Student Case Study Data: Digging Deeper
What questions do you have about instruction, curriculum, environment and the learner based on this data?
Instruction
Curriculum
Environment
Learner
Handout
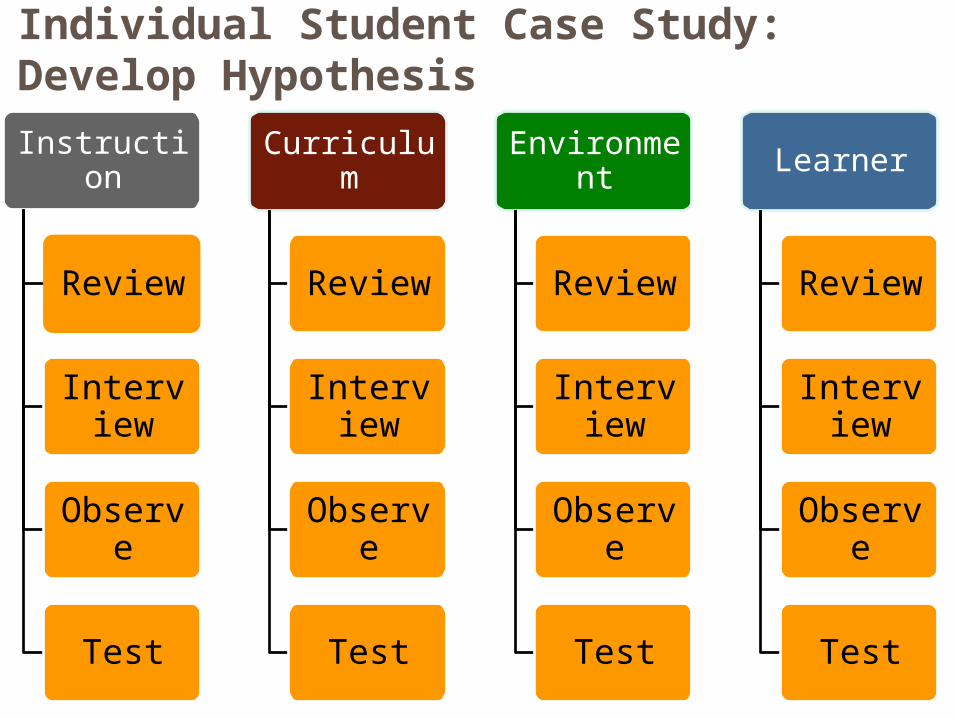
Instruction
Review
Interview
Observe
Test
Curriculum
Review
Interview
Observe
Test
Environment
Review
Interview
Observe
Test
Learner
Review
Interview
Observe
Test
Individual Student Case Study:Develop Hypothesis
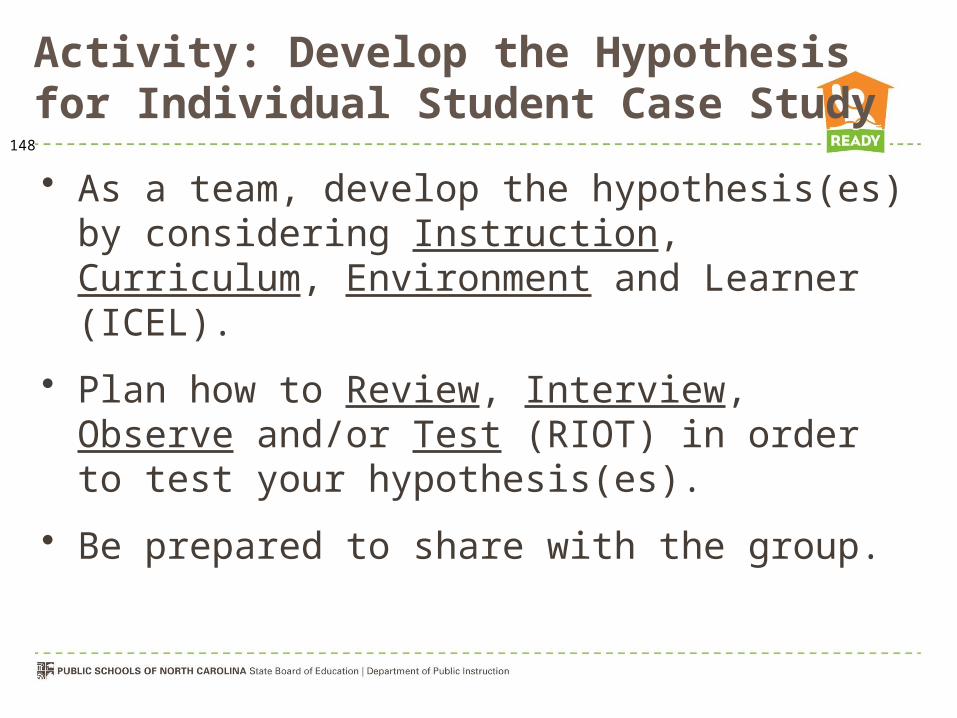
Activity: Develop the Hypothesis for Individual Student Case Study
148
• As a team, develop the hypothesis(es) by considering Instruction, Curriculum, Environment and Learner (ICEL).
• Plan how to Review, Interview, Observe and/or Test (RIOT) in order to test your hypothesis(es).
• Be prepared to share with the group.

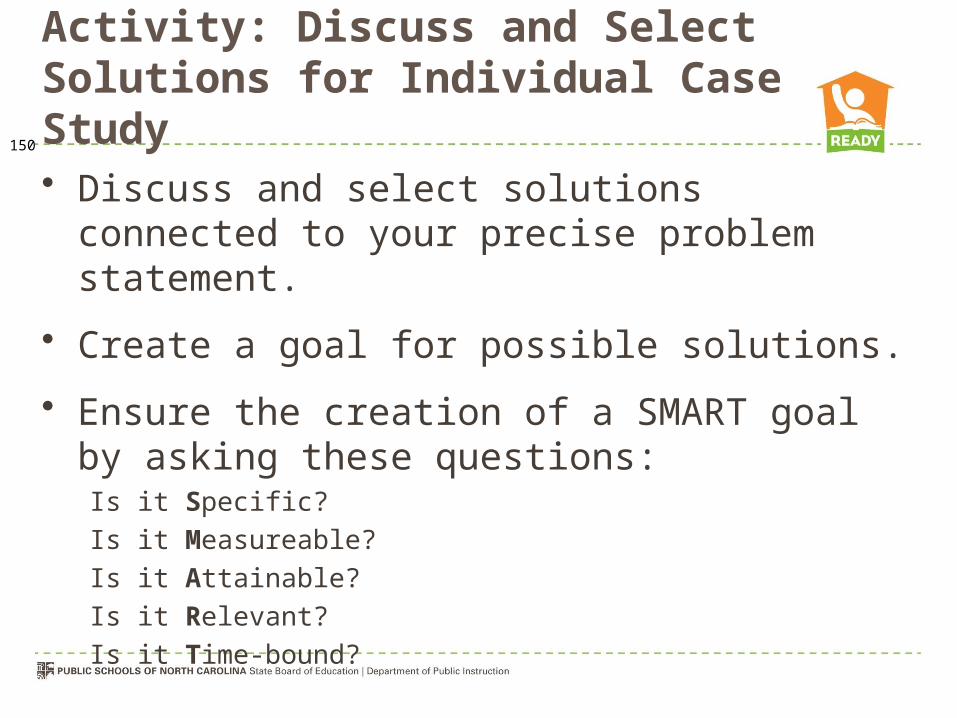
Activity: Discuss and Select Solutions for Individual Case Study
150
• Discuss and select solutions connected to your precise problem statement.
• Create a goal for possible solutions.
• Ensure the creation of a SMART goal by asking these questions:Is it Specific?Is it Measureable? Is it Attainable?Is it Relevant?Is it Time-bound?
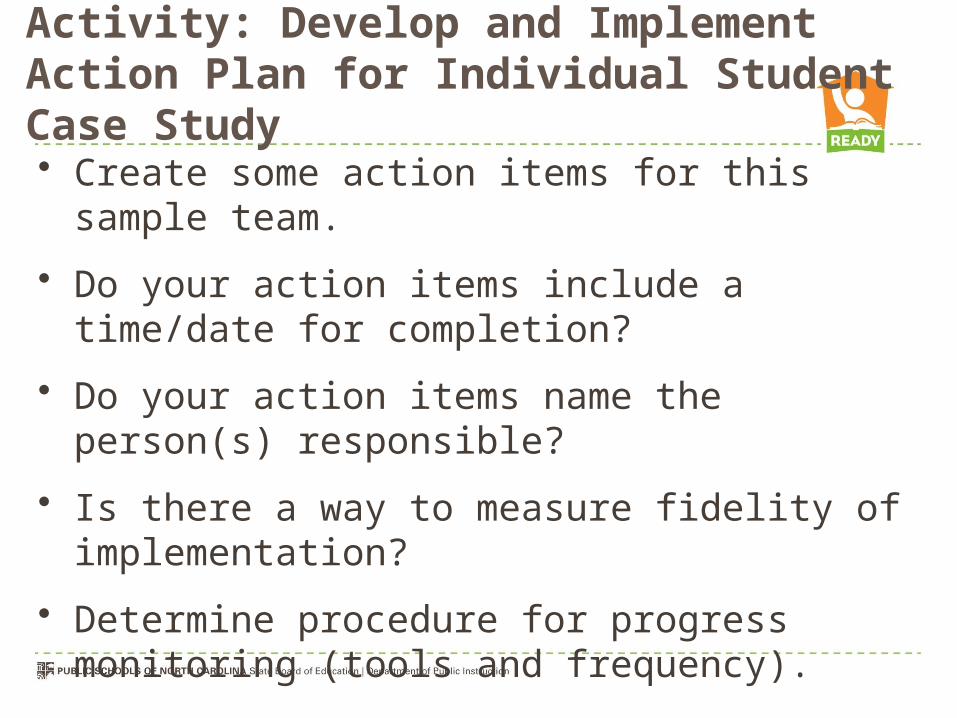
Activity: Develop and Implement Action Plan for Individual Student Case Study• Create some action items for this sample team.
• Do your action items include a time/date for completion?
• Do your action items name the person(s) responsible?
• Is there a way to measure fidelity of implementation?
• Determine procedure for progress monitoring (tools and frequency).

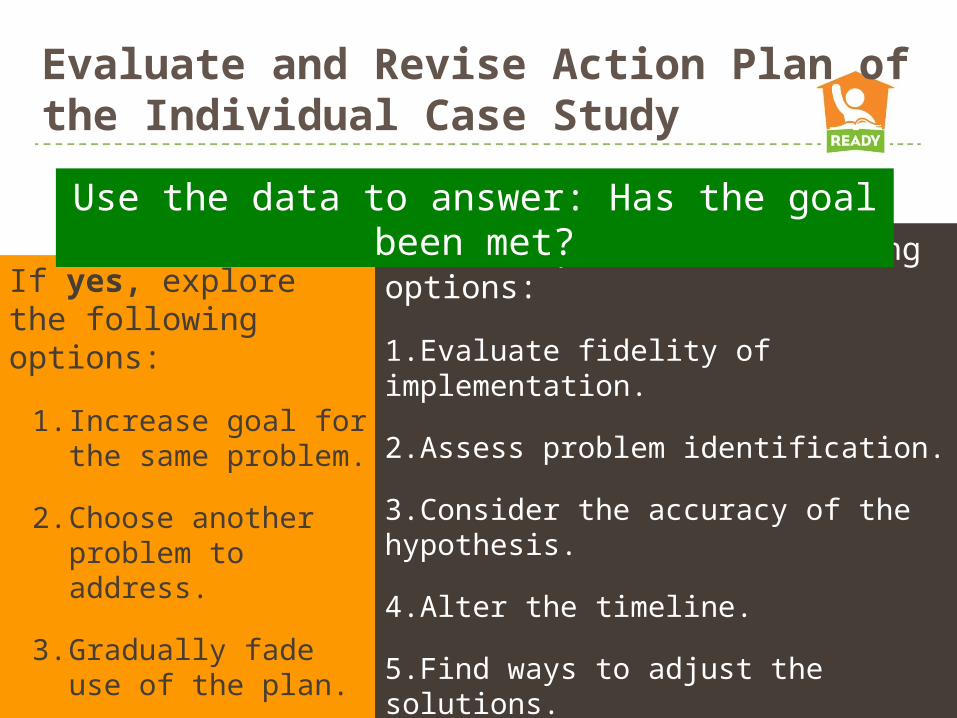
Evaluate and Revise Action Plan of the Individual Case Study
If yes, explore the following options:
1. Increase goal for the same problem.
2. Choose another problem to address.
3. Gradually fade use of the plan.
If no, explore the following options:
1.Evaluate fidelity of implementation.
2.Assess problem identification.
3.Consider the accuracy of the hypothesis.
4.Alter the timeline.
5.Find ways to adjust the solutions.
6.Review “like peer” data.
Use the data to answer: Has the goal been met?
Data-Based Decision Making
Questions?
Related Documents