Republic of Zimbabwe Ministry of Environment, Water and Climate Ministry of Local Government, Public Works and National Housing Environment Management Agency DATA COLLECTION SURVEY ON WATER SUPPLY AND SEWAGE SECTOR IN HARARE CITY AREA IN ZIMBABWE FINAL REPORT APRIL 2018 JAPAN INTERNATIONAL COOPERATION AGENCY (JICA) EIGHT-JAPAN ENGINEERING CONSULTANTS INC. 6R JR 18-019

Welcome message from author
This document is posted to help you gain knowledge. Please leave a comment to let me know what you think about it! Share it to your friends and learn new things together.
Transcript
Republic of Zimbabwe Ministry of Environment, Water and Climate Ministry of Local Government, Public Works and National Housing Environment Management Agency
DATA COLLECTION SURVEY
ON WATER SUPPLY AND SEWAGE SECTOR
IN HARARE CITY AREA
IN ZIMBABWE
FINAL REPORT
APRIL 2018
JAPAN INTERNATIONAL COOPERATION AGENCY (JICA)
EIGHT-JAPAN ENGINEERING CONSULTANTS INC.
6R
JR
18-019
Data Collection Survey on Water Supply and Sewage Sector in Harare City Area in Zimbabwe April 2018
i
Table of Contents List of Figures List of Tables Abbreviations Executive Summary
TABLE OF CONTENTS
CHAPTER 1 General ............................................................................................................ 1-1 1.1 Background and Objectives of the Survey .................................................................. 1-1
1.1.1 Background ......................................................................................................... 1-1 1.1.2 Objectives ........................................................................................................... 1-1
1.2 Survey Area ............................................................................................................... 1-1 1.3 Survey Schedule and Survey Team ............................................................................. 1-2
1.3.1 Survey Schedule in Zimbabwe ............................................................................. 1-2 1.3.2 Member of the Survey Team................................................................................ 1-6 1.3.3 Interviewee of the Survey .................................................................................... 1-6
CHAPTER 2 General condition and sanitation in Zimbabwe ............................................. 2-1 2.1 Natural Condition ....................................................................................................... 2-1 2.2 Socio-economy .......................................................................................................... 2-4 2.3 Policy on Sanitation in Zimbabwe .............................................................................. 2-7
2.3.1 National Plan ....................................................................................................... 2-7 2.3.2 Development Plan for Sanitation ......................................................................... 2-9 2.3.3 Laws Relating to Sanitation and Hygiene in Zimbabwe...................................... 2-13 2.3.4 Activity of Donors and International Organization in the Sanitation Sector ........ 2-15
2.4 Institution for sewerage sector in Zimbabwe ............................................................. 2-21 2.4.1 Progress of Decentralization in sewerage sector ................................................. 2-21 2.4.2 National Institutions for Sanitation and Hygiene Sector ..................................... 2-24 2.4.3 Organization for Sewerage in Cities ................................................................... 2-28
CHAPTER 3 Water supply Works and sewerage Works in the greater Harare ................ 3-1 3.1 Water Supply in Greater Harare.................................................................................. 3-1 3.2 Wastewater Works in Chitungwiza ............................................................................. 3-2 3.3 Present Condition of Zengeza Wastewater Treatment Plant ........................................ 3-4 3.4 Water Quality........................................................................................................... 3-10 3.5 Long and mid term planning, management accounting ............................................. 3-15
3.5.1 Long and Mid-term Development Plan .............................................................. 3-15 3.5.2 Budget Formulation and Outlook ....................................................................... 3-15 3.5.3 Status of management of fixed assets and liabilities ........................................... 3-18 3.5.4 Tariff system ..................................................................................................... 3-18
3.6 Financial Situation ................................................................................................... 3-20 3.6.1 Financial accounting .......................................................................................... 3-20
3.7 Public-Private Partnership, Privatization, and Corporation ........................................ 3-25 3.7.1 Overview........................................................................................................... 3-25 3.7.2 Potential PPP project in Chitungwiza ................................................................. 3-26
CHAPTER 4 CHALLENGES in SeweragE Works in Chitungwiza ................................... 4-1 4.1 Challenges on Institution and Organization................................................................. 4-1 4.2 Technical Challenges ................................................................................................. 4-1 4.3 Challenges in Finance ................................................................................................ 4-2
4.3.2 Problems related to Sewerage projects ................................................................. 4-3 4.4 Issues related to PPP .................................................................................................. 4-4
Data Collection Survey on Water Supply and Sewage Sector in Harare City Area in Zimbabwe April 2018
ii
CHAPTER 5 Achievement and Direction of Japanese Cooperation in Sanitation and Hygiene Sector............................................................................................................... 5-1
5.1 Achievement and of Japanese Cooperation in Hygiene and Sanitation Sector.............. 5-1 5.2 Improvement of Zengeza WWTP ............................................................................... 5-3
5.2.1 Basic Approach ................................................................................................... 5-3 5.2.2 Consideration of BNR Repair Options ................................................................. 5-4 5.2.3 Cost Estimates of BNR Repair Options ................................................................ 5-6 5.2.4 Consideration of financial analysis and financial sustainability after
rehabilitation ....................................................................................................... 5-7 5.3 Recommendations for Sustainable Water and Sewerage Services ............................. 5-15
5.3.1 Status Variance from Past Points in Time .......................................................... 5-15 5.3.2 Tasks and Recommendations for Sustainable Water Supply and Sewage
Works ............................................................................................................... 5-16 5.3.3 Workshop for Survey Findings .......................................................................... 5-18
APPENDIX 1 Data for Financial Analysis ..................................................................... App1-1 1.1 Data for Chapter 3 ............................................................................................... App1-1 1.2 Data for Chapter 4 ..............................................................................................App1-27
APPENDIX 2 Inspection Result of Zengeza WWTP ..................................................... App2-1 APPENDIX 3 Residents’ Consciousness Survey Result ................................................. App3-1
3.1 Outline of Survey Results .................................................................................... App3-1 3.2 Survey Results .................................................................................................... App3-2
3.2.1 Service Provision of Water and Sewerage ..................................................... App3-2 3.2.2 Willingness to Pay for Water Supply and Sewerage Service .......................... App3-3 3.2.3 Public Relations from the Municipality ......................................................... App3-4 3.2.4 Others .......................................................................................................... App3-4
APPENDIX 4 Minutes of Meeting for Workshop .......................................................... App4-1
Data Collection Survey on Water Supply and Sewage Sector in Harare City Area in Zimbabwe April 2018
iii
LIST OF FIGURES
Figure 1.2.1 Survey Area ...................................................................................................... 1-2 Figure 2.1.1 Topographical Map of Zimbabwe ..................................................................... 2-1 Figure 2.1.2 River System in Zimbabwe ............................................................................... 2-2 Figure 2.1.3 Geological Map of Zimbabwe ........................................................................... 2-3 Figure 2.1.4 Weather in Harare ............................................................................................. 2-4 Figure 2.2.1 Ward Map in Chitungwiza ................................................................................ 2-5 Figure 2.4.1 Organization Chart of National Action Committee (NAC)............................... 2-24 Figure 2.4.2 Administrative Chart of Ministry of Environment, Water and Climate ............. 2-25 Figure 2.4.3 Oraganization Chart of Harare Water .............................................................. 2-28 Figure 2.4.4 Organization chart of Chitungwiza Municipality ............................................. 2-29 Figure 2.4.5 Organization Chart of Sewage Treatment Plant Section, Sewerage Department,
Chitungwiza Municipality ............................................................................................. 2-29 Figure 3.1.1 Location of Purification Plant............................................................................ 3-1 Figure 3.4.1 Record of Water Quality of Lake Chivero from 1988 to 2006 .......................... 3-12 Figure 3.4.2 Relation between Water Depth and Density of Chloride .................................. 3-12 Figure 3.4.3 Schematic Drawing of Water Cycle in Harare City Area ................................. 3-14 Figure 5.2.1 Image of Operation and Maintenance Cost of BNR ........................................... 5-9
Data Collection Survey on Water Supply and Sewage Sector in Harare City Area in Zimbabwe April 2018
iv
LIST OF TABLES
Table 1.3.1 Survey Schedule of First Survey in Zimbabwe................................................... 1-2 Table 1.3.2 Survey Schedule of Second Survey in Zimbabwe .............................................. 1-4 Table 1.3.3 Agenda and Collected Information of Meetings ................................................. 1-4 Table 1.3.4 Inspection Items in Site Visit ............................................................................. 1-5 Table 1.3.5 Survey Team Members...................................................................................... 1-5 Table 1.3.6 Interviewee of Government Organization .......................................................... 1-6 Table 1.3.7 Interviewee of Donors and Private Company ..................................................... 1-7 Table 1.3.8 Embassy of Japan and JICA .............................................................................. 1-7 Table 2.1.1 Weather in Harare ............................................................................................. 2-3 Table 2.2.1 Population of Zimbabwe and Harare Province ................................................... 2-4 Table 2.2.2 Population by District in Harare Province .......................................................... 2-4 Table 2.2.3 Population by Ward in Chitungwiza in 2012 ...................................................... 2-5 Table 2.2.4 GDP in SADC Countries ................................................................................... 2-5 Table 2.2.5 GDP per Capita in SADC Countries .................................................................. 2-6 Table 2.3.1 I-PRSP Budget (USD million), 2017 - 2018 ...................................................... 2-8 Table 2.3.2 Progress of Assistance to Zimbabwe by AfDB................................................. 2-15 Table 2.3.3 Improved Facilities by UWSSRP Phase 1 ........................................................ 2-17 Table 2.3.4 Water Flow Projection in Greater Harare ......................................................... 2-18 Table 2.3.5 Design Capacity of Existing Wastewater Treatment Plants .............................. 2-18 Table 2.3.6 Sewerage Infrastructure Assessment in Chitungwiza ....................................... 2-19 Table 2.3.7 Proposed Investment Measures for Sewerage in Chitungwiza .......................... 2-19 Table 2.3.8 Projects for Sewerage in Chitungwiza by Priority ............................................ 2-20 Table 3.1.1 Outline of Water Purification Plant in City of Harare ......................................... 3-1 Table 3.1.2 Daily Water Supply in Harare Municipality in 2017 .......................................... 3-2 Table 3.1.3 Water Demand in Chitungwiza Municipality ..................................................... 3-2 Table 3.4.1 Raw Water Quality from Upper Manyame in 1996 .......................................... 3-10 Table 3.4.2 Lake Chivero Raw Water Quality in 1996 ....................................................... 3-11 Table 3.4.3 Water Quality of Raw Sewage and Final Effluent of Firle Sewage treatment Works
in1996 ....................................................................................................................... 3-11 Table 3.4.4 Chemical valuables in Lake Chivero and Other Lakes in 2010 ......................... 3-11 Table 3.4.5 Classes of Effluent Discharge Licences ........................................................... 3-13 Table 3.4.6 Treated Water Quality of Zengeza WWTP ...................................................... 3-13 Table 3.4.7 Estimation of Pollution Load of Lake Chivero ................................................. 3-14 Table 3.5.1 Overview of budget allocation for the Ministries related to the sewerage system .....
....................................................................................................................... 3-16 Table 3.5.2 Taxes and Charges in Past Five Years in Chitungwiza ..................................... 3-19 Table 3.5.3 Collection Rate of Sewage Charge in Chitungwiza .......................................... 3-19 Table 3.5.4 Collection Rate of Waterworks Charge in Chitungwiza ................................... 3-19 Table 3.5.5 Collection Rate of Woterworks and Sewage Charge in Harare ......................... 3-20 Table 3.6.1 Breakdown of the Accrued Expenses ............................................................... 3-23 Table 3.7.1 Initial Tariff Settings under Chitungwiza PPP .................................................. 3-27 Table 4.3.1 Comparison of Budget and Actual Result of Revenue and Expenses in
Chitungwiza .................................................................................................................... 4-2 Table 4.3.2 Comparison of Financial Statement and SLB Data for Sewage Charge Collection
Rate ......................................................................................................................... 4-3 Table 5.2.1 BNR Repair Proposals....................................................................................... 5-4 Table 5.2.2 Combination of Improvement Proposals ............................................................ 5-5 Table 5.2.3 Comparison Table of BNR Improvement Options.............................................. 5-5 Table 5.2.4 Approximate Cost Estimation of BNR Repair Options (Unit: USD) ................... 5-6 Table 5.2.5 Inflation rate over the past 5 years ..................................................................... 5-8 Table 5.2.6 Cost Estimation for Chemicals and Electricity ................................................... 5-9

Data Collection Survey on Water Supply and Sewage Sector in Harare City Area in Zimbabwe April 2018
v
Table 5.2.7 Cost Directly Imposed on Fillet Wastewater Treatment Plant (2016) ............... 5-12 Table 5.2.8 Possible Operation and Maintenance Cost According to Tariff Collection Rate and
Distribution Rate Change (USD) ................................................................................... 5-13 Table 5.2.9 Conservative Case ........................................................................................... 5-14 Table 5.2.10 Decrease in Chemicals ................................................................................... 5-14 Table 5.3.1 Changes in the Past and Circumstances Expected in the Future ........................ 5-15 Table 5.3.2 Inflation rate after 2001 ................................................................................... 5-16 Table 5.3.3 Tasks and Recommendations for Sustainable Water Supply and Sewage Works .....
....................................................................................................................... 5-16
Data Collection Survey on Water Supply and Sewage Sector in Harare City Area in Zimbabwe April 2018
vii
ABBREVIATIONS
A-MDTF Zimbabwe Analytical Multi Donor Trust Fund
A.T.C Acting Town Clerk
AMCOW African Minister’s Council on Water
AWF African Water Facility
AfDB African Development Bank
BNR Biological Nutrient Removal
BOD Biochemical Oxygen Demand
CAPEX Capital Expenditure
CSO2 Second round of Country Status Overviews
EMA Environmental Management Agency
EOJ Embassy of Japan
EPIRP Emergency Power Infrastructure Rehabilitation Project
GC Grid Chamber
GDP Gross Domestic Product
I-PRSP Zimbabwe Interim Poverty Reduction Strategy PaperIE Project Implementing Entity
IFRS International Financial Reporting Standards
IPSAS International Public Sector Accounting Standards
ISA International Standards on Auditing
JICA Japan International Cooperation Agency
JST JICA Survey Team
M/P Master Plan
MEWC Ministry of Environment, Water and Climate
MFAIT Ministry of Foreign Affairs and International Trade
MLGPWNH Ministry of Local Government, Public Works and National Housing
MOFED Ministry of Finance and Economic Development
MoWRDM Ministry of Water Resources Development and Management
NAC National Action Committee
NWP National Water Policy
NWSSU National Water Service and Sanitation Utility
PBB Performance Based Budgeting
POC Project Oversight Committee
PPP Public Private Partnership
PSIP Public Sector Investment Programme
SADC South Africa Development Community
SPV Special Purpose Vehicle
STP Sewage Treatment Plant
TOR Terms of ReferenceUNICEF United Nations Children Fund
USH Urban Sanitation and HygieneUWSSRP Urgent Water Supply and Sanitation Rehabilitation Project
Data Collection Survey on Water Supply and Sewage Sector in Harare City Area in Zimbabwe April 2018
viii
VAT Value Added Tax
WASH Water, Sanitation and Hygiene
WB World Bank
WHO World Health Organization
WSP Water and Sanitation Program
WSS Water Supply and Sanitation
WWTN Waste Water Treatment Works
ZIMSTAT Zimbabwe National Statistics Agency
ZINWA Zimbabwe National Water Authority
Zim Asset Zimbabwe Agenda for Sustainable Socio-Economic Transformation
Zim-Fund Zimbabwe Multi Donor Trust Fund

Data Collection Survey on Water Supply and Sewage Sector in Harare City Area in Zimbabwe April 2018
S-1
EXECUTIVE SUMMARY
1. General
1.1 Background
In the Harare metropolitan area, increasing volume of domestic waste water and industrial effluent surpassed the capacity of the treatment plant due to rapid urbanization, population growth and evolution of industry. Consequently, contamination of the water of Lake Manyame and Lake Chivero, which are the major water resources of the area, has been deteriorating from the late 1990s. Furthermore, dysfunction of the socio-economy after 2000 worsened the water, sanitation and hygiene condition in Chitungwiza municipality, a dormitory town of Harare city.
In order to improve this condition, “The project for Improvement of Sewage Facilities in the Municipality of Chitungwiza in the Republic of Zimbabwe” a grant aid project, was conducted and facilities delivered to Government of Zimbabwe (hereinafter referred to as GOZ) in 2000. However, rapid and intense aggravation of the economy of Zimbabwe in the period made it difficult to secure the necessary budget for development and operation of facilities for water, sanitation and solid waste disposal. As a result, operation and maintenance of sewage and hygiene facilities in Chitungwiza became difficult and dysfunctional.
Subsequently JICA conducted “Data Collection Survey for Improvement of Hygiene Condition in Chitungwiza Municipality in the Republic of Zimbabwe” in 2011, for the collection and analysis of basic information for improvement of sanitation and hygiene conditions in Chitungwiza municipality. The result of the survey showed that the water supply as well as the sanitation and the solid waste management in the municipality were dysfunctional. Given the result of this survey, GOZ requested the implementation of “The Project for the Improvement of Water Supply, Sewage and Solid Waste Management in Chitungwiza in the Republic of Zimbabwe” for establishment of a Master Plan (M/P) and examination and clarification of improvement measures. In response to the request, JICA commenced the study in 2012, conducting Phase 1 for collection and analysis of information, and established the M/P in Phase 2. Nonetheless, the implementation of the study was suspended in July 2013 due to severe financial conditions in Chitungwiza municipality. Agreement was made between JICA and GOZ that the project would be resumed when the financial condition had improved.
To date, improvement of the financial condition has not been observed. From 2017, examination of various reform measures is ongoing, and improvement in the financial condition is expected.
1.2 Objectives
This survey aims at collection of information on activities and plans by relevant organizations, the financial condition, organization structure of implementing agency and activities by donors regarding water supply and sanitation in Harare metropolitan area (City of Harare and Chitungwiza municipality). Additionally, by inspection on the condition of facilities and equipment of Zengeza treatment plant constructed by grant aid by the Japanese government, options for replacement of facilities and partial utilization of existing facilities will be analyzed. Based on the result of those surveys, issues and proposals for sustainable management of water supply and sanitation in Chitungwiza municipality will be scrutinized.
1.3 Survey Area
The principal survey area is Chitungwiza municipality. The City of Harare is included if integrated survey is required from facility aspect and institutional aspect.
Data Collection Survey on Water Supply and Sewage Sector in Harare City Area in Zimbabwe April 2018
S-2
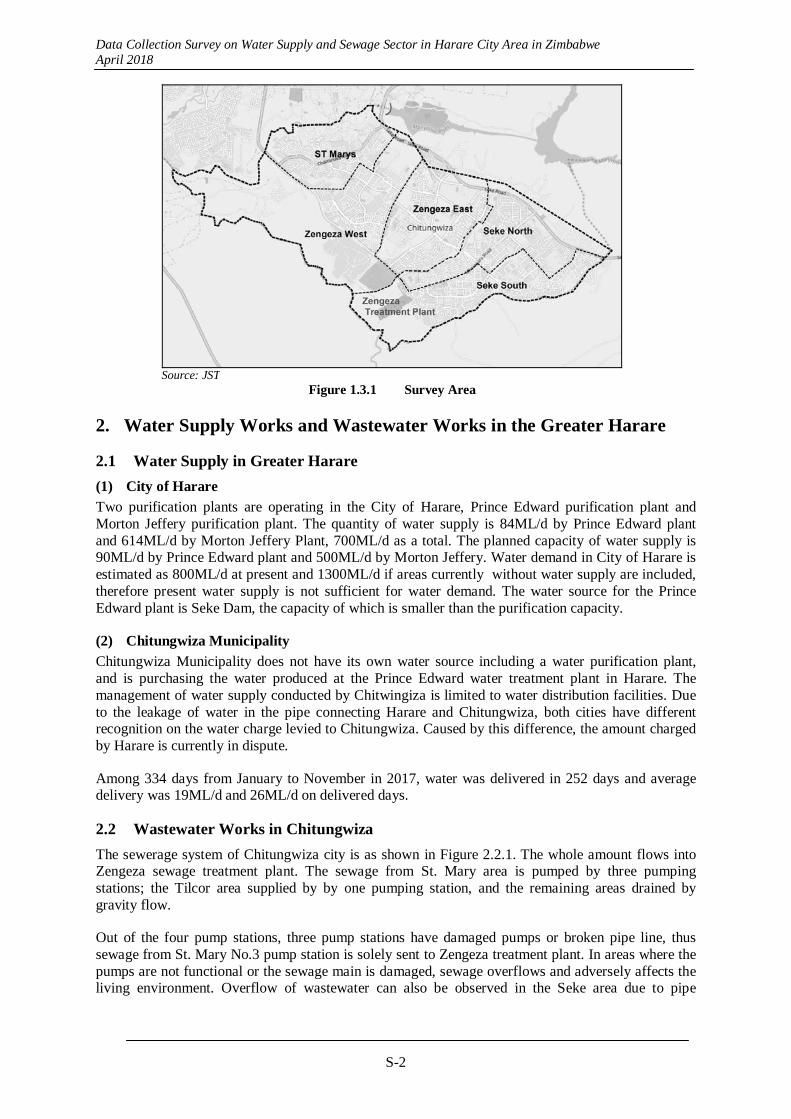
Source: JST
Figure 1.3.1 Survey Area
2. Water Supply Works and Wastewater Works in the Greater Harare
2.1 Water Supply in Greater Harare
(1) City of Harare
Two purification plants are operating in the City of Harare, Prince Edward purification plant and Morton Jeffery purification plant. The quantity of water supply is 84ML/d by Prince Edward plant and 614ML/d by Morton Jeffery Plant, 700ML/d as a total. The planned capacity of water supply is 90ML/d by Prince Edward plant and 500ML/d by Morton Jeffery. Water demand in City of Harare is estimated as 800ML/d at present and 1300ML/d if areas currently without water supply are included, therefore present water supply is not sufficient for water demand. The water source for the Prince Edward plant is Seke Dam, the capacity of which is smaller than the purification capacity.
(2) Chitungwiza Municipality
Chitungwiza Municipality does not have its own water source including a water purification plant, and is purchasing the water produced at the Prince Edward water treatment plant in Harare. The management of water supply conducted by Chitwingiza is limited to water distribution facilities. Due to the leakage of water in the pipe connecting Harare and Chitungwiza, both cities have different recognition on the water charge levied to Chitungwiza. Caused by this difference, the amount charged by Harare is currently in dispute.
Among 334 days from January to November in 2017, water was delivered in 252 days and average delivery was 19ML/d and 26ML/d on delivered days.
2.2 Wastewater Works in Chitungwiza
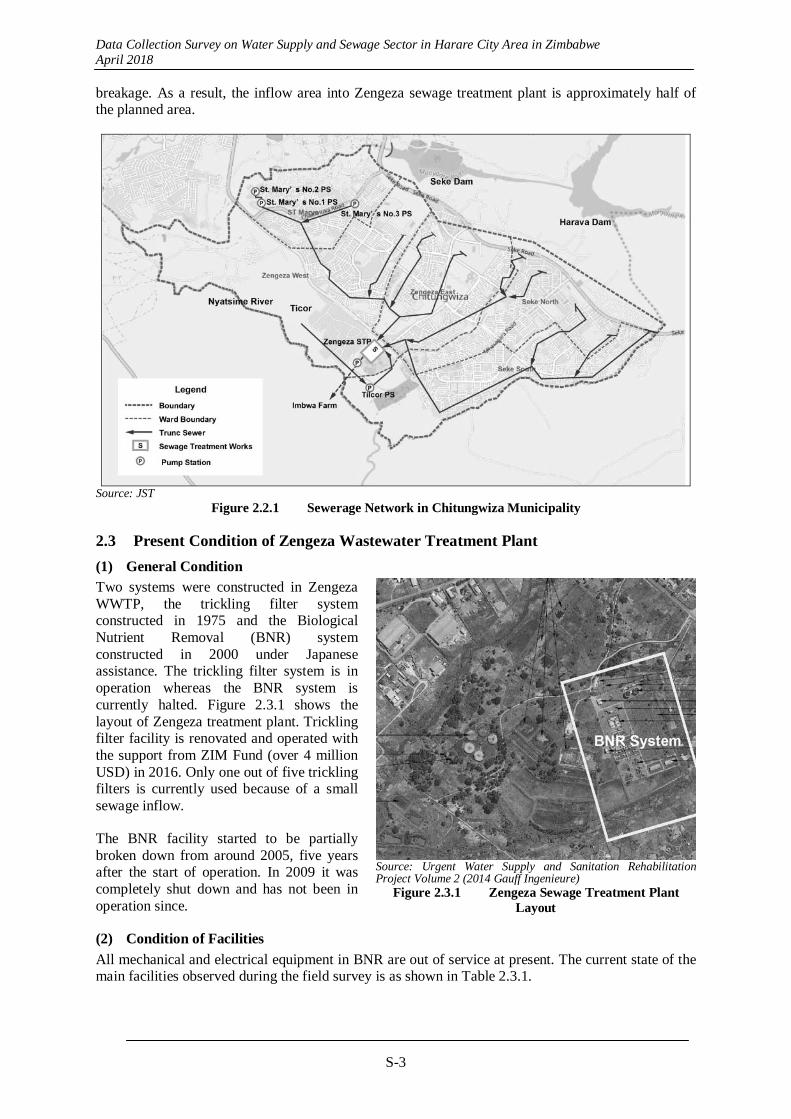
The sewerage system of Chitungwiza city is as shown in Figure 2.2.1. The whole amount flows into Zengeza sewage treatment plant. The sewage from St. Mary area is pumped by three pumping stations; the Tilcor area supplied by by one pumping station, and the remaining areas drained by gravity flow.
Out of the four pump stations, three pump stations have damaged pumps or broken pipe line, thus sewage from St. Mary No.3 pump station is solely sent to Zengeza treatment plant. In areas where the pumps are not functional or the sewage main is damaged, sewage overflows and adversely affects the living environment. Overflow of wastewater can also be observed in the Seke area due to pipe
Data Collection Survey on Water Supply and Sewage Sector in Harare City Area in Zimbabwe April 2018
S-3
breakage. As a result, the inflow area into Zengeza sewage treatment plant is approximately half of the planned area.
Source: JST
Figure 2.2.1 Sewerage Network in Chitungwiza Municipality
2.3 Present Condition of Zengeza Wastewater Treatment Plant
(1) General Condition
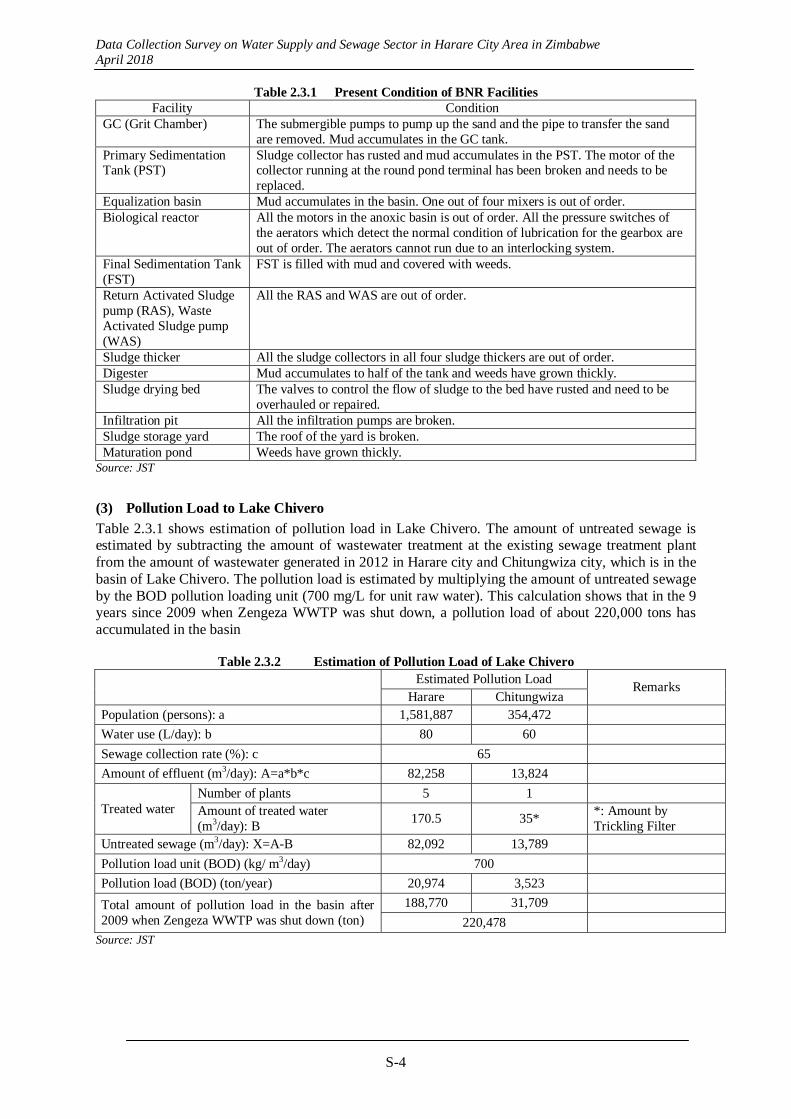
Two systems were constructed in Zengeza WWTP, the trickling filter system constructed in 1975 and the Biological Nutrient Removal (BNR) system constructed in 2000 under Japanese assistance. The trickling filter system is in operation whereas the BNR system is currently halted. Figure 2.3.1 shows the layout of Zengeza treatment plant. Trickling filter facility is renovated and operated with the support from ZIM Fund (over 4 million USD) in 2016. Only one out of five trickling filters is currently used because of a small sewage inflow.
The BNR facility started to be partially broken down from around 2005, five years after the start of operation. In 2009 it was completely shut down and has not been in operation since.
(2) Condition of Facilities
All mechanical and electrical equipment in BNR are out of service at present. The current state of the main facilities observed during the field survey is as shown in Table 2.3.1.
Source: Urgent Water Supply and Sanitation Rehabilitation Project Volume 2 (2014 Gauff Ingenieure)
Figure 2.3.1 Zengeza Sewage Treatment Plant Layout
Data Collection Survey on Water Supply and Sewage Sector in Harare City Area in Zimbabwe April 2018
S-4
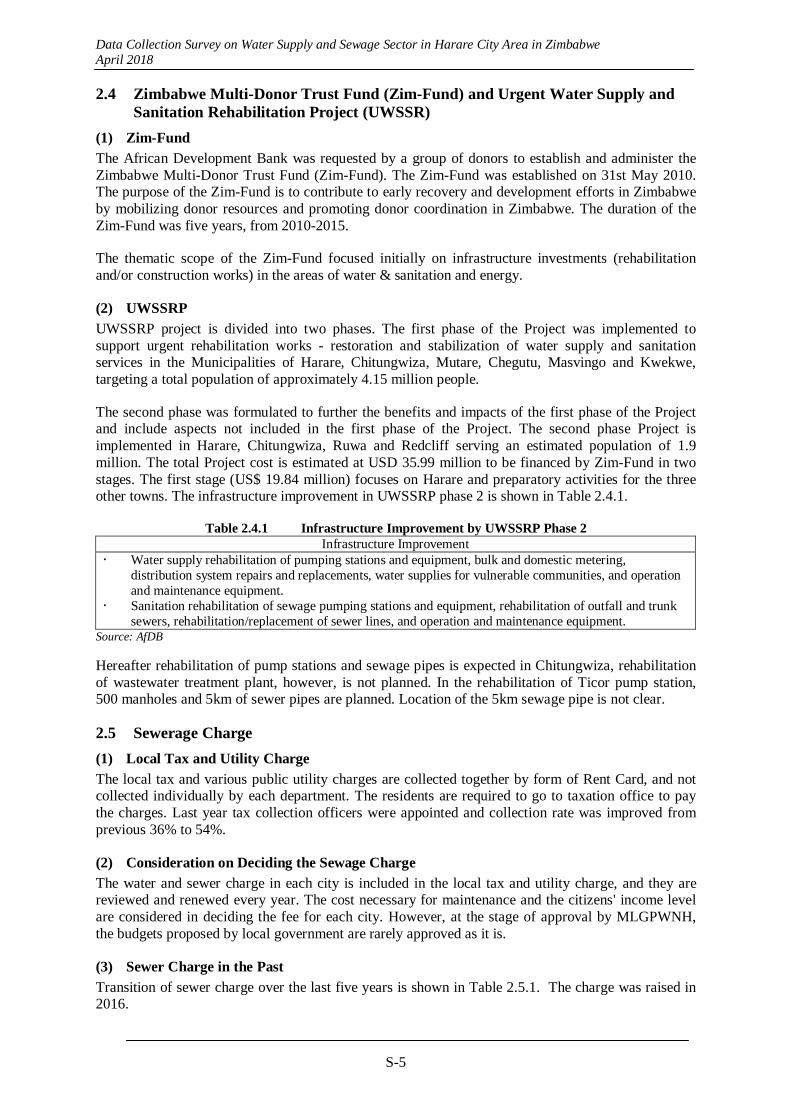
Table 2.3.1 Present Condition of BNR Facilities Facility Condition
GC (Grit Chamber) The submergible pumps to pump up the sand and the pipe to transfer the sand are removed. Mud accumulates in the GC tank.
Primary Sedimentation Tank (PST)
Sludge collector has rusted and mud accumulates in the PST. The motor of the collector running at the round pond terminal has been broken and needs to be replaced.
Equalization basin Mud accumulates in the basin. One out of four mixers is out of order. Biological reactor All the motors in the anoxic basin is out of order. All the pressure switches of
the aerators which detect the normal condition of lubrication for the gearbox are out of order. The aerators cannot run due to an interlocking system.
Final Sedimentation Tank (FST)
FST is filled with mud and covered with weeds.
Return Activated Sludge pump (RAS), Waste Activated Sludge pump (WAS)
All the RAS and WAS are out of order.
Sludge thicker All the sludge collectors in all four sludge thickers are out of order. Digester Mud accumulates to half of the tank and weeds have grown thickly. Sludge drying bed The valves to control the flow of sludge to the bed have rusted and need to be
overhauled or repaired. Infiltration pit All the infiltration pumps are broken.Sludge storage yard The roof of the yard is broken.Maturation pond Weeds have grown thickly.
Source: JST
(3) Pollution Load to Lake Chivero
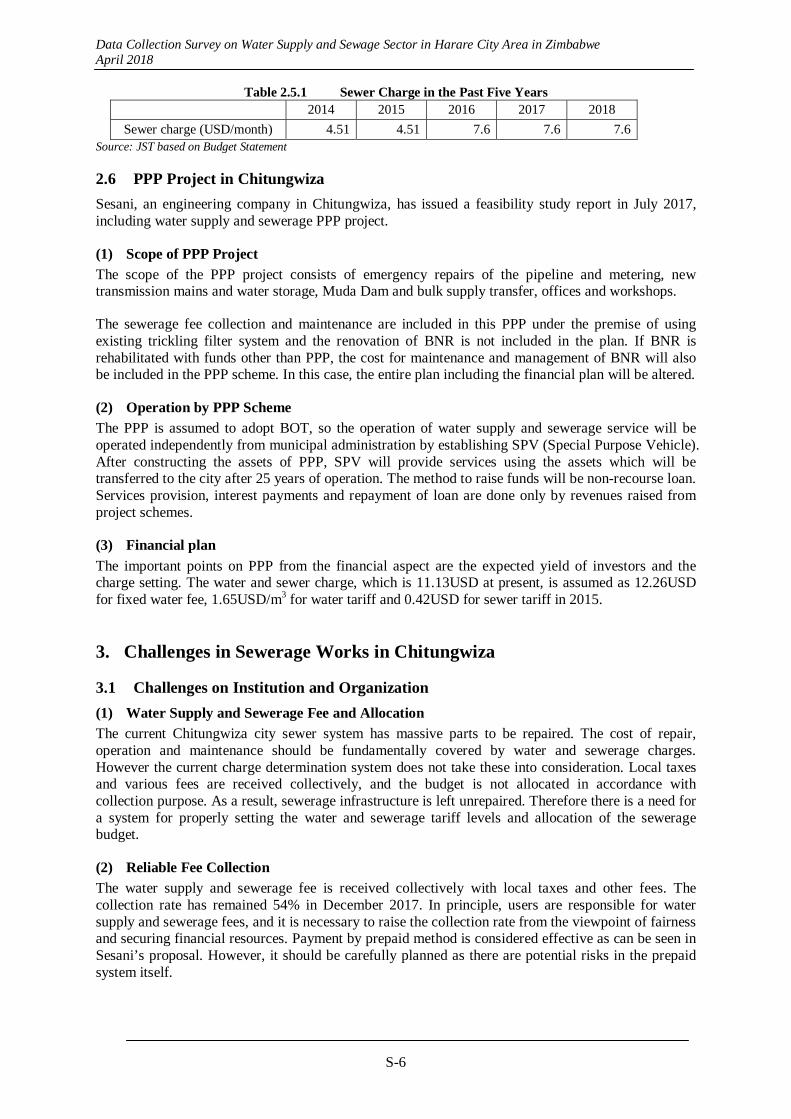
Table 2.3.1 shows estimation of pollution load in Lake Chivero. The amount of untreated sewage is estimated by subtracting the amount of wastewater treatment at the existing sewage treatment plant from the amount of wastewater generated in 2012 in Harare city and Chitungwiza city, which is in the basin of Lake Chivero. The pollution load is estimated by multiplying the amount of untreated sewage by the BOD pollution loading unit (700 mg/L for unit raw water). This calculation shows that in the 9 years since 2009 when Zengeza WWTP was shut down, a pollution load of about 220,000 tons has accumulated in the basin
Table 2.3.2 Estimation of Pollution Load of Lake Chivero
Estimated Pollution Load
Remarks Harare Chitungwiza
Population (persons): a 1,581,887 354,472
Water use (L/day): b 80 60
Sewage collection rate (%): c 65
Amount of effluent (m3/day): A=a*b*c 82,258 13,824
Treated water Number of plants 5 1 Amount of treated water (m3/day): B
170.5 35* *: Amount by Trickling Filter
Untreated sewage (m3/day): X=A-B 82,092 13,789
Pollution load unit (BOD) (kg/ m3/day) 700
Pollution load (BOD) (ton/year) 20,974 3,523
Total amount of pollution load in the basin after 2009 when Zengeza WWTP was shut down (ton)
188,770 31,709
220,478 Source: JST
Data Collection Survey on Water Supply and Sewage Sector in Harare City Area in Zimbabwe April 2018
S-5
2.4 Zimbabwe Multi-Donor Trust Fund (Zim-Fund) and Urgent Water Supply and Sanitation Rehabilitation Project (UWSSR)
(1) Zim-Fund
The African Development Bank was requested by a group of donors to establish and administer the Zimbabwe Multi-Donor Trust Fund (Zim-Fund). The Zim-Fund was established on 31st May 2010. The purpose of the Zim-Fund is to contribute to early recovery and development efforts in Zimbabwe by mobilizing donor resources and promoting donor coordination in Zimbabwe. The duration of the Zim-Fund was five years, from 2010-2015.
The thematic scope of the Zim-Fund focused initially on infrastructure investments (rehabilitation and/or construction works) in the areas of water & sanitation and energy.
(2) UWSSRP
UWSSRP project is divided into two phases. The first phase of the Project was implemented to support urgent rehabilitation works - restoration and stabilization of water supply and sanitation services in the Municipalities of Harare, Chitungwiza, Mutare, Chegutu, Masvingo and Kwekwe, targeting a total population of approximately 4.15 million people.
The second phase was formulated to further the benefits and impacts of the first phase of the Project and include aspects not included in the first phase of the Project. The second phase Project is implemented in Harare, Chitungwiza, Ruwa and Redcliff serving an estimated population of 1.9 million. The total Project cost is estimated at USD 35.99 million to be financed by Zim-Fund in two stages. The first stage (US$ 19.84 million) focuses on Harare and preparatory activities for the three other towns. The infrastructure improvement in UWSSRP phase 2 is shown in Table 2.4.1.
Table 2.4.1 Infrastructure Improvement by UWSSRP Phase 2 Infrastructure Improvement
Water supply rehabilitation of pumping stations and equipment, bulk and domestic metering, distribution system repairs and replacements, water supplies for vulnerable communities, and operation and maintenance equipment.
Sanitation rehabilitation of sewage pumping stations and equipment, rehabilitation of outfall and trunk sewers, rehabilitation/replacement of sewer lines, and operation and maintenance equipment.
Source: AfDB Hereafter rehabilitation of pump stations and sewage pipes is expected in Chitungwiza, rehabilitation of wastewater treatment plant, however, is not planned. In the rehabilitation of Ticor pump station, 500 manholes and 5km of sewer pipes are planned. Location of the 5km sewage pipe is not clear.
2.5 Sewerage Charge
(1) Local Tax and Utility Charge
The local tax and various public utility charges are collected together by form of Rent Card, and not collected individually by each department. The residents are required to go to taxation office to pay the charges. Last year tax collection officers were appointed and collection rate was improved from previous 36% to 54%.
(2) Consideration on Deciding the Sewage Charge
The water and sewer charge in each city is included in the local tax and utility charge, and they are reviewed and renewed every year. The cost necessary for maintenance and the citizens' income level are considered in deciding the fee for each city. However, at the stage of approval by MLGPWNH, the budgets proposed by local government are rarely approved as it is.
(3) Sewer Charge in the Past
Transition of sewer charge over the last five years is shown in Table 2.5.1. The charge was raised in 2016.
Data Collection Survey on Water Supply and Sewage Sector in Harare City Area in Zimbabwe April 2018
S-6
Table 2.5.1 Sewer Charge in the Past Five Years 2014 2015 2016 2017 2018
Sewer charge (USD/month) 4.51 4.51 7.6 7.6 7.6 Source: JST based on Budget Statement
2.6 PPP Project in Chitungwiza
Sesani, an engineering company in Chitungwiza, has issued a feasibility study report in July 2017, including water supply and sewerage PPP project.
(1) Scope of PPP Project
The scope of the PPP project consists of emergency repairs of the pipeline and metering, new transmission mains and water storage, Muda Dam and bulk supply transfer, offices and workshops.
The sewerage fee collection and maintenance are included in this PPP under the premise of using existing trickling filter system and the renovation of BNR is not included in the plan. If BNR is rehabilitated with funds other than PPP, the cost for maintenance and management of BNR will also be included in the PPP scheme. In this case, the entire plan including the financial plan will be altered.
(2) Operation by PPP Scheme
The PPP is assumed to adopt BOT, so the operation of water supply and sewerage service will be operated independently from municipal administration by establishing SPV (Special Purpose Vehicle). After constructing the assets of PPP, SPV will provide services using the assets which will be transferred to the city after 25 years of operation. The method to raise funds will be non-recourse loan. Services provision, interest payments and repayment of loan are done only by revenues raised from project schemes.
(3) Financial plan
The important points on PPP from the financial aspect are the expected yield of investors and the charge setting. The water and sewer charge, which is 11.13USD at present, is assumed as 12.26USD for fixed water fee, 1.65USD/m3 for water tariff and 0.42USD for sewer tariff in 2015.
3. Challenges in Sewerage Works in Chitungwiza
3.1 Challenges on Institution and Organization
(1) Water Supply and Sewerage Fee and Allocation
The current Chitungwiza city sewer system has massive parts to be repaired. The cost of repair, operation and maintenance should be fundamentally covered by water and sewerage charges. However the current charge determination system does not take these into consideration. Local taxes and various fees are received collectively, and the budget is not allocated in accordance with collection purpose. As a result, sewerage infrastructure is left unrepaired. Therefore there is a need for a system for properly setting the water and sewerage tariff levels and allocation of the sewerage budget.
(2) Reliable Fee Collection
The water supply and sewerage fee is received collectively with local taxes and other fees. The collection rate has remained 54% in December 2017. In principle, users are responsible for water supply and sewerage fees, and it is necessary to raise the collection rate from the viewpoint of fairness and securing financial resources. Payment by prepaid method is considered effective as can be seen in Sesani’s proposal. However, it should be carefully planned as there are potential risks in the prepaid system itself.

Data Collection Survey on Water Supply and Sewage Sector in Harare City Area in Zimbabwe April 2018
S-7
(3) Securing the Necessary Personnel
There are currently 51 maintenance staffs in Zengeza sewage treatment plant for the maintenance of the trickling filter facility. In the case of BNR operation, 51 personnel are insufficient considering the size of the treatment facility. Hence it is also important to secure personnel and experts for sustainable maintenance and stable operation.
3.2 Technical Challenges
(1) Strengthening of the Planning Ability
Comprehensive inspection, updating or repair is needed for the aged sewerage infrastructure. It is necessary to clarify the projects to be implemented in the short, medium and long term as a program. It is prerequisite to prepare an integrated plan with the repair program of water supply infrastructure which is the source of sewage, and to coordinate with the activities by donors. Planning ability is required to make such a plan.
(2) Technology Improvement Related to Maintenance
Appropriate maintenance is essential for prolonging the life of the sewage system. Preventive maintenance type management is required as well as minimization of life cycle cost and optimization of the budget in order to prevent disruption of the sewage system. Preparation of manuals and training for that will be necessary. Likewise, improvement in technology related to operation and maintenance is an issue for the future.
(3) Improvement of Sewer Inspection Technology
In order to promote systematic rehabilitation, it is necessary to accurately grasp the current situation. It is required to acquire visual inspection techniques and to introduce inspection technology using TV cameras.
3.3 Challenges in Finance
(1) Low Reliability and Delays on Accounting Reports
Financial statements from Chitungwiza Municipality are not reliable, in regard to the stakeholders that evaluate the financial status. Further, the analysis with these financial statements might lead stakeholders to the wrong conclusion. Additionally, the issuance of financial statements delayed for more than a year to the mandated limit. Therefore, it is an urgent task to prepare financial statements with fair presentation including revenue by tax. Establishing the institutional arrangement is also important towards acquiring the understanding of the citizens.
(2) Deviation of Budget Record
From the comparison between the budget and the accrual basis, it can be said that; 1) the amount of cash collected was significantly different from the budget, and 2) all the expenditure could not be met due to the shortage of cash. This is because the income is not shown on a cash basis, whereas expenses are reported on a cash basis in the budgeting. Moreover, for this reason, the result on the budget was that a large amount of final profit came to be expected. As a result, achieving the budget goals, enabling each department to work corresponding to the budget, and increasing the effectiveness of the budget are challenges to be thought about even in sewerage projects.
3.4 Problems Related to Sewerage Projects
(1) Issues on the Financial Soundness of the City
Financial deficits occurred since 2012 and the cumulative loss was also expanding as of 2015. Although the city's financial situation is not quite sound, fiscal management using obtained city tax and fee collection as ceiling is the only possible way of fiscal management. Consequently, the risk of having extremely high financial leverage caused by excessive usage on external funds is low.

Data Collection Survey on Water Supply and Sewage Sector in Harare City Area in Zimbabwe April 2018
S-8
It is anticipated that the Chitungwiza Municipality should pay the controversial water charge to the City of Harare. In addition, the problem of unpaid salaries for officers in Chitungwiza Municipality may yet worsen. As a conclusion, it is a critical challenge that Chitungwiza Municipality shows a solution to increasing unpaid expenses.
(2) Issues Related to Soundness of Sewage Projects
Although it is a principle that sewerage service is run by the revenue of the sewerage works, it is not stipulated by the laws to bind sewer income to sewer expenditure. Therefore, there is a possibility that sewer revenue is used in other sectors when urgent large expenditure is required. In such cases, it would be difficult to stock necessary spare parts for sewerage projects. This might be a future risk of the facility’s sustainability and management.
3.5 Issues Related to PPP
(1) Water Charge Setting
The water charge by PPP is considerably higher than the current level. In the explanation by Sesani, a survey on willingness to pay for PPP was conducted and the residents’ reaction was that they have intention to pay if water is supplied appropriately even if it is a little expensive.
(2) Issues in Collection System
Management by smart meters and introduction of the prepaid method may cause risks that are not currently recognized (e.g. the lack of a method or system of collecting fees when a system error occurs over a long period of time). There should be a notice on the possibilities that this may lead to a financial influence that could break the premise of the core of SPV as a continuing company.
(3) Financial Feasibility
In this PPP, for example, in 2020 it was scheduled that tariffs would be collected by smart meters. This scheme anticipates USD 24,066,070 as the total revenue of water supply and sewerage, and USD 36,598,094 from 2022, when it starts the dam operation. However, from the financial statements of Harare Water, looking at the fiscal size in 2016, it was USD 84,132,196 on an accrual basis, although the amount was USD 31,657,550 on a cash basis. Considering that the population of the city of Harare is about six times that of Chitungwiza, and amount of revenue is almost the same as Harare on a cash basis, the feasibility of such a plan is questionable.
4. Direction of Improvement of Zengeza WWTP
4.1 Basic Approach
(1) Processing Capacity
Zengeza WWTP has two lines of facility with processing capacity of 10 ML/day each, totaling 20 ML/day processing capacity. The current amount of wastewater generation in Chitungwiza city is 20.8 ML/day, and about 50 % is leaked, which makes the influx amount 10 ML/day. Considering the expected increase in the inflow volume in the future, JST proposes a phased improvement with one line operation in short term and two line operation in mid-term.
(2) Critical Matters in Repair
1) Removal of Sand
One of the causes of failure of BNR facility is inflow of sand. It is therefore required to install facility to remove sand.
2) Extension of Service Life
Given breakdown began to occur at five years from the start of operation, extension of service life of the facility is required.
Data Collection Survey on Water Supply and Sewage Sector in Harare City Area in Zimbabwe April 2018
S-9
3) Easy Maintenance
One of the reasons for early failure was that the technical level of the staffs was low and maintenance was not done as specified. Installation of equipment using the latest technology that is easy to maintain is recommended.
4) Procurement of Spare Parts and Expendable Items
Machine failure occurs unexpectedly, and so it is necessary to provide spare parts and expendable items to minimize the down time due to failure.
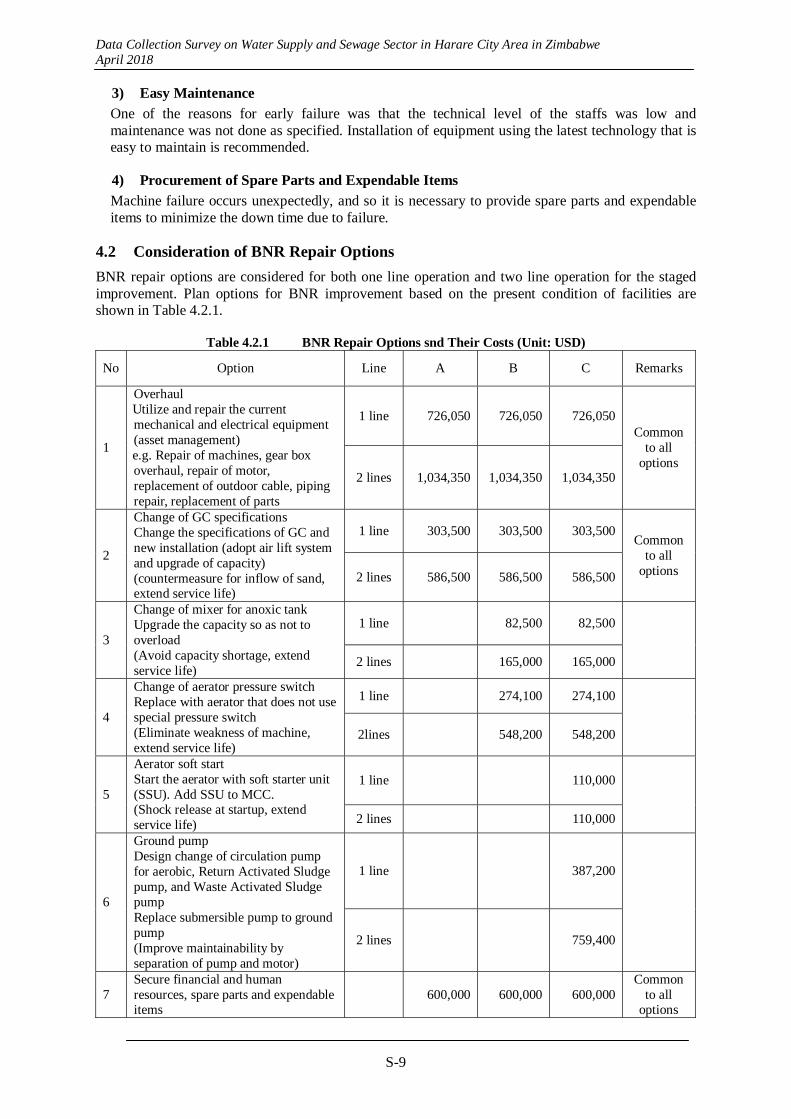
4.2 Consideration of BNR Repair Options
BNR repair options are considered for both one line operation and two line operation for the staged improvement. Plan options for BNR improvement based on the present condition of facilities are shown in Table 4.2.1.
Table 4.2.1 BNR Repair Options snd Their Costs (Unit: USD)
No Option Line A B C Remarks
1
Overhaul Utilize and repair the current mechanical and electrical equipment (asset management) e.g. Repair of machines, gear box overhaul, repair of motor, replacement of outdoor cable, piping repair, replacement of parts
1 line 726,050 726,050 726,050 Common
to all options
2 lines 1,034,350 1,034,350 1,034,350
2
Change of GC specifications Change the specifications of GC and new installation (adopt air lift system and upgrade of capacity) (countermeasure for inflow of sand, extend service life)
1 line 303,500 303,500 303,500 Common
to all options 2 lines 586,500 586,500 586,500
3
Change of mixer for anoxic tank Upgrade the capacity so as not to overload (Avoid capacity shortage, extend service life)
1 line 82,500 82,500
2 lines 165,000 165,000
4
Change of aerator pressure switch Replace with aerator that does not use special pressure switch (Eliminate weakness of machine, extend service life)
1 line 274,100 274,100
2lines 548,200 548,200
5
Aerator soft start Start the aerator with soft starter unit (SSU). Add SSU to MCC. (Shock release at startup, extend service life)
1 line 110,000
2 lines 110,000
6
Ground pump Design change of circulation pump for aerobic, Return Activated Sludge pump, and Waste Activated Sludge pump Replace submersible pump to ground pump (Improve maintainability by separation of pump and motor)
1 line 387,200
2 lines 759,400
7 Secure financial and human resources, spare parts and expendable items
600,000 600,000 600,000 Common
to all options

Data Collection Survey on Water Supply and Sewage Sector in Harare City Area in Zimbabwe April 2018
S-10
No Option Line A B C Remarks
8 Security enhancement (prevention of robbers) 50,000 50,000 50,000
Common to all
options
9 Cleaning
61,400 61,400 61,400 Common
to all options
Total Amount 1 line 1,740,950 2,097,550 2,594,750
2 lines 2,332,250 3,045,450 3,914,850
Source: JST
4.3 Financial Analysis and Analysis on Financial Sustainability
Based on the analysis on (1) how much expenses will be incurred to maintain BNR (amount of contents), and (2) how much operation and maintenance expenses can be increased in the sewerage account of Chitungwiza Municipality (frame size), JST examines the overall financial sustainability.
a) Regarding the size of cost for operating and maintaining BNR, it is not a level of monetary value that cannot be covered even by fully allocating the sewerage income generated.
b) Among the additional expenses for BNR operation, when strictly estimating chemicals, increase in the collection rate of the charge to at least 70% or more, and further increase in allocation to BNR to at least 60% of the administrative and maintenance expenses should be required. Remaining 40% must maintain and manage the conventional treatment plant, pipe catcher and pump station. In order to reduce the allocation rate to BNR, it is necessary to raise the collection rate even more.
c) It is necessary to raise the charge collection rate to about 50% and increase the allocation rate to BNR to 60% even if it is possible to lower the additional cost required when the operation of BNR is improved.
d) In order to operate and maintain only one line of BNR, it is necessary to spend BNR of about 55% of the collection rate of 45% and general administrative expenses and repair/maintenance expenses.
4.4 Recommendations for Sustainable Water and Sewerage Services
(1) Status Variance from Past Points in Time
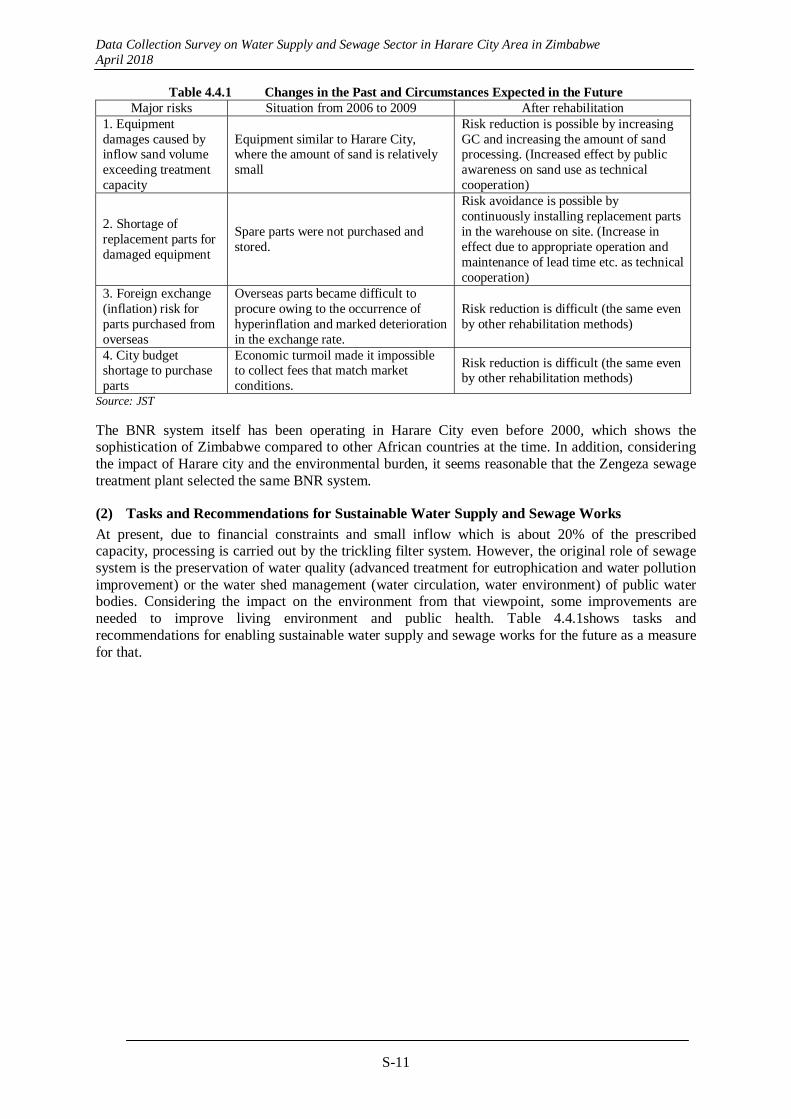
As an overall recommendation of JST, the rehabilitation of the facilities should consider the living condition in Chitungwiza. What is of concern in this case is that past outages will be repeated. Therefore, regarding the case where rehabilitation is done according to the proposal of JST, we summarized the change of various situations in the past and the situation assumed in the future as shown in Table 4.4.1.
Data Collection Survey on Water Supply and Sewage Sector in Harare City Area in Zimbabwe April 2018
S-11
Table 4.4.1 Changes in the Past and Circumstances Expected in the Future Major risks Situation from 2006 to 2009 After rehabilitation
1. Equipment damages caused by inflow sand volume exceeding treatment capacity
Equipment similar to Harare City, where the amount of sand is relatively small
Risk reduction is possible by increasing GC and increasing the amount of sand processing. (Increased effect by public awareness on sand use as technical cooperation)
2. Shortage of replacement parts for damaged equipment
Spare parts were not purchased and stored.
Risk avoidance is possible by continuously installing replacement parts in the warehouse on site. (Increase in effect due to appropriate operation and maintenance of lead time etc. as technical cooperation)
3. Foreign exchange (inflation) risk for parts purchased from overseas
Overseas parts became difficult to procure owing to the occurrence of hyperinflation and marked deterioration in the exchange rate.
Risk reduction is difficult (the same even by other rehabilitation methods)
4. City budget shortage to purchase parts
Economic turmoil made it impossible to collect fees that match market conditions.
Risk reduction is difficult (the same even by other rehabilitation methods)
Source: JST The BNR system itself has been operating in Harare City even before 2000, which shows the sophistication of Zimbabwe compared to other African countries at the time. In addition, considering the impact of Harare city and the environmental burden, it seems reasonable that the Zengeza sewage treatment plant selected the same BNR system.
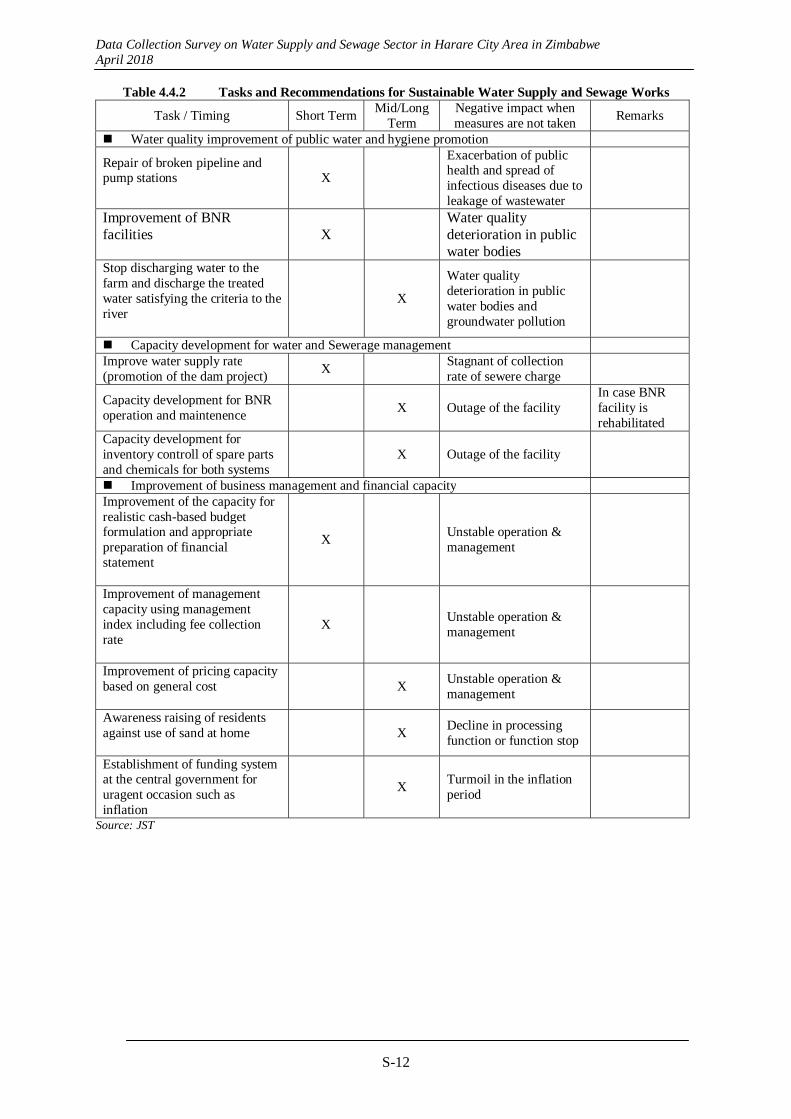
(2) Tasks and Recommendations for Sustainable Water Supply and Sewage Works
At present, due to financial constraints and small inflow which is about 20% of the prescribed capacity, processing is carried out by the trickling filter system. However, the original role of sewage system is the preservation of water quality (advanced treatment for eutrophication and water pollution improvement) or the water shed management (water circulation, water environment) of public water bodies. Considering the impact on the environment from that viewpoint, some improvements are needed to improve living environment and public health. Table 4.4.1shows tasks and recommendations for enabling sustainable water supply and sewage works for the future as a measure for that.
Data Collection Survey on Water Supply and Sewage Sector in Harare City Area in Zimbabwe April 2018
S-12
Table 4.4.2 Tasks and Recommendations for Sustainable Water Supply and Sewage Works
Task / Timing Short TermMid/Long
Term Negative impact when measures are not taken
Remarks
Water quality improvement of public water and hygiene promotion
Repair of broken pipeline and pump stations
X
Exacerbation of public health and spread of infectious diseases due to leakage of wastewater
Improvement of BNR facilities
X Water quality deterioration in public water bodies
Stop discharging water to the farm and discharge the treated water satisfying the criteria to the river
X
Water quality deterioration in public water bodies and groundwater pollution
Capacity development for water and Sewerage management Improve water supply rate(promotion of the dam project)
X Stagnant of collection rate of sewere charge
Capacity development for BNR operation and maintenence
X Outage of the facility In case BNR facility is rehabilitated
Capacity development for inventory controll of spare parts and chemicals for both systems
X Outage of the facility
Improvement of business management and financial capacity Improvement of the capacity for realistic cash-based budget formulation and appropriate preparation of financial statement
X Unstable operation & management
Improvement of management capacity using management index including fee collection rate
X Unstable operation & management
Improvement of pricing capacity based on general cost
X Unstable operation & management
Awareness raising of residents against use of sand at home
X Decline in processing function or function stop
Establishment of funding system at the central government for uragent occasion such as inflation
X Turmoil in the inflation period
Source: JST
Data Collection Survey on Water Supply and Sewage Sector in Harare City Area in Zimbabwe April 2018
1-1
CHAPTER 1 GENERAL
1.1 Background and Objectives of the Survey
1.1.1 Background
In the Harare metropolitan area, increasing volume of domestic waste water and industrial effluent surpassed the capacity of treatment plants due to rapid urbanization, population growth and evolution of industry. Consequently, water contamination at Lake Manyame and Lake Chivero, the major water resources of the area, has been a problem since the late 1990s. Furthermore, socio-economic dysfunction after the year 2000 worsened the water sanitation and hygiene condition in Chitungwiza municipality, a dormitory town of Harare city.
In order to improve the condition, “The project for Improvement of Sewage Facilities in the Municipality of Chitungwiza in the Republic of Zimbabwe”, a grant aid project, was conducted and facilities delivered to The Government of Zimbabwe (hereinafter referred to as GOZ) in 2000. However, rapid and intense aggravation of the economy in Zimbabwe in this period made it difficult to secure the appropriate budget for development and operation of facilities for water, sanitation and solid waste disposal. As a result, operation and maintenance of sewage and hygiene facilities in Chitungwiza became difficult and dysfunctional.
Subsequently JICA conducted “Data Collection Survey for Improvement of Hygiene Condition in Chitungwiza Municipality in the Republic of Zimbabwe” in 2011, and collected and analyzed basic information for the improvement of sanitation and hygiene conditions in Chitungwiza municipality. The result of the survey showed that the water supply as well as the sanitation and the solid waste management was not functioning in the municipality. Given the result of the survey, GOZ requested the implementation of “The Project for the Improvement of Water Supply, Sewage and Solid Waste Management in Chitungwiza in the Republic of Zimbabwe” for the establishment of a Master Plan (M/P) and examination and clarification of improvement measures. In response to the request, JICA commenced the study in 2012, conducting Phase 1 which involved collection of information and analysis, and established the M/P in Phase 2. Nonetheless, the implementation of the study was suspended in July 2013 due to serious financial conditions in Chitungwiza municipality. Agreement was made between JICA and GOZ that the project would be resumed when the financial condition had been improved. To date, improvement of the financial condition has not been observed. From 2017, examination of various reform measures is ongoing and improvement in the financial condition is expected.
1.1.2 Objectives
This survey aims at collection of information on activities and plans by relevant organizations, the financial condition, organization structure of the implementing agency and activities by donors regarding water supply and sanitation in the Harare metropolitan area (City of Harare and Chitungwiza municipality). Additionally, by inspection on the condition of facilities and equipment of Zengeza treatment plant constructed under the Japanese grant aid, options for replacement of facilities and partial utilization of existing facilities will be analyzed. Based on the result of those surveys, issues and proposals for sustainable management of water supply and sanitation in Chitungwiza municipality will be scrutinized.
1.2 Survey Area
The principal survey area is Chitungwiza municipality. The City of Harare is included if integrated survey is required from the facilities and institutional aspects.

Data Collection Survey on Water Supply and Sewage Sector in Harare City Area in Zimbabwe April 2018
1-2
Source: JST Figure 1.2.1 Survey Area
1.3 Survey Schedule and Survey Team
1.3.1 Survey Schedule in Zimbabwe
The following two surveys were conducted in Zimbabwe. Detailed schedules are shown in Table 1.3.1 and Table 1.3.2.
First Survey in Zimbabwe: From 1 Jan. 2018 to 7 Feb. 2018 (30 days)
Second Survey in Zimbabwe: From 9 Apr. 2018 to 15 Apr. 2018 (7 days)
Table 1.3.1 Survey Schedule of First Survey in Zimbabwe
Tatsuo TOMIDOKORO Natsuki SHIMEGI Takaaki OGAWA
Erina KAN (1/9 - 1/20) Satoshi MIZUNO (1/29 - 2/4)
1/9 Tue Dep. from Tokyo Dep. from Tokyo Dep.from Kansai Dep. from Tokyo 1/10 Wed AM Arrive at Harare Arrive at Harare Arrive at Harare Arrive at Harare
PM Office work Office work Office work Office work 1/11 Thr AM JICA Zimbabwe Office
EOJ JICA Zimbabwe Office EOJ
JICA Zimbabwe Office EOJ
JICA Zimbabwe OfficeEOJ
PM Ministry of Evironment, Water and Climate
Ministry of Evironment, Water and Climate
Ministry of Evironment, Water and Climate
Ministry of Evironment, Water and Climate
1/12 Fri AM Ministry of Evironment, Water and Climate
Ministry of Evironment, Water and Climate
Chitugwiza Municipality Office
Ministry of Evironment, Water and Climate
PM Harare Water Department Harare Water Department Zengeza Sewage Plant Harare Water Department
1/13 Sat AM Field Survey (St. Mary PS1/2/3, Tilcor PS)
Field Survey (St. Mary PS1/2/3, Tilcor PS)
Field Survey (St. Mary PS1/2/3, Tilcor PS)
Field Survey (St. Mary PS1/2/3, Tilcor PS)
PM Field Survey (St. Mary PS1/2/3, Tilcor PS)
Field Survey (St. Mary PS1/2/3, Tilcor PS)
Field Survey (St. Mary PS1/2/3, Tilcor PS)
Field Survey (St. Mary PS1/2/3, Tilcor PS)
1/14 Sun AM Office work Office work Office work Office work

Data Collection Survey on Water Supply and Sewage Sector in Harare City Area in Zimbabwe April 2018
1-3
PM Office work Office work Office work Office work
1/15 Mon AM Chitungwiza Municipality Office
Chitungwiza Municipality Office
Chitungwiza Municipality Office
Chitungwiza Municipality Office
PM Zengeza Sewage Plant Zengeza Sewage Plant Zengeza Sewage Plant Zengeza Sewage Plant 1/16 Tue AM Environmental
Management Agency Environmental Management Agency
Chitungwiza Municipality Office
Environmental Management Agency
PM Ministry of Local Government, Public Works and National Housing
Ministry of Local Government, Public Works and National Housing
Zengeza Sewage Plant Ministry of Local Government, Public Works and National Housing
1/17 Wed AM ZINWA ZINWA Zengeza Sewage Plant ZINWA PM Office work Office work Zengeza Sewage Plant Office work
1/18 Thr AM JICA Zimbabwe Office JICA Zimbabwe Office JICA Zimbabwe Office JICA Zimbabwe OfficePM The Harare Water
Department The Harare Water Department
The Harare Water Department
The Harare Water Department
1/19 Fri AM Chitugwiza Municipality Office
Chitugwiza Municipality Office
Chitugwiza Municipality Office
Chitugwiza Municipality Office
PM Field Survey (Tilcor, Unit M trunk line)
Field Survey (Tilcor, Unit M trunk line)
Field Survey (Tilcor, Unit M trunk line)
Field Survey (Tilcor, Unit M trunk line)
1/20 Sat AM Office work Office work Office work Dep. from Harare PM Office work Office work Office work
1/21 Sun AM Office work Office work Office work PM Office work Office work Office work
1/22 Mon AM AfDB (Zim Fund) Chinese Embassy AfDB (Zim Fund) PM Sesani (PPP)
UNICEF Sesani (PPP) UNICEF
Sesani (PPP) UNICEF
1/23 Tue AM Finance Department, Chitugwiza Municipality
Finance Department, Chitugwiza Municipality
Finance Department, Chitugwiza Municipality
PM Acting Town Clerk, Chitugwiza Municipality
Acting Town Clerk, Chitugwiza Municipality
Zengeza Sewage Plant
1/24 Wed AM Office work Office work Office work PM Firle Sewage Plant Firle Sewage Plant Firle Sewage Plant
1/25 Thr AM JICA Zimbabwe Office JICA Zimbabwe Office JICA Zimbabwe Office PM Ministry of Finance and
Economic Planning Ministry of Finance and Economic Planning
Ministry of Finance and Economic Planning
1/26 Fri AM Crowborough Sewage Plant
Finance Department, Chitugwiza Municipality
Crowborough Sewage Plant
PM Harare Water Arrangement for survey Harare Water 1/27 Sat AM Morton Jeffry Plant and
Lake Chivero Survey for willingness to pay
Morton Jeffry Plant and Lake Chivero
PM Morton Jeffry Plant and Lake Chivero
Survey for willingness to pay
Morton Jeffry Plant and Lake Chivero
1/28 Sun AM Office work Office work Office work PM Office work Office work Office work
1/29 Mon AM Environmental Management Agency
Office work Harare Water Harare water
PM Ministry of Finance and Economic Planning
Ministry of Finance and Economic Planning
Zengeza Sewage Plant Zengeza Sewage Plant
1/30 Tue AM Report writing Survey for willingness to pay
Report writing Report writing
PM JICA Zimbabwe Office Survey for willingness to pay JICA Zimbabwe Office
JICA Zimbabwe Office JICA Zimbabwe Office
1/31 Wed AM EOJ EOJ EOJ EOJ PM Office work Finance Division,
Chitugwiza MunicipalityOffice work Office work
2/1 Thr AM Water Division, Chitugwiza Municipality
Water Division, Chitugwiza Municipality
Environmental Management Agency
Environmental Management Agency
PM Finance Division, Chitugwiza Municipality Plannning Division, Chitugwiza Municipality
Finance Division, Chitugwiza MunicipalityPlannning Division, Chitugwiza Municipality
Finance Division, Chitugwiza Municipality Environmental Management Agency
Finance Division, Chitugwiza Municipality Environmental Management Agency

Data Collection Survey on Water Supply and Sewage Sector in Harare City Area in Zimbabwe April 2018
1-4
2/2 Fri AM Accounting Division, Harare Wate Planning Division, City of Harare
Accounting Division, Harare Wate Planning Division, City of Harare
Prince Edward Plant Zengeza Sewage Plant
Prince Edward Plant Zengeza Sewage Plant
PM Sesani (PPP) Sesani (PPP) Harare Water Harare Water 2/3 Sat AM Office work Survey for willingness to
pay Office work Office work
PM Office work Survey for willingness to pay
Office work Office work
2/4 Sun AM Dep. from Harare Dep. from Harare Dep. from Harare Office work PM Arrive at Johannesburg Arrive at Johannesburg Arrive at Johannesburg Dep. from Harare
2/5 Mon AM Survey in Johannesburg Survey in Johannesburg Survey in Johannesburg PM Survey in Johannesburg Survey in Johannesburg Survey in Johannesburg
2/6 Tue AM JICA South Africa Office JICA South Africa Office JICA South Africa Office PM Dep. from Johannesburg Dep. from Johannesburg Dep. from Johannesburg
2/7 Wed Arrive at Tokyo Arrive at Tokyo Arrive at Kansai Source: JST
Table 1.3.2 Survey Schedule of Second Survey in Zimbabwe Tatsuo TOMIDOKORO Natsuki SHIMEGI Remark
4/9 Mon Dep. From Tokyo Dep. From Tokyo 4/10 Tue Arrive at Harare Arrive at Harare
4/11 Wed AM
JICA Zimbabwe, AfDB, Ministry of Evironment, Water and Climate
JICA Zimbabwe, AfDB, Ministry of Evironment, Water and Climate
PM Chitungwiza Municipality, ZengezaSewage Plan
Chitungwiza Municipality, ZengezaSewage Plan
4/12 Thr AM Sesani, EOJ Sesani, EOJ
PM Ministry of Evironment, Water and Climate
Ministry of Evironment, Water and Climate
4/13 Fri AM WorkShop WorkShop PM Harare Water Harare Water
4/14 Sat AM Office work Office work PM Dep. from Harare Dep. from Harare
4/15 Sun Arrive at Tokyo Arrive at Tokyo Source: JST The outline of discussion in the workshop held 13 April is shown in 5.3.3. The Minutes of Meeting and material for meeting are shown in Appendix 4.
The outline of agenda and collected information are shown in Table 1.3.3.
Table 1.3.3 Agenda and Collected Information of Meetings Organization Agenda and Collected Information
Embassy of Japan Explanation on circumstances of Zengeza Sewage Plant and objectives of the survey by the JST
EOJ's expectations are grant aid through follow-up, repair through technical cooperation
Dep. Of Environment, Ministry of Environment, Water and Climate
The following information was collected:- Organization structure and role of related organization - Relation with sewer policy and legislative system - Budget of the ministry
Dep. Of Water, Ministry of Environment, Water and Climate
The following information was collected:- Organization structure - Legislation for water and sanitation - Relation with local government and its water and sanitation entity - Policy on water charge - Activities by donors and progress of PPP
Ministry of Local Government Public Works and National Housing
The following information was collected:- Role of the Ministry and relation with local government - Financial system of local government - On-going project of water and sanitation

Data Collection Survey on Water Supply and Sewage Sector in Harare City Area in Zimbabwe April 2018
1-5
- Intervention to water charge policy Ministry of Finance and Economic Development
The following information was collected:- State of control for water and sanitation entity in local government - Financial statement
Zimbabwe National Water Authority (ZINWA)
The following information was collected:- Institution for water and sanitation enterprise - Present state of water resource management and problems - Method of water charge levy
Environment Management Agency (EMA)
The following information was collected: - Environmental regulation, quality standard - Administration of regulation, penalties - Relation with local government
Harare Water The following information was collected:- Budget allocation by Harare City - State of water charge levy - Relation with Chitungwiza municipality: disbursement by Chitungwiza
municipality, water supply to Chitungwiza municipality Chitungwiza Municipality The following information was collected:
- Financial statements in last year, budget for this year - Accounting system of the municipality
Zengeza STP The following information was collected:- Past cooperation by Zim-Fund and Japan - Problems of BNR system and improvement method
AfDB The following information was collected:- Water and sanitation project by Zim-Fund - Improvement condition of Zengeza treatment plant and existing issues
Sesani The following information was collected:- Progress of transition to PPP and prospect - Government policy for PPP
Chinese Embassy The following information was collected:- Chinese aid system including loan - Recognition on current water and sanitation condition
UNICEF The following information was collected:- Activity in Zimbabwe - Planned activity
Source: JST
Table 1.3.4 Inspection Items in Site Visit Site Inspection item and result
Zengeza STP Operation condition Detailed inspection on facilities for BNR system
Firle Sewage Plant Crouborough Sewage Plant
Operation condition of BNR sewage plant Condition of facilities of BNR sewage plant: Firle Sewage plant is
working. Crouborough Sewage Plant is out of service for rehabilitation. Morton Jeffry Water Plant Condition of facilities of purification plantLake Chivero Condition of Lake Chivero (headspring)Pump Stations Status of pump station: One station is working. One station is out of
service due to equipment shortage. One station is out of service due to problem in water pipe.
Discharge points Destination of treated water from Zengeza plant: Used for irrigation water. Not discharged to river.
Source: JST
Data Collection Survey on Water Supply and Sewage Sector in Harare City Area in Zimbabwe April 2018
1-6
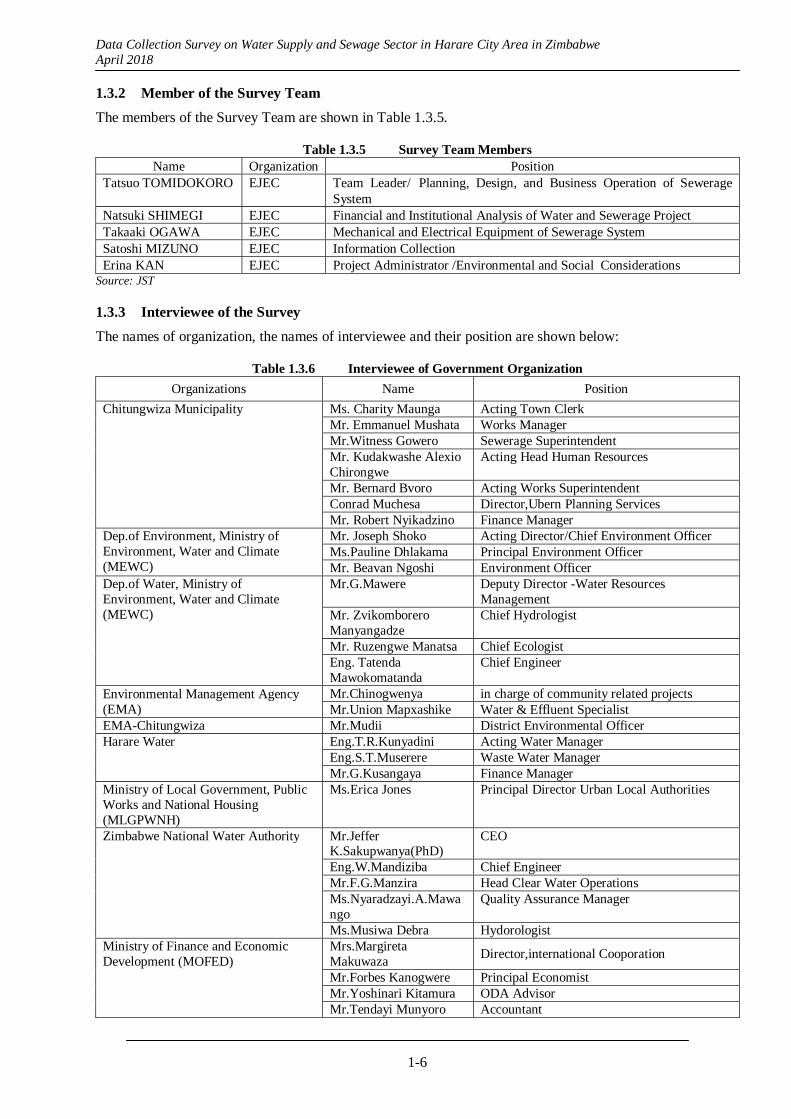
1.3.2 Member of the Survey Team
The members of the Survey Team are shown in Table 1.3.5.
Table 1.3.5 Survey Team Members Name Organization Position
Tatsuo TOMIDOKORO EJEC Team Leader/ Planning, Design, and Business Operation of Sewerage System
Natsuki SHIMEGI EJEC Financial and Institutional Analysis of Water and Sewerage Project Takaaki OGAWA EJEC Mechanical and Electrical Equipment of Sewerage System Satoshi MIZUNO EJEC Information Collection Erina KAN EJEC Project Administrator /Environmental and Social Considerations
Source: JST
1.3.3 Interviewee of the Survey
The names of organization, the names of interviewee and their position are shown below:
Table 1.3.6 Interviewee of Government Organization
Organizations Name Position
Chitungwiza Municipality Ms. Charity Maunga Acting Town Clerk Mr. Emmanuel Mushata Works Manager Mr.Witness Gowero Sewerage Superintendent Mr. Kudakwashe Alexio Chirongwe
Acting Head Human Resources
Mr. Bernard Bvoro Acting Works Superintendent Conrad Muchesa Director,Ubern Planning ServicesMr. Robert Nyikadzino Finance Manager
Dep.of Environment, Ministry of Environment, Water and Climate (MEWC)
Mr. Joseph Shoko Acting Director/Chief Environment OfficerMs.Pauline Dhlakama Principal Environment Officer Mr. Beavan Ngoshi Environment Officer
Dep.of Water, Ministry of Environment, Water and Climate (MEWC)
Mr.G.Mawere Deputy Director -Water Resources Management
Mr. Zvikomborero Manyangadze
Chief Hydrologist
Mr. Ruzengwe Manatsa Chief Ecologist Eng. Tatenda Mawokomatanda
Chief Engineer
Environmental Management Agency (EMA)
Mr.Chinogwenya in charge of community related projectsMr.Union Mapxashike Water & Effluent Specialist
EMA-Chitungwiza Mr.Mudii District Environmental Officer Harare Water Eng.T.R.Kunyadini Acting Water Manager
Eng.S.T.Muserere Waste Water Manager Mr.G.Kusangaya Finance Manager
Ministry of Local Government, Public Works and National Housing (MLGPWNH)
Ms.Erica Jones Principal Director Urban Local Authorities
Zimbabwe National Water Authority Mr.Jeffer K.Sakupwanya(PhD)
CEO
Eng.W.Mandiziba Chief Engineer Mr.F.G.Manzira Head Clear Water Operations Ms.Nyaradzayi.A.Mawango
Quality Assurance Manager
Ms.Musiwa Debra HydorologistMinistry of Finance and Economic Development (MOFED)
Mrs.Margireta Makuwaza
Director,international Cooporation
Mr.Forbes Kanogwere Principal Economist Mr.Yoshinari Kitamura ODA AdvisorMr.Tendayi Munyoro Accountant
Data Collection Survey on Water Supply and Sewage Sector in Harare City Area in Zimbabwe April 2018
1-7
Mr.Peter Makore EconomistMr.Stephen Nkomo EconomistMr.Nimirod Mawindidze EconomistMr. Edison Mutsvunguma
Economist
Mr.John Mafararikwa Head - Zimbabwe Public Debt Management Office
Joint Venture Unit, MOFED- Mr.Johah Mushayi Acting Director Mr.Moriseni Mutema Acting Deputy Director Mr.Pardon Nyandoro Principal Economist Mr.Wilbert Zimbiti Principal Economist
Source: JST
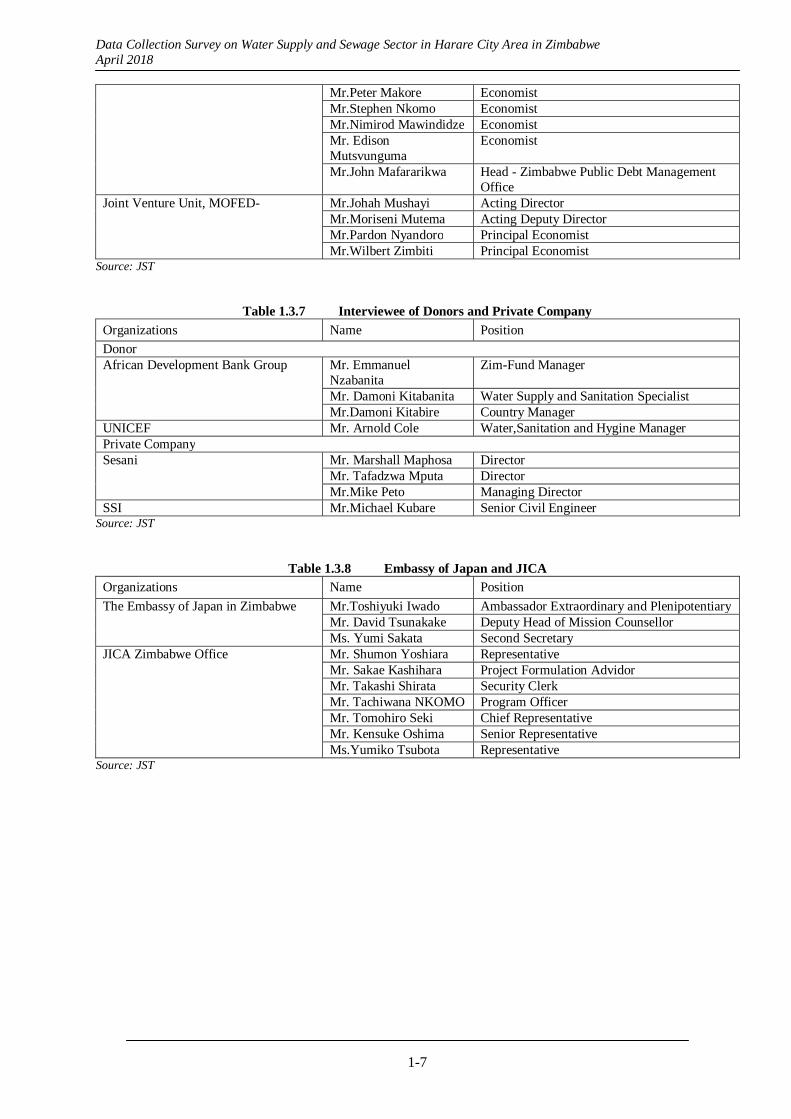
Table 1.3.7 Interviewee of Donors and Private Company
Organizations Name Position
Donor African Development Bank Group Mr. Emmanuel
Nzabanita Zim-Fund Manager
Mr. Damoni Kitabanita Water Supply and Sanitation SpecialistMr.Damoni Kitabire Country Manager
UNICEF Mr. Arnold Cole Water,Sanitation and Hygine ManagerPrivate Company Sesani Mr. Marshall Maphosa Director
Mr. Tafadzwa Mputa DirectorMr.Mike Peto Managing Director
SSI Mr.Michael Kubare Senior Civil Engineer Source: JST
Table 1.3.8 Embassy of Japan and JICA Organizations Name Position
The Embassy of Japan in Zimbabwe Mr.Toshiyuki Iwado Ambassador Extraordinary and PlenipotentiaryMr. David Tsunakake Deputy Head of Mission CounsellorMs. Yumi Sakata Second Secretary
JICA Zimbabwe Office Mr. Shumon Yoshiara Representative Mr. Sakae Kashihara Project Formulation Advidor Mr. Takashi Shirata Security ClerkMr. Tachiwana NKOMO Program Officer Mr. Tomohiro Seki Chief Representative Mr. Kensuke Oshima Senior Representative Ms.Yumiko Tsubota Representative
Source: JST
Data Collection Survey on Water Supply and Sewage Sector in Harare City Area in Zimbabwe April 2018
2-1
CHAPTER 2 GENERAL CONDITION AND SANITATION IN ZIMBABWE
2.1 Natural Condition
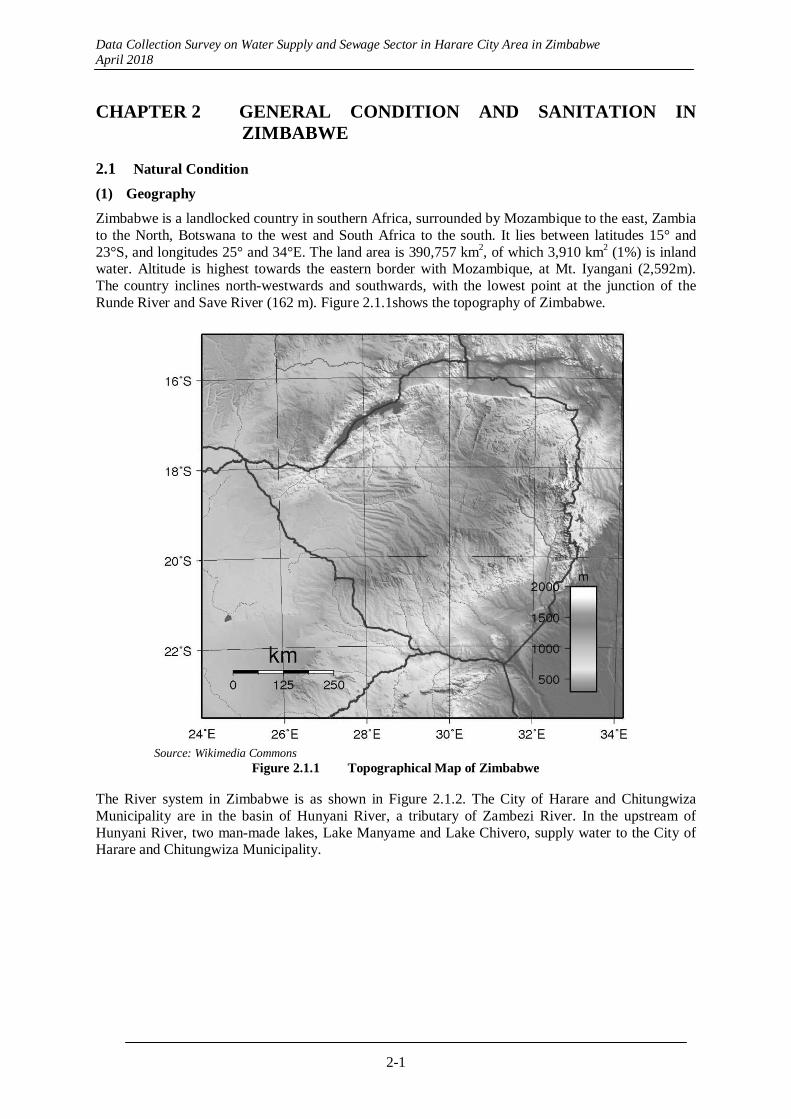
(1) Geography
Zimbabwe is a landlocked country in southern Africa, surrounded by Mozambique to the east, Zambia to the North, Botswana to the west and South Africa to the south. It lies between latitudes 15° and 23°S, and longitudes 25° and 34°E. The land area is 390,757 km2, of which 3,910 km2 (1%) is inland water. Altitude is highest towards the eastern border with Mozambique, at Mt. Iyangani (2,592m). The country inclines north-westwards and southwards, with the lowest point at the junction of the Runde River and Save River (162 m). Figure 2.1.1shows the topography of Zimbabwe.
Source: Wikimedia Commons
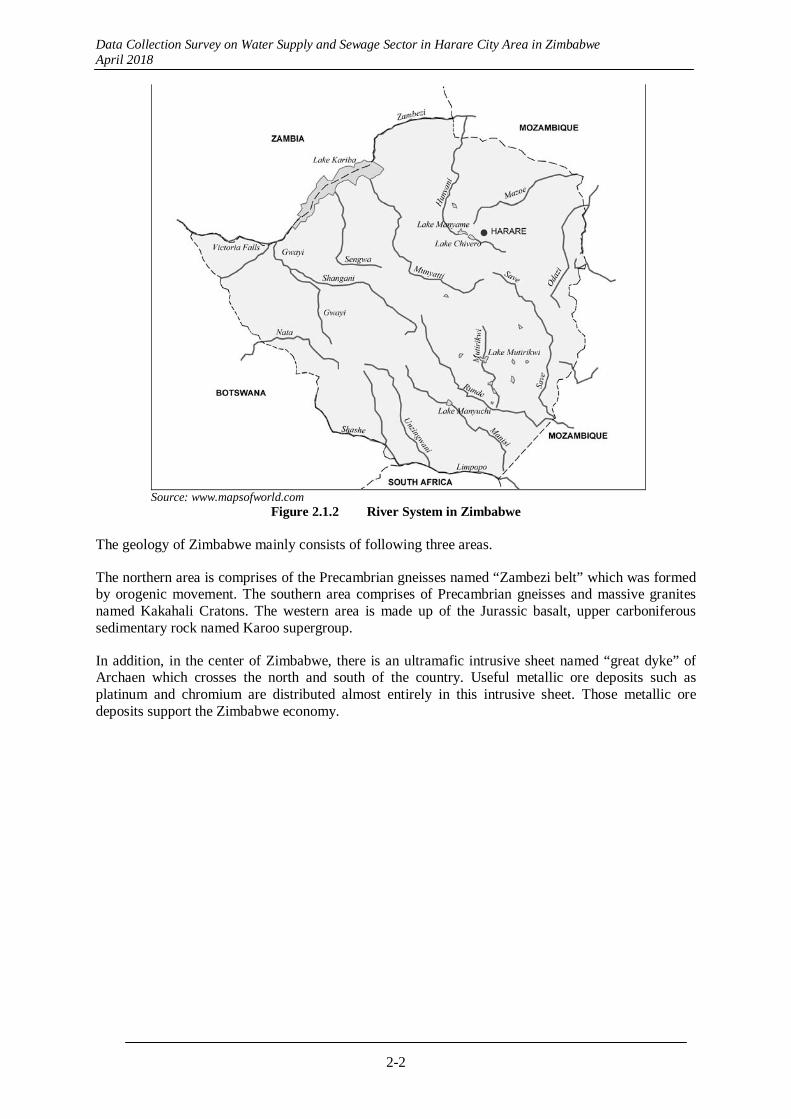
Figure 2.1.1 Topographical Map of Zimbabwe The River system in Zimbabwe is as shown in Figure 2.1.2. The City of Harare and Chitungwiza Municipality are in the basin of Hunyani River, a tributary of Zambezi River. In the upstream of Hunyani River, two man-made lakes, Lake Manyame and Lake Chivero, supply water to the City of Harare and Chitungwiza Municipality.
Data Collection Survey on Water Supply and Sewage Sector in Harare City Area in Zimbabwe April 2018
2-2
Source: www.mapsofworld.com
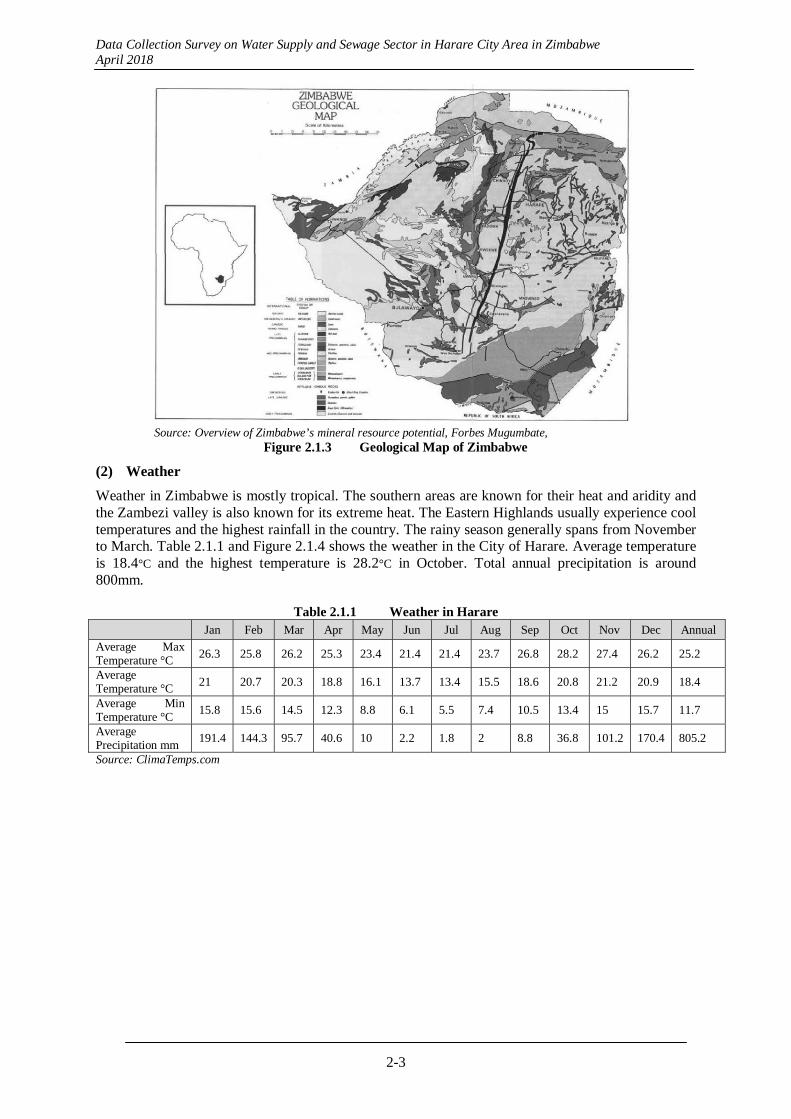
Figure 2.1.2 River System in Zimbabwe The geology of Zimbabwe mainly consists of following three areas.
The northern area is comprises of the Precambrian gneisses named “Zambezi belt” which was formed by orogenic movement. The southern area comprises of Precambrian gneisses and massive granites named Kakahali Cratons. The western area is made up of the Jurassic basalt, upper carboniferous sedimentary rock named Karoo supergroup.
In addition, in the center of Zimbabwe, there is an ultramafic intrusive sheet named “great dyke” of Archaen which crosses the north and south of the country. Useful metallic ore deposits such as platinum and chromium are distributed almost entirely in this intrusive sheet. Those metallic ore deposits support the Zimbabwe economy.
Data Collection Survey on Water Supply and Sewage Sector in Harare City Area in Zimbabwe April 2018
2-3
Source: Overview of Zimbabwe’s mineral resource potential, Forbes Mugumbate,
Figure 2.1.3 Geological Map of Zimbabwe
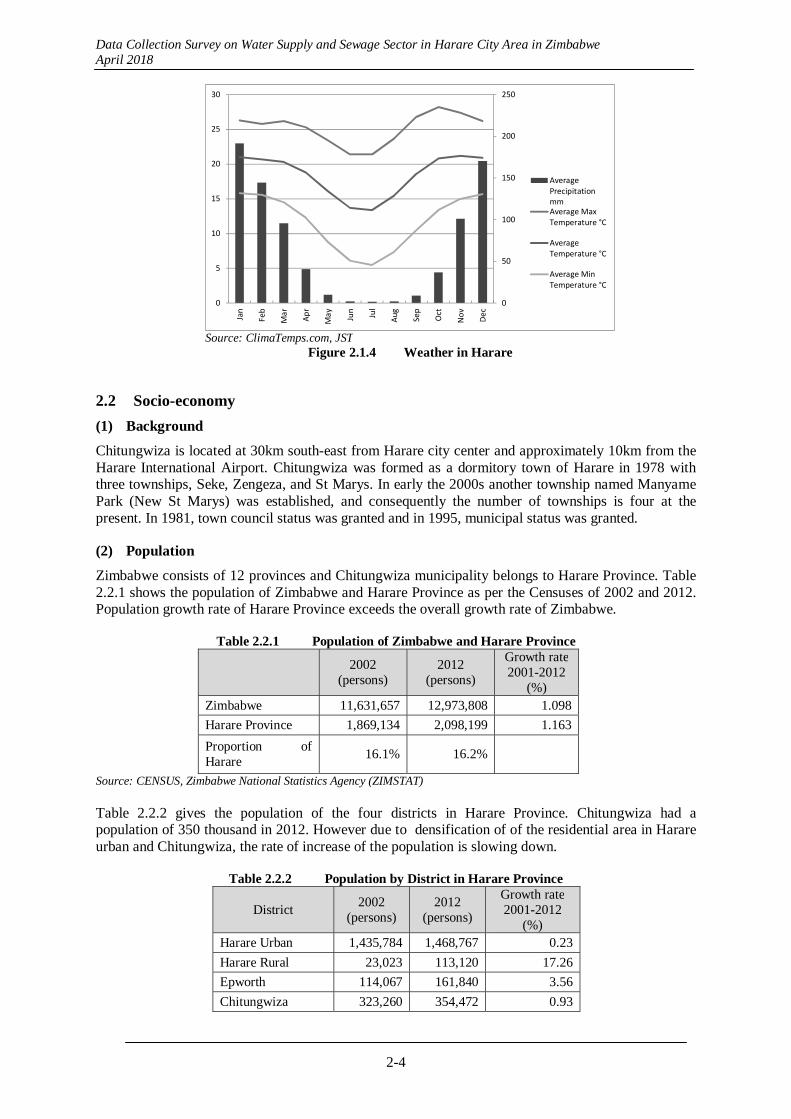
(2) Weather
Weather in Zimbabwe is mostly tropical. The southern areas are known for their heat and aridity and the Zambezi valley is also known for its extreme heat. The Eastern Highlands usually experience cool temperatures and the highest rainfall in the country. The rainy season generally spans from November to March. Table 2.1.1 and Figure 2.1.4 shows the weather in the City of Harare. Average temperature is 18.4°C and the highest temperature is 28.2°C in October. Total annual precipitation is around 800mm.
Table 2.1.1 Weather in Harare Jan Feb Mar Apr May Jun Jul Aug Sep Oct Nov Dec Annual
Average Max Temperature °C 26.3 25.8 26.2 25.3 23.4 21.4 21.4 23.7 26.8 28.2 27.4 26.2 25.2
Average Temperature °C 21 20.7 20.3 18.8 16.1 13.7 13.4 15.5 18.6 20.8 21.2 20.9 18.4
Average Min Temperature °C
15.8 15.6 14.5 12.3 8.8 6.1 5.5 7.4 10.5 13.4 15 15.7 11.7
Average Precipitation mm
191.4 144.3 95.7 40.6 10 2.2 1.8 2 8.8 36.8 101.2 170.4 805.2
Source: ClimaTemps.com
Data Collection Survey on Water Supply and Sewage Sector in Harare City Area in Zimbabwe April 2018
2-4
0
50
100
150
200
250
0
5
10
15
20
25
30
Jan
Feb
Mar
Apr
May
Jun
Jul
Aug
Sep
Oct
Nov
Dec
AveragePrecipitationmmAverage MaxTemperature °C
AverageTemperature °C
Average MinTemperature °C
Source: ClimaTemps.com, JST
Figure 2.1.4 Weather in Harare
2.2 Socio-economy
(1) Background
Chitungwiza is located at 30km south-east from Harare city center and approximately 10km from the Harare International Airport. Chitungwiza was formed as a dormitory town of Harare in 1978 with three townships, Seke, Zengeza, and St Marys. In early the 2000s another township named Manyame Park (New St Marys) was established, and consequently the number of townships is four at the present. In 1981, town council status was granted and in 1995, municipal status was granted.
(2) Population
Zimbabwe consists of 12 provinces and Chitungwiza municipality belongs to Harare Province. Table 2.2.1 shows the population of Zimbabwe and Harare Province as per the Censuses of 2002 and 2012. Population growth rate of Harare Province exceeds the overall growth rate of Zimbabwe.
Table 2.2.1 Population of Zimbabwe and Harare Province
2002
(persons) 2012
(persons)
Growth rate 2001-2012
(%) Zimbabwe 11,631,657 12,973,808 1.098
Harare Province 1,869,134 2,098,199 1.163
Proportion of Harare
16.1% 16.2%
Source: CENSUS, Zimbabwe National Statistics Agency (ZIMSTAT) Table 2.2.2 gives the population of the four districts in Harare Province. Chitungwiza had a population of 350 thousand in 2012. However due to densification of of the residential area in Harare urban and Chitungwiza, the rate of increase of the population is slowing down.
Table 2.2.2 Population by District in Harare Province
District 2002
(persons) 2012
(persons)
Growth rate 2001-2012
(%) Harare Urban 1,435,784 1,468,767 0.23
Harare Rural 23,023 113,120 17.26
Epworth 114,067 161,840 3.56
Chitungwiza 323,260 354,472 0.93
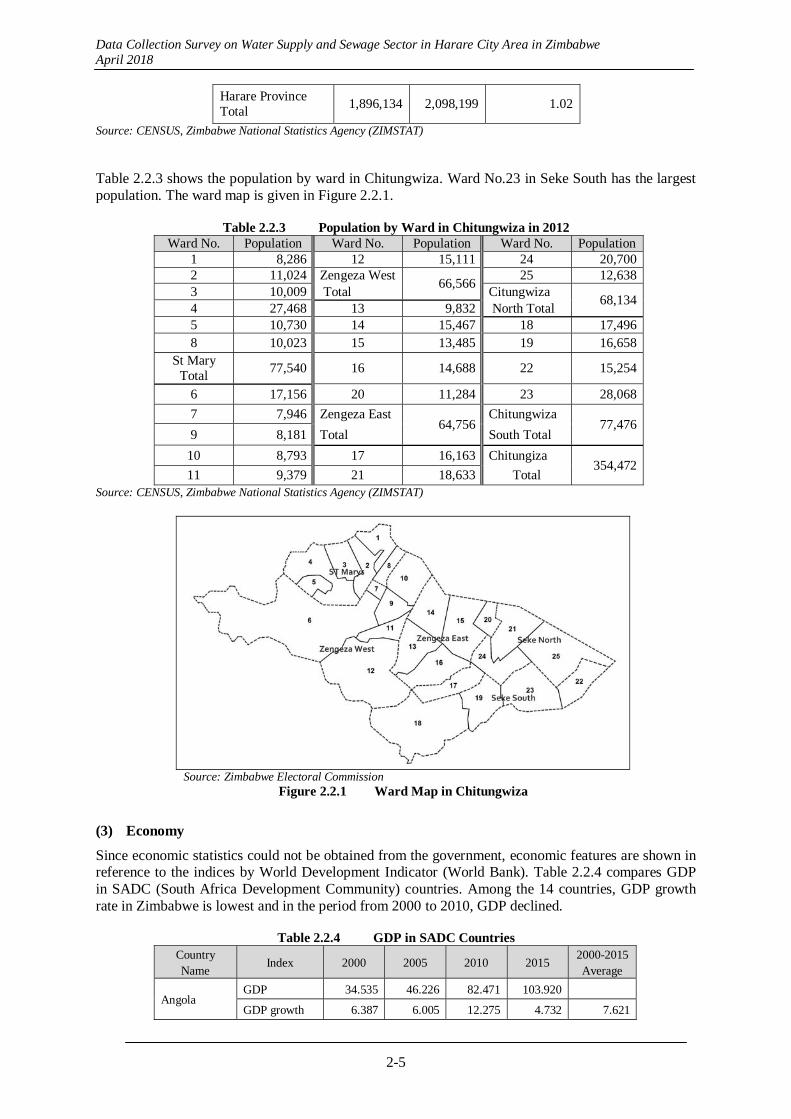
Data Collection Survey on Water Supply and Sewage Sector in Harare City Area in Zimbabwe April 2018
2-5
Harare Province Total
1,896,134 2,098,199 1.02
Source: CENSUS, Zimbabwe National Statistics Agency (ZIMSTAT)
Table 2.2.3 shows the population by ward in Chitungwiza. Ward No.23 in Seke South has the largest population. The ward map is given in Figure 2.2.1.
Table 2.2.3 Population by Ward in Chitungwiza in 2012 Ward No. Population Ward No. Population Ward No. Population
1 8,286 12 15,111 24 20,700 2 11,024 Zengeza West
66,56625 12,638
3 10,009 Total Citungwiza68,134
4 27,468 13 9,832 North Total5 10,730 14 15,467 18 17,496 8 10,023 15 13,485 19 16,658
St Mary Total
77,540 16 14,688 22 15,254
6 17,156 20 11,284 23 28,068
7 7,946 Zengeza East 64,756
Chitungwiza 77,476
9 8,181 Total South Total
10 8,793 17 16,163 Chitungiza 354,472
11 9,379 21 18,633 Total Source: CENSUS, Zimbabwe National Statistics Agency (ZIMSTAT)
Source: Zimbabwe Electoral Commission
Figure 2.2.1 Ward Map in Chitungwiza
(3) Economy
Since economic statistics could not be obtained from the government, economic features are shown in reference to the indices by World Development Indicator (World Bank). Table 2.2.4 compares GDP in SADC (South Africa Development Community) countries. Among the 14 countries, GDP growth rate in Zimbabwe is lowest and in the period from 2000 to 2010, GDP declined.
Table 2.2.4 GDP in SADC Countries Country Name
Index 2000 2005 2010 2015 2000-2015 Average
Angola GDP 34.535 46.226 82.471 103.920
GDP growth 6.387 6.005 12.275 4.732 7.621
Data Collection Survey on Water Supply and Sewage Sector in Harare City Area in Zimbabwe April 2018
2-6
DRC GDP 13.003 15.675 20.523 29.848
GDP growth -3.916 3.808 5.538 7.779 5.696
Zambia GDP 9.882 13.351 20.266 26.058
GDP growth 3.615 6.202 8.706 5.157 6.678
Zimbabwe GDP 15.352 10.459 10.052 14.577
GDP growth 2.310 -7.388 -0.791 7.716 -0.345
Tanzania GDP 16.511 23.383 31.408 43.728
GDP growth 4.309 7.207 6.079 6.843 6.708
Botswana GDP 8.564 10.231 12.787 16.146
GDP growth 5.191 3.622 4.561 4.776 4.318
Mozambique GDP 4.635 7.096 10.154 14.308
GDP growth 11.511 8.890 7.431 7.099 7.804
Lesotho GDP 1.645 1.888 2.394 2.983
GDP growth 3.022 2.791 4.864 4.498 4.047
Mauritius GDP 6.599 7.671 10.004 11.956
GDP growth 5.777 3.055 5.454 3.629 4.041
Malawi GDP 4.376 4.867 6.960 8.499
GDP growth 3.908 2.148 7.416 4.077 4.525
Namibia GDP 7.116 9.053 11.282 14.753
GDP growth 3.512 4.932 4.502 5.511 4.981
Swaziland GDP 3.135 3.773 4.439 5.373
GDP growth 2.850 3.775 3.304 3.893 3.657
South Africa GDP 266.993 322.228 375.349 418.388
GDP growth 2.787 3.832 3.099 2.195 3.040
Seychelles GDP 0.794 0.783 0.970 1.265
GDP growth 5.659 -0.285 4.374 5.457 3.152
GDP: constant 2010 billion USD GDP growth: annual % Source: World development Indicator, World Bank Table 2.2.5 compares GDP per capita in SADC countries. GDP per capita in Zimbabwe surpasses Tanzania, Mozambique, Malawi and DRC. However the growth rate is lowest among the SADC countries.
Table 2.2.5 GDP per Capita in SADC Countries Country Name
Index 2000 2005 2010 2015 2000-2015 Average
Angola GDP per capita 2,100.57 2,364.19 3,529.05 3,730.17
GDP per capita growth 3.42 2.39 8.34 1.11 3.90
DRC GDP per capita 276.22 286.29 318.08 391.72
GDP per capita growth -6.27 0.72 2.13 4.25 2.36
Zambia GDP per capita 938.35 1,107.73 1,463.21 1,618.46
GDP per capita growth 0.71 3.37 5.72 2.04 3.70
Zimbabwe GDP per capita 1,256.08 808.29 713.60 923.90
GDP per capita growth 0.75 -8.44 -2.46 5.30 -2.03
Tanzania GDP per capita 497.20 610.82 701.60 835.97
GDP per capita growth 1.60 4.20 2.81 3.57 3.52
Botswana GDP per capita 4,954.77 5,512.81 6,346.16 7,308.61
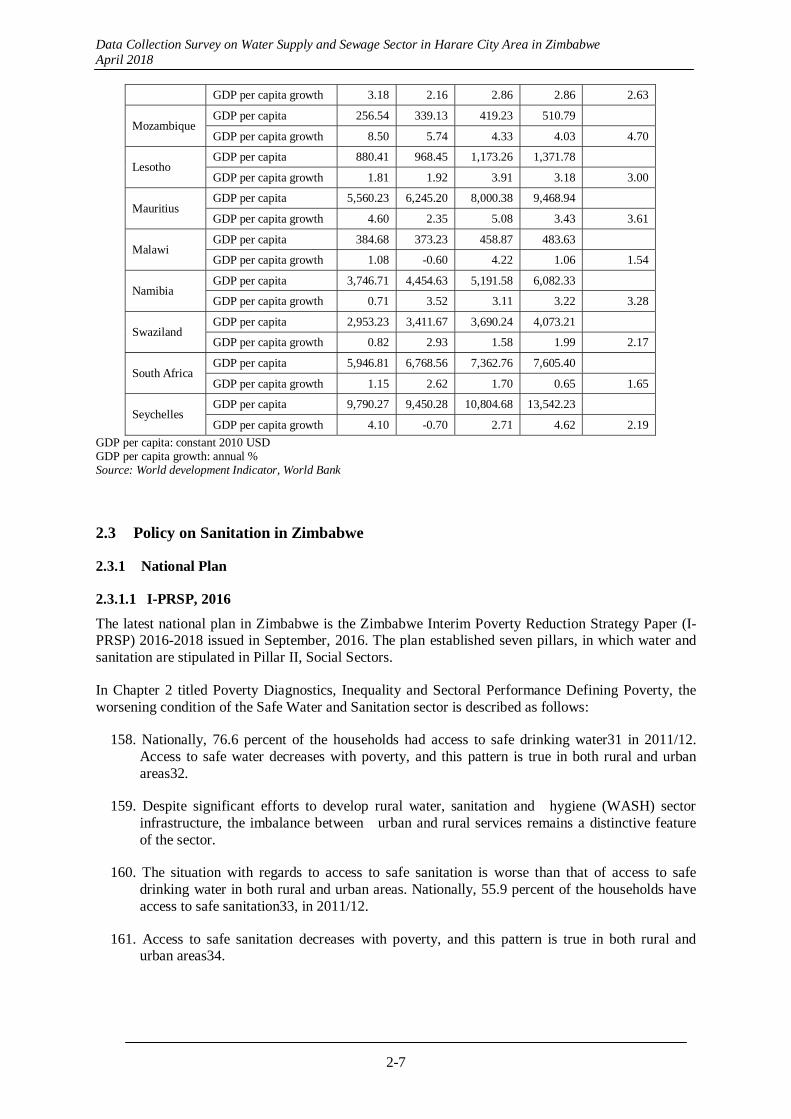
Data Collection Survey on Water Supply and Sewage Sector in Harare City Area in Zimbabwe April 2018
2-7
GDP per capita growth 3.18 2.16 2.86 2.86 2.63
Mozambique GDP per capita 256.54 339.13 419.23 510.79
GDP per capita growth 8.50 5.74 4.33 4.03 4.70
Lesotho GDP per capita 880.41 968.45 1,173.26 1,371.78
GDP per capita growth 1.81 1.92 3.91 3.18 3.00
Mauritius GDP per capita 5,560.23 6,245.20 8,000.38 9,468.94
GDP per capita growth 4.60 2.35 5.08 3.43 3.61
Malawi GDP per capita 384.68 373.23 458.87 483.63
GDP per capita growth 1.08 -0.60 4.22 1.06 1.54
Namibia GDP per capita 3,746.71 4,454.63 5,191.58 6,082.33
GDP per capita growth 0.71 3.52 3.11 3.22 3.28
Swaziland GDP per capita 2,953.23 3,411.67 3,690.24 4,073.21
GDP per capita growth 0.82 2.93 1.58 1.99 2.17
South Africa GDP per capita 5,946.81 6,768.56 7,362.76 7,605.40
GDP per capita growth 1.15 2.62 1.70 0.65 1.65
Seychelles GDP per capita 9,790.27 9,450.28 10,804.68 13,542.23
GDP per capita growth 4.10 -0.70 2.71 4.62 2.19
GDP per capita: constant 2010 USD GDP per capita growth: annual % Source: World development Indicator, World Bank
2.3 Policy on Sanitation in Zimbabwe
2.3.1 National Plan
2.3.1.1 I-PRSP, 2016
The latest national plan in Zimbabwe is the Zimbabwe Interim Poverty Reduction Strategy Paper (I-PRSP) 2016-2018 issued in September, 2016. The plan established seven pillars, in which water and sanitation are stipulated in Pillar II, Social Sectors.
In Chapter 2 titled Poverty Diagnostics, Inequality and Sectoral Performance Defining Poverty, the worsening condition of the Safe Water and Sanitation sector is described as follows:
158. Nationally, 76.6 percent of the households had access to safe drinking water31 in 2011/12. Access to safe water decreases with poverty, and this pattern is true in both rural and urban areas32.
159. Despite significant efforts to develop rural water, sanitation and hygiene (WASH) sector infrastructure, the imbalance between urban and rural services remains a distinctive feature of the sector.
160. The situation with regards to access to safe sanitation is worse than that of access to safe drinking water in both rural and urban areas. Nationally, 55.9 percent of the households have access to safe sanitation33, in 2011/12.
161. Access to safe sanitation decreases with poverty, and this pattern is true in both rural and urban areas34.
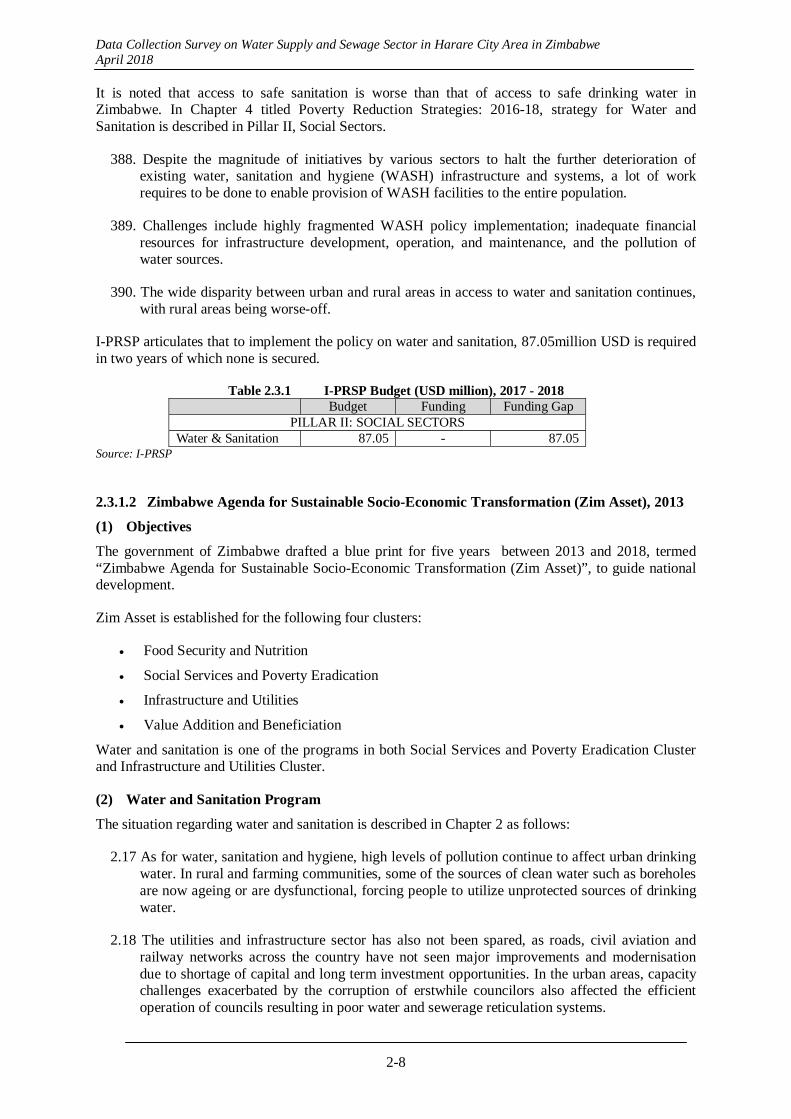
Data Collection Survey on Water Supply and Sewage Sector in Harare City Area in Zimbabwe April 2018
2-8
It is noted that access to safe sanitation is worse than that of access to safe drinking water in Zimbabwe. In Chapter 4 titled Poverty Reduction Strategies: 2016-18, strategy for Water and Sanitation is described in Pillar II, Social Sectors.
388. Despite the magnitude of initiatives by various sectors to halt the further deterioration of existing water, sanitation and hygiene (WASH) infrastructure and systems, a lot of work requires to be done to enable provision of WASH facilities to the entire population.
389. Challenges include highly fragmented WASH policy implementation; inadequate financial resources for infrastructure development, operation, and maintenance, and the pollution of water sources.
390. The wide disparity between urban and rural areas in access to water and sanitation continues, with rural areas being worse-off.
I-PRSP articulates that to implement the policy on water and sanitation, 87.05million USD is required in two years of which none is secured.
Table 2.3.1 I-PRSP Budget (USD million), 2017 - 2018 Budget Funding Funding Gap
PILLAR II: SOCIAL SECTORSWater & Sanitation 87.05 - 87.05
Source: I-PRSP
2.3.1.2 Zimbabwe Agenda for Sustainable Socio-Economic Transformation (Zim Asset), 2013
(1) Objectives
The government of Zimbabwe drafted a blue print for five years between 2013 and 2018, termed “Zimbabwe Agenda for Sustainable Socio-Economic Transformation (Zim Asset)”, to guide national development.
Zim Asset is established for the following four clusters:
Food Security and Nutrition
Social Services and Poverty Eradication
Infrastructure and Utilities
Value Addition and Beneficiation
Water and sanitation is one of the programs in both Social Services and Poverty Eradication Cluster and Infrastructure and Utilities Cluster.
(2) Water and Sanitation Program
The situation regarding water and sanitation is described in Chapter 2 as follows:
2.17 As for water, sanitation and hygiene, high levels of pollution continue to affect urban drinking water. In rural and farming communities, some of the sources of clean water such as boreholes are now ageing or are dysfunctional, forcing people to utilize unprotected sources of drinking water.
2.18 The utilities and infrastructure sector has also not been spared, as roads, civil aviation and railway networks across the country have not seen major improvements and modernisation due to shortage of capital and long term investment opportunities. In the urban areas, capacity challenges exacerbated by the corruption of erstwhile councilors also affected the efficient operation of councils resulting in poor water and sewerage reticulation systems.
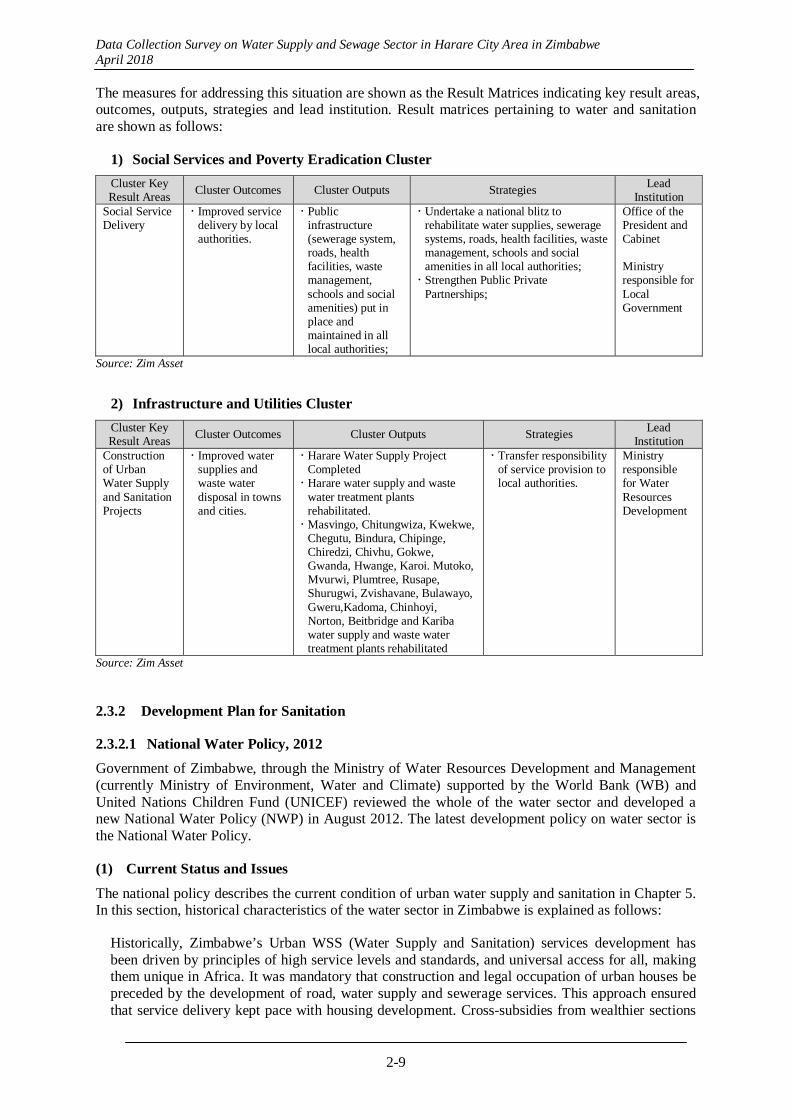
Data Collection Survey on Water Supply and Sewage Sector in Harare City Area in Zimbabwe April 2018
2-9
The measures for addressing this situation are shown as the Result Matrices indicating key result areas, outcomes, outputs, strategies and lead institution. Result matrices pertaining to water and sanitation are shown as follows:
1) Social Services and Poverty Eradication Cluster
Cluster Key Result Areas
Cluster Outcomes Cluster Outputs Strategies Lead Institution
Social Service Delivery
Improved service delivery by local authorities.
Public infrastructure (sewerage system, roads, health facilities, waste management, schools and social amenities) put in place and maintained in all local authorities;
Undertake a national blitz to rehabilitate water supplies, sewerage systems, roads, health facilities, waste management, schools and social amenities in all local authorities; Strengthen Public Private
Partnerships;
Office of the President and Cabinet Ministry responsible forLocal Government
Source: Zim Asset
2) Infrastructure and Utilities Cluster
Cluster Key Result Areas
Cluster Outcomes Cluster Outputs Strategies Lead Institution
Construction of Urban Water Supply and Sanitation Projects
Improved water supplies and waste water disposal in towns and cities.
Harare Water Supply Project Completed Harare water supply and waste
water treatment plants rehabilitated. Masvingo, Chitungwiza, Kwekwe,
Chegutu, Bindura, Chipinge, Chiredzi, Chivhu, Gokwe, Gwanda, Hwange, Karoi. Mutoko, Mvurwi, Plumtree, Rusape, Shurugwi, Zvishavane, Bulawayo, Gweru,Kadoma, Chinhoyi, Norton, Beitbridge and Kariba water supply and waste water treatment plants rehabilitated
Transfer responsibility of service provision to local authorities.
Ministry responsible for Water Resources Development
Source: Zim Asset
2.3.2 Development Plan for Sanitation
2.3.2.1 National Water Policy, 2012
Government of Zimbabwe, through the Ministry of Water Resources Development and Management (currently Ministry of Environment, Water and Climate) supported by the World Bank (WB) and United Nations Children Fund (UNICEF) reviewed the whole of the water sector and developed a new National Water Policy (NWP) in August 2012. The latest development policy on water sector is the National Water Policy.
(1) Current Status and Issues
The national policy describes the current condition of urban water supply and sanitation in Chapter 5. In this section, historical characteristics of the water sector in Zimbabwe is explained as follows:
Historically, Zimbabwe’s Urban WSS (Water Supply and Sanitation) services development has been driven by principles of high service levels and standards, and universal access for all, making them unique in Africa. It was mandatory that construction and legal occupation of urban houses be preceded by the development of road, water supply and sewerage services. This approach ensured that service delivery kept pace with housing development. Cross-subsidies from wealthier sections
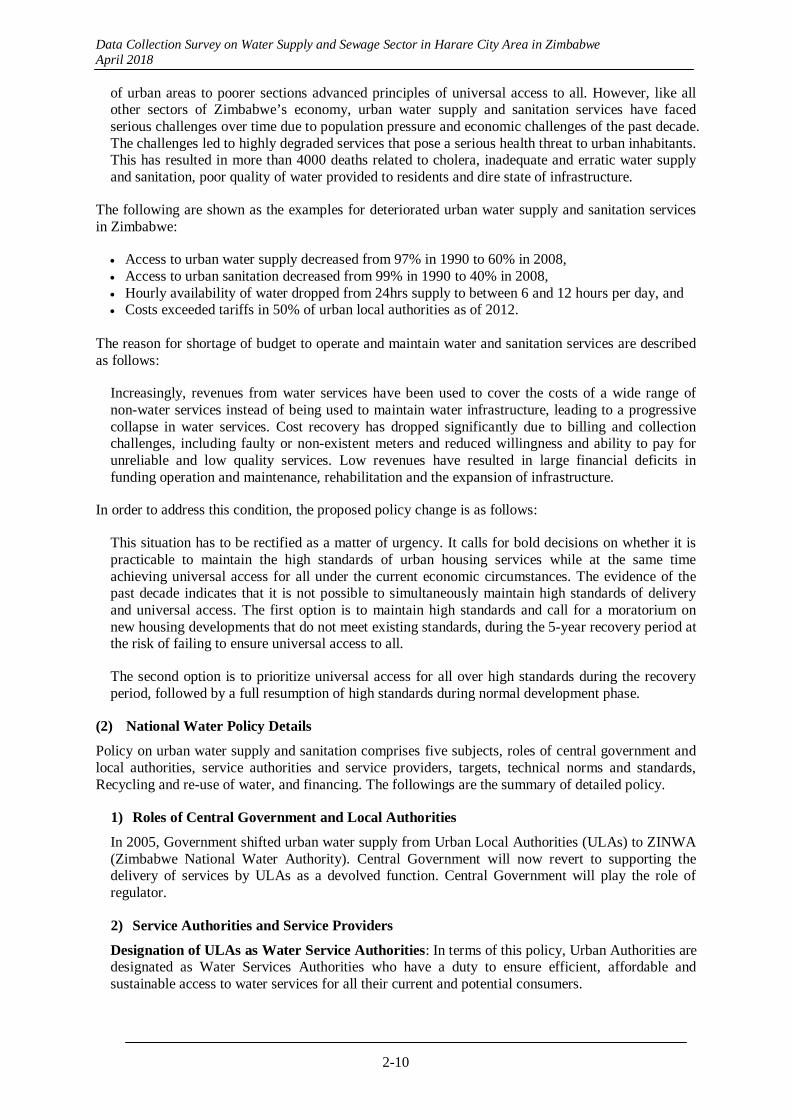
Data Collection Survey on Water Supply and Sewage Sector in Harare City Area in Zimbabwe April 2018
2-10
of urban areas to poorer sections advanced principles of universal access to all. However, like all other sectors of Zimbabwe’s economy, urban water supply and sanitation services have faced serious challenges over time due to population pressure and economic challenges of the past decade. The challenges led to highly degraded services that pose a serious health threat to urban inhabitants. This has resulted in more than 4000 deaths related to cholera, inadequate and erratic water supply and sanitation, poor quality of water provided to residents and dire state of infrastructure.
The following are shown as the examples for deteriorated urban water supply and sanitation services in Zimbabwe:
Access to urban water supply decreased from 97% in 1990 to 60% in 2008, Access to urban sanitation decreased from 99% in 1990 to 40% in 2008, Hourly availability of water dropped from 24hrs supply to between 6 and 12 hours per day, and Costs exceeded tariffs in 50% of urban local authorities as of 2012.
The reason for shortage of budget to operate and maintain water and sanitation services are described as follows:
Increasingly, revenues from water services have been used to cover the costs of a wide range of non-water services instead of being used to maintain water infrastructure, leading to a progressive collapse in water services. Cost recovery has dropped significantly due to billing and collection challenges, including faulty or non-existent meters and reduced willingness and ability to pay for unreliable and low quality services. Low revenues have resulted in large financial deficits in funding operation and maintenance, rehabilitation and the expansion of infrastructure.
In order to address this condition, the proposed policy change is as follows:
This situation has to be rectified as a matter of urgency. It calls for bold decisions on whether it is practicable to maintain the high standards of urban housing services while at the same time achieving universal access for all under the current economic circumstances. The evidence of the past decade indicates that it is not possible to simultaneously maintain high standards of delivery and universal access. The first option is to maintain high standards and call for a moratorium on new housing developments that do not meet existing standards, during the 5-year recovery period at the risk of failing to ensure universal access to all.
The second option is to prioritize universal access for all over high standards during the recovery period, followed by a full resumption of high standards during normal development phase.
(2) National Water Policy Details
Policy on urban water supply and sanitation comprises five subjects, roles of central government and local authorities, service authorities and service providers, targets, technical norms and standards, Recycling and re-use of water, and financing. The followings are the summary of detailed policy.
1) Roles of Central Government and Local Authorities
In 2005, Government shifted urban water supply from Urban Local Authorities (ULAs) to ZINWA (Zimbabwe National Water Authority). Central Government will now revert to supporting the delivery of services by ULAs as a devolved function. Central Government will play the role of regulator.
2) Service Authorities and Service Providers
Designation of ULAs as Water Service Authorities: In terms of this policy, Urban Authorities are designated as Water Services Authorities who have a duty to ensure efficient, affordable and sustainable access to water services for all their current and potential consumers.
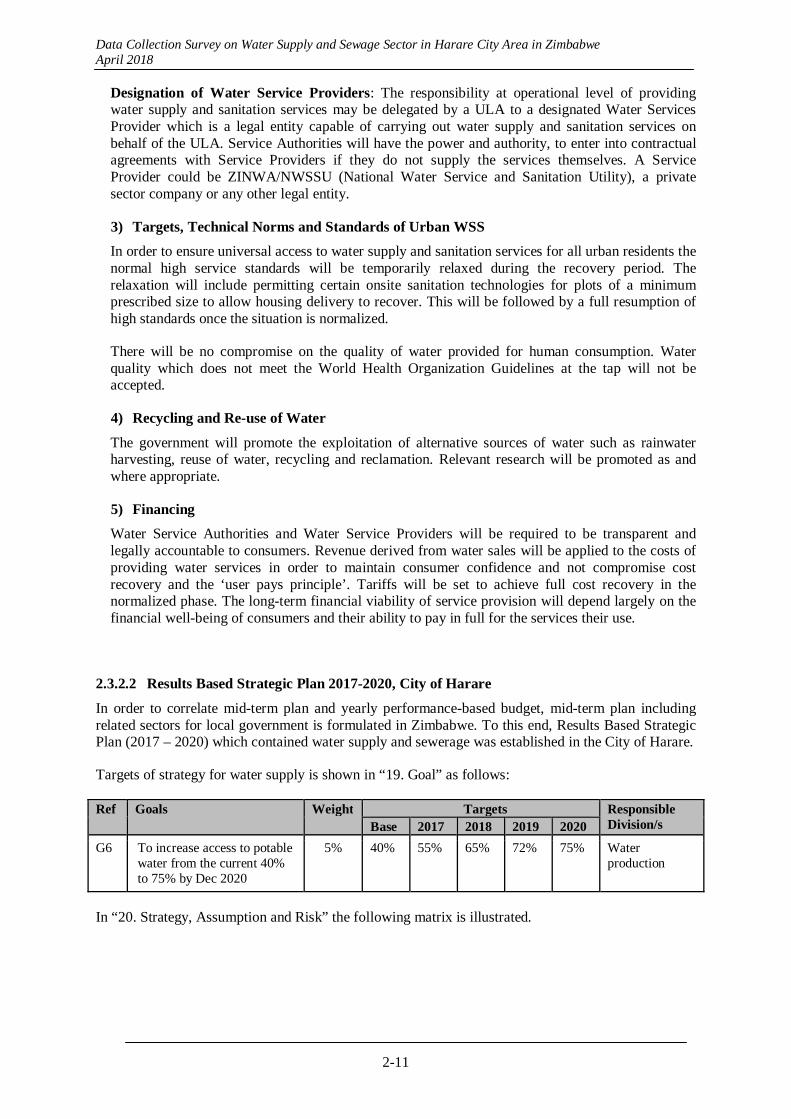
Data Collection Survey on Water Supply and Sewage Sector in Harare City Area in Zimbabwe April 2018
2-11
Designation of Water Service Providers: The responsibility at operational level of providing water supply and sanitation services may be delegated by a ULA to a designated Water Services Provider which is a legal entity capable of carrying out water supply and sanitation services on behalf of the ULA. Service Authorities will have the power and authority, to enter into contractual agreements with Service Providers if they do not supply the services themselves. A Service Provider could be ZINWA/NWSSU (National Water Service and Sanitation Utility), a private sector company or any other legal entity.
3) Targets, Technical Norms and Standards of Urban WSS
In order to ensure universal access to water supply and sanitation services for all urban residents the normal high service standards will be temporarily relaxed during the recovery period. The relaxation will include permitting certain onsite sanitation technologies for plots of a minimum prescribed size to allow housing delivery to recover. This will be followed by a full resumption of high standards once the situation is normalized.
There will be no compromise on the quality of water provided for human consumption. Water quality which does not meet the World Health Organization Guidelines at the tap will not be accepted.
4) Recycling and Re-use of Water
The government will promote the exploitation of alternative sources of water such as rainwater harvesting, reuse of water, recycling and reclamation. Relevant research will be promoted as and where appropriate.
5) Financing
Water Service Authorities and Water Service Providers will be required to be transparent and legally accountable to consumers. Revenue derived from water sales will be applied to the costs of providing water services in order to maintain consumer confidence and not compromise cost recovery and the ‘user pays principle’. Tariffs will be set to achieve full cost recovery in the normalized phase. The long-term financial viability of service provision will depend largely on the financial well-being of consumers and their ability to pay in full for the services their use.
2.3.2.2 Results Based Strategic Plan 2017-2020, City of Harare
In order to correlate mid-term plan and yearly performance-based budget, mid-term plan including related sectors for local government is formulated in Zimbabwe. To this end, Results Based Strategic Plan (2017 – 2020) which contained water supply and sewerage was established in the City of Harare.
Targets of strategy for water supply is shown in “19. Goal” as follows:
Ref Goals Weight Targets Responsible Division/s Base 2017 2018 2019 2020
G6 To increase access to potable water from the current 40% to 75% by Dec 2020
5% 40% 55% 65% 72% 75% Water production
In “20. Strategy, Assumption and Risk” the following matrix is illustrated.

Data Collection Survey on Water Supply and Sewage Sector in Harare City Area in Zimbabwe April 2018
2-12
Period Strategies Assumptions Risks Key Result Area 1: SERVICE DELIVERY Goal 6 : To increase access to potable water from the current 40% to 75% by Dec 2020 Objectives:
1. To increase water production from the current 400ML/day to 580 ML/day by December 2017 2. To reduce non-revenue water from the current 61% to 48% by December 2017 Budget Year (2017)
3. Optimize water production systems (complete plant rehabilitation works- treatment units, pumping plant and equipment)
4. Develop and implement a rehabilitation plan
5. Adequate raw water available.
6. Plant and infrastructure available.
7. Resources available (financial, human, skills)
8. Availability of partners
9. Climate change and variability.
10. Obsolete plant and equipment.
11. Shortage of resources (financial, skills).
12. Polluted raw water sources.
13. Contractors non performance
14. Optimise water transmission and distribution systems (study of water distribution network, replacement of aged pipes, pressure management and network zoning).
15. Develop a water distribution plan
16. Universal metering
17. Willing and capable partners available.
18. Captive market available – high and increasing demand for services.
19. Industry and commerce aware of sustainable environmental management.
20. Plant and equipment availability
21. Stakeholder cooperation
22. Unplanned settlements in water source catchments.
23. Illegal connections and water thefts.
24. Absence of research and development.
25. Technology deficit. 26. Resistant stakeholders
27. Implementation water conservation programmes (water conservation campaigns, installation of flow limiters)
28. Water conservation policies and programs in place.
29. Non cooperating stakeholders.
30. Engagement of stakeholders
31. Willing stakeholders. 32. stakeholders priorities
33. Engage development partners (PPPs – funding)
34. Update customer base 35. Project investment plan
for new water sources and infrastructure
36. Develop and implement a water supply infrastructure augmentation plan
37. Update of new developments
38. Enabling policies and environment.
39. Functional industry and commerce.
40. Technology available. 41. Economy performing
well. 42. Customers willing to pay. 43. Updated customer base 44. New water source
available 45. Stable currency
46. Inconsistent and unfavourable policies.
47. Bureaucracy. 48. Company closures 49. Customer resistance 50. Exorbitant costs 51. Non performing
contractors
52. Develop and implement a regulatory framework for water.
53. Policies available 54. Inconsistent policies
55. 100% metering (metering state study, assessment, prepaid meters, pilot conventional meters, smart prepaid metering project.
56. Customers willing to pay. 57. Technology available 58. Funding available
59. Contractors’ non-performance.
60. Industry and commerce polluting.
customer priorities
61. funding shortages 2018 -2020 62. Optimize water
production systems 63. Raw water available. 64. Plant and infrastructure
available. 65. Resources available
(financial, human, skills)
66. Climate change and variability.
67. Obsolete plant and equipment.
68. Resource procurement challenges
69. Polluted raw water sources.
70. Optimize water 71. Willing and capable 74. Unplanned settlements in

Data Collection Survey on Water Supply and Sewage Sector in Harare City Area in Zimbabwe April 2018
2-13
transmission and distribution systems (replacement of aged pipes, pressure, management and network zoning, active leak detection)
partners available. 72. Captive market available
– high and increasing demand for services.
73. Industry and commerce aware of sustainable environmental management.
water source catchments. 75. Illegal connections and
water thefts. 76. Absence of research and
development. 77. Technology deficit.
78. Implement water conservation programmes
79. Water conservation policies and programs in place.
80. Non cooperating stakeholders.
81. Reduction of non-revenue
water 82. Willing stakeholders. 83. Unwilling stakeholders
2.3.3 Laws Relating to Sanitation and Hygiene in Zimbabwe
There are 16 laws pertinent to sanitation and hygiene in Zimbabwe as follows:
1. Constitution of Zimbabwe (2013) 2. The Water Act (Chapter 20:24) 3. The Rural District Councils Act (Chapter 29:13) 4. The Communal Lands Act (Chapter 20:04) 5. The Public Health Act (Chapter 15:09). 6. The Provincial Councils and Administration Act (Chapter 29:11). 7. The Environmental Management Act (Chapter 20:27). 8. Urban Councils Act (Chapter 29:15). 9. The Regional, Town and Country Planning Acts (Chapter 29:12). 10. The Traditional Leaders Act (Chapter29:17). 11. The Zimbabwe National Water Authority Act (Chapter 20:25) 12. The Housing Standards Control Act (Chapter 29:08) 13. The Housing and Building Act (Chapter 29:07) 14. Older Persons Act (Chapter 17:11) 15. Disabled Persons Act (Chapter 17:01) 16. Civil Protection Act (Chapter 10:06) Among these laws, The Water Act, The Environmental Management Act and the Zimbabwe National Water Authority Act are essential for water administration.
The Water Act Objectives To provide for the development and utilisation of the water resources of Zimbabwe To provide for the establishment, powers and procedures of catchment councils and
subcatchment councils To provide for the grant of permits for the use of water To provide for the control of the use of water when water is in short supply To provide for the acquisition of servitudes in respect of water To provide for the protection of the environment and the prevention and control of water
pollution To provide for the approval of combined water schemes To provide for matters relating to dam works Contents Part I: Preliminary Part II: Water resources planning and development Part III: Establishment, functions and procedures of catchment councils Part IV: Use of Water Part V: Water shortage areas Part VI: Water quality control and environment protection

Data Collection Survey on Water Supply and Sewage Sector in Harare City Area in Zimbabwe April 2018
2-14
Part VII: Servitude in respect of waterPart VIII: Combined water schemes Part IX: Safety of dams Part X: Appeals Part XI: General Part XII: Repeals and savings The Environmental Management Act Objectives To provide for the sustainable management of natural resources and protection of the
environment The prevention of pollution and environmental degradation The preparation of a National Environmental Plan and other plans for the management and
protection of the environment The establishment of an Environmental Management Agency and an Environment Fund To amend references to intensive conservation areas and committees and associated matters in
various Acts Contents Part I: Preliminary Part II: Principles of environmental management and functions of minister Part III: National environmental council Part IV: Environmental management agency Part V: Environmental management board Part VI: Staff of agency Part VII: Financial provisions relating to agency Part VIII: Environment fund Part IX: Environment quality standards Part X: Environmental plans Part XI: Environmental impact assessments audit and monitoring of projects Part XII: Conservation and improvement of environment Part XIII: Control of invasive alien species Part XIV: Appeals Part XV: International obligations and commitments Part XVI: General Zimbabwe National Water Authority ActObjectives To establish the Zimbabwe National Water Authority and to provide for its functions To provide for the appointment and functions of a board of the Authority To provide for the raising of charges for the provision of water and other services by the
Authority To provide for the funds of the Authority To provide for the imposition and collection of a water levy Contents Part I: Preliminary Part II: Zimbabwe National Water Authority Part III: Issue of shares and securities by authority Part IV: Financial provisions relating to authority Part V: Water fund Part VI: General

Data Collection Survey on Water Supply and Sewage Sector in Harare City Area in Zimbabwe April 2018
2-15
2.3.4 Activity of Donors and International Organization in the Sanitation Sector
2.3.4.1 African Development Bank (AfDB)
Assistance to Zimbabwe by AfDB is through African Water Facility (AWF) and Zimbabwe Multi-Donor Trust Fund (Zim-Fund). Table 2.3.2 shows the progress of assistance to Zimbabwe by AfDB.
Table 2.3.2 Progress of Assistance to Zimbabwe by AfDB Progress
Jan. 2010 Agreement for Emergency Rehabilitation of Water Supply and Sewage System in Chitungwiza between AWF and Government of Zimbabwe including Chitungwiza
May. 2010 Establishment of Zim-FundApr. 2011 Approval by Zim-Fund for first stage of Urgent Water Supply and Sanitation
Rehabilitation Project (UWSSRP) Jan. 2013 Completion of Emergency Rehabilitation of Water Supply and Sewage System in
Chitungwiza Sept. 2018 Scheduled completion of Urgent Water Supply and Sanitation Rehabilitation Project
(UWSSRP) Source: JST based on the documents by AfDB Remark: * Additional Financing Grant Proposal, Sept. 2015, AfDB
(1) Emergency Rehabilitation of Water Supply and Sewage System in Chitungwiza
1) African Water Facility (AWF)
The African Water Facility (AWF) is a multilateral fund that provides grants and technical assistance to enable governments, NGOs and private-public partnerships to secure investments and implement sustainable water projects throughout Africa.
Hosted by the AfDB, the AWF was created in May 2004 by the African Ministers’ Council on Water (AMCOW) in response to the need to catalyse the development of the water sector, by increasing the number and the quality of sustainable water projects to meet water development goals throughout the continent.
A proposal from the Chitungwiza Municipality was submitted to the African Water Facility (AWF) to support its ailing water and sanitation systems. The AWF responded with a mission in May 2008 to follow up these proposals and to prepare and appraise a suitable project for AWF financing. Agreement was reached between AWF and the Zimbabwean authorities in Feb. 2010.
2) Purpose
The project was aimed at:
(a) Stabilising the deterioration in the provision of water and sanitation services in the Municipality of Chitungwiza and
(b) Enhancing institutional capacity for efficient and sustainable operation and management of the water supply and sanitation services.
3) Developed Facilities by the Project
The project consisted of the following components:
1. Pump Station No 1 2. Pump Station No 2: 3. Pump Station No 3 4. Trunk Sewers (sewers 2,6,7,8,9,10,11,12,13 and 14) 5. Water Pipes, Valves, Fittings, Meters 6. Boreholes 7. Equipment Supply
Data Collection Survey on Water Supply and Sewage Sector in Harare City Area in Zimbabwe April 2018
2-16
(2) Zimbabwe Multi-Donor Trust Fund (Zim-Fund) and Urgent Water Supply and Sanitation Rehabilitation Project (UWSSRP)
1) Zim-Fund
The African Development Bank was requested by a group of donors to establish and administer the (the “Zim-Fund”). The Bank was designated administrator of the Zim-Fund, with the endorsement of the Government and the Donor Community. The Zim-Fund was established on 31st May 2010. Negotiations between the Bank and Donors on the modalities to establish the Fund were concluded in July 2010.
2) Purpose
The purpose of the Zim-Fund is to contribute to early recovery and development efforts in Zimbabwe by mobilizing donor resources and promoting donor coordination in Zimbabwe. The current duration of the Zim-Fund is five years, over the period 2010-2015.
The thematic scope of the Zim-Fund will focus initially on infrastructure investments (rehabilitation and/or construction works) in the areas of water & sanitation and energy. Critical to the achievement of these goals are the following:
(i) Financial and technical support to activities that are consistent with the recovery priorities of the Government.
(ii) Mobilization of pooled donor resources based on a common understanding of the country’s recovery needs and linked to effective coordination and complementarity with other related activities funded outside the trust fund and.
(iii) Efficient monitoring and evaluation of outputs and impact. In line with the evolving Government needs, the scope can be reviewed and adjusted by the Project Oversight Committee (POC).
3) Urgent Water Supply and Sanitation Rehabilitation Project (UWSSRP)
The first phase of the Urgent Water Supply and Sanitation Rehabilitation Project (UWSSR, US$ 29.651 million) was approved to support urgent rehabilitation works - restoration and stabilization of water supply and sanitation services in the Municipalities of Harare, Chitungwiza, Mutare, Chegutu, Masvingo and Kwekwe, targeting a total population of approximately 4.15 million people.
A second phase of this Project was formulated to further the benefits and impacts of the first phase of the Project and include aspects not included in the first phase of the Project. The proposed second phase Project will be implemented in Harare, Chitungwiza, Ruwa and Redcliff serving an estimated population of 1.9 million. The total Project cost is estimated at USD 35.99 million to be financed by Zim-Fund in two stages. The first stage (US$ 19.84 million) will focus on Harare and preparatory activities for the three other towns.
The project consists of the following four components:
Component 1 - Water Supply and Sewerage: Water supply f pump stations and equipment, rehabilitation of bulk water and domestic metering, repair and replacement of distribution systems, water supplies for vulnerable communities, and operation and maintenance equipment.
Sewage pumping stations and equipment (Harare, Chitungwiza, Ruwa and Redcliff), rehabilitation of outfall and trunk sewers (Harare, Chitungwiza, Ruwa), rehabilitation/replacement of sewer lines (Harare, Chitungwiza, Ruwa and Redcliff), and operation and maintenance equipment.
Component 2 - Hygiene Promotion: This component will address the specific hygiene needs of vulnerable communities most affected by poor water and sanitation services.
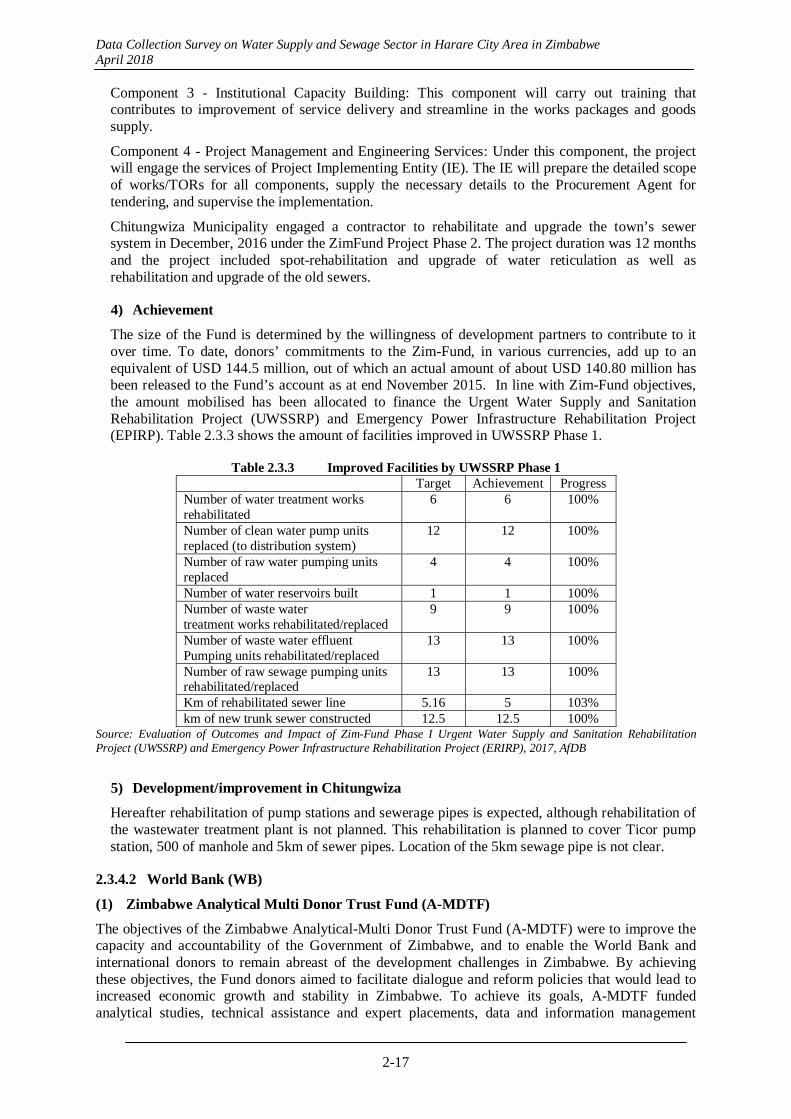
Data Collection Survey on Water Supply and Sewage Sector in Harare City Area in Zimbabwe April 2018
2-17
Component 3 - Institutional Capacity Building: This component will carry out training that contributes to improvement of service delivery and streamline in the works packages and goods supply.
Component 4 - Project Management and Engineering Services: Under this component, the project will engage the services of Project Implementing Entity (IE). The IE will prepare the detailed scope of works/TORs for all components, supply the necessary details to the Procurement Agent for tendering, and supervise the implementation.
Chitungwiza Municipality engaged a contractor to rehabilitate and upgrade the town’s sewer system in December, 2016 under the ZimFund Project Phase 2. The project duration was 12 months and the project included spot-rehabilitation and upgrade of water reticulation as well as rehabilitation and upgrade of the old sewers.
4) Achievement
The size of the Fund is determined by the willingness of development partners to contribute to it over time. To date, donors’ commitments to the Zim-Fund, in various currencies, add up to an equivalent of USD 144.5 million, out of which an actual amount of about USD 140.80 million has been released to the Fund’s account as at end November 2015. In line with Zim-Fund objectives, the amount mobilised has been allocated to finance the Urgent Water Supply and Sanitation Rehabilitation Project (UWSSRP) and Emergency Power Infrastructure Rehabilitation Project (EPIRP). Table 2.3.3 shows the amount of facilities improved in UWSSRP Phase 1.
Table 2.3.3 Improved Facilities by UWSSRP Phase 1 Target Achievement Progress Number of water treatment works rehabilitated
6 6 100%
Number of clean water pump units replaced (to distribution system)
12 12 100%
Number of raw water pumping units replaced
4 4 100%
Number of water reservoirs built 1 1 100% Number of waste water treatment works rehabilitated/replaced
9 9 100%
Number of waste water effluentPumping units rehabilitated/replaced
13 13 100%
Number of raw sewage pumping units rehabilitated/replaced
13 13 100%
Km of rehabilitated sewer line 5.16 5 103% km of new trunk sewer constructed 12.5 12.5 100%
Source: Evaluation of Outcomes and Impact of Zim-Fund Phase I Urgent Water Supply and Sanitation Rehabilitation Project (UWSSRP) and Emergency Power Infrastructure Rehabilitation Project (ERIRP), 2017, AfDB
5) Development/improvement in Chitungwiza
Hereafter rehabilitation of pump stations and sewerage pipes is expected, although rehabilitation of the wastewater treatment plant is not planned. This rehabilitation is planned to cover Ticor pump station, 500 of manhole and 5km of sewer pipes. Location of the 5km sewage pipe is not clear.
2.3.4.2 World Bank (WB)
(1) Zimbabwe Analytical Multi Donor Trust Fund (A-MDTF)
The objectives of the Zimbabwe Analytical-Multi Donor Trust Fund (A-MDTF) were to improve the capacity and accountability of the Government of Zimbabwe, and to enable the World Bank and international donors to remain abreast of the development challenges in Zimbabwe. By achieving these objectives, the Fund donors aimed to facilitate dialogue and reform policies that would lead to increased economic growth and stability in Zimbabwe. To achieve its goals, A-MDTF funded analytical studies, technical assistance and expert placements, data and information management
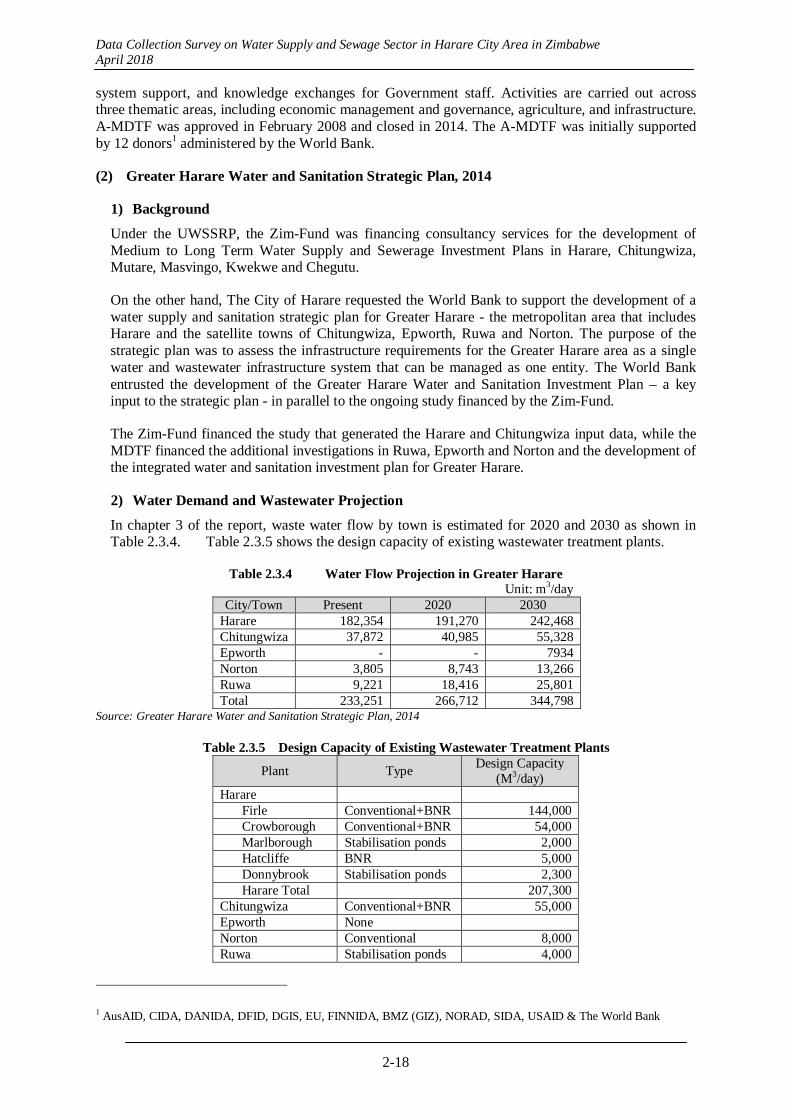
Data Collection Survey on Water Supply and Sewage Sector in Harare City Area in Zimbabwe April 2018
2-18
system support, and knowledge exchanges for Government staff. Activities are carried out across three thematic areas, including economic management and governance, agriculture, and infrastructure. A-MDTF was approved in February 2008 and closed in 2014. The A-MDTF was initially supported by 12 donors1 administered by the World Bank.
(2) Greater Harare Water and Sanitation Strategic Plan, 2014
1) Background
Under the UWSSRP, the Zim-Fund was financing consultancy services for the development of Medium to Long Term Water Supply and Sewerage Investment Plans in Harare, Chitungwiza, Mutare, Masvingo, Kwekwe and Chegutu.
On the other hand, The City of Harare requested the World Bank to support the development of a water supply and sanitation strategic plan for Greater Harare - the metropolitan area that includes Harare and the satellite towns of Chitungwiza, Epworth, Ruwa and Norton. The purpose of the strategic plan was to assess the infrastructure requirements for the Greater Harare area as a single water and wastewater infrastructure system that can be managed as one entity. The World Bank entrusted the development of the Greater Harare Water and Sanitation Investment Plan – a key input to the strategic plan - in parallel to the ongoing study financed by the Zim-Fund.
The Zim-Fund financed the study that generated the Harare and Chitungwiza input data, while the MDTF financed the additional investigations in Ruwa, Epworth and Norton and the development of the integrated water and sanitation investment plan for Greater Harare.
2) Water Demand and Wastewater Projection
In chapter 3 of the report, waste water flow by town is estimated for 2020 and 2030 as shown in Table 2.3.4. Table 2.3.5 shows the design capacity of existing wastewater treatment plants.
Table 2.3.4 Water Flow Projection in Greater Harare Unit: m3/day
City/Town Present 2020 2030Harare 182,354 191,270 242,468 Chitungwiza 37,872 40,985 55,328 Epworth - - 7934 Norton 3,805 8,743 13,266 Ruwa 9,221 18,416 25,801 Total 233,251 266,712 344,798
Source: Greater Harare Water and Sanitation Strategic Plan, 2014
Table 2.3.5 Design Capacity of Existing Wastewater Treatment Plants
Plant Type Design Capacity
(M3/day) Harare Firle Conventional+BNR 144,000 Crowborough Conventional+BNR 54,000 Marlborough Stabilisation ponds 2,000 Hatcliffe BNR 5,000 Donnybrook Stabilisation ponds 2,300 Harare Total 207,300 Chitungwiza Conventional+BNR 55,000 Epworth None Norton Conventional 8,000 Ruwa Stabilisation ponds 4,000
1 AusAID, CIDA, DANIDA, DFID, DGIS, EU, FINNIDA, BMZ (GIZ), NORAD, SIDA, USAID & The World Bank
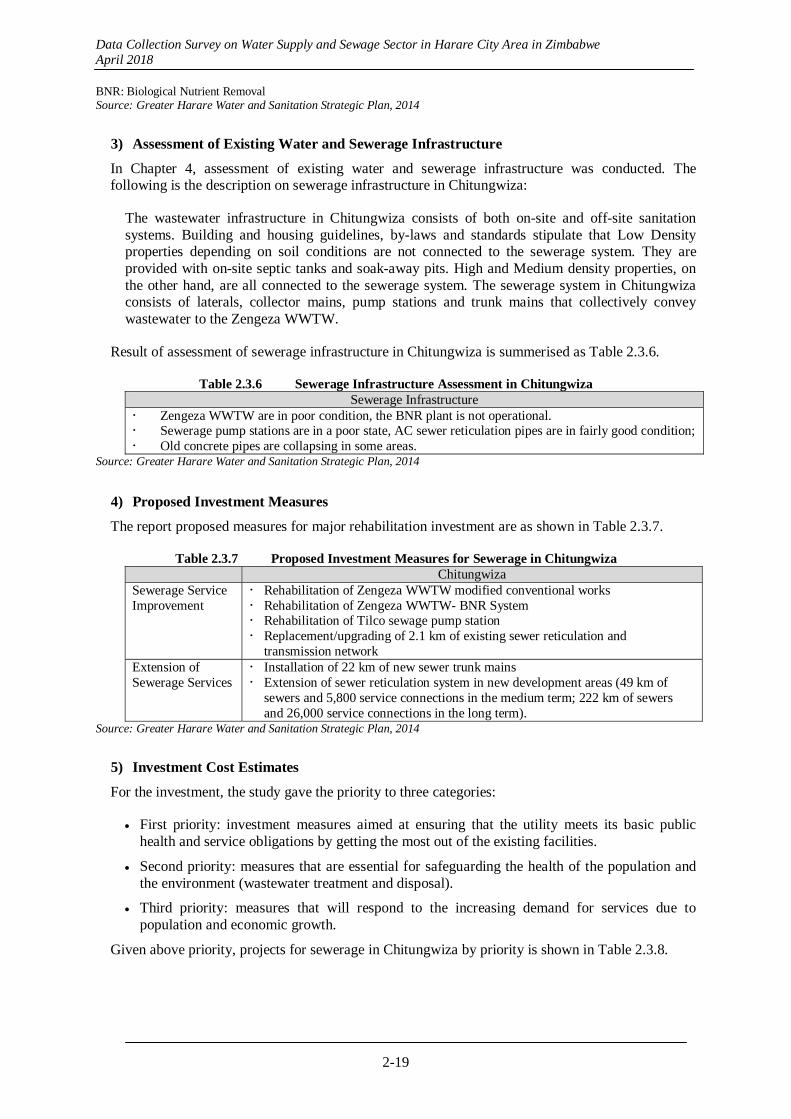
Data Collection Survey on Water Supply and Sewage Sector in Harare City Area in Zimbabwe April 2018
2-19
BNR: Biological Nutrient Removal Source: Greater Harare Water and Sanitation Strategic Plan, 2014
3) Assessment of Existing Water and Sewerage Infrastructure
In Chapter 4, assessment of existing water and sewerage infrastructure was conducted. The following is the description on sewerage infrastructure in Chitungwiza:
The wastewater infrastructure in Chitungwiza consists of both on-site and off-site sanitation systems. Building and housing guidelines, by-laws and standards stipulate that Low Density properties depending on soil conditions are not connected to the sewerage system. They are provided with on-site septic tanks and soak-away pits. High and Medium density properties, on the other hand, are all connected to the sewerage system. The sewerage system in Chitungwiza consists of laterals, collector mains, pump stations and trunk mains that collectively convey wastewater to the Zengeza WWTW.
Result of assessment of sewerage infrastructure in Chitungwiza is summerised as Table 2.3.6.
Table 2.3.6 Sewerage Infrastructure Assessment in Chitungwiza Sewerage Infrastructure
Zengeza WWTW are in poor condition, the BNR plant is not operational. Sewerage pump stations are in a poor state, AC sewer reticulation pipes are in fairly good condition; Old concrete pipes are collapsing in some areas.
Source: Greater Harare Water and Sanitation Strategic Plan, 2014
4) Proposed Investment Measures
The report proposed measures for major rehabilitation investment are as shown in Table 2.3.7.
Table 2.3.7 Proposed Investment Measures for Sewerage in Chitungwiza ChitungwizaSewerage Service Improvement
Rehabilitation of Zengeza WWTW modified conventional works Rehabilitation of Zengeza WWTW- BNR System Rehabilitation of Tilco sewage pump station Replacement/upgrading of 2.1 km of existing sewer reticulation and
transmission network Extension of Sewerage Services
Installation of 22 km of new sewer trunk mains Extension of sewer reticulation system in new development areas (49 km of
sewers and 5,800 service connections in the medium term; 222 km of sewers and 26,000 service connections in the long term).
Source: Greater Harare Water and Sanitation Strategic Plan, 2014
5) Investment Cost Estimates
For the investment, the study gave the priority to three categories:
First priority: investment measures aimed at ensuring that the utility meets its basic public health and service obligations by getting the most out of the existing facilities.
Second priority: measures that are essential for safeguarding the health of the population and the environment (wastewater treatment and disposal).
Third priority: measures that will respond to the increasing demand for services due to population and economic growth.
Given above priority, projects for sewerage in Chitungwiza by priority is shown in Table 2.3.8.
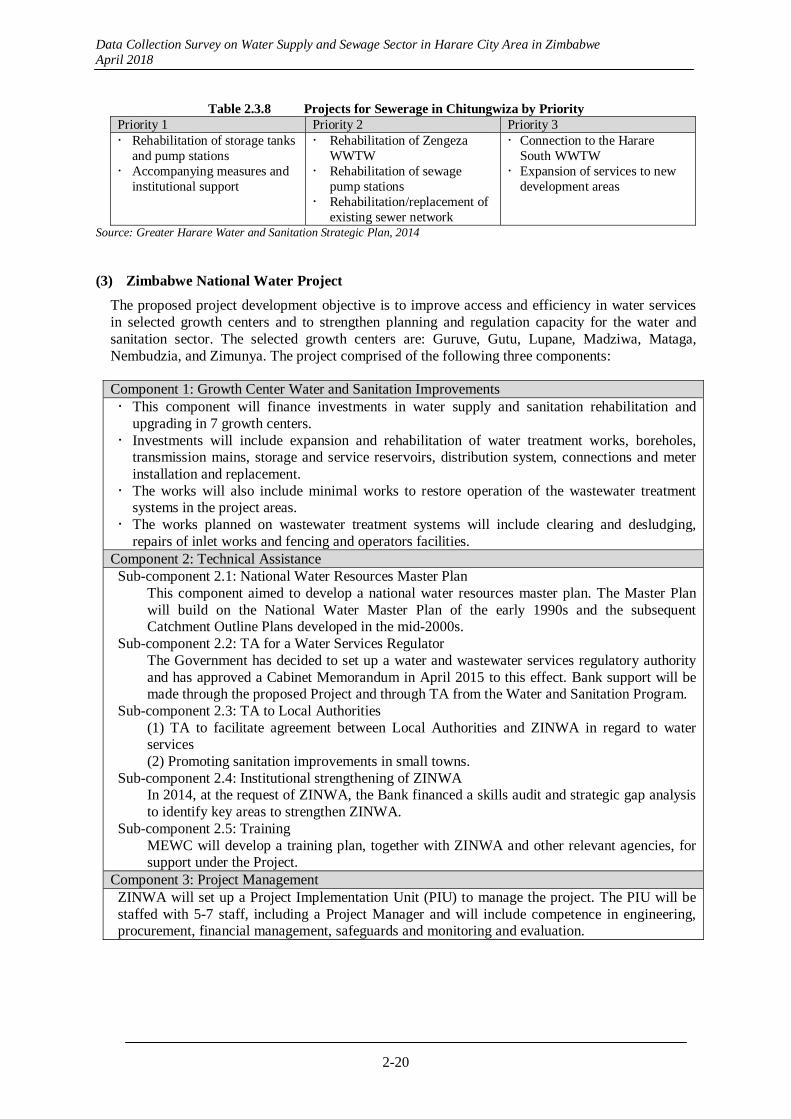
Data Collection Survey on Water Supply and Sewage Sector in Harare City Area in Zimbabwe April 2018
2-20
Table 2.3.8 Projects for Sewerage in Chitungwiza by Priority
Priority 1 Priority 2 Priority 3 Rehabilitation of storage tanks
and pump stations Accompanying measures and
institutional support
Rehabilitation of Zengeza WWTW
Rehabilitation of sewage pump stations
Rehabilitation/replacement of existing sewer network
Connection to the HarareSouth WWTW
Expansion of services to new development areas
Source: Greater Harare Water and Sanitation Strategic Plan, 2014
(3) Zimbabwe National Water Project
The proposed project development objective is to improve access and efficiency in water services in selected growth centers and to strengthen planning and regulation capacity for the water and sanitation sector. The selected growth centers are: Guruve, Gutu, Lupane, Madziwa, Mataga, Nembudzia, and Zimunya. The project comprised of the following three components:
Component 1: Growth Center Water and Sanitation Improvements This component will finance investments in water supply and sanitation rehabilitation and
upgrading in 7 growth centers. Investments will include expansion and rehabilitation of water treatment works, boreholes,
transmission mains, storage and service reservoirs, distribution system, connections and meter installation and replacement.
The works will also include minimal works to restore operation of the wastewater treatment systems in the project areas.
The works planned on wastewater treatment systems will include clearing and desludging, repairs of inlet works and fencing and operators facilities.
Component 2: Technical Assistance Sub-component 2.1: National Water Resources Master Plan
This component aimed to develop a national water resources master plan. The Master Plan will build on the National Water Master Plan of the early 1990s and the subsequent Catchment Outline Plans developed in the mid-2000s.
Sub-component 2.2: TA for a Water Services Regulator The Government has decided to set up a water and wastewater services regulatory authority and has approved a Cabinet Memorandum in April 2015 to this effect. Bank support will be made through the proposed Project and through TA from the Water and Sanitation Program.
Sub-component 2.3: TA to Local Authorities (1) TA to facilitate agreement between Local Authorities and ZINWA in regard to water services (2) Promoting sanitation improvements in small towns.
Sub-component 2.4: Institutional strengthening of ZINWA In 2014, at the request of ZINWA, the Bank financed a skills audit and strategic gap analysis to identify key areas to strengthen ZINWA.
Sub-component 2.5: Training MEWC will develop a training plan, together with ZINWA and other relevant agencies, for support under the Project.
Component 3: Project Management ZINWA will set up a Project Implementation Unit (PIU) to manage the project. The PIU will be staffed with 5-7 staff, including a Project Manager and will include competence in engineering, procurement, financial management, safeguards and monitoring and evaluation.
Data Collection Survey on Water Supply and Sewage Sector in Harare City Area in Zimbabwe April 2018
2-21
2.3.4.3 African Minister’s Council on Water (AMCOW)
The African Ministers' Council on Water (AMCOW) was formed in 2002 primarily to promote cooperation, security, social and economic development and poverty eradication among member states through the effective management of the continent’s water resources and provision of water supply services. Member states are 53 African countries.
AMCOW issued a document titled “Water Supply and Sanitation in Zimbabwe” in 2011 which analyzed current status of water sector in Zimbabwe. With regard to urban sanitation and hygiene sector, the document summarises the current status as follows:
The urban sanitation subsector in Zimbabwe once had one of the highest coverage levels in Africa, including for networked sewerage. The economic collapse has led to a severe decline in services, reflected in both data sets, though the government estimates of coverage present a far more rapid deterioration. Lack of water flow causes frequent sewer blockages. Densification means that many more households use the same infrastructure. Many wastewater treatment plants are now dysfunctional.
CSO2 (The second round of Country Status Overviews) estimates show a massive capital investment gap of US$273 million per year, relative to the US$325 million per year required to meet national targets, requiring a six-fold CAPEX (Capital Expenditure) increase to rehabilitate neglected services. Current anticipated CAPEX has fallen to US$51 million,
For the priority actions for urban sanitation and hygiene, the followings are proposed:
Alternatives to high-cost sewerage-only policy: A specific USH policy challenge facing Zimbabwe is whether it is realistic to have a goal of 100 percent sewerage coverage in urban areas. If not, policies on lower-cost approaches need to be considered. Lower-cost technologies would decrease investment costs for the local authority and the consumer, and provide services that are easier to manage, with less environmental risk when sewage treatment fails. In any case, the selection of wastewater treatment options should take sustainability and environmental impact more centrally into consideration. Also, at present some cities have by-laws prohibiting the construction of pit latrines in urban areas. Proposed policy changes would need consultation with consumers.
Financing strategy for urban sanitation: A review is needed of strategies to refinance the USH sector. Options such as specific sanitation levies or sale of wastewater for irrigation might be considered.
Enforcement of environmental and public health controls: Zimbabwe has the environmental and public health legislation in place to hold councils to account, although monitoring and enforcement is weak.
Specialist expertise: The USH sector has suffered from loss of skills. A specific capacity-building initiative is needed to attract back, or buy-in, the specialist engineering expertise needed to rehabilitate and manage sewerage and wastewater treatment facilities in Zimbabwe’s cities and towns.
2.4 Institution for sewerage sector in Zimbabwe
2.4.1 Progress of Decentralization in sewerage sector
1) Legal aspect
a) Constitution
First, the Constitution in 2013 has some descriptions about governmental decentralization. CHAPTER 14
Data Collection Survey on Water Supply and Sewage Sector in Harare City Area in Zimbabwe April 2018
2-22
PROVINCIAL AND LOCAL GOVERNMENT covers a specific content as below.
PREAMBLE
PART 1 PRELIMINARY
264. Devolution of governmental powers and responsibilities.
265. General principles of provincial and local government.
266. Conduct of employees of provincial and local governments.
PART 2 PROVINCES AND PROVINCIAL ANDMETROPOLITAN COUNCILS
267. Provinces and districts of Zimbabwe.
268. Provincial councils.
269. Metropolitan councils.
270. Functions of provincial and metropolitan councils.
271. Committees of provincial councils.
272. Chairpersons of provincial councils.
273. General provisions relating to provincial and metropolitan councils.
PART 3 LOCAL GOVERNMENT
274. Urban local authorities
275. Local authorities for rural areas.
276. Functions of local authorities.
277. Elections to local authorities.
278. Tenure of seats of members of local authorities.
279. Procedure of local authorities.
Article 276 especially is of high importance showing the role of the local government as this gives them permission to collect necessary fees to run the local authorities and the rights on power provision. The specific content is written as below.
276 Functions of local authorities
(1) Subject to this Constitution and any Act of Parliament, a local authority has the right to govern, on its own initiative, the local affairs of the people within the area for which it has been established, and has all the powers necessary for it to do so.
(2)An Act of Parliament may confer functions on local authorities, including—
(a) a power to make by-laws, regulations or rules for the effective administration of the areas for which they have been established;
(b) a power to levy rates and taxes and generally to raise sufficient revenue for them to carry out their objects and responsibilities.
In Part 2, Harare Metropolitan Province was established in Article 267 as the basic administrative unit for local administrative revenue management, and administrative services. Here, Provincial Councils, and the administrative management method based on the councils are clearly described. Chitungwiza Municipality would also be included in this state, and would be administered in accordance to this constitution. However, according to the interview with MoLG,
Data Collection Survey on Water Supply and Sewage Sector in Harare City Area in Zimbabwe April 2018
2-23
in practice, state-level management has not been implemented so far, and it was confirmed that Harare city, Chitungwiza Municipality is a unit of local administration.
Additionally, there are current preparations for a new law to switch some operations from the city to province management, and there is possibility that some operations may change from the city to the provincial administrative unit in the future.
b) Urban Councils Act (2008)
Details of contents and authority of residents' services in local governments mentioned in the Constitution are embodied in the Urban Council Act. In particular, the sewerage service is described in Chapter 12 and includes the following contents.
PART XII
SEWERAGE AND DRAINAGE
168. Powers of council in regard to sewerage and drainage.
169. Notice of work on public sewers or public drains.
170. Notice of construction of sewage works outside council area.
171. Objection to proposed sewage works.
172. Owners entitled to connect to public sewer.
173. Council may require connection to public sewer, provision of septic or conserving tank and treatment of trade effluent.
174. Construction, connection and extension of private sewers.
175. Combined private sewers.
176. Responsibility for septic or conserving tank, private sewer or combined private sewer.
177. Council may render services.
178. Council may finance water-borne sanitation and sanitary fittings.
179. Recovery of costs by instalments.
180. Protection of public sewers and public drains.
181. Control of public streams.
182. Saving of rights under contract or servitude.
2) Financial aspect
As mentioned above, the residents' services including the sewerage administration in Zimbabwe are decentralized by local governments under the Constitution. This is reflected in the financial aspect. According to the interview to MoLG, there are no grants, subsidies, etc. from the central government to the local government in the relationship between central and local finance. Therefore, local governments are required to operate with almost complete independent profit system including self-financing of financial resources. This could be confirmed by the fact that almost no financial transfer from the central government is written in the central government budget, and the financial statement of Chitungwiza Municipality as subsidies. The details of this is described in Chapter 3 of this report. Also, there is no prospect that this policy would change in future.
For these reasons, Chitungwiza Municipality needs to secure funding for sewage treatment plants, including facility renovation and maintenance. However, although capital budget may be
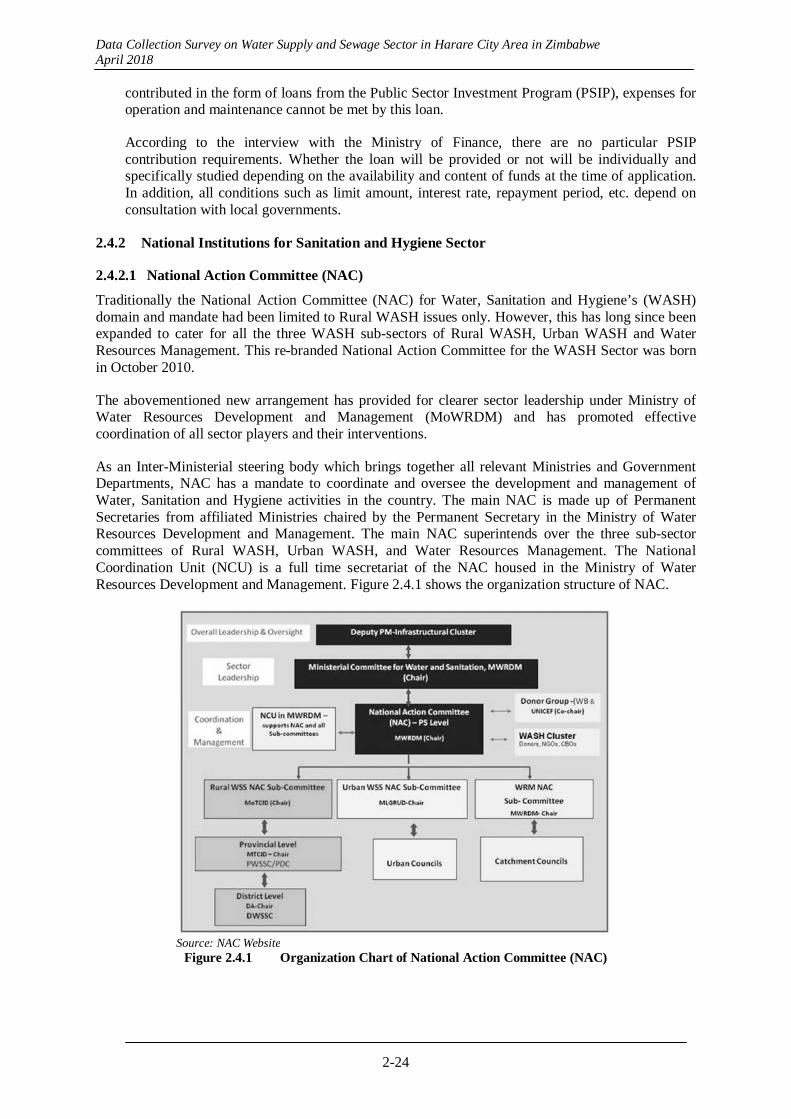
Data Collection Survey on Water Supply and Sewage Sector in Harare City Area in Zimbabwe April 2018
2-24
contributed in the form of loans from the Public Sector Investment Program (PSIP), expenses for operation and maintenance cannot be met by this loan.
According to the interview with the Ministry of Finance, there are no particular PSIP contribution requirements. Whether the loan will be provided or not will be individually and specifically studied depending on the availability and content of funds at the time of application. In addition, all conditions such as limit amount, interest rate, repayment period, etc. depend on consultation with local governments.
2.4.2 National Institutions for Sanitation and Hygiene Sector
2.4.2.1 National Action Committee (NAC)
Traditionally the National Action Committee (NAC) for Water, Sanitation and Hygiene’s (WASH) domain and mandate had been limited to Rural WASH issues only. However, this has long since been expanded to cater for all the three WASH sub-sectors of Rural WASH, Urban WASH and Water Resources Management. This re-branded National Action Committee for the WASH Sector was born in October 2010.
The abovementioned new arrangement has provided for clearer sector leadership under Ministry of Water Resources Development and Management (MoWRDM) and has promoted effective coordination of all sector players and their interventions.
As an Inter-Ministerial steering body which brings together all relevant Ministries and Government Departments, NAC has a mandate to coordinate and oversee the development and management of Water, Sanitation and Hygiene activities in the country. The main NAC is made up of Permanent Secretaries from affiliated Ministries chaired by the Permanent Secretary in the Ministry of Water Resources Development and Management. The main NAC superintends over the three sub-sector committees of Rural WASH, Urban WASH, and Water Resources Management. The National Coordination Unit (NCU) is a full time secretariat of the NAC housed in the Ministry of Water Resources Development and Management. Figure 2.4.1 shows the organization structure of NAC.
Source: NAC Website
Figure 2.4.1 Organization Chart of National Action Committee (NAC)
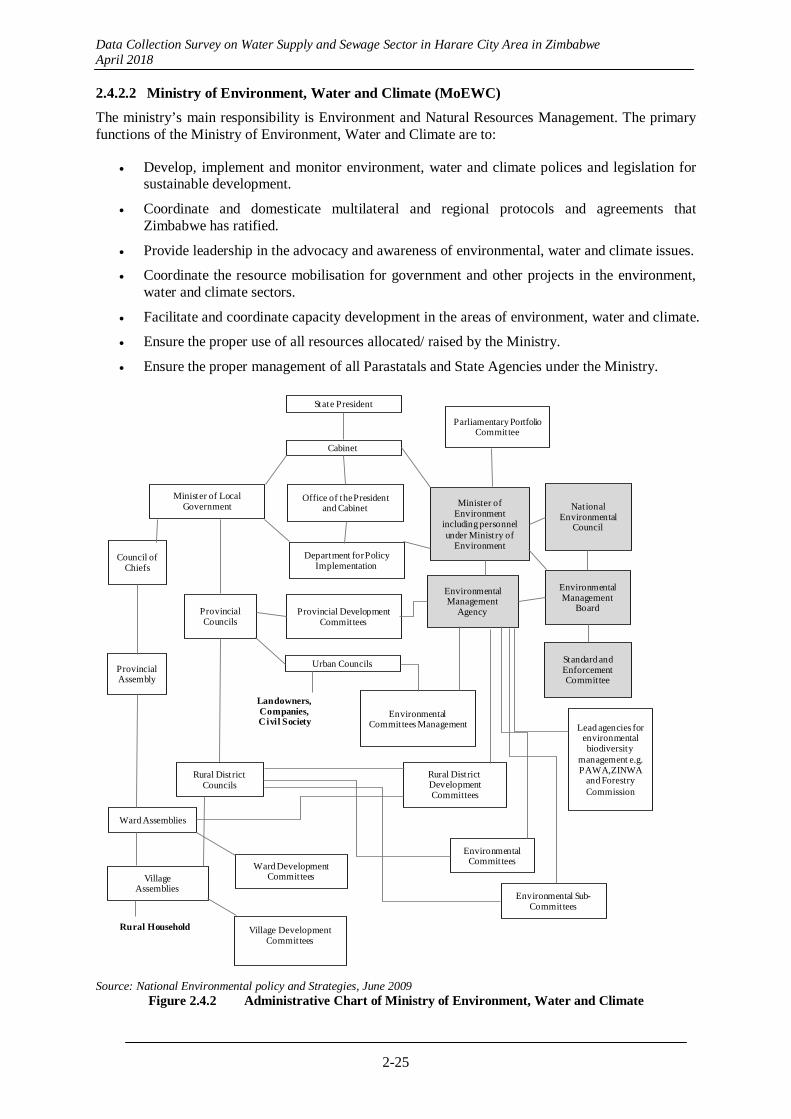
Data Collection Survey on Water Supply and Sewage Sector in Harare City Area in Zimbabwe April 2018
2-25
2.4.2.2 Ministry of Environment, Water and Climate (MoEWC)
The ministry’s main responsibility is Environment and Natural Resources Management. The primary functions of the Ministry of Environment, Water and Climate are to:
Develop, implement and monitor environment, water and climate polices and legislation for sustainable development.
Coordinate and domesticate multilateral and regional protocols and agreements that Zimbabwe has ratified.
Provide leadership in the advocacy and awareness of environmental, water and climate issues.
Coordinate the resource mobilisation for government and other projects in the environment, water and climate sectors.
Facilitate and coordinate capacity development in the areas of environment, water and climate.
Ensure the proper use of all resources allocated/ raised by the Ministry.
Ensure the proper management of all Parastatals and State Agencies under the Ministry.
State President
Cabinet
Office of the President and Cabinet
Department for Policy Implementation
Minister of Local Government
Parliamentary Portfolio Committee
Minister of Environment
including personnel under Ministry of
Environment
NationalEnvironmental
Council
Environmental Management
Board
Environmental Management
Agency
Standard and Enforcement Committee
Lead agencies for environmental biodiversity
management e.g. PAWA,ZINWA
and ForestryCommission
Council of Chiefs
Provincial Assembly
ProvincialCouncils
Provincial Development Committees
EnvironmentalCommittees Management
Landowners,Companies,Civil Society
Rural District Development Committees
Environmental Committees
Environmental Sub-Committees
Urban Councils
Rural District Councils
Ward Assemblies
VillageAssemblies
Ward DevelopmentCommittees
Village DevelopmentCommittees
Rural Household
Source: National Environmental policy and Strategies, June 2009
Figure 2.4.2 Administrative Chart of Ministry of Environment, Water and Climate

Data Collection Survey on Water Supply and Sewage Sector in Harare City Area in Zimbabwe April 2018
2-26
Administrative Chart of Ministry of Environment, Water and Climate is shown in Figure 2.4.2. Environmental Management Agency (EMA) is a sub-grain structure of the ministry. Environmental condition of sewage is controlled by each city.
2.4.2.3 Ministry of Local Government, Public Works and National Housing (MLGPWNH)
The Ministry is responsible for function and governance of local body as the supervisory authority, and is directing collection of sewerage charge.
2.4.2.4 Zimbabwe National Water Authority (ZINWA)
The Zimbabwe National Water Authority is a wholly Government-owned organisation that falls under the Ministry of Environment, Water and Climate. The Authority was formed in 2000 following the promulgation of the ZINWA Act and its functions and mandate are drawn from the same Act and the Water Act of 1998.
The Authority has a mandate to manage water for the State and to ensure sustainable development and equitable distribution of the country’s water resources to all Zimbabweans at an affordable price. The major function provided by the Zimbabwe National Water Authority Act is as follows:
(a) to advise the Minister on the formulation of national policies and standards on—
(i) water resources planning, management and development; and
(ii) water quality and pollution control and environmental protection; and
(iii) hydrology and hydrogeology; and
(iv) dam safety and borehole drilling; and
(v) water pricing;
(b) subject to the Water Act [Chapter 20:24], to assist and participate in or advise on any matter pertaining to the planning of the development, exploitation, protection and conservation of water resources; and
(c) to exploit, conserve and manage the water resources of Zimbabwe with the object of—
(i) securing equitable accessibility and efficient allocation, distribution, use and development; and
(ii) providing, in both the short and the long term, adequate water on a cost effective basis; and
(iii) taking appropriate measures to minimise the impacts of droughts, floods or other hazards;
(d) to promote an equitable, efficient and sustainable allocation and distribution of water resources; and
(e) to encourage and assist local authorities in the discharge of their functions under the Rural District Councils Act [Chapter 29:13] and the Urban Councils Act [Chapter 29:15] with regard to the development and management of water resources in areas under their jurisdiction and in particular, the provision of potable water and the disposal of waste water; and
(f) to ensure that, catchment councils discharge their functions in accordance with the Water Act [Chapter 20:24]; and
(g) to encourage and assist catchment councils to plan and co-ordinate the development and management of water resources in areas under their jurisdiction; and
(h) to operate and maintain any water works owned or managed by the Authority and to sell any water therefrom, to dispose of waste water, to construct boreholes and to provide design and construction services; and
Data Collection Survey on Water Supply and Sewage Sector in Harare City Area in Zimbabwe April 2018
2-27
(i) to provide, at such fee as the Authority may determine, all forms of assistance, including technical assistance, personnel, advisory and training, information and other services to the Government, local authorities and catchment councils in connection with the exploitation, development, management and distribution of water resources; and
(j) to undertake research studies and develop a database on hydrological issues pertaining to or of interest to Zimbabwe and to publish the findings and any other data compiled by the Authority; and
(k) to conduct hydrological and geographical surveys and to produce plans, maps or other information necessary in the planning, development and exploitation of water resources and to publish any such surveys, plans, maps or other information; and
(l) to promote such mechanisms for the co-operative management of international water resources as the Minister may determine; and
(m) to carry out any function that may be conferred or imposed on the Authority by or under this Act, the Water Act [Chapter 20:24], or any other enactment.
2.4.2.5 Environmental Management Agency (EMA)
(1) General
The Environmental Management Agency is a statutory body responsible for ensuring the sustainable management of natural resources and protection of the environment, prevention of pollution and environmental degradation, as well as preparation of Environmental Plans for the management and protection of the environment. It was established under the Environmental Management Act and enacted in 2002.
(2) Function
According to the Environmental Management Act, the function of the Agency is provided as follows:
(a) To formulate quality standards on air, water, soil, noise, vibration, radiation and waste management;
(b) To assist and participate in any matter pertaining to the management of the environments; and in particular,
(i) To develop guidelines for the preparation of the National Plan, environmental management plans and local environmental management action plans; and
(ii) To regulate and monitor the collection, disposal, treatment and recycling of waste; and
(iii) To regulate and monitor the discharge or emission of any pollutant or hazardous substance into the environment;
(iv) To keep records in the form of registers of all licenses and permits issued under this Act;
(v) To regulate and monitor the control of invasive alien species;
(vi) To regulate, monitor, review, and approve environmental impact assessments;
(vii) To regulate and monitor the management and utilisation of ecologically fragile ecosystems;
(viii) To make model by-laws and to establish measures for the management of the environment within the jurisdiction of the local authorities;
(x) To recommend to the Government the conventions which the country may join, and incorporate their provisions into national law;
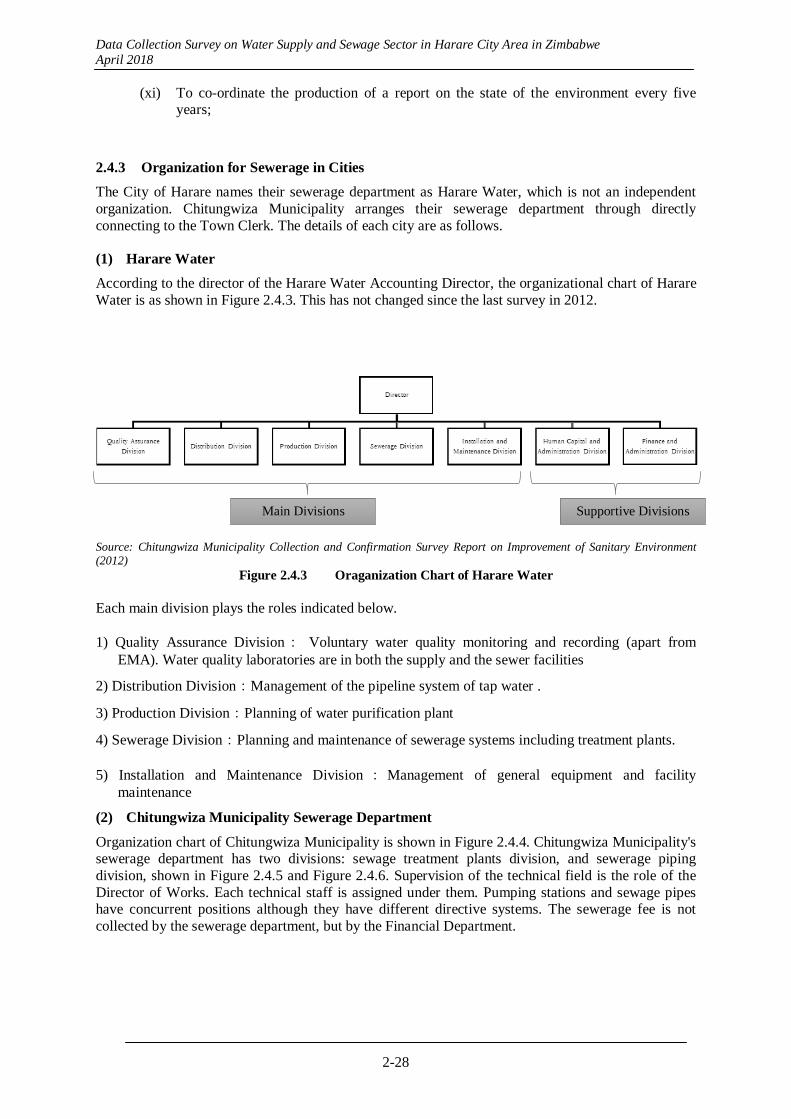
Data Collection Survey on Water Supply and Sewage Sector in Harare City Area in Zimbabwe April 2018
2-28
(xi) To co-ordinate the production of a report on the state of the environment every five years;
2.4.3 Organization for Sewerage in Cities
The City of Harare names their sewerage department as Harare Water, which is not an independent organization. Chitungwiza Municipality arranges their sewerage department through directly connecting to the Town Clerk. The details of each city are as follows.
(1) Harare Water
According to the director of the Harare Water Accounting Director, the organizational chart of Harare Water is as shown in Figure 2.4.3. This has not changed since the last survey in 2012.
Source: Chitungwiza Municipality Collection and Confirmation Survey Report on Improvement of Sanitary Environment (2012)
Figure 2.4.3 Oraganization Chart of Harare Water Each main division plays the roles indicated below.
1) Quality Assurance Division: Voluntary water quality monitoring and recording (apart from EMA). Water quality laboratories are in both the supply and the sewer facilities
2) Distribution Division:Management of the pipeline system of tap water .
3) Production Division:Planning of water purification plant
4) Sewerage Division:Planning and maintenance of sewerage systems including treatment plants.
5) Installation and Maintenance Division : Management of general equipment and facility maintenance
(2) Chitungwiza Municipality Sewerage Department
Organization chart of Chitungwiza Municipality is shown in Figure 2.4.4. Chitungwiza Municipality's sewerage department has two divisions: sewage treatment plants division, and sewerage piping division, shown in Figure 2.4.5 and Figure 2.4.6. Supervision of the technical field is the role of the Director of Works. Each technical staff is assigned under them. Pumping stations and sewage pipes have concurrent positions although they have different directive systems. The sewerage fee is not collected by the sewerage department, but by the Financial Department.
Main Divisions Supportive Divisions
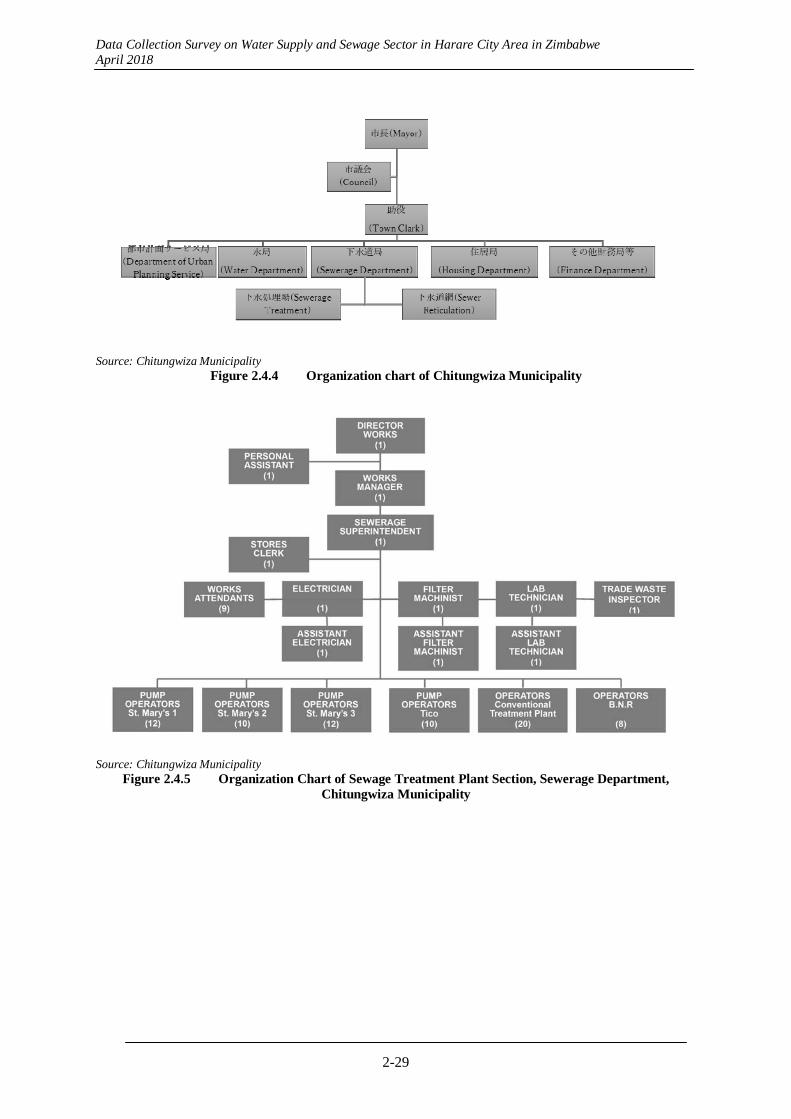
Data Collection Survey on Water Supply and Sewage Sector in Harare City Area in Zimbabwe April 2018
2-29
Source: Chitungwiza Municipality
Figure 2.4.4 Organization chart of Chitungwiza Municipality
Source: Chitungwiza Municipality Figure 2.4.5 Organization Chart of Sewage Treatment Plant Section, Sewerage Department,
Chitungwiza Municipality
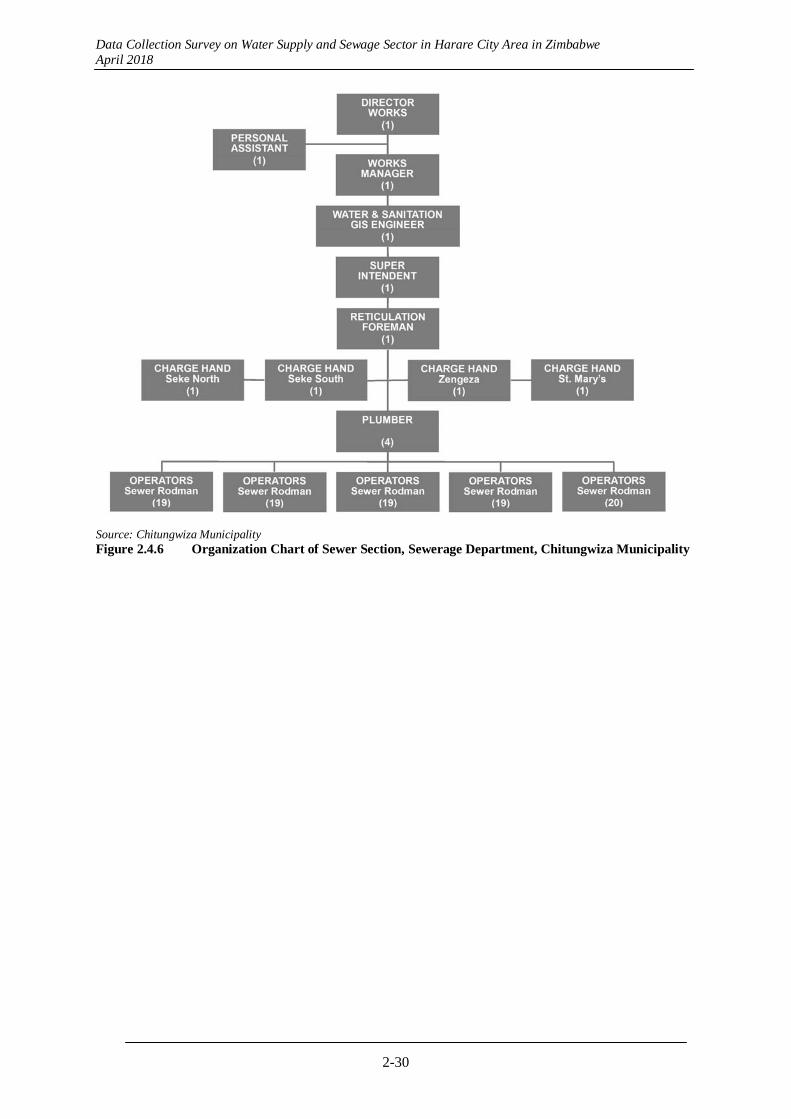
Data Collection Survey on Water Supply and Sewage Sector in Harare City Area in Zimbabwe April 2018
2-30
Source: Chitungwiza Municipality Figure 2.4.6 Organization Chart of Sewer Section, Sewerage Department, Chitungwiza Municipality
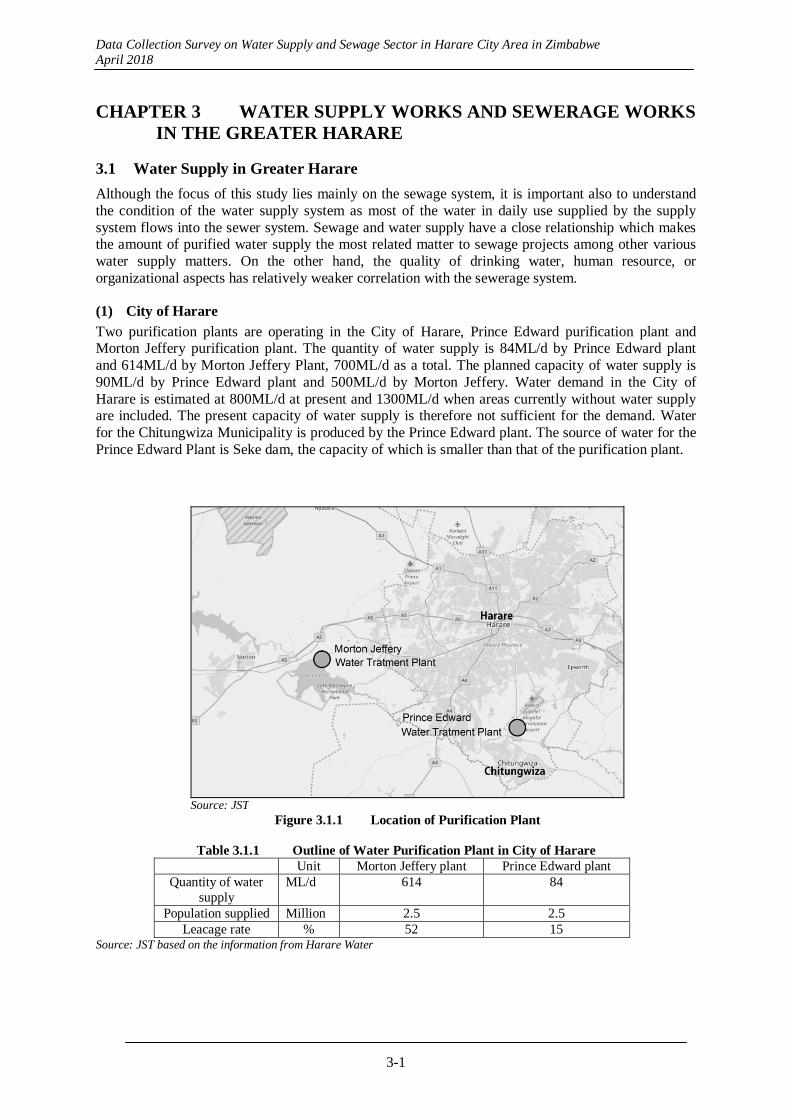
Data Collection Survey on Water Supply and Sewage Sector in Harare City Area in Zimbabwe April 2018
3-1
CHAPTER 3 WATER SUPPLY WORKS AND SEWERAGE WORKS IN THE GREATER HARARE
3.1 Water Supply in Greater Harare
Although the focus of this study lies mainly on the sewage system, it is important also to understand the condition of the water supply system as most of the water in daily use supplied by the supply system flows into the sewer system. Sewage and water supply have a close relationship which makes the amount of purified water supply the most related matter to sewage projects among other various water supply matters. On the other hand, the quality of drinking water, human resource, or organizational aspects has relatively weaker correlation with the sewerage system.
(1) City of Harare
Two purification plants are operating in the City of Harare, Prince Edward purification plant and Morton Jeffery purification plant. The quantity of water supply is 84ML/d by Prince Edward plant and 614ML/d by Morton Jeffery Plant, 700ML/d as a total. The planned capacity of water supply is 90ML/d by Prince Edward plant and 500ML/d by Morton Jeffery. Water demand in the City of Harare is estimated at 800ML/d at present and 1300ML/d when areas currently without water supply are included. The present capacity of water supply is therefore not sufficient for the demand. Water for the Chitungwiza Municipality is produced by the Prince Edward plant. The source of water for the Prince Edward Plant is Seke dam, the capacity of which is smaller than that of the purification plant.
Source: JST
Figure 3.1.1 Location of Purification Plant
Table 3.1.1 Outline of Water Purification Plant in City of Harare Unit Morton Jeffery plant Prince Edward plant
Quantity of water supply
ML/d 614 84
Population supplied Million 2.5 2.5 Leacage rate % 52 15
Source: JST based on the information from Harare Water
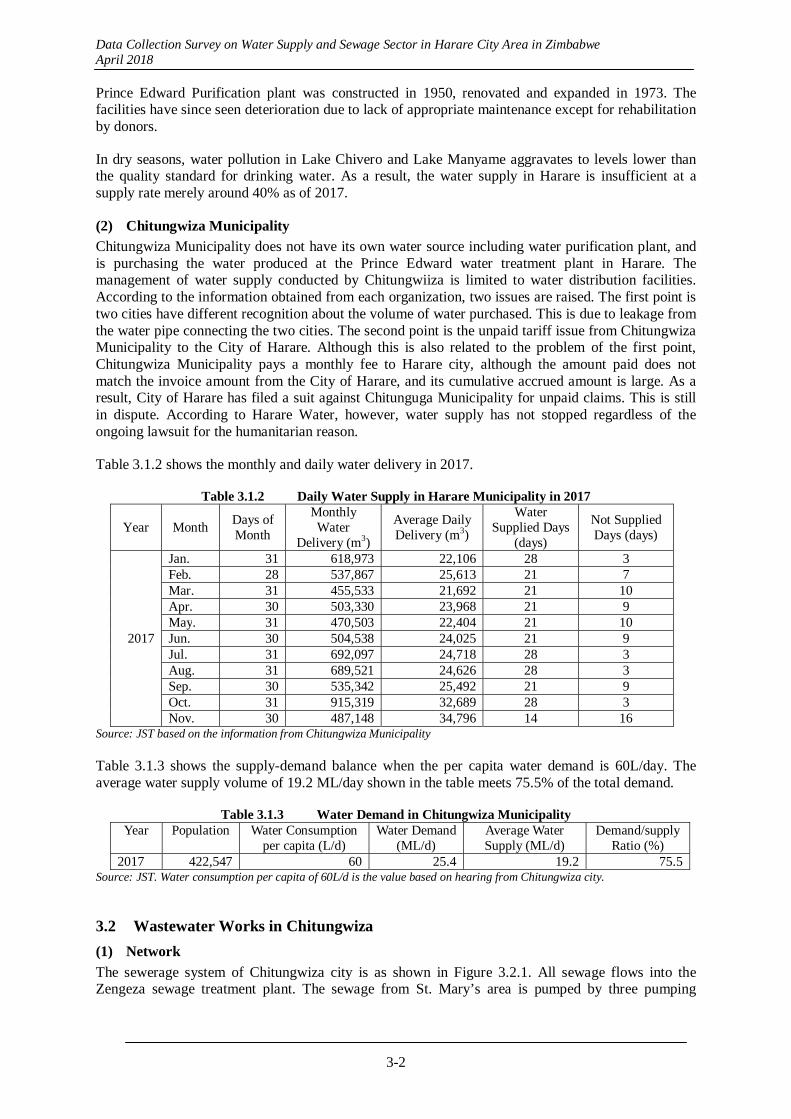
Data Collection Survey on Water Supply and Sewage Sector in Harare City Area in Zimbabwe April 2018
3-2
Prince Edward Purification plant was constructed in 1950, renovated and expanded in 1973. The facilities have since seen deterioration due to lack of appropriate maintenance except for rehabilitation by donors.
In dry seasons, water pollution in Lake Chivero and Lake Manyame aggravates to levels lower than the quality standard for drinking water. As a result, the water supply in Harare is insufficient at a supply rate merely around 40% as of 2017.
(2) Chitungwiza Municipality
Chitungwiza Municipality does not have its own water source including water purification plant, and is purchasing the water produced at the Prince Edward water treatment plant in Harare. The management of water supply conducted by Chitungwiiza is limited to water distribution facilities. According to the information obtained from each organization, two issues are raised. The first point is two cities have different recognition about the volume of water purchased. This is due to leakage from the water pipe connecting the two cities. The second point is the unpaid tariff issue from Chitungwiza Municipality to the City of Harare. Although this is also related to the problem of the first point, Chitungwiza Municipality pays a monthly fee to Harare city, although the amount paid does not match the invoice amount from the City of Harare, and its cumulative accrued amount is large. As a result, City of Harare has filed a suit against Chitunguga Municipality for unpaid claims. This is still in dispute. According to Harare Water, however, water supply has not stopped regardless of the ongoing lawsuit for the humanitarian reason.
Table 3.1.2 shows the monthly and daily water delivery in 2017.
Table 3.1.2 Daily Water Supply in Harare Municipality in 2017
Year Month Days of Month
Monthly Water
Delivery (m3)
Average Daily Delivery (m3)
Water Supplied Days
(days)
Not Supplied Days (days)
2017
Jan. 31 618,973 22,106 28 3 Feb. 28 537,867 25,613 21 7 Mar. 31 455,533 21,692 21 10 Apr. 30 503,330 23,968 21 9 May. 31 470,503 22,404 21 10 Jun. 30 504,538 24,025 21 9 Jul. 31 692,097 24,718 28 3 Aug. 31 689,521 24,626 28 3 Sep. 30 535,342 25,492 21 9 Oct. 31 915,319 32,689 28 3 Nov. 30 487,148 34,796 14 16
Source: JST based on the information from Chitungwiza Municipality Table 3.1.3 shows the supply-demand balance when the per capita water demand is 60L/day. The average water supply volume of 19.2 ML/day shown in the table meets 75.5% of the total demand.
Table 3.1.3 Water Demand in Chitungwiza Municipality Year Population Water Consumption
per capita (L/d) Water Demand
(ML/d) Average Water Supply (ML/d)
Demand/supply Ratio (%)
2017 422,547 60 25.4 19.2 75.5Source: JST. Water consumption per capita of 60L/d is the value based on hearing from Chitungwiza city.
3.2 Wastewater Works in Chitungwiza
(1) Network
The sewerage system of Chitungwiza city is as shown in Figure 3.2.1. All sewage flows into the Zengeza sewage treatment plant. The sewage from St. Mary’s area is pumped by three pumping
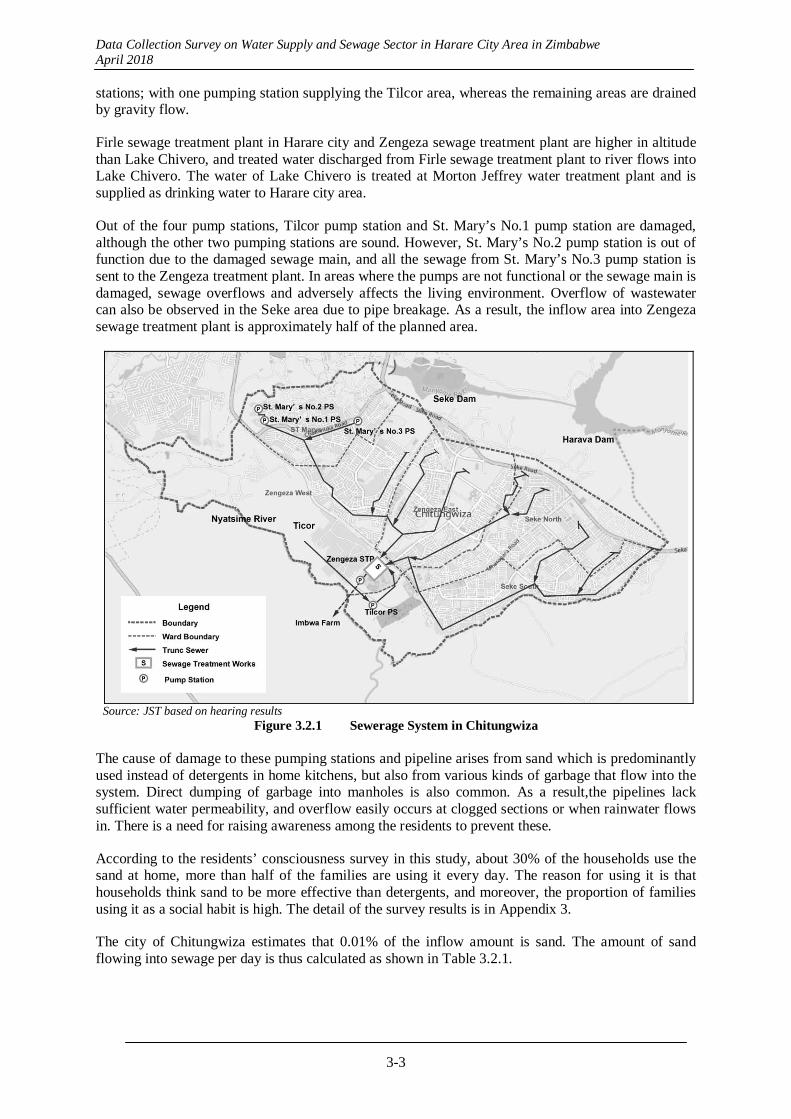
Data Collection Survey on Water Supply and Sewage Sector in Harare City Area in Zimbabwe April 2018
3-3
stations; with one pumping station supplying the Tilcor area, whereas the remaining areas are drained by gravity flow.
Firle sewage treatment plant in Harare city and Zengeza sewage treatment plant are higher in altitude than Lake Chivero, and treated water discharged from Firle sewage treatment plant to river flows into Lake Chivero. The water of Lake Chivero is treated at Morton Jeffrey water treatment plant and is supplied as drinking water to Harare city area.
Out of the four pump stations, Tilcor pump station and St. Mary’s No.1 pump station are damaged, although the other two pumping stations are sound. However, St. Mary’s No.2 pump station is out of function due to the damaged sewage main, and all the sewage from St. Mary’s No.3 pump station is sent to the Zengeza treatment plant. In areas where the pumps are not functional or the sewage main is damaged, sewage overflows and adversely affects the living environment. Overflow of wastewater can also be observed in the Seke area due to pipe breakage. As a result, the inflow area into Zengeza sewage treatment plant is approximately half of the planned area.
Source: JST based on hearing results Figure 3.2.1 Sewerage System in Chitungwiza
The cause of damage to these pumping stations and pipeline arises from sand which is predominantly used instead of detergents in home kitchens, but also from various kinds of garbage that flow into the system. Direct dumping of garbage into manholes is also common. As a result,the pipelines lack sufficient water permeability, and overflow easily occurs at clogged sections or when rainwater flows in. There is a need for raising awareness among the residents to prevent these.
According to the residents’ consciousness survey in this study, about 30% of the households use the sand at home, more than half of the families are using it every day. The reason for using it is that households think sand to be more effective than detergents, and moreover, the proportion of families using it as a social habit is high. The detail of the survey results is in Appendix 3.
The city of Chitungwiza estimates that 0.01% of the inflow amount is sand. The amount of sand flowing into sewage per day is thus calculated as shown in Table 3.2.1.

Data Collection Survey on Water Supply and Sewage Sector in Harare City Area in Zimbabwe April 2018
3-4
Table 3.2.1 Amount of Sand Flowing into Sewage per day in Chitungwiza
Year Sand % including
in Wastewater
Incoming Wastewater at Zengeza ML/d
Sand L /Wastewater 10
ML/d
Sand gravity average kg/L
Sand kg /Wastewater 10
ML/d 2017 0.01 10 1000 2 2000
Source: JST
(2) Water Leakage Volume
Table 3.2.2 shows the amount of sewage generated when 80% of the water supply amount is to be sewage.
Table 3.2.2 Amount of Sewage Generated in Chitungwiza
Year Population Water Consumption
per capita (L/d) Population using
septic tank Population not
using septic tank
Sewage Generation
(ML/d) 2017 422,547 60 76,152 346,395 20.8
Note: The population of septic tank users is calculated from information on 3,173regional group Chintungwiza city has, with 1 regional group as 4 families and 1 family as 6 members. Source: JST Since the sewage in the city flows into Zengeza treatment plant except for the septic tank users, the leakage rate from the sewer network is calculated as shown in Table 3.2.3, which is about 50%. This is consistent with the fact that sewage from about half of the area is not flowing into the treatment plant.
Table 3.2.3 Sewage Leakage Rate
Year Sewage Generation
(ML/d) Inflow to Zengeza Treatment Plant
(ML/d) Sewage Leakage Rate
(%) 2017 20.8 10 52
Note: Sewage inflow to Zengeza treatment plant is unknown because there is no flow meter, but it is set to 10 ML/d based on hearing form the staffs. Source: JST
3.3 Present Condition of Zengeza Wastewater Treatment Plant
(1) Overview
Two systems were constructed in Zengeza WWTP, namely; the trickling filter system constructed in 1975 and the Biological nutrient removal (BNR) system constructed in 2000 under Japanese assistance.
Figure 3.3.1 shows the layout of Zengeza treatment plant and Figure 3.3.2 the overall layout of the facility. Trickling filter facility is renovated and operated with the support from ZIM Fund (over 4 million USD) in 2016. Only one out of five trickling filters is currently used because of a small sewage inflow.
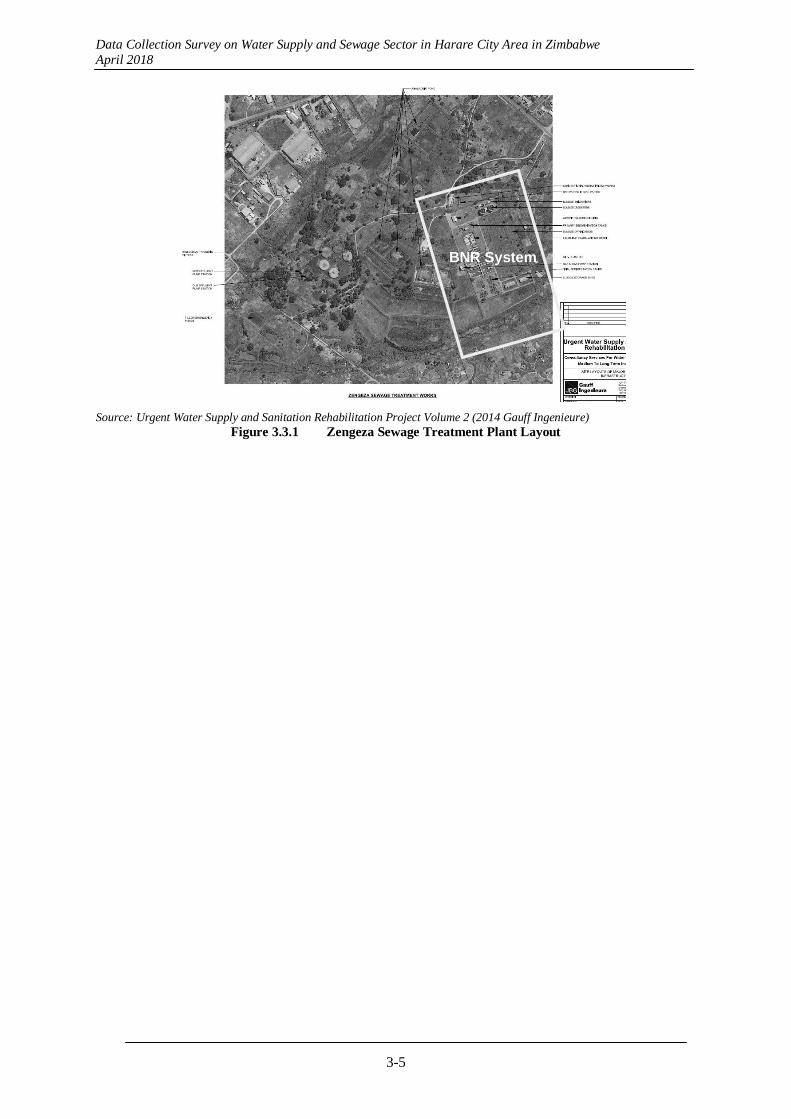
Data Collection Survey on Water Supply and Sewage Sector in Harare City Area in Zimbabwe April 2018
3-5
Source: Urgent Water Supply and Sanitation Rehabilitation Project Volume 2 (2014 Gauff Ingenieure)
Figure 3.3.1 Zengeza Sewage Treatment Plant Layout
BNR System

Data Collection Survey on Water Supply and Sewage Sector in Harare City Area in Zimbabwe April 2018
3-6
Source: As-built Drawing of Zengeza Treatment Plant
Figure 3.3.2 Overall Layout Drawing of Zengeza Treatment Plant Facility
Table 3.3.1 shows summary of mechanical equipment, equipment capacity and staffing of the trickling filter system and BNR system in Zengeza treatment plant.
Sewerage inlet+Grit Chamber (GC) →
BNR (Anaerobic tank+Anoxic tank+ Aerobic tank) →
← Sludge stack
Final sedimentation tank →
Equalization basin+Alkali injection facility (Not used) →
← Sludge drying bed
Primary sedimentation tank →
←Sludge treatment facility (Concentration tank+digestion tank)
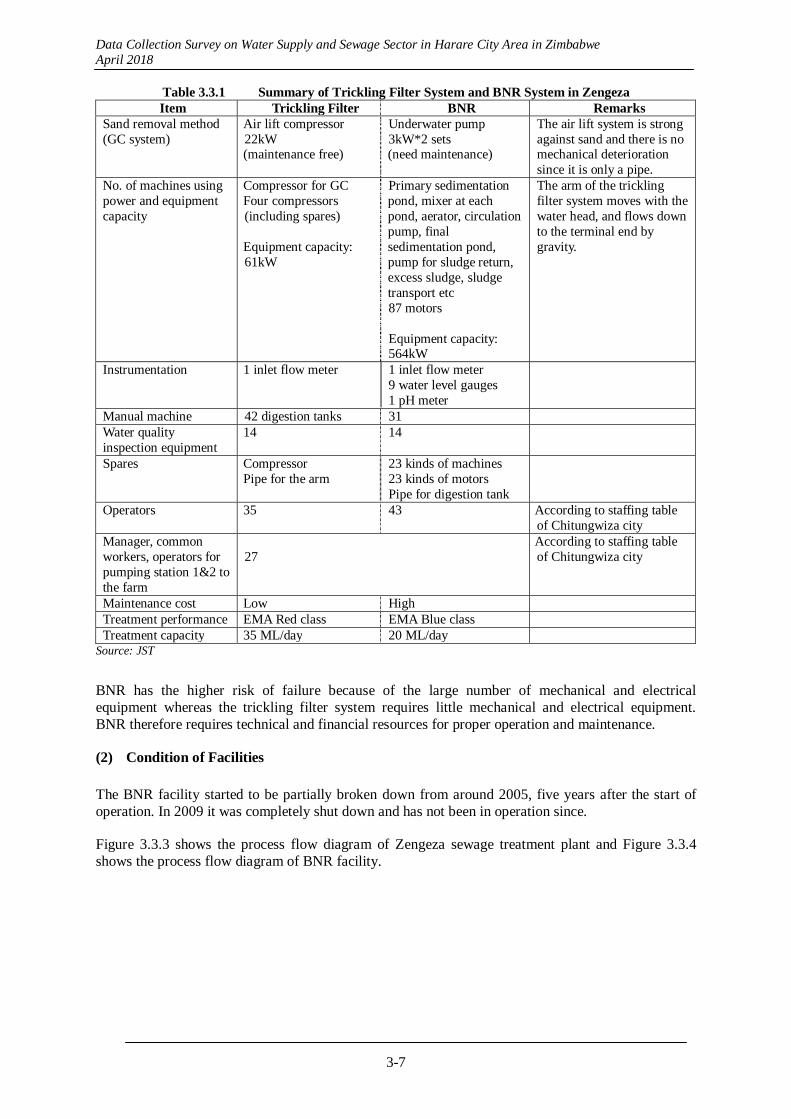
Data Collection Survey on Water Supply and Sewage Sector in Harare City Area in Zimbabwe April 2018
3-7
Table 3.3.1 Summary of Trickling Filter System and BNR System in Zengeza Item Trickling Filter BNR Remarks
Sand removal method (GC system)
Air lift compressor 22kW (maintenance free)
Underwater pump3kW*2 sets (need maintenance)
The air lift system is strong against sand and there is no mechanical deterioration since it is only a pipe.
No. of machines using power and equipment capacity
Compressor for GCFour compressors (including spares) Equipment capacity: 61kW
Primary sedimentation pond, mixer at each pond, aerator, circulation pump, final sedimentation pond, pump for sludge return, excess sludge, sludge transport etc 87 motors Equipment capacity: 564kW
The arm of the trickling filter system moves with the water head, and flows down to the terminal end by gravity.
Instrumentation 1 inlet flow meter 1 inlet flow meter9 water level gauges 1 pH meter
Manual machine 42 digestion tanks 31Water quality inspection equipment
14 14
Spares Compressor Pipe for the arm
23 kinds of machines23 kinds of motors Pipe for digestion tank
Operators 35 43 According to staffing table of Chitungwiza city
Manager, common workers, operators for pumping station 1&2 to the farm
27 According to staffing table of Chitungwiza city
Maintenance cost Low HighTreatment performance EMA Red class EMA Blue classTreatment capacity 35 ML/day 20 ML/day
Source: JST
BNR has the higher risk of failure because of the large number of mechanical and electrical equipment whereas the trickling filter system requires little mechanical and electrical equipment. BNR therefore requires technical and financial resources for proper operation and maintenance.
(2) Condition of Facilities
The BNR facility started to be partially broken down from around 2005, five years after the start of operation. In 2009 it was completely shut down and has not been in operation since.
Figure 3.3.3 shows the process flow diagram of Zengeza sewage treatment plant and Figure 3.3.4 shows the process flow diagram of BNR facility.
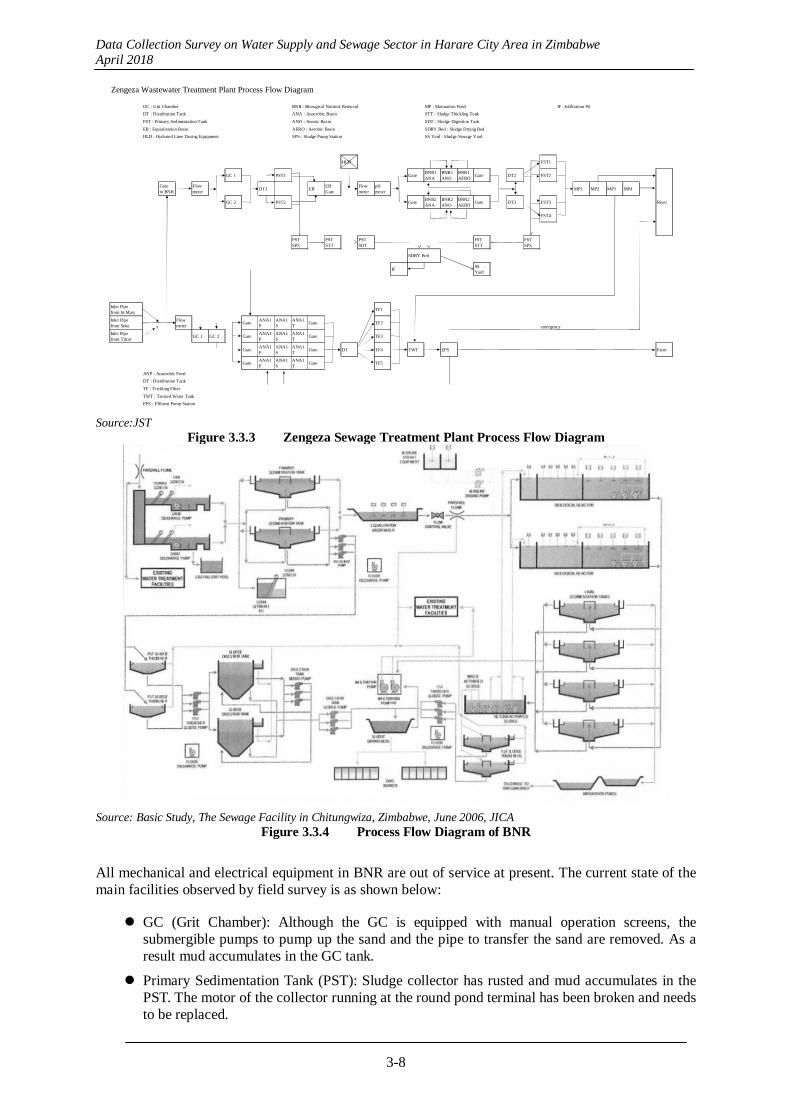
Data Collection Survey on Water Supply and Sewage Sector in Harare City Area in Zimbabwe April 2018
3-8
Zengeza Wastewater Treatment Plant Process Flow Diagram
GC : Grit Chamber BNR : Biorogical Nutrient Removal MP : Maturation Pond IF : Infiltration Pit
DT : Distribution Tank ANA : Anaerobic Basin STT : Sludge Thickling Tank
PST : Primary Sedimentation Tank ANO : Anoxic Basin SDT : Sludge Digestion Tank
EB : Equialization Basin AERO : Aerobic Basin SDRY Bed : Sludge Drying Bed
HLD : Hydrated Lime Dosing Equipment SPS : Sludge Pump Station SS Yard : Sludge Storage Yard
HLD FST1
GC 1 PST1 GateBNR1ANA
BNR1ANO
BNR1AERO
Gate DT2 FST2
Gateto BNR
Flowmeter
DT1 EBEBGate
Flowmeter
pHmeter
MP1 MP2 MP3 MP4
GC 2 PST2 GateBNR2ANA
BNR2ANO
BNR2AERO
Gate DT3 FST3
FST4
PSTSPS
PSTSTT
PSTSDT
FSTSTT
FSTSPS
IFSSYard
Inlet Pipefrom St.Mary
TF1
Inlet Pipefrom Seke x
Flowmeter
GateANA1P
ANA1S
ANA1T
Gate TF2emergency
Inlet Pipefrom Tilcor
GC 1 GC 2 GateANA1P
ANA1S
ANA1T
Gate TF3
GateANA1P
ANA1S
ANA1T
Gate DT TF4 TWT EPS Farm
GateANA1P
ANA1S
ANA1T
Gate TF5
ANP : Anaerobic Pond
DT : Distribution Tank
TF : Trickling Filter
TWT : Treated Water Tank
EPS : Effluent Pump Station
SDRY Bed
River
Source:JST
Figure 3.3.3 Zengeza Sewage Treatment Plant Process Flow Diagram
Source: Basic Study, The Sewage Facility in Chitungwiza, Zimbabwe, June 2006, JICA
Figure 3.3.4 Process Flow Diagram of BNR
All mechanical and electrical equipment in BNR are out of service at present. The current state of the main facilities observed by field survey is as shown below:
GC (Grit Chamber): Although the GC is equipped with manual operation screens, the submergible pumps to pump up the sand and the pipe to transfer the sand are removed. As a result mud accumulates in the GC tank.
Primary Sedimentation Tank (PST): Sludge collector has rusted and mud accumulates in the PST. The motor of the collector running at the round pond terminal has been broken and needs to be replaced.
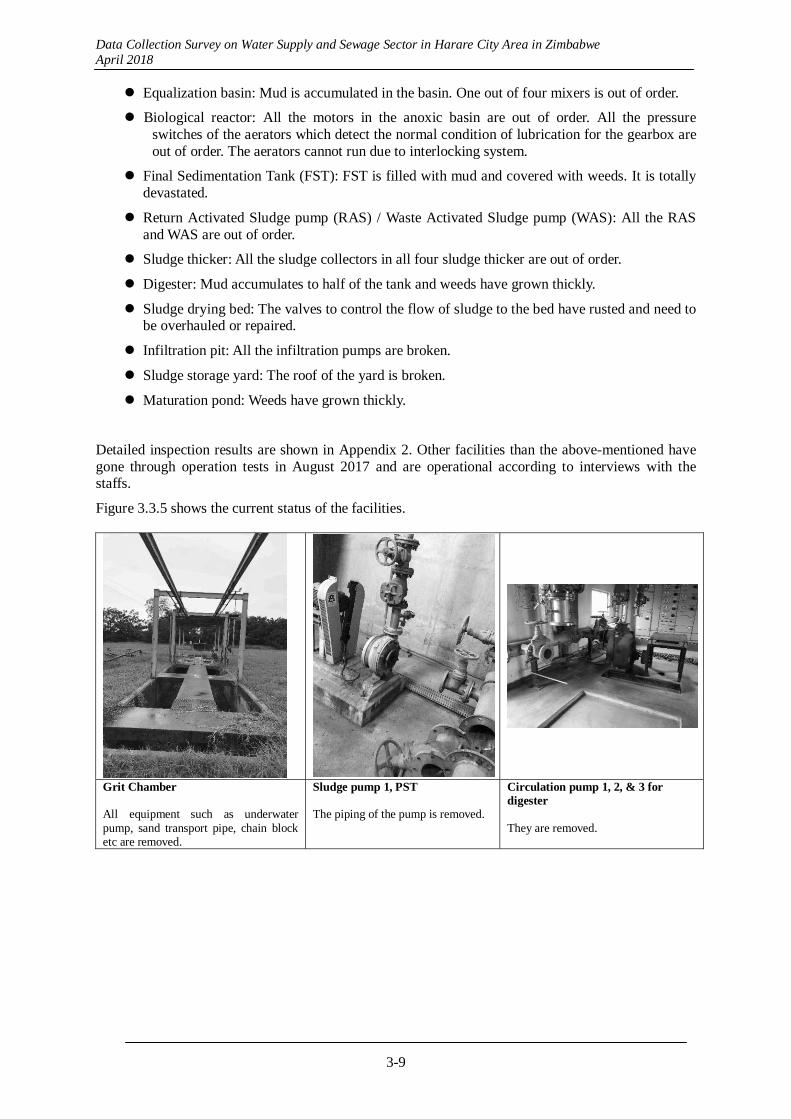
Data Collection Survey on Water Supply and Sewage Sector in Harare City Area in Zimbabwe April 2018
3-9
Equalization basin: Mud is accumulated in the basin. One out of four mixers is out of order.
Biological reactor: All the motors in the anoxic basin are out of order. All the pressure switches of the aerators which detect the normal condition of lubrication for the gearbox are out of order. The aerators cannot run due to interlocking system.
Final Sedimentation Tank (FST): FST is filled with mud and covered with weeds. It is totally devastated.
Return Activated Sludge pump (RAS) / Waste Activated Sludge pump (WAS): All the RAS and WAS are out of order.
Sludge thicker: All the sludge collectors in all four sludge thicker are out of order.
Digester: Mud accumulates to half of the tank and weeds have grown thickly.
Sludge drying bed: The valves to control the flow of sludge to the bed have rusted and need to be overhauled or repaired.
Infiltration pit: All the infiltration pumps are broken.
Sludge storage yard: The roof of the yard is broken.
Maturation pond: Weeds have grown thickly.
Detailed inspection results are shown in Appendix 2. Other facilities than the above-mentioned have gone through operation tests in August 2017 and are operational according to interviews with the staffs.
Figure 3.3.5 shows the current status of the facilities.
Grit Chamber All equipment such as underwater pump, sand transport pipe, chain block etc are removed.
Sludge pump 1, PST The piping of the pump is removed.
Circulation pump 1, 2, & 3 for digester They are removed.

Data Collection Survey on Water Supply and Sewage Sector in Harare City Area in Zimbabwe April 2018
3-10
Primary Sedimentation Tank 1 Sand and mud are deposited.
Equalization basin mixer Mixer is buried in mud. Motor and gearbox are removed.
Final Sedimentation Tank 3 It is completely covered with weeds.
Source: JST Figure 3.3.5 Facilities of BNR in Zengeza Sewage Treatment Plant
3.4 Water Quality
(1) Water Quality in Lakes and Rivers
In terms of environmental management, Environmental Management Agency (EMA) monitors the water quality of rivers and lakes where wastewater is flowing in. However quality data of Lake Manyame and Lake Chivero was not obtained in this survey.
The followings are extracts from Data Collection Survey for Improvement of Hygiene Condition in Chitungwiza Municipality (2012).
Table 3.4.1 Raw Water Quality from Upper Manyame in 1996
Source: Data Collection Survey for Improvement of Hygiene Condition in Chitungwiza Municipality, 2012, JICA
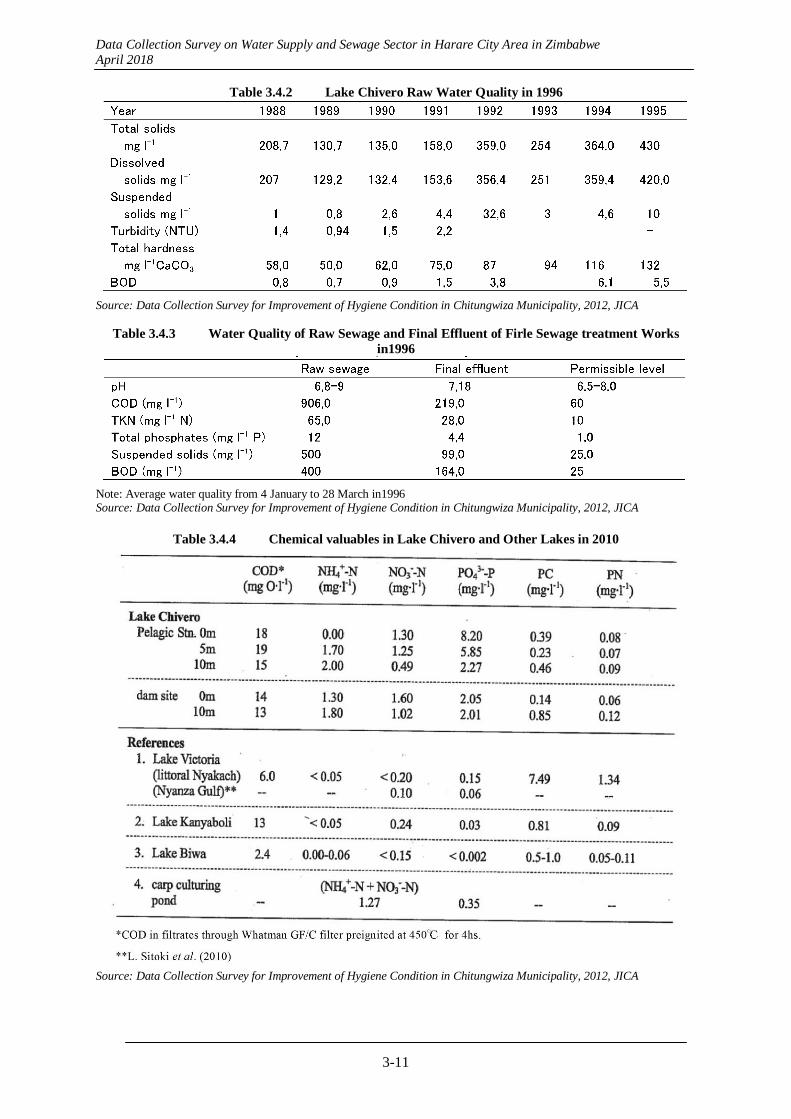
Data Collection Survey on Water Supply and Sewage Sector in Harare City Area in Zimbabwe April 2018
3-11
Table 3.4.2 Lake Chivero Raw Water Quality in 1996
Source: Data Collection Survey for Improvement of Hygiene Condition in Chitungwiza Municipality, 2012, JICA
Table 3.4.3 Water Quality of Raw Sewage and Final Effluent of Firle Sewage treatment Works in1996
Note: Average water quality from 4 January to 28 March in1996 Source: Data Collection Survey for Improvement of Hygiene Condition in Chitungwiza Municipality, 2012, JICA
Table 3.4.4 Chemical valuables in Lake Chivero and Other Lakes in 2010
Source: Data Collection Survey for Improvement of Hygiene Condition in Chitungwiza Municipality, 2012, JICA

Data Collection Survey on Water Supply and Sewage Sector in Harare City Area in Zimbabwe April 2018
3-12
Source: Data Collection Survey for Improvement of Hygiene Condition in Chitungwiza Municipality, 2012, JICA
Figure 3.4.1 Record of Water Quality of Lake Chivero from 1988 to 2006
Source: Data Collection Survey for Improvement of Hygiene Condition in Chitungwiza Municipality, 2012, JICA
Figure 3.4.2 Relation between Water Depth and Density of Chloride Table 3.4.2, Table 3.4.3, and Figure 3.4.1 only show a part of the water quality status but the concentration levels of nitrogen and phosphorous are high, and BOD level also deteriorates towards the upstream of the sewerage line. Considering the above, it is assumed that the surface water quality in the area including Lake Chivero is not good as a tap water source. Since nitrogen and phosphorus cannot be removed by conventional treatment methods such as the trickling filter method, it is necessary to introduce advanced treatments that can remove them.
(2) Quality of Treated Effluent
Table 3.4.5 shows classes of effluent discharge and Table 3.4.6 shows the treated water quality of Zengeza treatment plant.
EMA has established effluent discharge standards and limits discharge of contaminated wastewater to the river. Environmental Management (Effluent and Solid Waste Disposal) Regulations, 2007 indicate the quality of effluent discharge in four classes (Blue, Green, Yellow, and Red), and stipulates a fine for each class when discharging to the river. The treated water of the trickling filter system in Zengeza
Water Depth
(m)
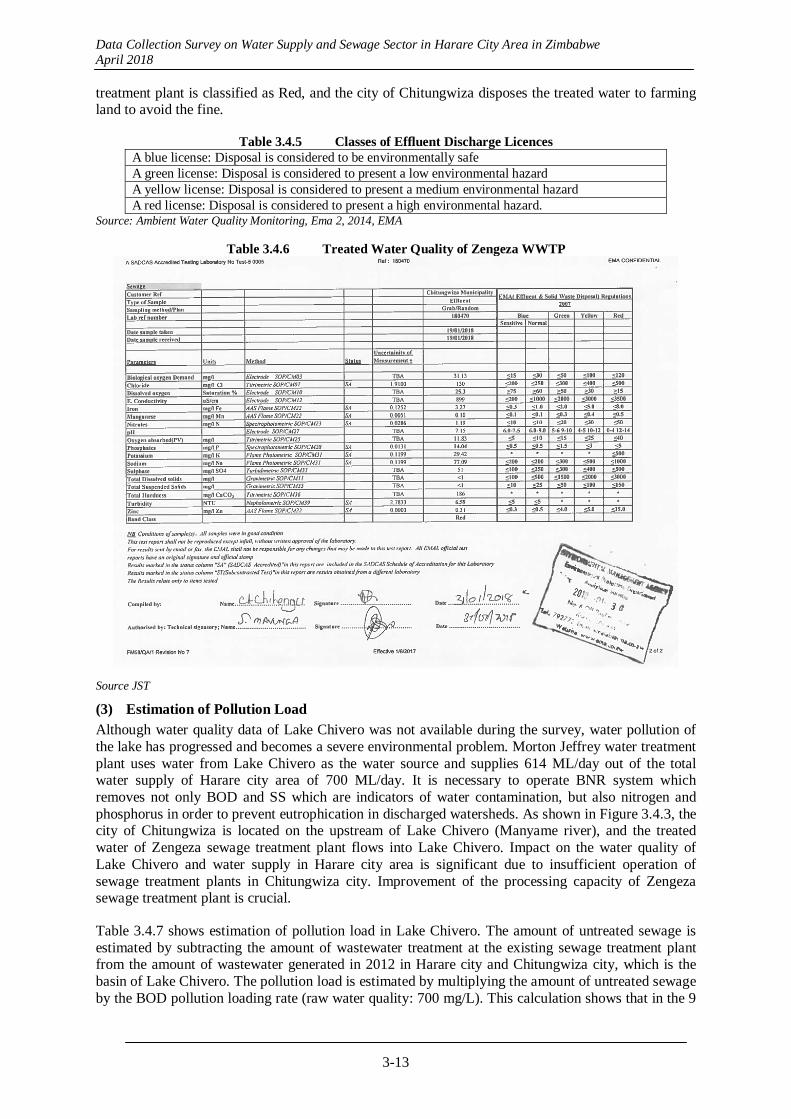
Data Collection Survey on Water Supply and Sewage Sector in Harare City Area in Zimbabwe April 2018
3-13
treatment plant is classified as Red, and the city of Chitungwiza disposes the treated water to farming land to avoid the fine.
Table 3.4.5 Classes of Effluent Discharge Licences A blue license: Disposal is considered to be environmentally safeA green license: Disposal is considered to present a low environmental hazardA yellow license: Disposal is considered to present a medium environmental hazard A red license: Disposal is considered to present a high environmental hazard.
Source: Ambient Water Quality Monitoring, Ema 2, 2014, EMA
Table 3.4.6 Treated Water Quality of Zengeza WWTP
Source JST
(3) Estimation of Pollution Load
Although water quality data of Lake Chivero was not available during the survey, water pollution of the lake has progressed and becomes a severe environmental problem. Morton Jeffrey water treatment plant uses water from Lake Chivero as the water source and supplies 614 ML/day out of the total water supply of Harare city area of 700 ML/day. It is necessary to operate BNR system which removes not only BOD and SS which are indicators of water contamination, but also nitrogen and phosphorus in order to prevent eutrophication in discharged watersheds. As shown in Figure 3.4.3, the city of Chitungwiza is located on the upstream of Lake Chivero (Manyame river), and the treated water of Zengeza sewage treatment plant flows into Lake Chivero. Impact on the water quality of Lake Chivero and water supply in Harare city area is significant due to insufficient operation of sewage treatment plants in Chitungwiza city. Improvement of the processing capacity of Zengeza sewage treatment plant is crucial.
Table 3.4.7 shows estimation of pollution load in Lake Chivero. The amount of untreated sewage is estimated by subtracting the amount of wastewater treatment at the existing sewage treatment plant from the amount of wastewater generated in 2012 in Harare city and Chitungwiza city, which is the basin of Lake Chivero. The pollution load is estimated by multiplying the amount of untreated sewage by the BOD pollution loading rate (raw water quality: 700 mg/L). This calculation shows that in the 9
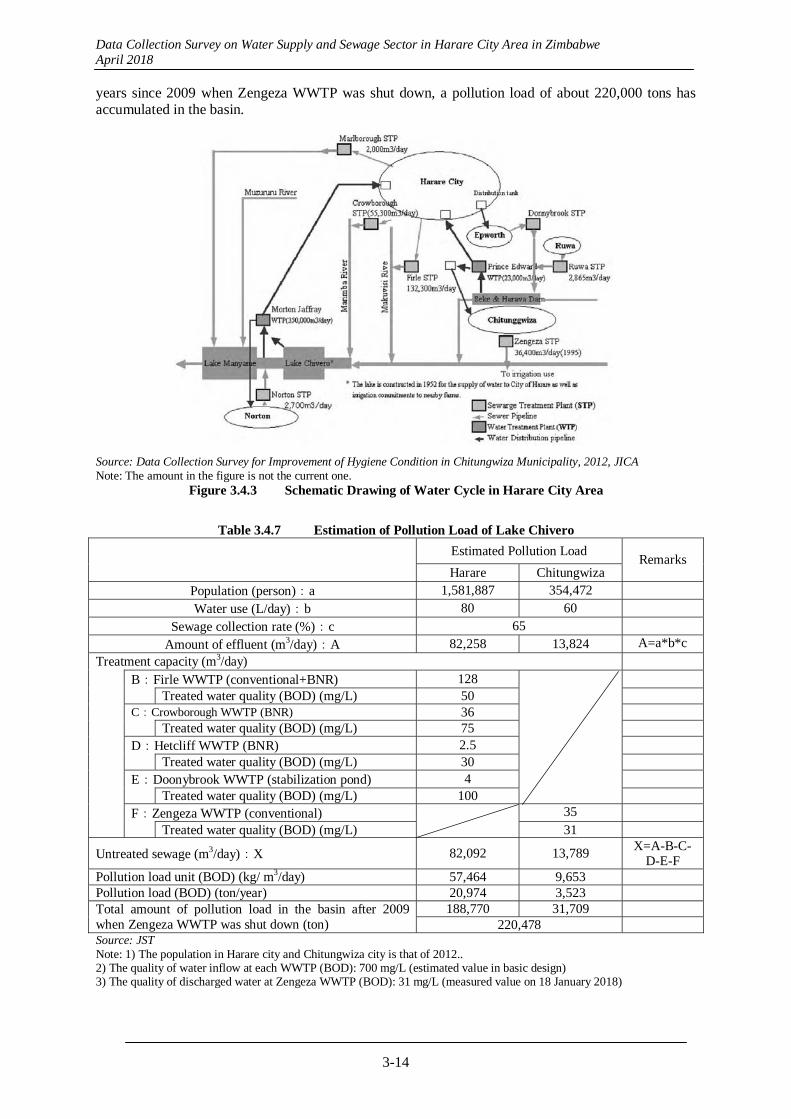
Data Collection Survey on Water Supply and Sewage Sector in Harare City Area in Zimbabwe April 2018
3-14
years since 2009 when Zengeza WWTP was shut down, a pollution load of about 220,000 tons has accumulated in the basin.
Source: Data Collection Survey for Improvement of Hygiene Condition in Chitungwiza Municipality, 2012, JICA Note: The amount in the figure is not the current one.
Figure 3.4.3 Schematic Drawing of Water Cycle in Harare City Area
Table 3.4.7 Estimation of Pollution Load of Lake Chivero
Estimated Pollution Load
Remarks Harare Chitungwiza
Population (person):a 1,581,887 354,472 Water use (L/day):b 80 60
Sewage collection rate (%):c 65 Amount of effluent (m3/day):A 82,258 13,824 A=a*b*c
Treatment capacity (m3/day)
B:Firle WWTP (conventional+BNR) 128 Treated water quality (BOD) (mg/L) 50
C:Crowborough WWTP (BNR) 36 Treated water quality (BOD) (mg/L) 75D:Hetcliff WWTP (BNR) 2.5 Treated water quality (BOD) (mg/L) 30E:Doonybrook WWTP (stabilization pond) 4 Treated water quality (BOD) (mg/L) 100F:Zengeza WWTP (conventional)
35 Treated water quality (BOD) (mg/L) 31
Untreated sewage (m3/day):X 82,092 13,789 X=A-B-C-D-E-F
Pollution load unit (BOD) (kg/ m3/day) 57,464 9,653 Pollution load (BOD) (ton/year) 20,974 3,523 Total amount of pollution load in the basin after 2009 when Zengeza WWTP was shut down (ton)
188,770 31,709 220,478
Source: JST Note: 1) The population in Harare city and Chitungwiza city is that of 2012.. 2) The quality of water inflow at each WWTP (BOD): 700 mg/L (estimated value in basic design) 3) The quality of discharged water at Zengeza WWTP (BOD): 31 mg/L (measured value on 18 January 2018)
Data Collection Survey on Water Supply and Sewage Sector in Harare City Area in Zimbabwe April 2018
3-15
3.5 Long and mid term planning, management accounting
3.5.1 Long and Mid-term Development Plan
(1) Long-term development plan
The Policy Document that currently states the comprehensive development plan of the City of Harare and the suburban cities is the Harare Integrated Master Plan. The development plan of Chitungwiza Municipality is also included in the plan. According to the explanation of the City of Harare, the master plan was initially formulated as a 20 years plan from 1989, but since the City of Harare hardly developed during the economic stagnation period, the Master Plan remains as the comprehensive mid-term development plan at present. The subsequent long-term development plan is yet to be written however, and as the standings are not aligned among the departments, it is unpredictable when the plan could be announced.
Statements on goals, aims, policies and proposals of the sewerage projects in the master plan can be found in section “2.3 Infrastructure and land development potential” on page 11. However, since this master plan is a comprehensive content covering a wide range of sectors, plans or other details for sewage treatment plants are not individually indicated.
(2) Mid-term dvelopment plan (Service level benchmark)
Aiming at the improvement of the administrative services of the city, local governments have created service level benchmarks based on the guidance of the World Bank. The benchmark sets several indicators for each administrative service and shows the achievement goal and the current situation, as well as the future action plan and financial resources for implementation, based on the situation.
Both the City of Harare and Chitungwiza Municipality have created the benchmark. In addition, Chitungwiza Municipality has prepared an improvement plan with the funding sources for its implementation based on the original data, which is called the SLB PIP. The sewerage budget allocation is basically linking to this.
The SLB PIP on sewerage project (sewage management) is shown in Appendix 1. It shows future improvement plans to challenges which were recognized through the original data. Additionally, the SLB PIP shows the funding source for its implementation. Performance indexes for sewerage service are as follows.
Coverage of toilets, % Coverage of sewerage network services, % Efficiency in collection of sewage, % Adequacy of capacity for treatment of sewage, % Quality of sewage treatment, % Extent of recycling or reuse of sewage, % Efficiency in satisfactory response/reaction to customer complaints, % Efficiency of cost recovery in sewage management, % Efficiency in collection of sewage charges, % Maintenance Coverage ratio, %
3.5.2 Budget Formulation and Outlook
Explanation of the terms of the words used in this report
The words "income", "expenditure", "revenue", "cost" from this section are used in terms of budget and accounting terminology. "Income" and "expenditure" are generally used in budget and cash-based simple bookkeeping financial statements and are both basically cash basis. "Revenue" and "Cost" means double-entry bookkeeping accounting basis on accrual basis, and accounts receivable, uncollected income, accrued expenses, other than cash and are recorded as counterpart accounts. Therefore, even if "revenue" and "cost" are recorded, this does not mean that cash is
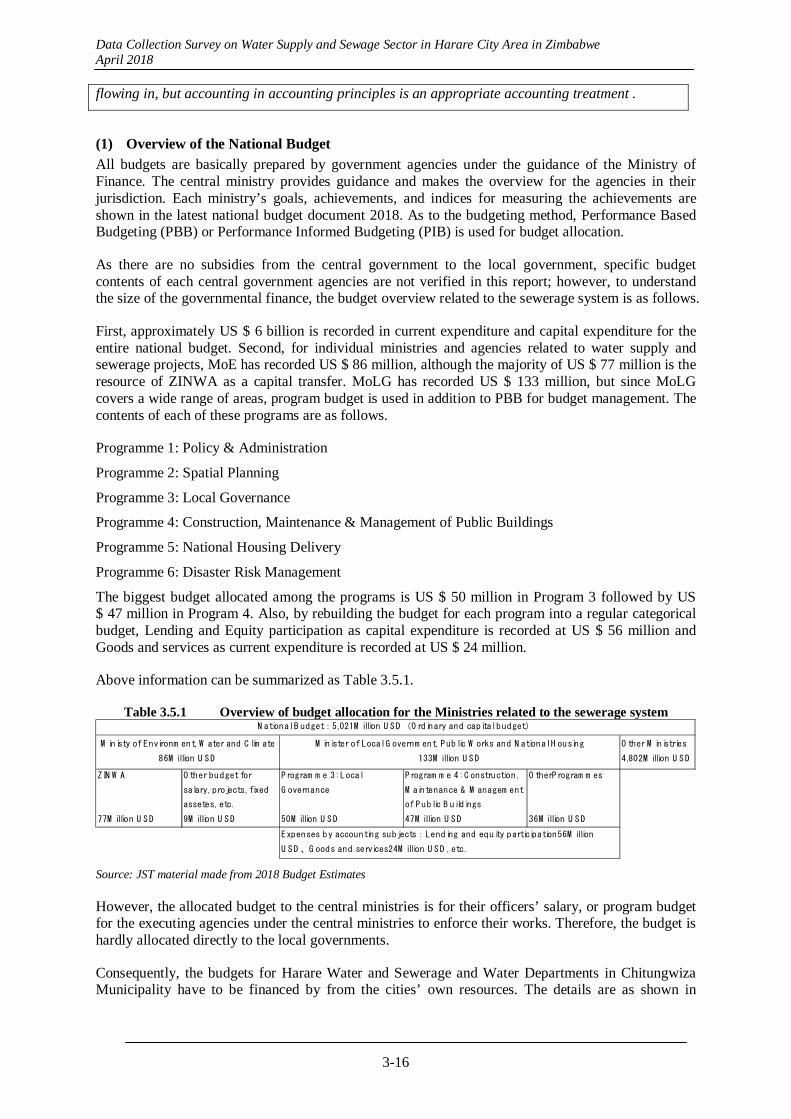
Data Collection Survey on Water Supply and Sewage Sector in Harare City Area in Zimbabwe April 2018
3-16
flowing in, but accounting in accounting principles is an appropriate accounting treatment .
(1) Overview of the National Budget
All budgets are basically prepared by government agencies under the guidance of the Ministry of Finance. The central ministry provides guidance and makes the overview for the agencies in their jurisdiction. Each ministry’s goals, achievements, and indices for measuring the achievements are shown in the latest national budget document 2018. As to the budgeting method, Performance Based Budgeting (PBB) or Performance Informed Budgeting (PIB) is used for budget allocation.
As there are no subsidies from the central government to the local government, specific budget contents of each central government agencies are not verified in this report; however, to understand the size of the governmental finance, the budget overview related to the sewerage system is as follows.
First, approximately US $ 6 billion is recorded in current expenditure and capital expenditure for the entire national budget. Second, for individual ministries and agencies related to water supply and sewerage projects, MoE has recorded US $ 86 million, although the majority of US $ 77 million is the resource of ZINWA as a capital transfer. MoLG has recorded US $ 133 million, but since MoLG covers a wide range of areas, program budget is used in addition to PBB for budget management. The contents of each of these programs are as follows.
Programme 1: Policy & Administration
Programme 2: Spatial Planning
Programme 3: Local Governance
Programme 4: Construction, Maintenance & Management of Public Buildings
Programme 5: National Housing Delivery
Programme 6: Disaster Risk Management
The biggest budget allocated among the programs is US $ 50 million in Program 3 followed by US $ 47 million in Program 4. Also, by rebuilding the budget for each program into a regular categorical budget, Lending and Equity participation as capital expenditure is recorded at US $ 56 million and Goods and services as current expenditure is recorded at US $ 24 million.
Above information can be summarized as Table 3.5.1.
Table 3.5.1 Overview of budget allocation for the Ministries related to the sewerage system
O ther M inistries
4,802M illion U S D
ZIN W A
77M illion U S D
O ther budget for
salary, projects, fixed
assetes, etc.
9M illion U S D
P rogram m e 3: Local
G overnance
50M illion U S D
P rogram m e 4: C onstruction,
M aintenance & M anagem ent
of P ublic B uildings
47M illion U S D
O therP rogram m es
36M illion U S D
M inisty of Environm ent, W ater and C lim ate
86M illion U S D
M inister of Local G overnm ent, P ublic W orks and N ational H ousing
133M illion U S D
Expenses by accounting subjects:Lending and equity participation56M illion
U S D 、G oods and services24M illion U S D , etc.
N ational B udget:5,021M illion U S D (O rdinary and capital budget)
Source: JST material made from 2018 Budget Estimates However, the allocated budget to the central ministries is for their officers’ salary, or program budget for the executing agencies under the central ministries to enforce their works. Therefore, the budget is hardly allocated directly to the local governments.
Consequently, the budgets for Harare Water and Sewerage and Water Departments in Chitungwiza Municipality have to be financed by from the cities’ own resources. The details are as shown in
Data Collection Survey on Water Supply and Sewage Sector in Harare City Area in Zimbabwe April 2018
3-17
Appendix 1. The city of Harare and Chitungwiza Municipality manage their respective budgets, and the budgets have to be eventually approved by MoLG.
(2) Local Government Budget around the Water Supply and Sewerage Projects
1) Harare Water
In Harare Water, the budget is divided into an ordinary budget and a capital budget. The budget that integrates both is shown in the last chapter of the current budget. The current budget consists of the individual budgets for each water supply and sewerage facility. Then, common expenses and income are added to it as the final budget. The 2017 budget of Firle sewage treatment plant where is operated both the conventional system and BNR is shown in Appendix 1.
The Firle Sewage Treatment Plant in 2017 operated two conventional systems and three BNRs, and the budget size is US $ 4.8 million. Among these, the electricity expenditure budget is the largest, accounting for US $ 0.9 million. Regarding of chemicals, only US $ 0.08 million has been recorded, but within the overall budget of Harare Water, US $ 17 million for water, and US $ 0.2 million for sewage are recorded.
Although the budget book shows the budget of the previous year and the estimated amount of settlement, this settlement has a wide gap from the actual settlement. This point will be examined in Chapter 4.
2) Chitungwiza Municipality
Chitungwiza Municipality makes the city budget by integrating the budget of each sector. The sewerage system manages its individual budget plan. The sewerage budget of Chitungwiza municipality is shown in Appendix 1.
The first page shows the cost budget whereas the second page shows the total budget of the current account payment and the fund resource of income and capital expenditure added.
Among the trends in this budget, points to consider are as follows.
The toll revenue budget has increased significantly from 2.6 million US dollars to 4.4 million US dollars in 2015-2016. This seems to reflect that the price rose significantly from 4.51 US dollars / household to 7.6 US dollars / household since 2016, as described below.
About personnel expenses, the rehabilitation of the sprinkled-bed method was completed in 2016, and despite the fact that the sewage treatment plant had not been in operation until 2014, labor costs were halved between 2014 and 2015 are doing. Therefore, it is thought that until 2014 he was hiring surplus personnel. Also, in 2016, when the sprinkling filter bed system was in operation, the same amount as the personnel expenses in 2015 was accrued, which means that the staff worked efficiently, or by the operation of surplus personnel, personnel It can be thought that it could be maintained without increasing.
Operating and maintenance expenses are posted from 2016. This is thought to reflect the fact that the sprinkling filter bed system was restarted in 2016.
Although reimbursement by ZimFund is recorded as a revenue budget on the budget, the same amount is calculated as rehabilitation expenditure and can not be diverted between expense items. In this regard, according to an interview with the city of Chitunggiza, ZimFund pays directly to the merchant, so that cash etc. payment management of this part can not be done.
Regarding the repair cost budget, it is newly added from 2016, and it is considered to correspond to the BNR restart of the same year. However, in 2017 it has halved.
As an overall consideration, the revenue in the budget is calculated on an accrual basis and the cost is calculated on a cash basis, so it becomes a calculation that generates a large residual income. Originally, in the present situation where accrued revenues are large, if the amount of cash proceeds is calculated and the expenditure corresponding to that amount is taken as the budget, such a
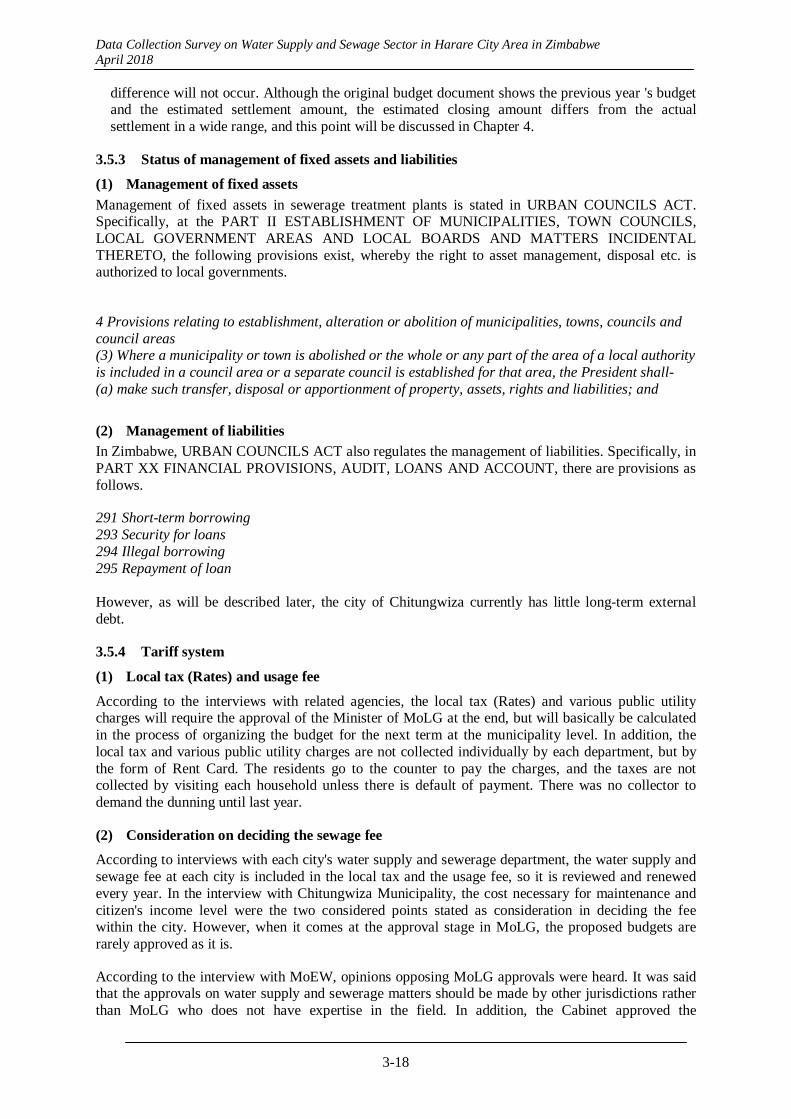
Data Collection Survey on Water Supply and Sewage Sector in Harare City Area in Zimbabwe April 2018
3-18
difference will not occur. Although the original budget document shows the previous year 's budget and the estimated settlement amount, the estimated closing amount differs from the actual settlement in a wide range, and this point will be discussed in Chapter 4.
3.5.3 Status of management of fixed assets and liabilities
(1) Management of fixed assets
Management of fixed assets in sewerage treatment plants is stated in URBAN COUNCILS ACT. Specifically, at the PART II ESTABLISHMENT OF MUNICIPALITIES, TOWN COUNCILS, LOCAL GOVERNMENT AREAS AND LOCAL BOARDS AND MATTERS INCIDENTAL THERETO, the following provisions exist, whereby the right to asset management, disposal etc. is authorized to local governments.
4 Provisions relating to establishment, alteration or abolition of municipalities, towns, councils and council areas (3) Where a municipality or town is abolished or the whole or any part of the area of a local authority is included in a council area or a separate council is established for that area, the President shall- (a) make such transfer, disposal or apportionment of property, assets, rights and liabilities; and
(2) Management of liabilities
In Zimbabwe, URBAN COUNCILS ACT also regulates the management of liabilities. Specifically, in PART XX FINANCIAL PROVISIONS, AUDIT, LOANS AND ACCOUNT, there are provisions as follows.
291 Short-term borrowing 293 Security for loans 294 Illegal borrowing 295 Repayment of loan However, as will be described later, the city of Chitungwiza currently has little long-term external debt.
3.5.4 Tariff system
(1) Local tax (Rates) and usage fee
According to the interviews with related agencies, the local tax (Rates) and various public utility charges will require the approval of the Minister of MoLG at the end, but will basically be calculated in the process of organizing the budget for the next term at the municipality level. In addition, the local tax and various public utility charges are not collected individually by each department, but by the form of Rent Card. The residents go to the counter to pay the charges, and the taxes are not collected by visiting each household unless there is default of payment. There was no collector to demand the dunning until last year.
(2) Consideration on deciding the sewage fee
According to interviews with each city's water supply and sewerage department, the water supply and sewage fee at each city is included in the local tax and the usage fee, so it is reviewed and renewed every year. In the interview with Chitungwiza Municipality, the cost necessary for maintenance and citizen's income level were the two considered points stated as consideration in deciding the fee within the city. However, when it comes at the approval stage in MoLG, the proposed budgets are rarely approved as it is.
According to the interview with MoEW, opinions opposing MoLG approvals were heard. It was said that the approvals on water supply and sewerage matters should be made by other jurisdictions rather than MoLG who does not have expertise in the field. In addition, the Cabinet approved the
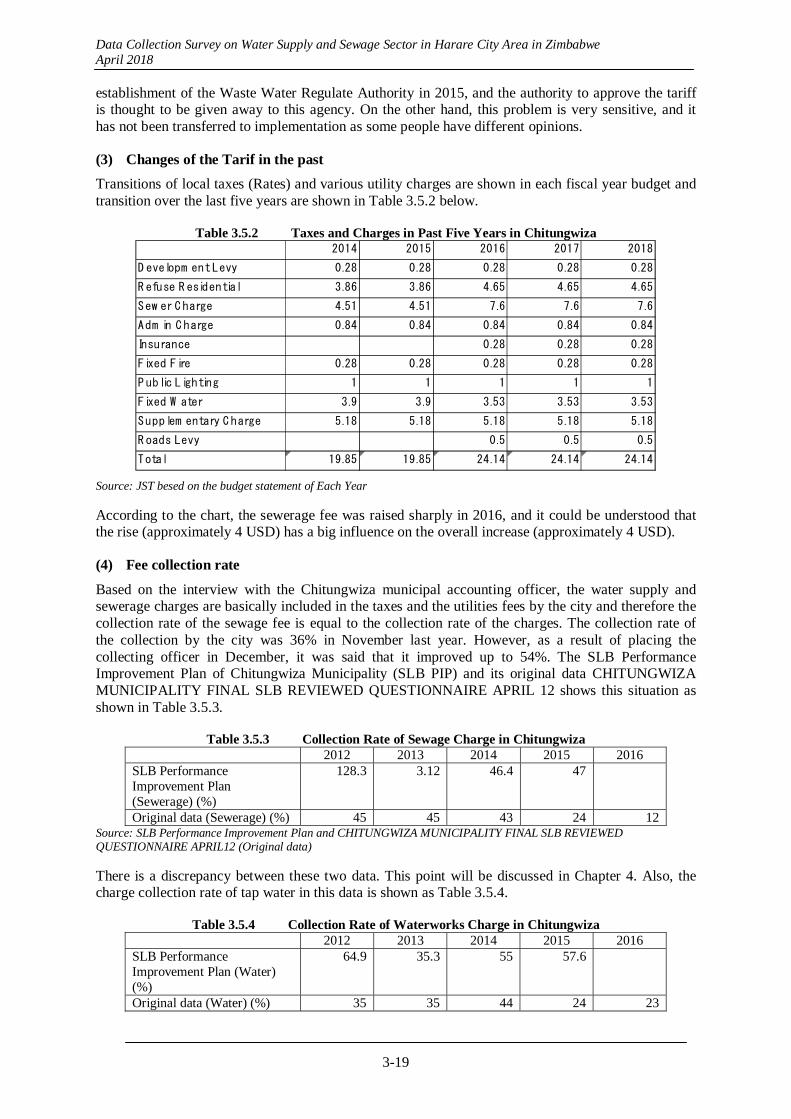
Data Collection Survey on Water Supply and Sewage Sector in Harare City Area in Zimbabwe April 2018
3-19
establishment of the Waste Water Regulate Authority in 2015, and the authority to approve the tariff is thought to be given away to this agency. On the other hand, this problem is very sensitive, and it has not been transferred to implementation as some people have different opinions.
(3) Changes of the Tarif in the past
Transitions of local taxes (Rates) and various utility charges are shown in each fiscal year budget and transition over the last five years are shown in Table 3.5.2 below.
Table 3.5.2 Taxes and Charges in Past Five Years in Chitungwiza 2014 2015 2016 2017 2018
D evelopm ent Levy 0.28 0.28 0.28 0.28 0.28
R efuse R esidential 3.86 3.86 4.65 4.65 4.65
Sew er C harge 4.51 4.51 7.6 7.6 7.6
Adm in C harge 0.84 0.84 0.84 0.84 0.84
Insurance 0.28 0.28 0.28
Fixed Fire 0.28 0.28 0.28 0.28 0.28
P ublic Lighting 1 1 1 1 1
Fixed W ater 3.9 3.9 3.53 3.53 3.53
Supplem entary C harge 5.18 5.18 5.18 5.18 5.18
R oads Levy 0.5 0.5 0.5
Total 19.85 19.85 24.14 24.14 24.14 Source: JST besed on the budget statement of Each Year According to the chart, the sewerage fee was raised sharply in 2016, and it could be understood that the rise (approximately 4 USD) has a big influence on the overall increase (approximately 4 USD).
(4) Fee collection rate
Based on the interview with the Chitungwiza municipal accounting officer, the water supply and sewerage charges are basically included in the taxes and the utilities fees by the city and therefore the collection rate of the sewage fee is equal to the collection rate of the charges. The collection rate of the collection by the city was 36% in November last year. However, as a result of placing the collecting officer in December, it was said that it improved up to 54%. The SLB Performance Improvement Plan of Chitungwiza Municipality (SLB PIP) and its original data CHITUNGWIZA MUNICIPALITY FINAL SLB REVIEWED QUESTIONNAIRE APRIL 12 shows this situation as shown in Table 3.5.3.
Table 3.5.3 Collection Rate of Sewage Charge in Chitungwiza 2012 2013 2014 2015 2016 SLB Performance Improvement Plan (Sewerage) (%)
128.3 3.12 46.4 47
Original data (Sewerage) (%) 45 45 43 24 12 Source: SLB Performance Improvement Plan and CHITUNGWIZA MUNICIPALITY FINAL SLB REVIEWED QUESTIONNAIRE APRIL12 (Original data) There is a discrepancy between these two data. This point will be discussed in Chapter 4. Also, the charge collection rate of tap water in this data is shown as Table 3.5.4.
Table 3.5.4 Collection Rate of Waterworks Charge in Chitungwiza 2012 2013 2014 2015 2016 SLB Performance Improvement Plan (Water) (%)
64.9 35.3 55 57.6
Original data (Water) (%) 35 35 44 24 23

Data Collection Survey on Water Supply and Sewage Sector in Harare City Area in Zimbabwe April 2018
3-20
Source: SLB Performance Improvement Plan and CHITUNGWIZA MUNICIPALITY FINAL SLB REVIEWED QUESTIONNAIRE APRIL12 (Original data) According to the interview with Harare Water, the collection rate of City of Harare was about 50%, but SLB (Original data) of City of Harare shows the changes asin Table 3.5.5.
Table 3.5.5 Collection Rate of Woterworks and Sewage Charge in Harare 2012 2013 2014 2015 2016 Efficiency in collection of sewage charges
58.7 52.6 31.6 47.9 33.3
Efficiency in collection of water supply-related charges
35.2 35.2 43.9 38.1 45.3
Source: Original data of SLB by City of Harare
3.6 Financial Situation
3.6.1 Financial accounting
3.6.1.1 Financial situation in Chitungwiza
(1) System, accounting standards, and process of preparing financial statements
The highest level of legislation stipulating the fiscal management, budget, and accounting of local governments including Chitungwiza Municipality is the Public Finance Management Act of 2009 (Cap. 22: 19 PUBLIC FINANCE MANAGEMENT). In this Act, the preparation of the financial statements is shown in Part 4 as below.
PART IV FINANCIAL STATEMENTS
32. Preparation and reporting of annual financial statements by Ministries.
33. Preparation and reporting of quarterly financial statements.
34. Preparation and reporting of monthly financial statements.
35. Consolidation of annual financial statements.
36. Content of financial statements.
37. Financial statements and budgets to comply with generally accepted accounting
practice.
38. Publishing of reports on financial statements.
Specific standards on the preparation based on the law above are adopted using accrual basis International Public Sector Accounting Standards (IPSAS) and International Financial Reporting Standards (IFRS).
According to interviews with the city's accounting officer and MoLG, the current accounting system used is one of three accounting systems that MoLG admits (SAGE Pastel: a system that is widespread in African countries). However, before this accounting system was introduced in 2013, accounting was done by Excel with manual input.
Preparing financial statements by these standards and the accounting system enabled the city to adopt double entry bookkeeping in accruals basis, and make three statements: Balance Sheet, Income Statement, Cash-flow Statement. In addition, on using this system, the journal entry process for the income, for example, became as follows: At first, when the right of collecting taxes occurs, both accrued income (balance sheet: current assets) and city tax revenue (income statement: revenue) should be recorded at the amount of the collected inherently before collecting them from residents. Then, when some of the actual accrued income has been collected in cash, some accrued income (balance sheet: current assets) will be transferred to cash deposit (balance sheet: current asset).

Data Collection Survey on Water Supply and Sewage Sector in Harare City Area in Zimbabwe April 2018
3-21
Such journal entry will be booked based on evidence every time a transaction occurs. However, the appropriateness of the financial statement itself will be described in the following section
(2) Reliability of financial statements
1) Policy on reliability on financial statements
In order to ensure the reliability of financial statements, the Public Financial Management Law stipulates internal audits, external audits and others in Chapter 8. This chapter structures as follows.
PART VIII AUDIT
80. Internal auditors.
81. External auditors.
82. Auditor’s report on public entities.
83. Annual reports and audited financial statements.
84. Audit Committees.
According to the interview with the Accounting Director of the Ministry of Finance, Actual practice of audit is as follows. The appropriateness of the city’s financial statements is supposed to be audited by the Auditor - General Office, but because of the lack of human resources in the board of audit, it is outsourced to a private audit corporation. As the auditor of Chitungwiza Municipality, UNICORP, which undertakes a lot of local government audits, has been selected. As for the standards for auditing, International Standards on Auditing (ISA) are used.
2) Independent Auditor’s opinion
In the interview with UNICORP, adverse opinions (The independent auditor cannot guarantee as the financial statement are incorrect) were given for the financial statement from 2009 to 2013 of the Chitungwiza Municipality by the auditor. The major reason for this result is pointed out to be the problem of corruption which influenced all the financial statements incorrectly displayed. On the other hand, the report in 2014 was given qualified opinion (correctly indicated except for some exclusion items) as audit report, and improvements were seen. The report for 2015 is currently under audit. In the second dispatch, it was confirmed that the financial report on fiscal 2016 is currently still being prepared by the accounting department. It is scheduled to be audited after auditing the financial statements for 2015. Financial statements for 2017 are currently under compliation. In this respect, the reporting situation of Chitungwiza Municipality is significantly delayed as financial statements are necessary to be composed within 90 days after the end of the fiscal year, and the audited financial statements should be handed in to MoLG.
The scope of the audit does not include the adequacy of the budget amount nor the comparison with the budget record.
(3) Financial statements for the past four years (Municipality level)
Financial statements of the Chitungwiza Municipality over the past four years with a comparable style for each fiscal year, the balance sheet, income statement and cash flow statement are presented in Appendix 1.
(4) Considerations to use financial statements (Municipality level)
1) How to use the financial statements (Municipality level)
One of the ultimate goals regarding the finance part of the study is to confirm that, if the BNR is restarted, it will be able to bear the appropriate operating and maintenance costs in the future. To that end, at least, it is necessary to verify the occurrence of expenses in situations where the conventional system is in operation and check the tariff collection status after a substantial rate increase in 2016. Then, it would be possible to consider the future financial margin.
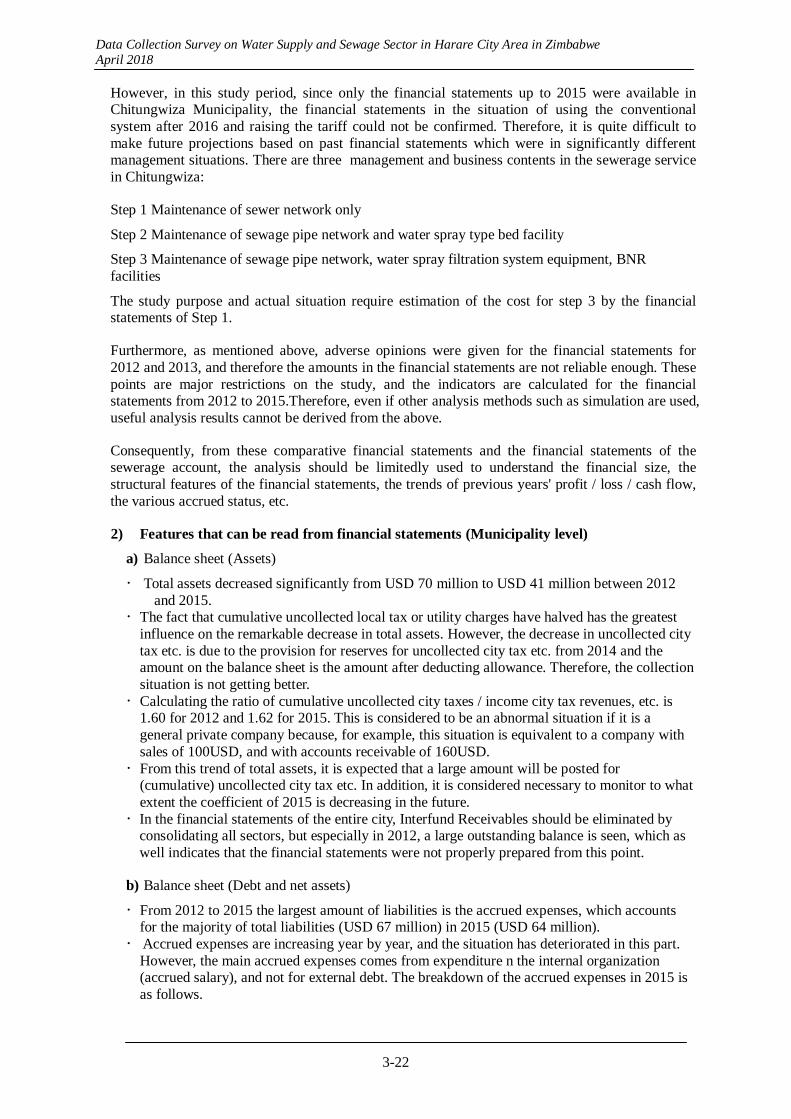
Data Collection Survey on Water Supply and Sewage Sector in Harare City Area in Zimbabwe April 2018
3-22
However, in this study period, since only the financial statements up to 2015 were available in Chitungwiza Municipality, the financial statements in the situation of using the conventional system after 2016 and raising the tariff could not be confirmed. Therefore, it is quite difficult to make future projections based on past financial statements which were in significantly different management situations. There are three management and business contents in the sewerage service in Chitungwiza:
Step 1 Maintenance of sewer network only
Step 2 Maintenance of sewage pipe network and water spray type bed facility
Step 3 Maintenance of sewage pipe network, water spray filtration system equipment, BNR facilities
The study purpose and actual situation require estimation of the cost for step 3 by the financial statements of Step 1.
Furthermore, as mentioned above, adverse opinions were given for the financial statements for 2012 and 2013, and therefore the amounts in the financial statements are not reliable enough. These points are major restrictions on the study, and the indicators are calculated for the financial statements from 2012 to 2015.Therefore, even if other analysis methods such as simulation are used, useful analysis results cannot be derived from the above.
Consequently, from these comparative financial statements and the financial statements of the sewerage account, the analysis should be limitedly used to understand the financial size, the structural features of the financial statements, the trends of previous years' profit / loss / cash flow, the various accrued status, etc.
2) Features that can be read from financial statements (Municipality level)
a) Balance sheet (Assets)
Total assets decreased significantly from USD 70 million to USD 41 million between 2012 and 2015.
The fact that cumulative uncollected local tax or utility charges have halved has the greatest influence on the remarkable decrease in total assets. However, the decrease in uncollected city tax etc. is due to the provision for reserves for uncollected city tax etc. from 2014 and the amount on the balance sheet is the amount after deducting allowance. Therefore, the collection situation is not getting better.
Calculating the ratio of cumulative uncollected city taxes / income city tax revenues, etc. is 1.60 for 2012 and 1.62 for 2015. This is considered to be an abnormal situation if it is a general private company because, for example, this situation is equivalent to a company with sales of 100USD, and with accounts receivable of 160USD.
From this trend of total assets, it is expected that a large amount will be posted for (cumulative) uncollected city tax etc. In addition, it is considered necessary to monitor to what extent the coefficient of 2015 is decreasing in the future.
In the financial statements of the entire city, Interfund Receivables should be eliminated by consolidating all sectors, but especially in 2012, a large outstanding balance is seen, which as well indicates that the financial statements were not properly prepared from this point.
b) Balance sheet (Debt and net assets)
From 2012 to 2015 the largest amount of liabilities is the accrued expenses, which accounts for the majority of total liabilities (USD 67 million) in 2015 (USD 64 million).
Accrued expenses are increasing year by year, and the situation has deteriorated in this part. However, the main accrued expenses comes from expenditure n the internal organization (accrued salary), and not for external debt. The breakdown of the accrued expenses in 2015 is as follows.
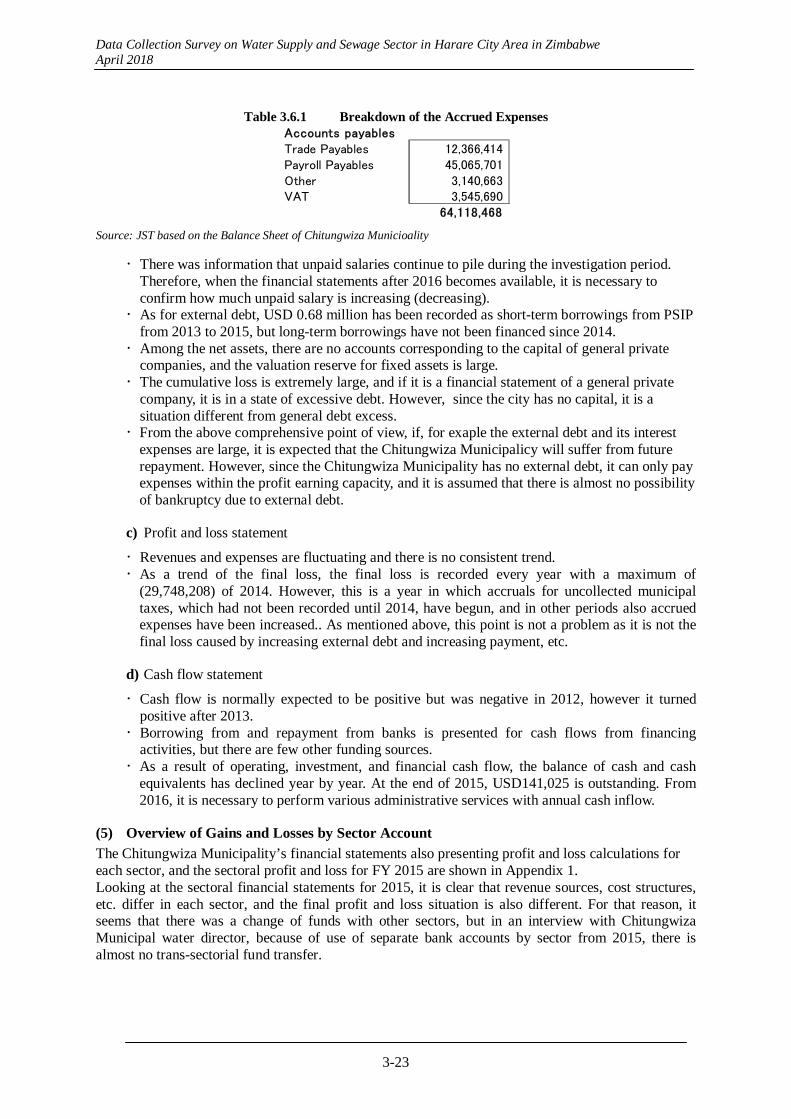
Data Collection Survey on Water Supply and Sewage Sector in Harare City Area in Zimbabwe April 2018
3-23
Table 3.6.1 Breakdown of the Accrued Expenses Accounts payablesTrade Payables 12,366,414 Payroll Payables 45,065,701 Other 3,140,663 VAT 3,545,690
64,118,468 Source: JST based on the Balance Sheet of Chitungwiza Municioality
There was information that unpaid salaries continue to pile during the investigation period. Therefore, when the financial statements after 2016 becomes available, it is necessary to confirm how much unpaid salary is increasing (decreasing).
As for external debt, USD 0.68 million has been recorded as short-term borrowings from PSIP from 2013 to 2015, but long-term borrowings have not been financed since 2014.
Among the net assets, there are no accounts corresponding to the capital of general private companies, and the valuation reserve for fixed assets is large.
The cumulative loss is extremely large, and if it is a financial statement of a general private company, it is in a state of excessive debt. However, since the city has no capital, it is a situation different from general debt excess.
From the above comprehensive point of view, if, for exaple the external debt and its interest expenses are large, it is expected that the Chitungwiza Municipalicy will suffer from future repayment. However, since the Chitungwiza Municipality has no external debt, it can only pay expenses within the profit earning capacity, and it is assumed that there is almost no possibility of bankruptcy due to external debt.
c) Profit and loss statement
Revenues and expenses are fluctuating and there is no consistent trend. As a trend of the final loss, the final loss is recorded every year with a maximum of
(29,748,208) of 2014. However, this is a year in which accruals for uncollected municipal taxes, which had not been recorded until 2014, have begun, and in other periods also accrued expenses have been increased.. As mentioned above, this point is not a problem as it is not the final loss caused by increasing external debt and increasing payment, etc.
d) Cash flow statement
Cash flow is normally expected to be positive but was negative in 2012, however it turned positive after 2013.
Borrowing from and repayment from banks is presented for cash flows from financing activities, but there are few other funding sources.
As a result of operating, investment, and financial cash flow, the balance of cash and cash equivalents has declined year by year. At the end of 2015, USD141,025 is outstanding. From 2016, it is necessary to perform various administrative services with annual cash inflow.
(5) Overview of Gains and Losses by Sector Account
The Chitungwiza Municipality’s financial statements also presenting profit and loss calculations for each sector, and the sectoral profit and loss for FY 2015 are shown in Appendix 1. Looking at the sectoral financial statements for 2015, it is clear that revenue sources, cost structures, etc. differ in each sector, and the final profit and loss situation is also different. For that reason, it seems that there was a change of funds with other sectors, but in an interview with Chitungwiza Municipal water director, because of use of separate bank accounts by sector from 2015, there is almost no trans-sectorial fund transfer.
Data Collection Survey on Water Supply and Sewage Sector in Harare City Area in Zimbabwe April 2018
3-24
In terms of profit, income from each sector is derived from each business. In terms of cost, protective clothing, fuel costs and repair costs are outstanding in sewerage accounts compared to other sectors. Protective clothing was against cholera that occurred in 2015.
3.6.1.2 Financial situation for sewerage service in Chitungwiza
(1) Financial statement over the past 5 years
The financial situation of Zengeza Sewage Treatment Plant is equivalent to the sewerage account of Chitungwiza Municipality. The income statement and balance sheet of the sewerage account with organizing in chronological order, and without unnecessary columns are shown in Appendix 1.
(2) Cash-basis Income statement
The most important thing to keep in mind when reading the financial statements of Chitungwiza Municipality including sewerage accounts is that these financial statements are prepared on an accrual basis. Although preparing financial statement based on accrual basis is an appropriate accounting from the global trend. On the other hand, the actual situation is difficult to understand if there are many credit transactions because income on a cash basis does not match revenues on the income statement. If the cash flow statement is made only for sewerage account, this problem will be solved to a certain extent. However, cash flows related to sales are calculated collectively from revenues and expenses in the cash flow statements, so it is impossible to determine how much each income and expenditure is occurring.
Coming back to the purpose of this report, the following calculation rebuilding accrual based revenue to rough cash based income is necessary to grasp the actual cash income and the spending on each item.
1) Sales
The cash flow on sales can be calculated by the following formula.
Cash collection amount related to sales= balance of account receivables at the end of previous fiscal year + accrual sales in the current fiscal year - balance of account receivables at the end of the current fiscal year
If this formula is applied to uncollected revenues and sales for each fiscal year, it can be calculated as follows.
2013: Cash collection on sales = 6,070,692 + 3, 137, 305-3, 575, 222 = 5, 632, 775
2014: Cash collection on sales = 3,575,222 + 2,342,872 - 6,361,431 = -443,337
2015: Cash collection on sales = 6,361,431 + 3,173,258 - 9,063,799 = 470,890
This calculation highlights that earnings on income statement based on accrual basis seems fine, but actually it was corroborated with much smaller cash and cash equivalents.
Among above results, 2014 is difficult to understand since it is negative amount; however, the sewerage account has lending, and borrowing with other sector accounts (Interfund Receivables). There was lending to other accounts in 2013 but then turned to borrowing from 2014. Therefore, in order to reflect the effect of increase or decrease of the sales account on the cash collection, it is necessary to add the following calculation.
Revised Sales Revenue = Interfund Receivables Balance of previous Fiscal Year End + Cash Collection Pertaining to Sales – Interfund Receivables Balance of Current Year End
Applying this calculation to each year, sales income is revised as follows.
2013: Revised cash collection amount on sales = 745, 901 + 5, 632, 775 - 1, 089, 064 = 5, 289, 612
Data Collection Survey on Water Supply and Sewage Sector in Harare City Area in Zimbabwe April 2018
3-25
2014: Revised cash collection amount on sales = 1,089,064 + (- 443,337) - (-1, 289,443) = 1,935,170
2015: Revised cash collection amount on sales = (- 1,289,443) +470,890 - (- 1,497,305) = 678,752
From this result, sales seems to decline sharply from 2013 to 2014 and flat in 2015 in the income statement based on accrual basis, but on a cash basis, it is understood that the income from 2013 is halved every year.
2) Salary
Accrued expense accounts including accrued salaries are increasing annually, although the breakdown is unknown. However, in sewerage accounts, payroll payable has not occurred, so the amount recorded in employee expense is considered to be equal to expenditure.
3) Other expenses
Trade payable on other expenses is decreasing annually. Actual expenditure is supposed to be bigger than the expenses. Unpaid VAT is increasing year by year, and the reason is thought to be VAT not being paid.
(3) Points to be noted in financial statements (sewerage account)
A large amount of final deficit was presented in 2014 on the income statement. This was due to the impact on provision and fixed asset depreciation, although there were no records on this subject until 2013, but started recording from 2014(4,870,295 USD in 2014, 3,068,060 in 2015 USD).
As a result, the final loss seems to be getting worse in 2014; however, it would have actually improved if the same accounting procedure (records without provision and depreciation) before 2013 are used in 2014 and 2015. In addition, the accounting system has also improved qualitatively as provision and depreciation are necessary in double entry bookkeeping,
3.6.1.3 Financial statements in related organizations
1) Water supply and sewerage financial situation of the City of Harare
The water supply and sewerage financial statement of the City of Harare is managed by Harare Water, but unlike the budget, the water supply and sewage systems are not classified. It is reported as one account to the City of Harare. Therefore, the calculation of the cost of sewerage alone is not possible, although according to the interview with Harare Water, the policy allocates the budget of 45% for water, 55% for other sectors.
2) Financial status of other organizations
The financial source of the expenditure on Zengeza Sewage Treatment Plant is only tariff income and donors’ contribution in the past 5 years. As there are no plans of grants and subsidies from the central government to the local government in the future, financial statements are not obtained from any central government agencies. In addition, Zengeza Sewage Treatment Plant cannot spend expenses by themselves as they don’t own cash. Thus, financial management is not operated in Zengeza, and the city’s accounting officer is in charge of recording accounts including the sewerage account.
3.7 Public-Private Partnership, Privatization, and Corporation
3.7.1 Overview
According to the interview to the Ministry of Finance, the most important movement in recent Public-Private Partnership (PPP) movement is the JOINT VENTURES ACT. Joint Venture department is placed in the Ministry of Finance to promote this Act. Before this act was made, PPP was done on the basis of “PPP Guideline 2004”; however, no department was placed in charge for PPP.
Data Collection Survey on Water Supply and Sewage Sector in Harare City Area in Zimbabwe April 2018
3-26
The past major PPP projects in Zimbabwe are; Limpopo Toll Bridge, Beitbridge, Bulawayo Railway, and Mutare-Plumtree Highway. The methodology of these were Build-Operation-Transfer(BOT), though Build Transfer(BT) was used for the Toll Bridge project. There are few small PPP other than these examples, but none are done in the sewage sector in Zimbabwe so far.
The most PPP related sewage business in Chitungwiza is the Chitungwiza Sewage PPP Project promoted by Sesani inc., an engineering company in Zimbabwe. If this PPP happens, the sewage system would be operated by the SPV within PPP. The details of the project will be written in the next chapter.
Regarding privatization or other reform, there were several discussions or rumors that were spoken in MoLG, MoF, or Chitungwiza Municipality; however, there were no established plans. The sewage sector has no simple privatization plans in particular. According to MoLG’s explanation, there are sectors which match their character to privatization, and sewage sector was said to be a sector which shouldn’t be privatized in the content of counter measure for small income households.
3.7.2 Potential PPP project in Chitungwiza
Sesani has issued a feasibility study report in July 2017, including the exhaustive content of Sesani's water supply and sewerage PPP project. Based on the report and interview, this section will show (a) the scope of the project included in PPP, (b) operation by the PPP scheme, and (c) financial plan, mainly focusing on sewage treatment plants, especially BNR. Although Sesani has no experience of similar PPP in the past in Zimbabwe, the main members have work experience at a major UK construction company (Balfour Beatty and others) and the project is designed based on their PPP experience there.
1) Scope of projects included in PPP
In the PPP proposed by Sesani, the following repairs and constructions on the facilities are included.
Project 1 - PE and emergency repairs and metering
Project 3 - New transmission mains and water storage
Project 5 - Muda Dam and Pipeline, plus Bulk Supply transfer
Project 6 - Offices and Workshops
Approximately $ 176 million (excluding interest on assets inclusion) is expected as invested capital to conduct these activities.
The largest amount of funds required among the components is the construction of Muda dam and the pipeline construction to the Prince Edward water treatment plant, estimating USD 128 million. Muda dam was designed back in 1995, but was a concept that didn’t happen for the lack of funds. Chitungwiza Municipality will be able to have its own water source if Muda dam is constructed, and the environment of the water supply will be significantly improved.
However, the construction of water purification plants is not included in this PPP. Therefore, even if Mudadam is constructed, the raw water of the dam is assumed to be sold, and sent to the Prince Edward water treatment plant, and then purchased, and sent to Chitungwiza Municipality after processed.
Although the sewerage fee collection and maintenance are included in this PPP, the plans are formulated under the premise of using conventional plant system. Therefore, the renovation of BNR is not included in the plan. However, if BNR is rehabilitated with funds other than PPP, maintenance and management, and fee collection of BNR will also be included in the PPP scheme. All Plans including a part of the financial plan will be changed if this happens.

Data Collection Survey on Water Supply and Sewage Sector in Harare City Area in Zimbabwe April 2018
3-27
2) Operation by PPP scheme
The PPP is assumed to adopt BOT, so the operation of water supply and sewerage service will be run separately from municipal administration by establishing SPV (Chitungwiza water company). After constructing the assets intended to be PPP, SPV will provide services using the assets, and will be transferred to the city after 25 years of operation. The services of existing water supply and sewerage facilities is provided and maintained with using the assets, but the possession of the assets themselves will not change from the municipality and the related liabilities will not be transferred. The method to raise funds will be non-recourse loan. Providing services, making interest payments, and repaying loan are done only by revenues rose from project schemes.
The role of Chitungwiza Municipality during PPP implementation is as follows.
· Setting policy
· Provision on existing water and sanitation facilities.
· Transfer of skilled and experienced workforce from existing water and sanitation division.
· Provision of customer database.
3) Financial plan
The important points on PPP from the financial point of view is the expected yield of investors and the charge setting. As for the expected yields of investors, the loan portion is set as 8%, the stock portion as mezzanine, and the non-voting preferred stock as 15%.
The fee setting is calculated as shown in Table 3.7.1.
Table 3.7.1 Initial Tariff Settings under Chitungwiza PPP
Source: CHITUNGWIZA WATER COMPANY - SPV FEASIBILITY STUDY, Sesani, 2017)
The tariff collection rate is expected to be 100% due to the prepaid system. Also, although VAT needs to be paid, corporate tax will be tax exempted.
Various grounds for calculations performed by Sesani, detailed financial plans including assumptions, calculation processes, etc., and financial schedule are included in Appendix 1.
Data Collection Survey on Water Supply and Sewage Sector in Harare City Area in Zimbabwe April 2018
4-1
CHAPTER 4 CHALLENGES IN SEWERAGE WORKS IN CHITUNGWIZA
4.1 Challenges on Institution and Organization
1) Water Supply and Sewerage Fees and Allocation
The current Chitungwiza city sewer system has massive parts to be repaired, such as damage to pumping stations, rupture of pipelines, shutdown of treatment plants etc.
The cost of repair, operation and maintenance should be fundamentally covered by water and sewerage charges, although the current charge determination system does not take these into consideration. If the users cannot bear the necessary expenses, it is necessary to supplement with local taxes. However, local taxes and various fees are received collectively, and the budget is not allocated in accordance with collection purpose. As a result, sewerage infrastructure is left unrepaired. Therefore, there is a need for a system to properly set the water and sewerage tariff levels and to properly allocate the sewerage budget.
2) Reliable Fee Collection
As mentioned above, the water supply and sewerage fee is received collectively with local taxes and other fees. The collection rate has remained 54% in December 2017 although this is an improvement from 40% before November 2017, thanks to debt collectors. In principle, users are responsible for water supply and sewerage fees, and it is necessary to raise the collection rate from the viewpoint of fairness and securing financial resources. Prepaid meters have already been introduced for electricity supply, and this mode of payment is considered effective as can be seen in Sesani’s proposal. However, it should be carefully planned as there are potential risks in the prepaid system itself as described later in this chapter.
3) Securing the Necessary Personnel
The implementing agency is the sewerage department of Chitungwiza city. It has 72 staff in sewer network maintenance and 93 staffs in the sewage treatment plant.
There are currently 51 maintenance staffs in Zengeza sewage treatment plant, of which 38 operators work in four shifts. These 51 staffs are personnel for the maintenance of the trickling filter facility that is currently running. In the case of BNR operation, 51 personnel is insufficient considering the size of the treatment facility. Hence it is also important to secure personnel and experts for sustainable maintenance and stable operation.
4.2 Technical Challenges
1) Strengthening of the Planning Ability
As the sewage infrastructure has been in place for nearly 50 years since construction, comprehensive inspection, updating or repair is required. It is necessary to clarify the projects to be implemented in the short, medium and long terms based on the current and future population and to present them as a program. As a prerequisite, it is necessary to prepare an integrated plan with the repair program of water supply infrastructure which is the source of sewage, and also to coordinate with the activities by donors. Planning ability is required to make such a plan.
2) Technology Improvement Related to Maintenance
Appropriate maintenance is essential for prolonging the life of the sewage system. Preventive maintenance type management is required as well as minimization of life cycle cost and optimization of budget in order to prevent disruption of the sewage system. Manual preparation and training for this maintenance is necessary. In addition, it is also necessary to build a maintenance database covering the current situation of sewerage facilities, history of accidents , and repair
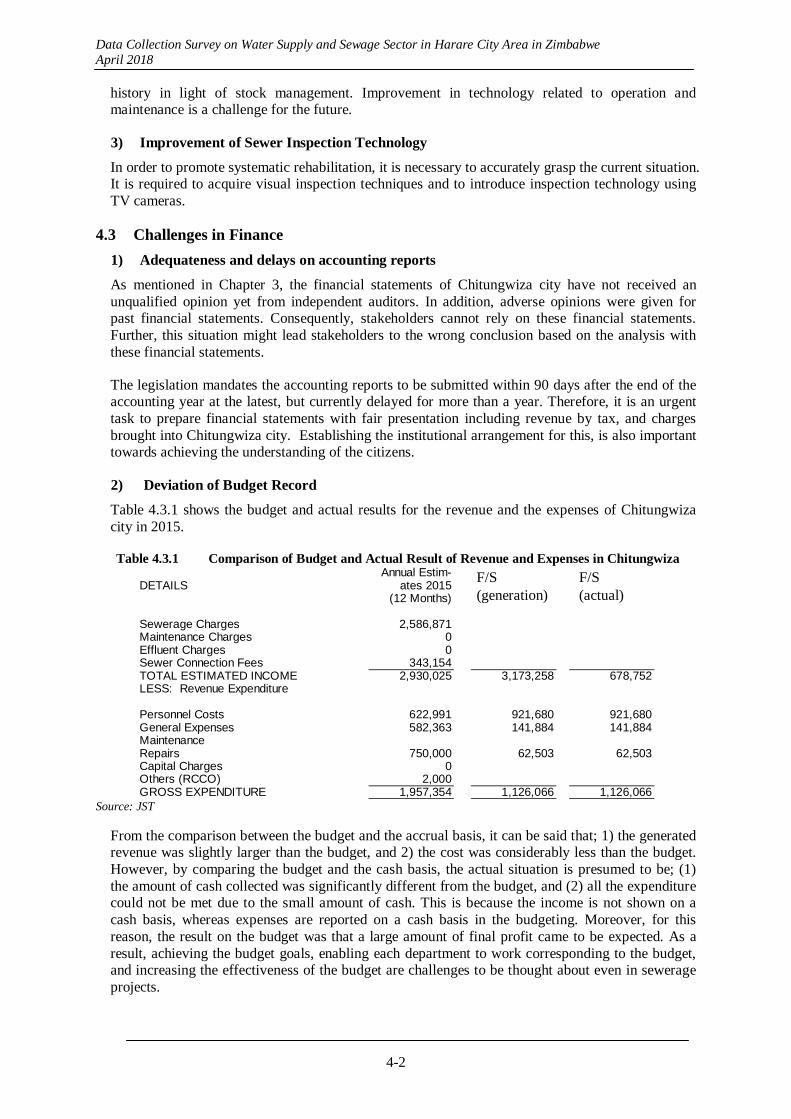
Data Collection Survey on Water Supply and Sewage Sector in Harare City Area in Zimbabwe April 2018
4-2
history in light of stock management. Improvement in technology related to operation and maintenance is a challenge for the future.
3) Improvement of Sewer Inspection Technology
In order to promote systematic rehabilitation, it is necessary to accurately grasp the current situation. It is required to acquire visual inspection techniques and to introduce inspection technology using TV cameras.
4.3 Challenges in Finance
1) Adequateness and delays on accounting reports
As mentioned in Chapter 3, the financial statements of Chitungwiza city have not received an unqualified opinion yet from independent auditors. In addition, adverse opinions were given for past financial statements. Consequently, stakeholders cannot rely on these financial statements. Further, this situation might lead stakeholders to the wrong conclusion based on the analysis with these financial statements.
The legislation mandates the accounting reports to be submitted within 90 days after the end of the accounting year at the latest, but currently delayed for more than a year. Therefore, it is an urgent task to prepare financial statements with fair presentation including revenue by tax, and charges brought into Chitungwiza city. Establishing the institutional arrangement for this, is also important towards achieving the understanding of the citizens.
2) Deviation of Budget Record
Table 4.3.1 shows the budget and actual results for the revenue and the expenses of Chitungwiza city in 2015.
Table 4.3.1 Comparison of Budget and Actual Result of Revenue and Expenses in Chitungwiza Annual Estim-
DETAILS ates 2015(12 Months)
Sewerage Charges 2,586,871Maintenance Charges 0Effluent Charges 0Sewer Connection Fees 343,154TOTAL ESTIMATED INCOME 2,930,025 3,173,258 678,752LESS: Revenue Expenditure
Personnel Costs 622,991 921,680 921,680General Expenses 582,363 141,884 141,884MaintenanceRepairs 750,000 62,503 62,503Capital Charges 0Others (RCCO) 2,000GROSS EXPENDITURE 1,957,354 1,126,066 1,126,066
F/S (発生主義
ベース)F/S (現金ベー
ス)
Source: JST
From the comparison between the budget and the accrual basis, it can be said that; 1) the generated revenue was slightly larger than the budget, and 2) the cost was considerably less than the budget. However, by comparing the budget and the cash basis, the actual situation is presumed to be; (1) the amount of cash collected was significantly different from the budget, and (2) all the expenditure could not be met due to the small amount of cash. This is because the income is not shown on a cash basis, whereas expenses are reported on a cash basis in the budgeting. Moreover, for this reason, the result on the budget was that a large amount of final profit came to be expected. As a result, achieving the budget goals, enabling each department to work corresponding to the budget, and increasing the effectiveness of the budget are challenges to be thought about even in sewerage projects.
F/S(generation)
F/S (actual)
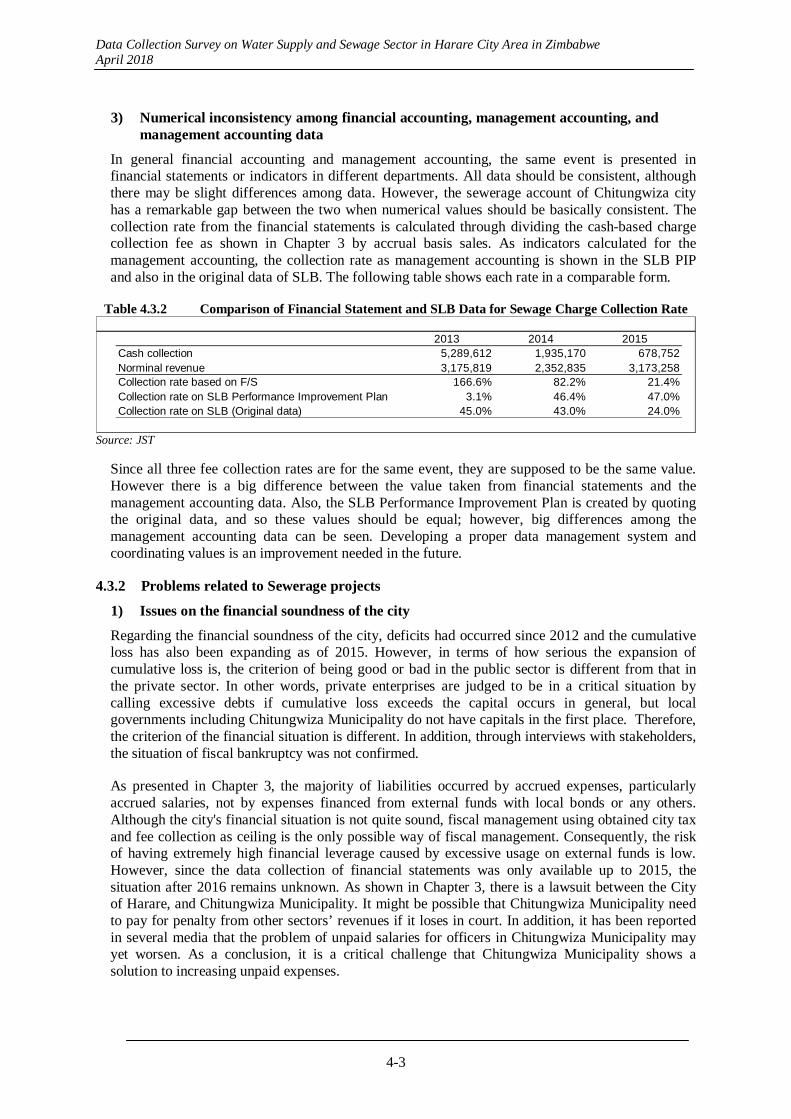
Data Collection Survey on Water Supply and Sewage Sector in Harare City Area in Zimbabwe April 2018
4-3
3) Numerical inconsistency among financial accounting, management accounting, and management accounting data
In general financial accounting and management accounting, the same event is presented in financial statements or indicators in different departments. All data should be consistent, although there may be slight differences among data. However, the sewerage account of Chitungwiza city has a remarkable gap between the two when numerical values should be basically consistent. The collection rate from the financial statements is calculated through dividing the cash-based charge collection fee as shown in Chapter 3 by accrual basis sales. As indicators calculated for the management accounting, the collection rate as management accounting is shown in the SLB PIP and also in the original data of SLB. The following table shows each rate in a comparable form.
Table 4.3.2 Comparison of Financial Statement and SLB Data for Sewage Charge Collection Rate
2013 2014 2015Cash collection 5,289,612 1,935,170 678,752Norminal revenue 3,175,819 2,352,835 3,173,258Collection rate based on F/S 166.6% 82.2% 21.4%Collection rate on SLB Performance Improvement Plan 3.1% 46.4% 47.0%Collection rate on SLB (Original data) 45.0% 43.0% 24.0%
Source: JST
Since all three fee collection rates are for the same event, they are supposed to be the same value. However there is a big difference between the value taken from financial statements and the management accounting data. Also, the SLB Performance Improvement Plan is created by quoting the original data, and so these values should be equal; however, big differences among the management accounting data can be seen. Developing a proper data management system and coordinating values is an improvement needed in the future.
4.3.2 Problems related to Sewerage projects
1) Issues on the financial soundness of the city
Regarding the financial soundness of the city, deficits had occurred since 2012 and the cumulative loss has also been expanding as of 2015. However, in terms of how serious the expansion of cumulative loss is, the criterion of being good or bad in the public sector is different from that in the private sector. In other words, private enterprises are judged to be in a critical situation by calling excessive debts if cumulative loss exceeds the capital occurs in general, but local governments including Chitungwiza Municipality do not have capitals in the first place. Therefore, the criterion of the financial situation is different. In addition, through interviews with stakeholders, the situation of fiscal bankruptcy was not confirmed.
As presented in Chapter 3, the majority of liabilities occurred by accrued expenses, particularly accrued salaries, not by expenses financed from external funds with local bonds or any others. Although the city's financial situation is not quite sound, fiscal management using obtained city tax and fee collection as ceiling is the only possible way of fiscal management. Consequently, the risk of having extremely high financial leverage caused by excessive usage on external funds is low. However, since the data collection of financial statements was only available up to 2015, the situation after 2016 remains unknown. As shown in Chapter 3, there is a lawsuit between the City of Harare, and Chitungwiza Municipality. It might be possible that Chitungwiza Municipality need to pay for penalty from other sectors’ revenues if it loses in court. In addition, it has been reported in several media that the problem of unpaid salaries for officers in Chitungwiza Municipality may yet worsen. As a conclusion, it is a critical challenge that Chitungwiza Municipality shows a solution to increasing unpaid expenses.
Data Collection Survey on Water Supply and Sewage Sector in Harare City Area in Zimbabwe April 2018
4-4
2) Issues related to soundness of sewage projects
The sewerage service is not operated by an independent public entity, and the soundness of the sewerage service follows to the soundness of the city. Although it is a principle that sewerage service is run by the income of the sewerage projects, it is not stipulated by the laws to bind sewer income to sewer expenditure. Therefore, there is a possibility of sewer revenues being used in other sectors when urgent large expenditure is required there. In such cases, it would be difficult to stock necessary spare parts for sewerage projects. This might be a future risk of the facility’s sustainability and management.
4.4 Issues related to PPP
Although Zim-fund Phase2 is planned for the sewerage project in Chitungwiza City, the support is not planned for the BNR treatment plant, but is planned to be used for the repairment of the sewer pipe. From the interview with sewage treatment plants, related facilities, and multiple stakeholders, the tasks are summarized as follows.
(1) Challenges from the present to the start of operation
1) Process of approval
In the case of local government implementing PPP in Zimbabwe, there are four stages (city council, MoLG, MoF, Cabinet) of approvals as administrative procedures. The procedural progress of the PPP advanced by Chitungwiza Municipality, and Sesani is in the final stage, and need to submit the necessary supporting documents to get the final Cabinet approval.
2) Credit guarantor
On the other hand, there is a big problem in terms of finance that the credit guarantor has not yet been found. In other words, in order for this PPP to be established, 80% of the total financial resources as a loan, and 20% of total financial resources needs to be actually disbursed. There is no particular problem in the paid-in capital part as it will be undertaken by Chitungwiza Municipality, the Pension Fund, and the National Social Security Agency. On the other hand, the loan part holds a problem. The standard bank, whose head office is located in South Africa, usually carries out a loan up to 5 years. To complement the market gap to get a 25 years loan, a guarantor is essential; however, such a guarantor has not yet been found. Therefore, PPP cannot be implemented in the future other than finding an appropriate guarantor.
3) Loan and construction period
Three years is set as the grace period; however, the bank side requires this to be two years. Although this is still being negotiated, there is also a need to shorten the construction period and to hurry monetization in order to pass the request of the bank side.
(2) Issues for sustainable operation in the future
1) Expected tasks in the scheme
Although it was not recognized as a big problem in the interview with stakeholders, it seems that there are some problems with introduction of prepaid smart meters and the fee structure. The first problem is the high price of water charges. As aforementioned, the water charge by PPP is considerably higher than the current level. In the explanation by Sesani, a survey on willingness to pay for PPP was conducted and the residents’ reaction was that they have intention to pay if water is supplied appropriately even if it is a little expensive.
However, in the residents 'consciousness survey in this study, it is necessary to review the point that the residents' willingness to pay is considerably lower than the fee assumed by PPP, and whether the income according to the financial plan will be feasible. The detailed result on willingness to pay is in Appendix 3.

Data Collection Survey on Water Supply and Sewage Sector in Harare City Area in Zimbabwe April 2018
4-5
2) Issues in Collection System
The second problem in operation will be the IT systematic risks. There are concerns that preliminary verification is difficult for system errors under the situation with the large amount of non-revenue water.
In addition, management by smart meters and introduction of the prepaid method may cause risks that are not currently recognized (e.g. the lack of a method or system of collecting fees when a system error occurs over a long period of time). There should be a notice on the possibilities that this may lead to a financial influence that could break the premise of the core of SPV as a continuing company.
3) Financial Feasibility
Finally, from the overall financial aspect of this PPP, there seems to be a problem in feasibility. In addition, there seems to be a necessity of reviewing individual assumptions and premises in order to examine it.
Specifically, in this PPP, for example, in 2020 it was scheduled that tariffs would be collected by smart meters. This scheme anticipates USD 24,066,070 as the total revenue of water supply and sewerage, and USD 36,598,094 from 2022, when it starts the dam operation. However, from the financial statements of Harare Water, looking at the fiscal size in 2016, it was USD 84,132,196 on an accrual basis, although the amount was USD 31,657,550 on a cash basis. Therefore, considering that the population of the city of Harare is about six times that of Chitungwiza, although the same level of revenue as planned for Harare city on a cash basis is planned, the feasibility of such a plan is questionable.
However, it is difficult to point out what assumptions are questionable. This is because the PPP financial plan is created on many assumptions, as shown inAppendix 1. Each hypothesis / premise and numerical value or indicator is specifically examined and cited from external resources, and the overall financial plan is the final result. Therefore, it cannot be pointed out which of the individual assumptions or premises are decisively in error, although, still, the feasibility of each should be reconsidered in terms of overall size of the project.
Data Collection Survey on Water Supply and Sewage Sector in Harare City Area in Zimbabwe April 2018
5-1
CHAPTER 5 ACHIEVEMENT AND DIRECTION OF JAPANESE COOPERATION IN SANITATION AND HYGIENE SECTOR
5.1 Achievement and of Japanese Cooperation in Hygiene and Sanitation Sector
The following four projects were conducted by JICA for the improvement of sanitation and the condition of solid waste in Chitungwiza.
The Project for the Improvement of Sanity Condition in the Municipality of Chitungwiza in the Republic of Zimbabwe
The project for Improvement of Sewage Facilities in the Municipality of Chitungwiza in the Republic of Zimbabwe
Data Collection Survey for Improvement of Hygiene Condition in Chitungwiza Municipality in the Republic of Zimbabwe (Provisional English title)
The Project for the Improvement of Water Supply, Sewage and Solid Waste Management in Chitungwiza in the Republic of Zimbabwe
The summary of the projects is shown below.
(1) The Project for the Improvement of Sanity Condition in the Municipality of Chitungwiza in the Republic of Zimbabwe
Project title The Project for the Improvement of Sanity Condition in the Municipality of
Chitungwiza in the Republic of Zimbabwe Project completion March, 1997 Objective To improve the solid waste condition by procuring currently lacking solid
waste collection and disposal equipment and maintenance tools. Contents of basic design
Garbage collection trucks: 6 Detachable container trucks: 8 Containers: 18 Dump trucks: 3 Bulldozer: 1 Wheel loader: 1 Motor grader: 1 Workshop tools Trailer truck: 1 Work trucks: 2
Cost estimates Machinery and equipment: 3.35 million USDDesign and supervision: 0.28 million USD Total: 3.63 million USD
(2) The project for Improvement of Sewage Facilities in the Municipality of Chitungwiza in the Republic of Zimbabwe
Project title The project for Improvement of Sewage Facilities in the Municipality of
Chitungwiza in the Republic of Zimbabwe Project completion January, 1998 Objective To decrease the pollution load of Nyatsme River by improvement and
expansion of Zengeza treatment plant and by replacement of decrepit mechanical and electric facilities of pump stations.
Contents of basic design
Construction of new waste water treatment facilities:Sewage treatment facility with capacity 20,000m3/d

Data Collection Survey on Water Supply and Sewage Sector in Harare City Area in Zimbabwe April 2018
5-2
Sludge treatment facility Accompanying facilities for new treatment plant:
Reconstruction of inlet sewer Anaerobic pond Installation of treated water distribution pipe
Rehabilitation of three pump stations: Replacement of existing pump Replacement of electrical equipment Replacement of level detector Installation of new magnetic flowmeters
Procurement and supply of equipment: Mechanical and electrical facilities for sewage treatment and sludge treatment Maintenance vehicle Water analysis equipment
(3) Data Collection Survey for Improvement of Hygiene Condition in Chitungwiza Municipality in the Republic of Zimbabwe (Provisional English title)
Project title Data Collection Survey for Improvement of Hygiene Condition in
Chitungwiza Municipality in the Republic of Zimbabwe (Provisional English title)
Project completion April 2012 Objective The project aimed at collection and analysis of necessary basic information
on the current condition of sewerage and solid waste management, and the activities and capacity of relevant organizations, for the improvement of sanitation and hygiene conditions in Chitungwiza.
Candidate improvement measure
The report shows improvement options with combination of improvement measures for sewage reticulation, pump station and treatment plant. The report shows rehabilitation options for sewage reticulation, pump station and treatment plant. Options for anticipated studies for improvement of hygiene conditions are shown.
Proposals for improvement measures
Rehabilitation of existing BNR treatment plantRehabilitation by a method capable of easy operation and maintenance such as conventional activated sludge method.
Rehabilitation of oxidation pond and filter bed Rehabilitation and expansion to 20,000m3 by the same method.
Rehabilitation of sewage reticulation and pump station To complement the rehabilitation by AfDB project.
(4) The Project for the Improvement of Water Supply, Sewage and Solid Waste Management in Chitungwiza in the Republic of Zimbabwe
Project title The Project for the Improvement of Water Supply, Sewage and Solid Waste
Management in Chitungwiza in the Republic of Zimbabwe Project completion September, 2013Objective To prepare the Master Plan and the Feasibility Studies for water supply,
sewerage and solid waste management in Chitungwiza Municipality. In the F/S, the high priority projects will be selected and studied from the projects in the M/P. At the same time, the study will benefit the local counterparts in Zimbabwe by building their capacity for future development planning.
Major Contents of Sewage rehabilitation
Data Collection Survey on Water Supply and Sewage Sector in Harare City Area in Zimbabwe April 2018
5-3
Master Plan for sewage
Urgent PhaseCity of Harare: Rehabilitation of Crowborough STP (Sewage Treatment Plant) and Firle STP and Sewers Chitungwiza: Rehabilitation of Zengeza STP and Pump Stations/Sewers
Mid-Term Augmentation of facilities: City of Harare: Crowborough STP and Firle STP Chitungwiza: Zengeza STP
Development of Ward 1 in Chitungwiza Cost Estimates for sanitation/sewage facilities
Zengeza STP improvementOption 1: New stabilization pond: 128,619 thousand USD Option 2: Existing trickling filter and Oxidation Ditch 20,121 thousand USD Option 3: Rehabilitation of existing BNR and usage of existing trickling filter 15,377 thousand USD
Pump station 2,592 thousand USD Development of Tilcor Industrial area
384 thousand USD
5.2 Improvement of Zengeza WWTP
5.2.1 Basic Approach
The basic approach toward rehabilitation of Zengeza WWTP is summarized in this section.
(1) Processing Capacity
Zengeza WWTP has two lines of facility with processing capacity of 10 ML/day each, totaling 20 ML/day processing capacity. The current amount of wastewater generation in Chitungwiza city is 20.8 ML/day, but about 50 % is leaked, which makes the influx amount 10 ML/day. Considering the expected future increase in the inflow, JST proposes an improvement proposal including one line operation plan out of the two lines.
(2) Critical Matters in Repair
1) Removal of Sand
One of the causes of failure of BNR facility is the inflow of sand. It is therefore required to install facilities to remove sand.
2) Extension of Service Life
Given breakdown began to occur in five years from the start of operation, extension of service life of the facility is required.
3) Easy Maintenance
One of the reasons for failure early was that the technical level of the staffs was inadequate and maintenance was not done as specified. Installation of equipment using the latest technology that is easy to maintain is recommended.
4) Procurement of Spare Parts and Expendable Items
Machine failure occurs unexpectedly, so it is necessary to provide spare parts and expendable items to minimize the down time due to failure.
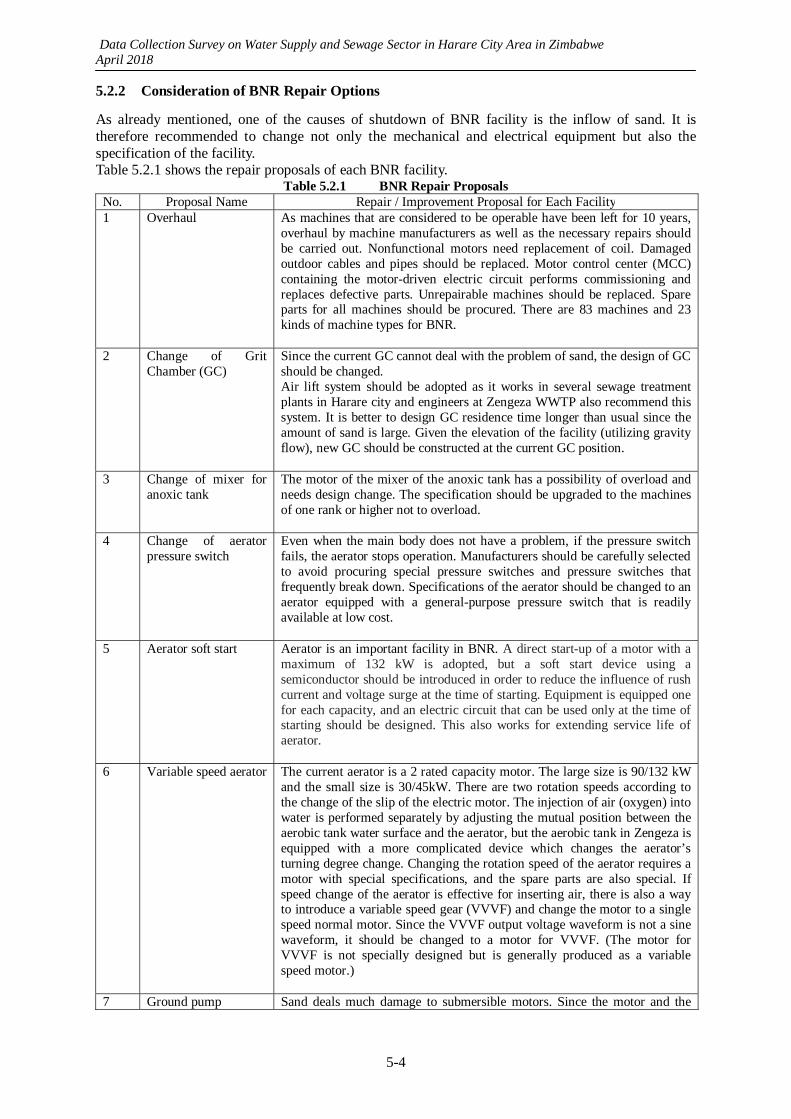
Data Collection Survey on Water Supply and Sewage Sector in Harare City Area in Zimbabwe April 2018
5-4
5.2.2 Consideration of BNR Repair Options
As already mentioned, one of the causes of shutdown of BNR facility is the inflow of sand. It is therefore recommended to change not only the mechanical and electrical equipment but also the specification of the facility. Table 5.2.1 shows the repair proposals of each BNR facility.
Table 5.2.1 BNR Repair Proposals No. Proposal Name Repair / Improvement Proposal for Each Facility 1 Overhaul As machines that are considered to be operable have been left for 10 years,
overhaul by machine manufacturers as well as the necessary repairs should be carried out. Nonfunctional motors need replacement of coil. Damaged outdoor cables and pipes should be replaced. Motor control center (MCC) containing the motor-driven electric circuit performs commissioning and replaces defective parts. Unrepairable machines should be replaced. Spare parts for all machines should be procured. There are 83 machines and 23 kinds of machine types for BNR.
2 Change of Grit Chamber (GC)
Since the current GC cannot deal with the problem of sand, the design of GC should be changed. Air lift system should be adopted as it works in several sewage treatment plants in Harare city and engineers at Zengeza WWTP also recommend this system. It is better to design GC residence time longer than usual since the amount of sand is large. Given the elevation of the facility (utilizing gravity flow), new GC should be constructed at the current GC position.
3 Change of mixer for anoxic tank
The motor of the mixer of the anoxic tank has a possibility of overload and needs design change. The specification should be upgraded to the machines of one rank or higher not to overload.
4 Change of aerator pressure switch
Even when the main body does not have a problem, if the pressure switch fails, the aerator stops operation. Manufacturers should be carefully selected to avoid procuring special pressure switches and pressure switches that frequently break down. Specifications of the aerator should be changed to an aerator equipped with a general-purpose pressure switch that is readily available at low cost.
5 Aerator soft start
Aerator is an important facility in BNR. A direct start-up of a motor with a maximum of 132 kW is adopted, but a soft start device using a semiconductor should be introduced in order to reduce the influence of rush current and voltage surge at the time of starting. Equipment is equipped one for each capacity, and an electric circuit that can be used only at the time of starting should be designed. This also works for extending service life of aerator.
6 Variable speed aerator
The current aerator is a 2 rated capacity motor. The large size is 90/132 kW and the small size is 30/45kW. There are two rotation speeds according to the change of the slip of the electric motor. The injection of air (oxygen) into water is performed separately by adjusting the mutual position between the aerobic tank water surface and the aerator, but the aerobic tank in Zengeza is equipped with a more complicated device which changes the aerator’s turning degree change. Changing the rotation speed of the aerator requires a motor with special specifications, and the spare parts are also special. If speed change of the aerator is effective for inserting air, there is also a way to introduce a variable speed gear (VVVF) and change the motor to a single speed normal motor. Since the VVVF output voltage waveform is not a sine waveform, it should be changed to a motor for VVVF. (The motor for VVVF is not specially designed but is generally produced as a variable speed motor.)
7 Ground pump Sand deals much damage to submersible motors. Since the motor and the
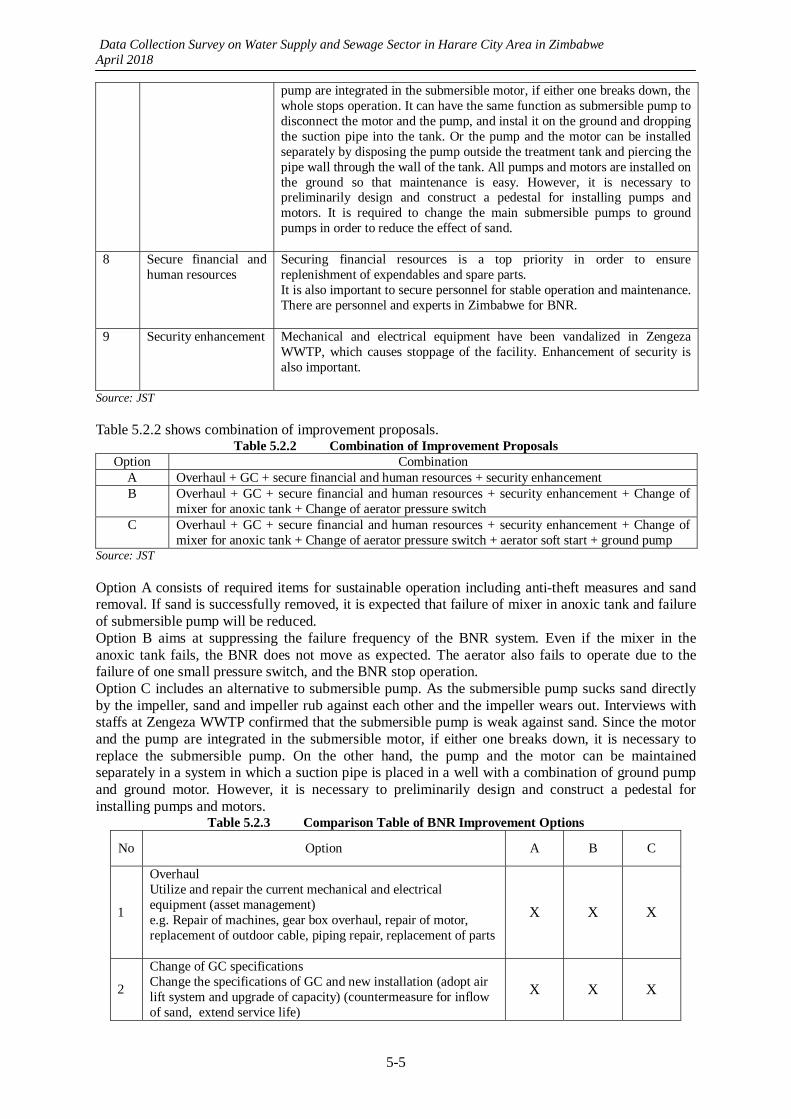
Data Collection Survey on Water Supply and Sewage Sector in Harare City Area in Zimbabwe April 2018
5-5
pump are integrated in the submersible motor, if either one breaks down, thewhole stops operation. It can have the same function as submersible pump to disconnect the motor and the pump, and instal it on the ground and dropping the suction pipe into the tank. Or the pump and the motor can be installed separately by disposing the pump outside the treatment tank and piercing the pipe wall through the wall of the tank. All pumps and motors are installed on the ground so that maintenance is easy. However, it is necessary to preliminarily design and construct a pedestal for installing pumps and motors. It is required to change the main submersible pumps to ground pumps in order to reduce the effect of sand.
8 Secure financial and human resources
Securing financial resources is a top priority in order to ensure replenishment of expendables and spare parts. It is also important to secure personnel for stable operation and maintenance. There are personnel and experts in Zimbabwe for BNR.
9 Security enhancement Mechanical and electrical equipment have been vandalized in Zengeza WWTP, which causes stoppage of the facility. Enhancement of security is also important.
Source: JST Table 5.2.2 shows combination of improvement proposals.
Table 5.2.2 Combination of Improvement Proposals Option Combination
A Overhaul + GC + secure financial and human resources + security enhancement B Overhaul + GC + secure financial and human resources + security enhancement + Change of
mixer for anoxic tank + Change of aerator pressure switch C Overhaul + GC + secure financial and human resources + security enhancement + Change of
mixer for anoxic tank + Change of aerator pressure switch + aerator soft start + ground pump Source: JST Option A consists of required items for sustainable operation including anti-theft measures and sand removal. If sand is successfully removed, it is expected that failure of mixer in anoxic tank and failure of submersible pump will be reduced. Option B aims at suppressing the failure frequency of the BNR system. Even if the mixer in the anoxic tank fails, the BNR does not move as expected. The aerator also fails to operate due to the failure of one small pressure switch, and the BNR stop operation. Option C includes an alternative to submersible pump. As the submersible pump sucks sand directly by the impeller, sand and impeller rub against each other and the impeller wears out. Interviews with staffs at Zengeza WWTP confirmed that the submersible pump is weak against sand. Since the motor and the pump are integrated in the submersible motor, if either one breaks down, it is necessary to replace the submersible pump. On the other hand, the pump and the motor can be maintained separately in a system in which a suction pipe is placed in a well with a combination of ground pump and ground motor. However, it is necessary to preliminarily design and construct a pedestal for installing pumps and motors.
Table 5.2.3 Comparison Table of BNR Improvement Options
No Option A B C
1
Overhaul Utilize and repair the current mechanical and electrical equipment (asset management) e.g. Repair of machines, gear box overhaul, repair of motor, replacement of outdoor cable, piping repair, replacement of parts
X X X
2
Change of GC specifications Change the specifications of GC and new installation (adopt air lift system and upgrade of capacity) (countermeasure for inflow of sand, extend service life)
X X X
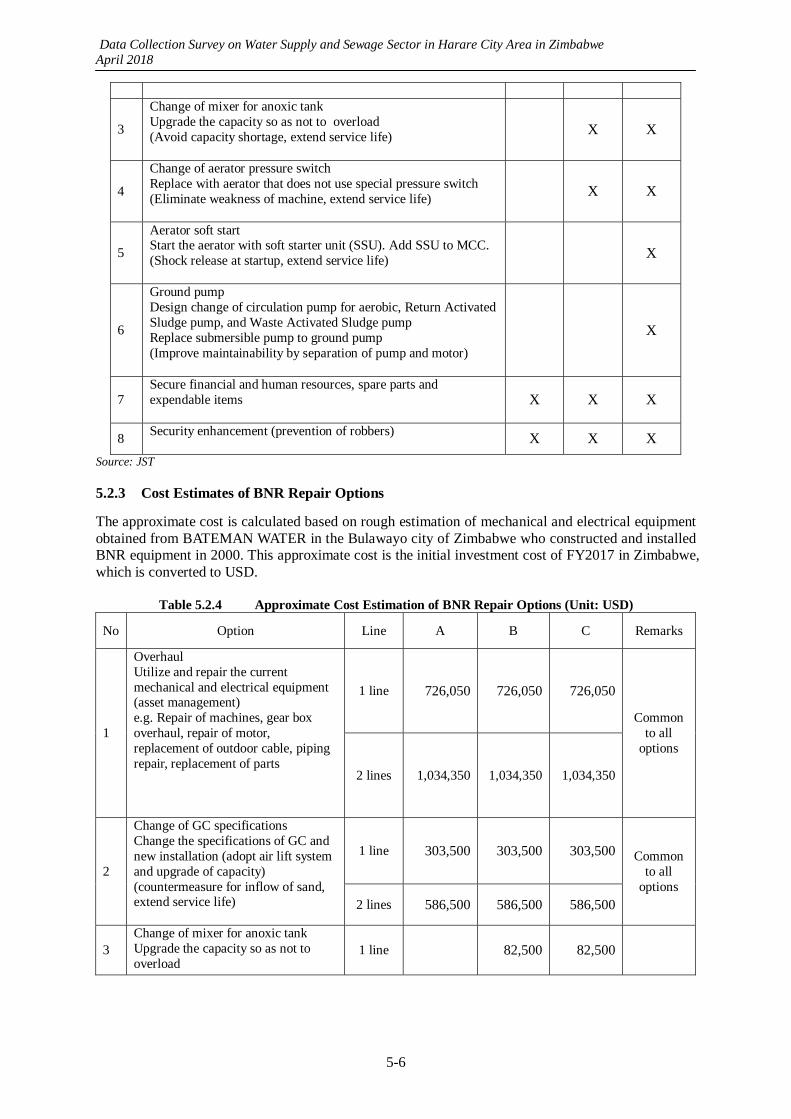
Data Collection Survey on Water Supply and Sewage Sector in Harare City Area in Zimbabwe April 2018
5-6
3
Change of mixer for anoxic tank Upgrade the capacity so as not to overload (Avoid capacity shortage, extend service life)
X X
4
Change of aerator pressure switchReplace with aerator that does not use special pressure switch (Eliminate weakness of machine, extend service life)
X X
5
Aerator soft startStart the aerator with soft starter unit (SSU). Add SSU to MCC. (Shock release at startup, extend service life)
X
6
Ground pump Design change of circulation pump for aerobic, Return Activated Sludge pump, and Waste Activated Sludge pump Replace submersible pump to ground pump (Improve maintainability by separation of pump and motor)
X
7 Secure financial and human resources, spare parts and expendable items
X X X
8 Security enhancement (prevention of robbers) X X X
Source: JST
5.2.3 Cost Estimates of BNR Repair Options
The approximate cost is calculated based on rough estimation of mechanical and electrical equipment obtained from BATEMAN WATER in the Bulawayo city of Zimbabwe who constructed and installed BNR equipment in 2000. This approximate cost is the initial investment cost of FY2017 in Zimbabwe, which is converted to USD.
Table 5.2.4 Approximate Cost Estimation of BNR Repair Options (Unit: USD)
No Option Line A B C Remarks
1
Overhaul Utilize and repair the current mechanical and electrical equipment (asset management) e.g. Repair of machines, gear box overhaul, repair of motor, replacement of outdoor cable, piping repair, replacement of parts
1 line 726,050 726,050 726,050
Common to all
options
2 lines 1,034,350 1,034,350 1,034,350
2
Change of GC specifications Change the specifications of GC and new installation (adopt air lift system and upgrade of capacity) (countermeasure for inflow of sand, extend service life)
1 line 303,500 303,500 303,500 Common to all
options 2 lines 586,500 586,500 586,500
3 Change of mixer for anoxic tank Upgrade the capacity so as not to overload
1 line 82,500 82,500
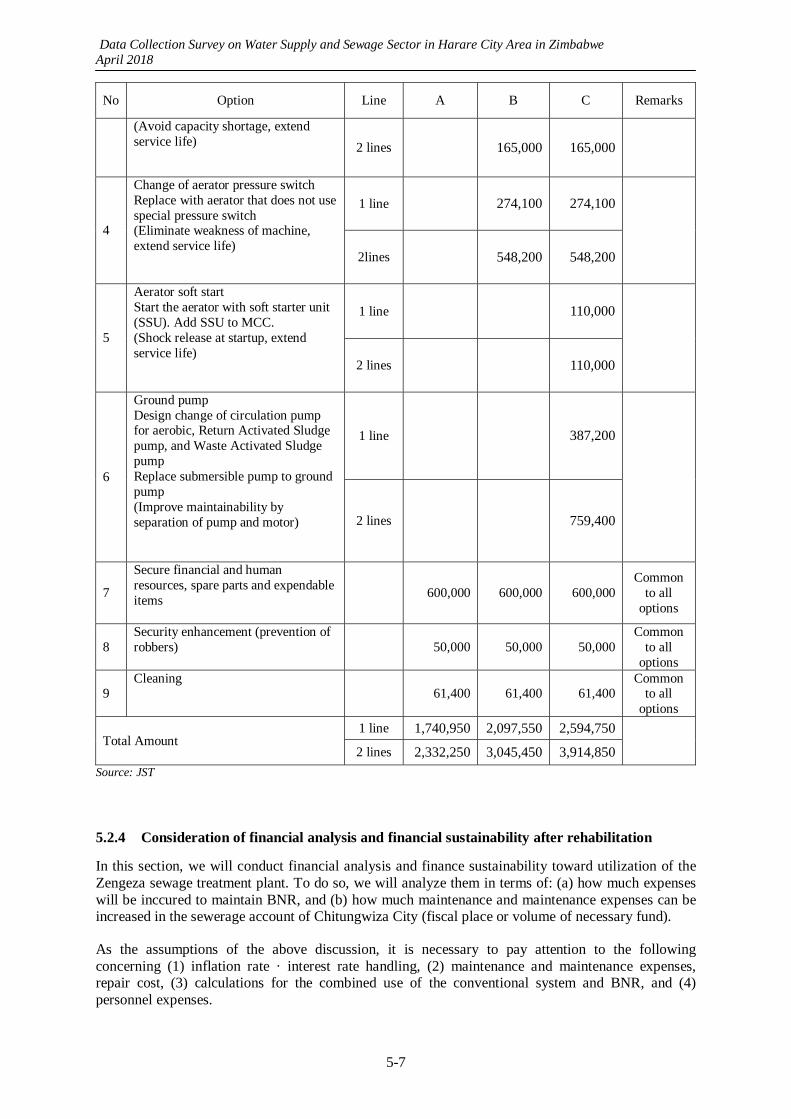
Data Collection Survey on Water Supply and Sewage Sector in Harare City Area in Zimbabwe April 2018
5-7
No Option Line A B C Remarks
(Avoid capacity shortage, extend service life)
2 lines 165,000 165,000
4
Change of aerator pressure switch Replace with aerator that does not use special pressure switch (Eliminate weakness of machine, extend service life)
1 line 274,100 274,100
2lines 548,200 548,200
5
Aerator soft start Start the aerator with soft starter unit (SSU). Add SSU to MCC. (Shock release at startup, extend service life)
1 line 110,000
2 lines 110,000
6
Ground pump Design change of circulation pump for aerobic, Return Activated Sludge pump, and Waste Activated Sludge pump Replace submersible pump to ground pump (Improve maintainability by separation of pump and motor)
1 line 387,200
2 lines 759,400
7
Secure financial and human resources, spare parts and expendable items
600,000 600,000 600,000 Common
to all options
8 Security enhancement (prevention of robbers)
50,000 50,000 50,000 Common
to all options
9 Cleaning
61,400 61,400 61,400 Common
to all options
Total Amount 1 line 1,740,950 2,097,550 2,594,750
2 lines 2,332,250 3,045,450 3,914,850
Source: JST
5.2.4 Consideration of financial analysis and financial sustainability after rehabilitation
In this section, we will conduct financial analysis and finance sustainability toward utilization of the Zengeza sewage treatment plant. To do so, we will analyze them in terms of: (a) how much expenses will be inccured to maintain BNR, and (b) how much maintenance and maintenance expenses can be increased in the sewerage account of Chitungwiza City (fiscal place or volume of necessary fund).
As the assumptions of the above discussion, it is necessary to pay attention to the following concerning (1) inflation rate · interest rate handling, (2) maintenance and maintenance expenses, repair cost, (3) calculations for the combined use of the conventional system and BNR, and (4) personnel expenses.
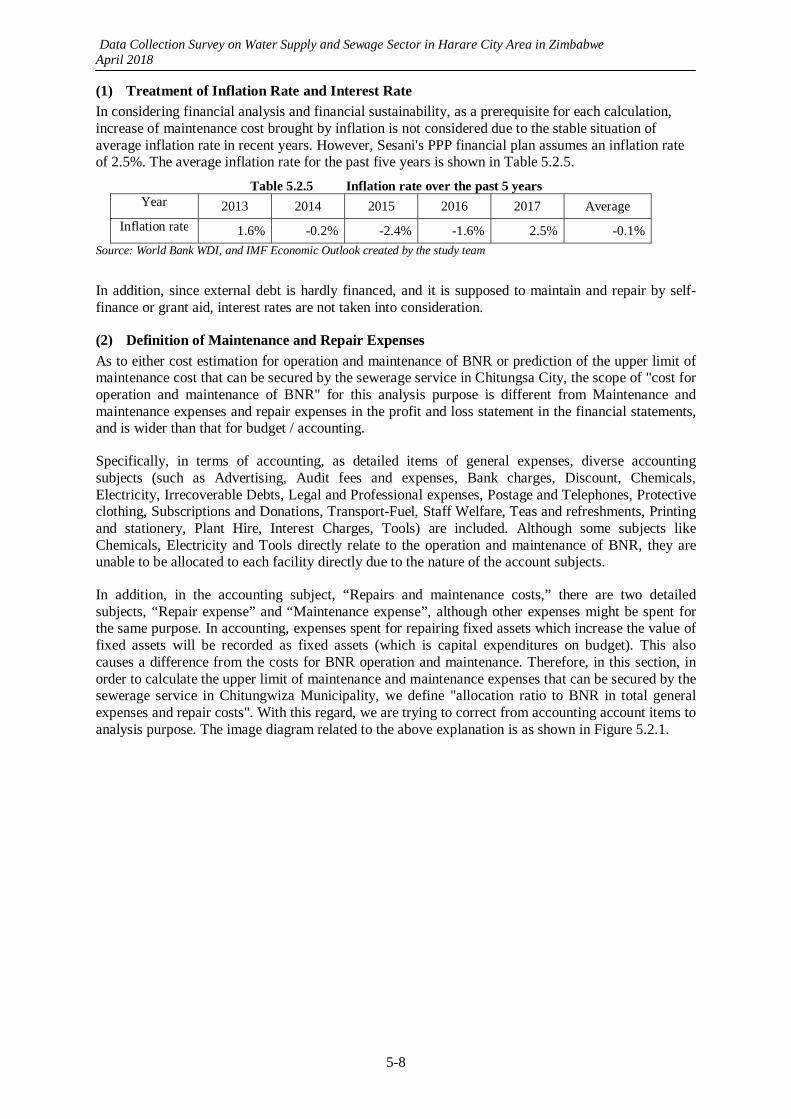
Data Collection Survey on Water Supply and Sewage Sector in Harare City Area in Zimbabwe April 2018
5-8
(1) Treatment of Inflation Rate and Interest Rate
In considering financial analysis and financial sustainability, as a prerequisite for each calculation, increase of maintenance cost brought by inflation is not considered due to the stable situation of average inflation rate in recent years. However, Sesani's PPP financial plan assumes an inflation rate of 2.5%. The average inflation rate for the past five years is shown in Table 5.2.5.
Table 5.2.5 Inflation rate over the past 5 years Year 2013 2014 2015 2016 2017 Average
Inflation rate 1.6% -0.2% -2.4% -1.6% 2.5% -0.1%
Source: World Bank WDI, and IMF Economic Outlook created by the study team
In addition, since external debt is hardly financed, and it is supposed to maintain and repair by self-finance or grant aid, interest rates are not taken into consideration.
(2) Definition of Maintenance and Repair Expenses
As to either cost estimation for operation and maintenance of BNR or prediction of the upper limit of maintenance cost that can be secured by the sewerage service in Chitungsa City, the scope of "cost for operation and maintenance of BNR" for this analysis purpose is different from Maintenance and maintenance expenses and repair expenses in the profit and loss statement in the financial statements, and is wider than that for budget / accounting.
Specifically, in terms of accounting, as detailed items of general expenses, diverse accounting subjects (such as Advertising, Audit fees and expenses, Bank charges, Discount, Chemicals, Electricity, Irrecoverable Debts, Legal and Professional expenses, Postage and Telephones, Protective clothing, Subscriptions and Donations, Transport-Fuel, Staff Welfare, Teas and refreshments, Printing and stationery, Plant Hire, Interest Charges, Tools) are included. Although some subjects like Chemicals, Electricity and Tools directly relate to the operation and maintenance of BNR, they are unable to be allocated to each facility directly due to the nature of the account subjects.
In addition, in the accounting subject, “Repairs and maintenance costs,” there are two detailed subjects, “Repair expense” and “Maintenance expense”, although other expenses might be spent for the same purpose. In accounting, expenses spent for repairing fixed assets which increase the value of fixed assets will be recorded as fixed assets (which is capital expenditures on budget). This also causes a difference from the costs for BNR operation and maintenance. Therefore, in this section, in order to calculate the upper limit of maintenance and maintenance expenses that can be secured by the sewerage service in Chitungwiza Municipality, we define "allocation ratio to BNR in total general expenses and repair costs". With this regard, we are trying to correct from accounting account items to analysis purpose. The image diagram related to the above explanation is as shown in Figure 5.2.1.
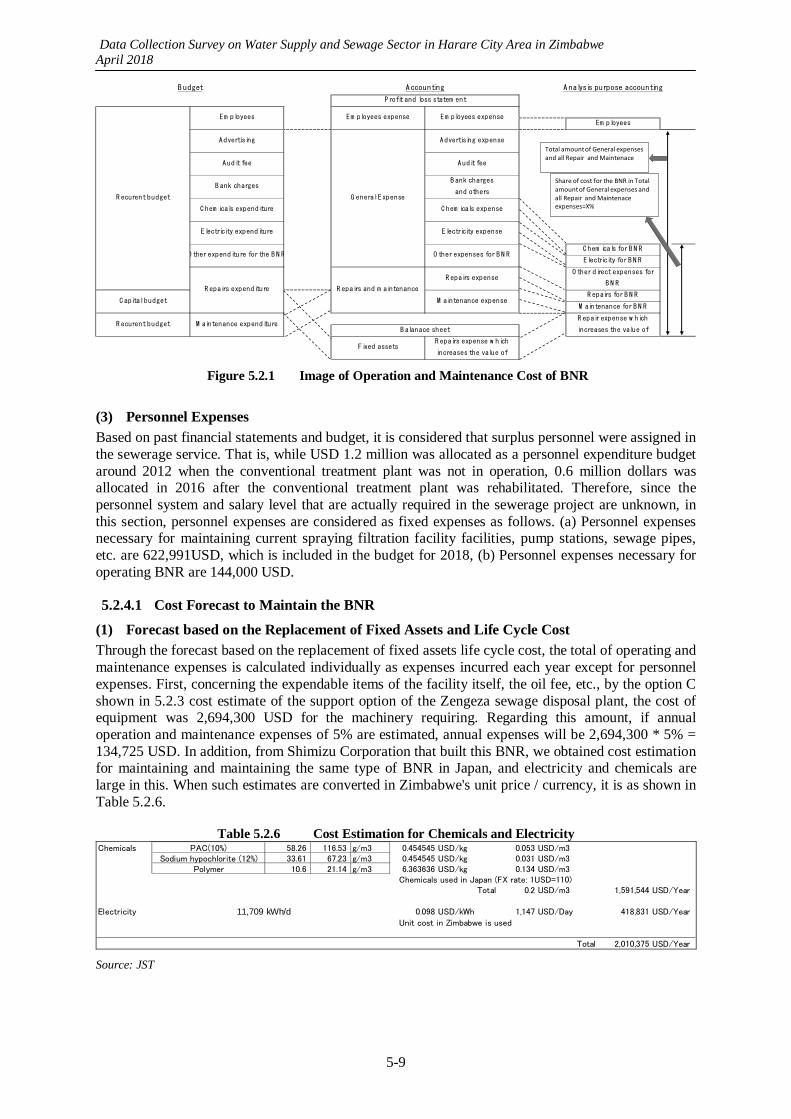
Data Collection Survey on Water Supply and Sewage Sector in Harare City Area in Zimbabwe April 2018
5-9
Fixed assetsR epairs expense w hich
increases the value of
C apital budget M aintenance expenseR epairs for B N R
M aintenance for B N R
R ecurent budget M aintenance expenditureR epair expense w hich
increases the value ofB alanace sheet
O ther expenditure for the B N R O ther expenses for B N RC hem icals for B N R
Electricity for B N R
R epairs expenditure R epairs and m aintenance
R epairs expenseO ther direct expenses for
B N R
C hem icals expenditure C hem icals expense
Electricity expenditure Electricity expense
B udget A ccounting A nalysis purpose accounting
P rofit and loss statem ent
R ecurent budget
Em ployees Em ployees expense Em ployees expenseEm ployees
Advertising
G eneral Expense
Advertising expense
Audit fee Audit fee
B ank chargesB ank charges
and others
Total amount of General expensesand all Repair and Maintenace
Share of cost for the BNR in Total amount of General expenses and all Repair and Maintenace expenses=X%
Figure 5.2.1 Image of Operation and Maintenance Cost of BNR
(3) Personnel Expenses
Based on past financial statements and budget, it is considered that surplus personnel were assigned in the sewerage service. That is, while USD 1.2 million was allocated as a personnel expenditure budget around 2012 when the conventional treatment plant was not in operation, 0.6 million dollars was allocated in 2016 after the conventional treatment plant was rehabilitated. Therefore, since the personnel system and salary level that are actually required in the sewerage project are unknown, in this section, personnel expenses are considered as fixed expenses as follows. (a) Personnel expenses necessary for maintaining current spraying filtration facility facilities, pump stations, sewage pipes, etc. are 622,991USD, which is included in the budget for 2018, (b) Personnel expenses necessary for operating BNR are 144,000 USD.
5.2.4.1 Cost Forecast to Maintain the BNR
(1) Forecast based on the Replacement of Fixed Assets and Life Cycle Cost
Through the forecast based on the replacement of fixed assets life cycle cost, the total of operating and maintenance expenses is calculated individually as expenses incurred each year except for personnel expenses. First, concerning the expendable items of the facility itself, the oil fee, etc., by the option C shown in 5.2.3 cost estimate of the support option of the Zengeza sewage disposal plant, the cost of equipment was 2,694,300 USD for the machinery requiring. Regarding this amount, if annual operation and maintenance expenses of 5% are estimated, annual expenses will be 2,694,300 * 5% = 134,725 USD. In addition, from Shimizu Corporation that built this BNR, we obtained cost estimation for maintaining and maintaining the same type of BNR in Japan, and electricity and chemicals are large in this. When such estimates are converted in Zimbabwe's unit price / currency, it is as shown in Table 5.2.6.
Table 5.2.6 Cost Estimation for Chemicals and Electricity Chemicals PAC(10%) 58.26 116.53 g/m3 0.454545 USD/kg 0.053 USD/m3
Sodium hypochlorite (12%) 33.61 67.23 g/m3 0.454545 USD/kg 0.031 USD/m3Polymer 10.6 21.14 g/m3 6.363636 USD/kg 0.134 USD/m3
Chemicals used in Japan (FX rate: 1USD=110)Total 0.2 USD/m3 1,591,544 USD/Year
Electricity 11,709 kWh/d 0.098 USD/kWh 1,147 USD/Day 418,831 USD/Year
Unit cost in Zimbabwe is used
Total 2,010,375 USD/Year Source: JST

Data Collection Survey on Water Supply and Sewage Sector in Harare City Area in Zimbabwe April 2018
5-10
If we assume (1) the whole function will be maintained by replacing parts sequentially in the next 20 years, and (2) expenses will cost double progressively within having intervals of 5 years in the next 20 years from the facility's life cycle, the calculation of repair cost in the next 5 years would be as follows.
0 - 5 years: 2,694,300 * 1 / (5 * 1 + 5 * 2 + 5 * 4 + 5 * 8) = 35,924 / year
6 - 10 years: 2,694,300 * 2 / (5 * 1 + 5 * 2 + 5 * 4 + 5 * 8) = 71,848 / year
11 - 15 years: 2,694,300 * 4 / (5 * 1 + 5 * 2 + 5 * 4 + 5 * 8) = 143,696 / year
16th - 20th year: 2,694,300 * 8 / (5 * 1 + 5 * 2 + 5 * 4 + 5 * 8) = 287,392 / year
From this result, for the first year, estimated operation and maintenance cost would be
134, 725 + 418, 831 + 1, 591, 544 + 35, 924 = 2, 181, 024 (USD).
(2) Forecast based on Operation and Maintenance Cost of Average Sewage Treatment Plant in Japan
In the analysis report on the sewerage entities in Japan by the Ministry of Land, Infrastructure, Transport and Tourism of Japan, 13,000 yen / m 3 day is calculated as the average annual operation and maintenance cost of sewage treatment plants. In addition, the ratio of maintenance cost to capital cost is shown as 65.8: 82.3. If these figures are used for the BNR capacity (20 m3) at the Zengeza plant and converted into year / US dollar (1 USD = 110 yen), the total cost is calculated as follows.
Operation and maintenance cost = 13,000 * 20 * 365/110 = 862,727 (USD)
Capital cost = 862, 727 / 65.8 * 82.3 = 1,079,064 (USD)
Total amount = 862,727 + 1,079,064 = 1,941,792 (USD)
The total amount also includes personnel expenses, and the various costs are Japanese based. Furthermore, since various sorts of methods are mixed in Japan's sewage treatment plant, it cannot be said that it is a cost corresponding to BNR. However, the cost ratio of personnel expenses in sewage treatment plant operating and maintenance costs is over 10% in Japan, and despite being a conservative calculation (based on cost of Japan), this is lower than the cost estimation result.
(3) Cost Estimation by PPP
As to the calculation sheet of Sesani, the sewer fee was estimated with multiplying the water supply amount by the targeted expense unit price. That is, a water supply amount of 37,584 m 3 / day is expected in the project start year. Then, 31,946 m 3 / day of sewerage inflow is calculated based on it. This is the daily maintenance cost, which is multiplied by 0.35 USD / m 3, and the result of calculating 365 days is estimated to be 4,081,125 USD as annual maintenance cost on financial statements. Also, from the following year after starting business, the first year's amount is multiplied by the inflation rate of 2.5%. In addition to this, if the common indirect cost of water supply and sewerage is allocated to the sewerage plant by some cost driver, the total maintenance cost will increase.
However, the above-mentioned amount is the cost estimate for maintaining the conventional plant. In the interview with Sesani about the rise in maintenance and maintenance expenses when BNR was rehabilitated, it is necessary to consider the income generated by treated water supply from Zengeza plant to the Prince Edward water treatment plant. It is possible to circulate and resell wastewater from BNR. In other words, by sending water from BNR to the Prince Edward Water Treatment Plant, 0.25 USD / m 3 will be resale / increase income, so if the cost increase is less than 0.25 USD / m 3, it can be absorbed. Yet, according to Sesani, it was mentioned that the cost of about 3 times the current estimate would be imposed because the electricity and chemicals will be a high burden for the operation of the BNR. Therefore, by doubling the present cost and deducting the increased income, it is 0.35 * 3 - 0.25 = 0.8 m3, which is multiplied by the influx of sewage and if further based on the year, USD 9,328,232 is maintained for the first year of the year, it is estimated as expenses (excluding

Data Collection Survey on Water Supply and Sewage Sector in Harare City Area in Zimbabwe April 2018
5-11
personnel expenses and indirect expenses). For the following year and later, it is calculated by multiplying this by 2.5% inflation.
5.2.4.2 Prediction of Upper Limit of Maintenance Cost that can be secured by sewer project in Chitungwiza Municipality
(1) Forecast based on 2018 Budget
Regarding the budget size of the whole city of Chitungwiza, approximately 201 million USD is recorded as revenue in the 2018 budget. However, this amount, like the sewerage project, shows the amount that can be reached if all the city tax and various usage fees are collected.
The budget for sewerage accounts is USD 5,870,727 as income in 2018 and the total cost is USD 2,652,975. In current expenditure, personnel expenses are USD 622,991, general and administrative expenses are USD 813,362, and maintenance and repair costs are USD 359,952. The sum total of general and administrative expenses plus maintenance and repair expenses is 1,173,314 USD. In addition, the capital expenditure of 836,670 USD has been recorded, and the total expenditure budget to Zengeza Sewage Treatment Plant in a situation where BNR which added this to general maintenance fee as maintenance cost and repair cost is not used, is 2,009,984 USD.
However, as stated in Chapter 4, according to the past budget-actual comparison, there is a large gap between the budget amount and the actual amount on a cash basis. In particular, it is assumed that it is difficult to spend according to this budget, as expenditure is largely influenced by income, that is, sewerage fee collection rate.
(2) Forecasts based on Historical Financial Statements
Regarding the income statement concerning past sewerage, as mentioned in Chapter 3, if the financial statements before 2014 are unreliable, 2015 will be 3,173,258 USD on a revenue basis on 2015, and 678,752 USD on cash basis. Regarding the cost aspect, the total of expenses excluding personnel expenses, general administrative expenses and repair / maintenance expenses is 204,384 USD. Therefore, this amount of expenses is a very small proportion (6.4%) of the income-based revenue amount, as it was analyzed in Chapter 3. This would be because the revenue is attributed on an accrual basis. Also, since the equipment of the conventional system was rehabilitated in 2016, it should be considered that the cost up to 2015 when Zengeza sewage treatment plant was not in operation at all.
From the above situation, even based on the financial statements up to 2015, it is difficult to predict to what extent the expenditure is possible if the BNR is rehabilitated in the future. As explained in Chapter 3, 2016 and 2017 financial statements are not yet available because they are being prepared. However, it is expected that revenues will both increase considerably on an accrual basis or cash basis due to the substantial tariff raise from 4.5 USD to 7.6 USD from FY 2016 as shown in Chapter 3. Regarding the tariff collection rate as well, as shown in Chapter 4, there is no data on the period since 2016, but if there is no significant change, it is expected that income will also increase significantly.
It should be noted that the cost of 2016 and 2017 is the cost corresponding to the conventional method. If these are obtained, more accurate calculation for using the conventional system and BNR can be made with the use of actual operation cost for the conventional system.
In addition to examining the financial statements of sewerage accounts in Chitungwiza Municipality, the study team also examined the financial statements of Harare Water, which has already operated BNR. However, since the financial statements of Harare Water are collective financial statements of water supply and sewage systems, and there are common costs of water supply and sewerage system, it is difficult to extract the individual cost for maintaining BNR. For reference, we extracted the costs imposed directly on the Firle wastewater treatment facility running BNR from Harare Water General Ledger in 2016. The results are as shown in Table 5.2.7.
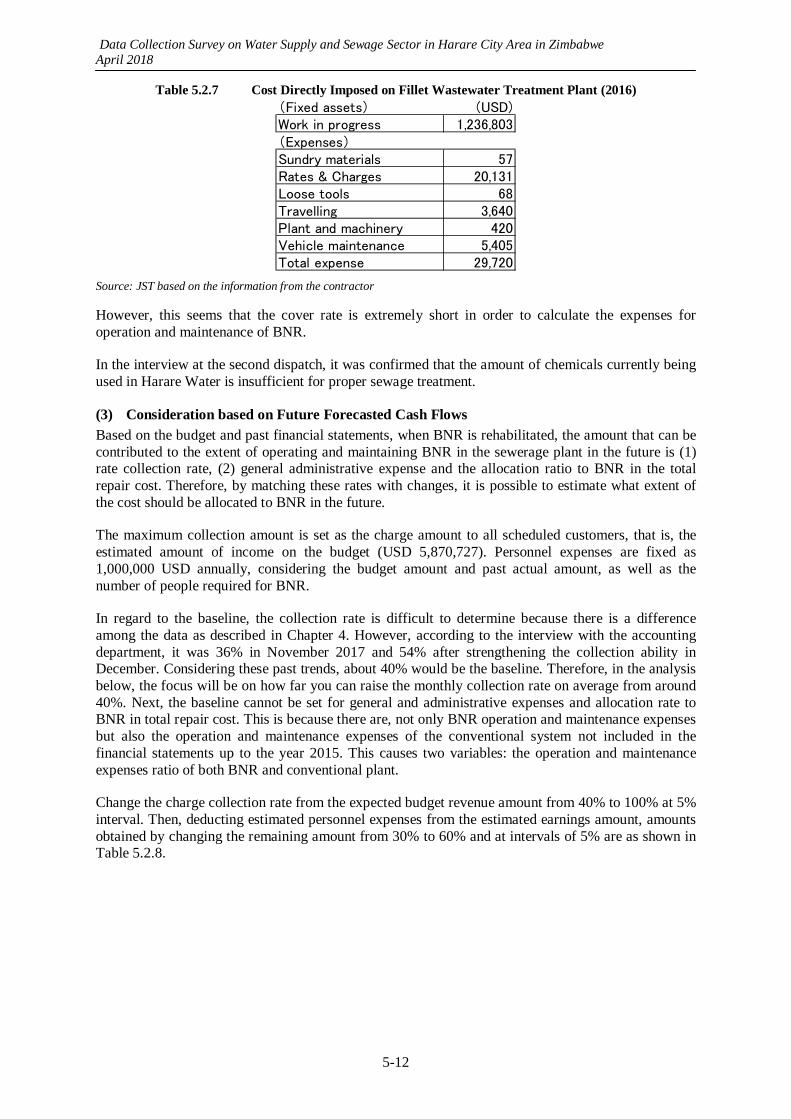
Data Collection Survey on Water Supply and Sewage Sector in Harare City Area in Zimbabwe April 2018
5-12
Table 5.2.7 Cost Directly Imposed on Fillet Wastewater Treatment Plant (2016) (Fixed assets) (USD)Work in progress 1,236,803(Expenses)Sundry materials 57Rates & Charges 20,131Loose tools 68Travelling 3,640Plant and machinery 420Vehicle maintenance 5,405Total expense 29,720
Source: JST based on the information from the contractor However, this seems that the cover rate is extremely short in order to calculate the expenses for operation and maintenance of BNR.
In the interview at the second dispatch, it was confirmed that the amount of chemicals currently being used in Harare Water is insufficient for proper sewage treatment.
(3) Consideration based on Future Forecasted Cash Flows
Based on the budget and past financial statements, when BNR is rehabilitated, the amount that can be contributed to the extent of operating and maintaining BNR in the sewerage plant in the future is (1) rate collection rate, (2) general administrative expense and the allocation ratio to BNR in the total repair cost. Therefore, by matching these rates with changes, it is possible to estimate what extent of the cost should be allocated to BNR in the future.
The maximum collection amount is set as the charge amount to all scheduled customers, that is, the estimated amount of income on the budget (USD 5,870,727). Personnel expenses are fixed as 1,000,000 USD annually, considering the budget amount and past actual amount, as well as the number of people required for BNR.
In regard to the baseline, the collection rate is difficult to determine because there is a difference among the data as described in Chapter 4. However, according to the interview with the accounting department, it was 36% in November 2017 and 54% after strengthening the collection ability in December. Considering these past trends, about 40% would be the baseline. Therefore, in the analysis below, the focus will be on how far you can raise the monthly collection rate on average from around 40%. Next, the baseline cannot be set for general and administrative expenses and allocation rate to BNR in total repair cost. This is because there are, not only BNR operation and maintenance expenses but also the operation and maintenance expenses of the conventional system not included in the financial statements up to the year 2015. This causes two variables: the operation and maintenance expenses ratio of both BNR and conventional plant.
Change the charge collection rate from the expected budget revenue amount from 40% to 100% at 5% interval. Then, deducting estimated personnel expenses from the estimated earnings amount, amounts obtained by changing the remaining amount from 30% to 60% and at intervals of 5% are as shown in Table 5.2.8.
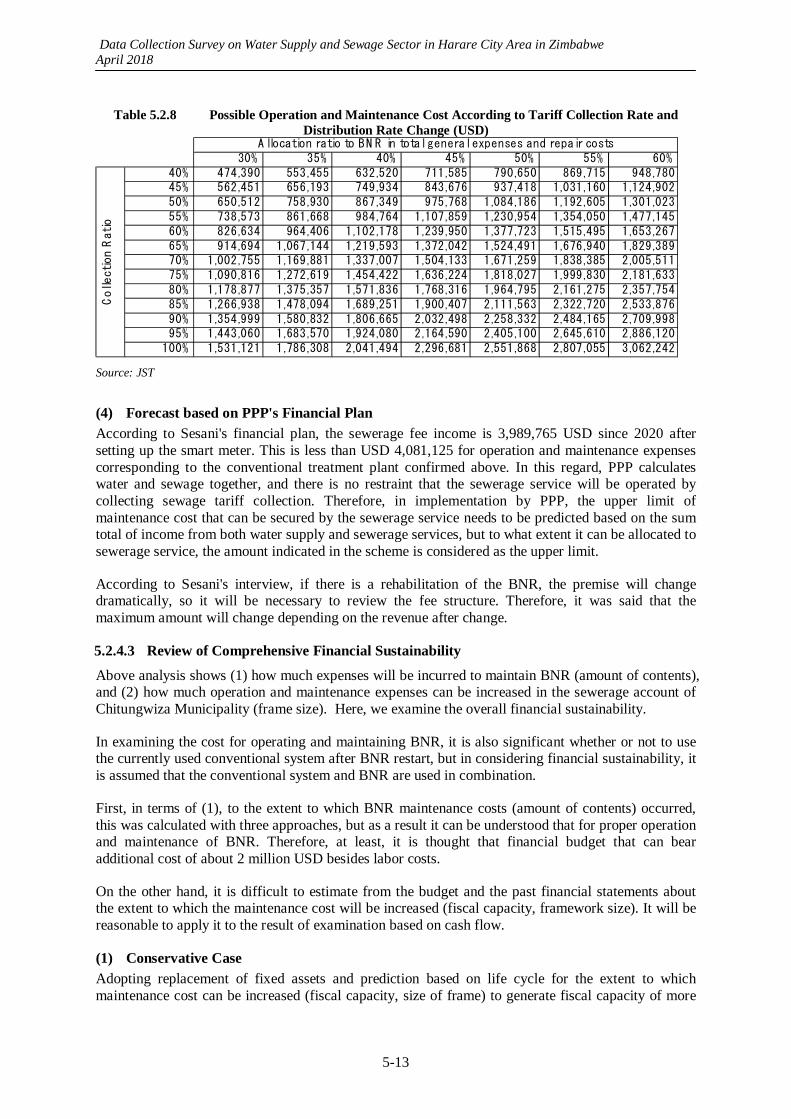
Data Collection Survey on Water Supply and Sewage Sector in Harare City Area in Zimbabwe April 2018
5-13
Table 5.2.8 Possible Operation and Maintenance Cost According to Tariff Collection Rate and Distribution Rate Change (USD)
30% 35% 40% 45% 50% 55% 60%40% 474,390 553,455 632,520 711,585 790,650 869,715 948,78045% 562,451 656,193 749,934 843,676 937,418 1,031,160 1,124,90250% 650,512 758,930 867,349 975,768 1,084,186 1,192,605 1,301,02355% 738,573 861,668 984,764 1,107,859 1,230,954 1,354,050 1,477,14560% 826,634 964,406 1,102,178 1,239,950 1,377,723 1,515,495 1,653,26765% 914,694 1,067,144 1,219,593 1,372,042 1,524,491 1,676,940 1,829,38970% 1,002,755 1,169,881 1,337,007 1,504,133 1,671,259 1,838,385 2,005,51175% 1,090,816 1,272,619 1,454,422 1,636,224 1,818,027 1,999,830 2,181,63380% 1,178,877 1,375,357 1,571,836 1,768,316 1,964,795 2,161,275 2,357,75485% 1,266,938 1,478,094 1,689,251 1,900,407 2,111,563 2,322,720 2,533,87690% 1,354,999 1,580,832 1,806,665 2,032,498 2,258,332 2,484,165 2,709,99895% 1,443,060 1,683,570 1,924,080 2,164,590 2,405,100 2,645,610 2,886,120
100% 1,531,121 1,786,308 2,041,494 2,296,681 2,551,868 2,807,055 3,062,242
A llocation ratio to BN R in total general expenses and repair costs
Collection Ratio
Source: JST
(4) Forecast based on PPP's Financial Plan
According to Sesani's financial plan, the sewerage fee income is 3,989,765 USD since 2020 after setting up the smart meter. This is less than USD 4,081,125 for operation and maintenance expenses corresponding to the conventional treatment plant confirmed above. In this regard, PPP calculates water and sewage together, and there is no restraint that the sewerage service will be operated by collecting sewage tariff collection. Therefore, in implementation by PPP, the upper limit of maintenance cost that can be secured by the sewerage service needs to be predicted based on the sum total of income from both water supply and sewerage services, but to what extent it can be allocated to sewerage service, the amount indicated in the scheme is considered as the upper limit.
According to Sesani's interview, if there is a rehabilitation of the BNR, the premise will change dramatically, so it will be necessary to review the fee structure. Therefore, it was said that the maximum amount will change depending on the revenue after change.
5.2.4.3 Review of Comprehensive Financial Sustainability
Above analysis shows (1) how much expenses will be incurred to maintain BNR (amount of contents), and (2) how much operation and maintenance expenses can be increased in the sewerage account of Chitungwiza Municipality (frame size). Here, we examine the overall financial sustainability.
In examining the cost for operating and maintaining BNR, it is also significant whether or not to use the currently used conventional system after BNR restart, but in considering financial sustainability, it is assumed that the conventional system and BNR are used in combination.
First, in terms of (1), to the extent to which BNR maintenance costs (amount of contents) occurred, this was calculated with three approaches, but as a result it can be understood that for proper operation and maintenance of BNR. Therefore, at least, it is thought that financial budget that can bear additional cost of about 2 million USD besides labor costs.
On the other hand, it is difficult to estimate from the budget and the past financial statements about the extent to which the maintenance cost will be increased (fiscal capacity, framework size). It will be reasonable to apply it to the result of examination based on cash flow.
(1) Conservative Case
Adopting replacement of fixed assets and prediction based on life cycle for the extent to which maintenance cost can be increased (fiscal capacity, size of frame) to generate fiscal capacity of more
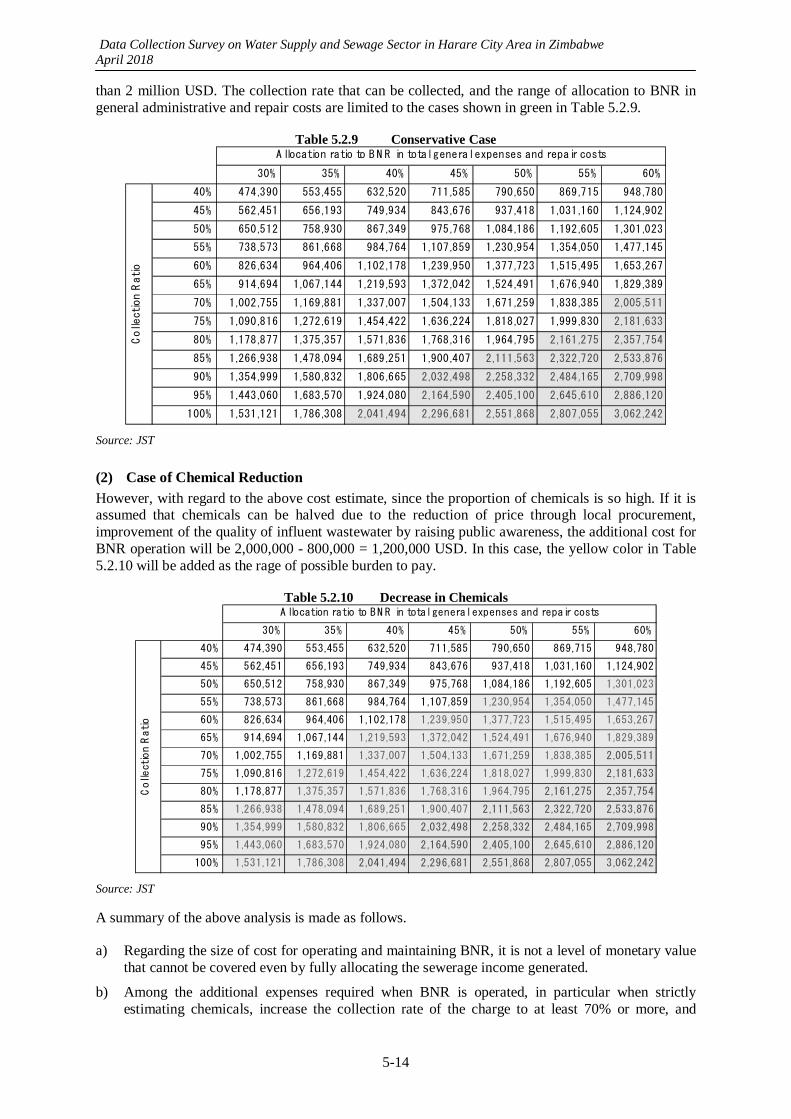
Data Collection Survey on Water Supply and Sewage Sector in Harare City Area in Zimbabwe April 2018
5-14
than 2 million USD. The collection rate that can be collected, and the range of allocation to BNR in general administrative and repair costs are limited to the cases shown in green in Table 5.2.9.
Table 5.2.9 Conservative Case
30% 35% 40% 45% 50% 55% 60%
40% 474,390 553,455 632,520 711,585 790,650 869,715 948,780
45% 562,451 656,193 749,934 843,676 937,418 1,031,160 1,124,902
50% 650,512 758,930 867,349 975,768 1,084,186 1,192,605 1,301,023
55% 738,573 861,668 984,764 1,107,859 1,230,954 1,354,050 1,477,145
60% 826,634 964,406 1,102,178 1,239,950 1,377,723 1,515,495 1,653,267
65% 914,694 1,067,144 1,219,593 1,372,042 1,524,491 1,676,940 1,829,389
70% 1,002,755 1,169,881 1,337,007 1,504,133 1,671,259 1,838,385 2,005,511
75% 1,090,816 1,272,619 1,454,422 1,636,224 1,818,027 1,999,830 2,181,633
80% 1,178,877 1,375,357 1,571,836 1,768,316 1,964,795 2,161,275 2,357,754
85% 1,266,938 1,478,094 1,689,251 1,900,407 2,111,563 2,322,720 2,533,876
90% 1,354,999 1,580,832 1,806,665 2,032,498 2,258,332 2,484,165 2,709,998
95% 1,443,060 1,683,570 1,924,080 2,164,590 2,405,100 2,645,610 2,886,120
100% 1,531,121 1,786,308 2,041,494 2,296,681 2,551,868 2,807,055 3,062,242
A llocation ratio to B N R in total general expenses and repair costs
Collection Ratio
Source: JST
(2) Case of Chemical Reduction
However, with regard to the above cost estimate, since the proportion of chemicals is so high. If it is assumed that chemicals can be halved due to the reduction of price through local procurement, improvement of the quality of influent wastewater by raising public awareness, the additional cost for BNR operation will be 2,000,000 - 800,000 = 1,200,000 USD. In this case, the yellow color in Table 5.2.10 will be added as the rage of possible burden to pay.
Table 5.2.10 Decrease in Chemicals
30% 35% 40% 45% 50% 55% 60%
40% 474,390 553,455 632,520 711,585 790,650 869,715 948,780
45% 562,451 656,193 749,934 843,676 937,418 1,031,160 1,124,902
50% 650,512 758,930 867,349 975,768 1,084,186 1,192,605 1,301,023
55% 738,573 861,668 984,764 1,107,859 1,230,954 1,354,050 1,477,145
60% 826,634 964,406 1,102,178 1,239,950 1,377,723 1,515,495 1,653,267
65% 914,694 1,067,144 1,219,593 1,372,042 1,524,491 1,676,940 1,829,389
70% 1,002,755 1,169,881 1,337,007 1,504,133 1,671,259 1,838,385 2,005,511
75% 1,090,816 1,272,619 1,454,422 1,636,224 1,818,027 1,999,830 2,181,633
80% 1,178,877 1,375,357 1,571,836 1,768,316 1,964,795 2,161,275 2,357,754
85% 1,266,938 1,478,094 1,689,251 1,900,407 2,111,563 2,322,720 2,533,876
90% 1,354,999 1,580,832 1,806,665 2,032,498 2,258,332 2,484,165 2,709,998
95% 1,443,060 1,683,570 1,924,080 2,164,590 2,405,100 2,645,610 2,886,120
100% 1,531,121 1,786,308 2,041,494 2,296,681 2,551,868 2,807,055 3,062,242
Collection Ratio
A llocation ratio to B N R in total general expenses and repair costs
Source: JST A summary of the above analysis is made as follows.
a) Regarding the size of cost for operating and maintaining BNR, it is not a level of monetary value that cannot be covered even by fully allocating the sewerage income generated.
b) Among the additional expenses required when BNR is operated, in particular when strictly estimating chemicals, increase the collection rate of the charge to at least 70% or more, and
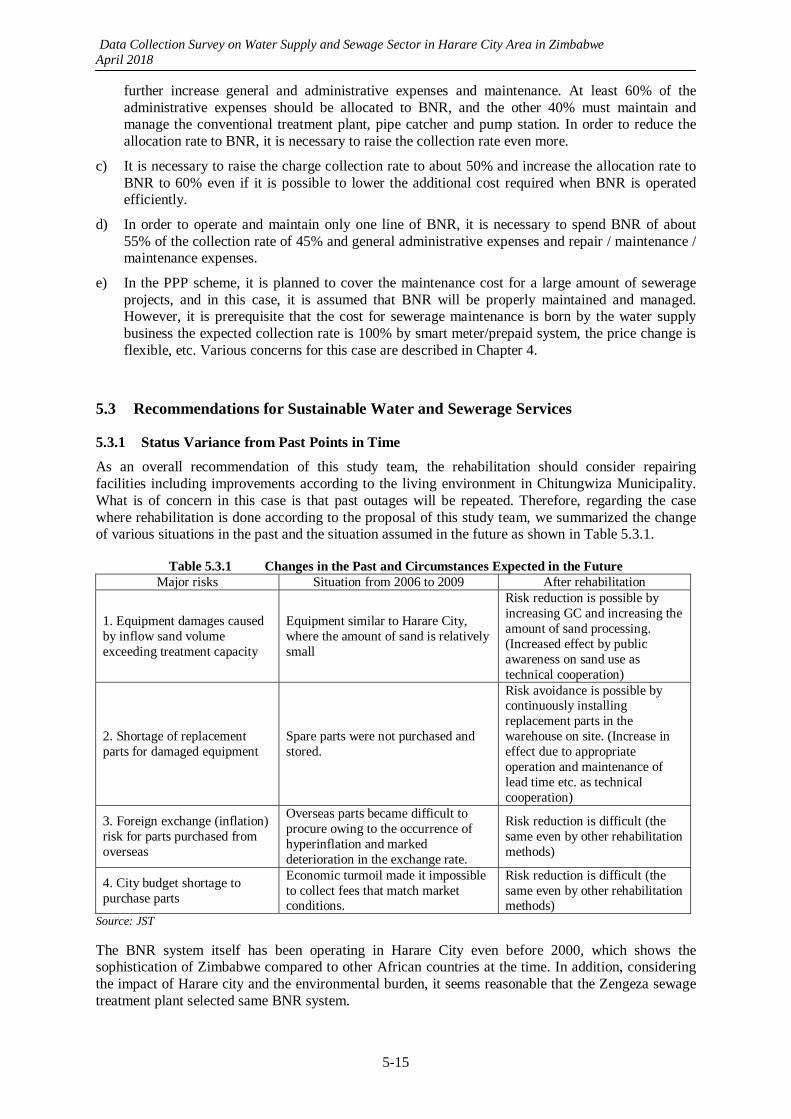
Data Collection Survey on Water Supply and Sewage Sector in Harare City Area in Zimbabwe April 2018
5-15
further increase general and administrative expenses and maintenance. At least 60% of the administrative expenses should be allocated to BNR, and the other 40% must maintain and manage the conventional treatment plant, pipe catcher and pump station. In order to reduce the allocation rate to BNR, it is necessary to raise the collection rate even more.
c) It is necessary to raise the charge collection rate to about 50% and increase the allocation rate to BNR to 60% even if it is possible to lower the additional cost required when BNR is operated efficiently.
d) In order to operate and maintain only one line of BNR, it is necessary to spend BNR of about 55% of the collection rate of 45% and general administrative expenses and repair / maintenance / maintenance expenses.
e) In the PPP scheme, it is planned to cover the maintenance cost for a large amount of sewerage projects, and in this case, it is assumed that BNR will be properly maintained and managed. However, it is prerequisite that the cost for sewerage maintenance is born by the water supply business the expected collection rate is 100% by smart meter/prepaid system, the price change is flexible, etc. Various concerns for this case are described in Chapter 4.
5.3 Recommendations for Sustainable Water and Sewerage Services
5.3.1 Status Variance from Past Points in Time
As an overall recommendation of this study team, the rehabilitation should consider repairing facilities including improvements according to the living environment in Chitungwiza Municipality. What is of concern in this case is that past outages will be repeated. Therefore, regarding the case where rehabilitation is done according to the proposal of this study team, we summarized the change of various situations in the past and the situation assumed in the future as shown in Table 5.3.1.
Table 5.3.1 Changes in the Past and Circumstances Expected in the Future Major risks Situation from 2006 to 2009 After rehabilitation
1. Equipment damages caused by inflow sand volume exceeding treatment capacity
Equipment similar to Harare City, where the amount of sand is relatively small
Risk reduction is possible by increasing GC and increasing the amount of sand processing. (Increased effect by public awareness on sand use as technical cooperation)
2. Shortage of replacement parts for damaged equipment
Spare parts were not purchased and stored.
Risk avoidance is possible by continuously installing replacement parts in the warehouse on site. (Increase in effect due to appropriate operation and maintenance of lead time etc. as technical cooperation)
3. Foreign exchange (inflation) risk for parts purchased from overseas
Overseas parts became difficult to procure owing to the occurrence of hyperinflation and marked deterioration in the exchange rate.
Risk reduction is difficult (the same even by other rehabilitation methods)
4. City budget shortage to purchase parts
Economic turmoil made it impossible to collect fees that match market conditions.
Risk reduction is difficult (the same even by other rehabilitation methods)
Source: JST The BNR system itself has been operating in Harare City even before 2000, which shows the sophistication of Zimbabwe compared to other African countries at the time. In addition, considering the impact of Harare city and the environmental burden, it seems reasonable that the Zengeza sewage treatment plant selected same BNR system.
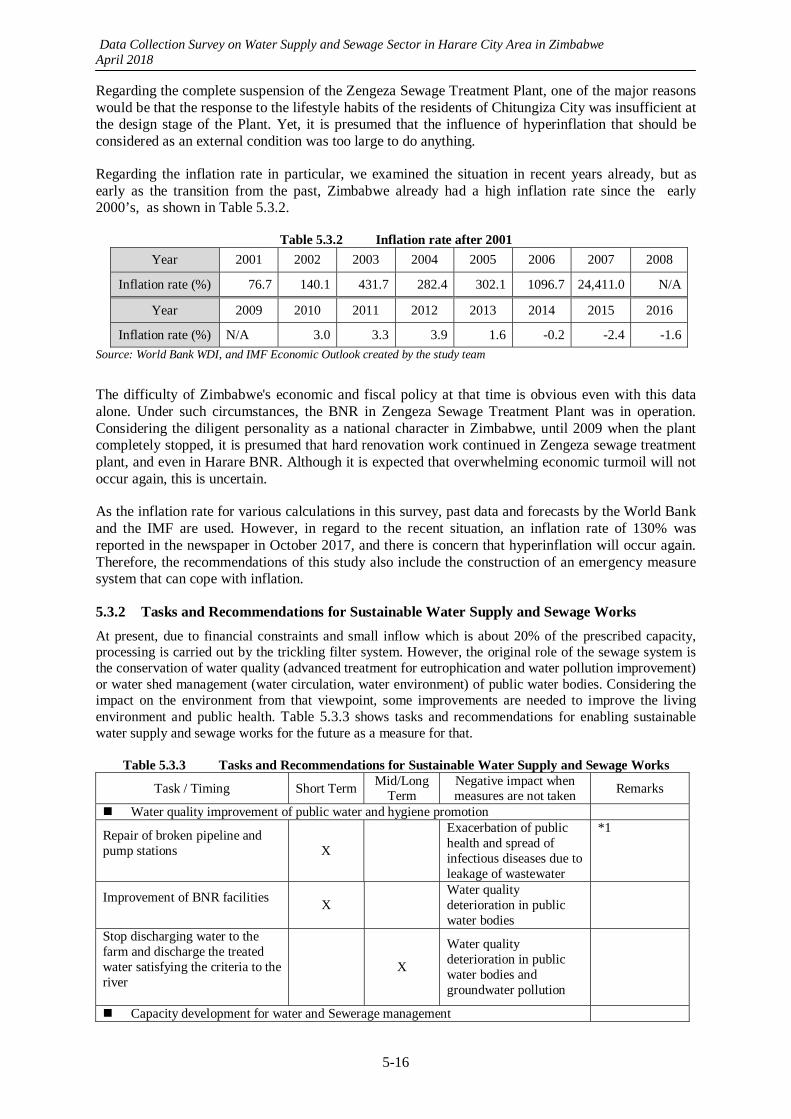
Data Collection Survey on Water Supply and Sewage Sector in Harare City Area in Zimbabwe April 2018
5-16
Regarding the complete suspension of the Zengeza Sewage Treatment Plant, one of the major reasons would be that the response to the lifestyle habits of the residents of Chitungiza City was insufficient at the design stage of the Plant. Yet, it is presumed that the influence of hyperinflation that should be considered as an external condition was too large to do anything.
Regarding the inflation rate in particular, we examined the situation in recent years already, but as early as the transition from the past, Zimbabwe already had a high inflation rate since the early 2000’s, as shown in Table 5.3.2.
Table 5.3.2 Inflation rate after 2001
Year 2001 2002 2003 2004 2005 2006 2007 2008
Inflation rate (%) 76.7 140.1 431.7 282.4 302.1 1096.7 24,411.0 N/A
Year 2009 2010 2011 2012 2013 2014 2015 2016
Inflation rate (%) N/A 3.0 3.3 3.9 1.6 -0.2 -2.4 -1.6
Source: World Bank WDI, and IMF Economic Outlook created by the study team
The difficulty of Zimbabwe's economic and fiscal policy at that time is obvious even with this data alone. Under such circumstances, the BNR in Zengeza Sewage Treatment Plant was in operation. Considering the diligent personality as a national character in Zimbabwe, until 2009 when the plant completely stopped, it is presumed that hard renovation work continued in Zengeza sewage treatment plant, and even in Harare BNR. Although it is expected that overwhelming economic turmoil will not occur again, this is uncertain.
As the inflation rate for various calculations in this survey, past data and forecasts by the World Bank and the IMF are used. However, in regard to the recent situation, an inflation rate of 130% was reported in the newspaper in October 2017, and there is concern that hyperinflation will occur again. Therefore, the recommendations of this study also include the construction of an emergency measure system that can cope with inflation.
5.3.2 Tasks and Recommendations for Sustainable Water Supply and Sewage Works
At present, due to financial constraints and small inflow which is about 20% of the prescribed capacity, processing is carried out by the trickling filter system. However, the original role of the sewage system is the conservation of water quality (advanced treatment for eutrophication and water pollution improvement) or water shed management (water circulation, water environment) of public water bodies. Considering the impact on the environment from that viewpoint, some improvements are needed to improve the living environment and public health. Table 5.3.3 shows tasks and recommendations for enabling sustainable water supply and sewage works for the future as a measure for that.
Table 5.3.3 Tasks and Recommendations for Sustainable Water Supply and Sewage Works
Task / Timing Short TermMid/Long
Term Negative impact when measures are not taken Remarks
Water quality improvement of public water and hygiene promotion
Repair of broken pipeline and pump stations
X
Exacerbation of public health and spread of infectious diseases due to leakage of wastewater
*1
Improvement of BNR facilities
X Water quality deterioration in public water bodies
Stop discharging water to the farm and discharge the treated water satisfying the criteria to the river
X
Water quality deterioration in public water bodies and groundwater pollution
Capacity development for water and Sewerage management
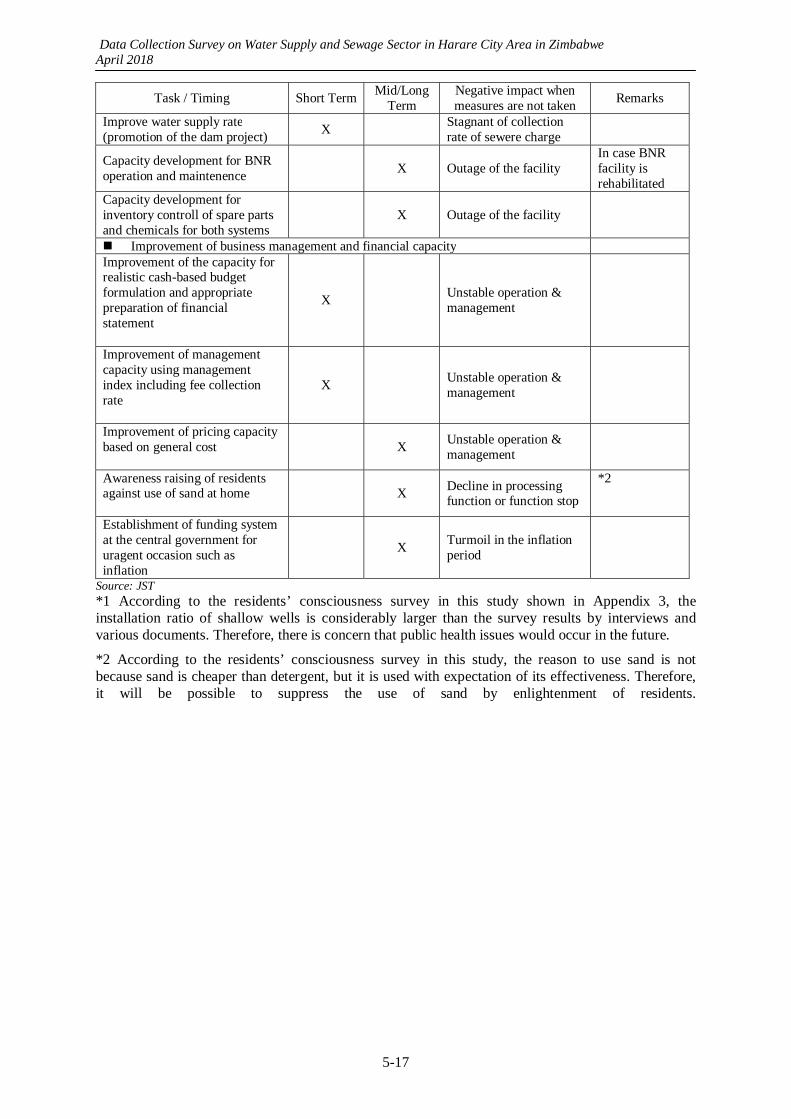
Data Collection Survey on Water Supply and Sewage Sector in Harare City Area in Zimbabwe April 2018
5-17
Task / Timing Short TermMid/Long
Term Negative impact when measures are not taken
Remarks
Improve water supply rate(promotion of the dam project)
X Stagnant of collection rate of sewere charge
Capacity development for BNR operation and maintenence
X Outage of the facility In case BNR facility is rehabilitated
Capacity development for inventory controll of spare parts and chemicals for both systems
X Outage of the facility
Improvement of business management and financial capacity Improvement of the capacity for realistic cash-based budget formulation and appropriate preparation of financial statement
X Unstable operation & management
Improvement of management capacity using management index including fee collection rate
X Unstable operation & management
Improvement of pricing capacity based on general cost
X Unstable operation & management
Awareness raising of residents against use of sand at home
X Decline in processing function or function stop
*2
Establishment of funding system at the central government for uragent occasion such as inflation
X Turmoil in the inflation period
Source: JST *1 According to the residents’ consciousness survey in this study shown in Appendix 3, the installation ratio of shallow wells is considerably larger than the survey results by interviews and various documents. Therefore, there is concern that public health issues would occur in the future.
*2 According to the residents’ consciousness survey in this study, the reason to use sand is not because sand is cheaper than detergent, but it is used with expectation of its effectiveness. Therefore, it will be possible to suppress the use of sand by enlightenment of residents.
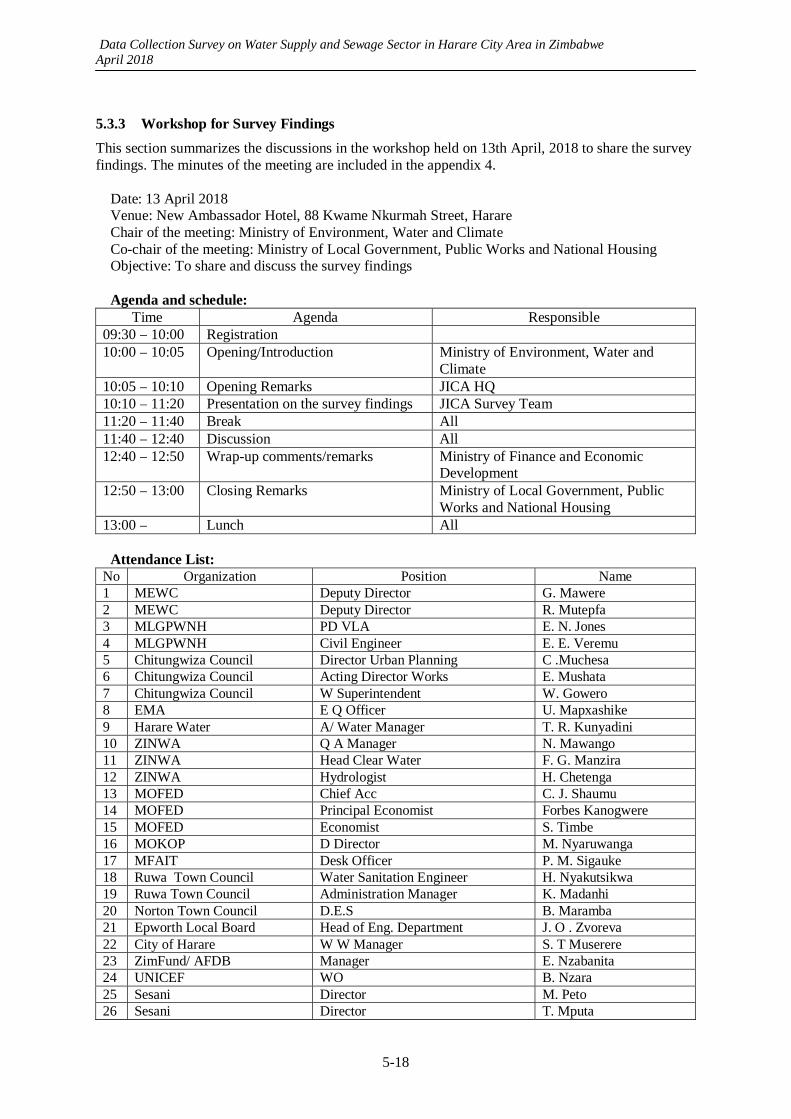
Data Collection Survey on Water Supply and Sewage Sector in Harare City Area in Zimbabwe April 2018
5-18
5.3.3 Workshop for Survey Findings
This section summarizes the discussions in the workshop held on 13th April, 2018 to share the survey findings. The minutes of the meeting are included in the appendix 4.
Date: 13 April 2018 Venue: New Ambassador Hotel, 88 Kwame Nkurmah Street, Harare Chair of the meeting: Ministry of Environment, Water and Climate Co-chair of the meeting: Ministry of Local Government, Public Works and National Housing Objective: To share and discuss the survey findings Agenda and schedule:
Time Agenda Responsible 09:30 – 10:00 Registration 10:00 – 10:05 Opening/Introduction Ministry of Environment, Water and
Climate 10:05 – 10:10 Opening Remarks JICA HQ10:10 – 11:20 Presentation on the survey findings JICA Survey Team11:20 – 11:40 Break All11:40 – 12:40 Discussion All12:40 – 12:50 Wrap-up comments/remarks Ministry of Finance and Economic
Development 12:50 – 13:00 Closing Remarks Ministry of Local Government, Public
Works and National Housing 13:00 – Lunch All
Attendance List:
No Organization Position Name 1 MEWC Deputy Director G. Mawere 2 MEWC Deputy Director R. Mutepfa 3 MLGPWNH PD VLA E. N. Jones 4 MLGPWNH Civil Engineer E. E. Veremu 5 Chitungwiza Council Director Urban Planning C .Muchesa 6 Chitungwiza Council Acting Director Works E. Mushata 7 Chitungwiza Council W Superintendent W. Gowero 8 EMA E Q Officer U. Mapxashike 9 Harare Water A/ Water Manager T. R. Kunyadini 10 ZINWA Q A Manager N. Mawango 11 ZINWA Head Clear Water F. G. Manzira 12 ZINWA Hydrologist H. Chetenga 13 MOFED Chief Acc C. J. Shaumu 14 MOFED Principal Economist Forbes Kanogwere 15 MOFED Economist S. Timbe 16 MOKOP D Director M. Nyaruwanga 17 MFAIT Desk Officer P. M. Sigauke 18 Ruwa Town Council Water Sanitation Engineer H. Nyakutsikwa 19 Ruwa Town Council Administration Manager K. Madanhi 20 Norton Town Council D.E.S B. Maramba 21 Epworth Local Board Head of Eng. Department J. O . Zvoreva 22 City of Harare W W Manager S. T Muserere 23 ZimFund/ AFDB Manager E. Nzabanita 24 UNICEF WO B. Nzara 25 Sesani Director M. Peto 26 Sesani Director T. Mputa

Data Collection Survey on Water Supply and Sewage Sector in Harare City Area in Zimbabwe April 2018
5-19
No Organization Position Name 27 JICA HQ Director Masanori Kurisu 28 JICA HQ Deputy Director Ryousuke Nakase 29 JICA Zim Office Resident Representative Shumon Yoshiara 30 JICA Zim Office Project Formulation Advisor Sakae Kashihara 31 JICA Zim Office P.O Tachiwana. Nkomo 32 JICA South Africa Chief Representative Seki Tomohiro 33 JICA South Africa Representative Tsubota Yumiko 34 JICA Study Team Consultant Tatsuo Tomidokoro 35 JICA Study Team Consultant Natsuki Shimegi
Discussion points: The water treated with trickling filter method has high environmental burden and it is unsuitable
to discharge into surface water from the viewpoint of water circulation. The participants understand the necessity and importance of restarting BNR at Zengeza sewage
treatment plant for reducing environmental burden. Zim-Fund has experience of renovation of BNR facility which was in the similar state of Zengeza
BNR. Since the financial burden of BNR is very large, it is difficult to operate under the current
financial situation. BNR will be required after the population of Chitungwiza increases (inflow volume increase) in
the future. It is necessary to lower the maintenance cost in BNR. It is desirable that BNR be restarted after the action plan is formulated by Zimbabwean
government and short and medium term efforts are made accordingly.
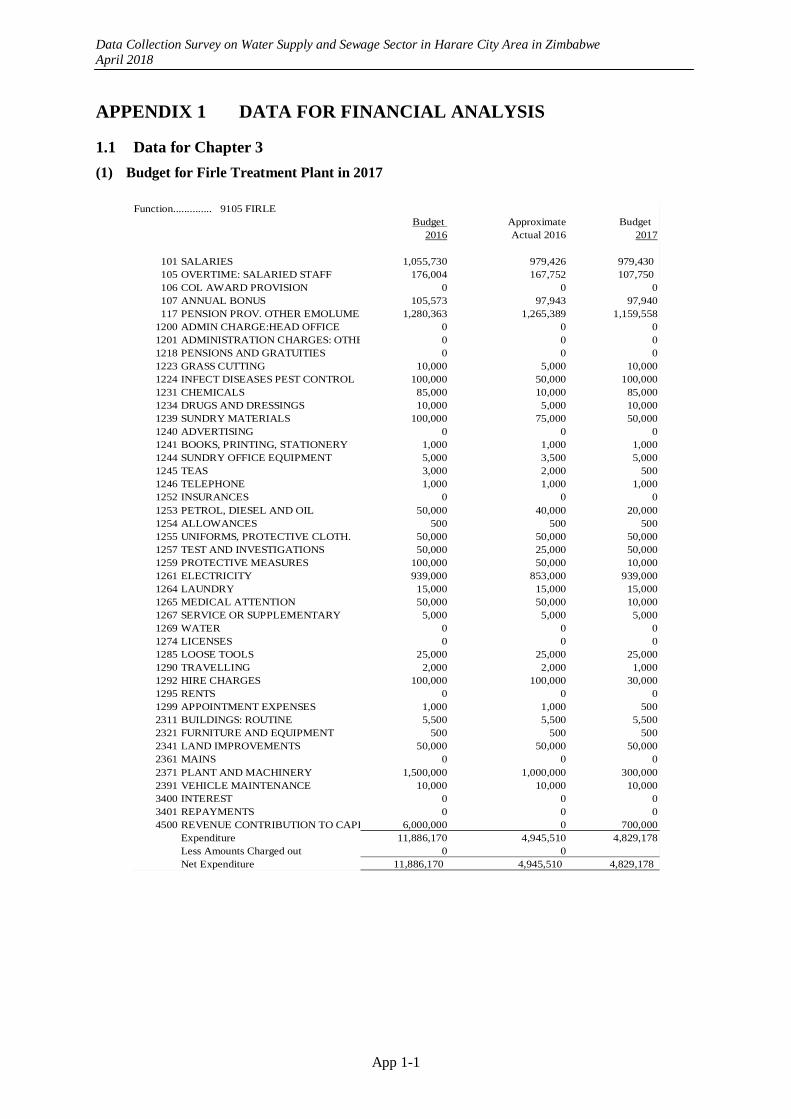
Data Collection Survey on Water Supply and Sewage Sector in Harare City Area in Zimbabwe April 2018
App 1-1
APPENDIX 1 DATA FOR FINANCIAL ANALYSIS
1.1 Data for Chapter 3
(1) Budget for Firle Treatment Plant in 2017
Function.............. 9105 FIRLE
Budget Approximate Budget 2016 Actual 2016 2017
101 SALARIES 1,055,730 979,426 979,430 105 OVERTIME: SALARIED STAFF 176,004 167,752 107,750 106 COL AWARD PROVISION 0 0 0107 ANNUAL BONUS 105,573 97,943 97,940117 PENSION PROV. OTHER EMOLUMEN 1,280,363 1,265,389 1,159,558
1200 ADMIN CHARGE:HEAD OFFICE 0 0 01201 ADMINISTRATION CHARGES: OTHE 0 0 01218 PENSIONS AND GRATUITIES 0 0 01223 GRASS CUTTING 10,000 5,000 10,0001224 INFECT DISEASES PEST CONTROL 100,000 50,000 100,0001231 CHEMICALS 85,000 10,000 85,0001234 DRUGS AND DRESSINGS 10,000 5,000 10,0001239 SUNDRY MATERIALS 100,000 75,000 50,0001240 ADVERTISING 0 0 01241 BOOKS, PRINTING, STATIONERY 1,000 1,000 1,0001244 SUNDRY OFFICE EQUIPMENT 5,000 3,500 5,0001245 TEAS 3,000 2,000 5001246 TELEPHONE 1,000 1,000 1,0001252 INSURANCES 0 0 01253 PETROL, DIESEL AND OIL 50,000 40,000 20,0001254 ALLOWANCES 500 500 5001255 UNIFORMS, PROTECTIVE CLOTH. 50,000 50,000 50,0001257 TEST AND INVESTIGATIONS 50,000 25,000 50,0001259 PROTECTIVE MEASURES 100,000 50,000 10,0001261 ELECTRICITY 939,000 853,000 939,0001264 LAUNDRY 15,000 15,000 15,0001265 MEDICAL ATTENTION 50,000 50,000 10,0001267 SERVICE OR SUPPLEMENTARY 5,000 5,000 5,0001269 WATER 0 0 01274 LICENSES 0 0 01285 LOOSE TOOLS 25,000 25,000 25,0001290 TRAVELLING 2,000 2,000 1,0001292 HIRE CHARGES 100,000 100,000 30,0001295 RENTS 0 0 01299 APPOINTMENT EXPENSES 1,000 1,000 5002311 BUILDINGS: ROUTINE 5,500 5,500 5,5002321 FURNITURE AND EQUIPMENT 500 500 5002341 LAND IMPROVEMENTS 50,000 50,000 50,0002361 MAINS 0 0 02371 PLANT AND MACHINERY 1,500,000 1,000,000 300,0002391 VEHICLE MAINTENANCE 10,000 10,000 10,0003400 INTEREST 0 0 03401 REPAYMENTS 0 0 04500 REVENUE CONTRIBUTION TO CAPI 6,000,000 0 700,000
Expenditure 11,886,170 4,945,510 4,829,178Less Amounts Charged out 0 0Net Expenditure 11,886,170 4,945,510 4,829,178
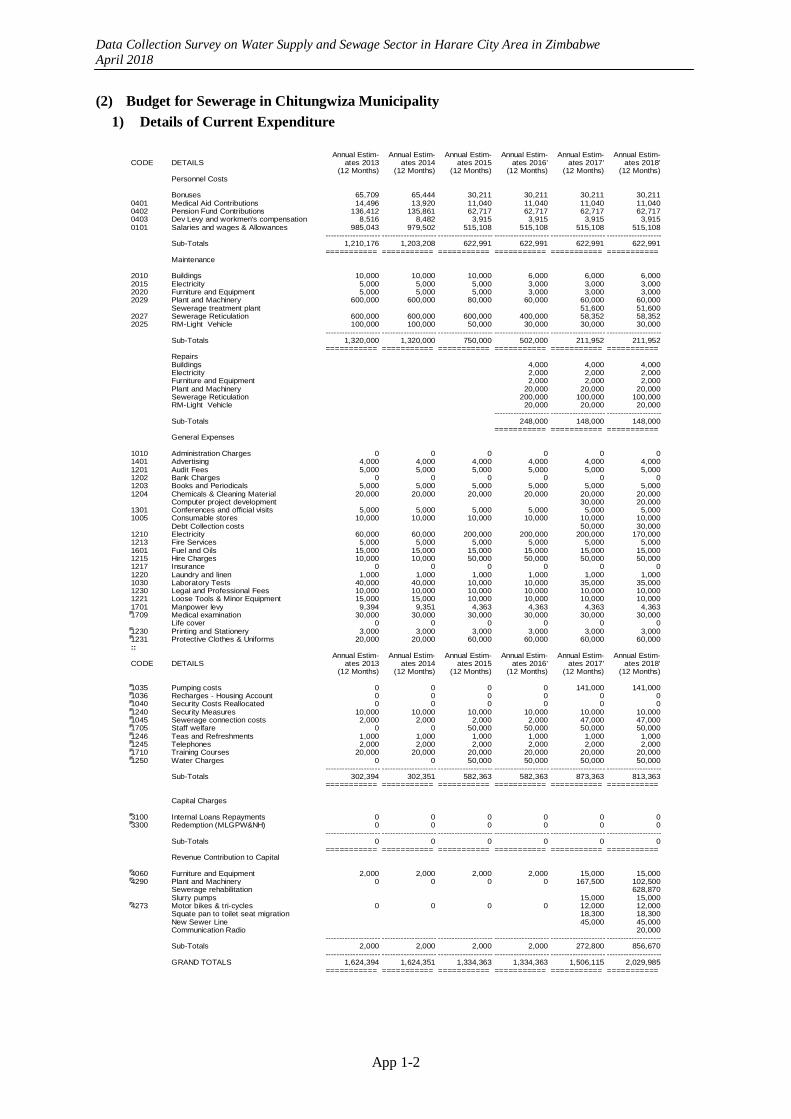
Data Collection Survey on Water Supply and Sewage Sector in Harare City Area in Zimbabwe April 2018
App 1-2
(2) Budget for Sewerage in Chitungwiza Municipality
1) Details of Current Expenditure
Annual Estim- Annual Estim- Annual Estim- Annual Estim- Annual Estim- Annual Estim-
CODE DETAILS ates 2013 ates 2014 ates 2015 ates 2016' ates 2017' ates 2018'(12 Months) (12 Months) (12 Months) (12 Months) (12 Months) (12 Months)
Personnel Costs
Bonuses 65,709 65,444 30,211 30,211 30,211 30,2110401 Medical Aid Contributions 14,496 13,920 11,040 11,040 11,040 11,0400402 Pension Fund Contributions 136,412 135,861 62,717 62,717 62,717 62,7170403 Dev Levy and workmen's compensation 8,516 8,482 3,915 3,915 3,915 3,9150101 Salaries and wages & Allowances 985,043 979,502 515,108 515,108 515,108 515,108
-------------------- -------------------- -------------------- -------------------- -------------------- --------------------Sub-Totals 1,210,176 1,203,208 622,991 622,991 622,991 622,991
=========== =========== =========== =========== =========== ===========Maintenance
2010 Buildings 10,000 10,000 10,000 6,000 6,000 6,0002015 Electricity 5,000 5,000 5,000 3,000 3,000 3,0002020 Furniture and Equipment 5,000 5,000 5,000 3,000 3,000 3,0002029 Plant and Machinery 600,000 600,000 80,000 60,000 60,000 60,000
Sewerage treatment plant 51,600 51,6002027 Sewerage Reticulation 600,000 600,000 600,000 400,000 58,352 58,3522025 RM-Light Vehicle 100,000 100,000 50,000 30,000 30,000 30,000
-------------------- -------------------- -------------------- -------------------- -------------------- --------------------Sub-Totals 1,320,000 1,320,000 750,000 502,000 211,952 211,952
=========== =========== =========== =========== =========== ===========Repairs Buildings 4,000 4,000 4,000Electricity 2,000 2,000 2,000Furniture and Equipment 2,000 2,000 2,000Plant and Machinery 20,000 20,000 20,000Sewerage Reticulation 200,000 100,000 100,000RM-Light Vehicle 20,000 20,000 20,000
-------------------- -------------------- --------------------Sub-Totals 248,000 148,000 148,000
=========== =========== ===========General Expenses
1010 Administration Charges 0 0 0 0 0 01401 Advertising 4,000 4,000 4,000 4,000 4,000 4,0001201 Audit Fees 5,000 5,000 5,000 5,000 5,000 5,0001202 Bank Charges 0 0 0 0 0 01203 Books and Periodicals 5,000 5,000 5,000 5,000 5,000 5,0001204 Chemicals & Cleaning Material 20,000 20,000 20,000 20,000 20,000 20,000
Computer project development 30,000 20,0001301 Conferences and official visits 5,000 5,000 5,000 5,000 5,000 5,0001005 Consumable stores 10,000 10,000 10,000 10,000 10,000 10,000
Debt Collection costs 50,000 30,0001210 Electricity 60,000 60,000 200,000 200,000 200,000 170,0001213 Fire Services 5,000 5,000 5,000 5,000 5,000 5,0001601 Fuel and Oils 15,000 15,000 15,000 15,000 15,000 15,0001215 Hire Charges 10,000 10,000 50,000 50,000 50,000 50,0001217 Insurance 0 0 0 0 0 01220 Laundry and linen 1,000 1,000 1,000 1,000 1,000 1,0001030 Laboratory Tests 40,000 40,000 10,000 10,000 35,000 35,0001230 Legal and Professional Fees 10,000 10,000 10,000 10,000 10,000 10,0001221 Loose Tools & Minor Equipment 15,000 15,000 10,000 10,000 10,000 10,0001701 Manpower levy 9,394 9,351 4,363 4,363 4,363 4,3631709 Medical examination 30,000 30,000 30,000 30,000 30,000 30,000
Life cover 0 0 0 0 0 01230 Printing and Stationery 3,000 3,000 3,000 3,000 3,000 3,0001231 Protective Clothes & Uniforms 20,000 20,000 60,000 60,000 60,000 60,000::
Annual Estim- Annual Estim- Annual Estim- Annual Estim- Annual Estim- Annual Estim-CODE DETAILS ates 2013 ates 2014 ates 2015 ates 2016' ates 2017' ates 2018'
(12 Months) (12 Months) (12 Months) (12 Months) (12 Months) (12 Months)
1035 Pumping costs 0 0 0 0 141,000 141,0001036 Recharges - Housing Account 0 0 0 0 0 01040 Security Costs Reallocated 0 0 0 0 0 01240 Security Measures 10,000 10,000 10,000 10,000 10,000 10,0001045 Sewerage connection costs 2,000 2,000 2,000 2,000 47,000 47,0001705 Staff welfare 0 0 50,000 50,000 50,000 50,0001246 Teas and Refreshments 1,000 1,000 1,000 1,000 1,000 1,0001245 Telephones 2,000 2,000 2,000 2,000 2,000 2,0001710 Training Courses 20,000 20,000 20,000 20,000 20,000 20,0001250 Water Charges 0 0 50,000 50,000 50,000 50,000
-------------------- -------------------- -------------------- -------------------- -------------------- --------------------Sub-Totals 302,394 302,351 582,363 582,363 873,363 813,363
=========== =========== =========== =========== =========== ===========
Capital Charges
3100 Internal Loans Repayments 0 0 0 0 0 03300 Redemption (MLGPW&NH) 0 0 0 0 0 0
-------------------- -------------------- -------------------- -------------------- -------------------- --------------------Sub-Totals 0 0 0 0 0 0
=========== =========== =========== =========== =========== ===========Revenue Contribution to Capital
4060 Furniture and Equipment 2,000 2,000 2,000 2,000 15,000 15,0004290 Plant and Machinery 0 0 0 0 167,500 102,500
Sewerage rehabilitation 628,870Slurry pumps 15,000 15,000
4273 Motor bikes & tri-cycles 0 0 0 0 12,000 12,000Squate pan to toilet seat migration 18,300 18,300New Sewer Line 45,000 45,000Communication Radio 20,000
-------------------- -------------------- -------------------- -------------------- -------------------- --------------------Sub-Totals 2,000 2,000 2,000 2,000 272,800 856,670
-------------------- -------------------- -------------------- -------------------- -------------------- --------------------GRAND TOTALS 1,624,394 1,624,351 1,334,363 1,334,363 1,506,115 2,029,985
=========== =========== =========== =========== =========== ===========
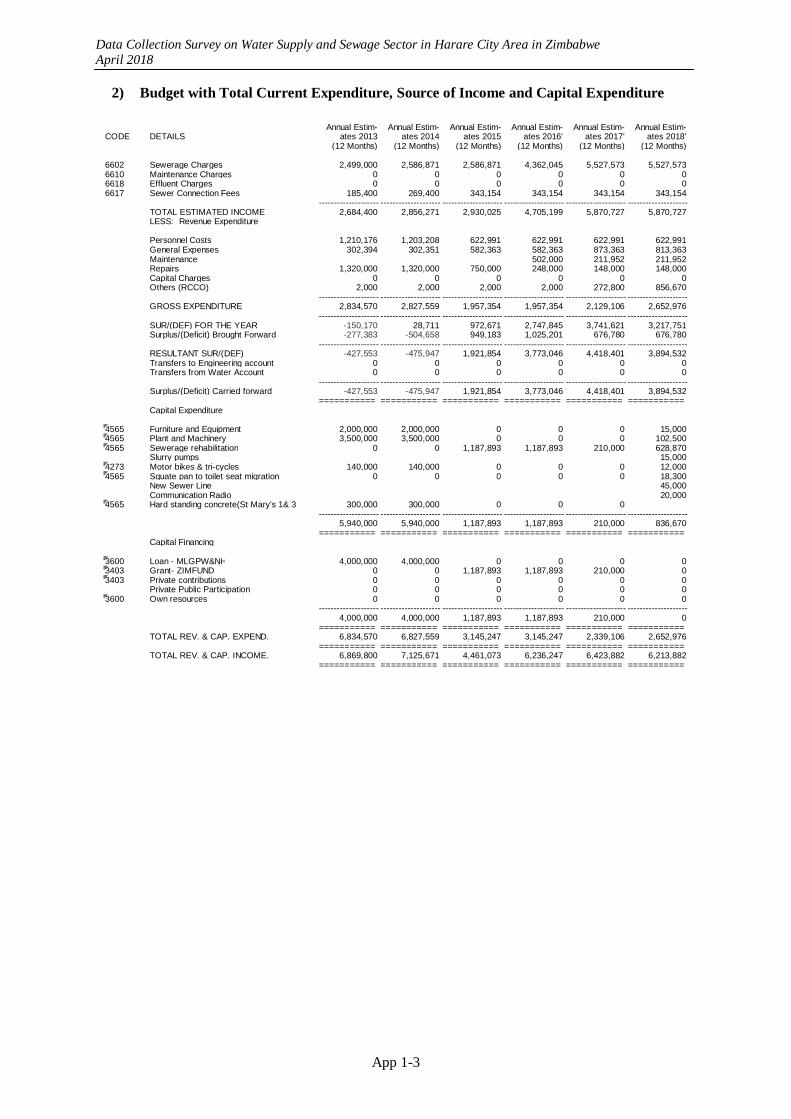
Data Collection Survey on Water Supply and Sewage Sector in Harare City Area in Zimbabwe April 2018
App 1-3
2) Budget with Total Current Expenditure, Source of Income and Capital Expenditure
Annual Estim- Annual Estim- Annual Estim- Annual Estim- Annual Estim- Annual Estim-
CODE DETAILS ates 2013 ates 2014 ates 2015 ates 2016' ates 2017' ates 2018'(12 Months) (12 Months) (12 Months) (12 Months) (12 Months) (12 Months)
6602 Sewerage Charges 2,499,000 2,586,871 2,586,871 4,362,045 5,527,573 5,527,5736610 Maintenance Charges 0 0 0 0 0 06618 Effluent Charges 0 0 0 0 0 06617 Sewer Connection Fees 185,400 269,400 343,154 343,154 343,154 343,154
-------------------- -------------------- -------------------- -------------------- -------------------- --------------------TOTAL ESTIMATED INCOME 2,684,400 2,856,271 2,930,025 4,705,199 5,870,727 5,870,727LESS: Revenue Expenditure
Personnel Costs 1,210,176 1,203,208 622,991 622,991 622,991 622,991General Expenses 302,394 302,351 582,363 582,363 873,363 813,363Maintenance 502,000 211,952 211,952Repairs 1,320,000 1,320,000 750,000 248,000 148,000 148,000Capital Charges 0 0 0 0 0 0Others (RCCO) 2,000 2,000 2,000 2,000 272,800 856,670
-------------------- -------------------- -------------------- -------------------- -------------------- --------------------GROSS EXPENDITURE 2,834,570 2,827,559 1,957,354 1,957,354 2,129,106 2,652,976
-------------------- -------------------- -------------------- -------------------- -------------------- --------------------SUR/(DEF) FOR THE YEAR -150,170 28,711 972,671 2,747,845 3,741,621 3,217,751Surplus/(Deficit) Brought Forward -277,383 -504,658 949,183 1,025,201 676,780 676,780
-------------------- -------------------- -------------------- -------------------- -------------------- --------------------RESULTANT SUR/(DEF) -427,553 -475,947 1,921,854 3,773,046 4,418,401 3,894,532Transfers to Engineering account 0 0 0 0 0 0Transfers from Water Account 0 0 0 0 0 0
-------------------- -------------------- -------------------- -------------------- -------------------- --------------------Surplus/(Deficit) Carried forward -427,553 -475,947 1,921,854 3,773,046 4,418,401 3,894,532
=========== =========== =========== =========== =========== ===========Capital Expenditure
4565 Furniture and Equipment 2,000,000 2,000,000 0 0 0 15,0004565 Plant and Machinery 3,500,000 3,500,000 0 0 0 102,5004565 Sewerage rehabilitation 0 0 1,187,893 1,187,893 210,000 628,870
Slurry pumps 15,0004273 Motor bikes & tri-cycles 140,000 140,000 0 0 0 12,0004565 Squate pan to toilet seat migration 0 0 0 0 0 18,300
New Sewer Line 45,000Communication Radio 20,000
4565 Hard standing concrete(St Mary's 1& 3 300,000 300,000 0 0 0-------------------- -------------------- -------------------- -------------------- -------------------- --------------------
5,940,000 5,940,000 1,187,893 1,187,893 210,000 836,670=========== =========== =========== =========== =========== ===========
Capital Financing
3600 Loan - MLGPW&NH 4,000,000 4,000,000 0 0 0 03403 Grant- ZIMFUND 0 0 1,187,893 1,187,893 210,000 03403 Private contributions 0 0 0 0 0 0
Private Public Participation 0 0 0 0 0 03600 Own resources 0 0 0 0 0 0
-------------------- -------------------- -------------------- -------------------- -------------------- --------------------4,000,000 4,000,000 1,187,893 1,187,893 210,000 0
=========== =========== =========== =========== =========== ===========TOTAL REV. & CAP. EXPEND. 6,834,570 6,827,559 3,145,247 3,145,247 2,339,106 2,652,976
=========== =========== =========== =========== =========== ===========TOTAL REV. & CAP. INCOME. 6,869,800 7,125,671 4,461,073 6,236,247 6,423,882 6,213,882
=========== =========== =========== =========== =========== ===========
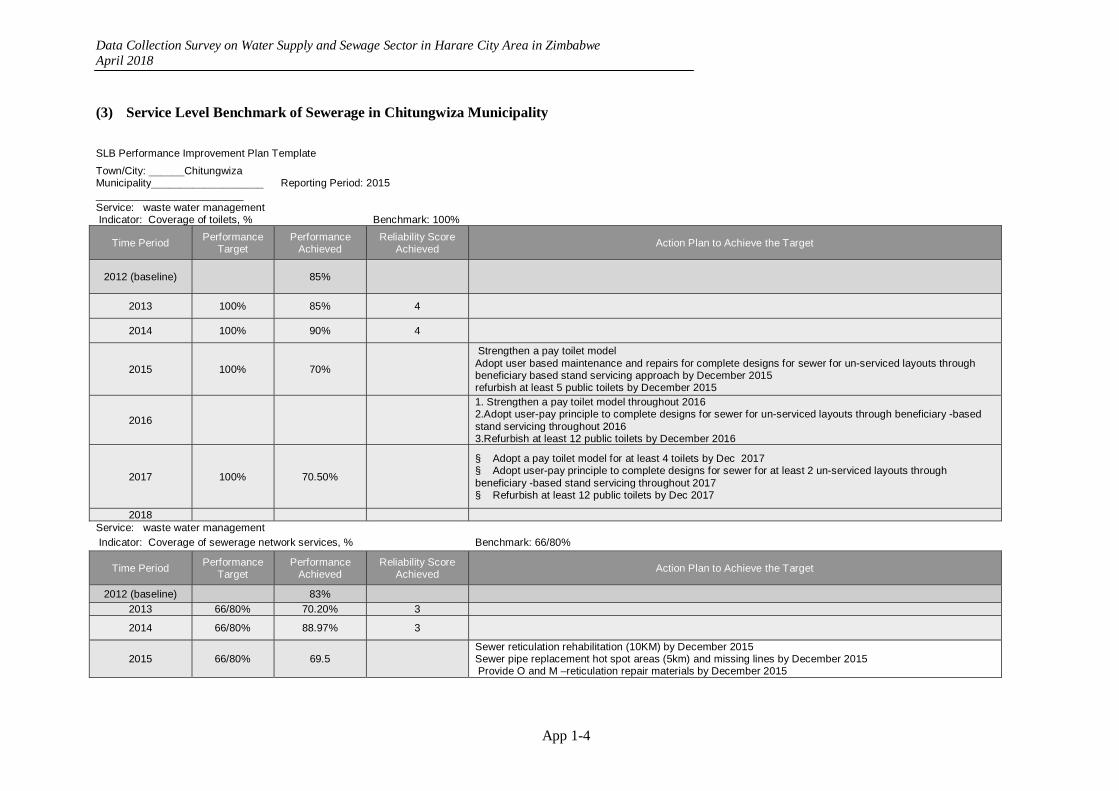
Data Collection Survey on Water Supply and Sewage Sector in Harare City Area in Zimbabwe April 2018
App 1-4
(3) Service Level Benchmark of Sewerage in Chitungwiza Municipality
SLB Performance Improvement Plan Template
Town/City: ______Chitungwiza Municipality____________________________________________
Reporting Period: 2015
Service: waste water management Indicator: Coverage of toilets, % Benchmark: 100%
Time Period Performance
Target Performance
Achieved Reliability Score
Achieved Action Plan to Achieve the Target
2012 (baseline)
85%
2013 100% 85% 4
2014 100% 90% 4
2015 100% 70%
Strengthen a pay toilet model Adopt user based maintenance and repairs for complete designs for sewer for un-serviced layouts through beneficiary based stand servicing approach by December 2015 refurbish at least 5 public toilets by December 2015
2016
1. Strengthen a pay toilet model throughout 2016 2.Adopt user-pay principle to complete designs for sewer for un-serviced layouts through beneficiary -based stand servicing throughout 2016 3.Refurbish at least 12 public toilets by December 2016
2017 100% 70.50%
§ Adopt a pay toilet model for at least 4 toilets by Dec 2017 § Adopt user-pay principle to complete designs for sewer for at least 2 un-serviced layouts through beneficiary -based stand servicing throughout 2017 § Refurbish at least 12 public toilets by Dec 2017
2018 Service: waste water management Indicator: Coverage of sewerage network services, % Benchmark: 66/80%
Time Period Performance
Target Performance
Achieved Reliability Score
Achieved Action Plan to Achieve the Target
2012 (baseline) 83%
2013 66/80% 70.20% 3
2014 66/80% 88.97% 3
2015 66/80% 69.5
Sewer reticulation rehabilitation (10KM) by December 2015 Sewer pipe replacement hot spot areas (5km) and missing lines by December 2015 Provide O and M –reticulation repair materials by December 2015
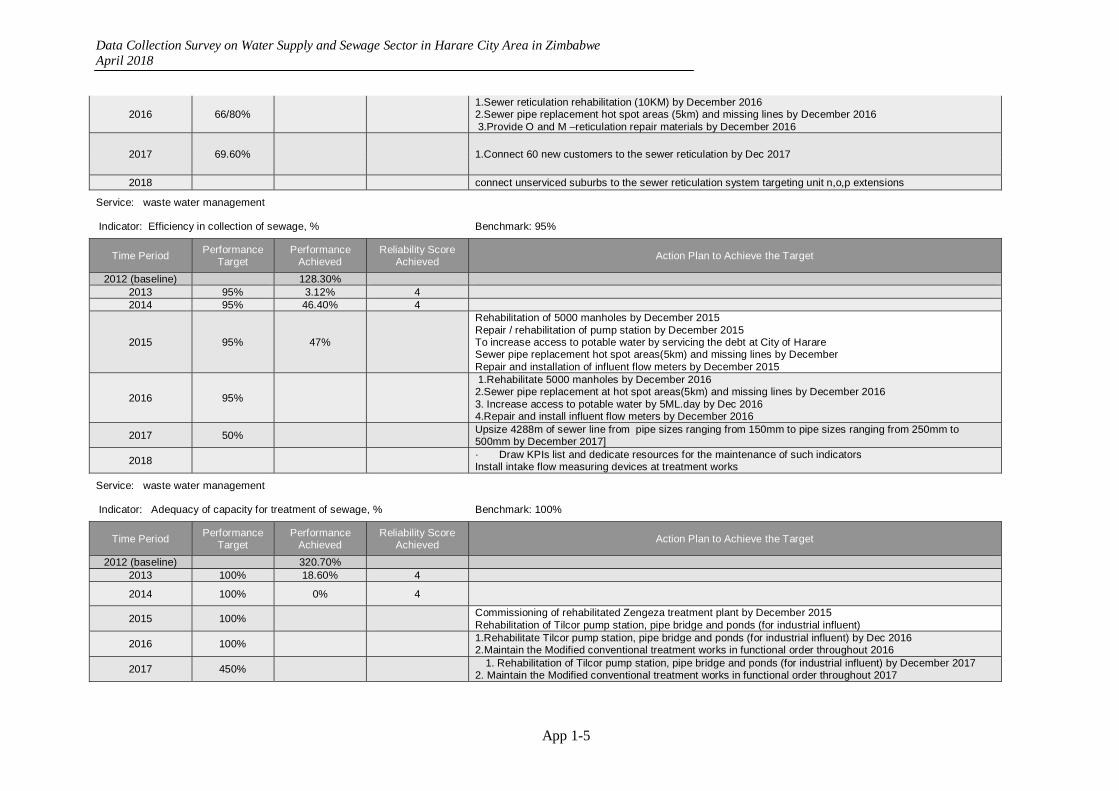
Data Collection Survey on Water Supply and Sewage Sector in Harare City Area in Zimbabwe April 2018
App 1-5
2016 66/80%
1.Sewer reticulation rehabilitation (10KM) by December 2016 2.Sewer pipe replacement hot spot areas (5km) and missing lines by December 2016 3.Provide O and M –reticulation repair materials by December 2016
2017 69.60%
1.Connect 60 new customers to the sewer reticulation by Dec 2017
2018 connect unserviced suburbs to the sewer reticulation system targeting unit n,o,p extensions
Service: waste water management
Indicator: Efficiency in collection of sewage, % Benchmark: 95%
Time Period Performance
Target Performance
Achieved Reliability Score
Achieved Action Plan to Achieve the Target
2012 (baseline) 128.30% 2013 95% 3.12% 4 2014 95% 46.40% 4
2015 95% 47%
Rehabilitation of 5000 manholes by December 2015 Repair / rehabilitation of pump station by December 2015 To increase access to potable water by servicing the debt at City of Harare Sewer pipe replacement hot spot areas(5km) and missing lines by December Repair and installation of influent flow meters by December 2015
2016 95%
1.Rehabilitate 5000 manholes by December 2016 2.Sewer pipe replacement at hot spot areas(5km) and missing lines by December 2016 3. Increase access to potable water by 5ML.day by Dec 2016 4.Repair and install influent flow meters by December 2016
2017 50%
Upsize 4288m of sewer line from pipe sizes ranging from 150mm to pipe sizes ranging from 250mm to 500mm by December 2017]
2018
· Draw KPIs list and dedicate resources for the maintenance of such indicators Install intake flow measuring devices at treatment works
Service: waste water management
Indicator: Adequacy of capacity for treatment of sewage, % Benchmark: 100%
Time Period Performance
Target Performance
Achieved Reliability Score
Achieved Action Plan to Achieve the Target
2012 (baseline) 320.70% 2013 100% 18.60% 4
2014 100% 0% 4
2015 100%
Commissioning of rehabilitated Zengeza treatment plant by December 2015 Rehabilitation of Tilcor pump station, pipe bridge and ponds (for industrial influent)
2016 100%
1.Rehabilitate Tilcor pump station, pipe bridge and ponds (for industrial influent) by Dec 2016 2.Maintain the Modified conventional treatment works in functional order throughout 2016
2017 450%
1. Rehabilitation of Tilcor pump station, pipe bridge and ponds (for industrial influent) by December 2017 2. Maintain the Modified conventional treatment works in functional order throughout 2017
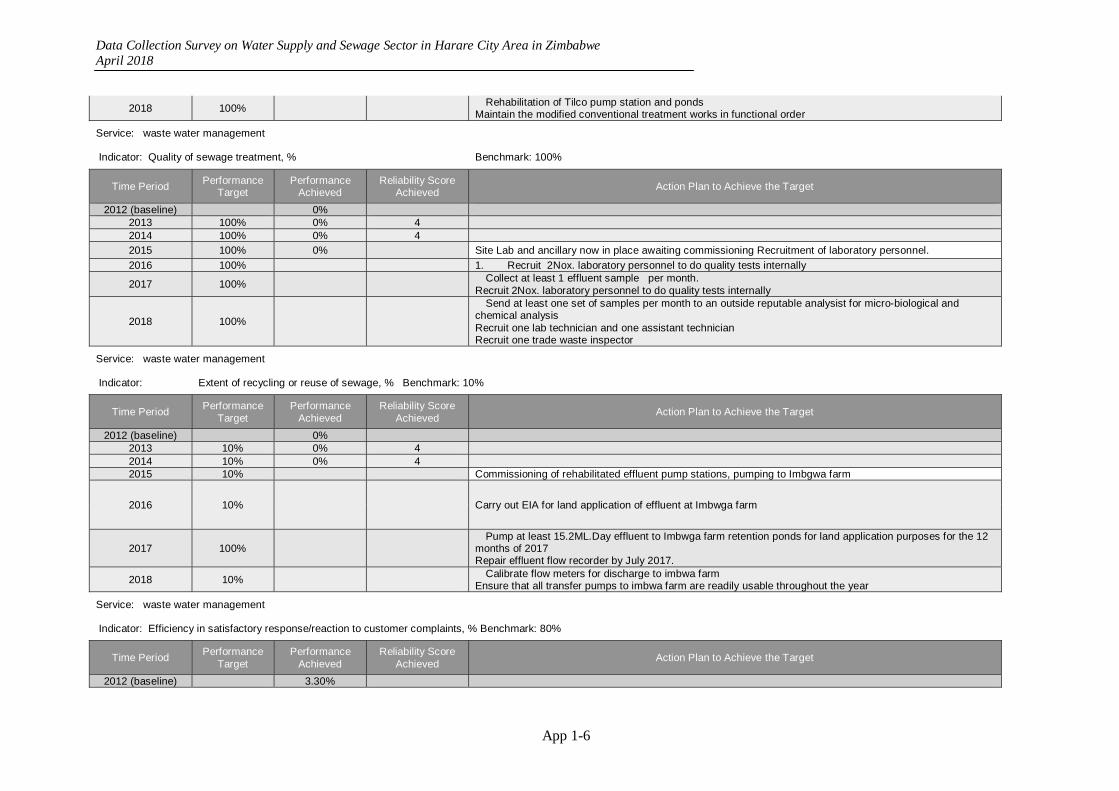
Data Collection Survey on Water Supply and Sewage Sector in Harare City Area in Zimbabwe April 2018
App 1-6
2018 100%
Rehabilitation of Tilco pump station and ponds Maintain the modified conventional treatment works in functional order
Service: waste water management
Indicator: Quality of sewage treatment, % Benchmark: 100%
Time Period Performance
Target Performance
Achieved Reliability Score
Achieved Action Plan to Achieve the Target
2012 (baseline) 0% 2013 100% 0% 4 2014 100% 0% 4 2015 100% 0% Site Lab and ancillary now in place awaiting commissioning Recruitment of laboratory personnel.
2016 100% 1. Recruit 2Nox. laboratory personnel to do quality tests internally
2017 100%
Collect at least 1 effluent sample per month. Recruit 2Nox. laboratory personnel to do quality tests internally
2018 100%
Send at least one set of samples per month to an outside reputable analysist for micro-biological and chemical analysis Recruit one lab technician and one assistant technician Recruit one trade waste inspector
Service: waste water management
Indicator: Extent of recycling or reuse of sewage, % Benchmark: 10%
Time Period Performance
Target Performance
Achieved Reliability Score
Achieved Action Plan to Achieve the Target
2012 (baseline) 0% 2013 10% 0% 4 2014 10% 0% 4 2015 10% Commissioning of rehabilitated effluent pump stations, pumping to Imbgwa farm
2016 10%
Carry out EIA for land application of effluent at Imbwga farm
2017 100%
Pump at least 15.2ML.Day effluent to Imbwga farm retention ponds for land application purposes for the 12 months of 2017 Repair effluent flow recorder by July 2017.
2018 10%
Calibrate flow meters for discharge to imbwa farm Ensure that all transfer pumps to imbwa farm are readily usable throughout the year
Service: waste water management
Indicator: Efficiency in satisfactory response/reaction to customer complaints, % Benchmark: 80%
Time Period Performance
Target Performance
Achieved Reliability Score
Achieved Action Plan to Achieve the Target
2012 (baseline) 3.30%
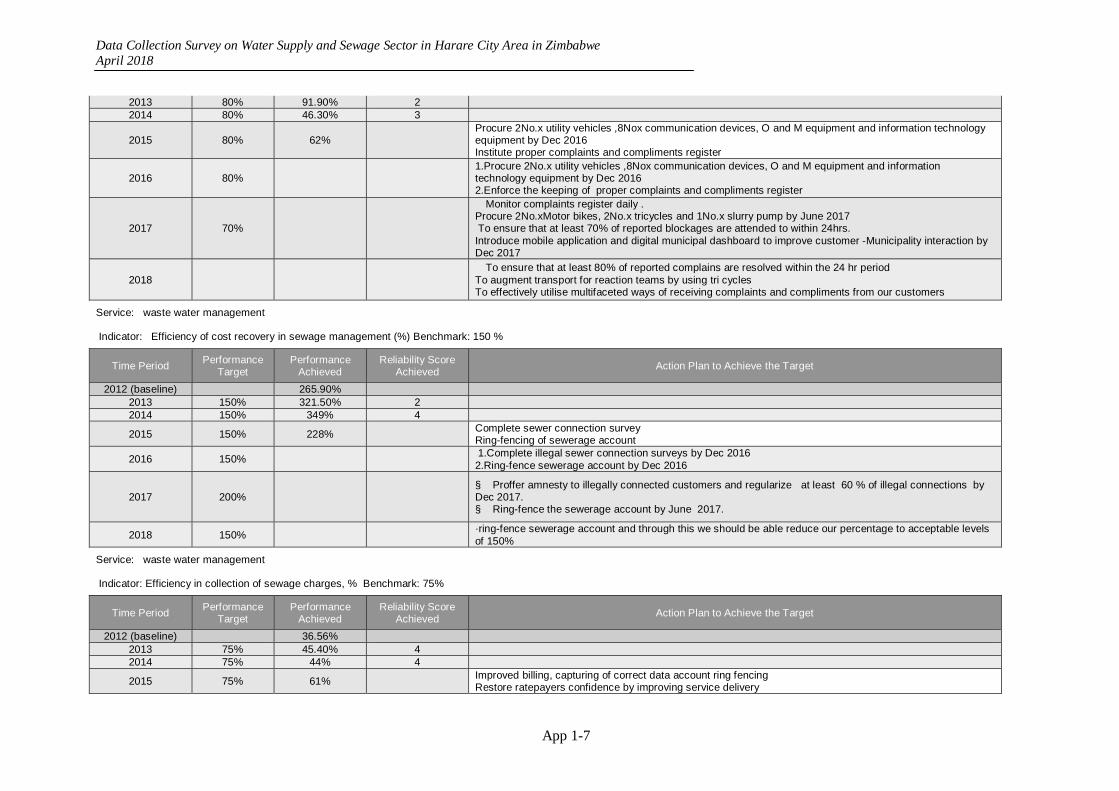
Data Collection Survey on Water Supply and Sewage Sector in Harare City Area in Zimbabwe April 2018
App 1-7
2013 80% 91.90% 2 2014 80% 46.30% 3
2015 80% 62%
Procure 2No.x utility vehicles ,8Nox communication devices, O and M equipment and information technology equipment by Dec 2016 Institute proper complaints and compliments register
2016 80%
1.Procure 2No.x utility vehicles ,8Nox communication devices, O and M equipment and information technology equipment by Dec 2016 2.Enforce the keeping of proper complaints and compliments register
2017 70%
Monitor complaints register daily . Procure 2No.xMotor bikes, 2No.x tricycles and 1No.x slurry pump by June 2017 To ensure that at least 70% of reported blockages are attended to within 24hrs. Introduce mobile application and digital municipal dashboard to improve customer -Municipality interaction by Dec 2017
2018
To ensure that at least 80% of reported complains are resolved within the 24 hr period To augment transport for reaction teams by using tri cycles To effectively utilise multifaceted ways of receiving complaints and compliments from our customers
Service: waste water management
Indicator: Efficiency of cost recovery in sewage management (%) Benchmark: 150 %
Time Period Performance
Target Performance
Achieved Reliability Score
Achieved Action Plan to Achieve the Target
2012 (baseline) 265.90% 2013 150% 321.50% 2 2014 150% 349% 4
2015 150% 228%
Complete sewer connection survey Ring-fencing of sewerage account
2016 150%
1.Complete illegal sewer connection surveys by Dec 2016 2.Ring-fence sewerage account by Dec 2016
2017 200%
§ Proffer amnesty to illegally connected customers and regularize at least 60 % of illegal connections by Dec 2017. § Ring-fence the sewerage account by June 2017.
2018 150%
·ring-fence sewerage account and through this we should be able reduce our percentage to acceptable levels of 150%
Service: waste water management
Indicator: Efficiency in collection of sewage charges, % Benchmark: 75%
Time Period Performance
Target Performance
Achieved Reliability Score
Achieved Action Plan to Achieve the Target
2012 (baseline) 36.56% 2013 75% 45.40% 4 2014 75% 44% 4
2015 75% 61%
Improved billing, capturing of correct data account ring fencing Restore ratepayers confidence by improving service delivery
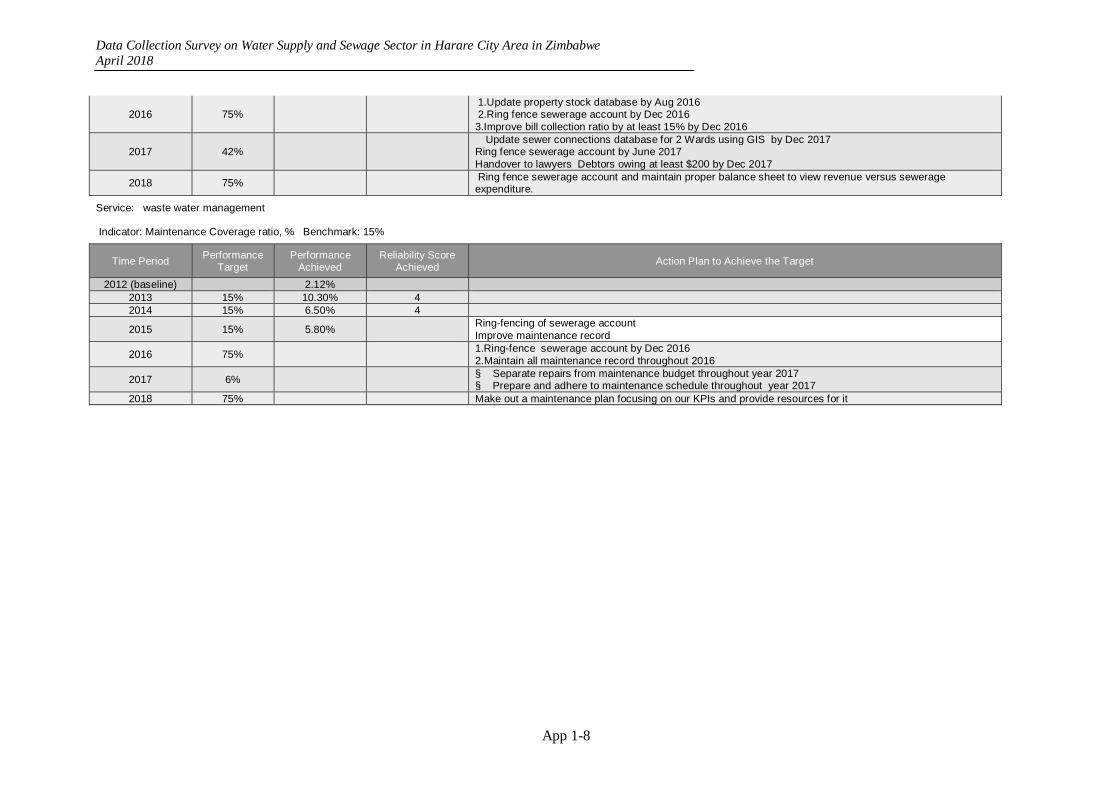
Data Collection Survey on Water Supply and Sewage Sector in Harare City Area in Zimbabwe April 2018
App 1-8
2016 75%
1.Update property stock database by Aug 2016 2.Ring fence sewerage account by Dec 2016 3.Improve bill collection ratio by at least 15% by Dec 2016
2017 42%
Update sewer connections database for 2 Wards using GIS by Dec 2017 Ring fence sewerage account by June 2017 Handover to lawyers Debtors owing at least $200 by Dec 2017
2018 75%
Ring fence sewerage account and maintain proper balance sheet to view revenue versus sewerage expenditure.
Service: waste water management
Indicator: Maintenance Coverage ratio, % Benchmark: 15%
Time Period Performance
Target Performance
Achieved Reliability Score
Achieved Action Plan to Achieve the Target
2012 (baseline) 2.12% 2013 15% 10.30% 4 2014 15% 6.50% 4
2015 15% 5.80%
Ring-fencing of sewerage account Improve maintenance record
2016 75%
1.Ring-fence sewerage account by Dec 2016 2.Maintain all maintenance record throughout 2016
2017 6%
§ Separate repairs from maintenance budget throughout year 2017 § Prepare and adhere to maintenance schedule throughout year 2017
2018 75% Make out a maintenance plan focusing on our KPIs and provide resources for it
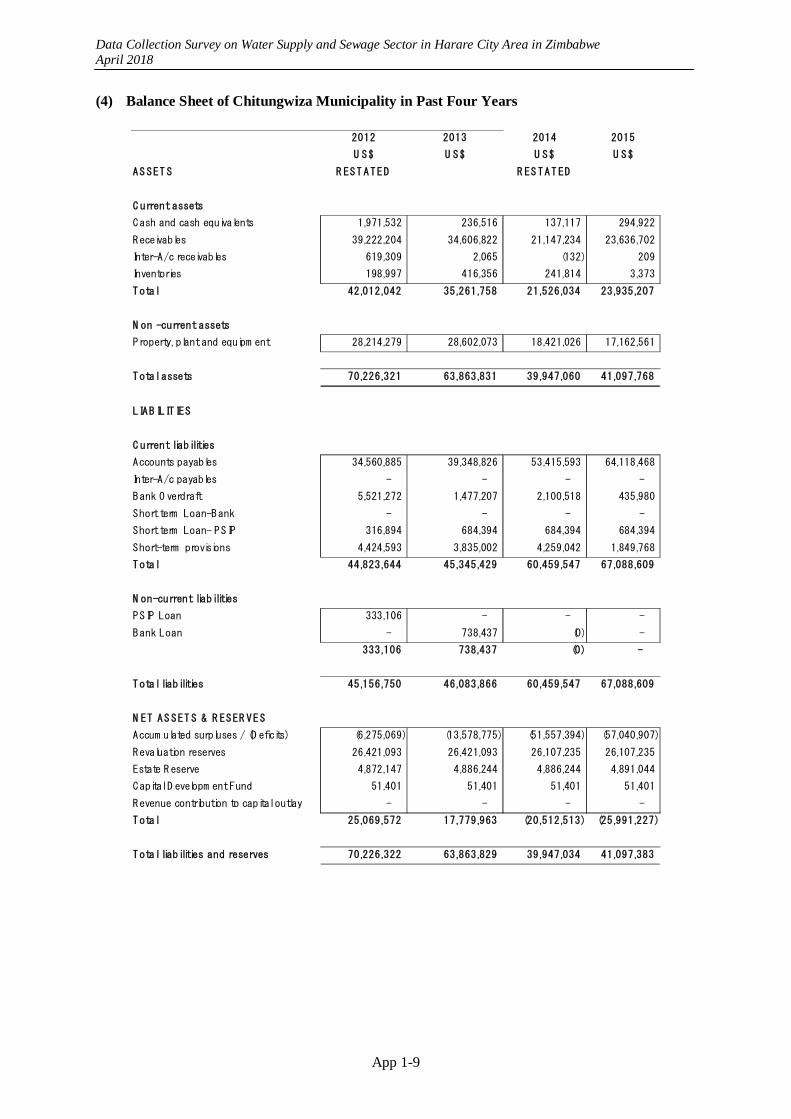
Data Collection Survey on Water Supply and Sewage Sector in Harare City Area in Zimbabwe April 2018
App 1-9
(4) Balance Sheet of Chitungwiza Municipality in Past Four Years
2012 2013 2014 2015
U S$ U S$ U S$ U S$
AS SET S R EST ATED R ES TAT ED
C urrent assets
Cash and cash equivalents 1,971,532 236,516 137,117 294,922
Receivables 39,222,204 34,606,822 21,147,234 23,636,702
Inter-A/c receivables 619,309 2,065 (132) 209
Inventories 198,997 416,356 241,814 3,373
Total 42,012,042 35,261,758 21,526,034 23,935,207
N on -current assets
Property, plant and equipm ent 28,214,279 28,602,073 18,421,026 17,162,561
Total assets 70,226,321 63,863,831 39,947,060 41,097,768
LIAB ILITIES
C urrent liabilities
Accounts payables 34,560,885 39,348,826 53,415,593 64,118,468
Inter-A/c payables - - - -
Bank O verdraft 5,521,272 1,477,207 2,100,518 435,980
Short term Loan-Bank - - - -
Short term Loan- PSIP 316,894 684,394 684,394 684,394
Short-term provisions 4,424,593 3,835,002 4,259,042 1,849,768
Total 44,823,644 45,345,429 60,459,547 67,088,609
N on-current liabilities
PSIP Loan 333,106 - - -
Bank Loan - 738,437 (0) -
333,106 738,437 (0) -
Total liabilities 45,156,750 46,083,866 60,459,547 67,088,609
N ET AS SET S & R ESER VES
Accum ulated surpluses / (D eficits) (6,275,069) (13,578,775) (51,557,394) (57,040,907)
Revaluation reserves 26,421,093 26,421,093 26,107,235 26,107,235
Estate R eserve 4,872,147 4,886,244 4,886,244 4,891,044
Capital D evelopm ent Fund 51,401 51,401 51,401 51,401
Revenue contribution to capital outlay - - - -
Total 25,069,572 17,779,963 (20,512,513) (25,991,227)
Total liabilities and reserves 70,226,322 63,863,829 39,947,034 41,097,383

Data Collection Survey on Water Supply and Sewage Sector in Harare City Area in Zimbabwe April 2018
App 1-10
(5) Income Statement of Chitungwiza Municipality in Past Four Years
2012 2013 2014 2015
US$ US$ US$ US$
RESTATED RESTATED
Revenue
Rates and Supplimentary Charges 5,324,896 6,055,643 3,966,821 7,434,137
Fees and Penalties 4,461,442 2,387,133 2,462,780 2,057,943
Sales and Tarriffs 13,354,551 23,443,526 11,072,902 13,929,748
Business Licences 81,052 69,403 116,427 100,869
Rentals 176,697 6,163 296,402 1,281,063
Grants and Other Income 1,115,961 14,673,270 192,057 385,468
Total 24,514,599 46,635,139 18,107,389 25,189,227
Expenses
Employee costs 21,604,306 18,167,054 19,910,401 10,762,297
General expenses 9,049,333 33,521,704 5,286,325 6,908,564
Repairs and maintanance 263,249 162,301 166,427 339,670
Cost of sales 1,673,745 2,087,786 1,440,869 592,379
Provisions 21,051,575 12,069,441
Total 32,590,633 53,938,845 47,855,597 30,672,350
Surplus/(Deficit) for the year (8,076,034) (7,303,706) (29,748,208) (5,483,123)
Surplus/(Deficit) b/fwd 1,800,965 (6,275,069) (21,809,186) (51,557,784)
Accumulated surpluses / (Deficits) (6,275,069) (13,578,775) (51,557,394) (57,040,907)
(6) Cashi-flow Statement of Chitungwiza Municipality in Past Four Years
2012 2013 2014 2015
US$ US$ US$ US$
OPERATING ACTIVITIES
Surplus / (Deficit) For the Year Before Interest (8,445,670) (15,534,117) (29,748,208) (5,483,123)
Increase in RCCO 1,122,215 34,399 - -
Add: Accrued Interest 8,230,409
Adjust for Non-cash items-Depreciation 1,420,029
Bad debts provision 19,631,546
Operating Profit before Working Capital Changes (7,323,455) (7,303,706) (8,696,632) (5,483,123)
CHANGES IN WORKING CAPITAL 6,949,446 9,213,618 8,495,582 6,042,233
Increase/(Decrease) in Payables 16,082,367 4,787,942 14,066,767 10,702,875
Increase/(Decrease) in Provisions 807,376 (589,591) 424,040 (2,409,274)
Decrease(Increase) in Inventory (22,340) (217,359) 174,541 238,441
Decrease/(Increase) in Interfunds (3,429,530) 617,244 2,193 (341)
Decrease/(Increase) in Receivables (6,488,427) 4,615,382 (6,171,960) (2,489,467)
NET CASH INFLOW/OUTFLOW FROM OPERATING ACTIVITIES (374,009) 1,909,912 1,909,912 559,110
INVESTING ACTIVITIES
Acquisition of property, plant & equipment (426,251) (387,794) (70,250) 1,258,465
Proceeds from asset disposal 287000
NET CASH INFLOW/OUTFLOW FROM INVESTING ACTIVITIES (426,251) (387,794) 216,750 1,258,465
FINANCING ACTIVITIES 782,059 752,534 (738,437) 4,800
Estate reserve 782,059 14,097 - 4,800
Interest on PSIP Loan - - -
Bank loan - 738,437 (738,437) 0
NET CASH INFLOW/OUTFLOW FROM FINANCING ACTIVITIES 782,059 752,534 (738,437) 4,800
NET MOVEMENT IN CASH & CASH EQUIVALENTS (18,201) 2,309,048 (722,738) 1,822,376
CASH & CASH EQUIVALENTS AT BEGINNING OF YEAR (3,531,539) (3,549,740) (1,240,691) (1,963,401)
CASH & CASH EQUIVALENTS AT END OF YEAR (3,549,740) (1,240,692) (1,963,429) (141,025)
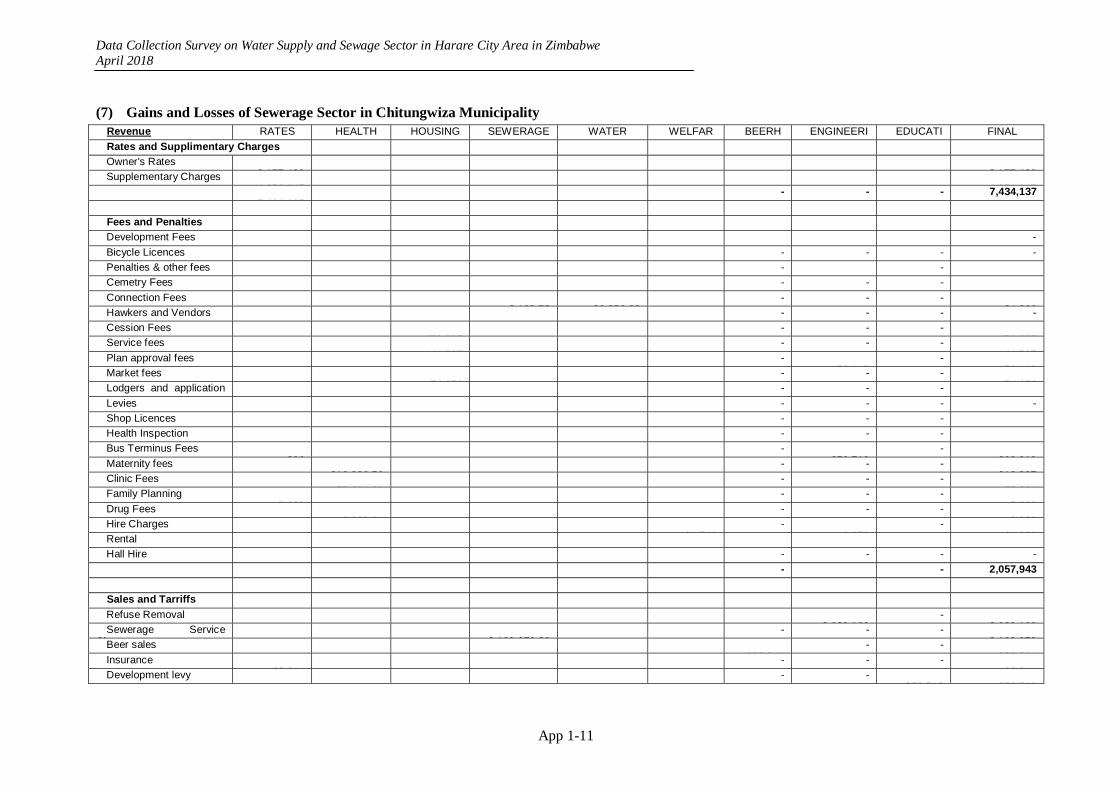
Data Collection Survey on Water Supply and Sewage Sector in Harare City Area in Zimbabwe April 2018
App 1-11
(7) Gains and Losses of Sewerage Sector in Chitungwiza Municipality Revenue RATES HEALTH HOUSING SEWERAGE WATER WELFAR
EBEERHALL
ENGINEERING
EDUCATION
FINAL BALANCERates and Supplimentary Charges
Owner's Rates 3 177 490
3 177 490Supplementary Charges
4 256 647
4 256 647 7 434 137
- - - 7,434,137
Fees and Penalties
Development Fees -
Bicycle Licences - - - -
Penalties & other fees 122 924
125 095
2 484 12
5 024
- 83 450
- 338 978Cemetry Fees
13 715 - - -
13 715Connection Fees 8 103 72
26 856 23
- - - 34 960Hawkers and Vendors - - - -
Cession Fees 176 635
- - - 176 635Service fees
144 597 - - -
144 597Plan approval fees - 152 143
- 152 143Market fees
74 953 - - -
74 953Lodgers and application f
159 539
- - - 159 539Levies - - - -
Shop Licences 329 103
- - - 329 103Health Inspection
64 257 - - -
64 257Bus Terminus Fees 300
- 259 710
- 260 010Maternity fees
212 386 50 - - -
212 387Clinic Fees 57 264 00
- - - 57 264Family Planning
5 682 - - -
5 682Drug Fees 2 320 31
- - - 2 320Hire Charges
24 740 -
6 659 -
31 399Rental
Hall Hire - - - -
522 267
271 970 81
680 820
10 587 84
26 856 23
43 479
- 501 962
- 2,057,943
Sales and Tarriffs
Refuse Removal 2 628 100
- 2 628 100Sewerage Service
Ch
3 162 670 29 - - -
3 162 670Beer sales 636 844
- - 636 844Insurance
22 844 - - -
22 844Development levy - - 279 718
279 718
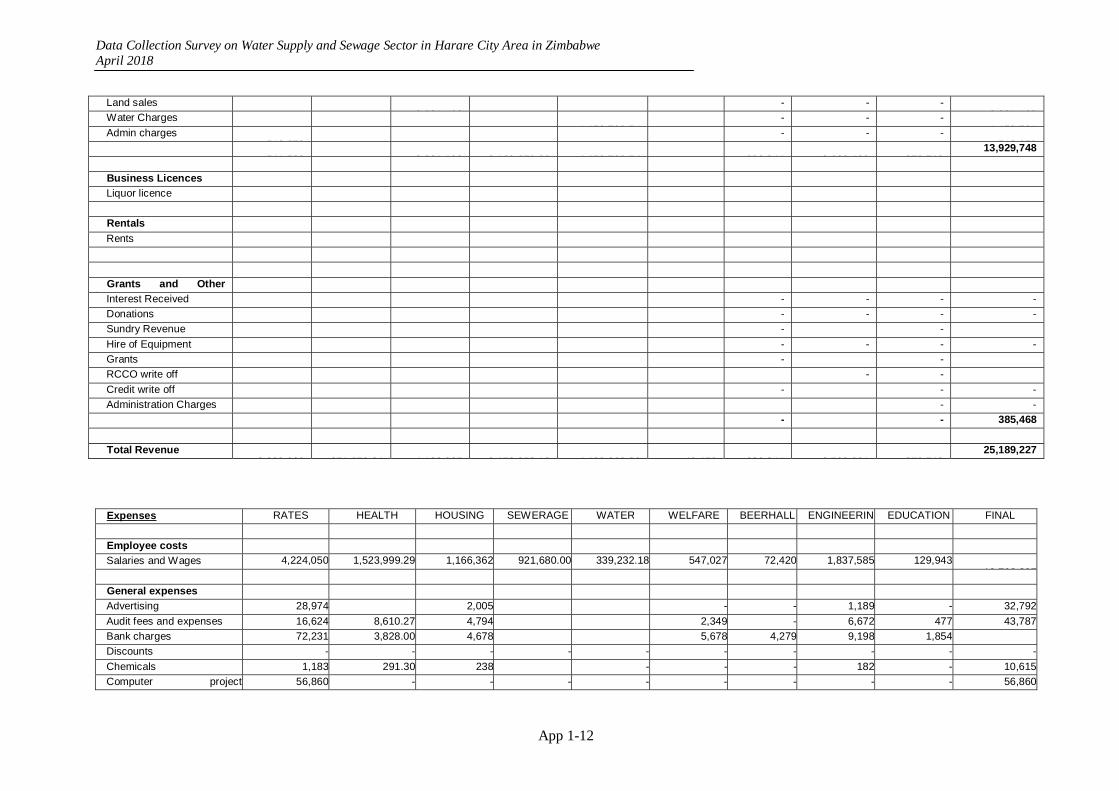
Data Collection Survey on Water Supply and Sewage Sector in Harare City Area in Zimbabwe April 2018
App 1-12
Land sales 2 221 103
- - - 2 221 103Water Charges
4 459 790 54 - - -
4 459 791Admin charges 518 679
- - - 518 679
541 523
2 221 103
3 162 670 29
4 459 790 54
636 844
2 628 100
279 718 13,929,748
Business Licences
Liquor licence 100 869
100 869
Rentals
Rents 1 281 063
1 281 063
Grants and Other I Interest Received - - - -
Donations - - - -
Sundry Revenue 6 679
2 422 59
- 12
- 9 114Hire of Equipment - - - -
Grants - 372 827
- 372 827RCCO write off
3 527 - -
3 527Credit write off - - -
Administration Charges - -
10 206
2 422 59
- 372 839
- 385,468
Total Revenue 8 609 002
271 970 81
4 182 987
3 173 258 13
4 489 069 36
43 479
636 844
3 502 901
279 718
25,189,227
Expenses RATES HEALTH HOUSING SEWERAGE WATER WELFARE BEERHALL ENGINEERING
EDUCATION FINAL BALANCE
Employee costs
Salaries and Wages 4,224,050 1,523,999.29 1,166,362 921,680.00 339,232.18 547,027 72,420 1,837,585 129,943 10 762 297
General expenses
Advertising 28,974 2,005 - - 1,189 - 32,792
Audit fees and expenses 16,624 8,610.27 4,794 2,349 - 6,672 477 43,787
Bank charges 72,231 3,828.00 4,678 5,678 4,279 9,198 1,854
Discounts - - - - - - - - - -
Chemicals 1,183 291.30 238 - - - 182 - 10,615
Computer project 56,860 - - - - - - - - 56,860
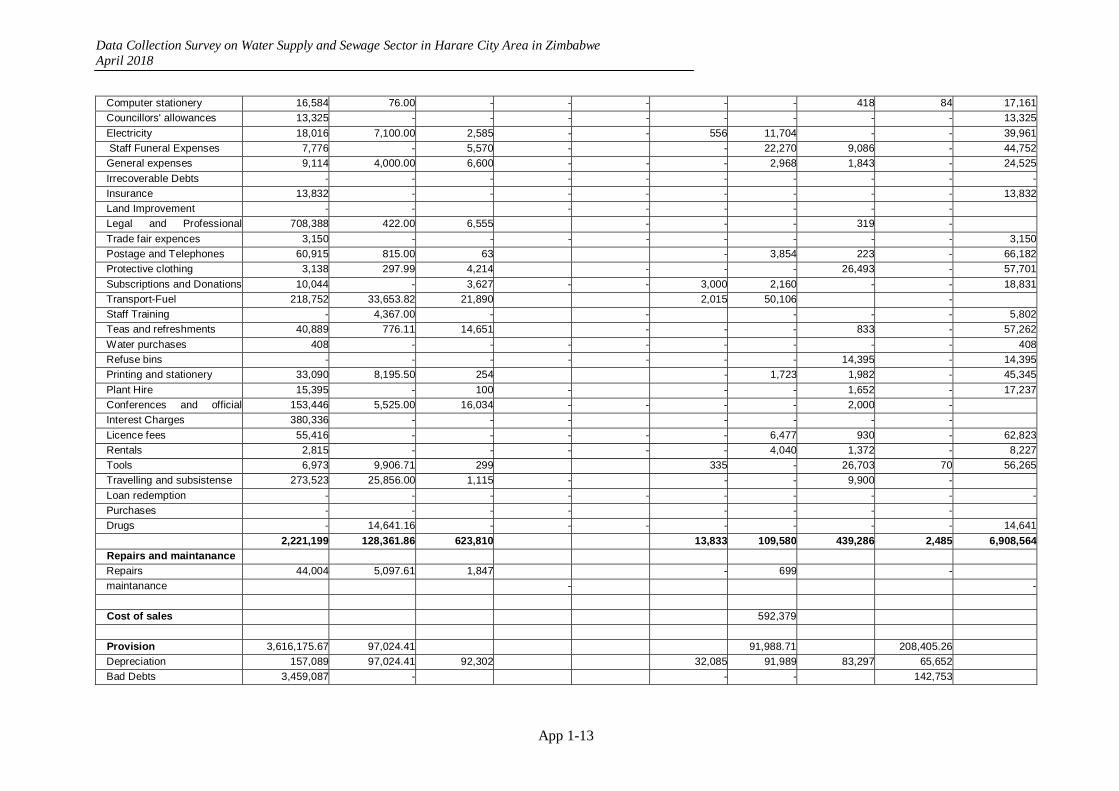
Data Collection Survey on Water Supply and Sewage Sector in Harare City Area in Zimbabwe April 2018
App 1-13
Computer stationery 16,584 76.00 - - - - - 418 84 17,161
Councillors' allowances 13,325 - - - - - - - - 13,325
Electricity 18,016 7,100.00 2,585 - - 556 11,704 - - 39,961
Staff Funeral Expenses 7,776 - 5,570 - - 22,270 9,086 - 44,752
General expenses 9,114 4,000.00 6,600 - - - 2,968 1,843 - 24,525
Irrecoverable Debts - - - - - - - - - -
Insurance 13,832 - - - - - - - - 13,832
Land Improvement - - - - - - - -
Legal and Professional 708,388 422.00 6,555 - - - 319 -
Trade fair expences 3,150 - - - - - - - - 3,150
Postage and Telephones 60,915 815.00 63 - 3,854 223 - 66,182
Protective clothing 3,138 297.99 4,214 - - - 26,493 - 57,701
Subscriptions and Donations 10,044 - 3,627 - - 3,000 2,160 - - 18,831
Transport-Fuel 218,752 33,653.82 21,890 2,015 50,106 -
Staff Training - 4,367.00 - - - - - 5,802
Teas and refreshments 40,889 776.11 14,651 - - - 833 - 57,262
Water purchases 408 - - - - - - - - 408
Refuse bins - - - - - - - 14,395 - 14,395
Printing and stationery 33,090 8,195.50 254 - 1,723 1,982 - 45,345
Plant Hire 15,395 - 100 - - - 1,652 - 17,237
Conferences and official 153,446 5,525.00 16,034 - - - - 2,000 -
Interest Charges 380,336 - - - - - - -
Licence fees 55,416 - - - - - 6,477 930 - 62,823
Rentals 2,815 - - - - - 4,040 1,372 - 8,227
Tools 6,973 9,906.71 299 335 - 26,703 70 56,265
Travelling and subsistense 273,523 25,856.00 1,115 - - - 9,900 -
Loan redemption - - - - - - - - - -
Purchases - - - - - - - -
Drugs - 14,641.16 - - - - - - - 14,641
2,221,199 128,361.86 623,810 13,833 109,580 439,286 2,485 6,908,564
Repairs and maintanance
Repairs 44,004 5,097.61 1,847 - 699 -
maintanance - -
Cost of sales 592,379
Provision 3,616,175.67 97,024.41 91,988.71 208,405.26
Depreciation 157,089 97,024.41 92,302 32,085 91,989 83,297 65,652
Bad Debts 3,459,087 - - - 142,753
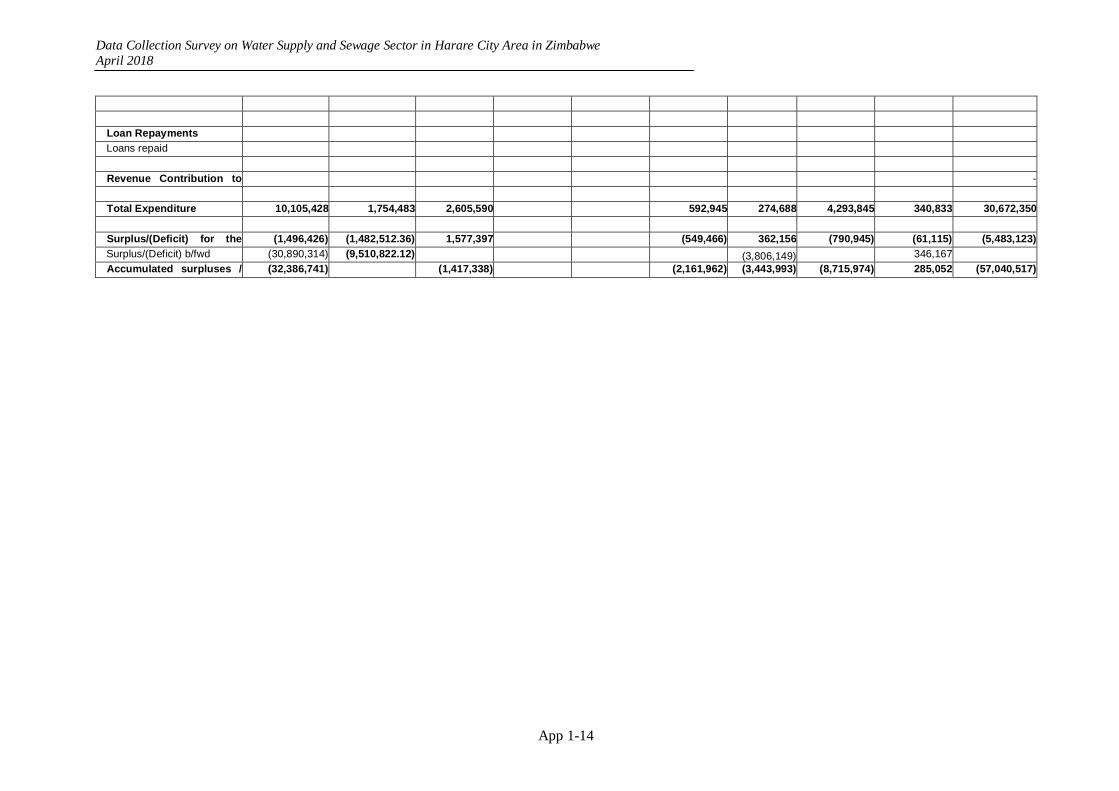
Data Collection Survey on Water Supply and Sewage Sector in Harare City Area in Zimbabwe April 2018
App 1-14
Loan Repayments
Loans repaid
Revenue Contribution to C O
-
Total Expenditure 10,105,428 1,754,483 2,605,590 592,945 274,688 4,293,845 340,833 30,672,350
Surplus/(Deficit) for the (1,496,426) (1,482,512.36) 1,577,397 ( )
( )
(549,466) 362,156 (790,945) (61,115) (5,483,123)
Surplus/(Deficit) b/fwd (30,890,314) (9,510,822.12)( ) ( )
( )
(3,806,149)( )
346,167 ( )Accumulated surpluses /
( f ) (32,386,741)
( ) (1,417,338)
( ) (2,161,962) (3,443,993) (8,715,974) 285,052 (57,040,517)

Data Collection Survey on Water Supply and Sewage Sector in Harare City Area in Zimbabwe April 2018
App 1-15
(8) Income Statement of Sewerage Account in Chitungwiza Municipality
2012 2013 2014 2015
RevenueFees and Penalties 22,773 38,501 9,961 10,588Penalties & other fees 4,840 23,514 400 2,484Connection Fees 17,933 14,987 9,561 8,104
Sales and Tarriffs 540,237 3,137,305 2,342,872 3,162,670Refuse Removal 0 0 0 0Sewerage Service Charges 540,237 3,137,305 2,342,872 3,162,670
Grants and Other Income 65 13 2 0Interest Received 65 0 0 0Sundry Revenue 0 13 2 0
Total Revenue 563,075 3,175,819 2,352,835 3,173,258
Expenses
Employee costs 1,420,602 1,103,065 1,220,335 921,680Salaries and Wages 1,420,602 1,103,065 1,220,335 921,680
General expenses 55,395 4,805,855 100,268 141,884Advertising 0 0 0 624Audit fees and expenses 5,033 4,538 -1,508 3,030Bank charges 2,614 5,975 3,292 6,214Discount 0 55,086 0 0Chemicals 0 0 50 8,721Electricity -6,869 2,493 4,809 0Irrecoverable Debts 0 4,651,917 0 0Legal and Professional expenses 1,000 5,000 2,845 2,049Postage and Telephones 0 0 0 302Protective clothing 7,620 8,746 9,732 23,558Subscriptions and Donations 0 0 0 0Transport-Fuel 42,299 17,706 76,204 84,997Staff Welfare 1,110 740 1,320 1,535Teas and refreshments 0 0 0 113Printing and stationery 0 0 0 85Plant Hire 0 6,092 0 0Interest Charges 2,301 34,406 0 0Tools 287 13,156 3,525 10,656
Repairs and maintanance 52,196 4,892 8,691 62,503Repairs 52,196 4,892 8,691 62,503maintanance 0 0
Cost of sales
Provision 非計上 非計上 4,870,295 3,068,060Depreciation 483,101 483,101Bad Debts 4,387,194 2,584,959
Total Expenditure 1,528,193 5,913,812 6,199,590 4,194,127
Surplus/(Deficit) for the year -965,118 -2,737,993 -3,846,755 -1,020,869Surplus/(Deficit) b/fwd 7,010,066 6,044,948 905,539 -2,941,216Accumulated surpluses / (Deficits) 6,044,948 3,306,955 -2,941,216 -3,962,085

Data Collection Survey on Water Supply and Sewage Sector in Harare City Area in Zimbabwe April 2018
APP1-16
(9) Balance Sheet of Sewerage Sector in Chitungwiza Municipality
2012 2013 2014 2015
ASSETSCurrent assets
Cash and cash equivalents 62,295 1,403 8,516 10,365Metbank 48,031 49 0 0FBC 10,455 1,345 8,516 10,157Kingdom-Main 1 0Kingdom-PSIP 3,808 9
Receivables 6,084,005 3,843,607 2,044,776 2,145,610Sewer 6,070,692 3,575,222 6,361,431 9,063,799Sewer provisions for bad debts -4,387,194 -6,972,153Staff Receivables 7,629 7,629 7,629Other 13,313 260,756 62,910 46,335
Interfund Receivables 745,901 1,089,064 -1,289,443 -1,497,305
Non -current assetsProperty, plant and equipment 7,011,098 7,011,098 3,845,710 3,362,609Buildings 2,200,933 2,200,933 2,200,933 2,200,933Accumulated depreciation Buildings -330,140 -385,163Vehicles 21,600 21,600 21,600 21,600Accumulated depreciation vehicles -21,600 -21,600Plant & Equipment 4,416,500 4,416,500 4,129,500 4,129,500Accumulated depreciation plant & machinery -2,477,700 -2,890,650Sewer Reticulation 372,065 372,065 378,195 378,195Accumulated depreciation sewer reticulation -55,078 -70,206
Total assets 13,903,299 11,945,171 4,609,559 4,021,279
LIABILITIESCurrent liabilities
Accounts payables 1,161,943 1,379,783 1,664,309 2,188,123Trade Payables 493,636 251,715 47,044 43,149Payroll Payables 0Other 348,697 0Short Term Loans-PSIP 316,894 684,394 684,394 684,394VAT 2,716 443,674 932,871 1,460,580
Interfund Payables 4,131 623,808 -741,770 -741,770
Bank Overdraft 155 155 0 0Kingdom Admin 0 0 0FBC-PSIP 155 155
Short-term provisions 355,681 282,437 276,204 184,979Audit fees 4,538 0 0Leave pay 355,681 277,898 276,204 184,979
Non-current liabilities 333,106 0 -0 -0Long term Loan-PSIP 333,106 -0 -0
Total liabilities 1,855,016 2,286,183 1,198,742 1,631,331
NET ASSETS & RESERVES
NET ASSETS AND RESERVESAccumulated surpluses / (Deficits) 5,677,561 3,306,955 -2,941,216 -3,962,085Revaluation reserves 6,352,033 6,352,033 6,352,033 6,352,033Revenue contribution to capital outlay 18,690 0 0 0
12,048,284 9,658,988 3,410,817 2,389,948
Total Liabilities and Reserves 13,903,300 11,945,171 4,609,559 4,021,279
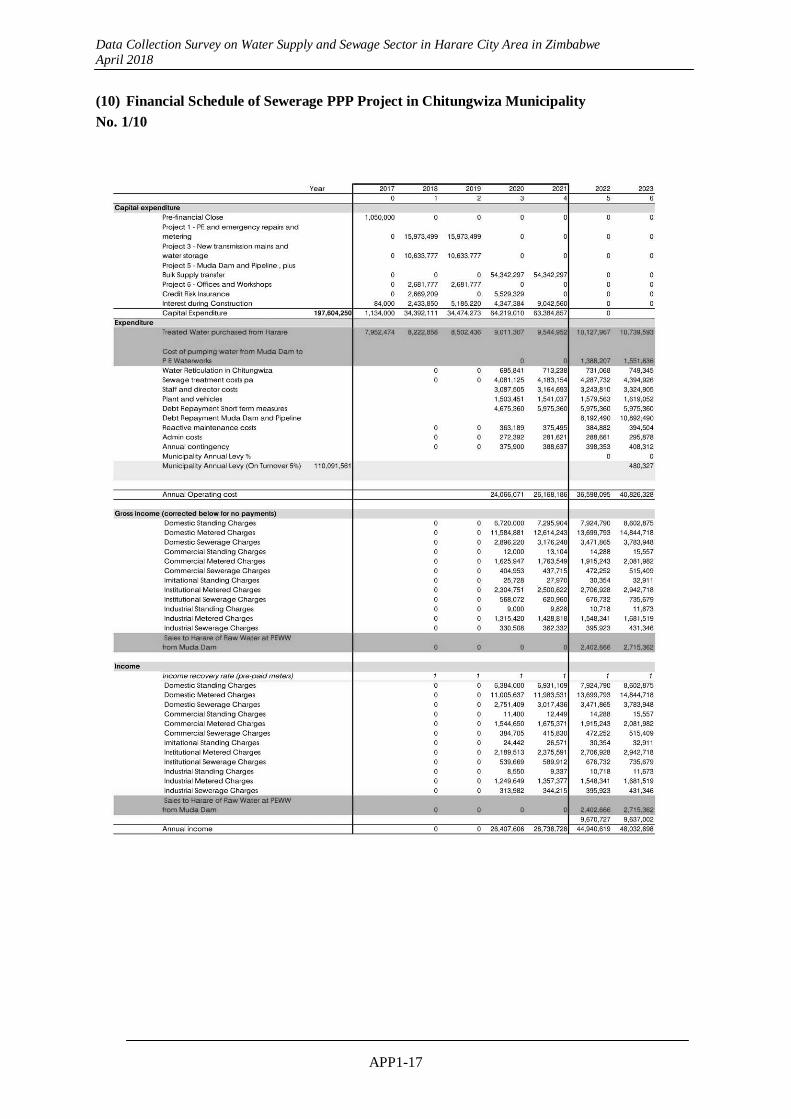
Data Collection Survey on Water Supply and Sewage Sector in Harare City Area in Zimbabwe April 2018
APP1-17
(10) Financial Schedule of Sewerage PPP Project in Chitungwiza Municipality
No. 1/10
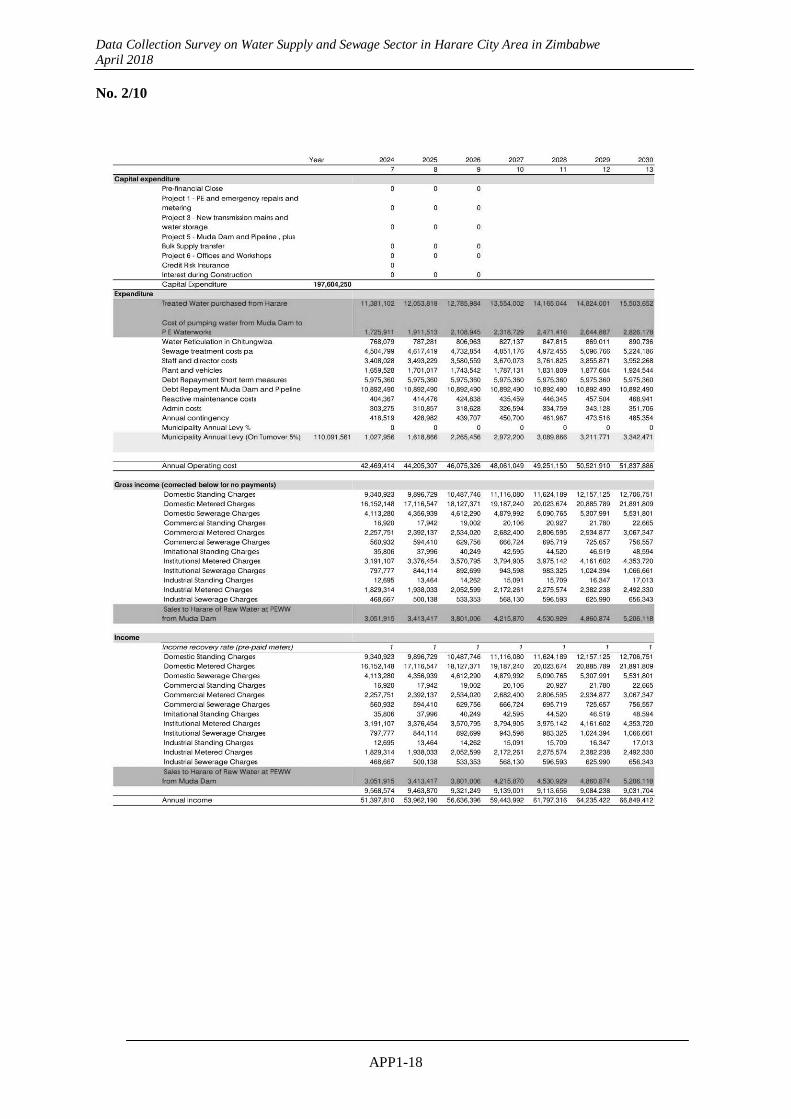
Data Collection Survey on Water Supply and Sewage Sector in Harare City Area in Zimbabwe April 2018
APP1-18
No. 2/10

Data Collection Survey on Water Supply and Sewage Sector in Harare City Area in Zimbabwe April 2018
APP1-19
No. 3/10
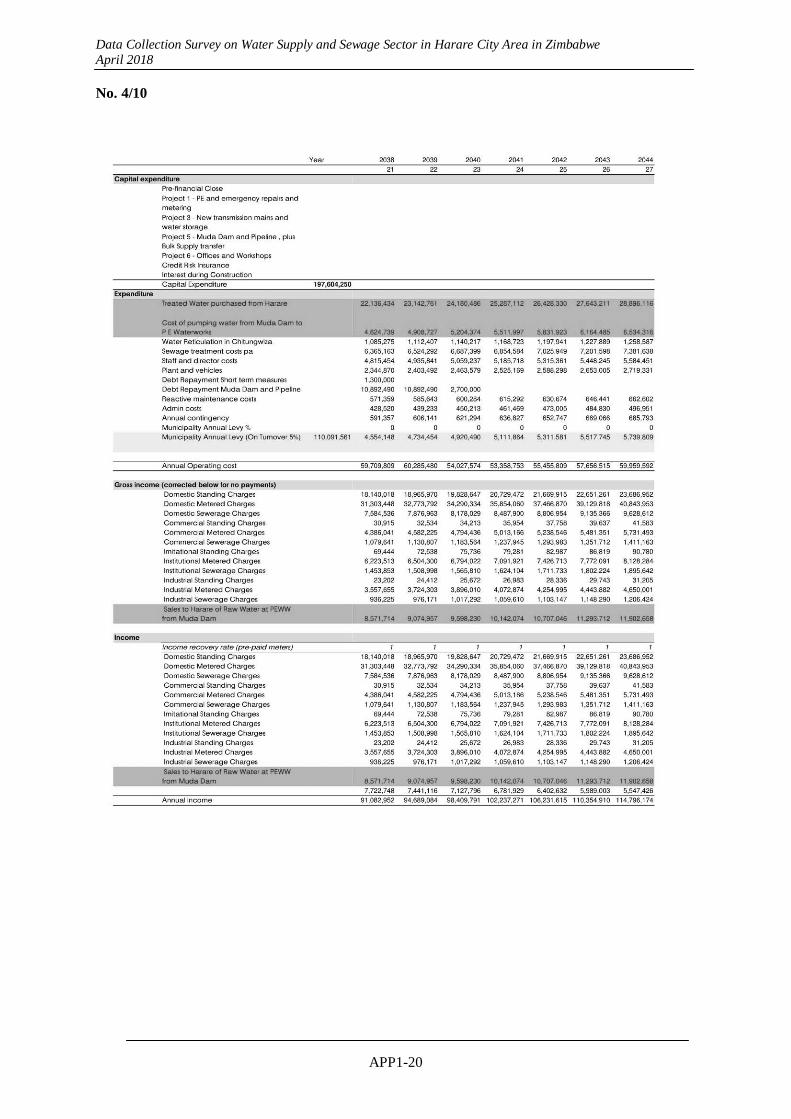
Data Collection Survey on Water Supply and Sewage Sector in Harare City Area in Zimbabwe April 2018
APP1-20
No. 4/10

Data Collection Survey on Water Supply and Sewage Sector in Harare City Area in Zimbabwe April 2018
APP1-21
No.5/10
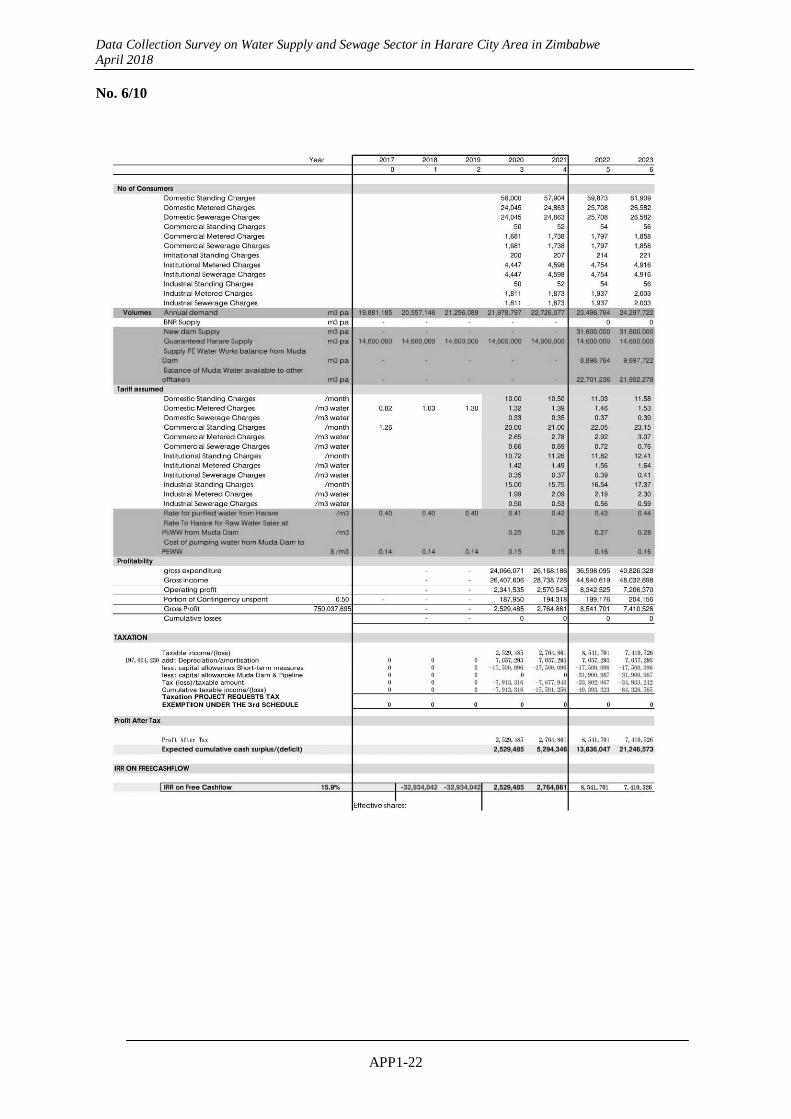
Data Collection Survey on Water Supply and Sewage Sector in Harare City Area in Zimbabwe April 2018
APP1-22
No. 6/10
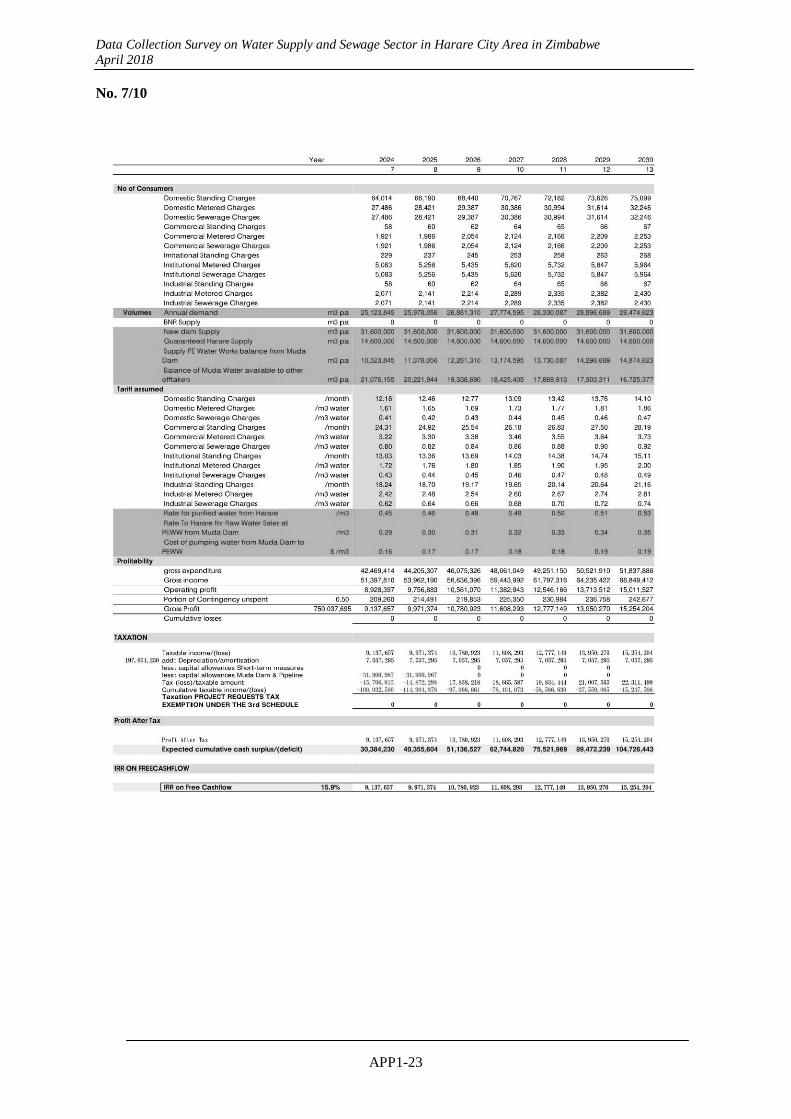
Data Collection Survey on Water Supply and Sewage Sector in Harare City Area in Zimbabwe April 2018
APP1-23
No. 7/10

Data Collection Survey on Water Supply and Sewage Sector in Harare City Area in Zimbabwe April 2018
APP1-24
No. 8/10
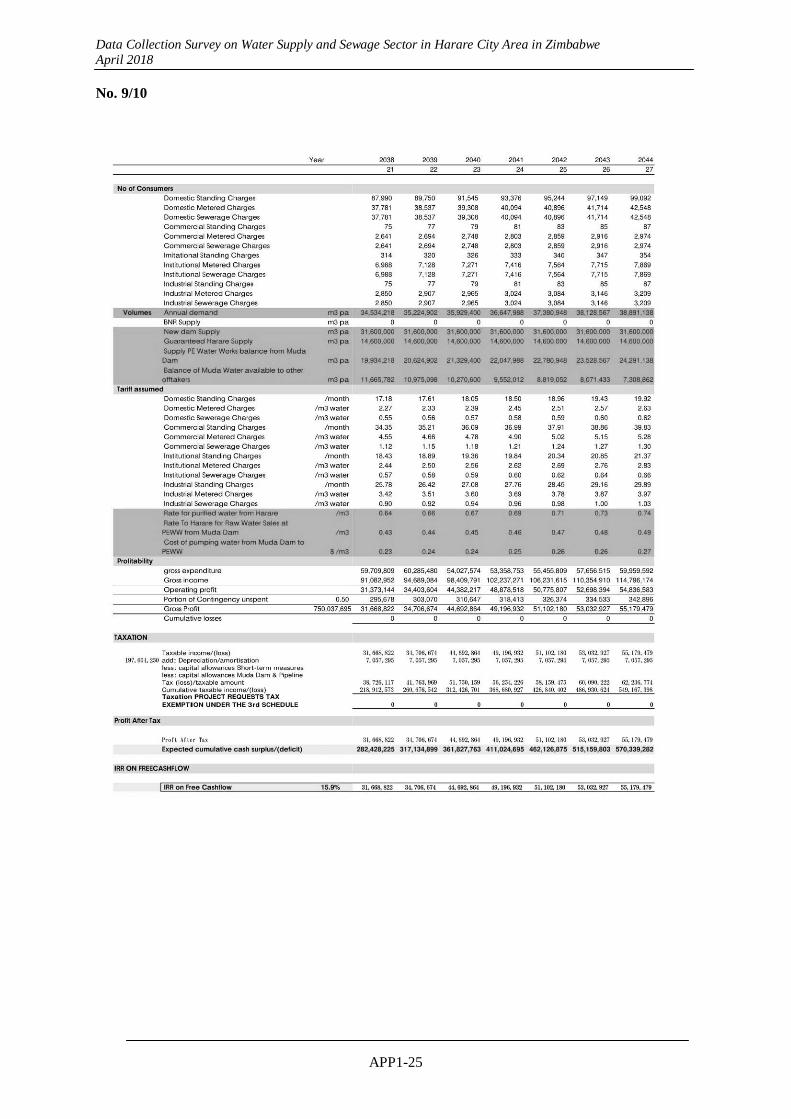
Data Collection Survey on Water Supply and Sewage Sector in Harare City Area in Zimbabwe April 2018
APP1-25
No. 9/10
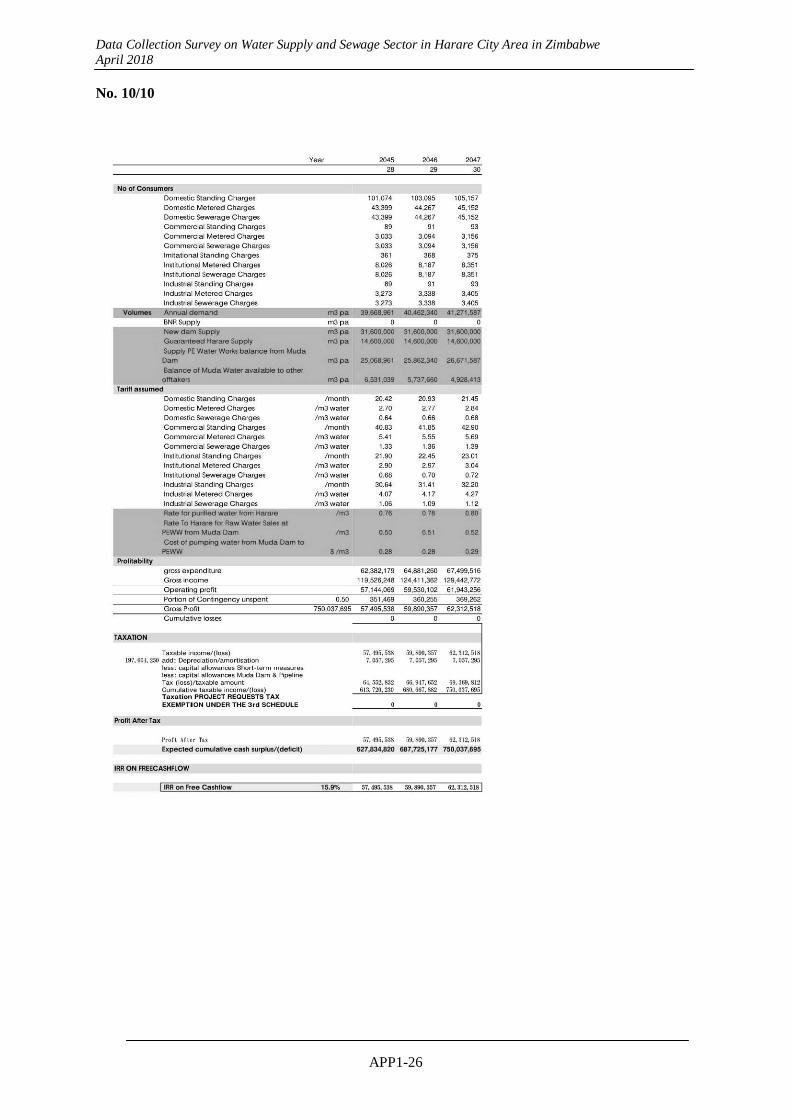
Data Collection Survey on Water Supply and Sewage Sector in Harare City Area in Zimbabwe April 2018
APP1-26
No. 10/10
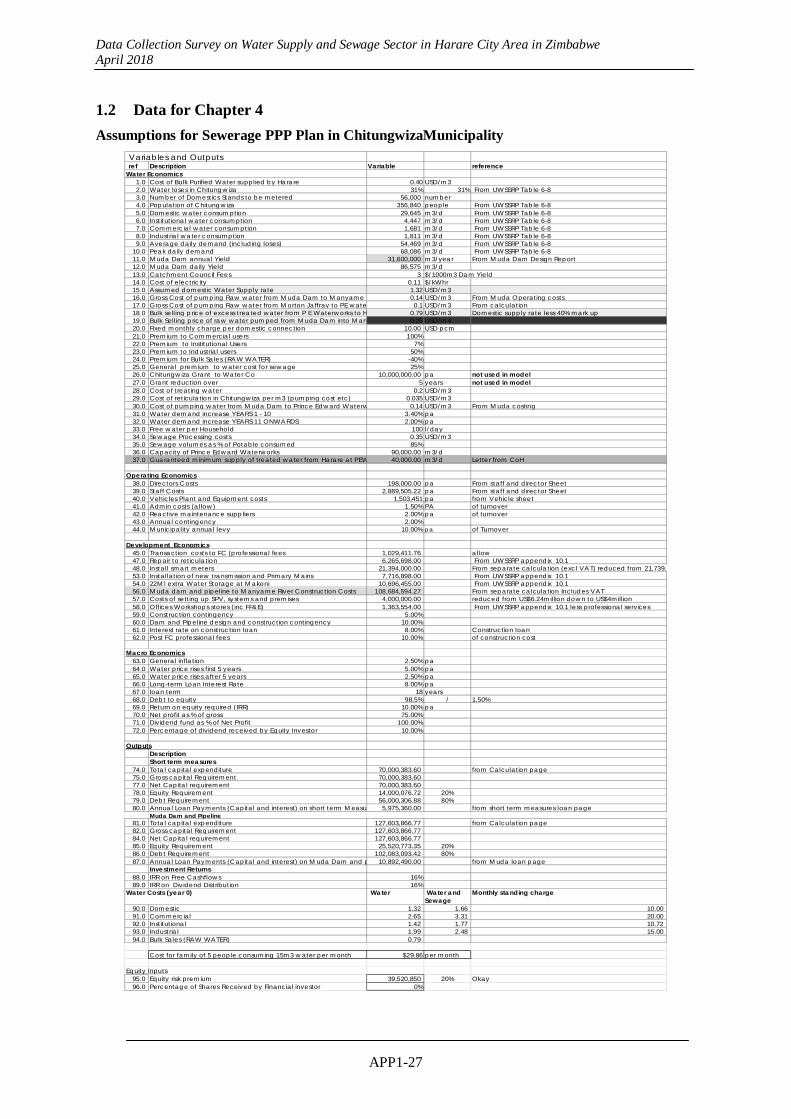
Data Collection Survey on Water Supply and Sewage Sector in Harare City Area in Zimbabwe April 2018
APP1-27
1.2 Data for Chapter 4
Assumptions for Sewerage PPP Plan in ChitungwizaMunicipality Variables and Outputsref Description Variable reference
Water Economics1.0 Cost of Bulk Purified Water supplied by Harare 0.40 USD/m32.0 Water loses in Chitungwiza 31% 31% From UWSSRP Table 6-83.0 Number of Domestics Stands to be metered 56,000 number4.0 Population of Chitungwiza 356,840 people From UWSSRP Table 6-85.0 Domestic water consumption 29,645 m3/d From UWSSRP Table 6-86.0 Institutional water consumption 4,447 m3/d From UWSSRP Table 6-87.0 Commercial water consumption 1,681 m3/d From UWSSRP Table 6-88.0 Industrial water consumption 1,811 m3/d From UWSSRP Table 6-89.0 Average daily demand (including loses) 54,469 m3/d From UWSSRP Table 6-8
10.0 Peak daily demand 68,086 m3/d From UWSSRP Table 6-811.0 Muda Dam annual Yield 31,600,000 m3/year From Muda Dam Design Report12.0 Muda Dam daily Yield 86,575 m3/d13.0 Catchment Council Fees 3 $/1000m3 Dam Yield14.0 Cost of electricity 0.11 $/kWhr15.0 Assumed domestic Water Supply rate 1.32 USD/m316.0 Gross Cost of pumping Raw water from Muda Dam to Manyame 0.14 USD/m3 From Muda Operating costs 17.0 Gross Cost of pumping Raw water from Morton Jaffray to PE wate 0.1 USD/m3 From calculation 18.0 Bulk sell ing price of excess treated water from P E Waterworks to H 0.79 USD/m3 Domestic supply rate less 40% mark up19.0 Bulk Sell ing price of raw water pumped from Muda Dam into Man 0.25 USD/m420.0 Fixed monthly charge per domestic connection 10.00 USD pcm21.0 Premium to Commercial users 100%22.0 Premium to Institutional Users 7%23.0 Premium to Industrial users 50%24.0 Premium for Bulk Sales (RAW WATER) -40%25.0 General premium to water cost for sewage 25%26.0 Chitungwiza Grant to Water Co 10,000,000.00 pa not used in model27.0 Grant reduction over 5 years not used in model28.0 Cost of treating water 0.2 USD/m329.0 Cost of reticulation in Chitungwiza per m3 (pumping cost etc) 0.035 USD/m330.0 Cost of pumping water from Muda Dam to Prince Edward Waterw 0.14 USD/m3 From Muda costing31.0 Water demand increase YEARS 1 - 10 3.40% pa32.0 Water demand increase YEARS 11 ONWARDS 2.00% pa33.0 Free water per Household 100 l/day34.0 Sewage Processing costs 0.35 USD/m335.0 Sewage volumes as % of Potable consumed 85%36.0 Capacity of Prince Edward Waterworks 90,000.00 m3/d37.0 Guaranteed minimum supply of treated water from Harare at PEW 40,000.00 m3/d Letter from CoH
Operating Economics38.0 Directors Costs 198,000.00 pa From staff and director Sheet39.0 Staff Costs 2,889,505.22 pa From staff and director Sheet40.0 Vehicles Plant and Equipment costs 1,503,451 pa from Vehicle sheet41.0 Admin costs (al low) 1.50% PA of turnover42.0 Reactive maintenance suppliers 2.00% pa of turnover43.0 Annual contingency 2.00%44.0 Municipality annual levy 10.00% pa of Turnover
Development Economics45.0 Transaction costs to FC (professional fees 1,029,411.76 al low47.0 Repair to reticulation 6,265,698.00 From UWSSRP appendix 10.148.0 Install smart meters 21,394,000.00 From separate calculation (excl VAT) reduced from 21,739,553.0 Installation of new transmission and Primary Mains 7,716,898.00 From UWSSRP appendix 10.154.0 22Ml extra Water Storage at Makoni 10,696,455.00 From UWSSRP appendix 10.156.0 Muda dam and pipeline to Manyame River Construction Costs 108,684,594.27 From separate calculation Includes VAT57.0 Costs of setting up SPV, systems and premises 4,000,000.00 reduced from US$6.24mil lion down to US$4mill ion58.0 Offices Workshops stores (inc FF&E) 1,363,554.00 From UWSSRP appendix 10.1 less professional services59.0 Construction contingency 5.00%60.0 Dam and Pipeline design and construction contingency 10.00%61.0 Interest rate on construction loan 8.00% Construction loan62.0 Post FC professional fees 10.00% of construction cost
Macro Economics63.0 General inflation 2.50% pa64.0 Water price rises first 5 years 5.00% pa65.0 Water price rises after 5 years 2.50% pa66.0 Long-term Loan Interest Rate 8.00% pa67.0 loan term 18 years68.0 Debt to equity 98.5% / 1.50%69.0 Return on equity required (IRR) 10.00% pa70.0 Net profit as % of gross 75.00%71.0 Dividend fund as % of Net Profit 100.00%72.0 Percentage of dividend received by Equity Investor 10.00%
OutputsDescriptionShort term measures
74.0 Total capital expenditure 70,000,383.60 from Calculation page75.0 Gross capital Requirement 70,000,383.60 77.0 Net Capital requirement 70,000,383.60 78.0 Equity Requirement 14,000,076.72 20%79.0 Debt Requirement 56,000,306.88 80%80.0 Annual Loan Payments (Capital and interest) on short term Measu 5,975,360.00 from short term measures loan page
Muda Dam and Pipeline81.0 Total capital expenditure 127,603,866.77 from Calculation page82.0 Gross capital Requirement 127,603,866.77 84.0 Net Capital requirement 127,603,866.77 85.0 Equity Requirement 25,520,773.35 20%86.0 Debt Requirement 102,083,093.42 80%87.0 Annual Loan Payments (Capital and interest) on M uda Dam and p 10,892,490.00 from Muda loan page
Investment Returns88.0 IRR on Free Cashflows 16%89.0 IRR on Dividend Distribution 16%
Water Costs (year 0) Water Water andSewage
Monthly standing charge
90.0 Domestic 1.32 1.66 10.00 91.0 Commercial 2.65 3.31 20.00 92.0 Institutional 1.42 1.77 10.72 93.0 Industrial 1.99 2.48 15.00 94.0 Bulk Sales (RAW WATER) 0.79
Cost for family of 5 people consuming 15m3 water per month $29.86 per month
Equity Inputs95.0 Equity risk premium 39,520,850 20% Okay96.0 Percentage of Shares Received by Financial investor 0%
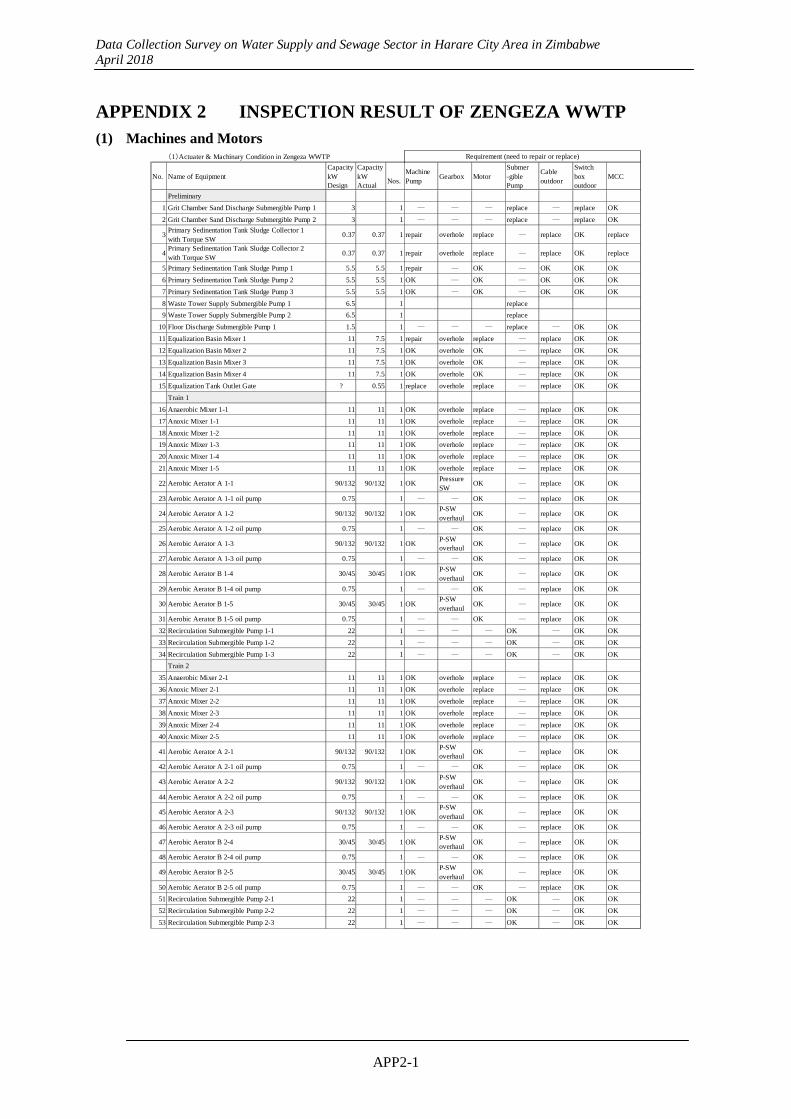
Data Collection Survey on Water Supply and Sewage Sector in Harare City Area in Zimbabwe April 2018
APP2-1
APPENDIX 2 INSPECTION RESULT OF ZENGEZA WWTP (1) Machines and Motors
(1)Actuater & Machinary Condition in Zengeza WWTP
No. Name of EquipmentCapacitykWDesign
CapacitykWActual
Nos.MachinePump
Gearbox MotorSubmer-giblePump
Cableoutdoor
Switchboxoutdoor
MCC
Preliminary
1 Grit Chamber Sand Discharge Submergible Pump 1 3 1 ― ― ― replace ― replace OK
2 Grit Chamber Sand Discharge Submergible Pump 2 3 1 ― ― ― replace ― replace OK
3Primary Sedinentation Tank Sludge Collector 1with Torque SW
0.37 0.37 1 repair overhole replace ― replace OK replace
4Primary Sedinentation Tank Sludge Collector 2with Torque SW
0.37 0.37 1 repair overhole replace ― replace OK replace
5 Primary Sedinentation Tank Sludge Pump 1 5.5 5.5 1 repair ― OK ― OK OK OK
6 Primary Sedinentation Tank Sludge Pump 2 5.5 5.5 1 OK ― OK ― OK OK OK
7 Primary Sedinentation Tank Sludge Pump 3 5.5 5.5 1 OK ― OK ― OK OK OK
8 Waste Tower Supply Submergible Pump 1 6.5 1 replace
9 Waste Tower Supply Submergible Pump 2 6.5 1 replace
10 Floor Discharge Submergible Pump 1 1.5 1 ― ― ― replace ― OK OK
11 Equalization Basin Mixer 1 11 7.5 1 repair overhole replace ― replace OK OK
12 Equalization Basin Mixer 2 11 7.5 1 OK overhole OK ― replace OK OK
13 Equalization Basin Mixer 3 11 7.5 1 OK overhole OK ― replace OK OK
14 Equalization Basin Mixer 4 11 7.5 1 OK overhole OK ― replace OK OK
15 Equalization Tank Outlet Gate ? 0.55 1 replace overhole replace ― replace OK OK
Train 1
16 Anaerobic Mixer 1-1 11 11 1 OK overhole replace ― replace OK OK
17 Anoxic Mixer 1-1 11 11 1 OK overhole replace ― replace OK OK
18 Anoxic Mixer 1-2 11 11 1 OK overhole replace ― replace OK OK
19 Anoxic Mixer 1-3 11 11 1 OK overhole replace ― replace OK OK
20 Anoxic Mixer 1-4 11 11 1 OK overhole replace ― replace OK OK
21 Anoxic Mixer 1-5 11 11 1 OK overhole replace ― replace OK OK
22 Aerobic Aerator A 1-1 90/132 90/132 1 OKPressureSW
OK ― replace OK OK
23 Aerobic Aerator A 1-1 oil pump 0.75 1 ― ― OK ― replace OK OK
24 Aerobic Aerator A 1-2 90/132 90/132 1 OKP-SWoverhaul
OK ― replace OK OK
25 Aerobic Aerator A 1-2 oil pump 0.75 1 ― ― OK ― replace OK OK
26 Aerobic Aerator A 1-3 90/132 90/132 1 OKP-SWoverhaul
OK ― replace OK OK
27 Aerobic Aerator A 1-3 oil pump 0.75 1 ― ― OK ― replace OK OK
28 Aerobic Aerator B 1-4 30/45 30/45 1 OKP-SWoverhaul
OK ― replace OK OK
29 Aerobic Aerator B 1-4 oil pump 0.75 1 ― ― OK ― replace OK OK
30 Aerobic Aerator B 1-5 30/45 30/45 1 OKP-SWoverhaul
OK ― replace OK OK
31 Aerobic Aerator B 1-5 oil pump 0.75 1 ― ― OK ― replace OK OK
32 Recirculation Submergible Pump 1-1 22 1 ― ― ― OK ― OK OK
33 Recirculation Submergible Pump 1-2 22 1 ― ― ― OK ― OK OK
34 Recirculation Submergible Pump 1-3 22 1 ― ― ― OK ― OK OK
Train 2
35 Anaerobic Mixer 2-1 11 11 1 OK overhole replace ― replace OK OK
36 Anoxic Mixer 2-1 11 11 1 OK overhole replace ― replace OK OK
37 Anoxic Mixer 2-2 11 11 1 OK overhole replace ― replace OK OK
38 Anoxic Mixer 2-3 11 11 1 OK overhole replace ― replace OK OK
39 Anoxic Mixer 2-4 11 11 1 OK overhole replace ― replace OK OK
40 Anoxic Mixer 2-5 11 11 1 OK overhole replace ― replace OK OK
41 Aerobic Aerator A 2-1 90/132 90/132 1 OKP-SWoverhaul
OK ― replace OK OK
42 Aerobic Aerator A 2-1 oil pump 0.75 1 ― ― OK ― replace OK OK
43 Aerobic Aerator A 2-2 90/132 90/132 1 OKP-SWoverhaul
OK ― replace OK OK
44 Aerobic Aerator A 2-2 oil pump 0.75 1 ― ― OK ― replace OK OK
45 Aerobic Aerator A 2-3 90/132 90/132 1 OKP-SWoverhaul
OK ― replace OK OK
46 Aerobic Aerator A 2-3 oil pump 0.75 1 ― ― OK ― replace OK OK
47 Aerobic Aerator B 2-4 30/45 30/45 1 OKP-SWoverhaul
OK ― replace OK OK
48 Aerobic Aerator B 2-4 oil pump 0.75 1 ― ― OK ― replace OK OK
49 Aerobic Aerator B 2-5 30/45 30/45 1 OKP-SWoverhaul
OK ― replace OK OK
50 Aerobic Aerator B 2-5 oil pump 0.75 1 ― ― OK ― replace OK OK
51 Recirculation Submergible Pump 2-1 22 1 ― ― ― OK ― OK OK
52 Recirculation Submergible Pump 2-2 22 1 ― ― ― OK ― OK OK
53 Recirculation Submergible Pump 2-3 22 1 ― ― ― OK ― OK OK
Requirement (need to repair or replace)

Data Collection Survey on Water Supply and Sewage Sector in Harare City Area in Zimbabwe April 2018
APP2-2
No. Name of EquipmentCapacitykWDesign
CapacitykWActual
Nos.MachinePump
Gearbox MotorSubmer-giblePump
Cableoutdoor
Switchboxoutdoor
MCC
Alkaline
54 Hydrated Lime Disolving Agitator 1 4 4 1 ― ― not use ― ― ― ―
55 Hydrated Lime Disolving Agitator 2 4 4 1 ― ― not use ― ― ― ―
56 Hydrated Lime Dosing Pump 1 0.05 1 ― ― not use ― ― ― ―
57 Hydrated Lime Dosing Pump 2 0.05 1 ― ― not use ― ― ― ―
Final
58Final Sedimentation Tank Sludge Collector 1with Torque SW
0.37 0.37 1 repair overhole replace ― replace OK OK
59Final Sedimentation Tank Sludge Collector 2with Torque SW
0.37 0.37 1 repair overhole replace ― replace OK OK
60Final Sedimentation Tank Sludge Collector 3with Torque SW
0.37 0.37 1 repair overhole replace ― replace OK OK
61Final Sedimentation Tank Sludge Collector 4with Torque SW
0.37 0.37 1 repair overhole replace ― replace OK OK
62 Return Activated Sludge Submergible Pump 1 22 1 ― ― ― replace ― OK OK
63 Return Activated Sludge Submergible Pump 2 22 1 ― ― ― replace ― OK OK
64 Return Activated Sludge Submergible Pump 3 22 1 ― ― ― replace ― OK OK
65 Return Activated Sludge Submergible Pump 4 22 1 ― ― ― replace ― OK OK
66 Waste Activated Sludge Submergible Pump 1 5.5 1 ― ― ― replace ― OK OK
67 Infiltration Pump 1 5.5 1 replace ― OK OK
68 Waste Activated Sludge Submergible Pump 2 5.5 1 ― ― ― replace ― OK OK
69 Infiltration Pump 2 5.5 1 replace ― OK OK
Sludge
70 Primary Sedimantation Tank Sludge Thicker 1 0.25 0.25 1 repair overhole replace ― replace OK OK
71 Primary Sedimantation Tank Sludge Thicker 2 0.25 0.25 1 repair overhole replace ― replace OK OK
72Primary Sedimantation Tank Sludge Thicker SludgePump 1
5.5 5.5 1 OK ― replace ― OK OK OK
73Primary Sedimantation Tank Sludge Thicker SludgePump 2
5.5 5.5 1 OK ― OK ― OK OK OK
74Primary Sedimantation Tank Sludge Thicker SludgePump 3
5.5 5.5 1 OK ― OK ― OK OK OK
75 Final Sedimantation Tank Sludge Thicker 1 0.25 0.25 1 repair overhole replace ― replace OK OK
76 Final Sedimantation Tank Sludge Thicker 2 0.25 0.25 1 repair overhole replace ― replace OK OK
77Final Sedimantation Tank Sludge Thicker SludgePump 1
5.5 5.5 1 replace ― replace ― OK OK OK
78Final Sedimantation Tank Sludge Thicker SludgePump 2
5.5 5.5 1 OK ― OK ― OK OK OK
79Final Sedimantation Tank Sludge Thicker SludgePump 3
5.5 5.5 1 OK ― OK ― OK OK OK
80 Digestion Tank Mixing Pump 1 15 1replacefoundationwork
― replace ― OK OK OK
81 Digestion Tank Mixing Pump 2 15 1replacefoundationwork
― replace ― OK OK OK
82 Digestion Tank Mixing Pump 3 15 1replacefoundationwork
― replace ― OK OK OK
83 Digestion Tank Sludge Pump 1 3 3 1 OK ― OK ― OK OK OK
84 Digestion Tank Sludge Pump 2 3 3 1 OK ― OK ― OK OK OK
85 Digestion Tank Sludge Pump 3 3 3 1 OK ― OK ― OK OK OK
86 Floor Discharge Submergible Pump 2 1.5 1 ― ― ― replace ― OK OK
87 Floor Discharge Submergible Pump 3 1.5 1 ― ― ― replace ― OK OK
Requirement (need to repair or replace)
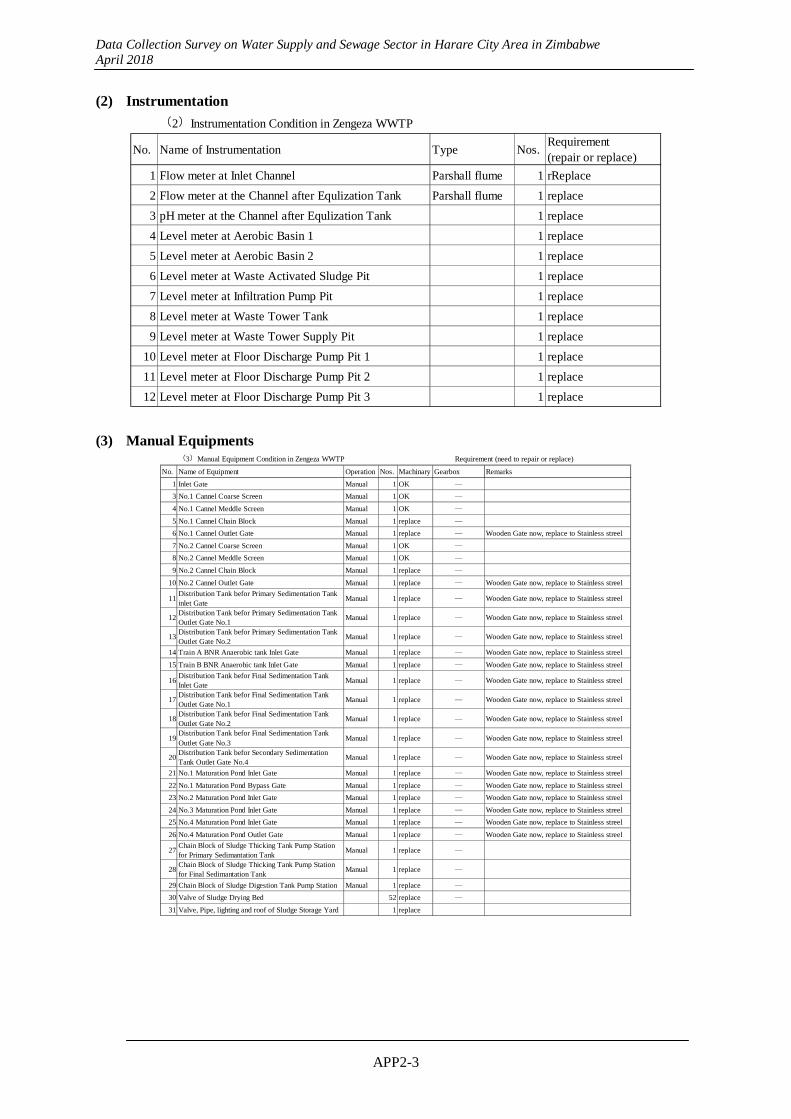
Data Collection Survey on Water Supply and Sewage Sector in Harare City Area in Zimbabwe April 2018
APP2-3
(2) Instrumentation (2)Instrumentation Condition in Zengeza WWTP
No. Name of Instrumentation Type Nos.Requirement(repair or replace)
1 Flow meter at Inlet Channel Parshall flume 1 rReplace
2 Flow meter at the Channel after Equlization Tank Parshall flume 1 replace
3 pH meter at the Channel after Equlization Tank 1 replace
4 Level meter at Aerobic Basin 1 1 replace
5 Level meter at Aerobic Basin 2 1 replace
6 Level meter at Waste Activated Sludge Pit 1 replace
7 Level meter at Infiltration Pump Pit 1 replace
8 Level meter at Waste Tower Tank 1 replace
9 Level meter at Waste Tower Supply Pit 1 replace
10 Level meter at Floor Discharge Pump Pit 1 1 replace
11 Level meter at Floor Discharge Pump Pit 2 1 replace
12 Level meter at Floor Discharge Pump Pit 3 1 replace
(3) Manual Equipments (3)Manual Equipment Condition in Zengeza WWTP
No. Name of Equipment Operation Nos. Machinary Gearbox Remarks
1 Inlet Gate Manual 1 OK ―
3 No.1 Cannel Coarse Screen Manual 1 OK ―
4 No.1 Cannel Meddle Screen Manual 1 OK ―
5 No.1 Cannel Chain Block Manual 1 replace ―
6 No.1 Cannel Outlet Gate Manual 1 replace ― Wooden Gate now, replace to Stainless streel
7 No.2 Cannel Coarse Screen Manual 1 OK ―
8 No.2 Cannel Meddle Screen Manual 1 OK ―
9 No.2 Cannel Chain Block Manual 1 replace ―
10 No.2 Cannel Outlet Gate Manual 1 replace ― Wooden Gate now, replace to Stainless streel
11Distribution Tank befor Primary Sedimentation Tankinlet Gate
Manual 1 replace ― Wooden Gate now, replace to Stainless streel
12Distribution Tank befor Primary Sedimentation TankOutlet Gate No.1
Manual 1 replace ― Wooden Gate now, replace to Stainless streel
13Distribution Tank befor Primary Sedimentation TankOutlet Gate No.2
Manual 1 replace ― Wooden Gate now, replace to Stainless streel
14 Train A BNR Anaerobic tank Inlet Gate Manual 1 replace ― Wooden Gate now, replace to Stainless streel
15 Train B BNR Anaerobic tank Inlet Gate Manual 1 replace ― Wooden Gate now, replace to Stainless streel
16Distribution Tank befor Final Sedimentation TankInlet Gate
Manual 1 replace ― Wooden Gate now, replace to Stainless streel
17Distribution Tank befor Final Sedimentation TankOutlet Gate No.1
Manual 1 replace ― Wooden Gate now, replace to Stainless streel
18Distribution Tank befor Final Sedimentation TankOutlet Gate No.2
Manual 1 replace ― Wooden Gate now, replace to Stainless streel
19Distribution Tank befor Final Sedimentation TankOutlet Gate No.3
Manual 1 replace ― Wooden Gate now, replace to Stainless streel
20Distribution Tank befor Secondary SedimentationTank Outlet Gate No.4
Manual 1 replace ― Wooden Gate now, replace to Stainless streel
21 No.1 Maturation Pond Inlet Gate Manual 1 replace ― Wooden Gate now, replace to Stainless streel
22 No.1 Maturation Pond Bypass Gate Manual 1 replace ― Wooden Gate now, replace to Stainless streel
23 No.2 Maturation Pond Inlet Gate Manual 1 replace ― Wooden Gate now, replace to Stainless streel
24 No.3 Maturation Pond Inlet Gate Manual 1 replace ― Wooden Gate now, replace to Stainless streel
25 No.4 Maturation Pond Inlet Gate Manual 1 replace ― Wooden Gate now, replace to Stainless streel
26 No.4 Maturation Pond Outlet Gate Manual 1 replace ― Wooden Gate now, replace to Stainless streel
27Chain Block of Sludge Thicking Tank Pump Stationfor Primary Sedimantation Tank
Manual 1 replace ―
28Chain Block of Sludge Thicking Tank Pump Stationfor Final Sedimantation Tank
Manual 1 replace ―
29 Chain Block of Sludge Digestion Tank Pump Station Manual 1 replace ―
30 Valve of Sludge Drying Bed 52 replace ―
31 Valve, Pipe, lighting and roof of Sludge Storage Yard 1 replace
Requirement (need to repair or replace)
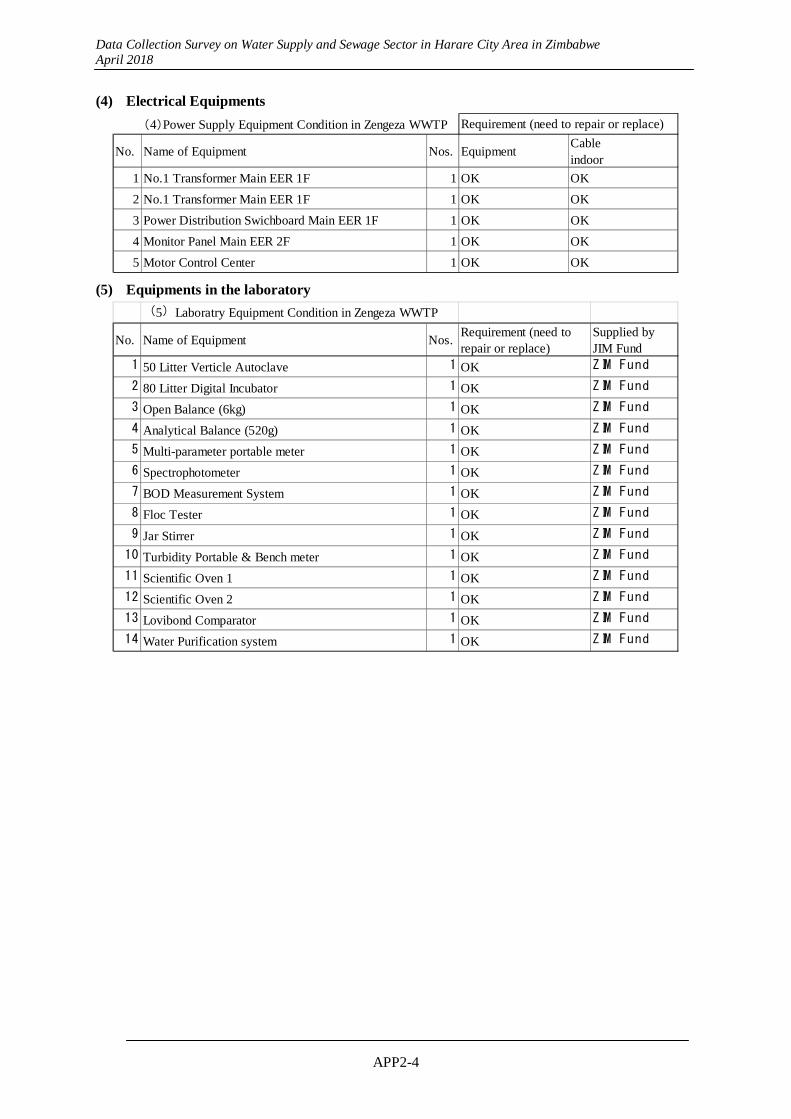
Data Collection Survey on Water Supply and Sewage Sector in Harare City Area in Zimbabwe April 2018
APP2-4
(4) Electrical Equipments
(4)Power Supply Equipment Condition in Zengeza WWTP
No. Name of Equipment Nos. EquipmentCableindoor
1 No.1 Transformer Main EER 1F 1 OK OK
2 No.1 Transformer Main EER 1F 1 OK OK
3 Power Distribution Swichboard Main EER 1F 1 OK OK
4 Monitor Panel Main EER 2F 1 OK OK
5 Motor Control Center 1 OK OK
Requirement (need to repair or replace)
(5) Equipments in the laboratory
(5)Laboratry Equipment Condition in Zengeza WWTP
No. Name of Equipment Nos.Requirement (need torepair or replace)
Supplied byJIM Fund
1 50 Litter Verticle Autoclave 1 OK ZIM Fund
2 80 Litter Digital Incubator 1 OK ZIM Fund
3 Open Balance (6kg) 1 OK ZIM Fund
4 Analytical Balance (520g) 1 OK ZIM Fund
5 Multi-parameter portable meter 1 OK ZIM Fund
6 Spectrophotometer 1 OK ZIM Fund
7 BOD Measurement System 1 OK ZIM Fund
8 Floc Tester 1 OK ZIM Fund
9 Jar Stirrer 1 OK ZIM Fund
10 Turbidity Portable & Bench meter 1 OK ZIM Fund
11 Scientific Oven 1 1 OK ZIM Fund
12 Scientific Oven 2 1 OK ZIM Fund
13 Lovibond Comparator 1 OK ZIM Fund
14 Water Purification system 1 OK ZIM Fund

Data Collection Survey on Water Supply and Sewage Sector in Harare City Area in Zimbabwe April 2018
APP2-5
(6) Concrete Structure
(6)Civil Structure Condition in Zengeza WWTP
No. Name of Equipment Nos. Grass Mud Structure
1 Grit Chamber 1 1 take out take out clean up
2 Grit Chamber 2 1 take out take out clean up
3 Primary Sedinentation Tank 1 1 take out take out clean up
4 Primary Sedinentation Tank 2 1 take out take out clean up
5 Primary Sedinentation Tank Sludge Pump Station 1 take out take out clean up
6 Equalization Basin 1 take out take out clean up
7 Anaerobic Basin 1 1 take out take out clean up
8 Anoxic Basin 1 1 take out take out clean up
9 Aerobic Basin 1 1 take out take out clean up
10 Anaerobic Basin 2 1 take out take out clean up
11 Anoxic Basin 2 1 take out take out clean up
12 Aerobic Basin 2 1 take out take out clean up
13 Recirculation Pump Station 1 take out take out clean up
14 Hydrated Lime House 1 take out take out clean up
15 Final Sedimentation Tank 1 1 take out take out clean up
16 Final Sedimentation Tank 2 1 take out take out clean up
17 Final Sedimentation Tank 3 1 take out take out clean up
18 Final Sedimentation Tank 4 1 take out take out clean up
19 Return Activated Sludge Pump Station 1 take out take out clean up
20 Primary Sedimantation Tank Sludge Thicker 1 1 take out take out clean up
21 Primary Sedimantation Tank Sludge Thicker 2 1 take out take out clean up
22Primary Sedimantation Tank Sludge Thicker SludgePump Station
1 take out take out clean up
23 Final Sedimantation Tank Sludge Thicker 1 1 take out take out clean up
24 Final Sedimantation Tank Sludge Thicker 2 1 take out take out clean up
25Final Sedimantation Tank Sludge Thicker SludgePump Station
1 take out take out clean up
26 Digestion Tank 1 1 take out take out clean up
27 Digestion Tank 2 1 take out take out clean up
28 Digestion Tank Sludge Pump Station 1 take out take out clean up
29 Sludge Drying Bed 52 take out take out clean up
30 Sludge Storrage Yard 1 take out take out clean up
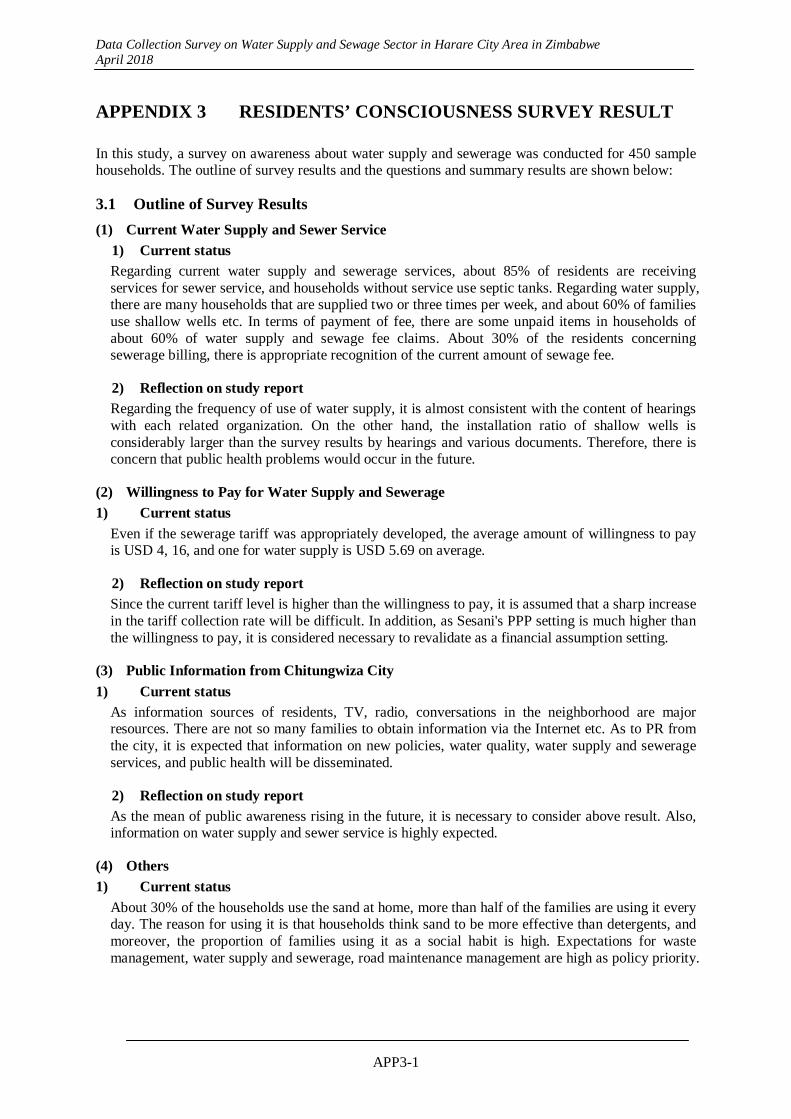
Data Collection Survey on Water Supply and Sewage Sector in Harare City Area in Zimbabwe April 2018
APP3-1
APPENDIX 3 RESIDENTS’ CONSCIOUSNESS SURVEY RESULT In this study, a survey on awareness about water supply and sewerage was conducted for 450 sample households. The outline of survey results and the questions and summary results are shown below:
3.1 Outline of Survey Results
(1) Current Water Supply and Sewer Service
1) Current status
Regarding current water supply and sewerage services, about 85% of residents are receiving services for sewer service, and households without service use septic tanks. Regarding water supply, there are many households that are supplied two or three times per week, and about 60% of families use shallow wells etc. In terms of payment of fee, there are some unpaid items in households of about 60% of water supply and sewage fee claims. About 30% of the residents concerning sewerage billing, there is appropriate recognition of the current amount of sewage fee.
2) Reflection on study report
Regarding the frequency of use of water supply, it is almost consistent with the content of hearings with each related organization. On the other hand, the installation ratio of shallow wells is considerably larger than the survey results by hearings and various documents. Therefore, there is concern that public health problems would occur in the future.
(2) Willingness to Pay for Water Supply and Sewerage
1) Current status
Even if the sewerage tariff was appropriately developed, the average amount of willingness to pay is USD 4, 16, and one for water supply is USD 5.69 on average.
2) Reflection on study report
Since the current tariff level is higher than the willingness to pay, it is assumed that a sharp increase in the tariff collection rate will be difficult. In addition, as Sesani's PPP setting is much higher than the willingness to pay, it is considered necessary to revalidate as a financial assumption setting.
(3) Public Information from Chitungwiza City
1) Current status
As information sources of residents, TV, radio, conversations in the neighborhood are major resources. There are not so many families to obtain information via the Internet etc. As to PR from the city, it is expected that information on new policies, water quality, water supply and sewerage services, and public health will be disseminated.
2) Reflection on study report
As the mean of public awareness rising in the future, it is necessary to consider above result. Also, information on water supply and sewer service is highly expected.
(4) Others
1) Current status
About 30% of the households use the sand at home, more than half of the families are using it every day. The reason for using it is that households think sand to be more effective than detergents, and moreover, the proportion of families using it as a social habit is high. Expectations for waste management, water supply and sewerage, road maintenance management are high as policy priority.

Data Collection Survey on Water Supply and Sewage Sector in Harare City Area in Zimbabwe April 2018
APP3-2
2) Reflection on study report
Regarding the use of sand, it is not reason that sand is cheaper than detergent, but it is used with expectation of its effectiveness. Therefore, it is considered possible to suppress the use of sand by enlightenment of residents. Also, as expectations for policies, expectations for improvements in water supply and sewage systems are high, and it is also important to distribute budgets in line with such expectations.
3.2 Survey Results
3.2.1 Service Provision of Water and Sewerage
(1) Questions about Service Provision of the Sewerage Service
1) The sewerage service by municipality is available at your home?
No. of answers Percentage (%) 1. Yes 387 85.8 2. No 64 14.2 Total 451 100.0
2) Does your home have a private septic tank?
No. of answers Percentage (%) 1. Yes 66 14.6 2. No 385 85.4 Total 451 100.0
3) Currently, how much is your bill for the sewage service?
No. of answers Percentage (%)Correct answer 117 25.9 No answer 334 74.1 Total 451 100.0
4) Are you paying for bill for the sewage service?
No. of answers Percentage (%) 1. All 193 42.9 2. Never 4 0.9 3. Some 253 57.5 Total 450 100.0
(2) Questions about Service Provision of the Water Supply Service
1) How many days per week water through municipality’s water supply service are available?
No. of answers Percentage (%) 1 Day 28 6.4 2 Days 186 42.6 3 Days 153 35 4 Days 41 9.4 5 Days 1 0.2 6 Days 0 0 7 Days 28 6.4 Total 437 100.0
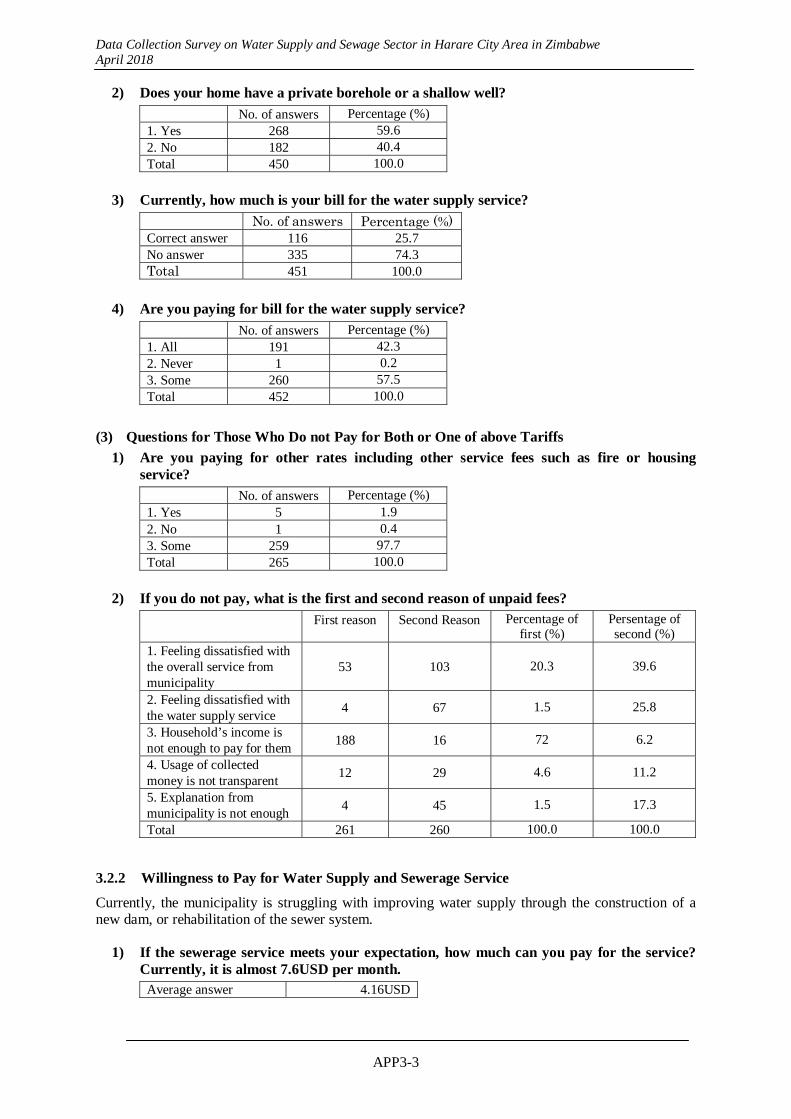
Data Collection Survey on Water Supply and Sewage Sector in Harare City Area in Zimbabwe April 2018
APP3-3
2) Does your home have a private borehole or a shallow well?
No. of answers Percentage (%) 1. Yes 268 59.6 2. No 182 40.4 Total 450 100.0
3) Currently, how much is your bill for the water supply service?
No. of answers Percentage (%)Correct answer 116 25.7 No answer 335 74.3 Total 451 100.0
4) Are you paying for bill for the water supply service?
No. of answers Percentage (%) 1. All 191 42.3 2. Never 1 0.2 3. Some 260 57.5 Total 452 100.0
(3) Questions for Those Who Do not Pay for Both or One of above Tariffs
1) Are you paying for other rates including other service fees such as fire or housing service?
No. of answers Percentage (%) 1. Yes 5 1.9 2. No 1 0.4 3. Some 259 97.7 Total 265 100.0
2) If you do not pay, what is the first and second reason of unpaid fees?
First reason Second Reason Percentage of first (%)
Persentage of second (%)
1. Feeling dissatisfied with the overall service from municipality
53 103 20.3 39.6
2. Feeling dissatisfied with the water supply service
4 67 1.5 25.8
3. Household’s income is not enough to pay for them
188 16 72 6.2
4. Usage of collected money is not transparent
12 29 4.6 11.2
5. Explanation from municipality is not enough
4 45 1.5 17.3
Total 261 260 100.0 100.0
3.2.2 Willingness to Pay for Water Supply and Sewerage Service
Currently, the municipality is struggling with improving water supply through the construction of a new dam, or rehabilitation of the sewer system.
1) If the sewerage service meets your expectation, how much can you pay for the service? Currently, it is almost 7.6USD per month.
Average answer 4.16USD
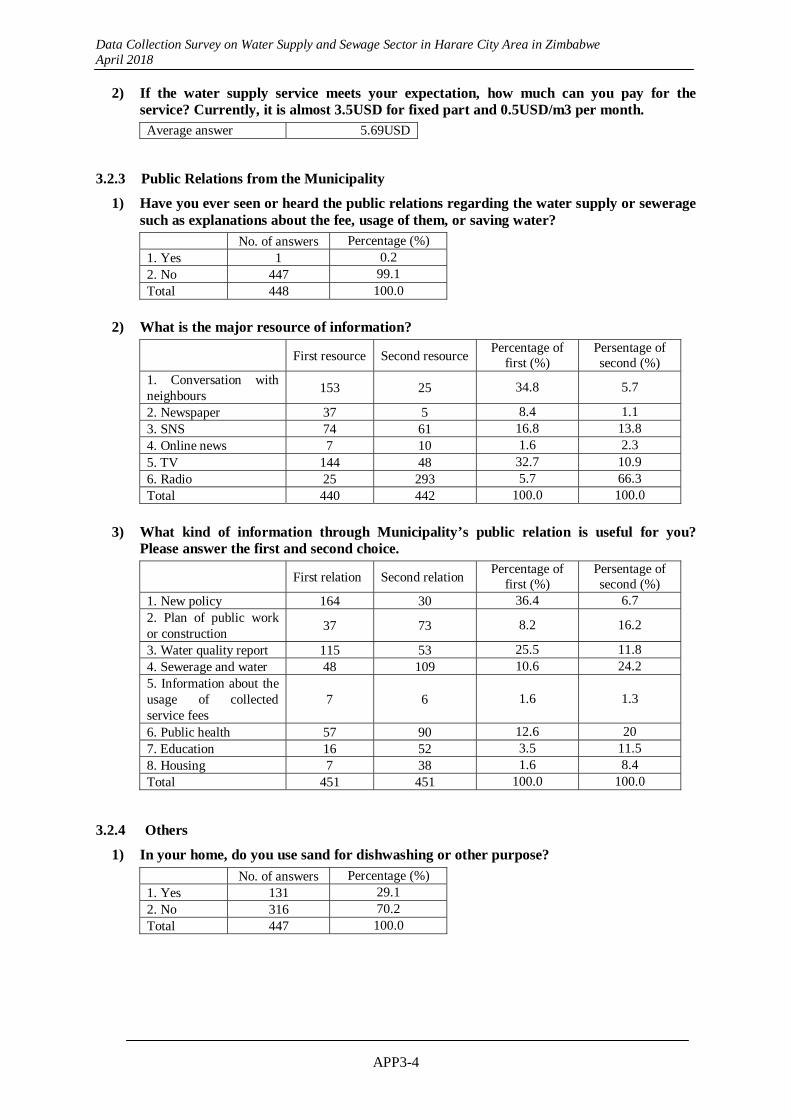
Data Collection Survey on Water Supply and Sewage Sector in Harare City Area in Zimbabwe April 2018
APP3-4
2) If the water supply service meets your expectation, how much can you pay for the service? Currently, it is almost 3.5USD for fixed part and 0.5USD/m3 per month.
Average answer 5.69USD
3.2.3 Public Relations from the Municipality
1) Have you ever seen or heard the public relations regarding the water supply or sewerage such as explanations about the fee, usage of them, or saving water?
No. of answers Percentage (%) 1. Yes 1 0.2 2. No 447 99.1 Total 448 100.0
2) What is the major resource of information?
First resource Second resource
Percentage of first (%)
Persentage of second (%)
1. Conversation with neighbours
153 25 34.8 5.7
2. Newspaper 37 5 8.4 1.1 3. SNS 74 61 16.8 13.8 4. Online news 7 10 1.6 2.3 5. TV 144 48 32.7 10.9 6. Radio 25 293 5.7 66.3 Total 440 442 100.0 100.0
3) What kind of information through Municipality’s public relation is useful for you? Please answer the first and second choice.
First relation Second relation
Percentage of first (%)
Persentage of second (%)
1. New policy 164 30 36.4 6.7 2. Plan of public work or construction
37 73 8.2 16.2
3. Water quality report 115 53 25.5 11.8 4. Sewerage and water 48 109 10.6 24.2 5. Information about the usage of collected service fees
7 6 1.6 1.3
6. Public health 57 90 12.6 20 7. Education 16 52 3.5 11.5 8. Housing 7 38 1.6 8.4 Total 451 451 100.0 100.0
3.2.4 Others
1) In your home, do you use sand for dishwashing or other purpose?
No. of answers Percentage (%) 1. Yes 131 29.1 2. No 316 70.2 Total 447 100.0
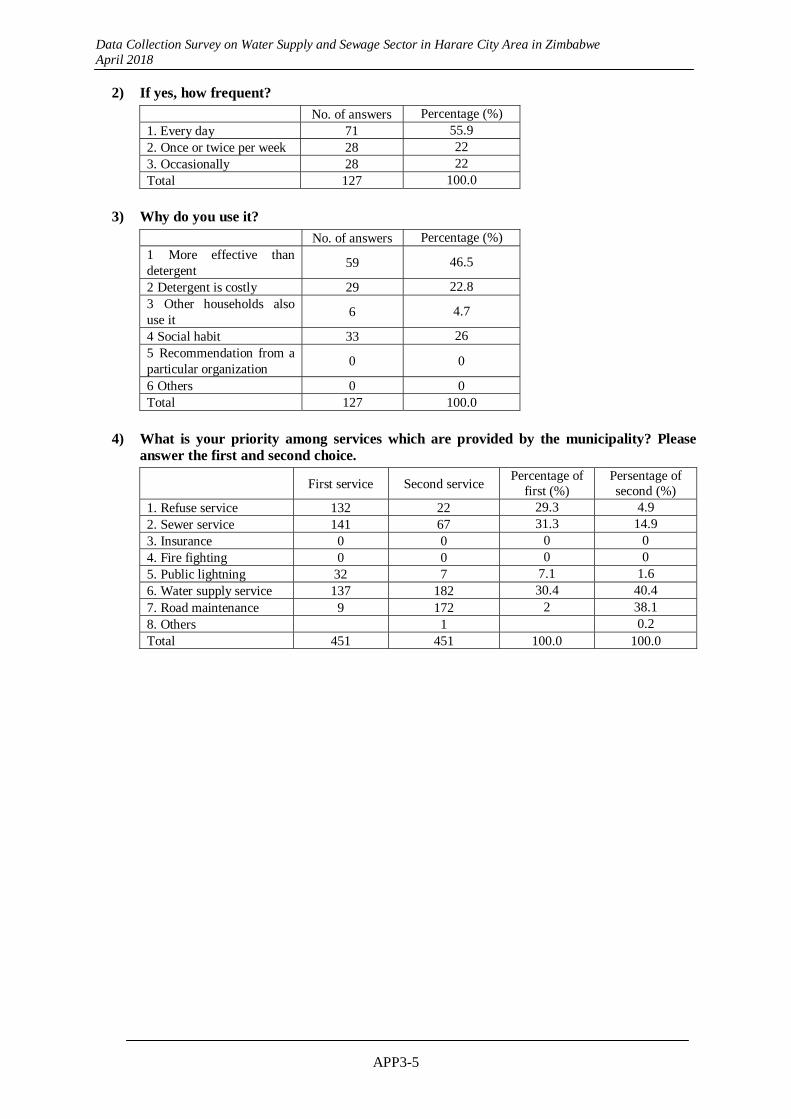
Data Collection Survey on Water Supply and Sewage Sector in Harare City Area in Zimbabwe April 2018
APP3-5
2) If yes, how frequent?
No. of answers Percentage (%) 1. Every day 71 55.9 2. Once or twice per week 28 22 3. Occasionally 28 22 Total 127 100.0
3) Why do you use it?
No. of answers Percentage (%) 1 More effective than detergent
59 46.5
2 Detergent is costly 29 22.8 3 Other households also use it
6 4.7
4 Social habit 33 26 5 Recommendation from a particular organization
0 0
6 Others 0 0 Total 127 100.0
4) What is your priority among services which are provided by the municipality? Please answer the first and second choice.
First service Second service
Percentage of first (%)
Persentage of second (%)
1. Refuse service 132 22 29.3 4.9 2. Sewer service 141 67 31.3 14.9 3. Insurance 0 0 0 0 4. Fire fighting 0 0 0 0 5. Public lightning 32 7 7.1 1.6 6. Water supply service 137 182 30.4 40.4 7. Road maintenance 9 172 2 38.1 8. Others 1 0.2 Total 451 451 100.0 100.0
Data Collection Survey on Water Supply and Sewage Sector in Harare City Area in Zimbabwe April 2018
APP4-1
APPENDIX 4 MINUTES OF MEETING FOR WORKSHOP DATE:13/4/2018 Venue: New Ambassador Hotel, Harare
Welcome and opening remarks from Ministry of Environment, Water and Climate (MEWC)
He asked that participants give self-introductions. In his opening remarks he stated the purpose for the workshop.
Opening remarks from JICA representative:
In 2000, JICA supported construction of a Bio Nutrient Removal (BNR) Plant at the Zengeza Waste Water Treatment Plant (ZWWTP) and donated it to the municipality for its residents. However, the BNR plant at ZWWTP has not been operational since 2009. Although JICA funded the project, it is not currently, in a position to financially support the rehabilitation of the system. JICA carried out the survey in order to give direction and options on the way forward.
Presentation (1): JICA Study Team (JST)
1. Outline of the Survey.
2. Current situation at the Zengeza Waste Water Treatment Plant (WWTP) and its surrounding places. Granted Bio Nutrient Removal (BNR) System not operational since 2009. Most parts need replacement for overall rehabilitation of the plant. Other parts need to be upgraded. The main BNR facilities are clogged with mud. No subsidy from the central government due to devolution. Active external funding resource is ZimFund through the African Development Bank (AfDB). Chitown relies on water supply from the Harare City Council but the recognition gap of purchased water causes insufficient payment. Several pipelines and pump stations are damaged, which negatively impact residents’ living conditions. The inflow area into ZWWTP is about half the planned area. The water basin of Lake Chivero includes Harare City and Chitungwiza. Water pollution in Lake Chivero is worsening. About 220, 000 tons of pollutant load is stored in nine years. Possibility of a cholera outbreak.
Presentation (2): JICA Study Team
JST explained the sewerage fee level and allocation of expenses to BNR. In order to maintain the BNR properly, it is necessary to consider two points: sewerage fees, and proper allocation of the sewerage budget.
To maintain the BNR, USD2,000,000 will be required. Regarding the sewerage tariff, it is necessary to raise the collection rate to 70% at least, though currently the collection rate is around 54 percent.
In terms of proper allocation of the sewerage budget, it is necessary to allocate the budget of 60% to the BNR maintenance at least.
Above combination of 70% and 60% is just example, so combination of other ratios in the range of green area will be alternative. In addition, if it is possible to reduce the amount of chemical use, the rage of yellow becomes the target area to maintain the BNR.
As other recommendation, it is necessary to improve consistency on data, improve the capacity to make financial statements and practical budget, and improve financial stability
As to PPP scheme, overall, it seems good plan; however, the financial plan looks unfeasible. Therefore, it would be necessary to reconsider and verify the assumption or premises.

Data Collection Survey on Water Supply and Sewage Sector in Harare City Area in Zimbabwe April 2018
APP4-2
Discussion:
1. Policy, and future projections:
EMA:
There is a policy in place that was enacted in 2009 and within that policy there is a legal framework which ensures that EMA regulates the quality of all environmental issues, including the quality of waste water. It is hoped that with time, through the improvement of various treatment processes there is a possibility that the water quality will improve.
Sesani:
The catchment for water supply is heavily polluted, and that the cycle of polluting the Manyame River catchment is increasing. A different catchment up-stream, such as Mupfuri River or the building of Muda Dam could be the solution to Chitungwiza’s clean water supply.
MEWC:
The Ministry drafted a bill proposing the creation of Water and Waste Water Regulatory Authority which will be a stand-alone institution mandated to monitor those who are polluting, such as Chitungwiza City and the City of Harare. Currently, EMA and ZINWA are carrying out both, operational and monitoring activities. There is need to separate onitoring and operations. The new institution will be responsible for monitoring and enforcing the regulations pertaining to the environment quality.
Ministry of Local Government, Public Works, and National Housing (MLGPWNH):
This country has a lot of good regulations and statutory instruments. However, there should be more enabling than regulating. Chitungwiza is shouted at but with no help to solve its problems.
ZINWA:
The main challenge is the pollution of the Manyame System. The solution is to correct the quality of discharge, so that it is not transferred to the Harare Metro and other several centres down-stream. There is a need to look more at the waste water treatment plants, rather than importing water.
Sesani:
Sesani submitted a tender proposing to commercialize and not privatize the water and waste water, which is also what AfDB recommended. Sesani appealed for support of the project proposal because this would solve Chitungwiza’s clean water supply and waste water management issues. Also revenue collection will be guaranteed through the prepaid meter system Sesani is proposing, adding that the National Water Act supports such an initiative through the “user must pay” policy.
Harare Water:
Consideration should be on 1) cost of rehabilitation, 2) sustainability, 3) tariff, 4) power supply and 5) the quality of effluent when deciding whether a BNR plant is right for Chitungwiza at this moment in time. Harare Water knows without doubt, that the BNR produces the highest quality of effluent but comparison of cost (BNR versus the conventional bio-filters and hybrid systems), sewerage treatment regime and capacity building have to be included in the analysis. If the BNR is resuscitated, are the desired results going to be achieved?
2. The current situation - Survey Results:
AfDB:
Chitungwiza City and City of Harare need to work together for solutions to the pollution of Manyame River. Chitungwiza is discharging into the river and Harare uses eight (8) chemicals to treat the water.

Data Collection Survey on Water Supply and Sewage Sector in Harare City Area in Zimbabwe April 2018
APP4-3
Operation and maintenance is not being done properly because Chitungwiza does not have the money. AfDB through their studies, have recommended ring-fencing the water and sewerage revenue. Sustainability of donor investments is critical for the benefit of the citizens, and even the municipalities that are involved.
Ruwa Town Council:
Under ZimFund, Phase I they rehabilitated three BNR plants in Mutare, Kwekwe and Masvingo (partially). Masvingo’s BNR is operating well except when experiencing power outages. Mutare’s BNR state before rehabilitation was quite similar to the Chitungwiza one but it is now operating and well maintained because of the resources. Mutare also has a power dedicated to it and power outages are not experienced that much. Kwekwe had a similar rehabilitation program. Their plant is working well and it is hoped that they will continue to make it work. The last one is, Redclif which has two smaller BNR plants compared to other cities. It is their hope that by the end of the rehabilitation of those two plants, the municipality will be able to sustain them. The issue with these BNR plants is about sustainability.
AfDB:
For Chitungwiza to get sufficient water, they have to pay. How do we make sure that Chitown has sustainable income to pay for the water supply from Harare? There is a proposal among other proposals to ring-fence the revenues that are coming from water and sewerage so that they are able to maintain the systems. Mutare has started ring-fencing and is now able to maintain their systems. Other cities are trying to ring-fence revenues from water. Those that are not, are having problems. He said he was not sure about City of Harare. He suggested the need to share information.
Harare Water:
From what Ruwa Town Council said about the rehabilitation in Mutare, and what said, people can be in a position to ask how much it cost to rehabilitate the Mutare system and whether it is sustainable for Chitungwiza?
Harare Water:
What needs to be done as a country, is to have a uniform model to run a BNR plant. There are about ten models available. Latest models run under process control and the inflow quality is checked at each and every stage. Once raw sewerage quality information is loaded into the model, it tells you what it is supposed to read at each stage and will pre-inform the reader what prevailing measures are supposed to be taken. Currently BNR plants produce inconsistent results of effluent quality because 1) people/personnel are not pre-informed, and 2) they are not optimizing these BNR plants. For example, Firle uses 444 mega litres (ML)/day but if it is optimized, it will only use around 200 ML/day. The result is a saving of US$56 million of investment with a model that one pays a subscription of only US$2,500 per year. City of Harare has two such connections and the University of Zimbabwe has one but I don’t think other municipalities have the same thing. Latest models bring in sustainability for the whole plant because they run efficiently. By using the same model in all local authorities, it becomes easy in terms of training, improving operations and it becomes an opportunity for interaction/collaboration with all other local authorities because the engineers/process controllers will be trained by the same consultant.
JICA:
Collaboration is necessary in order to minimize the cost and maximize performance. JICA hoped that the Zengeza BNR system could be rehabilitated.
Break: 11:00 AM
Data Collection Survey on Water Supply and Sewage Sector in Harare City Area in Zimbabwe April 2018
APP4-4
Presentation: JICA Study Team
Institution and Organization
Issues in Sewerage Works
The minimum cost of investment is US$1,740,000 estimate.
The maximum dollar amount is US$3,910,000.
Maintenance cost is estimated at US$2,000,000, annually.
Discussion:
MLGPWNH:
Local authorities use the three A-s as a government policy. Thus, service has to be accessible, affordable and appropriate. Example, she is from a local authority that uses ponds and she pays US$2.80/month for sewerage and the ponds are good enough to take her kids to watch waterworks. It is affordable, accessible and appropriate. She wanted to know, 1) what the figure would be to build equivalent size ponds? 2) What else can a BNR be used for besides BNR producing better quality effluent? She added that, Chitungwiza does not have a strong economic base, it is politically weak and the chances of increasing revenue are slim. She explained that the Commission engaged the services of a debt collector, however, the residents are calling on their councillors to have him fired and management cannot do anything about it. She also pointed that Chitungwiza is in salary arrears for more than a year. If staff is increased, they are not going to be paid, anyway. Chitungwiza cannot afford a BNR system at the present moment.
Sesani:
The sewerage ponds at Zengeza are not designed with an effluent quality suitable to discharge into the river but to irrigate land to avoid polluting the river. He was not sure how efficiently that operation is happening. To answer PD VLA, MLGPWNH’s second question, he explained that if gas is collected it can be used to generate electricity to continuously run the BNR system and other uses. She clarified that she was talking about a derelict BNR and not a working one. He suggested that the best thing would be to abandon it unless one is willing to pay $6 million, which is what JICA suggested. However, if a donor agency gave $6 million to fix the BNR, then that is the right solution because the quality of water that comes out of there could be pumped back into Seke or other dams. It is then re-cycle to Chitungwiza without having to put it into the Manyame System.
MLGPWNH:
It is greatly embarrassing to have to tell the Japanese that, “Sorry, we killed your kid,” over and over again. She suggested that the group talk about solutions that will suit Chitungwiza as Waste Water Manager, Harare Water pointed out earlier. We need to decide whether Chitungwiza is a BNR council at this stage because of the current problems that are not likely to change in the short-term. Director, Sesani suggested that Chitungwiza rates go up by 10 percent to increase revenue collection in order to reach international standards of 75 percent. He added that without an effective Town Clerk, the town council is not in a position to make changes which will enable Chitungwiza to operate as a council. He argued that ponds need to be financed, then maintained and still have to irrigate the land as opposed to discharging into the river. PD VLA, MLGPWNH maintained that government does not have the financial capacity to resuscitate the BNR in Chitungwiza. She also pointed that there are 31 other local authorities that are better managed than Chitungwiza and those are better investment destinations. She added that Chitungwiza residents do not like to pay for services and that their attitude is not going to change. On the willingness to pay, Director, Sesani indicated that Sesani carried out a survey on that and the residents pay $0.25 per 20 litres of water, which translates to $12.00/m3. He stated that the current tariff is around $0.60/month per cubic metre and Sesani, in its analysis, suggested a tariff of $0.75. Chitungwiza residents are already paying ten times more than
Data Collection Survey on Water Supply and Sewage Sector in Harare City Area in Zimbabwe April 2018
APP4-5
what they should by buying the 20 litre water at $0.25. The willingness to pay is there. All what is needed is organizational restructuring, adding that prepaid meters give them water that they pay for.
MEWC:
If ponds are a feasible option for Chitungwiza.
Harare Water:
The BNR system is mainly for industry. If a municipality has predominantly domestic effluent it may use ponds and if the flow quantity is not very much it may also use ponds. Ponds also occupy a very large area. Chitungwiza is not an industrial town and indications are that Chitown uses 35ML/day while the plant’s capacity is about 30 ML/day. Chitungwiza is predominantly domestic and has a small industry. Also, the discharge from the industry is not continuous. Of what benefit is the resuscitation of the BNR plant? Alternatively, there is a working conventional system, and all what could be done is to add another pond, and another biological filter. Then, the only thing to focus on is making sure the pump stations pumping to the farms are always functioning.
Ruwa Town Council:
Pollution is the biggest problem, therefore, effluent must be pumped to the farms and must not be discharged into the environment. The consequences of polluting are now evident at the water source for our treatment works at Morton Jaffrey and it makes it extremely expensive to treat. A total cost analysis has to be done from beginning to end. For the ponds, you have to incorporate the cost of pollution which translates to the chemical needed to treat the water for it to be portable and pumped back to Harare. A BNR plant achieves the desirable quality of effluent.
MLGPWNH:
When doing a cost benefit analysis, there is need to also look at Chitungwiza Municipality’s current ability to pay. It is better to pump EMA green water to Imbwa Farm than to pump EMA yellow or red water into the river. If the BNR does not work properly, the water still goes into the Manyame River. She argued that BNR water cannot be pumped to Imbwa farm because it is not connected that way. If we opt for BNR, it has to be maintainable. Chitungwiza has to obtain the spare parts and store the parts. That is tied up money, and in addition to that, more people are needed to operate and maintain the plant. All those costs have to be put into the cost-benefit-analysis. She clarified that she was not writing off the BNR but foresaw Chitungwiza drowning from the cost of running a BNR plant.
MEWC:
Ponds are the way to go unless there is no land. She said she is talking about the hybrid system and a good pipeline.
Zengeza WWTP:
When partially treated effluent is pumped to Imbwa Farm, in a way pollution is transferred to the Mupfuri catchment. He suggested that since the infrastructure is already there at Zengeza, rehabilitating the BNR would be the way to go. The existing set up at Zengeza, he explained, is that if the waste water from the BNR plant fails to meet the required standard, it can be pumped to Imbwa farm. He pointed out that the BNR may be expensive but it is the “in-thing,” considering our environment. Deputy Director, MEWC was surprised to learn that pumping treated effluent to the pastures in a way contributes to polluting the environment. E Q Officer, EMA explained that if the current capacity of a hybrid plant is failing, it means that the desired treatment efficiency is reduced and in instants where high percolation occurs, underground water contamination is possible.
Harare Water:
Referring to page 26 of the survey report regarding the current situation, the focus be on the conventional system for now and fix the BNR at a later stage followed by the hybrid system in the
Data Collection Survey on Water Supply and Sewage Sector in Harare City Area in Zimbabwe April 2018
APP4-6
long-term. Later, the town council can then decommission the more expensive operation and maintenance system. (Note: BNR system is more expensive in operation and maintenance than conventional treatment system.) Waste Water Manager, Harare Water highlighted that technology has moved extensively to improve efficiency. The cost of constructing an older version of a BNR system is about $1 million/ML on one hand and on the other, the newer models cost around $400,000/ML to build. The question is, should we sustain the Zengeza BNR plant or replace it? The conventional system requires more land for irrigation, however. PD VLA, MLGPWNH thought JST was going to highlight the cost of treating per cubic metre of the BNR versus the conventional plant.
ZINWA:
Imbwa Farm should not be used as a dumping ground but as part of the treatment process. She suggested that the town council consider paying whoever is running the farm so that they are accountable to the way they manage the effluent discharged to their land. She added that whilst the BNR is the in-thing, there is need to determine what type of BNR is at Zengeza. If the BNR plant was to be resuscitated, what other challenges that could be encountered in the future if everyone else is moving with the times? Responding to the issue of paying for the use of Imbwa Farm, Waste Water Manager, Harare Water stated that the water she mentioned is more valuable to the farmers if they use it properly. The people at Imbwa Farm should be paying not Chitown.
AfDB:
JICA’s statement that they (JICA) do not currently have funds to rehabilitate the BNR in Chitungwiza. There could be changes within the government structure and the use of Imbwa farm could change as well. What will you do if Imbwa Farm ceases to exist? Chitungwiza’s population is going to increase. Will you be able to sustain the current system on a long-term? Do we need to make plans for the future? We may tell JICA that maybe they consider providing us a modern BNR system that can be manageable. That is another option. Then we can talk about the planning, to say when can this happen? How can we manage to make these investments sustainable? Can we make an analysis and see which one in the long run is maintainable? I agree with PD VLA, MLGPWNH that at the moment we cannot sustain Chitungwiza. However, as time goes on something will change. We need to look at short-term, medium-term and long-term and plan from there. JICA is always looking for sustainability before they commit to an investment. We have to look at all the available scenarios and come to a conclusion. Acting Water Manager, Harare Water asked if there is a way to have future cooperation of waste water treatment between the southern cooperated areas and Chitungwiza rather than having dotted areas and they are all polluting the same water source.
AfDB:
Currently the inflow from the sewerage is not sufficient to run those parts. So there is a need to look at the capacity. PD VLA, MLGPWNH emphasized the lack of funds to fix the BNR. Shimegi, JST explained that US$2 million was for operation and maintenance, annually.
(Not sure whose contribution this is):
The system under discussion is a system that will cater for the current Chitungwiza residents, or cater for the existing boundaries but with Chitungwiza is expanding across Nyatsime River, it is anticipated that additional households will go up 40,000 and above. This system cannot cater for the new stands.
Harare Water:
We need to make suggestions on how the problems in Chitungwiza can be rectified.
JICA:
Somebody talked about the population increase and I am surprised that you are still maintaining the old conventional treatment system which produces low quality of water which will be discharged into the environment and not the BNR which is high quality of treatment. Is it a good idea to create more ponds to treat waste water as the population increases?
Data Collection Survey on Water Supply and Sewage Sector in Harare City Area in Zimbabwe April 2018
APP4-7
Harare Water:
Participants were not being understood. He explained that currently there is the conventional system, working with about 35 ML to be treated at ZWWTP. The current plant takes about 22 ML. On the BNR plant, $2 million/yearly is needed to run the BNR. There are new advanced BNR systems that are way cheaper to run than the one we have. If we run the conventional, we save $1.8 million per year, which we can then use to construct a more efficient and much cheaper BNR plant. The BNR we currently have is the oldest of systems. There is need to compare the cost of resuscitating the old BNR plant in Chitungwiza or should we buy a more modern system which cost $400,000/ML. (Note: There is no established BNR technology which is low in construction and maintenance cost.)
MEWC:
Let us look at the available options.
Wrap up comments from the Ministry of Finance:
Principal Economist, Ministry of Finance and Economic Development thanked JICA for the study which triggered a fruitful debate and discussion. He appealed to JICA to reconsider offering financial support for the rehabilitation of the BNR plant in Chitungwiza. He pointed out that JICA’s decision not to financially assist Chitungwiza at this stage was before they heard the discussion which has also enlightened them. He said he was pessimistic that JICA will come to Chitungwiza’s much needed aid and that the government of Zimbabwe will appreciate it. He mentioned that some development partners are taking part in assisting Chitungwiza and other local authorities. He urged JICA, saying that it will be pleasing to see JICA joining hands with other donors in improving the lives of the people in Chitungwiza. He added that population growth, some threats of disease outbreaks are some of the issues that call for our attention. He praised ZimFund for its intervention initiatives in Chitungwiza and elsewhere. He said, there were, however, still some gaps that need intervention and that could be a cause to chip in and assist, so that all the areas are bridged. He reiterated that government does not have enough resources to address all the challenges that have been noted. So Zimbabwe also relies on the development partners in times of need. That also will buttress our re-engagement process that is ongoing. The need might be more than the figures highlighted in this report, however, government will appreciate additional support at whatever level. He noted that the report indicated that the revenue collection rate in Chitungwiza is low. Chitungwiza needs to improve on that by providing services to its residents, as well as educating them on the importance of contributing towards their own service provision.
Closing Remarks by the Ministry of Local Government, Public Works and National Housing:
PD VLA, MLGPWNH thanked JICA for not giving up on assisting Zimbabwe, especially in Chitungwiza. She hoped that JICA will understand the way the group was debating. She indicated that it was important to urge Chitungwiza to have a short-term, medium-term and a long-term plan. She urged Chitungwiza to maintain its relationship with JICA. She pointed out that at least this time there is a completed report, unlike the last time when JICA quit mid-way because the assistance from Chitungwiza, and the situation in Chitungwiza was unmanageable. There are some positives in the report, good job on debt collection and other things. That means Chitungwiza has the potential to grow and she urged Chitungwiza to maintain its relationship with JICA. Every time they come back show them that you have made progress. The way forward is depended on Chitungwiza. We have democracy in Zimbabwe, local authorities make their own decisions. There is nothing that stops others from helping Chitungwiza but the ultimate decision will be with them. The town council needs all the help it can get because it still is in great danger of collapse. This document contains information that Chitungwiza needs to be looking at very carefully, keeping it and making notes of it. If Chitungwiza does not understand some of the contents, there are plenty of people who can help them. Chitungwiza needs to use the Engineers’ Forum and ask engineers like Waste Water Manager of Harare Water who can give them practical advice. Chitungwiza also has funding from ZimFund and engineers at ZimFund are also very practical. The Ministry of Environment, Water and Climate is duty-bound to help the municipality because it carries out their mandate for them. Ministries need to back-up Chitungwiza. We hope that we will continue to be
Data Collection Survey on Water Supply and Sewage Sector in Harare City Area in Zimbabwe April 2018
APP4-8
able to call on JICA’s country officer for help. Sometimes it is useful to get an unbiased report like this one because it does not care about the politics. So we are grateful to that. Chitungwiza has to remember the three As. It is a government policy – accessible, affordable and appropriate. Do not give up the BNR, if you are not going to use it sooner, you may want to use it at a later time when things come right. I genuinely believe that things are coming right in Zimbabwe and we are going to grow. The urban population growth has dropped. Chitungwiza has to stop planning vast housing programs without planning offsite infrastructure. Stop planning things that you cannot service. Chitungwiza has to come up with a list of enablers and present those to the respective officers, so that we can help you to put your plans into place. She appealed to JICA not to give up on the BNR system in Zengeza.
Workshop ended at 1:00 PM
Lunch 1:00 PM

Data Collection Survey on Water Supply and Sewage Sector in Harare City Area in Zimbabwe April 2018
APP4-9
Material for Presentation
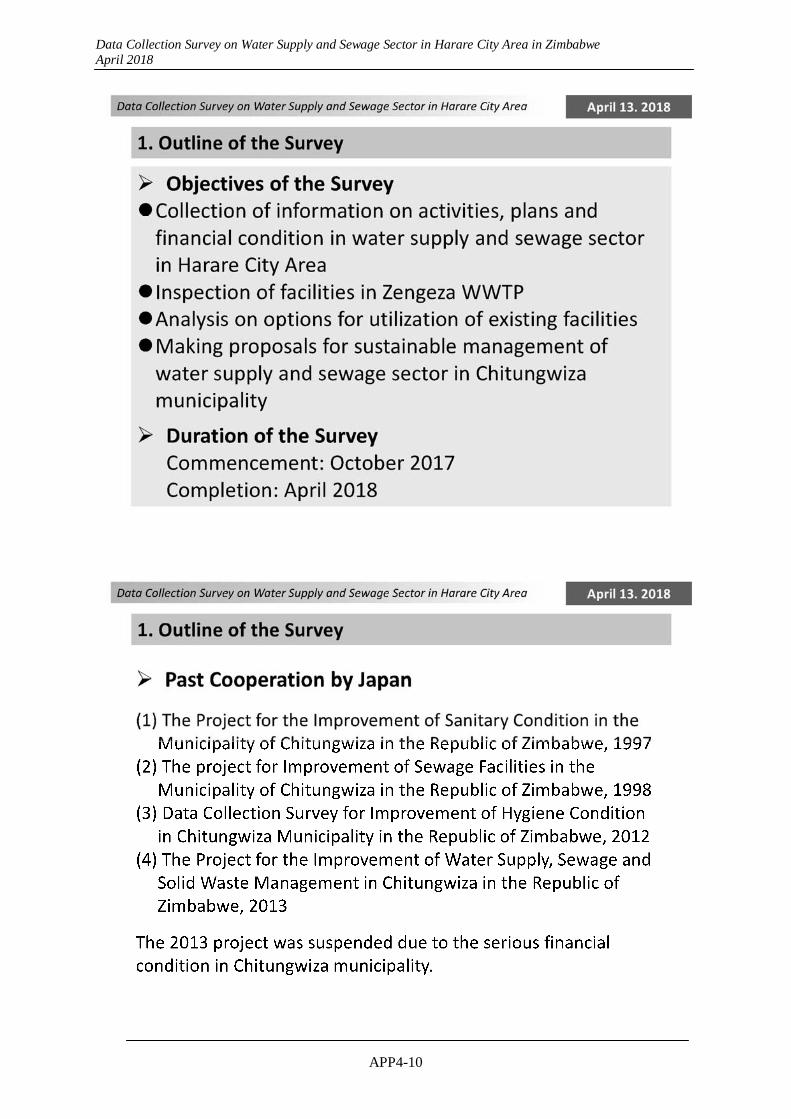
Data Collection Survey on Water Supply and Sewage Sector in Harare City Area in Zimbabwe April 2018
APP4-10
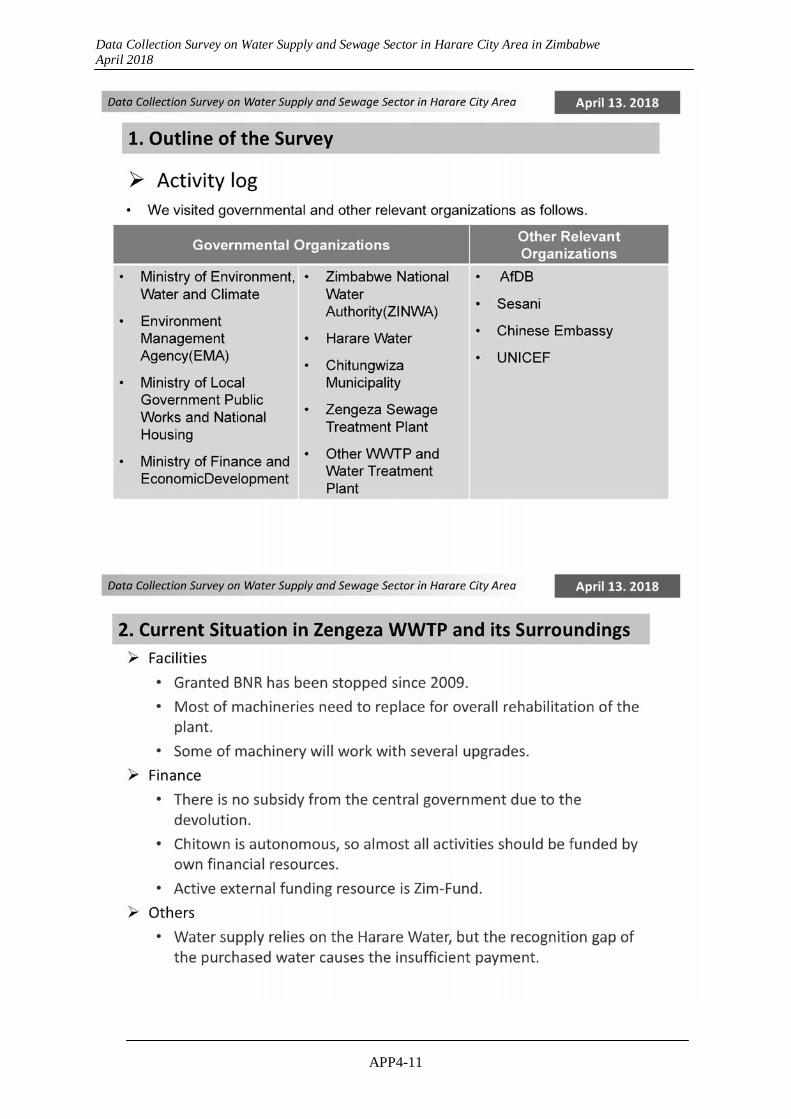
Data Collection Survey on Water Supply and Sewage Sector in Harare City Area in Zimbabwe April 2018
APP4-11
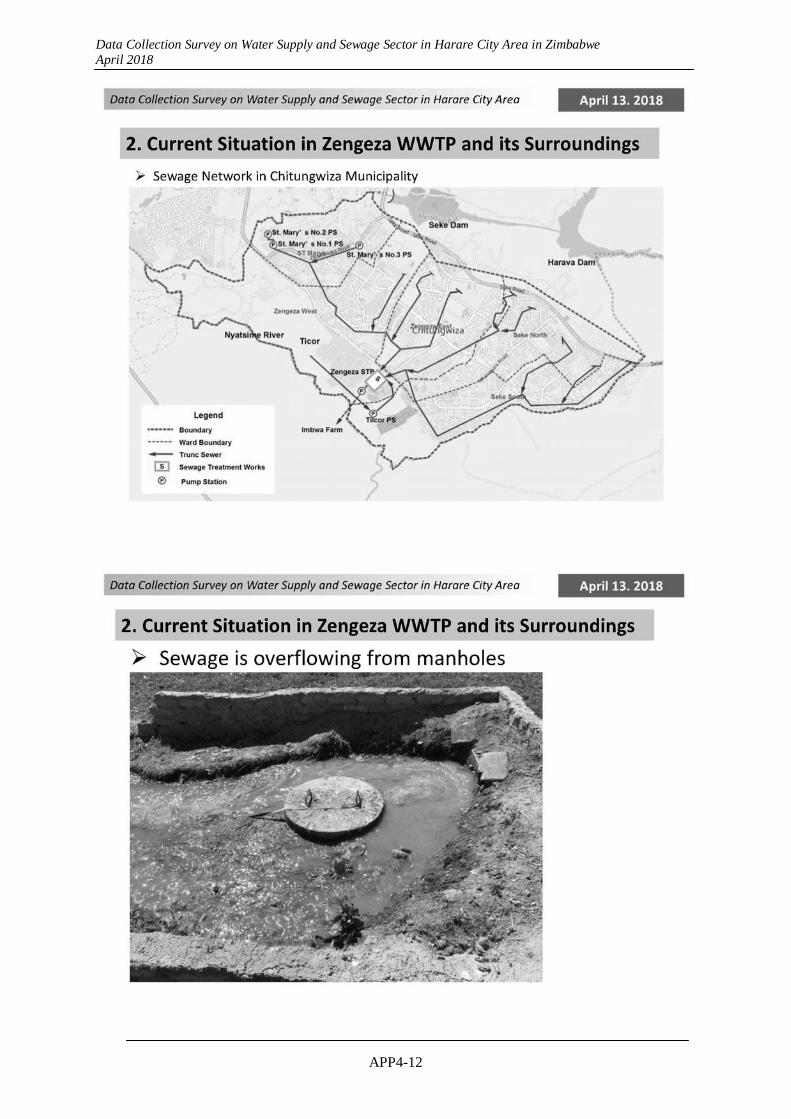
Data Collection Survey on Water Supply and Sewage Sector in Harare City Area in Zimbabwe April 2018
APP4-12
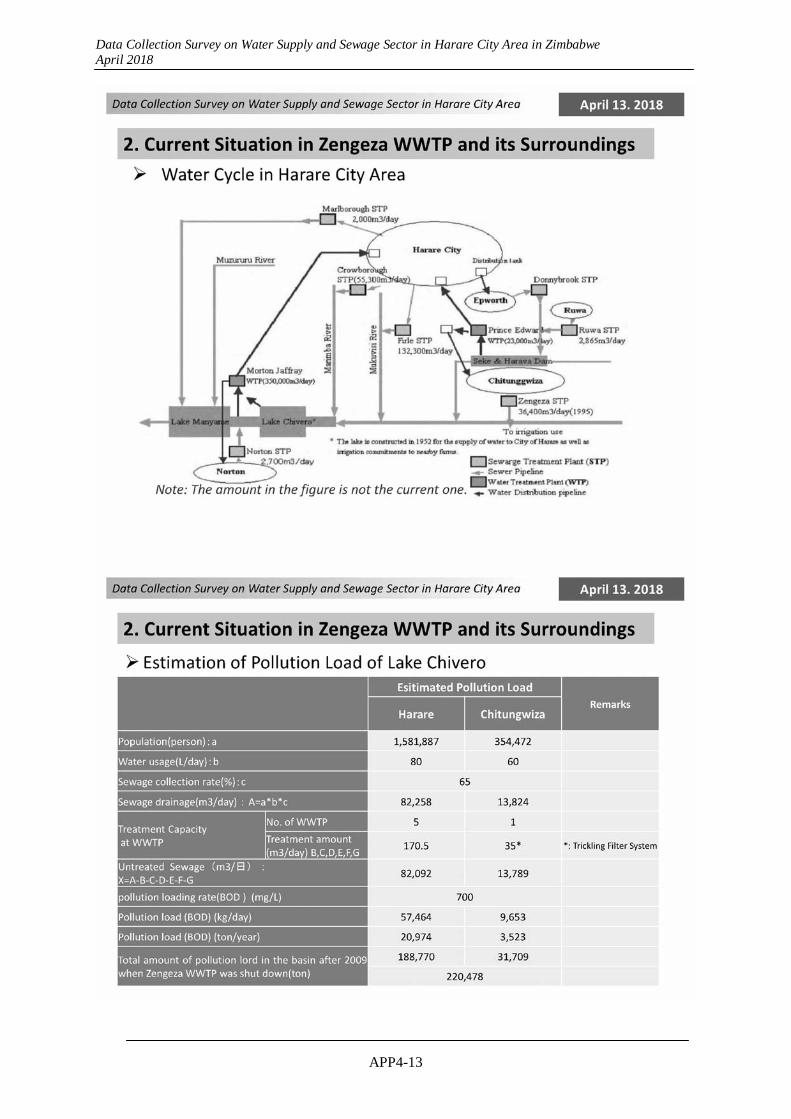
Data Collection Survey on Water Supply and Sewage Sector in Harare City Area in Zimbabwe April 2018
APP4-13
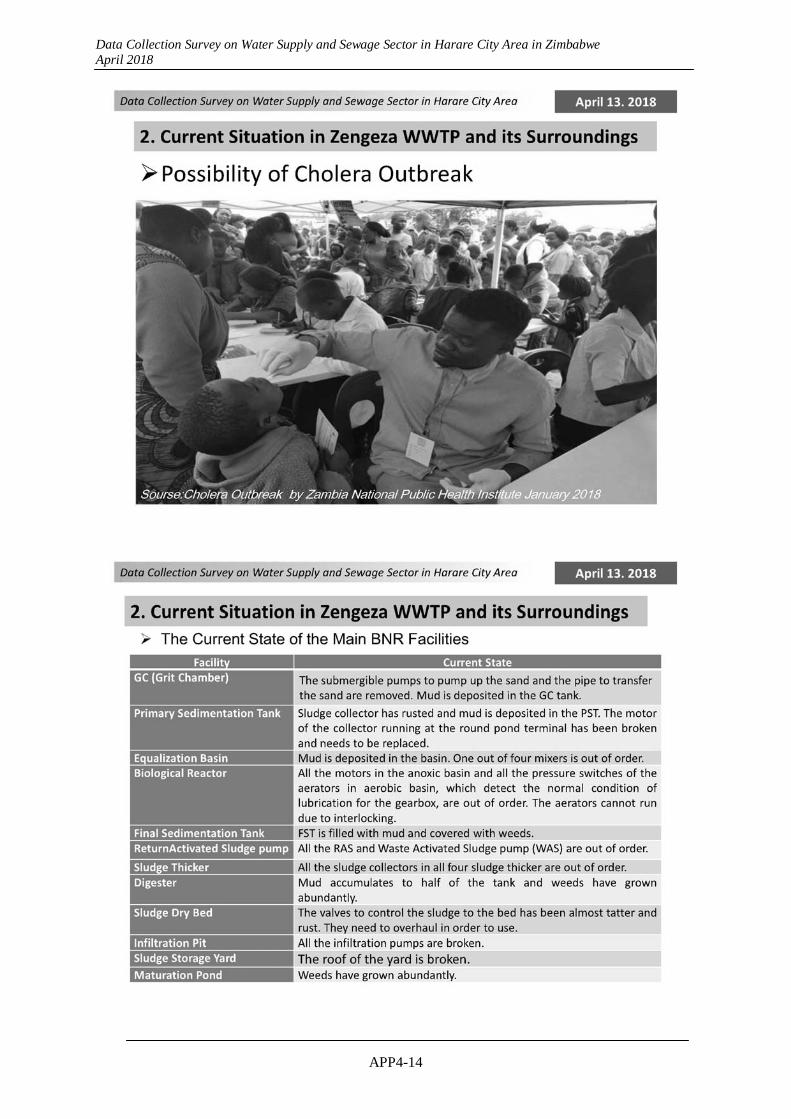
Data Collection Survey on Water Supply and Sewage Sector in Harare City Area in Zimbabwe April 2018
APP4-14
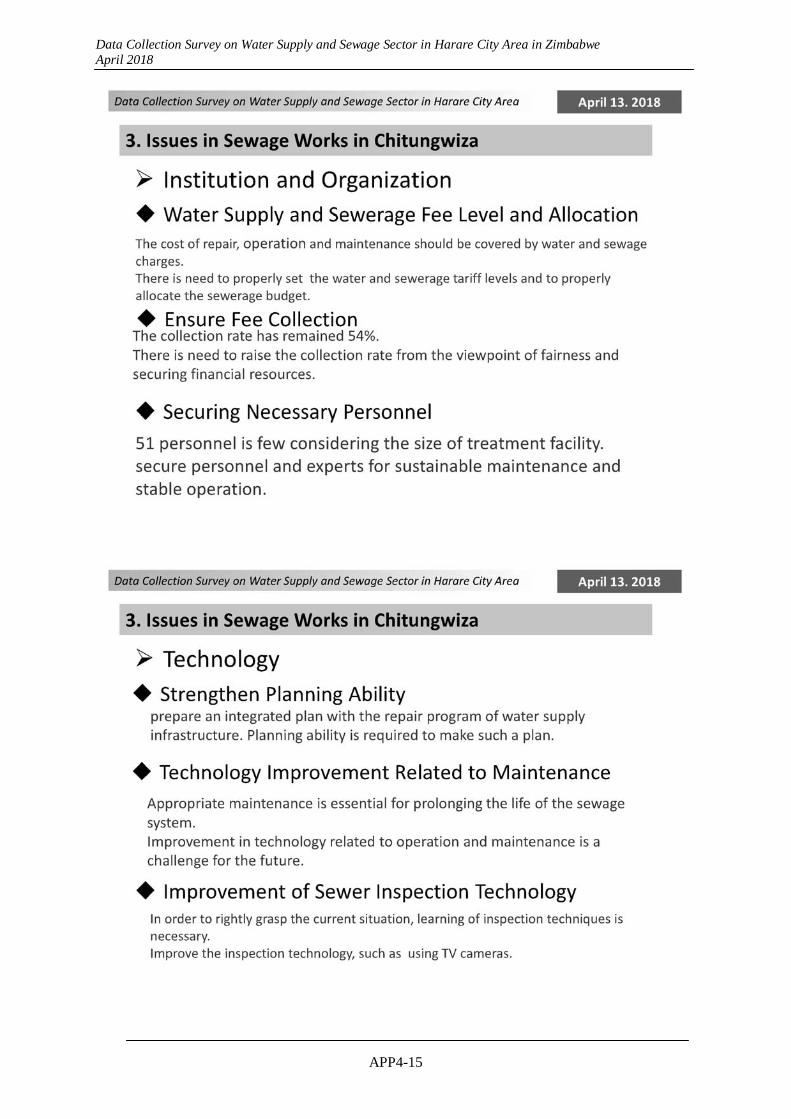
Data Collection Survey on Water Supply and Sewage Sector in Harare City Area in Zimbabwe April 2018
APP4-15
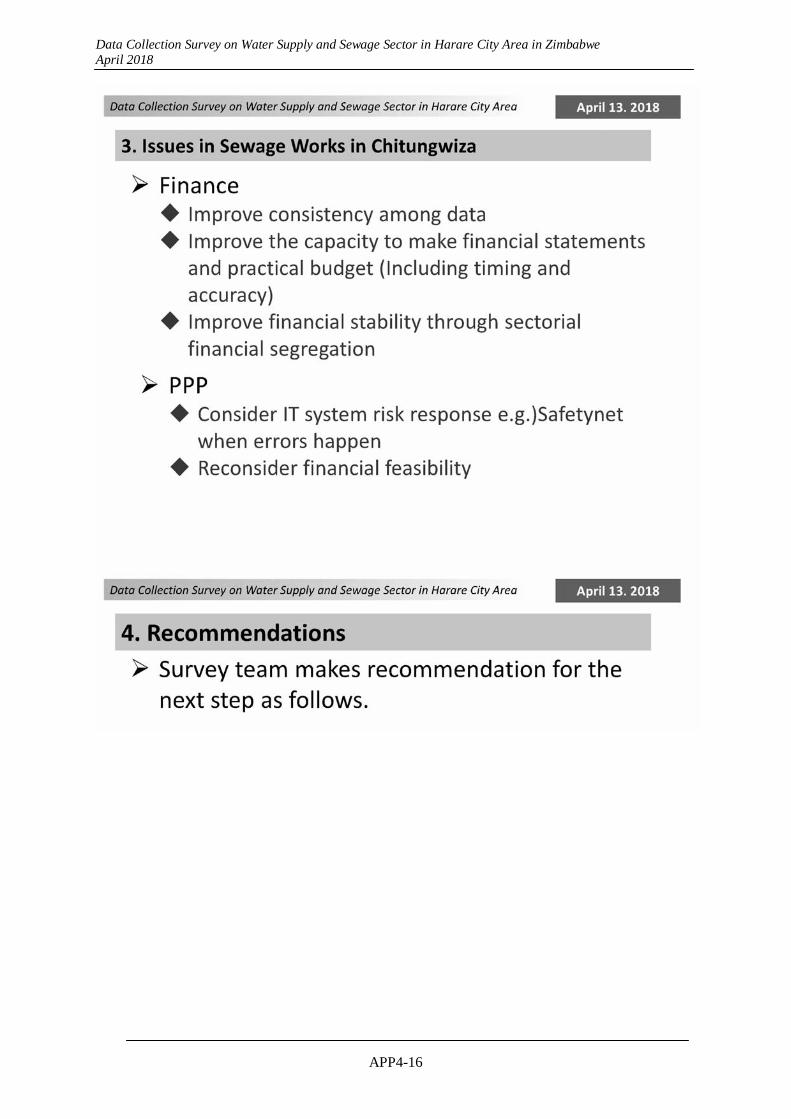
Data Collection Survey on Water Supply and Sewage Sector in Harare City Area in Zimbabwe April 2018
APP4-16
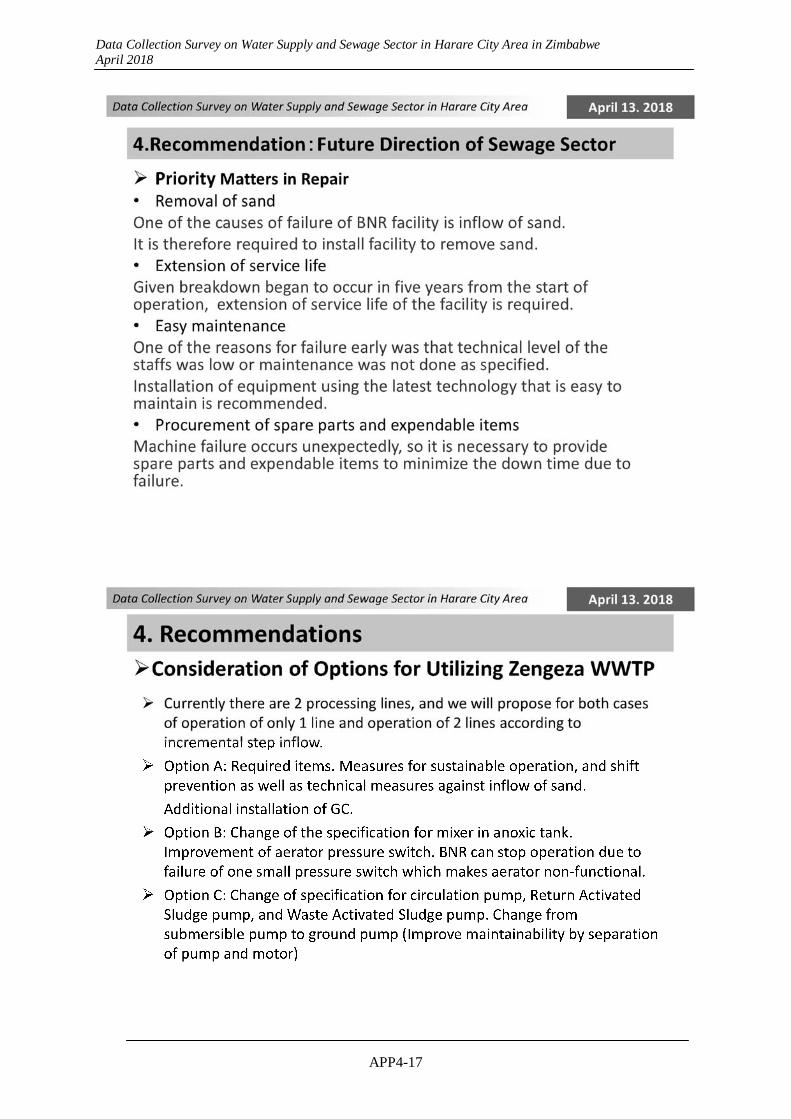
Data Collection Survey on Water Supply and Sewage Sector in Harare City Area in Zimbabwe April 2018
APP4-17
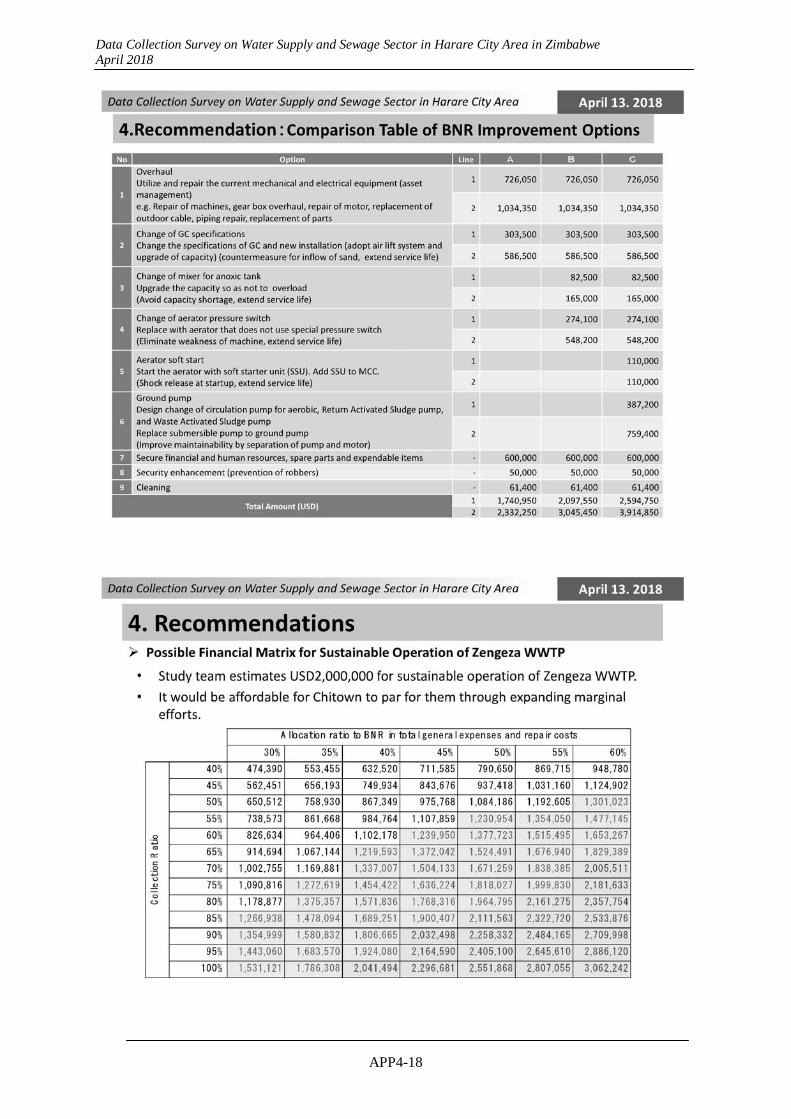
Data Collection Survey on Water Supply and Sewage Sector in Harare City Area in Zimbabwe April 2018
APP4-18
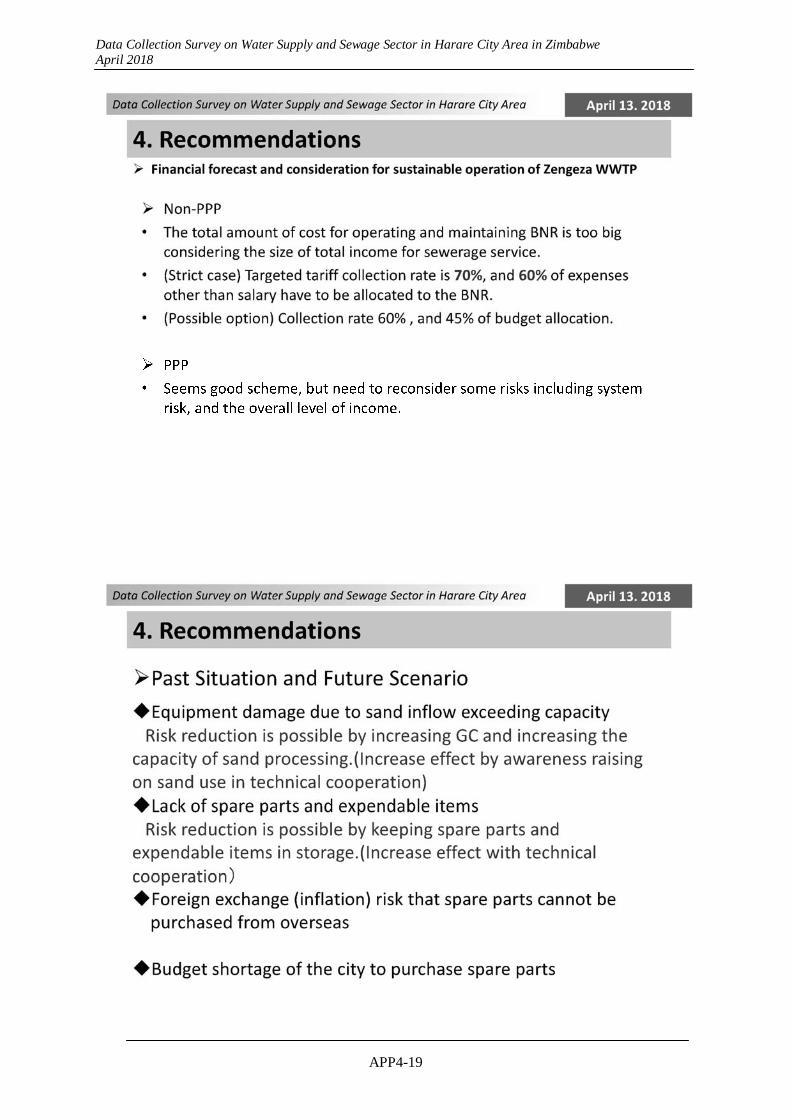
Data Collection Survey on Water Supply and Sewage Sector in Harare City Area in Zimbabwe April 2018
APP4-19

Data Collection Survey on Water Supply and Sewage Sector in Harare City Area in Zimbabwe April 2018
APP4-20
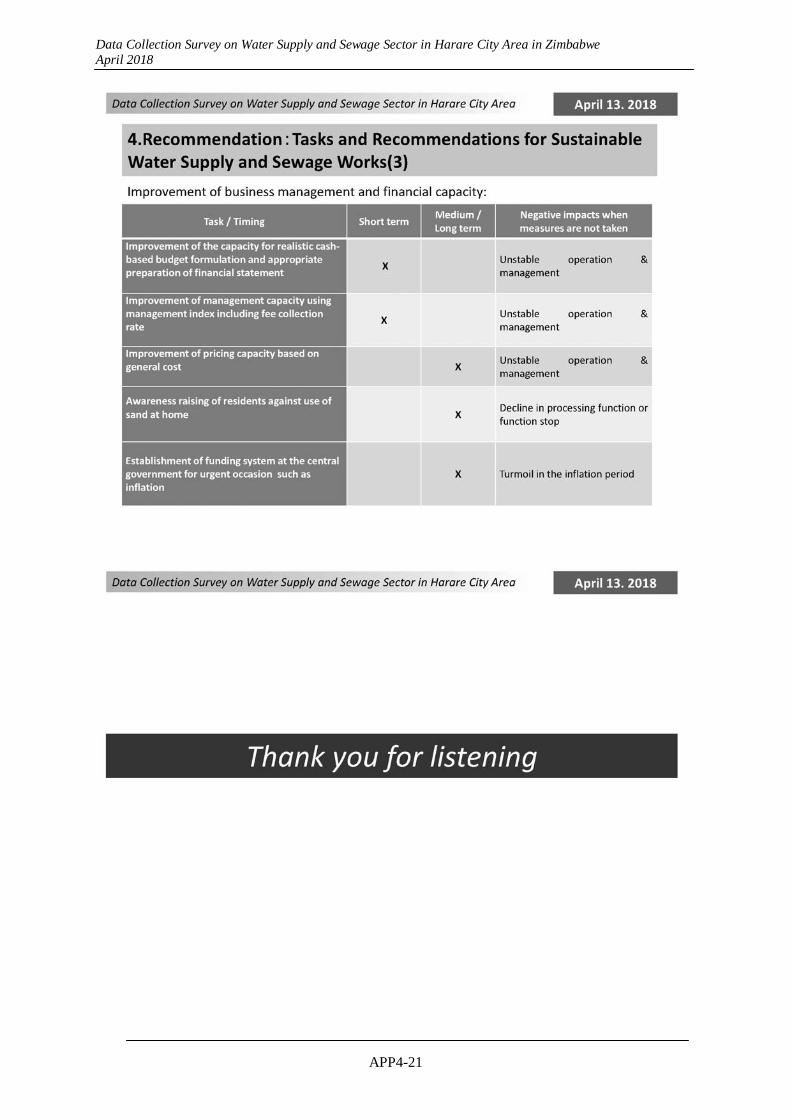
Data Collection Survey on Water Supply and Sewage Sector in Harare City Area in Zimbabwe April 2018
APP4-21
Related Documents