18 - 009 CR ( 3 ) 6R DATA COLLECTION SURVEY ON NACALA CORRIDOR INTEGRATED DEVELOPMENT IN SOUTHERN AFRICA FINAL REPORT MARCH 2018 JAPAN INTERNATIONAL COOPERATION AGENCY (JICA) ORIENTAL CONSULTANTS GLOBAL CO., LTD. MITSUBISHI UFJ RESEARCH AND CONSULTING CO.LTD. EIGHT-JAPAN ENGINEERING CONSULTANTS INC. REPUBLIC OF ZAMBIA REPUBLIC OF MALAWI

Welcome message from author
This document is posted to help you gain knowledge. Please leave a comment to let me know what you think about it! Share it to your friends and learn new things together.
Transcript
18-009CR (3)
6 R
DATA COLLECTION SURVEY ON
NACALA CORRIDOR INTEGRATED DEVELOPMENT
IN SOUTHERN AFRICA
FINAL REPORT
MARCH 2018
JAPAN INTERNATIONAL COOPERATION AGENCY (JICA) ORIENTAL CONSULTANTS GLOBAL CO., LTD.
MITSUBISHI UFJ RESEARCH AND CONSULTING CO.LTD.
EIGHT-JAPAN ENGINEERING CONSULTANTS INC.
REPUBLIC OF ZAMBIA REPUBLIC OF MALAWI

Exchange Rate (March 2018)
US Dollar (USD) 1.00=Japanese Yen (JPY) 106.79
Zambian Kwacha (ZMW) 1.00= (JPY) 10.99
Malawian Kwacha (MWK) 1.00= (JPY) 0.15
Data Collection Survey on Nacala Corridor Integrated Development in Southern Africa Final Report
i
TABLE OF CONTENTS
Page
List of Tables .......................................................................................................................................... vi
List of Figures ........................................................................................................................................ xi
List of Abbreviations .............................................................................................................................. xv
Executive Summary
Chapter 1 Introduction ................................................................................................................. 1-1
1.1 Background of the Study .................................................................................................... 1-1
1.2 Objectives of the Study ...................................................................................................... 1-1
1.3 Study Area .......................................................................................................................... 1-2
1.4 Counterpart Agencies for the Study ................................................................................... 1-3
1.5 Study Schedule ................................................................................................................... 1-3
Chapter 2 Corridor Development in Zambia and Malawi and Current Status
of Nacala Corridor Development ............................................................................... 2-1
2.1 Clusters of Transport Corridors .......................................................................................... 2-1
2.1.1 Propulsion Frameworks: Transport Corridors as Economic Corridors ......................... 2-1
2.1.2 Transport Corridors Relevant to Malawi and Zambia ................................................... 2-3
2.1.3 Current Status of Major Transport Corridors Excluding Nacala Corridor .................... 2-5
2.1.4 Institutions for Transport Corridors ............................................................................... 2-6
2.2 Current Conditions and Status of Nacala Corridor ............................................................. 2-8
2.2.1 Background of Nacala Corridor .................................................................................... 2-8
2.2.2 Status and Conditions of Nacala Corridor ..................................................................... 2-9
2.3 Current Usage of Nacala Corridor vis-a-vis Major Corridors .......................................... 2-15
2.3.1 Distance between Major Cities and Main Ports .......................................................... 2-15
2.3.2 Traffic Volume in Zambia and Malawi ....................................................................... 2-16
2.3.3 Freight Traffic at Border ............................................................................................. 2-17
2.3.4 Freight Share per Corridor .......................................................................................... 2-19
2.3.5 Freight Movement on Nacala Corridor ....................................................................... 2-22
2.3.6 Capacity of Major Ports .............................................................................................. 2-23
2.3.7 One Stop Border Posts (OSBPs) ................................................................................. 2-25
2.3.8 Transit Time and Cost ................................................................................................. 2-27
2.4 Comprehensive Evaluation of the Corridors .................................................................... 2-29
2.4.1 Hearing Survey Results on Nacala Corridor ............................................................... 2-29
2.4.2 Comprehensive Analysis on Transport Corridors Related to Zambia and Malawi ..... 2-31
Chapter 3 Present Condition of Zambia ..................................................................................... 3-1
3.1 Agriculture.......................................................................................................................... 3-2
3.1.1 Overview of the Agriculture .......................................................................................... 3-2
3.1.2 Agriculture Condition ................................................................................................... 3-2
3.1.3 Structure of Agriculture Producers ................................................................................ 3-5
Data Collection Survey on Nacala Corridor Integrated Development in Southern Africa Final Report
ii
3.1.4 Current Situation on Agriculture Production and Distribution ...................................... 3-5
3.1.5 Agribusiness Clusters and Players ................................................................................ 3-9
3.1.6 Related Policies, Programmes and Projects ................................................................ 3-13
3.1.7 Development Potential and Challenges of Agriculture and Agribusiness Sector ........ 3-19
3.2 Industry ............................................................................................................................. 3-55
3.2.1 Overview of the Industry ............................................................................................. 3-55
3.2.2 Current Condition and Potential of Industrial Development Along Nacala
Corridor ....................................................................................................................... 3-56
3.3 Mining .............................................................................................................................. 3-58
3.3.1 Overview of the Mining .............................................................................................. 3-58
3.3.2 Mineral Production in Zambia .................................................................................... 3-58
3.3.3 Export of the Mineral Commodities ............................................................................ 3-60
3.3.4 Export Destinations of Mineral Commodities ............................................................. 3-60
3.3.5 Government Policy of Mining Sector ......................................................................... 3-63
3.3.6 Development Potential of the Mining Sector in the Nacala Corridor Region ............. 3-64
3.4 Trade ................................................................................................................................. 3-64
3.4.1 Overview of the International Trade ........................................................................... 3-64
3.4.2 Traded Commodities ................................................................................................... 3-65
3.4.3 Trade Along Nacala Corridor ...................................................................................... 3-68
3.4.4 Development Potential and Challenges of the Trade Sector
in the Nacala Corridor Region .................................................................................... 3-72
3.5 Tourism ............................................................................................................................. 3-73
3.5.1 Overview of the Tourism ............................................................................................. 3-73
3.5.2 Tourism Sector of the Nacala Corridor Region ........................................................... 3-76
3.5.3 Policy Direction and Challenges of Tourism Sector ................................................... 3-78
3.5.4 Development Potential and Challenges of the Tourism Sector in the Nacala
Corridor Region .......................................................................................................... 3-79
3.6 Energy .............................................................................................................................. 3-80
3.6.1 Current Situations of the Electricity Sub-Sector ......................................................... 3-80
3.6.2 Current Situations of the Petroleum Sub-Sector ......................................................... 3-83
3.6.3 Development Potential and Challenges of the Energy Sector ..................................... 3-85
3.7 Foreign and Domestic Investment .................................................................................... 3-87
3.7.1 Investment in Zambia .................................................................................................. 3-87
3.7.2 Investment in Eastern Province ................................................................................... 3-90
3.8 Transport Infrastructure and Logistics ............................................................................. 3-92
3.8.1 Current Transport Sector ............................................................................................. 3-92
3.8.2 Road Sub-Sector .......................................................................................................... 3-93
3.8.3 Rail Sub-Sector ........................................................................................................... 3-98
3.8.4 Aviation Sub-Sector .................................................................................................. 3-102
3.8.5 Waterway Sub-Sector ................................................................................................ 3-104
Chapter 4 Present Condition of Malawi ...................................................................................... 4-1
4.1 Agriculture.......................................................................................................................... 4-2
4.1.1 Overview of the Agriculture .......................................................................................... 4-2
Data Collection Survey on Nacala Corridor Integrated Development in Southern Africa Final Report
iii
4.1.2 Agriculture Condition ................................................................................................... 4-2
4.1.3 Structure of Agriculture Producers ................................................................................ 4-5
4.1.4 Current Situation of Agriculture Production and Distribution ...................................... 4-6
4.1.5 Agribusiness Clusters and Players .............................................................................. 4-11
4.1.6 Related Policies, Programmes and Projects ................................................................ 4-13
4.1.7 Development Potential and Challenges of Agriculture and Agribusiness Sector ........ 4-20
4.2 Industry ............................................................................................................................. 4-43
4.2.1 Overview of the Industry ............................................................................................. 4-43
4.2.2 Current Condition and Potential of Industrial Development Along Nacala
Corridor ....................................................................................................................... 4-44
4.3 Mining .............................................................................................................................. 4-45
4.3.1 Overview of the Mining .............................................................................................. 4-45
4.3.2 Mineral Production in Malawi .................................................................................... 4-46
4.3.3 Export of Mineral Commodities ................................................................................. 4-46
4.3.4 Government Policy of Mining Sector ......................................................................... 4-47
4.3.5 Increased Mining Projects in Recent Years ................................................................. 4-48
4.4 Trade ................................................................................................................................. 4-49
4.4.1 Overview of the International Trade ........................................................................... 4-49
4.4.2 Traded Commodities ................................................................................................... 4-50
4.4.3 Development Potential and Challenges of the Trade Sector in the Nacala
Corridor Region .......................................................................................................... 4-53
4.5 Tourism ............................................................................................................................. 4-53
4.5.1 Overview of the Tourism ............................................................................................. 4-53
4.5.2 Policy Direction of Tourism Sector ............................................................................. 4-57
4.5.3 Development Potential and Challenges of the Tourism Sector in the Nacala
Corridor Region .......................................................................................................... 4-58
4.6 Energy .............................................................................................................................. 4-59
4.6.1 Current Situations of the Electricity Sub-Sector ......................................................... 4-59
4.6.2 Current Situations of the Liquid Fuel and Gas Sub-Sector ......................................... 4-61
4.6.3 Development Potential and Challenges of the Energy Sector ..................................... 4-63
4.7 Foreign and Domestic Investment .................................................................................... 4-66
4.8 Transport Infrastructure and Logistics ............................................................................. 4-68
4.8.1 Current Transport Sector ............................................................................................. 4-68
4.8.2 Road Sub-Sector .......................................................................................................... 4-71
4.8.3 Rail Sub-Sector ........................................................................................................... 4-77
4.8.4 Aviation Sub-Sector .................................................................................................... 4-83
4.8.5 Waterway Sub-Sector .................................................................................................. 4-84
Chapter 5 Overall Issues and Impact Analysis of Nacala Corridor Development .................. 5-1
5.1 Evaluation of Relevance of Nacala Corridor Development to Existing Policies
and Plans ............................................................................................................................ 5-1
5.1.1 Zambia’s National Development Plan and Nacala Corridor ......................................... 5-1
5.1.2 Zambia’s National Transport Policy (ZNTP) and Nacala Corridor ............................... 5-3
5.1.3 Zambia’s Budget Allocation Related Nacala Corridor Development ........................... 5-3
Data Collection Survey on Nacala Corridor Integrated Development in Southern Africa Final Report
iv
5.1.4 Malawi Growth and Development Strategy (MGDS) III and Nacala Corridor ............ 5-6
5.1.5 Malawi’s National Transport Policy and Nacala Corridor ............................................ 5-7
5.1.6 Malawi’s National Transport Master Plan (MNTMP) and Nacala Corridor ................. 5-8
5.1.7 Malawi’s Budget Allocation Related Nacala Corridor Development ........................... 5-9
5.1.8 Regional Economic Integration Policy and Nacala Corridor ...................................... 5-12
5.2 Possible Driving Forces for Nacala Corridor Development ............................................. 5-14
5.2.1 Zambia ......................................................................................................................... 5-14
5.2.2 Malawi ......................................................................................................................... 5-20
5.3 Overall Issues on Nacala Corridor Development ............................................................. 5-24
5.3.1 Issues on Nacala Corridor Transport ........................................................................... 5-24
5.3.2 Issues on Economic Sectors ........................................................................................ 5-26
5.3.3 Issues on the Relationship Between Corridor Transport and Economic Sectors ........ 5-29
5.3.4 Issues on Regional Economic Integration ................................................................... 5-30
5.4 Impact Analysis ................................................................................................................ 5-31
5.4.1 Perspectives on Nacala Corridor Development ........................................................... 5-31
5.4.2 Impact of Railway Upgrading on Transport Cost ....................................................... 5-36
5.4.3 Impact of Nacala Corridor Development on Fuels and Fertiliser ............................... 5-40
5.4.4 Economic Impact on the Nacala Corridor Region ...................................................... 5-45
Chapter 6 Proposed Growth Scenarios of Zambia and Malawi Related
to Nacala Corridor Development .............................................................................. 6-1
6.1 Introduction ........................................................................................................................ 6-1
6.2 Advantages of Nacala Corridor over Other Transport Corridors of Zambia
and Malawi ......................................................................................................................... 6-2
6.2.1 Emergence of Nacala Corridor as an Important Alternative Transport
Route ............................................................................................................................. 6-2
6.2.2 Advantages of Nacala Corridor over Other Transport Corridors
for Zambia and Malawi ................................................................................................. 6-3
6.2.3 Impact of Advantageous Nacala Corridor with Planned Interventions
on Development of Economic Sectors .......................................................................... 6-9
6.3 Proposed Vision for Nacala Corridor Development ......................................................... 6-10
6.3.1 Proposed Vision on Nacala Corridor Development for Zambia, Malawi
and Mozambique ......................................................................................................... 6-10
6.3.2 Nacala Corridor Development Concept and Guiding Principles ................................ 6-10
6.4 Basic Policies on the Utilisation of Nacala Corridor and Development
of Nacala Corridor Transport Infrastructure and Services ................................................ 6-12
6.4.1 Basic Policies on the Utilisation of Nacala Corridor .................................................. 6-12
6.4.2 Selection of Development Scenario of Nacala Corridor Transport
Infrastructure and Services .......................................................................................... 6-14
6.5 Basic Policies on Priority Economic Sectors and Target Markets in Nacala
Corridor Development ...................................................................................................... 6-17
6.5.1 Increasing Importance of Regional Markets ............................................................... 6-17
6.5.2 Basic Policies for Development of Economic Sectors in Relation to the
Development of Nacala Corridor Transport Infrastructure ......................................... 6-17
Data Collection Survey on Nacala Corridor Integrated Development in Southern Africa Final Report
v
6.5.3 Priority Economic Sectors to be Promoted in Relation to Nacala Corridor
Transport Infrastructure Development ........................................................................ 6-18
6.6 Strategies and Four Stages for Development of Nacala Corridor Transport
Infrastructure and Services ............................................................................................... 6-21
6.6.1 1st Stage (Present Situation) and 2nd Stage of Development of Nacala
Corridor Transport Infrastructure and Services ........................................................... 6-21
6.6.2 3rd Stage and 4th Stage of Development of Nacala Corridor Transport
Infrastructure and Services .......................................................................................... 6-21
6.7 Zambia’s Strategies for Promoting Development of Potential Economic Sectors
in Relation to Nacala Corridor Development ................................................................... 6-23
6.7.1 Zambia’s Strategies for Promoting Development of Potential Economic
Sectors by Taking Advantage of the Upgraded Nacala Corridor ................................ 6-23
6.7.2 Zambia’s Potential Economic Sectors Related to Nacala Corridor Development ...... 6-25
6.7.3 Description of Potential Economic Sectors of Zambia and Key Points
for Promoting Development of Potential Economic Sectors of Zambia ..................... 6-27
6.8 Malawi’s Strategies for Promoting Development of Potential Economic Sectors
in Relation to Nacala Corridor Transport Development ................................................... 6-32
6.8.1 Malawi’s Strategies for Promoting Development of Potential Economic
Sectors in Relation to Nacala Corridor Transport Development ................................. 6-32
6.8.2 Malawi’s Potential Economic Sectors Related to Nacala Corridor Development ...... 6-33
6.8.3 Description of Potential Economic Sectors of Malawi and Key Points
for Promoting Development of Potential Economic Sectors in Malawi ..................... 6-35
Chapter 7 Priority Projects Proposed for Promoting Nacala Corridor Development ............ 7-1
7.1 A Long List of Projects ...................................................................................................... 7-1
7.2 List of Recommended Priority Projects Promoting Nacala Corridor Development ........ 7-16
7.3 Brief Profiles of Priority Projects Recommended for Promoting Nacala
Corridor Development ...................................................................................................... 7-17
7.3.1 Development of Transport Infrastructure of Nacala Corridor ..................................... 7-17
7.3.2 Promotion of Economic Sectors Along Nacala Corridor ............................................ 7-27
Appendix for Chapter 7: Points to be Considered for Farming Plan .......................................... 7-36
ANNEX : Records of the Seminars
Data Collection Survey on Nacala Corridor Integrated Development in Southern Africa Final Report
vi
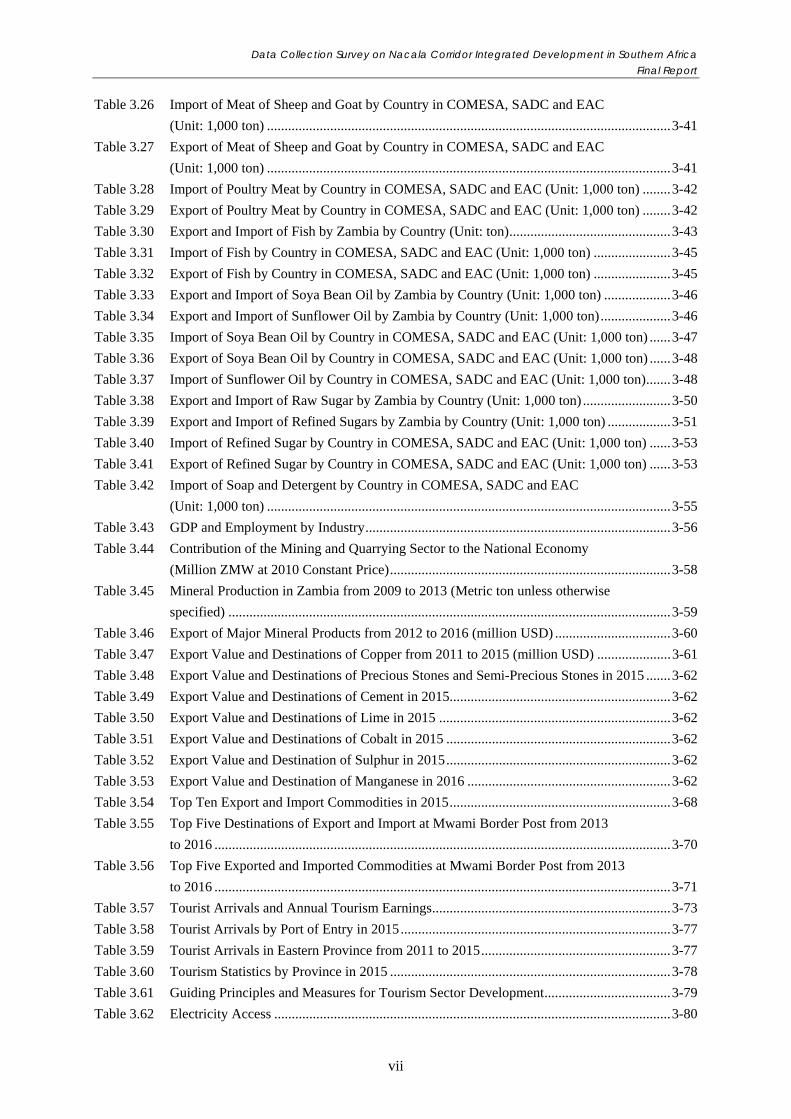
LIST OF TABLES Page
Table 1.1 Study Area (Nacala Corridor Region in Zambia and Malawi) ............................................... 1-2
Table 1.2 List of Main Counterpart Agencies for the Study ................................................................... 1-3
Table 2.1 Distance between Major Cities and Main Ports .................................................................... 2-16
Table 2.2 Border Freight Traffic for Zambia and Malawi in 2015 ....................................................... 2-18
Table 2.3 Freight Share per Corridor for Zambia (Year 2016) ............................................................. 2-20
Table 2.4 Freight Share per Corridor for Malawi (Year 2016) ............................................................. 2-21
Table 2.5 Freight Movement on Nacala Corridor in Zambia ................................................................ 2-22
Table 2.6 Freight Movement by Railway in Malawi (2015) ................................................................ 2-23
Table 2.7 Outline of the Capacity of the Major Ports ........................................................................... 2-25
Table 2.8 Development Status of OSBPs at Various Border Towns .................................................... 2-26
Table 2.9 Transit Time and Costs for the Major Towns from Various Ports ....................................... 2-28
Table 3.1 Demographic Characteristics of the Study Area ..................................................................... 3-1
Table 3.2 Agriculture Products by Agro-ecological Region ................................................................... 3-3
Table 3.3 Farm Structure in Zambia (2016) ........................................................................................... 3-5
Table 3.4 Category of Producers inside of Farm Block ........................................................................ 3-15
Table 3.5 Roles of the three Committees for Screening the Investment Plans ..................................... 3-15
Table 3.6 Progress of the Farm Block Development ............................................................................ 3-16
Table 3.7 Export and Import of Maize by Zambia by Country (Unit: ton) ........................................... 3-24
Table 3.8 Import of Maize by Country in COMESA, SADC and EAC (Unit: 1,000 ton) ................... 3-26
Table 3.9 Export of Maize by Country in COMESA, SADC and EAC (Unit: 1,000 ton) ................... 3-26
Table 3.10 Export and Import of Soya Bean by Zambia by Country (Unit: 1,000 ton) ......................... 3-27
Table 3.11 Import of Soya Bean by Country in COMESA, SADC and EAC (Unit: 1,000 ton) ............ 3-29
Table 3.12 Export of Soya Bean by Country in COMESA, SADC and EAC (Unit: 1,000 ton) ............ 3-29
Table 3.13 Export and Import of Wheat by Zambia by Country (Unit: 1,000 ton) ................................ 3-30
Table 3.14 Import of Wheat by Country in COMESA, SADC and EAC (Unit: 1,000 ton) ................... 3-31
Table 3.15 Export of Wheat by Country in COMESA, SADC and EAC (Unit: 1,000 ton) ................... 3-32
Table 3.16 Export and Import of Cotton Lint by Zambia by Country (Unit: 1,000 ton) ........................ 3-33
Table 3.17 Import of Cotton Lint by Country in COMESA, SADC and EAC (Unit: 1,000 ton) ........... 3-34
Table 3.18 Export of Cotton Lint by Country in COMESA, SADC and EAC (Unit: 1,000 ton) ........... 3-34
Table 3.19 Export and Import of Bovine Meat by Zambia by Country (Unit: ton) ................................ 3-36
Table 3.20 Export and Import of Live Bovine Animal by Zambia by Country (Unit: ton) .................... 3-36
Table 3.21 Export and Import of Live Goats and Sheep and Sheep Meat by Zambia
by Country (Unit: ton) .......................................................................................................... 3-37
Table 3.22 Export and Import of Meat and Edible Offal of Poultry by Zambia
by Country (Unit: ton) .......................................................................................................... 3-38
Table 3.23 Export and Import of Live Poultry by Zambia by Country (Unit: ton) ................................ 3-38
Table 3.24 Import of Bovine Meat by Country in COMESA, SADC and EAC (Unit: 1,000 ton) ......... 3-40
Table 3.25 Export of Bovine Meat by Country in COMESA, SADC and EAC (Unit: 1,000 ton) ......... 3-40
Data Collection Survey on Nacala Corridor Integrated Development in Southern Africa Final Report
vii
Table 3.26 Import of Meat of Sheep and Goat by Country in COMESA, SADC and EAC
(Unit: 1,000 ton) ................................................................................................................... 3-41
Table 3.27 Export of Meat of Sheep and Goat by Country in COMESA, SADC and EAC
(Unit: 1,000 ton) ................................................................................................................... 3-41
Table 3.28 Import of Poultry Meat by Country in COMESA, SADC and EAC (Unit: 1,000 ton) ........ 3-42
Table 3.29 Export of Poultry Meat by Country in COMESA, SADC and EAC (Unit: 1,000 ton) ........ 3-42
Table 3.30 Export and Import of Fish by Zambia by Country (Unit: ton) .............................................. 3-43
Table 3.31 Import of Fish by Country in COMESA, SADC and EAC (Unit: 1,000 ton) ...................... 3-45
Table 3.32 Export of Fish by Country in COMESA, SADC and EAC (Unit: 1,000 ton) ...................... 3-45
Table 3.33 Export and Import of Soya Bean Oil by Zambia by Country (Unit: 1,000 ton) ................... 3-46
Table 3.34 Export and Import of Sunflower Oil by Zambia by Country (Unit: 1,000 ton) .................... 3-46
Table 3.35 Import of Soya Bean Oil by Country in COMESA, SADC and EAC (Unit: 1,000 ton) ...... 3-47
Table 3.36 Export of Soya Bean Oil by Country in COMESA, SADC and EAC (Unit: 1,000 ton) ...... 3-48
Table 3.37 Import of Sunflower Oil by Country in COMESA, SADC and EAC (Unit: 1,000 ton) ....... 3-48
Table 3.38 Export and Import of Raw Sugar by Zambia by Country (Unit: 1,000 ton) ......................... 3-50
Table 3.39 Export and Import of Refined Sugars by Zambia by Country (Unit: 1,000 ton) .................. 3-51
Table 3.40 Import of Refined Sugar by Country in COMESA, SADC and EAC (Unit: 1,000 ton) ...... 3-53
Table 3.41 Export of Refined Sugar by Country in COMESA, SADC and EAC (Unit: 1,000 ton) ...... 3-53
Table 3.42 Import of Soap and Detergent by Country in COMESA, SADC and EAC
(Unit: 1,000 ton) ................................................................................................................... 3-55
Table 3.43 GDP and Employment by Industry ....................................................................................... 3-56
Table 3.44 Contribution of the Mining and Quarrying Sector to the National Economy
(Million ZMW at 2010 Constant Price) ................................................................................ 3-58
Table 3.45 Mineral Production in Zambia from 2009 to 2013 (Metric ton unless otherwise
specified) .............................................................................................................................. 3-59
Table 3.46 Export of Major Mineral Products from 2012 to 2016 (million USD) ................................. 3-60
Table 3.47 Export Value and Destinations of Copper from 2011 to 2015 (million USD) ..................... 3-61
Table 3.48 Export Value and Destinations of Precious Stones and Semi-Precious Stones in 2015 ....... 3-62
Table 3.49 Export Value and Destinations of Cement in 2015............................................................... 3-62
Table 3.50 Export Value and Destinations of Lime in 2015 .................................................................. 3-62
Table 3.51 Export Value and Destinations of Cobalt in 2015 ................................................................ 3-62
Table 3.52 Export Value and Destination of Sulphur in 2015 ................................................................ 3-62
Table 3.53 Export Value and Destination of Manganese in 2016 .......................................................... 3-62
Table 3.54 Top Ten Export and Import Commodities in 2015 ............................................................... 3-68
Table 3.55 Top Five Destinations of Export and Import at Mwami Border Post from 2013
to 2016 .................................................................................................................................. 3-70
Table 3.56 Top Five Exported and Imported Commodities at Mwami Border Post from 2013
to 2016 .................................................................................................................................. 3-71
Table 3.57 Tourist Arrivals and Annual Tourism Earnings .................................................................... 3-73
Table 3.58 Tourist Arrivals by Port of Entry in 2015 ............................................................................. 3-77
Table 3.59 Tourist Arrivals in Eastern Province from 2011 to 2015 ...................................................... 3-77
Table 3.60 Tourism Statistics by Province in 2015 ................................................................................ 3-78
Table 3.61 Guiding Principles and Measures for Tourism Sector Development .................................... 3-79
Table 3.62 Electricity Access ................................................................................................................. 3-80
Data Collection Survey on Nacala Corridor Integrated Development in Southern Africa Final Report
viii
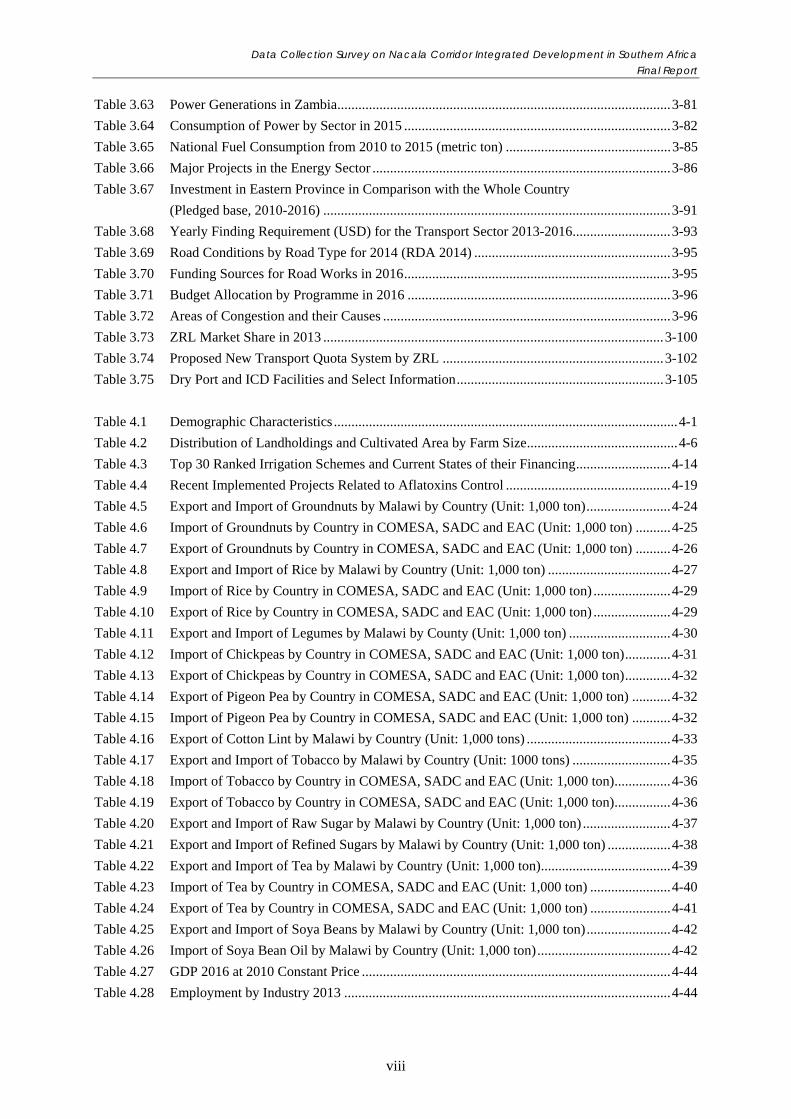
Table 3.63 Power Generations in Zambia ............................................................................................... 3-81
Table 3.64 Consumption of Power by Sector in 2015 ............................................................................ 3-82
Table 3.65 National Fuel Consumption from 2010 to 2015 (metric ton) ............................................... 3-85
Table 3.66 Major Projects in the Energy Sector ..................................................................................... 3-86
Table 3.67 Investment in Eastern Province in Comparison with the Whole Country
(Pledged base, 2010-2016) ................................................................................................... 3-91
Table 3.68 Yearly Finding Requirement (USD) for the Transport Sector 2013-2016 ............................ 3-93
Table 3.69 Road Conditions by Road Type for 2014 (RDA 2014) ........................................................ 3-95
Table 3.70 Funding Sources for Road Works in 2016 ............................................................................ 3-95
Table 3.71 Budget Allocation by Programme in 2016 ........................................................................... 3-96
Table 3.72 Areas of Congestion and their Causes .................................................................................. 3-96
Table 3.73 ZRL Market Share in 2013 ................................................................................................. 3-100
Table 3.74 Proposed New Transport Quota System by ZRL ............................................................... 3-102
Table 3.75 Dry Port and ICD Facilities and Select Information ........................................................... 3-105
Table 4.1 Demographic Characteristics .................................................................................................. 4-1
Table 4.2 Distribution of Landholdings and Cultivated Area by Farm Size ........................................... 4-6
Table 4.3 Top 30 Ranked Irrigation Schemes and Current States of their Financing ........................... 4-14
Table 4.4 Recent Implemented Projects Related to Aflatoxins Control ............................................... 4-19
Table 4.5 Export and Import of Groundnuts by Malawi by Country (Unit: 1,000 ton) ........................ 4-24
Table 4.6 Import of Groundnuts by Country in COMESA, SADC and EAC (Unit: 1,000 ton) .......... 4-25
Table 4.7 Export of Groundnuts by Country in COMESA, SADC and EAC (Unit: 1,000 ton) .......... 4-26
Table 4.8 Export and Import of Rice by Malawi by Country (Unit: 1,000 ton) ................................... 4-27
Table 4.9 Import of Rice by Country in COMESA, SADC and EAC (Unit: 1,000 ton) ...................... 4-29
Table 4.10 Export of Rice by Country in COMESA, SADC and EAC (Unit: 1,000 ton) ...................... 4-29
Table 4.11 Export and Import of Legumes by Malawi by County (Unit: 1,000 ton) ............................. 4-30
Table 4.12 Import of Chickpeas by Country in COMESA, SADC and EAC (Unit: 1,000 ton) ............. 4-31
Table 4.13 Export of Chickpeas by Country in COMESA, SADC and EAC (Unit: 1,000 ton) ............. 4-32
Table 4.14 Export of Pigeon Pea by Country in COMESA, SADC and EAC (Unit: 1,000 ton) ........... 4-32
Table 4.15 Import of Pigeon Pea by Country in COMESA, SADC and EAC (Unit: 1,000 ton) ........... 4-32
Table 4.16 Export of Cotton Lint by Malawi by Country (Unit: 1,000 tons) ......................................... 4-33
Table 4.17 Export and Import of Tobacco by Malawi by Country (Unit: 1000 tons) ............................ 4-35
Table 4.18 Import of Tobacco by Country in COMESA, SADC and EAC (Unit: 1,000 ton) ................ 4-36
Table 4.19 Export of Tobacco by Country in COMESA, SADC and EAC (Unit: 1,000 ton) ................ 4-36
Table 4.20 Export and Import of Raw Sugar by Malawi by Country (Unit: 1,000 ton) ......................... 4-37
Table 4.21 Export and Import of Refined Sugars by Malawi by Country (Unit: 1,000 ton) .................. 4-38
Table 4.22 Export and Import of Tea by Malawi by Country (Unit: 1,000 ton) ..................................... 4-39
Table 4.23 Import of Tea by Country in COMESA, SADC and EAC (Unit: 1,000 ton) ....................... 4-40
Table 4.24 Export of Tea by Country in COMESA, SADC and EAC (Unit: 1,000 ton) ....................... 4-41
Table 4.25 Export and Import of Soya Beans by Malawi by Country (Unit: 1,000 ton) ........................ 4-42
Table 4.26 Import of Soya Bean Oil by Malawi by Country (Unit: 1,000 ton) ...................................... 4-42
Table 4.27 GDP 2016 at 2010 Constant Price ........................................................................................ 4-44
Table 4.28 Employment by Industry 2013 ............................................................................................. 4-44
Data Collection Survey on Nacala Corridor Integrated Development in Southern Africa Final Report
ix
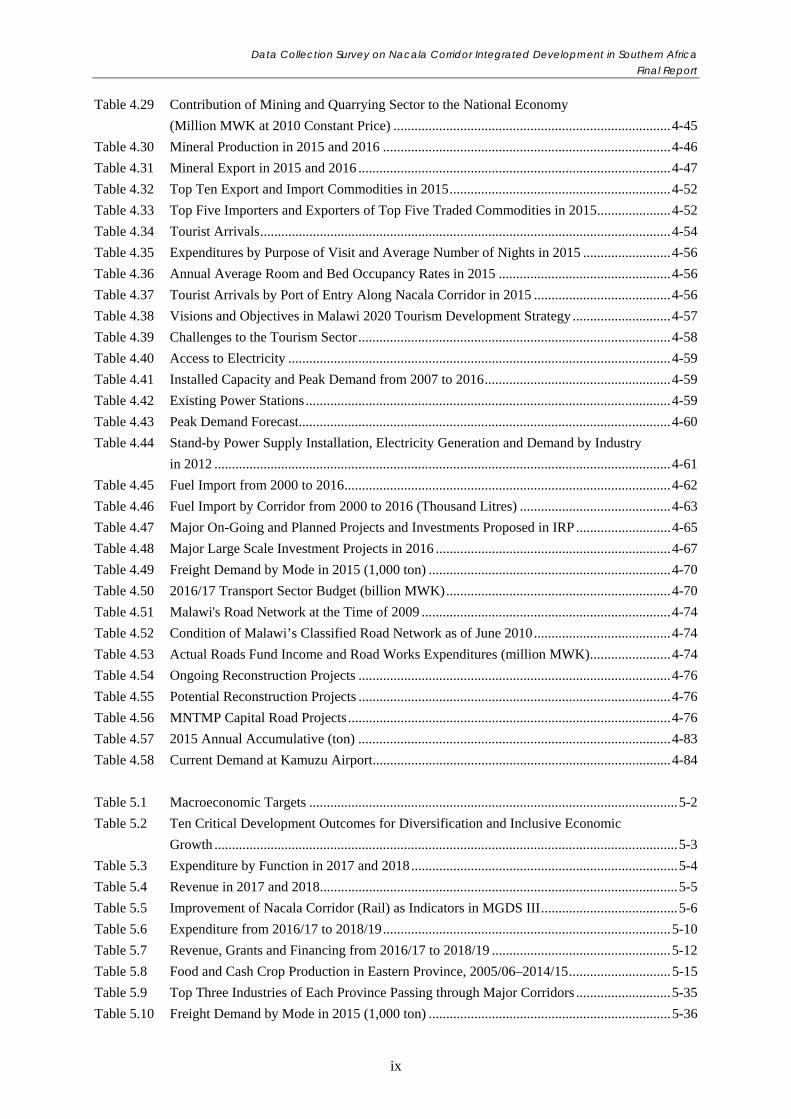
Table 4.29 Contribution of Mining and Quarrying Sector to the National Economy
(Million MWK at 2010 Constant Price) ............................................................................... 4-45
Table 4.30 Mineral Production in 2015 and 2016 .................................................................................. 4-46
Table 4.31 Mineral Export in 2015 and 2016 ......................................................................................... 4-47
Table 4.32 Top Ten Export and Import Commodities in 2015 ............................................................... 4-52
Table 4.33 Top Five Importers and Exporters of Top Five Traded Commodities in 2015 ..................... 4-52
Table 4.34 Tourist Arrivals ..................................................................................................................... 4-54
Table 4.35 Expenditures by Purpose of Visit and Average Number of Nights in 2015 ......................... 4-56
Table 4.36 Annual Average Room and Bed Occupancy Rates in 2015 ................................................. 4-56
Table 4.37 Tourist Arrivals by Port of Entry Along Nacala Corridor in 2015 ....................................... 4-56
Table 4.38 Visions and Objectives in Malawi 2020 Tourism Development Strategy ............................ 4-57
Table 4.39 Challenges to the Tourism Sector ......................................................................................... 4-58
Table 4.40 Access to Electricity ............................................................................................................. 4-59
Table 4.41 Installed Capacity and Peak Demand from 2007 to 2016 ..................................................... 4-59
Table 4.42 Existing Power Stations ........................................................................................................ 4-59
Table 4.43 Peak Demand Forecast.......................................................................................................... 4-60
Table 4.44 Stand-by Power Supply Installation, Electricity Generation and Demand by Industry
in 2012 .................................................................................................................................. 4-61
Table 4.45 Fuel Import from 2000 to 2016 ............................................................................................. 4-62
Table 4.46 Fuel Import by Corridor from 2000 to 2016 (Thousand Litres) ........................................... 4-63
Table 4.47 Major On-Going and Planned Projects and Investments Proposed in IRP ........................... 4-65
Table 4.48 Major Large Scale Investment Projects in 2016 ................................................................... 4-67
Table 4.49 Freight Demand by Mode in 2015 (1,000 ton) ..................................................................... 4-70
Table 4.50 2016/17 Transport Sector Budget (billion MWK) ................................................................ 4-70
Table 4.51 Malawi's Road Network at the Time of 2009 ....................................................................... 4-74
Table 4.52 Condition of Malawi’s Classified Road Network as of June 2010 ....................................... 4-74
Table 4.53 Actual Roads Fund Income and Road Works Expenditures (million MWK) ....................... 4-74
Table 4.54 Ongoing Reconstruction Projects ......................................................................................... 4-76
Table 4.55 Potential Reconstruction Projects ......................................................................................... 4-76
Table 4.56 MNTMP Capital Road Projects ............................................................................................ 4-76
Table 4.57 2015 Annual Accumulative (ton) ......................................................................................... 4-83
Table 4.58 Current Demand at Kamuzu Airport..................................................................................... 4-84
Table 5.1 Macroeconomic Targets ......................................................................................................... 5-2
Table 5.2 Ten Critical Development Outcomes for Diversification and Inclusive Economic
Growth .................................................................................................................................... 5-3
Table 5.3 Expenditure by Function in 2017 and 2018 ............................................................................ 5-4
Table 5.4 Revenue in 2017 and 2018 ...................................................................................................... 5-5
Table 5.5 Improvement of Nacala Corridor (Rail) as Indicators in MGDS III ....................................... 5-6
Table 5.6 Expenditure from 2016/17 to 2018/19 .................................................................................. 5-10
Table 5.7 Revenue, Grants and Financing from 2016/17 to 2018/19 ................................................... 5-12
Table 5.8 Food and Cash Crop Production in Eastern Province, 2005/06–2014/15 ............................. 5-15
Table 5.9 Top Three Industries of Each Province Passing through Major Corridors ........................... 5-35
Table 5.10 Freight Demand by Mode in 2015 (1,000 ton) ..................................................................... 5-36
Data Collection Survey on Nacala Corridor Integrated Development in Southern Africa Final Report
x
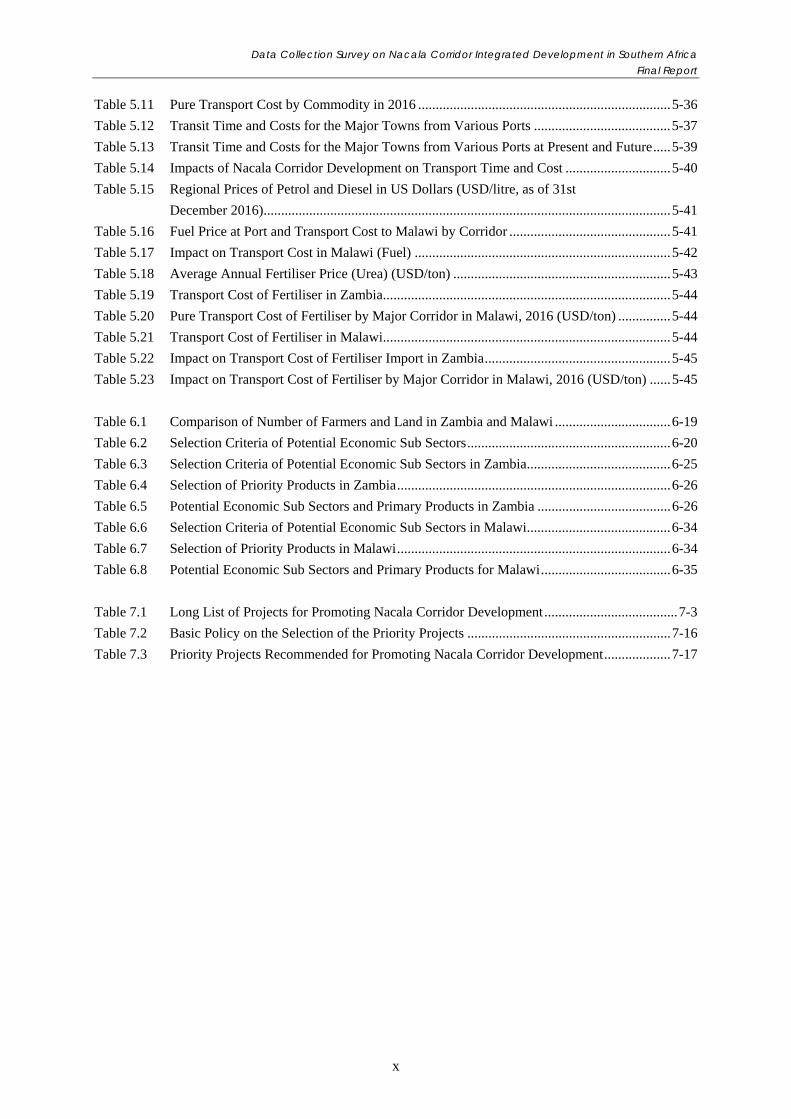
Table 5.11 Pure Transport Cost by Commodity in 2016 ........................................................................ 5-36
Table 5.12 Transit Time and Costs for the Major Towns from Various Ports ....................................... 5-37
Table 5.13 Transit Time and Costs for the Major Towns from Various Ports at Present and Future ..... 5-39
Table 5.14 Impacts of Nacala Corridor Development on Transport Time and Cost .............................. 5-40
Table 5.15 Regional Prices of Petrol and Diesel in US Dollars (USD/litre, as of 31st
December 2016) .................................................................................................................... 5-41
Table 5.16 Fuel Price at Port and Transport Cost to Malawi by Corridor .............................................. 5-41
Table 5.17 Impact on Transport Cost in Malawi (Fuel) ......................................................................... 5-42
Table 5.18 Average Annual Fertiliser Price (Urea) (USD/ton) .............................................................. 5-43
Table 5.19 Transport Cost of Fertiliser in Zambia .................................................................................. 5-44
Table 5.20 Pure Transport Cost of Fertiliser by Major Corridor in Malawi, 2016 (USD/ton) ............... 5-44
Table 5.21 Transport Cost of Fertiliser in Malawi .................................................................................. 5-44
Table 5.22 Impact on Transport Cost of Fertiliser Import in Zambia ..................................................... 5-45
Table 5.23 Impact on Transport Cost of Fertiliser by Major Corridor in Malawi, 2016 (USD/ton) ...... 5-45
Table 6.1 Comparison of Number of Farmers and Land in Zambia and Malawi ................................. 6-19
Table 6.2 Selection Criteria of Potential Economic Sub Sectors .......................................................... 6-20
Table 6.3 Selection Criteria of Potential Economic Sub Sectors in Zambia ......................................... 6-25
Table 6.4 Selection of Priority Products in Zambia .............................................................................. 6-26
Table 6.5 Potential Economic Sub Sectors and Primary Products in Zambia ...................................... 6-26
Table 6.6 Selection Criteria of Potential Economic Sub Sectors in Malawi ......................................... 6-34
Table 6.7 Selection of Priority Products in Malawi .............................................................................. 6-34
Table 6.8 Potential Economic Sub Sectors and Primary Products for Malawi ..................................... 6-35
Table 7.1 Long List of Projects for Promoting Nacala Corridor Development ...................................... 7-3
Table 7.2 Basic Policy on the Selection of the Priority Projects .......................................................... 7-16
Table 7.3 Priority Projects Recommended for Promoting Nacala Corridor Development ................... 7-17
Data Collection Survey on Nacala Corridor Integrated Development in Southern Africa Final Report
xi
LIST OF FIGURES Page
Figure 1.1 Study Area: Nacala Corridor Region ...................................................................................... 1-2
Figure 1.2 Workflow ................................................................................................................................ 1-4
Figure 2.1 Corridors Supplying Zambia and Malawi ............................................................................... 2-4
Figure 2.2 National Transport Corridor Coordination Secretariat ........................................................... 2-8
Figure 2.3 Current Conditions of Development of Nacala Corridor ........................................................ 2-8
Figure 2.4 Traffic Volume on Main Roads in Zambia and Malawi (2015) ........................................... 2-17
Figure 2.5 Major Border Posts Related to Zambia and Malawi ............................................................. 2-17
Figure 2.6 Proportions of Observed Truck Movements in Malawi (2016) ............................................ 2-19
Figure 2.7 Imports and Exports by Seaport (ton) ................................................................................... 2-21
Figure 3.1 Nacala Corridor Region in Zambia ......................................................................................... 3-1
Figure 3.2 Agro-ecological Region and Vegetation Type ....................................................................... 3-3
Figure 3.3 Water Catchment in Zambia ................................................................................................... 3-4
Figure 3.4 Main Crop Zones of Zambia ................................................................................................... 3-6
Figure 3.5 Production of Maize (right) and Other Cereals (left) .............................................................. 3-6
Figure 3.6 Production of Oil Crops .......................................................................................................... 3-7
Figure 3.7 Production of Tobacco, Cotton and Coffee ............................................................................ 3-7
Figure 3.8 Number of Livestock – Cattle, Goats, Pigs, Sheep (right) and Chicken (left) ........................ 3-8
Figure 3.9 Concentration of Food Manufacturing Firms in Zambia, and the Spatial Analysis
of New Entrants .................................................................................................................... 3-10
Figure 3.10 COMACO Value Chain Model ............................................................................................ 3-19
Figure 3.11 Net Agricultural Export Value in Zambia ............................................................................ 3-20
Figure 3.12 Production of Maize by Zambia and its Export by Country ................................................. 3-24
Figure 3.13 Import of Maize by Country in the Integrated Region .......................................................... 3-25
Figure 3.14 Production and Trade of Soya Bean by Zambia ................................................................... 3-27
Figure 3.15 Import of Soya Bean by Country in the Integrated Region .................................................. 3-28
Figure 3.16 Production and Trade of Wheat by Zambia .......................................................................... 3-30
Figure 3.17 Import of Wheat by Country in the Integrated Region ......................................................... 3-31
Figure 3.18 Production and Trade of Cotton Lint by Zambia .................................................................. 3-32
Figure 3.19 Import of Cotton Lint by County in the Integrated Region .................................................. 3-34
Figure 3.20 Number of Livestock by Zambia .......................................................................................... 3-35
Figure 3.21 Number of Small Livestock by Zambia ................................................................................ 3-35
Figure 3.22 Import of Bovine Meat by Country in the Integrated Region ............................................... 3-39
Figure 3.23 Import of Meat of Sheep and Goat by Country in the Integrated Region ............................. 3-41
Figure 3.24 Fish Production 2011-2014 by Zambia ................................................................................. 3-43
Figure 3.25 Import of Fish by Country in the Integrated Region ............................................................. 3-44
Figure 3.26 Production and Trade of Edible Oil by Zambia .................................................................... 3-46
Figure 3.27 Import of Soya Bean Oil by Country in the Integrated Region ............................................ 3-47
Figure 3.28 Import of Sunflower Oil by Country in the Integrated Region ............................................. 3-48
Figure 3.29 Production of Sugar Cane and Trade of Sugar by Zambia ................................................... 3-49
Data Collection Survey on Nacala Corridor Integrated Development in Southern Africa Final Report
xii
Figure 3.30 Production and Trade of Refined Sugar ................................................................................ 3-50
Figure 3.31 Trade of Sugar Confectionery by Zambia ............................................................................ 3-51
Figure 3.32 Import of Refined Sugar by Country in the Integrated Region ............................................. 3-52
Figure 3.33 Import of Sugar Confectionery by Country in the Integrated Region .................................. 3-54
Figure 3.34 Trade of Soap and Detergent by Zambia .............................................................................. 3-54
Figure 3.35 Import of Soap and Detergent by Country in the Integrated Region .................................... 3-55
Figure 3.36 Copper Production and Copper Price ................................................................................... 3-59
Figure 3.37 Export and Import Values from 2006 to 2015 ...................................................................... 3-64
Figure 3.38 Top 10 Export Partners in 2015 ............................................................................................ 3-65
Figure 3.39 Top 10 Import Partners in 2015 ............................................................................................ 3-65
Figure 3.40 Traditional and Non-Traditional Export from 2007 to 2017 ................................................ 3-66
Figure 3.41 Export by Product Category from 2006 to 2015 ................................................................... 3-67
Figure 3.42 Import by Product Category from 2006 to 2015 ................................................................... 3-67
Figure 3.43 Export and Import Values at Mwami Border Post ................................................................ 3-69
Figure 3.44 Tourist Arrivals by Continent ............................................................................................... 3-73
Figure 3.45 Tourist Arrivals by Purpose of Visit ..................................................................................... 3-74
Figure 3.46 Tourist Arrivals by Top Ten Overseas Markets in 2015 ...................................................... 3-74
Figure 3.47 Tourist Arrivals by Top Ten Africa Markets in 2015 ........................................................... 3-75
Figure 3.48 Tourists Visited Major National Parks ................................................................................. 3-75
Figure 3.49 Installed Capacity by Type of Generation ............................................................................ 3-81
Figure 3.50 Power Generation by Power Plant ........................................................................................ 3-82
Figure 3.51 Power Import and Export ...................................................................................................... 3-83
Figure 3.52 Government Import of Petroleum Feedstock and Finished Products from 2011 to 2016 ..... 3-84
Figure 3.53 Refinery Production of Petroleum Products in 2016 ............................................................ 3-84
Figure 3.54 Investment in Zambia (Pledged base, 2010-2016) ................................................................ 3-88
Figure 3.55 Investment in Zambia (Pledged base, 2010-2016) by Sector ............................................... 3-88
Figure 3.56 Investment in Zambia (Pledged base, 2016) by Area ........................................................... 3-89
Figure 3.57 FDI Liabilities Stocks by Source Country, 2014-2015 ......................................................... 3-89
Figure 3.58 FDI Liabilities Stocks by Industry, 2014-2015 ..................................................................... 3-90
Figure 3.59 Investment in Eastern Province (Pledged base, 2010-2016) ................................................. 3-91
Figure 3.60 Core Road Network in Zambia ............................................................................................. 3-94
Figure 3.61 Feeder Road Density ............................................................................................................. 3-97
Figure 3.62 Road Network and Per Capita Agricultural Production for 2015 ......................................... 3-97
Figure 3.63 Railway Network in Zambia ................................................................................................. 3-99
Figure 4.1 The Nacala Corridor Region in Malawi .................................................................................. 4-1
Figure 4.2 Agricultural Development Domains for Malawi .................................................................... 4-4
Figure 4.3 Distribution of Water .............................................................................................................. 4-5
Figure 4.4 Production of Maize (left) and Other Cereals (right) .............................................................. 4-7
Figure 4.5 Production (left), Import and Export (right) of Legumes ....................................................... 4-8
Figure 4.6 Production of Cash Crops ....................................................................................................... 4-9
Figure 4.7 Volume of Export Crops ......................................................................................................... 4-9
Figure 4.8 Number of Livestock - Cattle, Goats, Pigs and Sheep (left), Chickens (right) ....................... 4-9
Figure 4.9 Potential Irrigation Area ....................................................................................................... 4-13
Data Collection Survey on Nacala Corridor Integrated Development in Southern Africa Final Report
xiii
Figure 4.10 Production and Trade of Groundnuts by Malawi.................................................................. 4-23
Figure 4.11 Import of Groundnuts by Country in the Integrated Region ................................................. 4-25
Figure 4.12 Export of Groundnuts by Country in the Integrated Region ................................................. 4-26
Figure 4.13 Production, Area Harvested, Yield and Export of Rice by Malawi ...................................... 4-27
Figure 4.14 Import of Rice by Country in the Integrated Region ............................................................ 4-28
Figure 4.15 Production and Export of Legumes by Malawi .................................................................... 4-30
Figure 4.16 Import of Chickpeas by Country in the Integrated Region ................................................... 4-31
Figure 4.17 Export of Pigeon Pea by Country in the Integrated Region .................................................. 4-32
Figure 4.18 Production and Export of Cotton Lint by Malawi ................................................................ 4-33
Figure 4.19 Production and Trade of Tobacco by Malawi ....................................................................... 4-34
Figure 4.20 Import of Tobacco by Country in the Integrated Region ...................................................... 4-36
Figure 4.21 Production and Trade of Raw Sugar by Malawi ................................................................... 4-37
Figure 4.22 Production, and Trade of Refined Sugar by Malawi ............................................................ 4-38
Figure 4.23 Production and Export of Tea by Malawi ............................................................................. 4-39
Figure 4.24 Import of Tea by Country in the Integrated Region .............................................................. 4-40
Figure 4.25 Production and Export of Oil Seeds in Malawi .................................................................... 4-41
Figure 4.26 Production and Trade of Edible Oil by Malawi .................................................................... 4-42
Figure 4.27 Export and Import Values from 2006 to 2015 ...................................................................... 4-49
Figure 4.28 Top 10 Export Partners in 2015 ............................................................................................ 4-50
Figure 4.29 Top 10 Import Partners in 2015 ............................................................................................ 4-50
Figure 4.30 Export by Product Category from 2006 to 2015 ................................................................... 4-51
Figure 4.31 Import by Product Category from 2006 to 2015 ................................................................... 4-51
Figure 4.32 Tourist Arrivals in 2005 by Continent .................................................................................. 4-54
Figure 4.33 Tourist Arrivals by Purpose of Visit ..................................................................................... 4-54
Figure 4.34 Tourist Arrivals by Top Ten African Markets ...................................................................... 4-55
Figure 4.35 Tourist Arrivals by Top Ten International Markets in 2015 ................................................. 4-55
Figure 4.36 Tourist Arrivals by Port of Entry in 2015 ............................................................................. 4-56
Figure 4.37 Power Generation and Consumption from 2007 to 2016 ..................................................... 4-60
Figure 4.38 Consumption by Customer Category of ESCOM in 2016 .................................................... 4-60
Figure 4.39 Fuel Import from 1999 to 2016 ............................................................................................. 4-62
Figure 4.40 Fuel Import by Corridor in 2016 ........................................................................................... 4-63
Figure 4.41 FDI Inflow to Malawi (2011-2014) ...................................................................................... 4-66
Figure 4.42 FDI Inflow to Malawi by Sector (2014) ............................................................................... 4-66
Figure 4.43 Authorized Investment in Malawi (2016) by Sector ............................................................. 4-67
Figure 4.44 Organization Structure of MOTPW ...................................................................................... 4-70
Figure 4.45 Institutions Relating to Road Traffic .................................................................................... 4-71
Figure 4.46 Road Network in Malawi ...................................................................................................... 4-73
Figure 4.47 Historic Development of the Railway Network in Malawi .................................................. 4-79
Figure 4.48 Freight Volume at Nayuchi from 2012 to 2016 .................................................................... 4-82
Figure 5.1 Expenditure for Selected Functions in 2018 (Economic Affairs, Environmental
Protection and Housing and Community Amenities) ............................................................. 5-5
Figure 5.2 Proposed Integrated National Transport Network .................................................................. 5-9
Figure 5.3 Expenditure of Major Programmes ....................................................................................... 5-11
Data Collection Survey on Nacala Corridor Integrated Development in Southern Africa Final Report
xiv
Figure 5.4 Location of Chipata- Petauke-Serenje Rail Line .................................................................. 5-16
Figure 5.5 Location of Possible Driving Force Projects and Plans ........................................................ 5-23
Figure 5.6 Industry Share to the Total GDP at Current Prices, 2015: Nacala Corridor ......................... 5-32
Figure 5.7 Industry Share to the Total GDP at Current Prices, 2015: North-South Corridor ................ 5-32
Figure 5.8 Industry Share to the Total GDP at Current Prices, 2015: Dar es Salaam Corridor ............. 5-33
Figure 5.9 Industry Share to the Total GDP at Current Prices, 2015: Lobito Corridor.......................... 5-34
Figure 6.1 Current Conditions of Development of Nacala Corridor ........................................................ 6-3
Figure 6.2 Transport Cost: Comparison of Transport Corridors Related to Zambia and Malawi ............ 6-8
Figure 6.3 Transport Time: Comparison of Transport Corridors Related to Zambia and Malawi ........... 6-9
Figure 6.4 Concept of Corridor Development ....................................................................................... 6-11
Figure 6.5 COMESA-EAC-SADC Tripartite FTA: Expanding Regional Market
-Urban Population 2030 of Major Cities in the Region ..................................................... 6-13
Figure 6.6 Access to Regional Market via Nacala Port ......................................................................... 6-14
Figure 6.7 Wide Railway Network in Zambia and Malawi: Scenario A ............................................... 6-15
Figure 6.8 Wide Railway Network in Zambia and Malawi: Scenario B ................................................ 6-15
Figure 6.9 Wide Railway Network in Zambia and Malawi: Scenario C (Selected) .............................. 6-16
Figure 6.10 Railway Network (Scenario C: Selected) with Areas of Potential Economic Sectors .......... 6-39
Figure 7.1 Development Stages and Implementation Periods .................................................................. 7-2
Figure 7.2 Location of Luangwa Bridge ................................................................................................ 7-19
Figure 7.3 Chipata Bypass ..................................................................................................................... 7-21
Figure 7.4 Lilongwe North-West Bypass ............................................................................................... 7-23
Figure 7.5 Location of Blantyre City Road Improvement Project ......................................................... 7-24
Figure 7.6 Blantyre Inner Relief Road ................................................................................................... 7-24
Data Collection Survey on Nacala Corridor Integrated Development in Southern Africa Final Report
xv
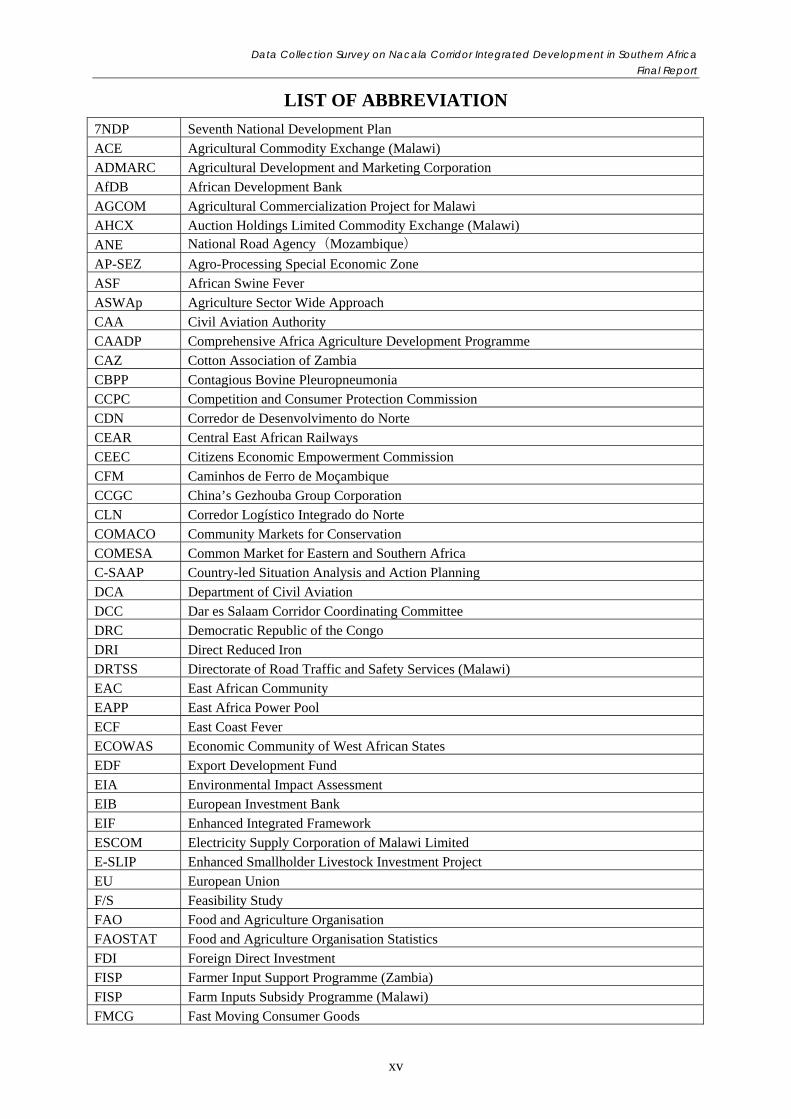
LIST OF ABBREVIATION
7NDP Seventh National Development Plan ACE Agricultural Commodity Exchange (Malawi) ADMARC Agricultural Development and Marketing Corporation AfDB African Development Bank AGCOM Agricultural Commercialization Project for Malawi AHCX Auction Holdings Limited Commodity Exchange (Malawi) ANE National Road Agency(Mozambique)
AP-SEZ Agro-Processing Special Economic Zone ASF African Swine Fever ASWAp Agriculture Sector Wide Approach CAA Civil Aviation Authority CAADP Comprehensive Africa Agriculture Development Programme CAZ Cotton Association of Zambia CBPP Contagious Bovine Pleuropneumonia CCPC Competition and Consumer Protection Commission CDN Corredor de Desenvolvimento do Norte CEAR Central East African Railways CEEC Citizens Economic Empowerment Commission CFM Caminhos de Ferro de Moçambique CCGC China’s Gezhouba Group Corporation CLN Corredor Logístico Integrado do Norte COMACO Community Markets for Conservation COMESA Common Market for Eastern and Southern Africa C-SAAP Country-led Situation Analysis and Action Planning DCA Department of Civil Aviation DCC Dar es Salaam Corridor Coordinating Committee DRC Democratic Republic of the Congo DRI Direct Reduced Iron DRTSS Directorate of Road Traffic and Safety Services (Malawi) EAC East African Community EAPP East Africa Power Pool ECF East Coast Fever ECOWAS Economic Community of West African States EDF Export Development Fund EIA Environmental Impact Assessment EIB European Investment Bank EIF Enhanced Integrated Framework ESCOM Electricity Supply Corporation of Malawi Limited E-SLIP Enhanced Smallholder Livestock Investment Project EU European Union F/S Feasibility Study FAO Food and Agriculture Organisation FAOSTAT Food and Agriculture Organisation Statistics FDI Foreign Direct Investment FISP Farmer Input Support Programme (Zambia) FISP Farm Inputs Subsidy Programme (Malawi) FMCG Fast Moving Consumer Goods
Data Collection Survey on Nacala Corridor Integrated Development in Southern Africa Final Report
xvi
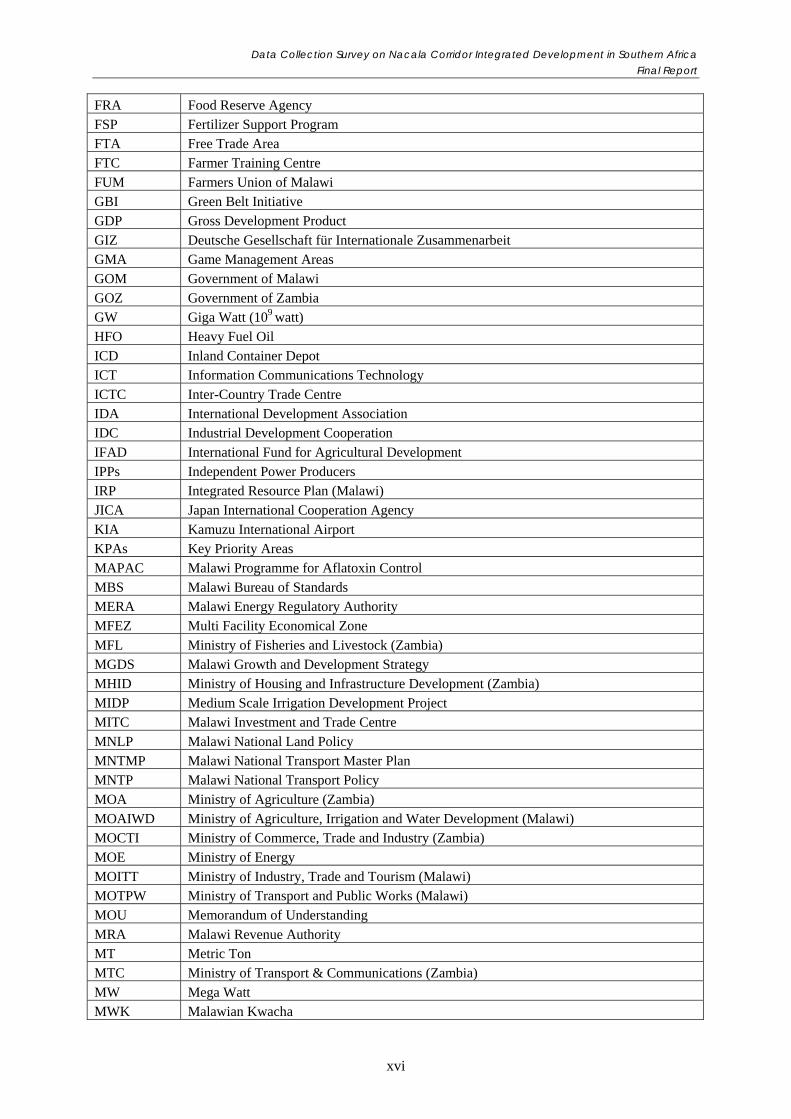
FRA Food Reserve Agency FSP Fertilizer Support Program FTA Free Trade Area FTC Farmer Training Centre FUM Farmers Union of Malawi GBI Green Belt Initiative GDP Gross Development Product GIZ Deutsche Gesellschaft für Internationale Zusammenarbeit GMA Game Management Areas GOM Government of Malawi GOZ Government of Zambia GW Giga Watt (109 watt) HFO Heavy Fuel Oil ICD Inland Container Depot ICT Information Communications Technology ICTC Inter-Country Trade Centre IDA International Development Association IDC Industrial Development Cooperation IFAD International Fund for Agricultural Development IPPs Independent Power Producers IRP Integrated Resource Plan (Malawi) JICA Japan International Cooperation Agency KIA Kamuzu International Airport KPAs Key Priority Areas MAPAC Malawi Programme for Aflatoxin Control MBS Malawi Bureau of Standards MERA Malawi Energy Regulatory Authority MFEZ Multi Facility Economical Zone MFL Ministry of Fisheries and Livestock (Zambia) MGDS Malawi Growth and Development Strategy MHID Ministry of Housing and Infrastructure Development (Zambia) MIDP Medium Scale Irrigation Development Project MITC Malawi Investment and Trade Centre MNLP Malawi National Land Policy MNTMP Malawi National Transport Master Plan MNTP Malawi National Transport Policy MOA Ministry of Agriculture (Zambia) MOAIWD Ministry of Agriculture, Irrigation and Water Development (Malawi) MOCTI Ministry of Commerce, Trade and Industry (Zambia) MOE Ministry of Energy MOITT Ministry of Industry, Trade and Tourism (Malawi) MOTPW Ministry of Transport and Public Works (Malawi) MOU Memorandum of Understanding MRA Malawi Revenue Authority MT Metric Ton MTC Ministry of Transport & Communications (Zambia) MW Mega Watt MWK Malawian Kwacha
Data Collection Survey on Nacala Corridor Integrated Development in Southern Africa Final Report
xvii
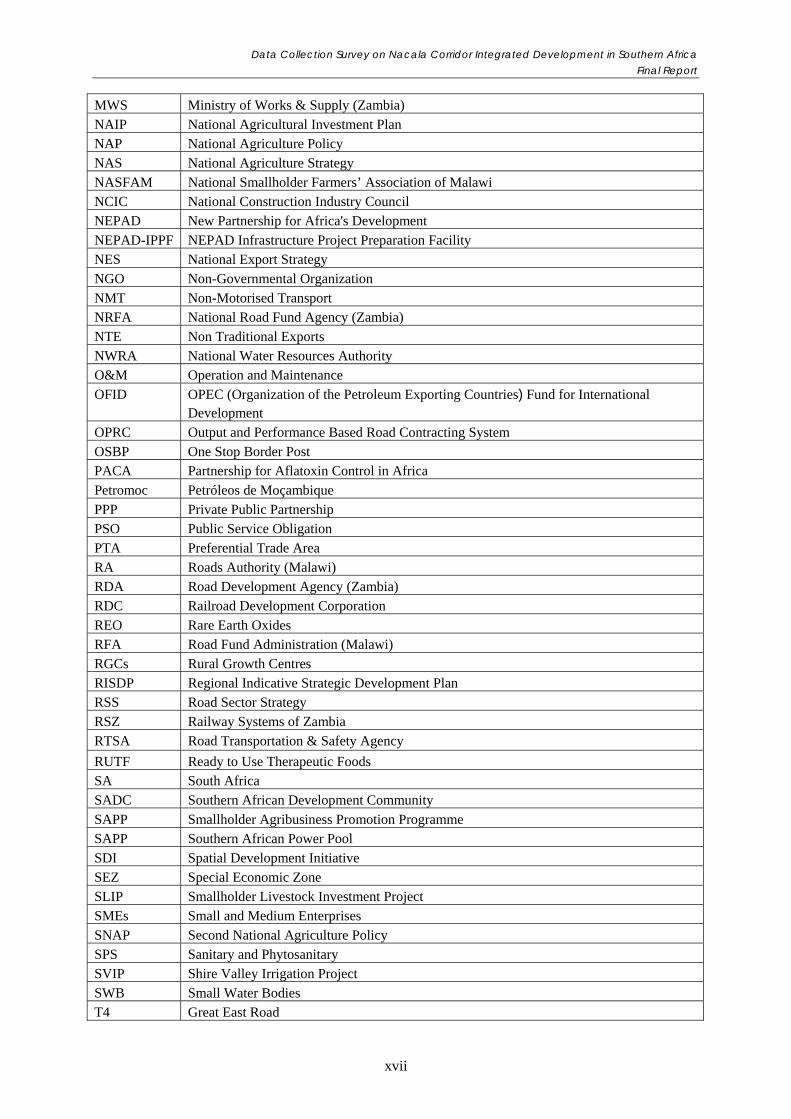
MWS Ministry of Works & Supply (Zambia) NAIP National Agricultural Investment Plan NAP National Agriculture Policy NAS National Agriculture Strategy NASFAM National Smallholder Farmers’ Association of Malawi NCIC National Construction Industry Council NEPAD New Partnership for Africa's Development NEPAD-IPPF NEPAD Infrastructure Project Preparation Facility NES National Export Strategy NGO Non-Governmental Organization NMT Non-Motorised Transport NRFA National Road Fund Agency (Zambia) NTE Non Traditional Exports NWRA National Water Resources Authority O&M Operation and Maintenance OFID OPEC (Organization of the Petroleum Exporting Countries) Fund for International
Development OPRC Output and Performance Based Road Contracting System OSBP One Stop Border Post PACA Partnership for Aflatoxin Control in Africa Petromoc Petróleos de Moçambique PPP Private Public Partnership PSO Public Service Obligation PTA Preferential Trade Area RA Roads Authority (Malawi) RDA Road Development Agency (Zambia) RDC Railroad Development Corporation REO Rare Earth Oxides RFA Road Fund Administration (Malawi) RGCs Rural Growth Centres RISDP Regional Indicative Strategic Development Plan RSS Road Sector Strategy RSZ Railway Systems of Zambia RTSA Road Transportation & Safety Agency
RUTF Ready to Use Therapeutic Foods SA South Africa SADC Southern African Development Community SAPP Smallholder Agribusiness Promotion Programme SAPP Southern African Power Pool SDI Spatial Development Initiative SEZ Special Economic Zone SLIP Smallholder Livestock Investment Project SMEs Small and Medium Enterprises SNAP Second National Agriculture Policy SPS Sanitary and Phytosanitary SVIP Shire Valley Irrigation Project SWB Small Water Bodies T4 Great East Road
Data Collection Survey on Nacala Corridor Integrated Development in Southern Africa Final Report
xviii
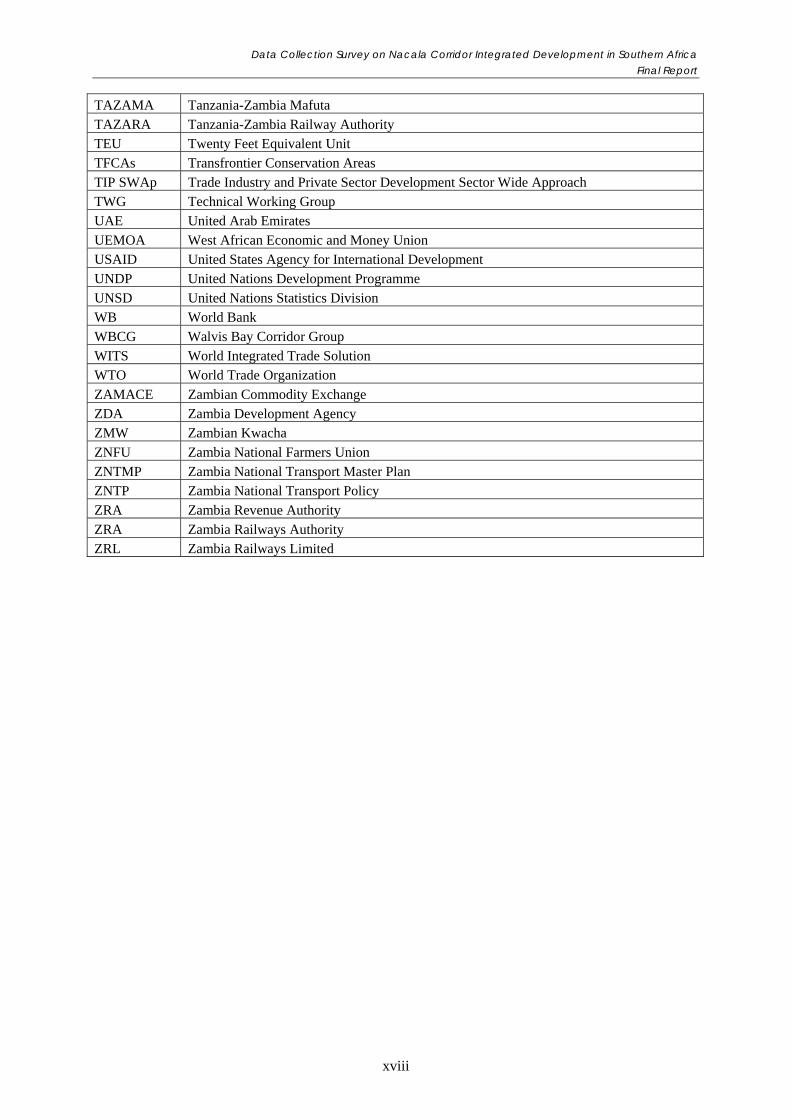
TAZAMA Tanzania-Zambia Mafuta TAZARA Tanzania-Zambia Railway Authority TEU Twenty Feet Equivalent Unit TFCAs Transfrontier Conservation Areas TIP SWAp Trade Industry and Private Sector Development Sector Wide Approach TWG Technical Working Group UAE United Arab Emirates UEMOA West African Economic and Money Union USAID United States Agency for International Development UNDP United Nations Development Programme UNSD United Nations Statistics Division WB World Bank WBCG Walvis Bay Corridor Group WITS World Integrated Trade Solution WTO World Trade Organization ZAMACE Zambian Commodity Exchange ZDA Zambia Development Agency ZMW Zambian Kwacha ZNFU Zambia National Farmers Union ZNTMP Zambia National Transport Master Plan ZNTP Zambia National Transport Policy ZRA Zambia Revenue Authority ZRA Zambia Railways Authority ZRL Zambia Railways Limited
Data Collection Survey on Nacala Corridor Integrated Development in Southern Africa Final Report
S-1
Executive Summary
Data Collection Survey on Nacala Corridor Integrated Development in Southern Africa
1. Objectives of the Study
The Nacala Corridor is an important economic corridor in Southern Africa, extending from
Nacala Port in the northern region of Mozambique, through Lilongwe, the capital city of Malawi,
to Lusaka, the capital city of Zambia. The study has three objectives. The first objective is to
identify issues, needs, and development potentials of the Nacala Corridor Region. Second, the
study is to propose priority projects including those suitable for assistance by considering
integrated development strategies for the Nacala Corridor Region. Third, it aims to clarify roles of
regional organisations, such as COMESA, SADC, and NEPAD, in Nacala Corridor Development
and identify possible cooperation between those organisations and JICA. This study focuses on
Zambia and Malawi, since a master plan was already prepared for the Nacala Corridor Region in
Mozambique.
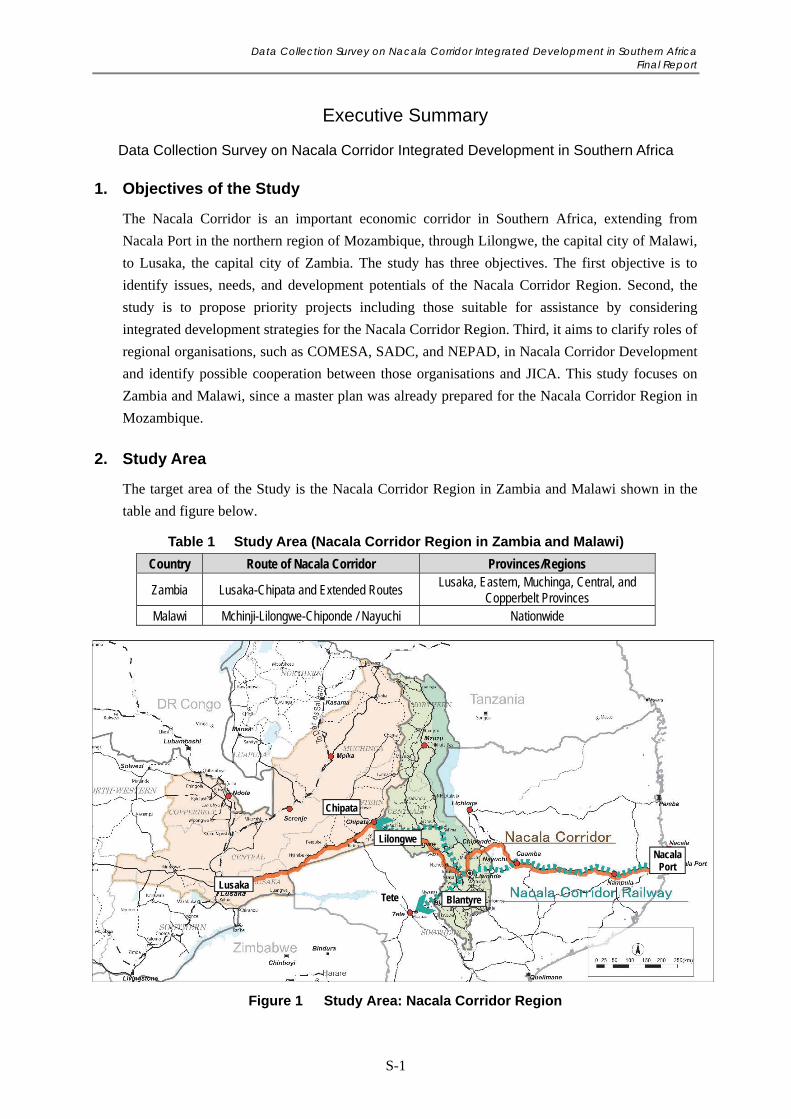
2. Study Area
The target area of the Study is the Nacala Corridor Region in Zambia and Malawi shown in the
table and figure below.
Table 1 Study Area (Nacala Corridor Region in Zambia and Malawi)
Country Route of Nacala Corridor Provinces/Regions
Zambia Lusaka-Chipata and Extended Routes Lusaka, Eastern, Muchinga, Central, and
Copperbelt Provinces Malawi Mchinji-Lilongwe-Chiponde / Nayuchi Nationwide
Figure 1 Study Area: Nacala Corridor Region
Tete Lusaka
Chipata
Lilongwe
Blantyre
Nacala Port
Data Collection Survey on Nacala Corridor Integrated Development in Southern Africa Final Report
S-2
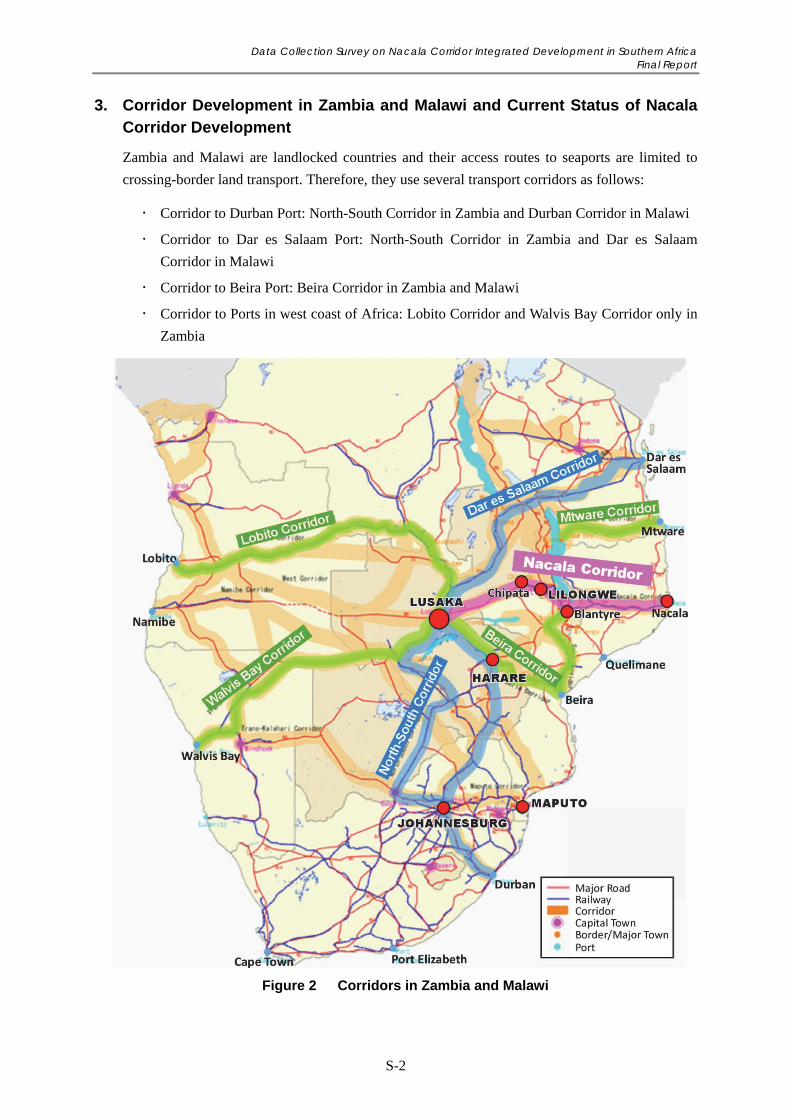
3. Corridor Development in Zambia and Malawi and Current Status of Nacala Corridor Development
Zambia and Malawi are landlocked countries and their access routes to seaports are limited to
crossing-border land transport. Therefore, they use several transport corridors as follows:
Corridor to Durban Port: North-South Corridor in Zambia and Durban Corridor in Malawi
Corridor to Dar es Salaam Port: North-South Corridor in Zambia and Dar es Salaam
Corridor in Malawi
Corridor to Beira Port: Beira Corridor in Zambia and Malawi
Corridor to Ports in west coast of Africa: Lobito Corridor and Walvis Bay Corridor only in
Zambia
Figure 2 Corridors in Zambia and Malawi
Data Collection Survey on Nacala Corridor Integrated Development in Southern Africa Final Report
S-3
At present, cargo transport does not use the Nacala Corridor very much in comparison with other
corridors. It is because the railway and Nacala Port of the Nacala Corridor have not yet been well
known by potential users, although the railway in the Nacala Corridor has been upgraded by a
private mining group for transporting coal from Moatize up to Nacala Port. The upgraded railway
is available up to Blantyre, the southern commercial centre of Malawi, through Nkaya and
Liwonde. However, due to the inefficiency of the transportation network as a result of the lack of
connectivity between road and railway transportation (Multi Modal Dry Ports for example), the
advantages of railway transportation have not yet been enjoyed in Lilongwe, the capital of
Malawi, or Chipata, in Zambia.
As for development of economic sectors, Zambia’s agricultural sector has a high export potential;
however, it needs to address challenges of low-productivity of small scale farmers and stagnant
production of Farm Blocks (large scale farms). Malawian economic sectors, especially
commercial agriculture and agro-processing sectors started responding to the upgraded Nacala
Corridor Railway for exporting their products. Now it is time for Malawi to encourage small scale
farmers to organise themselves and to export their products to regional markets, as well as outside
regional markets, by utilizing the railway and roads of the Nacala Corridor. For promoting
corridor development, it is essential to promote development of both corridor infrastructure and
economic sectors.
4. Advantages of Nacala Corridor
With planned interventions to maximise the transport functions of the Nacala Multi-Modal
Corridor, its advantages in terms of transport cost and time are identified in comparison with
other corridors. Those interventions include upgrading of railway and construction of dry ports.
Zambia: In Lusaka, Nacala Corridor (Rail and Road) has an advantage over other corridors in
terms of transport cost, while in terms of time, the Lusaka-Durban Corridor has an advantage over
the other corridors in terms of time. In Chipata, the Nacala Corridor (Rail and Road) has an
advantage over the other corridors in terms of transport cost and time.
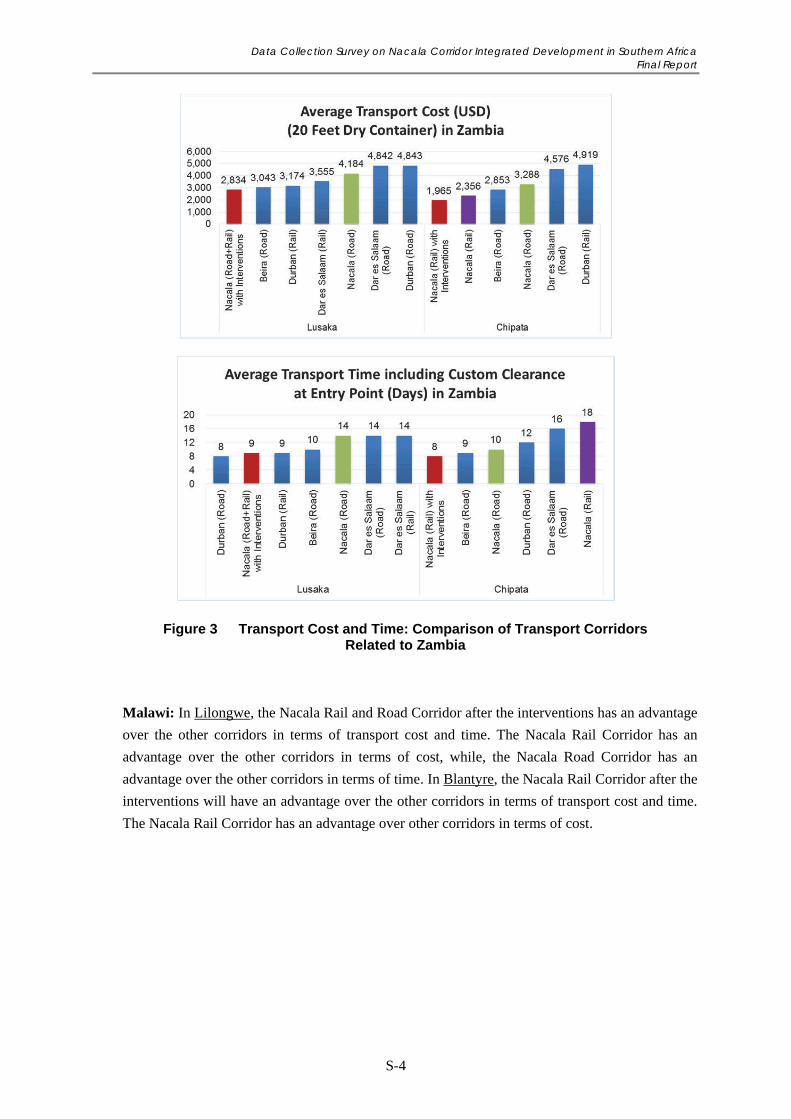
Data Collection Survey on Nacala Corridor Integrated Development in Southern Africa Final Report
S-4
Figure 3 Transport Cost and Time: Comparison of Transport Corridors Related to Zambia
Malawi: In Lilongwe, the Nacala Rail and Road Corridor after the interventions has an advantage
over the other corridors in terms of transport cost and time. The Nacala Rail Corridor has an
advantage over the other corridors in terms of cost, while, the Nacala Road Corridor has an
advantage over the other corridors in terms of time. In Blantyre, the Nacala Rail Corridor after the
interventions will have an advantage over the other corridors in terms of transport cost and time.
The Nacala Rail Corridor has an advantage over other corridors in terms of cost.
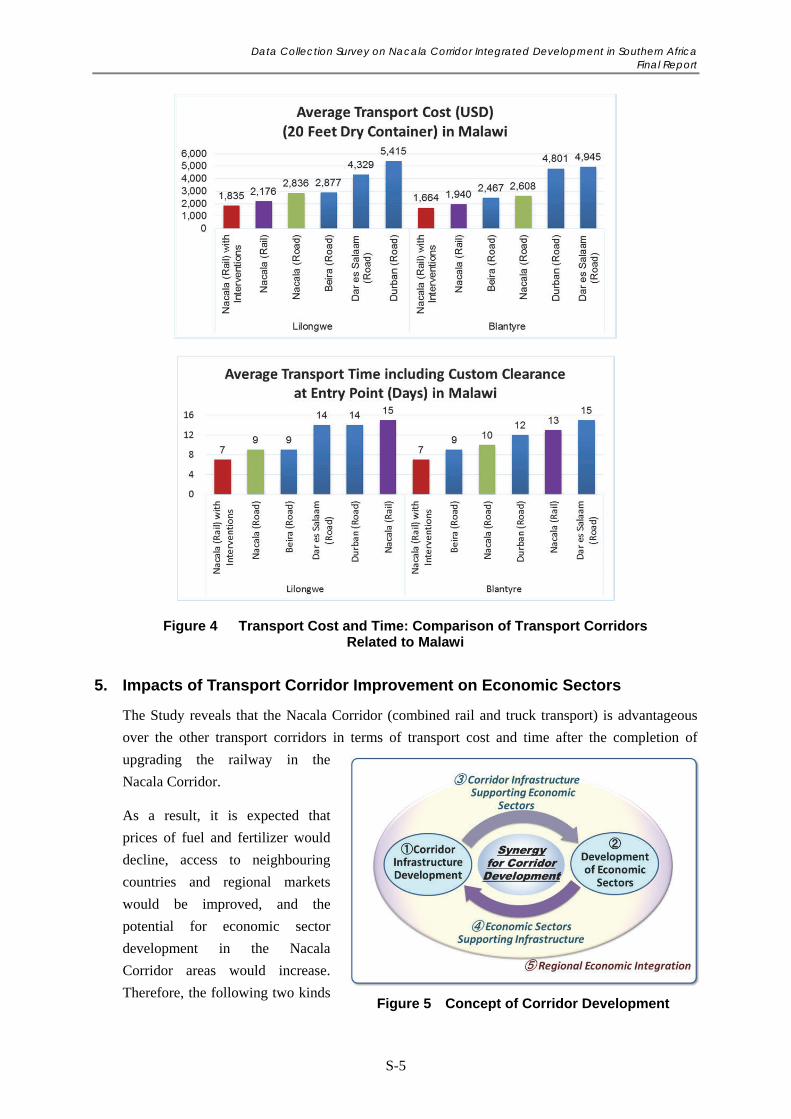
Data Collection Survey on Nacala Corridor Integrated Development in Southern Africa Final Report
S-5
Figure 4 Transport Cost and Time: Comparison of Transport Corridors Related to Malawi
5. Impacts of Transport Corridor Improvement on Economic Sectors
The Study reveals that the Nacala Corridor (combined rail and truck transport) is advantageous
over the other transport corridors in terms of transport cost and time after the completion of
upgrading the railway in the
Nacala Corridor.
As a result, it is expected that
prices of fuel and fertilizer would
decline, access to neighbouring
countries and regional markets
would be improved, and the
potential for economic sector
development in the Nacala
Corridor areas would increase.
Therefore, the following two kinds Figure 5 Concept of Corridor Development
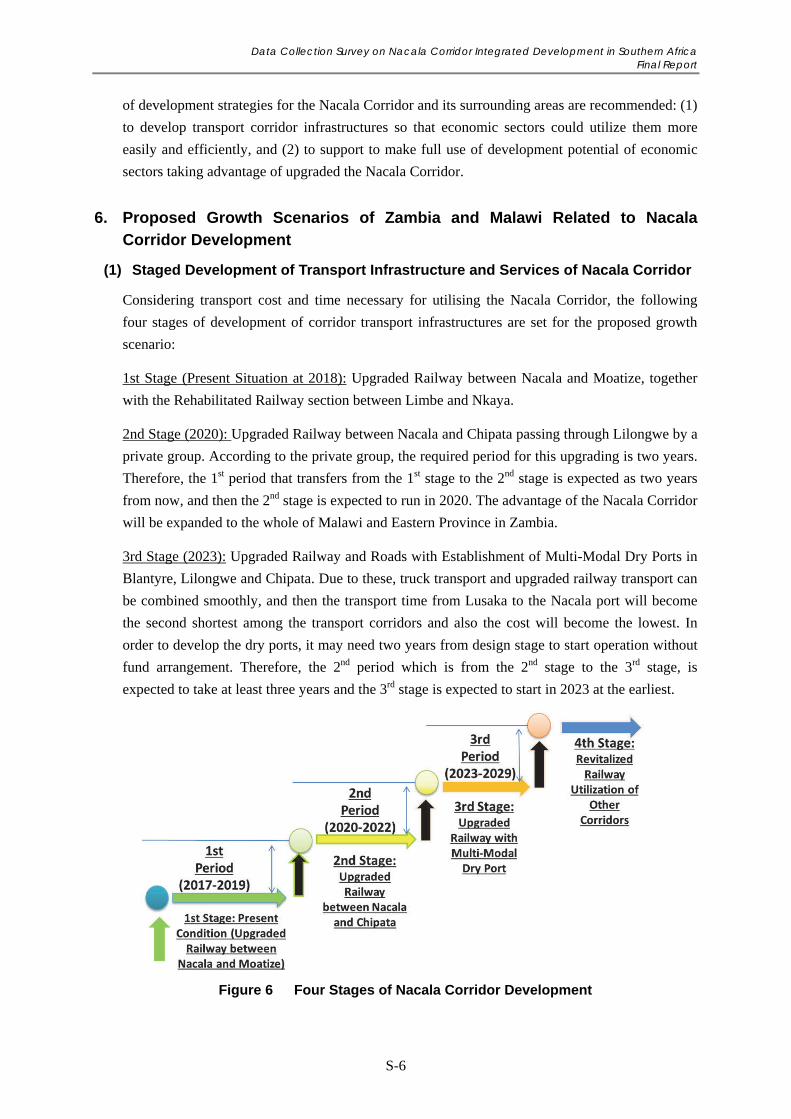
Data Collection Survey on Nacala Corridor Integrated Development in Southern Africa Final Report
S-6
of development strategies for the Nacala Corridor and its surrounding areas are recommended: (1)
to develop transport corridor infrastructures so that economic sectors could utilize them more
easily and efficiently, and (2) to support to make full use of development potential of economic
sectors taking advantage of upgraded the Nacala Corridor.
6. Proposed Growth Scenarios of Zambia and Malawi Related to Nacala Corridor Development
(1) Staged Development of Transport Infrastructure and Services of Nacala Corridor
Considering transport cost and time necessary for utilising the Nacala Corridor, the following
four stages of development of corridor transport infrastructures are set for the proposed growth
scenario:
1st Stage (Present Situation at 2018): Upgraded Railway between Nacala and Moatize, together
with the Rehabilitated Railway section between Limbe and Nkaya.
2nd Stage (2020): Upgraded Railway between Nacala and Chipata passing through Lilongwe by a
private group. According to the private group, the required period for this upgrading is two years.
Therefore, the 1st period that transfers from the 1st stage to the 2nd stage is expected as two years
from now, and then the 2nd stage is expected to run in 2020. The advantage of the Nacala Corridor
will be expanded to the whole of Malawi and Eastern Province in Zambia.
3rd Stage (2023): Upgraded Railway and Roads with Establishment of Multi-Modal Dry Ports in
Blantyre, Lilongwe and Chipata. Due to these, truck transport and upgraded railway transport can
be combined smoothly, and then the transport time from Lusaka to the Nacala port will become
the second shortest among the transport corridors and also the cost will become the lowest. In
order to develop the dry ports, it may need two years from design stage to start operation without
fund arrangement. Therefore, the 2nd period which is from the 2nd stage to the 3rd stage, is
expected to take at least three years and the 3rd stage is expected to start in 2023 at the earliest.
Figure 6 Four Stages of Nacala Corridor Development
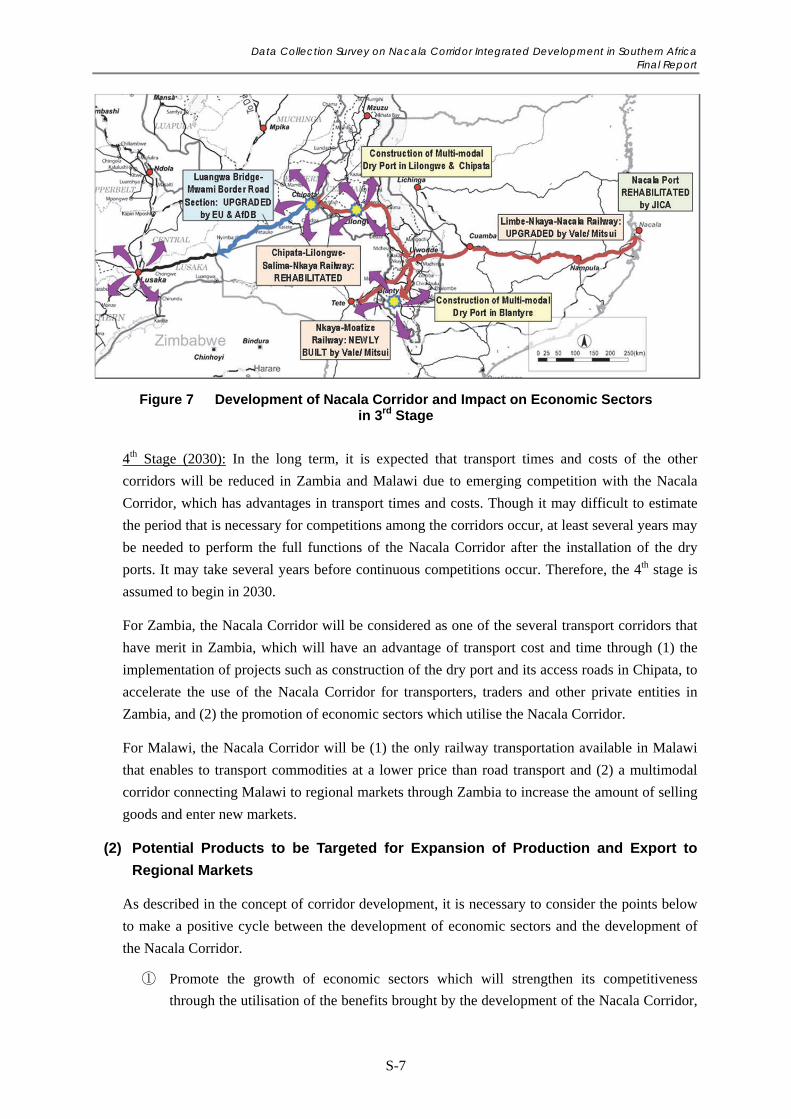
Data Collection Survey on Nacala Corridor Integrated Development in Southern Africa Final Report
S-7
Figure 7 Development of Nacala Corridor and Impact on Economic Sectors in 3rd Stage
4th Stage (2030): In the long term, it is expected that transport times and costs of the other
corridors will be reduced in Zambia and Malawi due to emerging competition with the Nacala
Corridor, which has advantages in transport times and costs. Though it may difficult to estimate
the period that is necessary for competitions among the corridors occur, at least several years may
be needed to perform the full functions of the Nacala Corridor after the installation of the dry
ports. It may take several years before continuous competitions occur. Therefore, the 4th stage is
assumed to begin in 2030.
For Zambia, the Nacala Corridor will be considered as one of the several transport corridors that
have merit in Zambia, which will have an advantage of transport cost and time through (1) the
implementation of projects such as construction of the dry port and its access roads in Chipata, to
accelerate the use of the Nacala Corridor for transporters, traders and other private entities in
Zambia, and (2) the promotion of economic sectors which utilise the Nacala Corridor.
For Malawi, the Nacala Corridor will be (1) the only railway transportation available in Malawi
that enables to transport commodities at a lower price than road transport and (2) a multimodal
corridor connecting Malawi to regional markets through Zambia to increase the amount of selling
goods and enter new markets.
(2) Potential Products to be Targeted for Expansion of Production and Export to
Regional Markets
As described in the concept of corridor development, it is necessary to consider the points below
to make a positive cycle between the development of economic sectors and the development of
the Nacala Corridor.
① Promote the growth of economic sectors which will strengthen its competitiveness
through the utilisation of the benefits brought by the development of the Nacala Corridor,
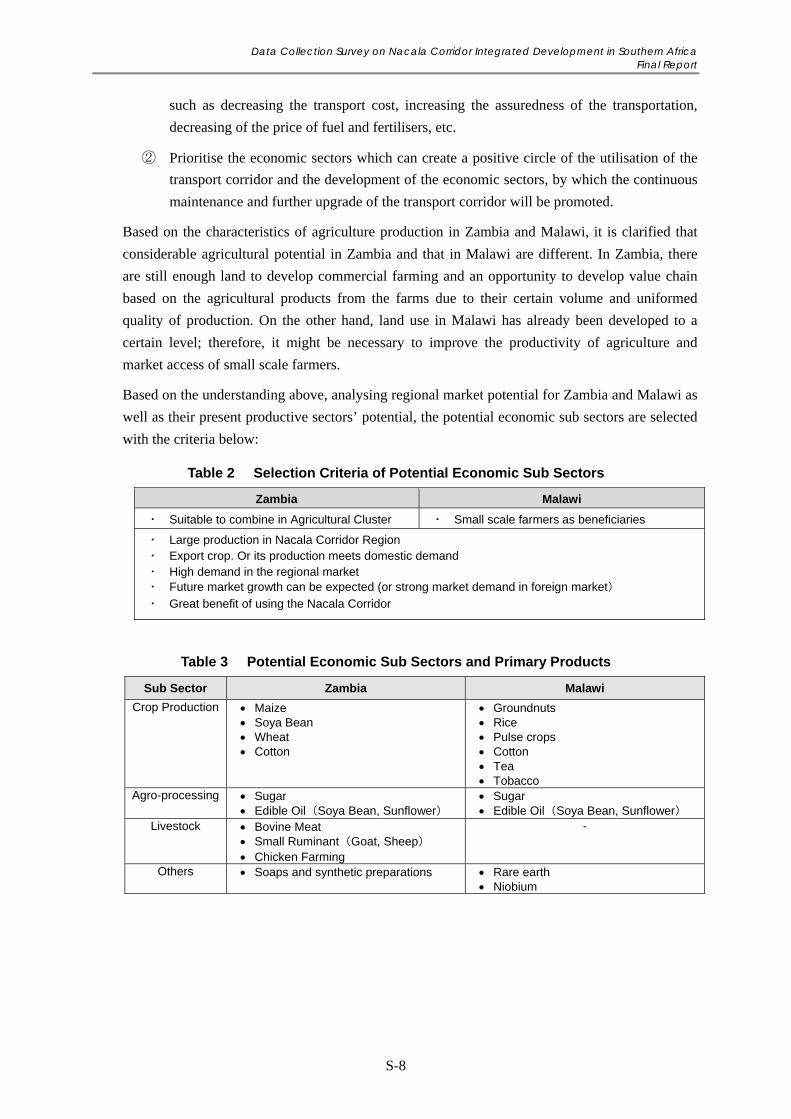
Data Collection Survey on Nacala Corridor Integrated Development in Southern Africa Final Report
S-8
such as decreasing the transport cost, increasing the assuredness of the transportation,
decreasing of the price of fuel and fertilisers, etc.
② Prioritise the economic sectors which can create a positive circle of the utilisation of the
transport corridor and the development of the economic sectors, by which the continuous
maintenance and further upgrade of the transport corridor will be promoted.
Based on the characteristics of agriculture production in Zambia and Malawi, it is clarified that
considerable agricultural potential in Zambia and that in Malawi are different. In Zambia, there
are still enough land to develop commercial farming and an opportunity to develop value chain
based on the agricultural products from the farms due to their certain volume and uniformed
quality of production. On the other hand, land use in Malawi has already been developed to a
certain level; therefore, it might be necessary to improve the productivity of agriculture and
market access of small scale farmers.
Based on the understanding above, analysing regional market potential for Zambia and Malawi as
well as their present productive sectors’ potential, the potential economic sub sectors are selected
with the criteria below:
Table 2 Selection Criteria of Potential Economic Sub Sectors
Zambia Malawi
Suitable to combine in Agricultural Cluster Small scale farmers as beneficiaries
Large production in Nacala Corridor Region Export crop. Or its production meets domestic demand High demand in the regional market Future market growth can be expected (or strong market demand in foreign market)
Great benefit of using the Nacala Corridor
Table 3 Potential Economic Sub Sectors and Primary Products
Sub Sector Zambia Malawi
Crop Production Maize Soya Bean Wheat Cotton
Groundnuts Rice Pulse crops Cotton Tea Tobacco
Agro-processing Sugar Edible Oil(Soya Bean, Sunflower)
Sugar Edible Oil(Soya Bean, Sunflower)
Livestock Bovine Meat Small Ruminant(Goat, Sheep) Chicken Farming
-
Others Soaps and synthetic preparations Rare earth Niobium
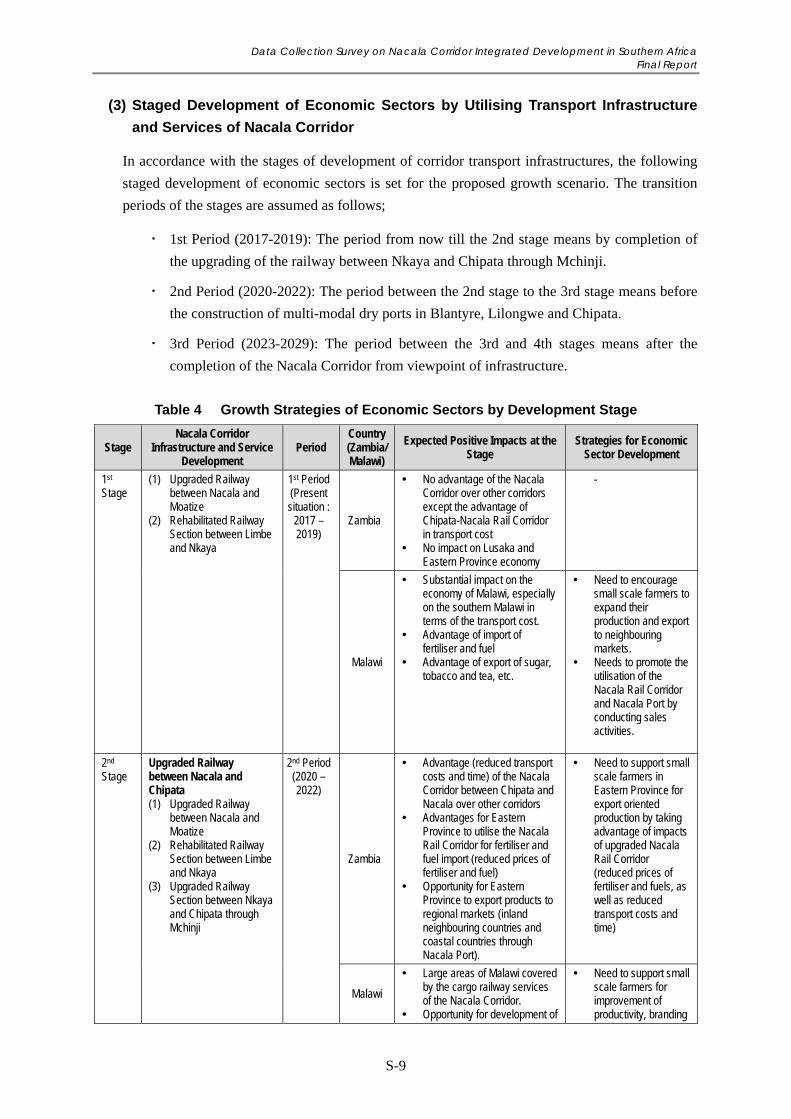
Data Collection Survey on Nacala Corridor Integrated Development in Southern Africa Final Report
S-9
(3) Staged Development of Economic Sectors by Utilising Transport Infrastructure
and Services of Nacala Corridor
In accordance with the stages of development of corridor transport infrastructures, the following
staged development of economic sectors is set for the proposed growth scenario. The transition
periods of the stages are assumed as follows;
1st Period (2017-2019): The period from now till the 2nd stage means by completion of
the upgrading of the railway between Nkaya and Chipata through Mchinji.
2nd Period (2020-2022): The period between the 2nd stage to the 3rd stage means before
the construction of multi-modal dry ports in Blantyre, Lilongwe and Chipata.
3rd Period (2023-2029): The period between the 3rd and 4th stages means after the
completion of the Nacala Corridor from viewpoint of infrastructure.
Table 4 Growth Strategies of Economic Sectors by Development Stage
Stage Nacala Corridor
Infrastructure and Service Development
Period Country (Zambia/ Malawi)
Expected Positive Impacts at the Stage
Strategies for Economic Sector Development
1st
Stage
(1) Upgraded Railway between Nacala and Moatize
(2) Rehabilitated Railway Section between Limbe and Nkaya
1st Period (Present situation :
2017 – 2019)
Zambia
No advantage of the Nacala Corridor over other corridors except the advantage of Chipata-Nacala Rail Corridor in transport cost
No impact on Lusaka and Eastern Province economy
-
Malawi
Substantial impact on the economy of Malawi, especially on the southern Malawi in terms of the transport cost.
Advantage of import of fertiliser and fuel
Advantage of export of sugar, tobacco and tea, etc.
Need to encourage small scale farmers to expand their production and export to neighbouring markets.
Needs to promote the utilisation of the Nacala Rail Corridor and Nacala Port by conducting sales activities.
2nd Stage
Upgraded Railway between Nacala and Chipata (1) Upgraded Railway
between Nacala and Moatize
(2) Rehabilitated Railway Section between Limbe and Nkaya
(3) Upgraded Railway Section between Nkaya and Chipata through Mchinji
2nd Period (2020 – 2022)
Zambia
Advantage (reduced transport costs and time) of the Nacala Corridor between Chipata and Nacala over other corridors
Advantages for Eastern Province to utilise the Nacala Rail Corridor for fertiliser and fuel import (reduced prices of fertiliser and fuel)
Opportunity for Eastern Province to export products to regional markets (inland neighbouring countries and coastal countries through Nacala Port).
Need to support small scale farmers in Eastern Province for export oriented production by taking advantage of impacts of upgraded Nacala Rail Corridor (reduced prices of fertiliser and fuels, as well as reduced transport costs and time)
Malawi
Large areas of Malawi covered by the cargo railway services of the Nacala Corridor.
Opportunity for development of
Need to support small scale farmers for improvement of productivity, branding
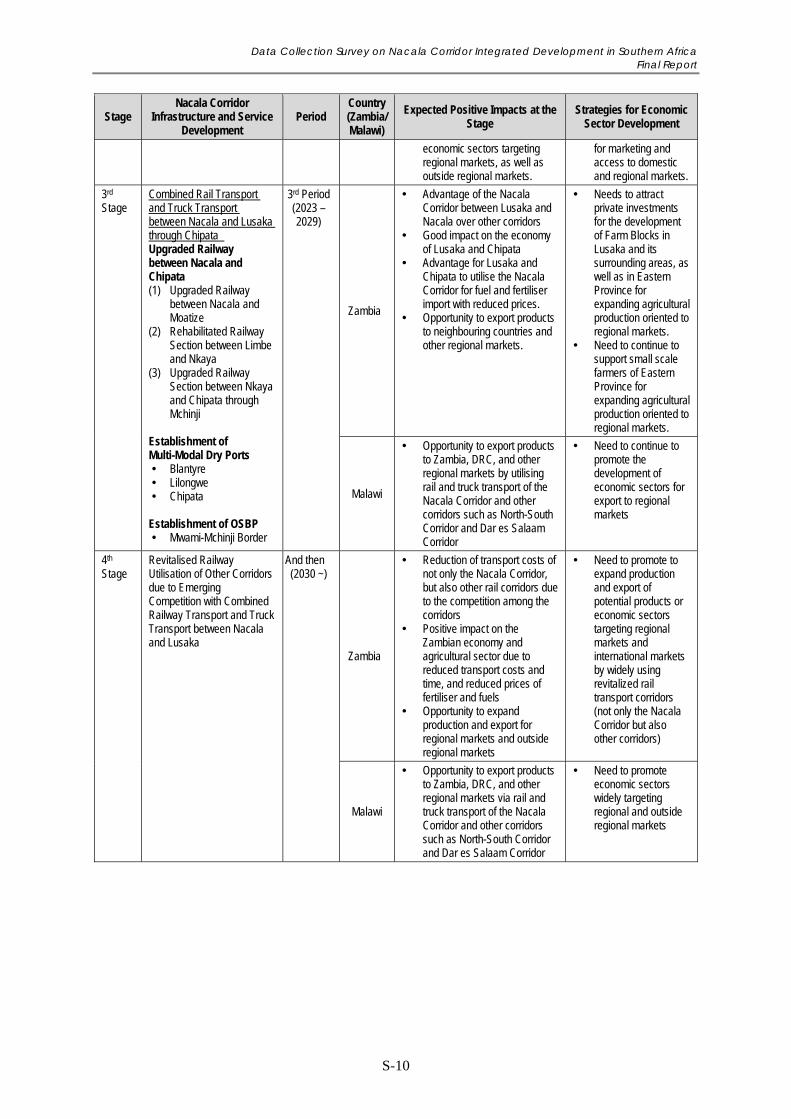
Data Collection Survey on Nacala Corridor Integrated Development in Southern Africa Final Report
S-10
Stage Nacala Corridor
Infrastructure and Service Development
Period Country (Zambia/ Malawi)
Expected Positive Impacts at the Stage
Strategies for Economic Sector Development
economic sectors targeting regional markets, as well as outside regional markets.
for marketing and access to domestic and regional markets.
3rd Stage
Combined Rail Transport and Truck Transport between Nacala and Lusaka through Chipata Upgraded Railway between Nacala and Chipata (1) Upgraded Railway
between Nacala and Moatize
(2) Rehabilitated Railway Section between Limbe and Nkaya
(3) Upgraded Railway Section between Nkaya and Chipata through Mchinji
Establishment of Multi-Modal Dry Ports Blantyre Lilongwe Chipata
Establishment of OSBP Mwami-Mchinji Border
3rd Period (2023 – 2029)
Zambia
Advantage of the Nacala Corridor between Lusaka and Nacala over other corridors
Good impact on the economy of Lusaka and Chipata
Advantage for Lusaka and Chipata to utilise the Nacala Corridor for fuel and fertiliser import with reduced prices.
Opportunity to export products to neighbouring countries and other regional markets.
Needs to attract private investments for the development of Farm Blocks in Lusaka and its surrounding areas, as well as in Eastern Province for expanding agricultural production oriented to regional markets.
Need to continue to support small scale farmers of Eastern Province for expanding agricultural production oriented to regional markets.
Malawi
Opportunity to export products to Zambia, DRC, and other regional markets by utilising rail and truck transport of the Nacala Corridor and other corridors such as North-South Corridor and Dar es Salaam Corridor
Need to continue to promote the development of economic sectors for export to regional markets
4th Stage
Revitalised Railway Utilisation of Other Corridors due to Emerging Competition with Combined Railway Transport and Truck Transport between Nacala and Lusaka
And then (2030 ~)
Zambia
Reduction of transport costs of not only the Nacala Corridor, but also other rail corridors due to the competition among the corridors
Positive impact on the Zambian economy and agricultural sector due to reduced transport costs and time, and reduced prices of fertiliser and fuels
Opportunity to expand production and export for regional markets and outside regional markets
Need to promote to expand production and export of potential products or economic sectors targeting regional markets and international markets by widely using revitalized rail transport corridors (not only the Nacala Corridor but also other corridors)
Malawi
Opportunity to export products to Zambia, DRC, and other regional markets via rail and truck transport of the Nacala Corridor and other corridors such as North-South Corridor and Dar es Salaam Corridor
Need to promote economic sectors widely targeting regional and outside regional markets
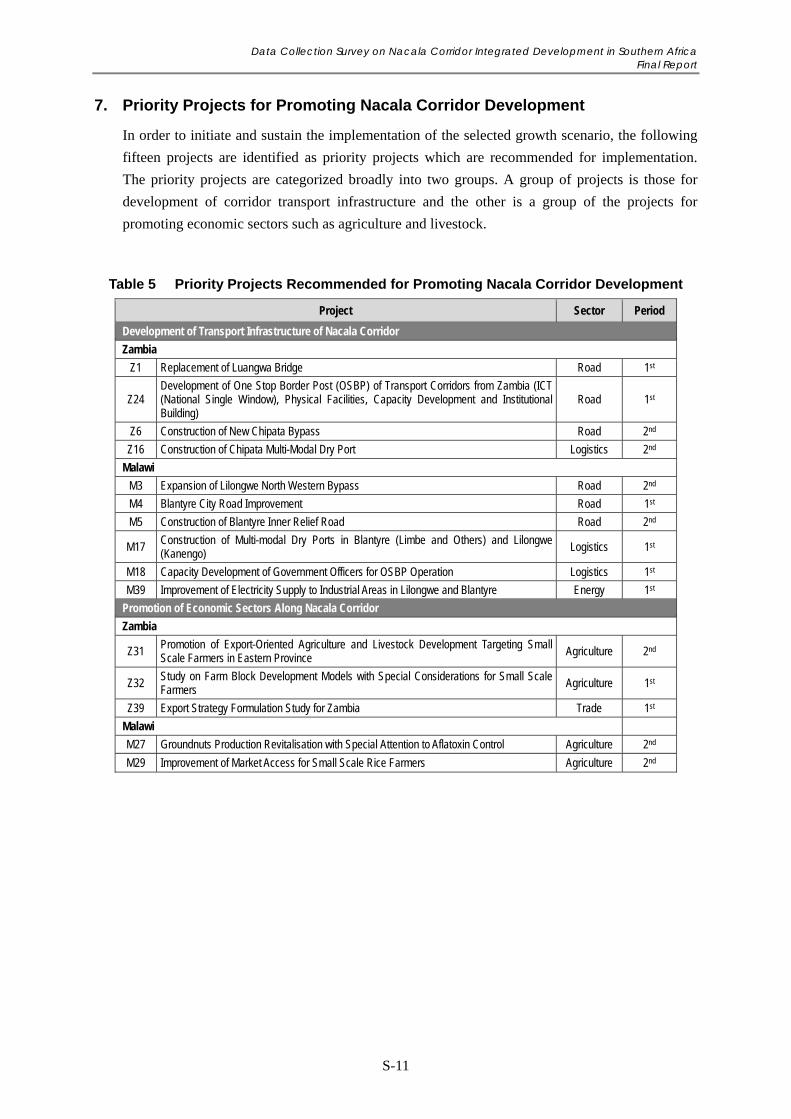
Data Collection Survey on Nacala Corridor Integrated Development in Southern Africa Final Report
S-11
7. Priority Projects for Promoting Nacala Corridor Development
In order to initiate and sustain the implementation of the selected growth scenario, the following
fifteen projects are identified as priority projects which are recommended for implementation.
The priority projects are categorized broadly into two groups. A group of projects is those for
development of corridor transport infrastructure and the other is a group of the projects for
promoting economic sectors such as agriculture and livestock.
Table 5 Priority Projects Recommended for Promoting Nacala Corridor Development
Project Sector Period
Development of Transport Infrastructure of Nacala Corridor
Zambia
Z1 Replacement of Luangwa Bridge Road 1st
Z24 Development of One Stop Border Post (OSBP) of Transport Corridors from Zambia (ICT (National Single Window), Physical Facilities, Capacity Development and Institutional Building)
Road 1st
Z6 Construction of New Chipata Bypass Road 2nd
Z16 Construction of Chipata Multi-Modal Dry Port Logistics 2nd
Malawi
M3 Expansion of Lilongwe North Western Bypass Road 2nd
M4 Blantyre City Road Improvement Road 1st
M5 Construction of Blantyre Inner Relief Road Road 2nd
M17 Construction of Multi-modal Dry Ports in Blantyre (Limbe and Others) and Lilongwe (Kanengo) Logistics 1st
M18 Capacity Development of Government Officers for OSBP Operation Logistics 1st
M39 Improvement of Electricity Supply to Industrial Areas in Lilongwe and Blantyre Energy 1st
Promotion of Economic Sectors Along Nacala Corridor
Zambia
Z31 Promotion of Export-Oriented Agriculture and Livestock Development Targeting Small Scale Farmers in Eastern Province Agriculture 2nd
Z32 Study on Farm Block Development Models with Special Considerations for Small Scale Farmers
Agriculture 1st
Z39 Export Strategy Formulation Study for Zambia Trade 1st
Malawi
M27 Groundnuts Production Revitalisation with Special Attention to Aflatoxin Control Agriculture 2nd
M29 Improvement of Market Access for Small Scale Rice Farmers Agriculture 2nd
Data Collection Survey on Nacala Corridor Integrated Development in Southern Africa Final Report
1-1
Chapter 1 Introduction
1.1 Background of the Study
The Nacala Corridor, extending from Nacala Port in the northern region of Mozambique,
through Malawi, to Lusaka, the capital city of Zambia, is an important economic corridor in
Southern Africa. JICA has been assisting the development of the Nacala Corridor and its
surrounding areas through various projects. However, most of the projects have targeted the
northern region of Mozambique. At present, traffic volume along the Nacala Corridor in
Zambia and Malawi is not much, and the potential of the corridor development is not utilised
effectively. For landlocked countries such as Zambia and Malawi, development and utilisation
of international corridors, which would improve access to international markets and vitalise
the regional economy, is an important issue for the development of the national economy.
The Government of Zambia identified diversification of the economy and infrastructure
development for economic diversification as the most important issue in the Sixth National
Development Plan (2013-2016). A cross-ministerial working group was established for Nacala
Corridor Development.
The Government of Malawi identified development of transport infrastructure as one of the
most important issues in the Malawi Growth and Development Strategy II (2011-2016), and
infrastructure development and management of international corridors as one of the priority
areas in the National Transport Policy formulated in 2015.
However, except for some information about infrastructure development, there had been no
adequate information of the existing conditions and development potential of the Nacala
Corridor from a perspective of regional development incorporating both hard and soft aspects
of economic sectors. Therefore, the JICA Study was conducted to collect information on
Nacala Corridor Development in Zambia and Malawi, placing a special focus on identification
of development potentials and formation of projects.
1.2 Objectives of the Study
The objectives of the Study were to identify issues, needs, and development potentials of the
Nacala Corridor Region, and to identify priority projects by considering integrated
development strategies for the Nacala Corridor Region.
The following information were collected and analysed to achieve the objectives:
Existing projects related to the development of the Nacala Corridor Region
Current socio-economic conditions of the Nacala Corridor Region
Economic sector development in the Nacala Corridor Region
Logistics networks for economic sector development in the Nacala Corridor Region
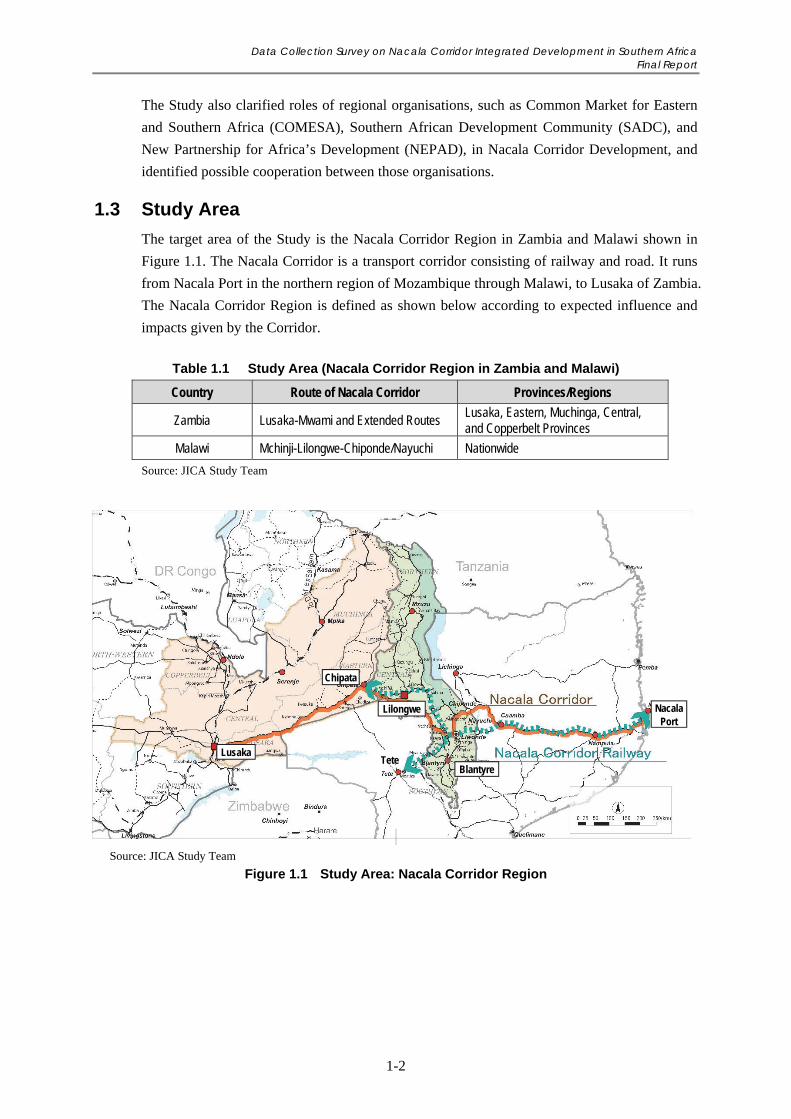
Data Collection Survey on Nacala Corridor Integrated Development in Southern Africa Final Report
1-2
The Study also clarified roles of regional organisations, such as Common Market for Eastern
and Southern Africa (COMESA), Southern African Development Community (SADC), and
New Partnership for Africa’s Development (NEPAD), in Nacala Corridor Development, and
identified possible cooperation between those organisations.
1.3 Study Area
The target area of the Study is the Nacala Corridor Region in Zambia and Malawi shown in
Figure 1.1. The Nacala Corridor is a transport corridor consisting of railway and road. It runs
from Nacala Port in the northern region of Mozambique through Malawi, to Lusaka of Zambia.
The Nacala Corridor Region is defined as shown below according to expected influence and
impacts given by the Corridor.
Table 1.1 Study Area (Nacala Corridor Region in Zambia and Malawi)
Country Route of Nacala Corridor Provinces/Regions
Zambia Lusaka-Mwami and Extended Routes Lusaka, Eastern, Muchinga, Central, and Copperbelt Provinces
Malawi Mchinji-Lilongwe-Chiponde/Nayuchi Nationwide
Source: JICA Study Team
Source: JICA Study Team
Figure 1.1 Study Area: Nacala Corridor Region
Tete Lusaka
Chipata
Lilongwe
Blantyre
Nacala Port
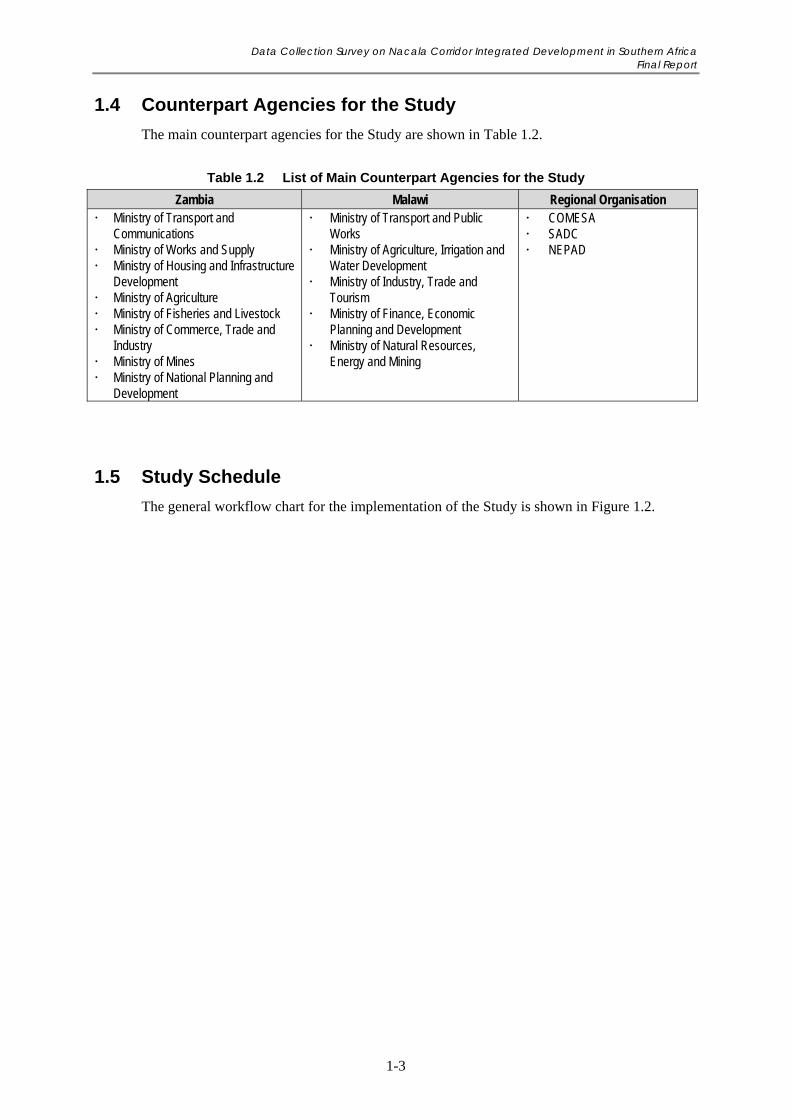
Data Collection Survey on Nacala Corridor Integrated Development in Southern Africa Final Report
1-3
1.4 Counterpart Agencies for the Study
The main counterpart agencies for the Study are shown in Table 1.2.
Table 1.2 List of Main Counterpart Agencies for the Study
Zambia Malawi Regional Organisation Ministry of Transport and
Communications Ministry of Works and Supply Ministry of Housing and Infrastructure
Development Ministry of Agriculture Ministry of Fisheries and Livestock Ministry of Commerce, Trade and
Industry Ministry of Mines Ministry of National Planning and
Development
Ministry of Transport and Public Works
Ministry of Agriculture, Irrigation and Water Development
Ministry of Industry, Trade and Tourism
Ministry of Finance, Economic Planning and Development
Ministry of Natural Resources, Energy and Mining
COMESA SADC NEPAD
1.5 Study Schedule
The general workflow chart for the implementation of the Study is shown in Figure 1.2.
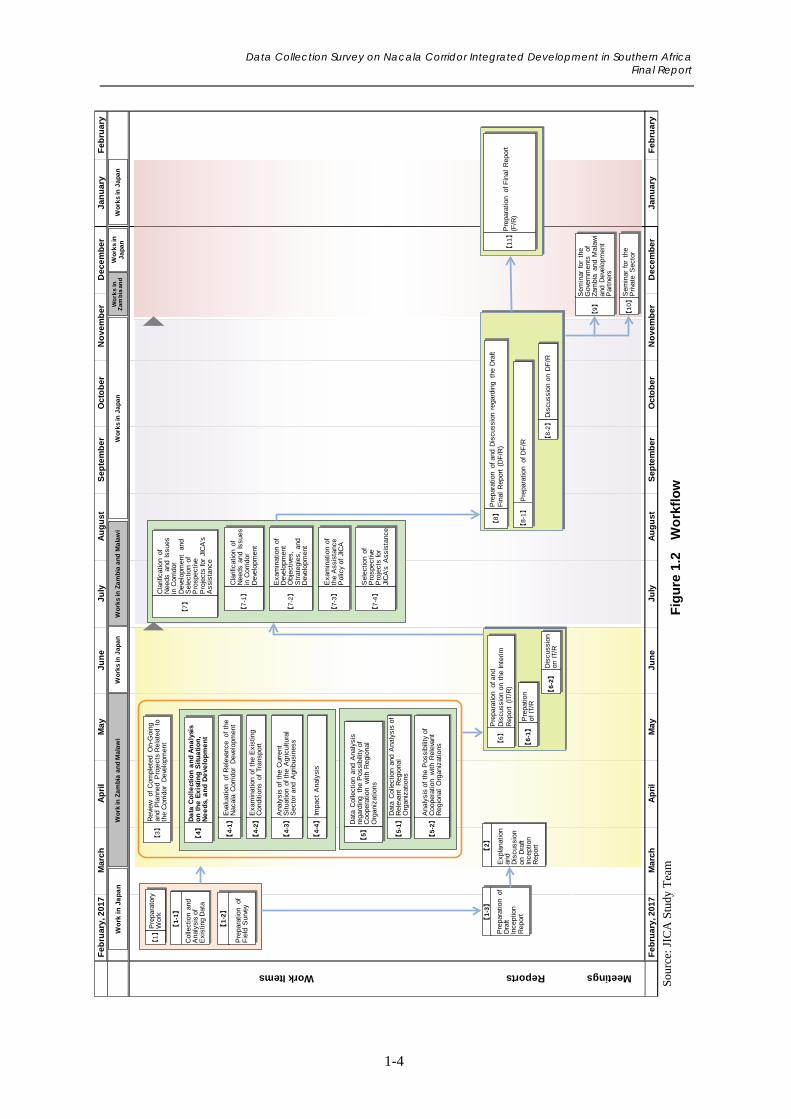
Data Collection Survey on Nacala Corridor Integrated Development in Southern Africa Final Report
1-4
Fig
ure
1.2
W
ork
flo
w
Fe
bru
ary
, 20
17
Ma
rch
Ap
ril
Ma
yJ
un
eJ
uly
Au
gu
st
Se
pte
mb
er
Oc
tob
er
No
ve
mb
er
De
ce
mb
er
Ja
nu
ary
Fe
bru
ary
Fe
bru
ary
, 20
17
Ma
rch
Ap
ril
Ma
yJ
un
eJ
uly
Au
gu
st
Se
pte
mb
er
Oc
tob
er
No
ve
mb
er
De
ce
mb
er
Ja
nu
ary
Fe
bru
ary
MeetingsReportsWork Items
Wo
rk i
n J
ap
an
Wo
rk in
Za
mb
ia a
nd
Ma
law
i
【1
-1】
【4】
Da
ta C
oll
ect
ion
an
d A
na
lysi
s o
n t
he
Ex
isti
ng
Sit
ua
tio
n,
Ne
ed
s, a
nd
De
velo
pm
en
t
【4
-1】
Eva
luat
ion
of R
elev
ance
of
the
Nac
ala
Cor
ridor
Dev
elop
men
t
【4
-2】
【4
-3】
Ana
lysi
s of
the
Cur
rent
S
ituat
ion
of t
he A
gric
ultu
ral
Sec
tor
and
Agr
ibus
ines
s
【4
-4】
Impa
ct A
naly
sis
【1
-3】
Pre
para
tion
of
Dra
ft In
cept
ion
Rep
ort
【1】
Pre
para
tory
W
ork
Col
lect
ion
and
Ana
lysi
s of
E
xist
ing
Dat
a
Wo
rks
in J
ap
an
Wo
rks
in J
ap
an
【1
-2】
Pre
para
tion
of
Fie
ld S
urve
y
【2】
Exp
lana
tion
and
Dis
cuss
ion
on D
raft
Ince
ptio
n R
epor
t
【3】
Rev
iew
of
Com
plet
ed O
n-G
oing
an
d P
lann
ed P
roje
cts
Rel
ated
to
the
Cor
ridor
Dev
elop
men
t
【5】
Dat
a C
olle
ctio
n an
d A
naly
sis
rega
rdin
g th
e P
ossi
bilit
y of
C
oope
ratio
n w
ith R
egio
nal
Org
aniz
atio
ns
【5
-1】
Dat
a C
olle
ctio
n an
d A
naly
sis
of
Rel
evan
t R
egio
nal
Org
aniz
atio
ns
【5
-2】
Ana
lysi
s of
the
Pos
sibi
lity
of
Coo
pera
tion
with
Rel
evan
t R
egio
nal
Org
aniz
atio
ns
【6】
Pre
para
tion
of a
nd
Dis
cuss
ion
on t
he In
terim
R
epor
t (IT
/R)
【6
-1】
Pre
patio
n of
IT/
R
【6
-2】
Dis
cuss
ion
on I
T/R
【7】
Cla
rific
atio
n of
N
eeds
and
Iss
ues
in C
orrid
or
Dev
elop
men
t an
d S
elec
tion
of
Pro
spec
tive
Pro
ject
s fo
r JI
CA
's
Ass
ista
nce
【7
-1】
Cla
rific
atio
n of
N
eeds
and
Iss
ues
in C
orrid
or
Dev
elop
men
t
【7
-2】
Exa
min
atio
n of
D
evel
opm
ent
Obj
ectiv
es,
Str
ateg
ies,
and
D
evel
opm
ent
【7
-3】
Exa
min
atio
n of
th
e A
ssis
tanc
e P
olic
y of
JIC
A
【7
-4】
Sel
ectio
n of
P
rosp
ectiv
e P
roje
cts
for
JIC
A's
Ass
ista
nce
【8】
Pre
para
tion
of a
nd D
iscu
ssio
n re
gard
ing
the
Dra
ft F
inal
Rep
ort
(DF
/R)
【8
-1】
Pre
para
tion
of D
F/R
【8
-2】
Dis
cuss
ion
on D
F/R
【9】
【1
0】
Wo
rks
in Z
am
bia
an
d M
ala
wi
Wo
rks
in
Ja
pa
nW
ork
s in
Z
amb
ia a
nd
【1
1】
Pre
para
tion
of F
inal
Rep
ort
(F/R
)
Sem
inar
for
the
G
over
nmen
ts
of
Zam
bia
and
Mal
awi
and
Dev
elop
men
t P
artn
ers
Sem
inar
for
the
P
rivat
e S
ecto
r
Wo
rks
in J
ap
an
Exa
min
atio
n of
the
Exi
stin
g C
ondi
tions
of
Tran
spor
t
Sour
ce: J
ICA
Stu
dy T
eam
Data Collection Survey on Nacala Corridor Integrated Development in Southern Africa Final Report
2-1
Chapter 2 Corridor Development in Zambia and Malawi and Current Status of Nacala Corridor Development
2.1 Clusters of Transport Corridors
2.1.1 Propulsion Frameworks: Transport Corridors as Economic Corridors
The Nacala Corridor is one of international transport corridors in Africa, which are cutting
across different countries, in many cases connecting international ports with inland countries.
These transport corridors are considered as “economic corridors”, which aim at not only
providing the countries along the corridors with transport services, but also initiating
economic development by promoting development of industries and social services in the
regions along the corridors.
(1) Spatial Development Initiative (SDI)
The economic corridor development is rooted in the “Spatial Development Initiative (SDI)”
started by South Africa for reconstruction in the 1990s after the end of the apartheid. The
programme, which intended to promote investment and improve transport efficiency, made
remarkable success for the determination and leadership of politicians, government officers
and development experts. Due to this success, the SDI approach was adopted by regional
organisations such as SADC, African Development Bank (AfDB), and COMESA1. These
regional organisations acknowledged that the SDI enables a region to achieve economic
growth by attracting investment to cultivate abundant natural resources and eventually by
nurturing manufacturing industry in an integrated manner2.
The Maputo Development Corridor in southern Mozambique is known as the most successful
inter-regional initiative in sub-Saharan Africa among others. The SDI advocates the other
corridors as follows3:
Limpopo Valley SDI (SA and Mozambique) Beira Development Corridor (SA, Mozambique and Zimbabwe) Zambezi Valley SDI (SA and Mozambique) Nacala Development Corridor (SA, Mozambique, Malawi and Zambia) Walvis Bay Development Corridor (SA and Namibia) Gariep SDI (SA’s Northern Cape Province and Namibia) Mtwara Development Corridor (SA, Tanzania, Mozambique and Malawi) Central Development Corridor (SA, Tanzania and Rwanda) Lebombo Investment Initiative (SA, Swaziland and Mozambique)
1 Gadzeni Mulenga. Developing Economic Corridors in Africa Rationale for the Participation of the African Development Bank. AfDB Regional Integration Brief. NEPAD, Regional Integration and Trade Department - No. 1. April, 2013 2 http://www.mcli.co.za/mcli-web/mdc/sdi.htm 3 http://sadcindustries.net/SDIs.html
Data Collection Survey on Nacala Corridor Integrated Development in Southern Africa Final Report
2-2
(2) SADC
Despite the importance of the infrastructure of transport corridors, such as roads, railways, and
marine waterways, only 25% of transport delays are attributed to the issues of hard
infrastructure. Rather, the operation issues of the existing infrastructure cause 75% of delays.
In particular, the main disturbances to the transport are bureaucratic border procedures and
inefficient customs regulations, which could result in interruptions of up to 24 hours and
adversely affect trade in the region4.
Therefore, SADC targets the removal of non-tariff barriers to trade, especially inconsistent and
unpredictable border procedures. SADC stated in the Protocol on Trade that coherent custom
procedures should be established in the entire region for the reduction of transport time and
vibrant trade activities5.
At the same time, SADC launched the SDI programme on 18 corridors as an integrated
planning tool for regional development with significant growth potential. In the programme,
the public sector takes a role to craft a business friendly environment in order to attract
investment from the private sector and/or to promote public-private partnerships. The
Regional Infrastructure Development Master Plan in 2012 identified the North-South Corridor
and the Dar es Salaam Corridor as high priority corridors, and the Beira Corridor and Nacala
Multimodal Corridor with the medium priority for the greatest potential for growth6. The 18
corridors contain:
Eastern Corridors: Limpopo, Beira, Nacala, Mtwara, Dar es Salaam
Southern Corridors: Durban-Manzini, Durban-Maseru, Durban-Phalaborwa, Maputo
Western Corridors: Trans Orange, Trans Kalahari, Walvis Bay-Ndola-Lubumbashi
(Trans Caprivi), Trans Cunene, Namibe, Lobito (Benguela),
Mulanje, Bas Congo
North South Corridor: Durban -Lubumbashi
(3) AfDB
The objectives of the AfDB’s support for the development of regional transport corridors in
Africa are to activate inter-regional and international trade and initiate market integration. In
particular, the corridors provide inland countries with new access to international markets.
Guided by the principles of the Bank’s Regional Integration Strategy, both the hard and soft
infrastructure components are included in the AfDB’s approach for development of the
corridors, such as construction, maintenance and rehabilitation of infrastructure, trade
promotion tools and capacity-building programmes. It also includes the components for
sustainability of economy, society, and environment7.
4 http://www.sadc.int/themes/infrastructure/transport/transport-corridors-spatial-development-initiatives/ 5 Ditto 6 Ditto 7 Gadzeni Mulenga. Developing Economic Corridors in Africa Rationale for the Participation of the African Development Bank. AfDB Regional Integration Brief. NEPAD, Regional Integration and Trade Department - No. 1. April, 2013
Data Collection Survey on Nacala Corridor Integrated Development in Southern Africa Final Report
2-3
For the Nacala Road Corridor Development Project, the Bank is supporting from Phase 1 to 4
in Mozambique, Malawi and Zambia as the main donor. Phase 1 involves rehabilitation of 348
km of road from Nampula to Cuamba in Mozambique and construction of a 13 km bypass
road west of Lilongwe City in Malawi; Phase 2 involves rehabilitation of 360 km of road from
Luangwa Bridge to Mwami in Zambia; and Phase 3 involves rehabilitation of 175 km Cuamba
-Mandimba-Lichinga road in Mozambique. Phase 4 involves rehabilitation of a 75 km road
between Liwonde and Mangochi (75 km) along the Nacala Road Corridor in Malawi as well
as construction and establishment of an One Stop Border Post (OSBP) between Malawi and
Zambia at Mchinji/ Mwami border post.
(4) COMESA
The goal of COMESA is to bring about economic benefits to the member states. By
organizing themselves, the member states take actions for the common objectives, such as
negotiation with non-member states or other organisations, investment attraction, and
development expansion. Regional integration is a tool to achieve prosperity and poverty
reduction by stimulating economic growth. Nevertheless, effective and reliable economic
infrastructure is indispensable to make the regional integration successful. In fact, the member
states suffer from excessively high transaction costs and weak competitiveness in markets
because of lack of transport, energy, and communication infrastructure. Thus, COMESA
includes development of economic infrastructure for the transaction cost reduction and
improvement of competitiveness in the priority areas among others. As a strategic objective, it
identified elimination of bottlenecks in infrastructure development and service improvement
by enhancing infrastructure connectivity and infrastructure integration in the region8.
The components of infrastructure development in COMESA cover transport, energy and
Information Communications Technology (ICT) sectors. A corridor approach adopted by
COMESA focuses on consistent and coherent policy and legal framework building, and
coordination and development of strategic physical infrastructure in the three sectors.
Transport sector development is concerned with air transport, road and rail transport and
maritime and inland water transport. The energy sector covers electricity, non-renewable
(fossil fuels) and renewable energy. The ICT sector includes telecommunications,
broadcasting and postal services9.
2.1.2 Transport Corridors Relevant to Malawi and Zambia
Malawi is a landlocked country bordering Tanzania on the north, Zambia on the west and
Mozambique on the south, east and partially on the west. Being an inland state, Malawi’s
access to seaports necessary for international trade is only available via land transport. Major
corridors that provide the country with access to sea include Nacala, Beira, Durban and Dar es
Salaam. The first three corridors pass through Mozambique; the Durban Corridor via
Zimbabwe; and the Dar es Salaam Corridor goes through Tanzania.
8 COMESA. 2013. COMESA Region Key Economic Infrastructure Development Project 9 Ditto
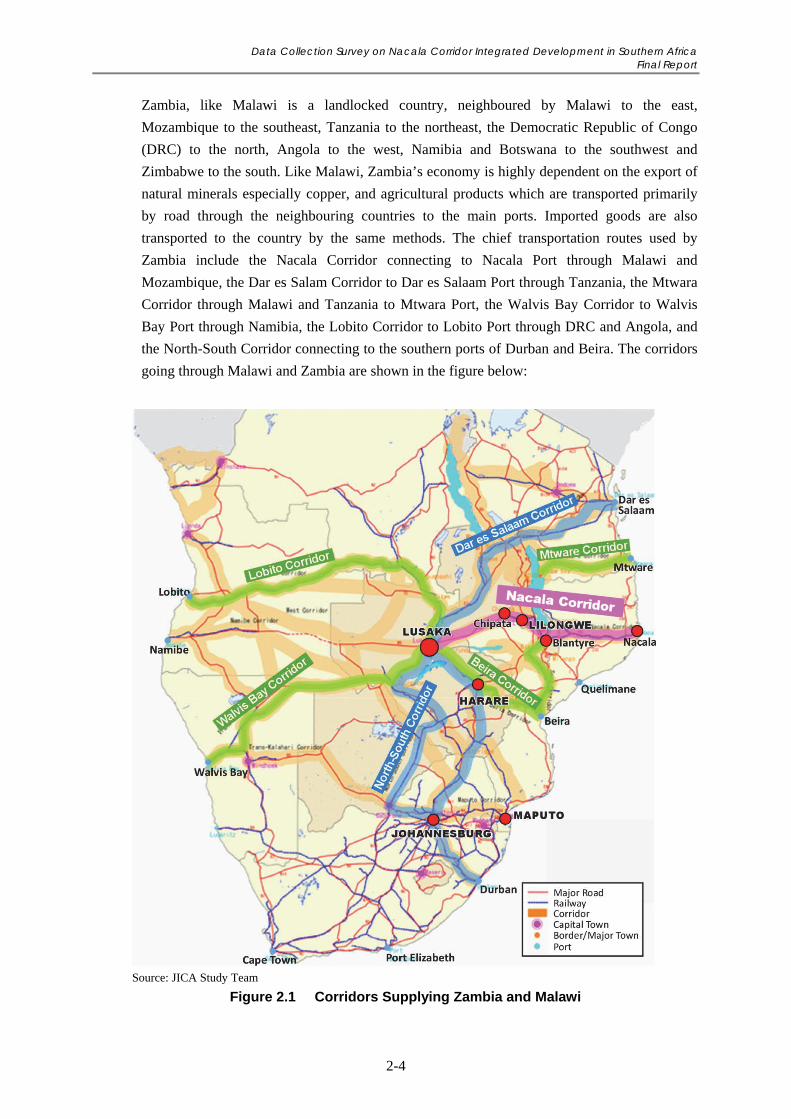
Data Collection Survey on Nacala Corridor Integrated Development in Southern Africa Final Report
2-4
Zambia, like Malawi is a landlocked country, neighboured by Malawi to the east,
Mozambique to the southeast, Tanzania to the northeast, the Democratic Republic of Congo
(DRC) to the north, Angola to the west, Namibia and Botswana to the southwest and
Zimbabwe to the south. Like Malawi, Zambia’s economy is highly dependent on the export of
natural minerals especially copper, and agricultural products which are transported primarily
by road through the neighbouring countries to the main ports. Imported goods are also
transported to the country by the same methods. The chief transportation routes used by
Zambia include the Nacala Corridor connecting to Nacala Port through Malawi and
Mozambique, the Dar es Salam Corridor to Dar es Salaam Port through Tanzania, the Mtwara
Corridor through Malawi and Tanzania to Mtwara Port, the Walvis Bay Corridor to Walvis
Bay Port through Namibia, the Lobito Corridor to Lobito Port through DRC and Angola, and
the North-South Corridor connecting to the southern ports of Durban and Beira. The corridors
going through Malawi and Zambia are shown in the figure below:
Source: JICA Study Team
Figure 2.1 Corridors Supplying Zambia and Malawi
Data Collection Survey on Nacala Corridor Integrated Development in Southern Africa Final Report
2-5
2.1.3 Current Status of Major Transport Corridors Excluding Nacala Corridor
(1) Beira Corridor
The Beira Corridor connects the Port Town of Beira to major towns in central Mozambique,
Zimbabwe and Zambia. Some of the major towns within this corridor include Chimoio,
Mutare and Harare. The route from southern Zambia through Harare to Beira is a major trade
route for the transportation of Zambian and Zimbabwean goods between the major towns and
Beira Port. Since 1980 at the height of the Mozambican Civil War, transportation through the
Beira Corridor was constantly interrupted by insurgent forces, causing major setback to trade
in the surrounding economies. The rehabilitation after the Civil war by the local government
as well as international funding has seen Beira retake its place as Mozambique’s second city
and a vital port for regional transportation.
Also from Malawi, the route through Tete in Mozambique to Beira Port is called the Beira
Corridor. Beira Port handles the largest portion of Malawi’s exports and imports.
(2) North-South Corridor
The North-South Corridor is a combination of two traditional corridors (the Durban Corridor
and Dar es Salaam Corridor) linking the Port of Durban and major cities in Southern Africa to
the Eastern Port of Dar es Salaam. The Durban Corridor also has direct links into the Beira,
Maputo, Walvis Bay, Benguela and Lobito Corridors. From the Port of Dar es Salaam, the
corridors link to the central region of Africa and from the border post of Tunduma in Tanzania
via the Tunduma (Tanzania) – Moyale (Kenya) Corridor and Northern Corridor linking the
Port of Mombasa to eastern DRC through Uganda and Rwanda thereby giving physical
interconnectivity between Eastern and Southern Africa. The North-South is the busiest
corridor in the region in terms of values and volumes of freight. There have been efforts by
regional trade blocs to improve the road and rail infrastructure and reduce waiting times at
borders and ports and thus facilitate regional and international trade.
(3) Dar es Salaam Corridor
The Dar es Salaam Corridor links the Port of Dar es Salaam to the major cities of Lusaka in
Zambia and Lilongwe in Malawi. Key infrastructure along the corridor includes the port, the
TAZARA (Tanzania-Zambia Railway Authority) railway line and the TANZAM
(Tanzania-Zambia) highway. In the 1960’s, a transport coordinating committee was founded
focusing essentially on the handling of metal exports from Zambia for providers and users of
the transport services. In 2003, the Dar es Salaam Corridor Coordinating Committee (DCC)
was established on behalf of the transport committee, under the auspices of SADC, as a public
private entity to coordinate the issues of transport services in general.
(4) Mtwara Corridor
The Mtwara Corridor connects Mtwara Port on the Indian Ocean to major towns in southern
Tanzania, and across Malawi to Zambia. Some of the major towns alongside this corridor
include Masasi, Songea, Mbamba Bay in Tanzania, Nkhata Bay, Mzuzu in Malawi and
Data Collection Survey on Nacala Corridor Integrated Development in Southern Africa Final Report
2-6
Chipata in Zambia, where it links with the Nacala Corridor. A section of the corridor runs
southwards from Mangaka to the border with Mozambique to Mueda and links with the
Pemba-Montepuez-Lichinga Corridor in northern Mozambique. The zone of influence of
Mtwara Port therefore covers large areas of southern Tanzania, northern Mozambique,
northern Malawi and eastern Zambia. This region, highly rich in natural minerals, is vital for
trade among the respective countries.
However, according to discussions with counterparts in Malawi, the Mtwara Corridor may not
become an important import-export port in future due to its limited effects for cost reduction
or modal-shift. Therefore, they gave a low priority for improvement of Nkhata Bay necessary
to complete the function of Mtwara Corridor.
(5) Walvis Bay Corridor
The Walvis Bay Corridor consists of three trade routes linking the Port of Walvis Bay to the
neighbouring countries. The three routes are namely, the Trans-Kalahari Corridor,
Trans-Caprivi Corridor and Trans-Cunene Corridor. The Trans-Kalahari Corridor is a highway
connecting Walvis Bay to Johannesburg and Pretoria through Botswana. The Trans-Caprivi
Corridor branches off from the Trans-Kalahari Highway at Karibib, proceeding northeast
wards to the Angolan border at Rundu, and further eastwards through to Katima Mulilo at the
border with Zambia. The Trans-Cunene Corridor consists of the northern part of the Namibian
national highway from Otavi to Oshikango, and shares the same route as the Trans-Caprivi
Highway from Walvis Bay to Otavi. From Oshikango, the road continues to Lubango in
Angola. The Walvis Bay Corridor suffered setbacks due to the civil war, but in its aftermath
has seen growth into a leading route for the transportation of goods inland from the West
African Coast. It is a key trading route connecting the landlocked countries of Botswana,
Zambia and Zimbabwe to the Western Port of Walvis Bay.
(6) Lobito Corridor
The Corridor of Lobito is an important route through central Angola, connecting several major
towns including Lubumbashi in southern DRC and Lusaka in Zambia. Its strategic location
provides the shortest connection of the West African Coast to the inland countries, playing a
key role as a platform in the regional and international network system of transports in
Southern Africa.
2.1.4 Institutions for Transport Corridors
The following entities are boosting demand of each corridor by means of a lot of supports.
(1) Walvis Bay Corridor Group
The Walvis Bay Corridor Group (WBCG) is a public-private partnership established in 2000
to promote the utilisation of the Walvis Bay Corridor and improve infrastructure. The Walvis
Bay Corridor is a network of transport corridors principally comprising the Port of Walvis Bay,
the Trans-Kalahari Corridor, the Walvis Bay-Ndola-Lubumbashi Development Corridor
(previously known as the Trans-Caprivi Corridor), the Trans-Cunene Corridor, and the
Data Collection Survey on Nacala Corridor Integrated Development in Southern Africa Final Report
2-7
Trans-Oranje Corridor. The Trans-Kalahari Corridor links the Port of Walvis Bay to
Botswana’s Gaborone and Gauteng in South Africa. From Gauteng, this Corridor links with
the Maputo Corridor to the east coast of Southern Africa.
The Walvis Bay-Ndola-Lubumbashi Development Corridor connects Walvis Bay to DRC as
well as the land locked countries of Zambia and Zimbabwe. The Trans-Cunene Corridor
extends through northern Namibia into southern Angola and the Trans-Oranje Corridor links
the Port of Luderitz with Northern Cape Province of South Africa.
The Walvis Bay Corridor Group’s public-private partnership set-up allows for the pooling of
resources from both the regulators and operators of transport. The public sector provides
guidance on the issues of regulations such as customs, transport regulation and infrastructure
development whereas the private sector is responsible for business development issues and the
making of operational proposals and logistical solutions. The ports and corridors are
strategically positioned to give Namibia the positioning of a transport hub for regional and
international trade among the SADC countries, and the rest of the world10.
(2) Beira Corridor Group
The Beira Corridor Group (BCG) – this was a successful private and public sector sponsored
company, which had the prime objective of trade facilitation on the Beira Corridor. The BCG
operated between 1984 and 2000, but closed due to the declining economy in Zimbabwe, and
has not been replaced since.
(3) Dar es Salaam Corridor Committee (DCC)
The DCC is a forum for regional cooperation on cross border transport policy formulation,
regulation and operation. The Committee was established in the year of 2003, under the
auspices of SADC, and it is composed of public and private institutions from the member
countries. Its current membership comprises the United Republic of Tanzania, the Republic of
Malawi, the Republic of Zambia and DRC. The DCC headquarters are located in Tanzania,
under the Secretariat established to support the implementation of interventions and measures
agreed by the DCC members. The DCC serves to facilitate and promote trade in and among
the member states using the corridor by promoting reduction of total transit time on the
corridor and total transport costs for corridor traffic11.
(4) National Transport Corridor Coordination Secretariat of Zambia
Zambia, in a step to promote economic development has established the “National Transport
Corridor Coordination Secretariat” to coordinate with other institutions including DCC and
Walvis Bay-Ndola-Lubumbashi Development Corridor to promote regional trade. The
Secretariat operates under the Ministry of Transport and Communications (MTC),
coordinating and promoting various corridors relevant to Zambia. It serves also as an advisory
10 http://www.wbcg.com.na/ 11 http://darcorridor.org/index.php/about-us
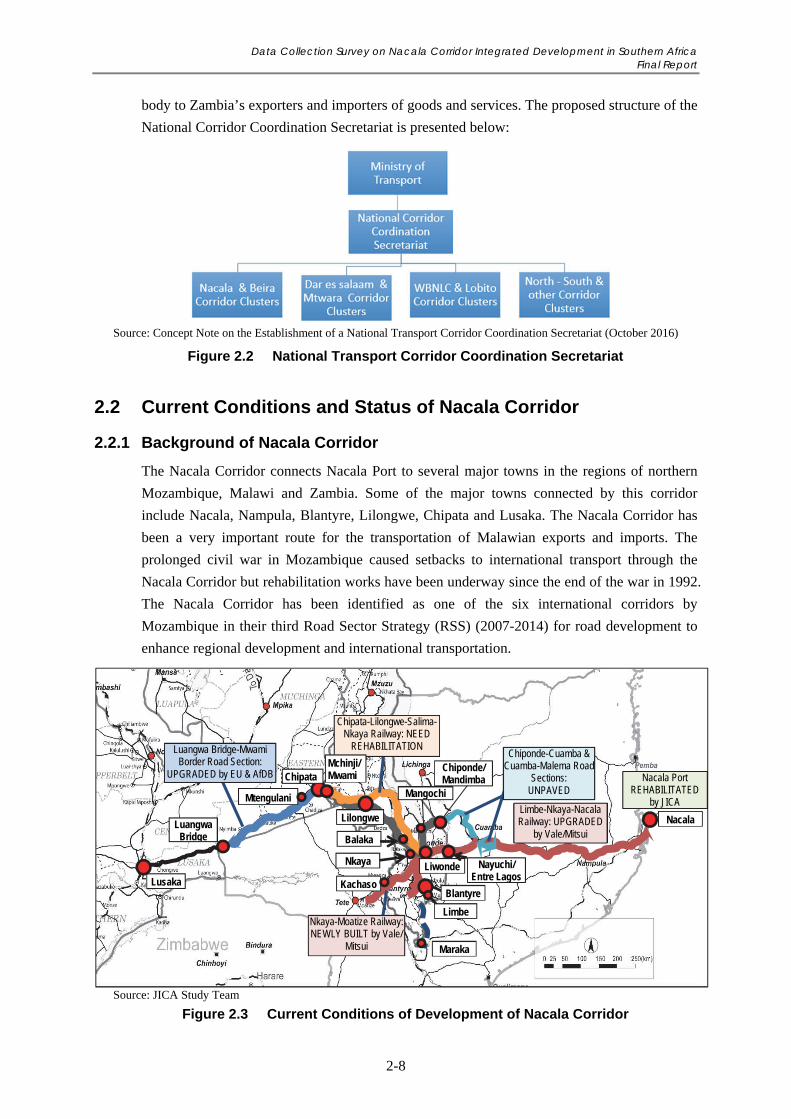
Data Collection Survey on Nacala Corridor Integrated Development in Southern Africa Final Report
2-8
body to Zambia’s exporters and importers of goods and services. The proposed structure of the
National Corridor Coordination Secretariat is presented below:
Source: Concept Note on the Establishment of a National Transport Corridor Coordination Secretariat (October 2016)
Figure 2.2 National Transport Corridor Coordination Secretariat
2.2 Current Conditions and Status of Nacala Corridor
2.2.1 Background of Nacala Corridor
The Nacala Corridor connects Nacala Port to several major towns in the regions of northern
Mozambique, Malawi and Zambia. Some of the major towns connected by this corridor
include Nacala, Nampula, Blantyre, Lilongwe, Chipata and Lusaka. The Nacala Corridor has
been a very important route for the transportation of Malawian exports and imports. The
prolonged civil war in Mozambique caused setbacks to international transport through the
Nacala Corridor but rehabilitation works have been underway since the end of the war in 1992.
The Nacala Corridor has been identified as one of the six international corridors by
Mozambique in their third Road Sector Strategy (RSS) (2007-2014) for road development to
enhance regional development and international transportation.
Source: JICA Study Team
Figure 2.3 Current Conditions of Development of Nacala Corridor
Nacala Port REHABILITATED
by JICA
Luangwa Bridge-Mwami Border Road Section:
UPGRADED by EU & AfDB
Nkaya-Moatize Railway: NEWLY BUILT by Vale/
Mitsui
Limbe-Nkaya-Nacala Railway: UPGRADED
by Vale/Mitsui
Chipata-Lilongwe-Salima-Nkaya Railway: NEED
REHABILITATION Chiponde-Cuamba &
Cuamba-Malema Road Sections:
UNPAVED
Lilongwe
Lusaka
Mchinji/ Mwami
Luangwa Bridge
Nacala
Chiponde/ Mandimba
Nayuchi/ Entre Lagos
Nkaya
Balaka
Maraka
Kachaso
Mtengulani Mangochi
Liwonde
Blantyre
Limbe
Chipata
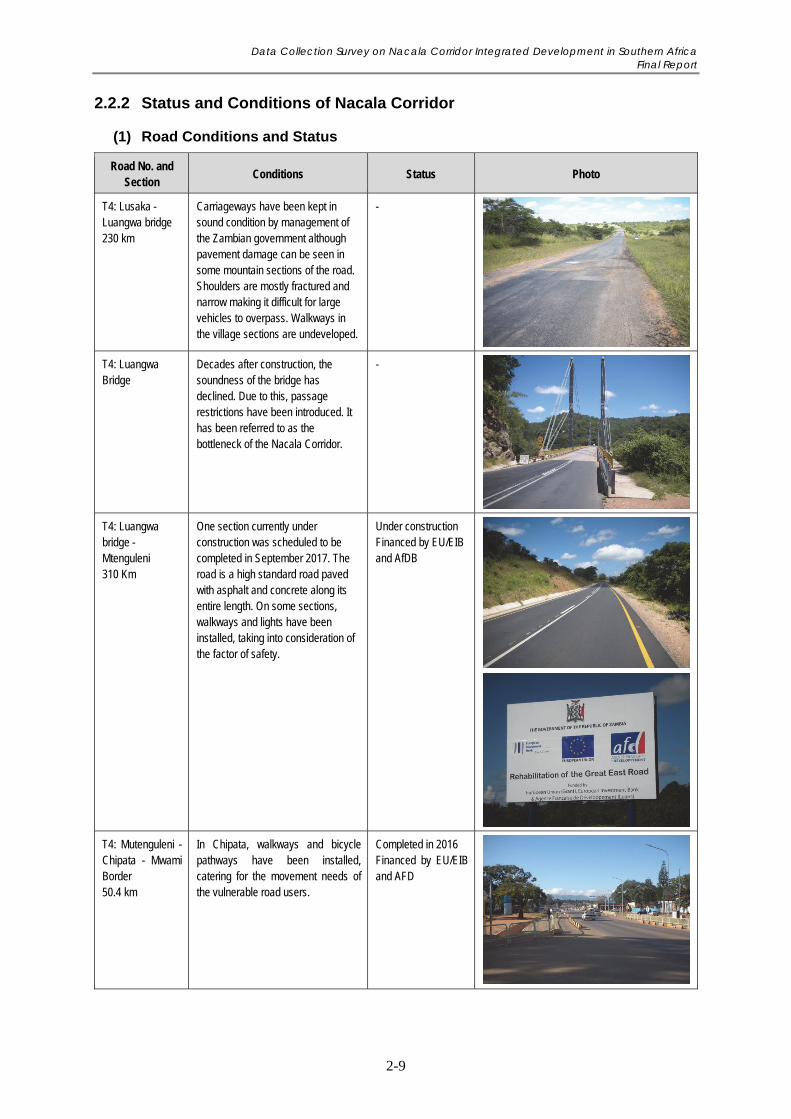
Data Collection Survey on Nacala Corridor Integrated Development in Southern Africa Final Report
2-9
2.2.2 Status and Conditions of Nacala Corridor
(1) Road Conditions and Status
Road No. and Section
Conditions Status Photo
T4: Lusaka - Luangwa bridge 230 km
Carriageways have been kept in sound condition by management of the Zambian government although pavement damage can be seen in some mountain sections of the road. Shoulders are mostly fractured and narrow making it difficult for large vehicles to overpass. Walkways in the village sections are undeveloped.
-
T4: Luangwa Bridge
Decades after construction, the soundness of the bridge has declined. Due to this, passage restrictions have been introduced. It has been referred to as the bottleneck of the Nacala Corridor.
-
T4: Luangwa bridge - Mtenguleni 310 Km
One section currently under construction was scheduled to be completed in September 2017. The road is a high standard road paved with asphalt and concrete along its entire length. On some sections, walkways and lights have been installed, taking into consideration of the factor of safety.
Under construction Financed by EU/EIB and AfDB
T4: Mutenguleni - Chipata - Mwami Border 50.4 km
In Chipata, walkways and bicycle pathways have been installed, catering for the movement needs of the vulnerable road users.
Completed in 2016 Financed by EU/EIB and AFD
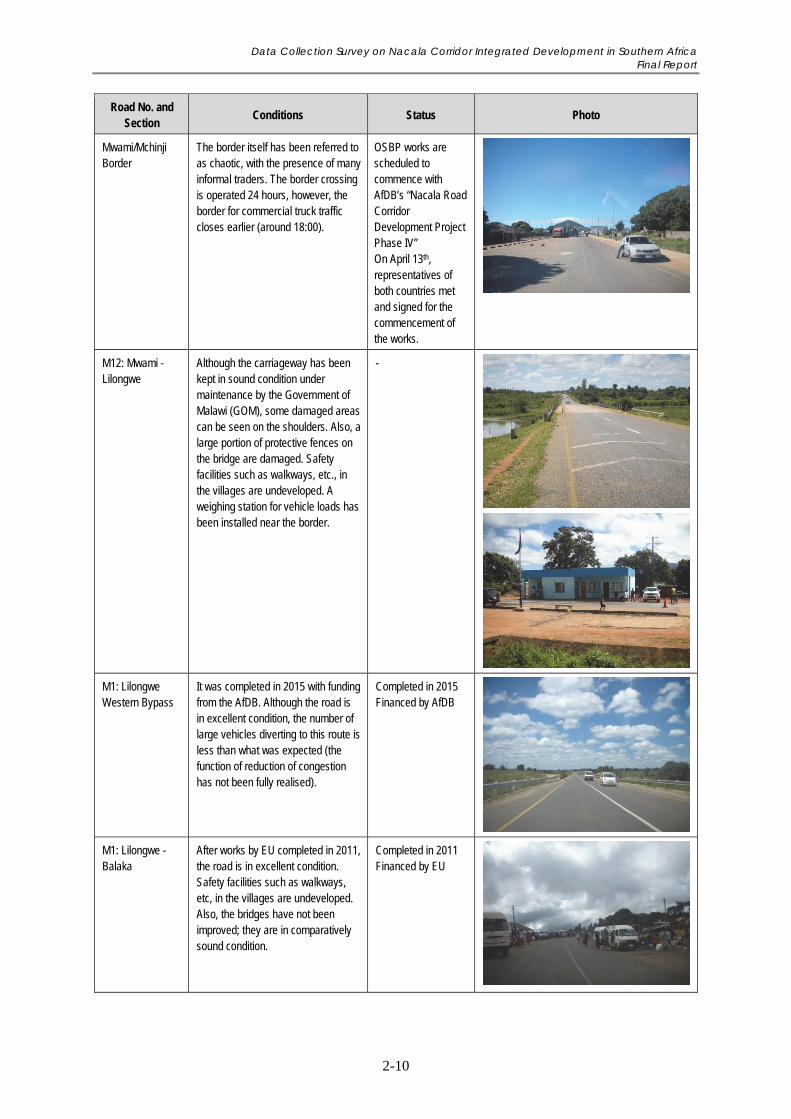
Data Collection Survey on Nacala Corridor Integrated Development in Southern Africa Final Report
2-10
Road No. and Section
Conditions Status Photo
Mwami/Mchinji Border
The border itself has been referred to as chaotic, with the presence of many informal traders. The border crossing is operated 24 hours, however, the border for commercial truck traffic closes earlier (around 18:00).
OSBP works are scheduled to commence with AfDB’s “Nacala Road Corridor Development Project Phase IV” On April 13th, representatives of both countries met and signed for the commencement of the works.
M12: Mwami - Lilongwe
Although the carriageway has been kept in sound condition under maintenance by the Government of Malawi (GOM), some damaged areas can be seen on the shoulders. Also, a large portion of protective fences on the bridge are damaged. Safety facilities such as walkways, etc., in the villages are undeveloped. A weighing station for vehicle loads has been installed near the border.
-
M1: Lilongwe Western Bypass
It was completed in 2015 with funding from the AfDB. Although the road is in excellent condition, the number of large vehicles diverting to this route is less than what was expected (the function of reduction of congestion has not been fully realised).
Completed in 2015 Financed by AfDB
M1: Lilongwe - Balaka
After works by EU completed in 2011, the road is in excellent condition. Safety facilities such as walkways, etc, in the villages are undeveloped. Also, the bridges have not been improved; they are in comparatively sound condition.
Completed in 2011 Financed by EU
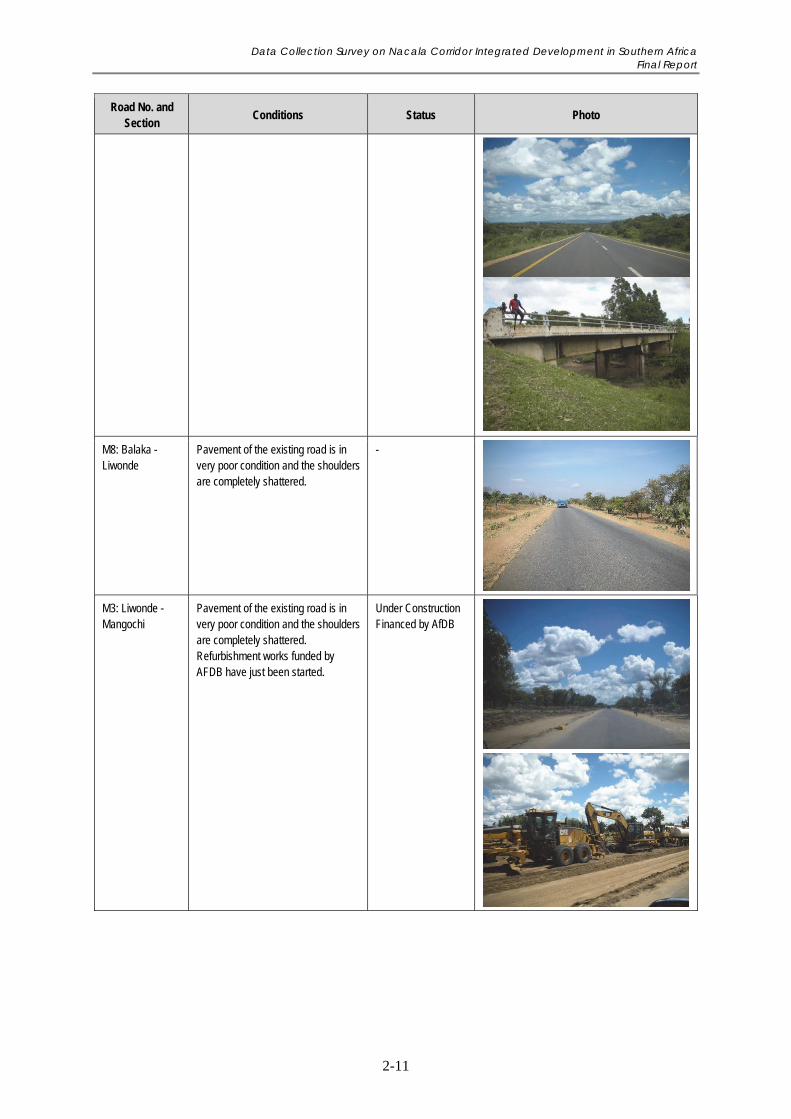
Data Collection Survey on Nacala Corridor Integrated Development in Southern Africa Final Report
2-11
Road No. and Section
Conditions Status Photo
M8: Balaka - Liwonde
Pavement of the existing road is in very poor condition and the shoulders are completely shattered.
-
M3: Liwonde - Mangochi
Pavement of the existing road is in very poor condition and the shoulders are completely shattered. Refurbishment works funded by AFDB have just been started.
Under Construction Financed by AfDB
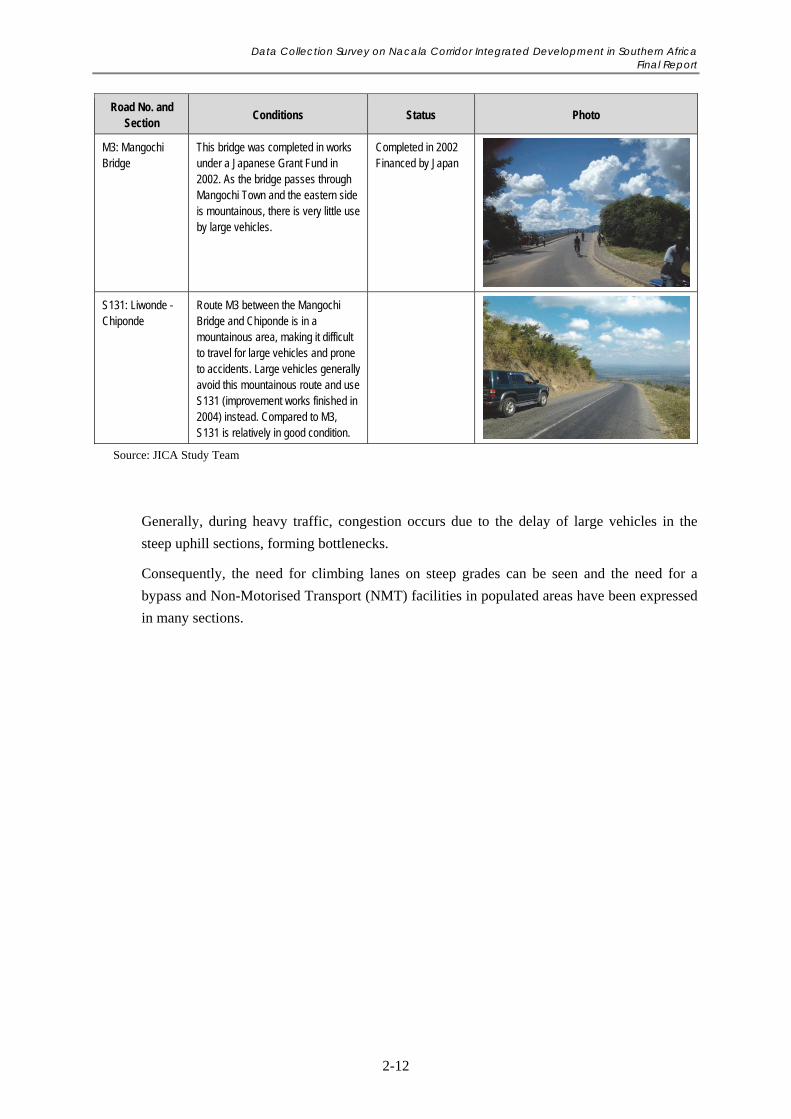
Data Collection Survey on Nacala Corridor Integrated Development in Southern Africa Final Report
2-12
Road No. and Section
Conditions Status Photo
M3: Mangochi Bridge
This bridge was completed in works under a Japanese Grant Fund in 2002. As the bridge passes through Mangochi Town and the eastern side is mountainous, there is very little use by large vehicles.
Completed in 2002 Financed by Japan
S131: Liwonde - Chiponde
Route M3 between the Mangochi Bridge and Chiponde is in a mountainous area, making it difficult to travel for large vehicles and prone to accidents. Large vehicles generally avoid this mountainous route and use S131 (improvement works finished in 2004) instead. Compared to M3, S131 is relatively in good condition.
Source: JICA Study Team
Generally, during heavy traffic, congestion occurs due to the delay of large vehicles in the
steep uphill sections, forming bottlenecks.
Consequently, the need for climbing lanes on steep grades can be seen and the need for a
bypass and Non-Motorised Transport (NMT) facilities in populated areas have been expressed
in many sections.
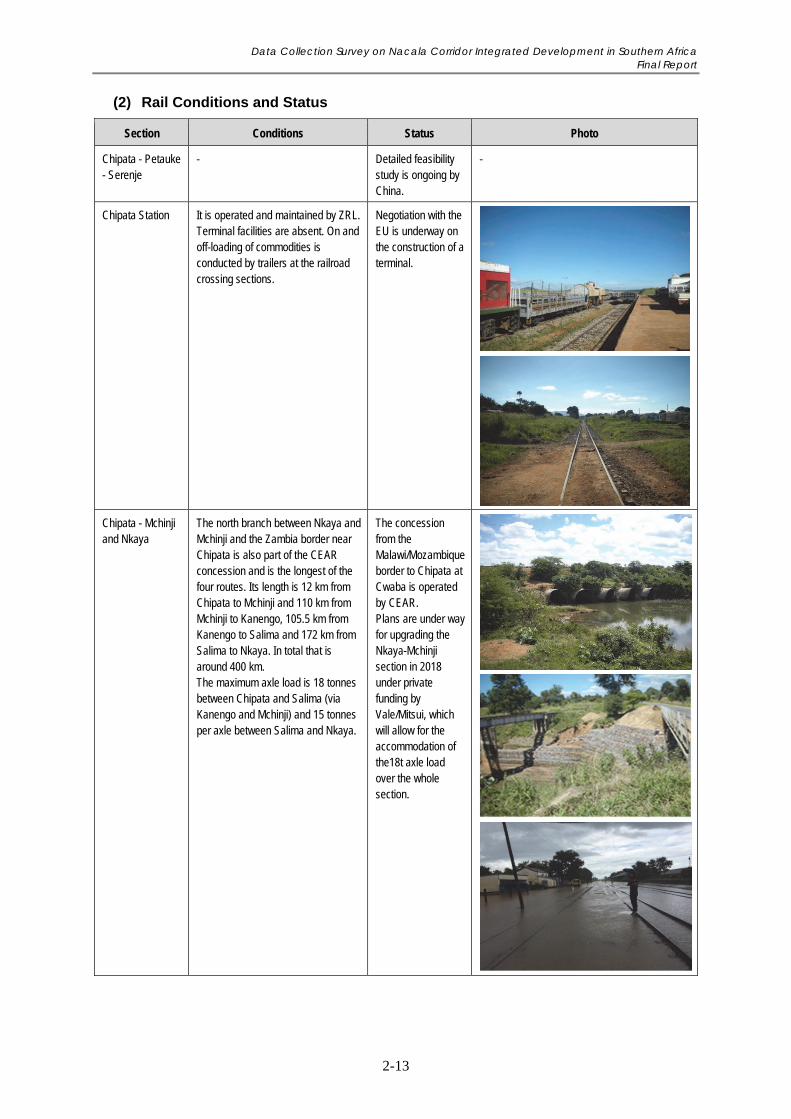
Data Collection Survey on Nacala Corridor Integrated Development in Southern Africa Final Report
2-13
(2) Rail Conditions and Status
Section Conditions Status Photo
Chipata - Petauke - Serenje
- Detailed feasibility study is ongoing by China.
-
Chipata Station It is operated and maintained by ZRL. Terminal facilities are absent. On and off-loading of commodities is conducted by trailers at the railroad crossing sections.
Negotiation with the EU is underway on the construction of a terminal.
Chipata - Mchinji and Nkaya
The north branch between Nkaya and Mchinji and the Zambia border near Chipata is also part of the CEAR concession and is the longest of the four routes. Its length is 12 km from Chipata to Mchinji and 110 km from Mchinji to Kanengo, 105.5 km from Kanengo to Salima and 172 km from Salima to Nkaya. In total that is around 400 km. The maximum axle load is 18 tonnes between Chipata and Salima (via Kanengo and Mchinji) and 15 tonnes per axle between Salima and Nkaya.
The concession from the Malawi/Mozambique border to Chipata at Cwaba is operated by CEAR. Plans are under way for upgrading the Nkaya-Mchinji section in 2018 under private funding by Vale/Mitsui, which will allow for the accommodation of the18t axle load over the whole section.
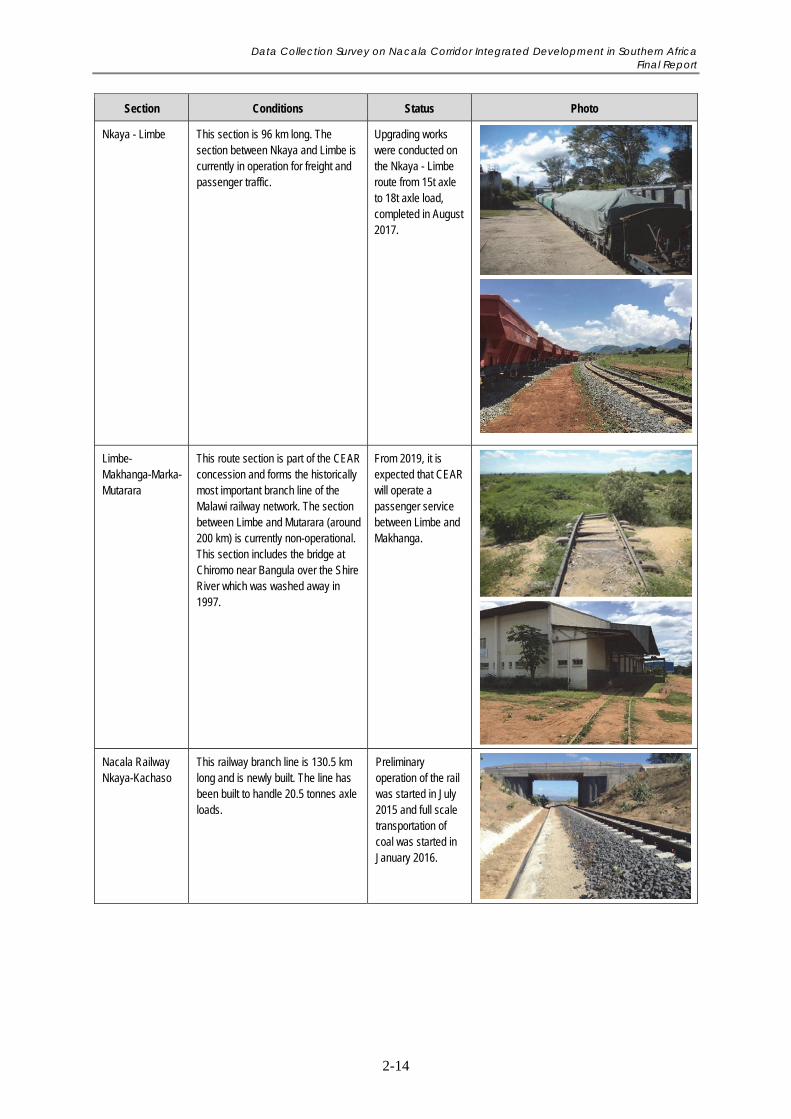
Data Collection Survey on Nacala Corridor Integrated Development in Southern Africa Final Report
2-14
Section Conditions Status Photo
Nkaya - Limbe This section is 96 km long. The section between Nkaya and Limbe is currently in operation for freight and passenger traffic.
Upgrading works were conducted on the Nkaya - Limbe route from 15t axle to 18t axle load, completed in August 2017.
Limbe- Makhanga-Marka-Mutarara
This route section is part of the CEAR concession and forms the historically most important branch line of the Malawi railway network. The section between Limbe and Mutarara (around 200 km) is currently non-operational. This section includes the bridge at Chiromo near Bangula over the Shire River which was washed away in 1997.
From 2019, it is expected that CEAR will operate a passenger service between Limbe and Makhanga.
Nacala Railway Nkaya-Kachaso
This railway branch line is 130.5 km long and is newly built. The line has been built to handle 20.5 tonnes axle loads.
Preliminary operation of the rail was started in July 2015 and full scale transportation of coal was started in January 2016.
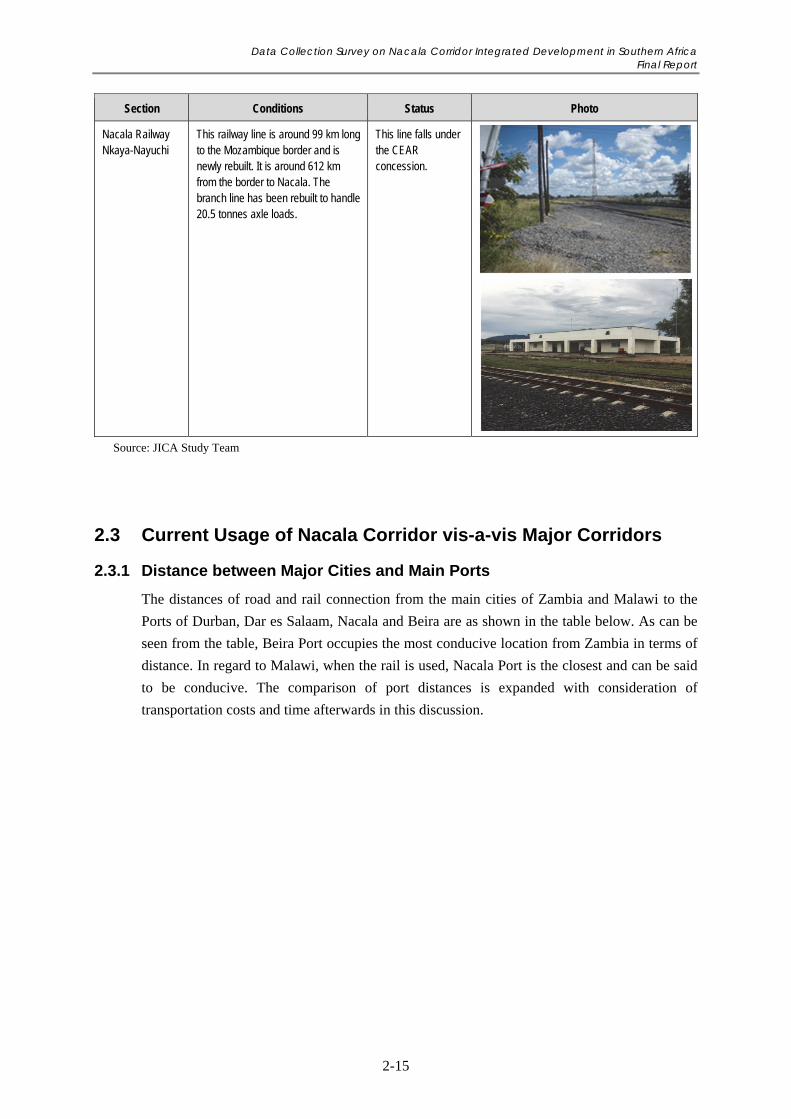
Data Collection Survey on Nacala Corridor Integrated Development in Southern Africa Final Report
2-15
Section Conditions Status Photo
Nacala Railway Nkaya-Nayuchi
This railway line is around 99 km long to the Mozambique border and is newly rebuilt. It is around 612 km from the border to Nacala. The branch line has been rebuilt to handle 20.5 tonnes axle loads.
This line falls under the CEAR concession.
Source: JICA Study Team
2.3 Current Usage of Nacala Corridor vis-a-vis Major Corridors
2.3.1 Distance between Major Cities and Main Ports
The distances of road and rail connection from the main cities of Zambia and Malawi to the
Ports of Durban, Dar es Salaam, Nacala and Beira are as shown in the table below. As can be
seen from the table, Beira Port occupies the most conducive location from Zambia in terms of
distance. In regard to Malawi, when the rail is used, Nacala Port is the closest and can be said
to be conducive. The comparison of port distances is expanded with consideration of
transportation costs and time afterwards in this discussion.
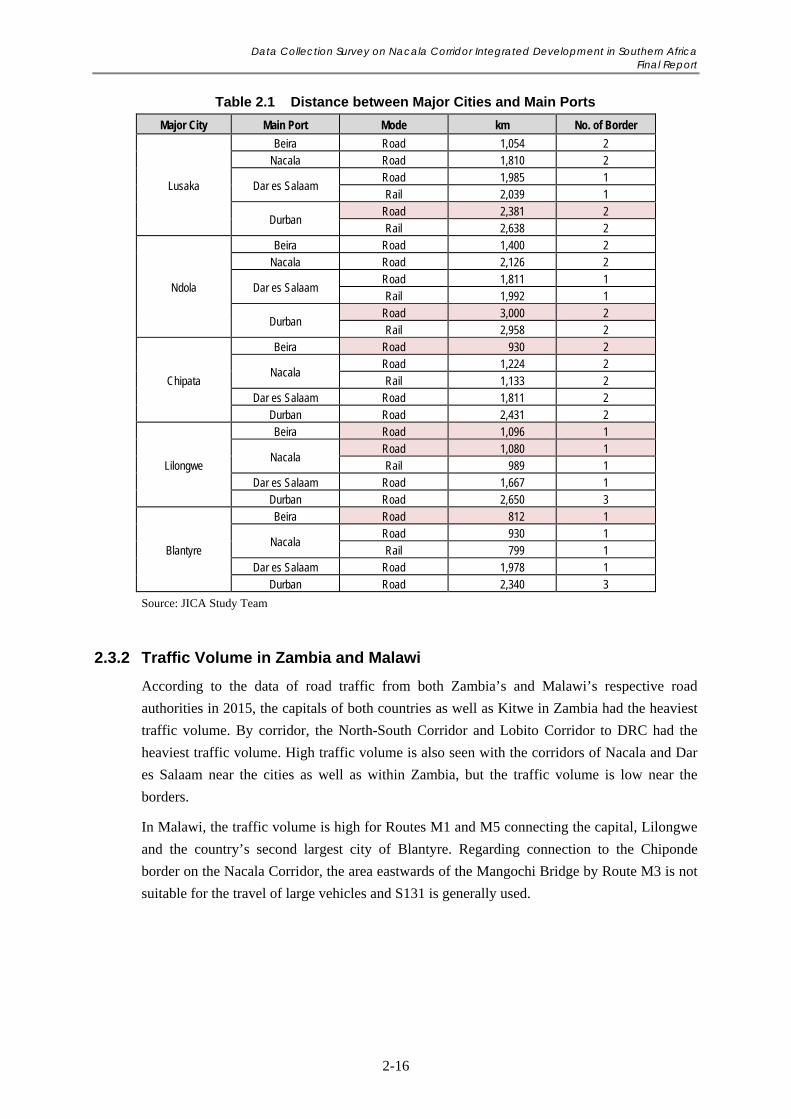
Data Collection Survey on Nacala Corridor Integrated Development in Southern Africa Final Report
2-16
Table 2.1 Distance between Major Cities and Main Ports
Major City Main Port Mode km No. of Border
Lusaka
Beira Road 1,054 2 Nacala Road 1,810 2
Dar es Salaam Road 1,985 1 Rail 2,039 1
Durban Road 2,381 2 Rail 2,638 2
Ndola
Beira Road 1,400 2 Nacala Road 2,126 2
Dar es Salaam Road 1,811 1 Rail 1,992 1
Durban Road 3,000 2 Rail 2,958 2
Chipata
Beira Road 930 2
Nacala Road 1,224 2 Rail 1,133 2
Dar es Salaam Road 1,811 2 Durban Road 2,431 2
Lilongwe
Beira Road 1,096 1
Nacala Road 1,080 1 Rail 989 1
Dar es Salaam Road 1,667 1 Durban Road 2,650 3
Blantyre
Beira Road 812 1
Nacala Road 930 1 Rail 799 1
Dar es Salaam Road 1,978 1 Durban Road 2,340 3
Source: JICA Study Team
2.3.2 Traffic Volume in Zambia and Malawi
According to the data of road traffic from both Zambia’s and Malawi’s respective road
authorities in 2015, the capitals of both countries as well as Kitwe in Zambia had the heaviest
traffic volume. By corridor, the North-South Corridor and Lobito Corridor to DRC had the
heaviest traffic volume. High traffic volume is also seen with the corridors of Nacala and Dar
es Salaam near the cities as well as within Zambia, but the traffic volume is low near the
borders.
In Malawi, the traffic volume is high for Routes M1 and M5 connecting the capital, Lilongwe
and the country’s second largest city of Blantyre. Regarding connection to the Chiponde
border on the Nacala Corridor, the area eastwards of the Mangochi Bridge by Route M3 is not
suitable for the travel of large vehicles and S131 is generally used.
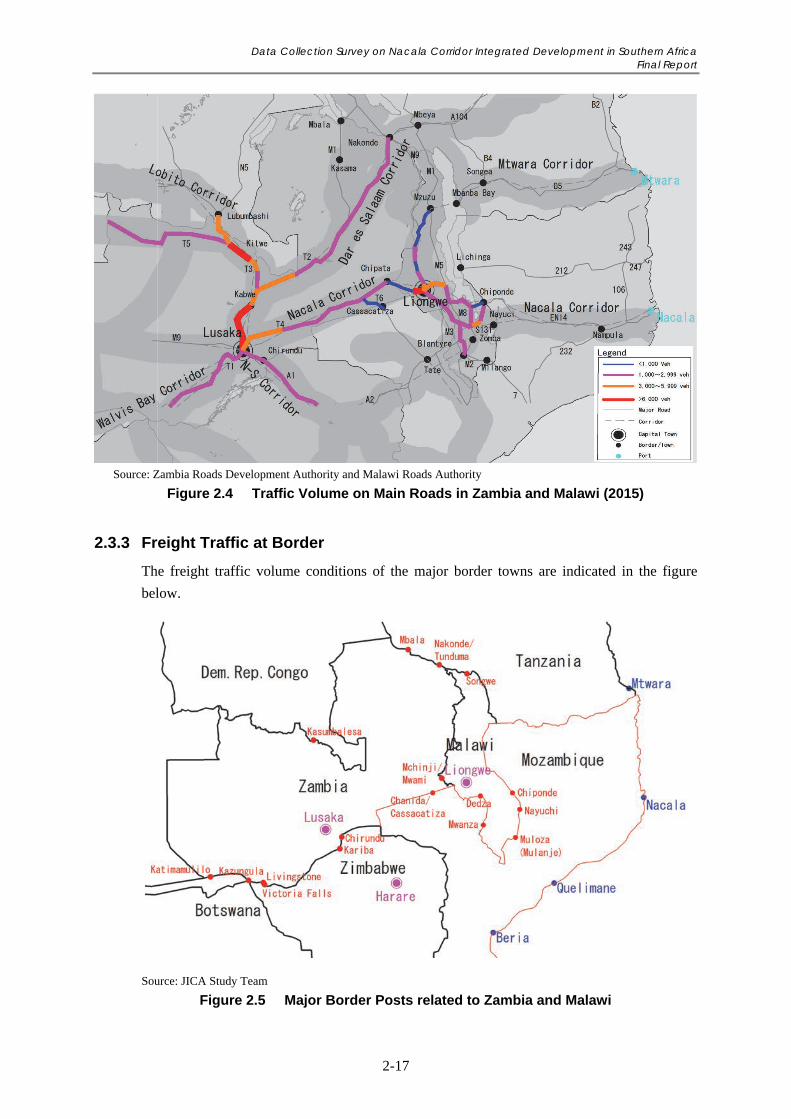
Data Collection Survey on Nacala Corridor Integrated Development in Southern Africa Final Report
2-17
Source: Zambia Roads Development Authority and Malawi Roads Authority
Figure 2.4 Traffic Volume on Main Roads in Zambia and Malawi (2015)
2.3.3 Freight Traffic at Border
The freight traffic volume conditions of the major border towns are indicated in the figure
below.
Source: JICA Study Team
Figure 2.5 Major Border Posts related to Zambia and Malawi
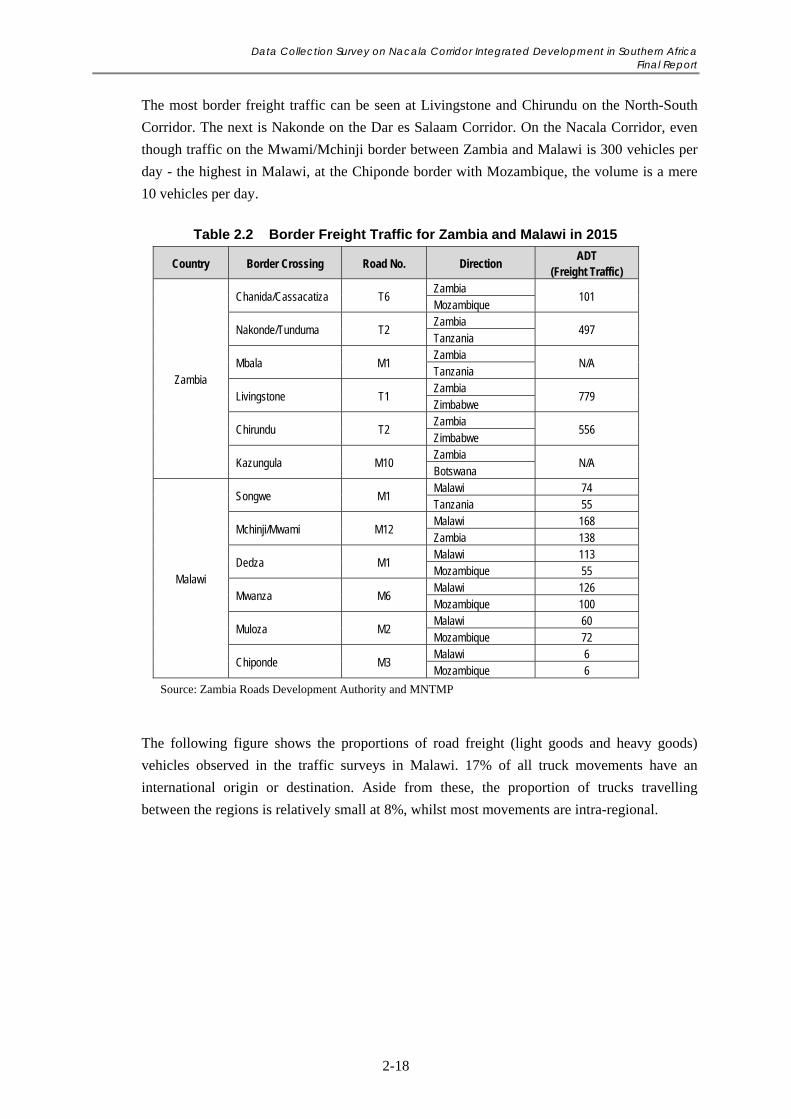
Data Collection Survey on Nacala Corridor Integrated Development in Southern Africa Final Report
2-18
The most border freight traffic can be seen at Livingstone and Chirundu on the North-South
Corridor. The next is Nakonde on the Dar es Salaam Corridor. On the Nacala Corridor, even
though traffic on the Mwami/Mchinji border between Zambia and Malawi is 300 vehicles per
day - the highest in Malawi, at the Chiponde border with Mozambique, the volume is a mere
10 vehicles per day.
Table 2.2 Border Freight Traffic for Zambia and Malawi in 2015
Country Border Crossing Road No. Direction ADT
(Freight Traffic)
Zambia
Chanida/Cassacatiza T6 Zambia
101 Mozambique
Nakonde/Tunduma T2 Zambia
497 Tanzania
Mbala M1 Zambia
N/A Tanzania
Livingstone T1 Zambia
779 Zimbabwe
Chirundu T2 Zambia
556 Zimbabwe
Kazungula M10 Zambia
N/A Botswana
Malawi
Songwe M1 Malawi 74 Tanzania 55
Mchinji/Mwami M12 Malawi 168 Zambia 138
Dedza M1 Malawi 113 Mozambique 55
Mwanza M6 Malawi 126 Mozambique 100
Muloza M2 Malawi 60 Mozambique 72
Chiponde M3 Malawi 6 Mozambique 6
Source: Zambia Roads Development Authority and MNTMP
The following figure shows the proportions of road freight (light goods and heavy goods)
vehicles observed in the traffic surveys in Malawi. 17% of all truck movements have an
international origin or destination. Aside from these, the proportion of trucks travelling
between the regions is relatively small at 8%, whilst most movements are intra-regional.
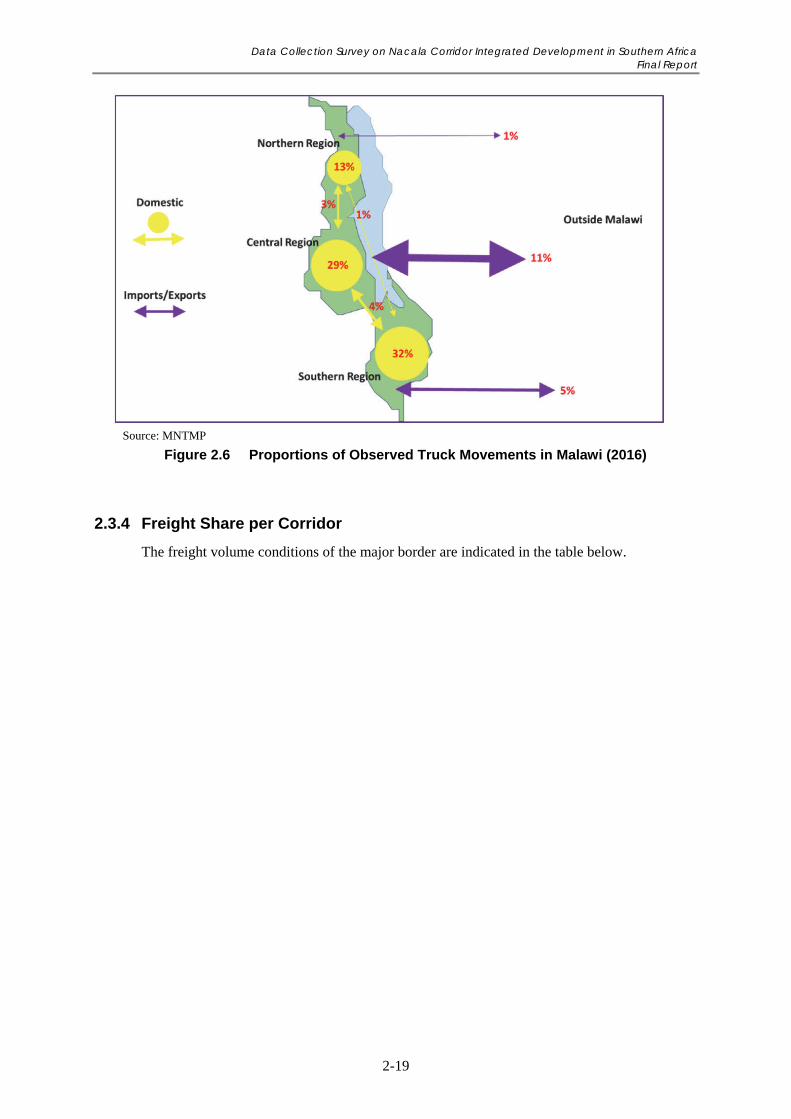
Data Collection Survey on Nacala Corridor Integrated Development in Southern Africa Final Report
2-19
Source: MNTMP
Figure 2.6 Proportions of Observed Truck Movements in Malawi (2016)
2.3.4 Freight Share per Corridor
The freight volume conditions of the major border are indicated in the table below.
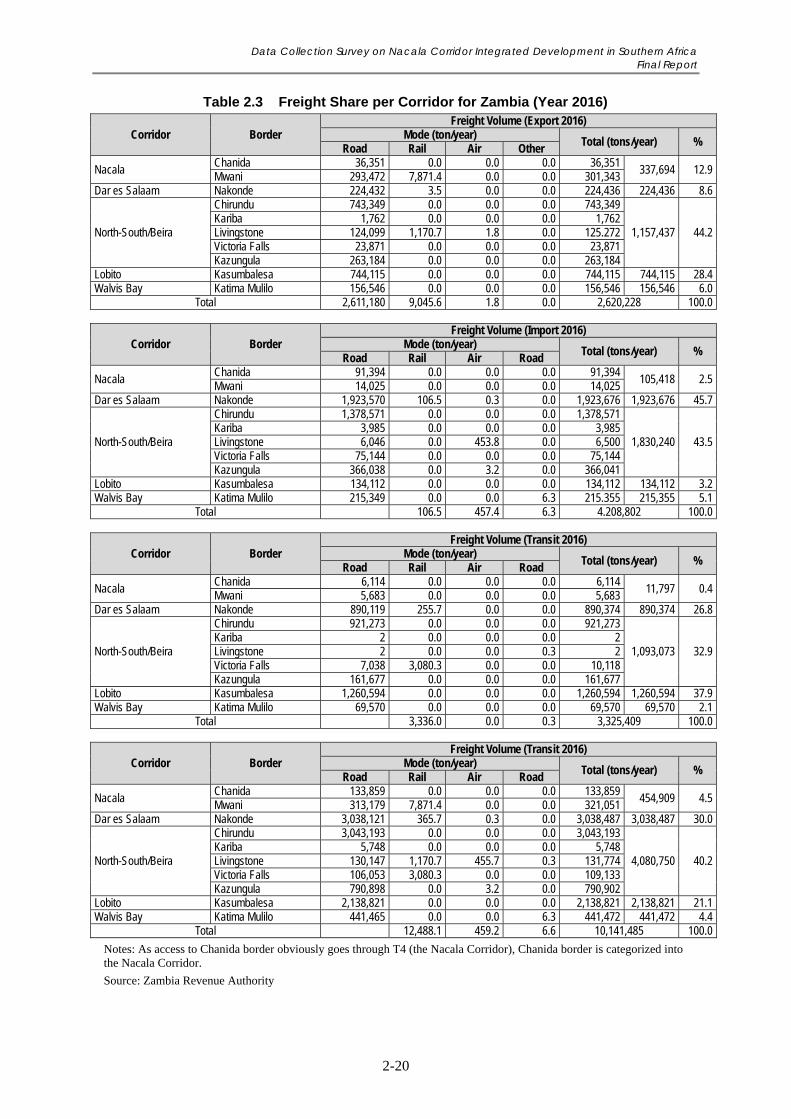
Data Collection Survey on Nacala Corridor Integrated Development in Southern Africa Final Report
2-20
Table 2.3 Freight Share per Corridor for Zambia (Year 2016)
Corridor Border Freight Volume (Export 2016)
Mode (ton/year) Total (tons/year) %
Road Rail Air Other
Nacala Chanida 36,351 0.0 0.0 0.0 36,351
337,694 12.9 Mwani 293,472 7,871.4 0.0 0.0 301,343
Dar es Salaam Nakonde 224,432 3.5 0.0 0.0 224,436 224,436 8.6
North-South/Beira
Chirundu 743,349 0.0 0.0 0.0 743,349
1,157,437 44.2 Kariba 1,762 0.0 0.0 0.0 1,762 Livingstone 124,099 1,170.7 1.8 0.0 125.272 Victoria Falls 23,871 0.0 0.0 0.0 23,871 Kazungula 263,184 0.0 0.0 0.0 263,184
Lobito Kasumbalesa 744,115 0.0 0.0 0.0 744,115 744,115 28.4 Walvis Bay Katima Mulilo 156,546 0.0 0.0 0.0 156,546 156,546 6.0
Total 2,611,180 9,045.6 1.8 0.0 2,620,228 100.0
Corridor Border Freight Volume (Import 2016)
Mode (ton/year) Total (tons/year) %
Road Rail Air Road
Nacala Chanida 91,394 0.0 0.0 0.0 91,394
105,418 2.5 Mwani 14,025 0.0 0.0 0.0 14,025
Dar es Salaam Nakonde 1,923,570 106.5 0.3 0.0 1,923,676 1,923,676 45.7
North-South/Beira
Chirundu 1,378,571 0.0 0.0 0.0 1,378,571
1,830,240 43.5 Kariba 3,985 0.0 0.0 0.0 3,985 Livingstone 6,046 0.0 453.8 0.0 6,500 Victoria Falls 75,144 0.0 0.0 0.0 75,144 Kazungula 366,038 0.0 3.2 0.0 366,041
Lobito Kasumbalesa 134,112 0.0 0.0 0.0 134,112 134,112 3.2 Walvis Bay Katima Mulilo 215,349 0.0 0.0 6.3 215.355 215,355 5.1
Total 106.5 457.4 6.3 4.208,802 100.0
Corridor Border Freight Volume (Transit 2016)
Mode (ton/year) Total (tons/year) %
Road Rail Air Road
Nacala Chanida 6,114 0.0 0.0 0.0 6,114
11,797 0.4 Mwani 5,683 0.0 0.0 0.0 5,683
Dar es Salaam Nakonde 890,119 255.7 0.0 0.0 890,374 890,374 26.8
North-South/Beira
Chirundu 921,273 0.0 0.0 0.0 921,273
1,093,073 32.9 Kariba 2 0.0 0.0 0.0 2 Livingstone 2 0.0 0.0 0.3 2 Victoria Falls 7,038 3,080.3 0.0 0.0 10,118 Kazungula 161,677 0.0 0.0 0.0 161,677
Lobito Kasumbalesa 1,260,594 0.0 0.0 0.0 1,260,594 1,260,594 37.9 Walvis Bay Katima Mulilo 69,570 0.0 0.0 0.0 69,570 69,570 2.1
Total 3,336.0 0.0 0.3 3,325,409 100.0
Corridor Border Freight Volume (Transit 2016)
Mode (ton/year) Total (tons/year) %
Road Rail Air Road
Nacala Chanida 133,859 0.0 0.0 0.0 133,859
454,909 4.5 Mwani 313,179 7,871.4 0.0 0.0 321,051
Dar es Salaam Nakonde 3,038,121 365.7 0.3 0.0 3,038,487 3,038,487 30.0
North-South/Beira
Chirundu 3,043,193 0.0 0.0 0.0 3,043,193
4,080,750 40.2 Kariba 5,748 0.0 0.0 0.0 5,748 Livingstone 130,147 1,170.7 455.7 0.3 131,774 Victoria Falls 106,053 3,080.3 0.0 0.0 109,133 Kazungula 790,898 0.0 3.2 0.0 790,902
Lobito Kasumbalesa 2,138,821 0.0 0.0 0.0 2,138,821 2,138,821 21.1 Walvis Bay Katima Mulilo 441,465 0.0 0.0 6.3 441,472 441,472 4.4
Total 12,488.1 459.2 6.6 10,141,485 100.0
Notes: As access to Chanida border obviously goes through T4 (the Nacala Corridor), Chanida border is categorized into the Nacala Corridor.
Source: Zambia Revenue Authority
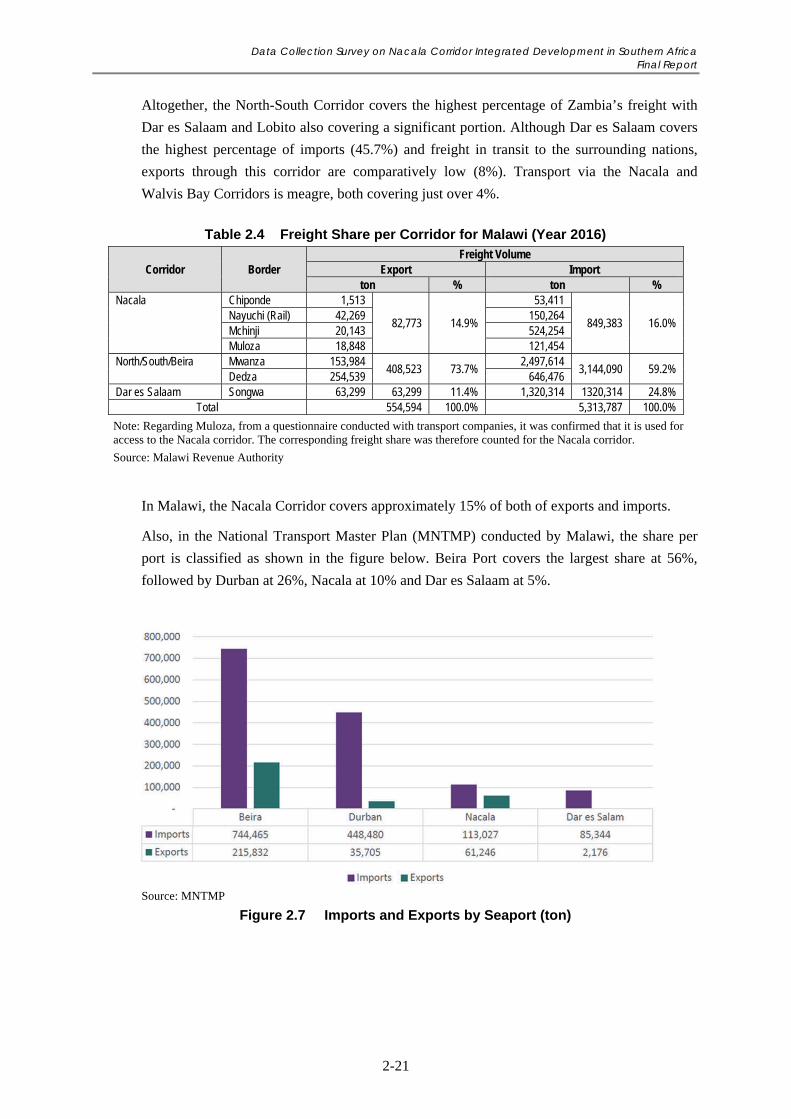
Data Collection Survey on Nacala Corridor Integrated Development in Southern Africa Final Report
2-21
Altogether, the North-South Corridor covers the highest percentage of Zambia’s freight with
Dar es Salaam and Lobito also covering a significant portion. Although Dar es Salaam covers
the highest percentage of imports (45.7%) and freight in transit to the surrounding nations,
exports through this corridor are comparatively low (8%). Transport via the Nacala and
Walvis Bay Corridors is meagre, both covering just over 4%.
Table 2.4 Freight Share per Corridor for Malawi (Year 2016)
Corridor Border Freight Volume
Export Import ton % ton %
Nacala Chiponde 1,513
82,773 14.9%
53,411
849,383 16.0% Nayuchi (Rail) 42,269 150,264 Mchinji 20,143 524,254 Muloza 18,848 121,454
North/South/Beira Mwanza 153,984 408,523 73.7%
2,497,614 3,144,090 59.2%
Dedza 254,539 646,476 Dar es Salaam Songwa 63,299 63,299 11.4% 1,320,314 1320,314 24.8%
Total 554,594 100.0% 5,313,787 100.0%
Note: Regarding Muloza, from a questionnaire conducted with transport companies, it was confirmed that it is used for access to the Nacala corridor. The corresponding freight share was therefore counted for the Nacala corridor.
Source: Malawi Revenue Authority
In Malawi, the Nacala Corridor covers approximately 15% of both of exports and imports.
Also, in the National Transport Master Plan (MNTMP) conducted by Malawi, the share per
port is classified as shown in the figure below. Beira Port covers the largest share at 56%,
followed by Durban at 26%, Nacala at 10% and Dar es Salaam at 5%.
Source: MNTMP
Figure 2.7 Imports and Exports by Seaport (ton)
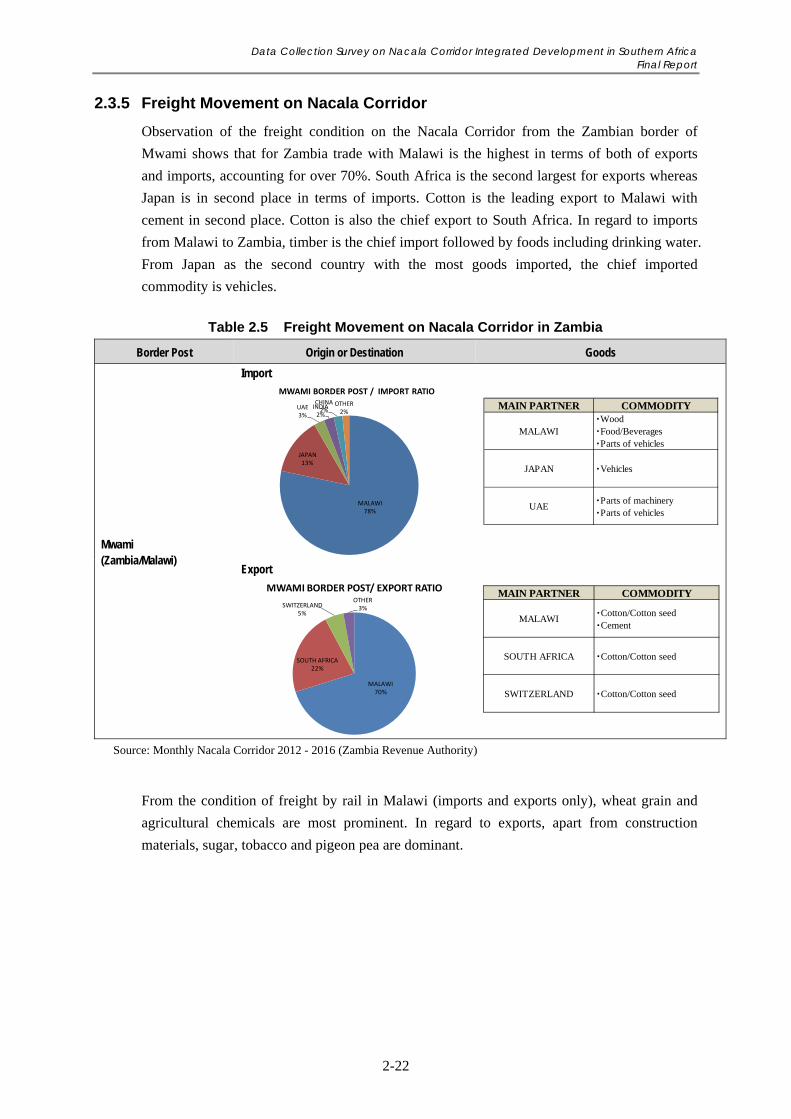
Data Collection Survey on Nacala Corridor Integrated Development in Southern Africa Final Report
2-22
2.3.5 Freight Movement on Nacala Corridor
Observation of the freight condition on the Nacala Corridor from the Zambian border of
Mwami shows that for Zambia trade with Malawi is the highest in terms of both of exports
and imports, accounting for over 70%. South Africa is the second largest for exports whereas
Japan is in second place in terms of imports. Cotton is the leading export to Malawi with
cement in second place. Cotton is also the chief export to South Africa. In regard to imports
from Malawi to Zambia, timber is the chief import followed by foods including drinking water.
From Japan as the second country with the most goods imported, the chief imported
commodity is vehicles.
Table 2.5 Freight Movement on Nacala Corridor in Zambia
Border Post Origin or Destination Goods
Mwami (Zambia/Malawi)
Import
Export
Source: Monthly Nacala Corridor 2012 - 2016 (Zambia Revenue Authority)
From the condition of freight by rail in Malawi (imports and exports only), wheat grain and
agricultural chemicals are most prominent. In regard to exports, apart from construction
materials, sugar, tobacco and pigeon pea are dominant.
MALAWI78%
JAPAN13%
UAE3%
INDIA2%
CHINA2%
OTHER2%
MWAMI BORDER POST / IMPORT RATIO
MAIN PARTNER COMMODITY
MALAWI・Wood・Food/Beverages・Parts of vehicles
JAPAN ・Vehicles
UAE・Parts of machinery・Parts of vehicles
MALAWI70%
SOUTH AFRICA22%
SWITZERLAND5%
OTHER3%
MWAMI BORDER POST/ EXPORT RATIO MAIN PARTNER COMMODITY
MALAWI・Cotton/Cotton seed・Cement
SOUTH AFRICA ・Cotton/Cotton seed
SWITZERLAND ・Cotton/Cotton seed
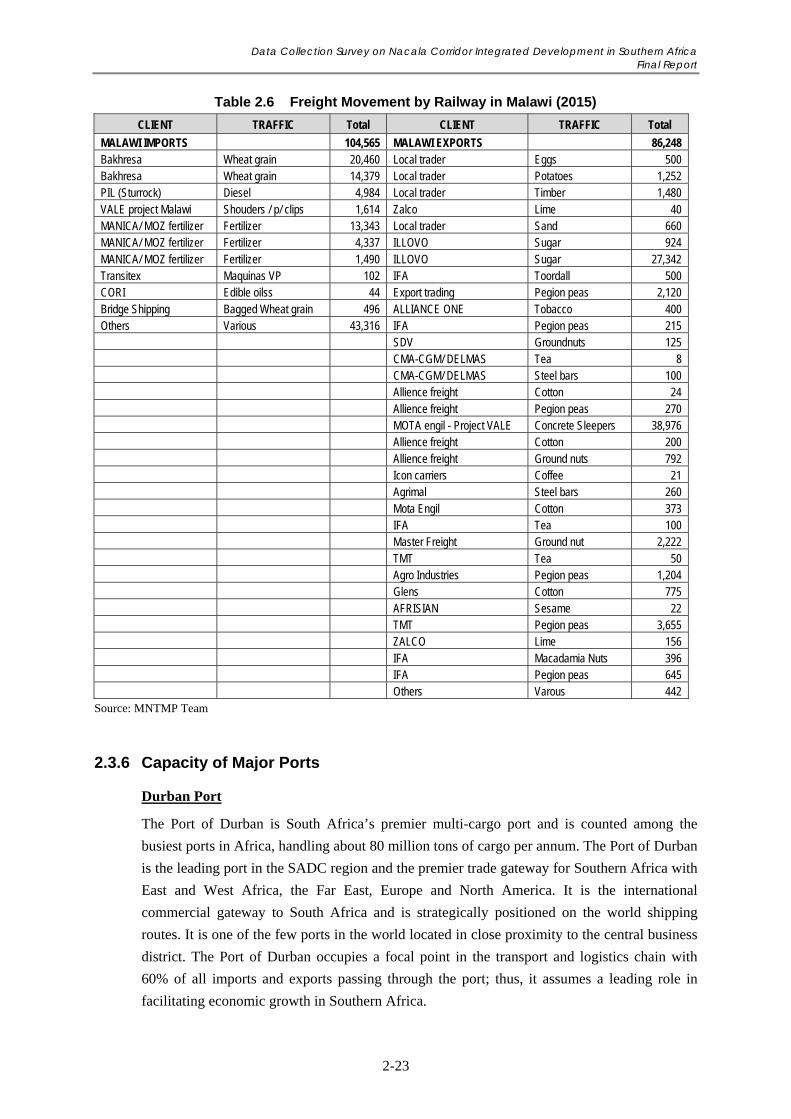
Data Collection Survey on Nacala Corridor Integrated Development in Southern Africa Final Report
2-23
Table 2.6 Freight Movement by Railway in Malawi (2015)
CLIENT TRAFFIC Total CLIENT TRAFFIC Total
MALAWI IMPORTS 104,565 MALAWI EXPORTS 86,248 Bakhresa Wheat grain 20,460 Local trader Eggs 500 Bakhresa Wheat grain 14,379 Local trader Potatoes 1,252 PIL (Sturrock) Diesel 4,984 Local trader Timber 1,480 VALE project Malawi Shouders / p/ clips 1,614 Zalco Lime 40 MANICA/ MOZ fertilizer Fertilizer 13,343 Local trader Sand 660 MANICA/ MOZ fertilizer Fertilizer 4,337 ILLOVO Sugar 924 MANICA/ MOZ fertilizer Fertilizer 1,490 ILLOVO Sugar 27,342 Transitex Maquinas VP 102 IFA Toordall 500 CORI Edible oilss 44 Export trading Pegion peas 2,120 Bridge Shipping Bagged Wheat grain 496 ALLIANCE ONE Tobacco 400 Others Various 43,316 IFA Pegion peas 215 SDV Groundnuts 125 CMA-CGM/ DELMAS Tea 8 CMA-CGM/ DELMAS Steel bars 100 Allience freight Cotton 24 Allience freight Pegion peas 270 MOTA engil - Project VALE Concrete Sleepers 38,976 Allience freight Cotton 200 Allience freight Ground nuts 792 Icon carriers Coffee 21 Agrimal Steel bars 260 Mota Engil Cotton 373 IFA Tea 100 Master Freight Ground nut 2,222 TMT Tea 50 Agro Industries Pegion peas 1,204 Glens Cotton 775 AFRISIAN Sesame 22 TMT Pegion peas 3,655 ZALCO Lime 156 IFA Macadamia Nuts 396 IFA Pegion peas 645 Others Varous 442
Source: MNTMP Team
2.3.6 Capacity of Major Ports
Durban Port
The Port of Durban is South Africa’s premier multi-cargo port and is counted among the
busiest ports in Africa, handling about 80 million tons of cargo per annum. The Port of Durban
is the leading port in the SADC region and the premier trade gateway for Southern Africa with
East and West Africa, the Far East, Europe and North America. It is the international
commercial gateway to South Africa and is strategically positioned on the world shipping
routes. It is one of the few ports in the world located in close proximity to the central business
district. The Port of Durban occupies a focal point in the transport and logistics chain with
60% of all imports and exports passing through the port; thus, it assumes a leading role in
facilitating economic growth in Southern Africa.
Data Collection Survey on Nacala Corridor Integrated Development in Southern Africa Final Report
2-24
Beira Port
The Port of Beira lies on the northern shores of the Mozambique Channel off the Indian Ocean
at the mouth of the Pungoe River in Sofala Province. Centrally located on Mozambique’s
eastern shores, the Port of Beira is an important trade and transportation centre for Central
African products and coastal goods. Railways from Zimbabwe, DRC, Zambia, and Malawi
end in the Port of Beira, and it serves as the main port for those inland nations.
Nacala Port
The Port of Nacala was granted to Corridor de Desenvolvimento de Norte (CDN) and recently
Vale, a Brazilian mining company. Nacala is one of the deepest natural ports in Africa. It is
certainly one of the best natural harbours in Eastern Africa. Nacala serves the Province of
Nampula and would be the main gateway to Malawi. However, due to underdeveloped
infrastructure in track, rolling stock and equipment, the Port is underutilised in providing
transport services of high international standard.
Mtwara Port
Mtwara Port is located at about 580 km southward from Dar es Salaam, and was initially
developed as the base for the export of groundnuts in the 1950s. In terms of the scale of cargo
handling volume, Mtwara Port is currently third after Dar es Salaam and Tanga Ports.
However, its location inside the Mikindani Bay is advantageous and provides potential over
the other two ports as it lies in a naturally protected harbour by the overhanging peninsular.
Dar es Salaam Port
The Port of Dar es Salaam is Tanzania’s major port in Dar es Salaam, which is the centre for
industry, the largest city, and the seat of government. Located on the shores of eastern Africa
off the Indian Ocean, the Port of Dar es Salaam is about 41 nautical miles south-southeast of
the Port of Zanzibar and some 170 nautical miles south of Kenya’s Port of Mombasa.
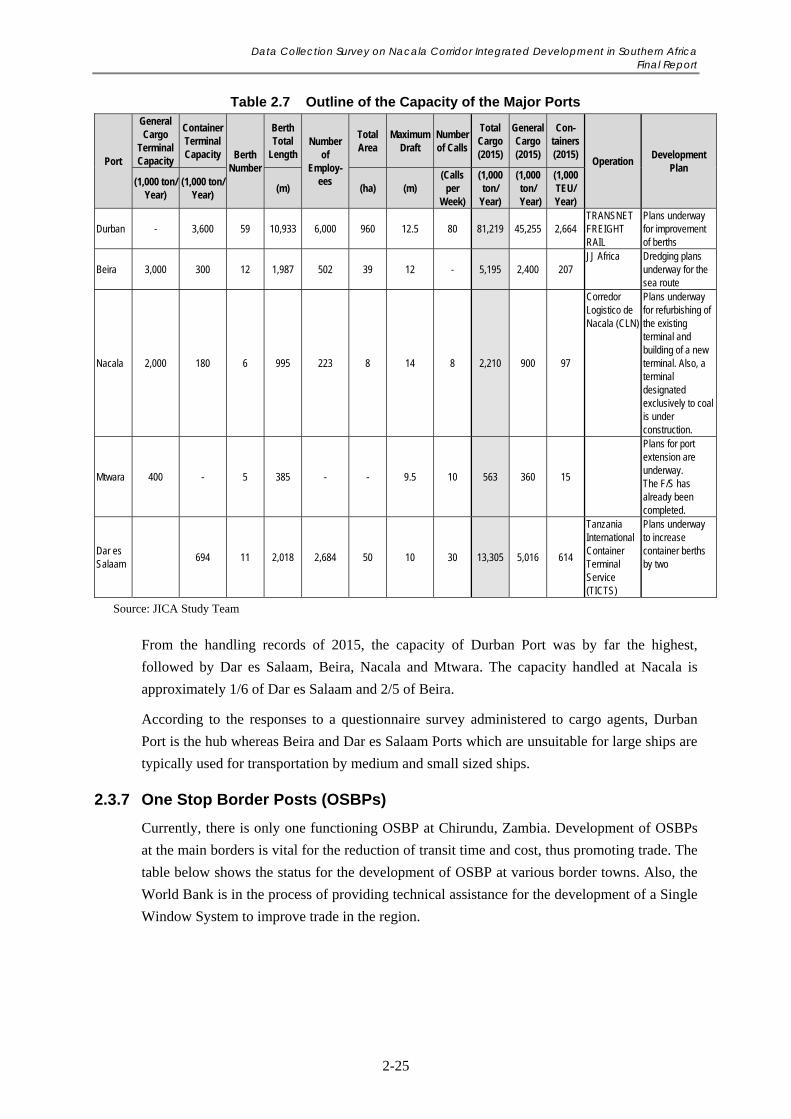
Data Collection Survey on Nacala Corridor Integrated Development in Southern Africa Final Report
2-25
Table 2.7 Outline of the Capacity of the Major Ports
Port
General Cargo
Terminal Capacity
Container Terminal Capacity Berth
Number
Berth Total
Length Number
of Employ-
ees
Total Area
Maximum Draft
Number of Calls
Total Cargo (2015)
General Cargo (2015)
Con- tainers (2015)
Operation Development
Plan (1,000 ton/
Year) (1,000 ton/
Year) (m) (ha) (m)
(Calls per
Week)
(1,000 ton/
Year)
(1,000 ton/
Year)
(1,000 TEU/ Year)
Durban - 3,600 59 10,933 6,000 960 12.5 80 81,219 45,255 2,664 TRANSNET FREIGHT RAIL
Plans underway for improvement of berths
Beira 3,000 300 12 1,987 502 39 12 - 5,195 2,400 207 JJ Africa Dredging plans
underway for the sea route
Nacala 2,000 180 6 995 223 8 14 8 2,210 900 97
Corredor Logistico de Nacala (CLN)
Plans underway for refurbishing of the existing terminal and building of a new terminal. Also, a terminal designated exclusively to coal is under construction.
Mtwara 400 - 5 385 - - 9.5 10 563 360 15
Plans for port extension are underway. The F/S has already been completed.
Dar es Salaam
694 11 2,018 2,684 50 10 30 13,305 5,016 614
Tanzania International Container Terminal Service (TICTS)
Plans underway to increase container berths by two
Source: JICA Study Team
From the handling records of 2015, the capacity of Durban Port was by far the highest,
followed by Dar es Salaam, Beira, Nacala and Mtwara. The capacity handled at Nacala is
approximately 1/6 of Dar es Salaam and 2/5 of Beira.
According to the responses to a questionnaire survey administered to cargo agents, Durban
Port is the hub whereas Beira and Dar es Salaam Ports which are unsuitable for large ships are
typically used for transportation by medium and small sized ships.
2.3.7 One Stop Border Posts (OSBPs)
Currently, there is only one functioning OSBP at Chirundu, Zambia. Development of OSBPs
at the main borders is vital for the reduction of transit time and cost, thus promoting trade. The
table below shows the status for the development of OSBP at various border towns. Also, the
World Bank is in the process of providing technical assistance for the development of a Single
Window System to improve trade in the region.
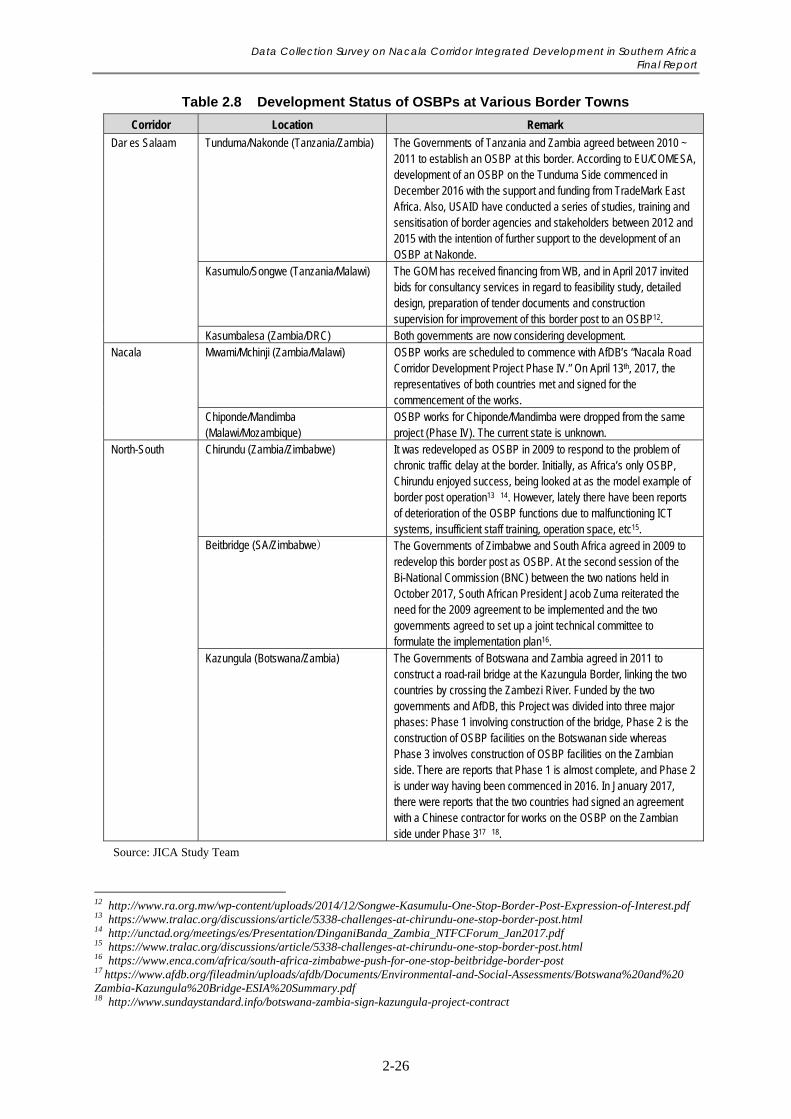
Data Collection Survey on Nacala Corridor Integrated Development in Southern Africa Final Report
2-26
Table 2.8 Development Status of OSBPs at Various Border Towns
Corridor Location Remark
Dar es Salaam Tunduma/Nakonde (Tanzania/Zambia) The Governments of Tanzania and Zambia agreed between 2010 ~ 2011 to establish an OSBP at this border. According to EU/COMESA, development of an OSBP on the Tunduma Side commenced in December 2016 with the support and funding from TradeMark East Africa. Also, USAID have conducted a series of studies, training and sensitisation of border agencies and stakeholders between 2012 and 2015 with the intention of further support to the development of an OSBP at Nakonde.
Kasumulo/Songwe (Tanzania/Malawi) The GOM has received financing from WB, and in April 2017 invited bids for consultancy services in regard to feasibility study, detailed design, preparation of tender documents and construction supervision for improvement of this border post to an OSBP12.
Kasumbalesa (Zambia/DRC) Both governments are now considering development. Nacala Mwami/Mchinji (Zambia/Malawi) OSBP works are scheduled to commence with AfDB’s “Nacala Road
Corridor Development Project Phase IV.” On April 13th, 2017, the representatives of both countries met and signed for the commencement of the works.
Chiponde/Mandimba (Malawi/Mozambique)
OSBP works for Chiponde/Mandimba were dropped from the same project (Phase IV). The current state is unknown.
North-South Chirundu (Zambia/Zimbabwe) It was redeveloped as OSBP in 2009 to respond to the problem of chronic traffic delay at the border. Initially, as Africa’s only OSBP, Chirundu enjoyed success, being looked at as the model example of border post operation13 14. However, lately there have been reports of deterioration of the OSBP functions due to malfunctioning ICT systems, insufficient staff training, operation space, etc15.
Beitbridge (SA/Zimbabwe) The Governments of Zimbabwe and South Africa agreed in 2009 to redevelop this border post as OSBP. At the second session of the Bi-National Commission (BNC) between the two nations held in October 2017, South African President Jacob Zuma reiterated the need for the 2009 agreement to be implemented and the two governments agreed to set up a joint technical committee to formulate the implementation plan16.
Kazungula (Botswana/Zambia) The Governments of Botswana and Zambia agreed in 2011 to construct a road-rail bridge at the Kazungula Border, linking the two countries by crossing the Zambezi River. Funded by the two governments and AfDB, this Project was divided into three major phases: Phase 1 involving construction of the bridge, Phase 2 is the construction of OSBP facilities on the Botswanan side whereas Phase 3 involves construction of OSBP facilities on the Zambian side. There are reports that Phase 1 is almost complete, and Phase 2 is under way having been commenced in 2016. In January 2017, there were reports that the two countries had signed an agreement with a Chinese contractor for works on the OSBP on the Zambian side under Phase 317 18.
Source: JICA Study Team
12 http://www.ra.org.mw/wp-content/uploads/2014/12/Songwe-Kasumulu-One-Stop-Border-Post-Expression-of-Interest.pdf 13 https://www.tralac.org/discussions/article/5338-challenges-at-chirundu-one-stop-border-post.html 14 http://unctad.org/meetings/es/Presentation/DinganiBanda_Zambia_NTFCForum_Jan2017.pdf 15 https://www.tralac.org/discussions/article/5338-challenges-at-chirundu-one-stop-border-post.html 16 https://www.enca.com/africa/south-africa-zimbabwe-push-for-one-stop-beitbridge-border-post 17 https://www.afdb.org/fileadmin/uploads/afdb/Documents/Environmental-and-Social-Assessments/Botswana%20and%20Zambia-Kazungula%20Bridge-ESIA%20Summary.pdf 18 http://www.sundaystandard.info/botswana-zambia-sign-kazungula-project-contract
Data Collection Survey on Nacala Corridor Integrated Development in Southern Africa Final Report
2-27
2.3.8 Transit Time and Cost
The table below shows the times and costs of transit to the major towns in Zambia and Malawi
from the major ports of Durban, Beira, Nacala, Mtwara and Dar es Salaam.
In regard to transit time, although Zambia’s Lusaka and Ndola lie in Durban Port’s sphere of
influence, Chipata and Malawi’s Blantyre lie in Beira Port’s whereas Lilongwe lies in both
Beira and Nacala Port’s sphere of influence. Comparison of the costs of transportation shows
that, although Chipata, Lilongwe and Blantyre lie in Nacala Port’s sphere of influence,
currently there is little reliability on railway transportation and the rate of use is low. In order
to reduce the transportation cost, which is a challenge faced by both countries, it is important
that the reliability of railways is improved and the transportation mode is shifted from road to
railway.
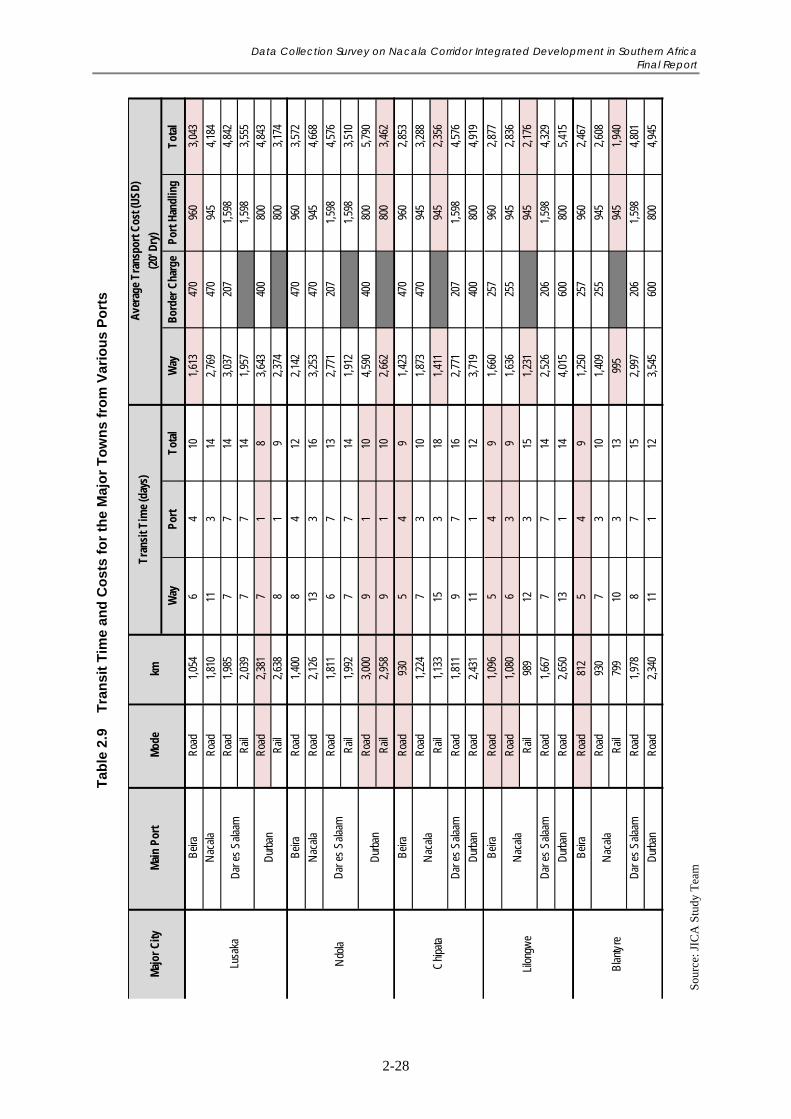
Data Collection Survey on Nacala Corridor Integrated Development in Southern Africa Final Report
2-28
Way
Por
tT
otal
Way
Bor
der
Cha
rge
Por
t Han
dlin
gT
otal
Bei
raR
oad
1,05
46
410
1,61
347
096
03,
043
Roa
d1,
810
113
142,
769
470
945
4,18
4R
oad
1,98
57
714
3,03
720
71,
598
4,84
2R
ail
2,03
97
714
1,95
71,
598
3,55
5R
oad
2,38
17
18
3,64
340
080
04,
843
Rai
l2,
638
81
92,
374
800
3,17
4
Bei
raR
oad
1,40
08
412
2,14
247
096
03,
572
Nac
ala
Roa
d2,
126
133
163,
253
470
945
4,66
8
Roa
d1,
811
67
132,
771
207
1,59
84,
576
Rai
l1,
992
77
141,
912
1,59
83,
510
Roa
d3,
000
91
104,
590
400
800
5,79
0
Rai
l2,
958
91
102,
662
800
3,46
2
Bei
raR
oad
930
54
91,
423
470
960
2,85
3
Roa
d1,
224
73
101,
873
470
945
3,28
8
Rai
l1,
133
153
181,
411
945
2,35
6
Dar
es
Sal
aam
Roa
d1,
811
97
162,
771
207
1,59
84,
576
Dur
ban
Roa
d2,
431
111
123,
719
400
800
4,91
9
Bei
raR
oad
1,09
65
49
1,66
025
796
02,
877
Roa
d1,
080
63
91,
636
255
945
2,83
6
Rai
l98
912
315
1,23
194
52,
176
Dar
es
Sal
aam
Roa
d1,
667
77
142,
526
206
1,59
84,
329
Dur
ban
Roa
d2,
650
131
144,
015
600
800
5,41
5
Bei
raR
oad
812
54
91,
250
257
960
2,46
7
Roa
d93
07
310
1,40
925
594
52,
608
Rai
l79
910
313
995
945
1,94
0
Dar
es
Sal
aam
Roa
d1,
978
87
152,
997
206
1,59
84,
801
Dur
ban
Roa
d2,
340
111
123,
545
600
800
4,94
5
Ave
rage
Tra
nspo
rt C
ost (
US
D)
(20'
Dry
)
Lilo
ngw
eN
acal
a
Tra
nsit
Tim
e (d
ays)
Lusa
kaD
ar e
s S
alaa
m
Dur
ban
Maj
or C
ityM
ain
Por
tM
ode
km
Ndo
laD
ar e
s S
alaa
m
Dur
ban
Nac
ala
Bla
ntyr
eN
acal
a
Chi
pata
Nac
ala
Tab
le 2
.9
Tra
nsi
t T
ime
and
Co
sts
fo
r th
e M
ajo
r T
ow
ns
fro
m V
ario
us
Po
rts
Sou
rce:
JIC
A S
tudy
Tea
m
Data Collection Survey on Nacala Corridor Integrated Development in Southern Africa Final Report
2-29
2.4 Comprehensive Evaluation of the Corridors
In this chapter, the current status of major transport corridors and ports were analysed, and the
comparison of the corridors from the viewpoints of time and transport cost from major cities
and its port are studied. In the following section, the results of hearing survey are summarised
aiming to understand the advantages and disadvantages of the corridors recognised by users.
Then, comprehensive evaluation of corridors is described.
2.4.1 Hearing Survey Results on Nacala Corridor
As can be seen from the above data, the rate of use of the Nacala Corridor for the flow of
goods to/from outside the African region is low. To understand the cause for this, a survey was
conducted with local transportation and trade companies in Zambia and Malawi. The main
views that arose are summarised below:
Views Obtained from Zambia
Top 4 most used harbours: 1. Dar es Salaam, 2. Durban, 3. Beira, 4. Walvis Bay
Market condition: Transportation routes are decided from observing the situations of the
transportation costs and routes.
Reason why the Nacala Corridor is currently not used: Unknown to cargo owners/ (Other
companies use the Ports of Dar es Salaam and Durban mainly. Nacala is unknown, or the
logistics firms have no offices there).
The scale of Nacala Port is small.
Challenges: 1) the railway system is inefficient and therefore unreliable, 2) the need for
cargo equipment infrastructure such as dry ports and containers was raised. Currently
Nacala Port is not being sufficiently used and these challenges will have to be overcome in
order to enable full operation of the Port.
For the utilisation of Nacala Port, improvement of railway inefficiency is necessary.
Improvement of efficiency includes shortening of transportation time, punctuality, and
smooth customs procedures.
Introduction of OSBP is not a serious problem. Large transportation companies beforehand
send documents to the border and only physical scanning is conducted at the border, which
does not take much time. More than OSBP, ICT is necessary.
In regard to the transportation of copper, South African transporters’ system is already
strongly established and it is difficult to alter that system.
Views Obtained from Malawi
Never used the Nacala Corridor at all. There has been no request by the owners of goods.
The road condition in Mozambique is poor. (There are unpaved sections)
Steep sections at the border sections are difficult for passage with large vehicles. Therefore,
even though it’s farther, the relatively flatter Beira Corridor is preferred. (The mountain
road between the border and the Mangochi Bridge is difficult for the passage of large
vehicles, and dangerous. Also, the road slope over the Mangochi Bridge often presents a
barrier for the large freight vehicles.)
Data Collection Survey on Nacala Corridor Integrated Development in Southern Africa Final Report
2-30
Compared to the Beira Corridor, management at the Nacala Corridor is poor. (Poor
performance)
The capacity and facilities of the main container terminals (Blantyre for example) are
insufficient.
The warehousing capacity around the Nacala Corridor is small. (They are not container
terminals).
Operation is impossible owing to the company’s not having an office at Nacala Port. If the
Nacala Corridor were to be used, installation of an office would be necessary.
The main port used is the Port of Beira (about 80% of all freight). The road condition for
the Beira Corridor is good, furnished even with facilities for bulk vessels. On the other
hand, Nacala Port is around 10% (the main form of transport to the port is the rail). The
Nacala Corridor has not been sufficiently utilised so far due to the shortage of locomotives
and freight vehicles as well as the underdeveloped railway operation system. The number
of waiting days is about one week for Nacala Port (and maximum three days for Beira).
Access to Nacala Port by road is through M2 and NR7 on the Mozambican side. NR7 is
unpaved for a stretch of about 60km from the border.
Challenges with Railway Transportation
The capacity of Nacala Railway is small.
The capacity and facilities of main container terminals (Blantyre, for example) are
insufficient.
It’s inefficient and unreliable (locomotives are broken and unusable, it’s slow. ※Bolloré
has own hundreds of trucks).
Although the railway should be cheaper than transportation by road, the cost per tonne is
approximately 5 to 10 dollars, similar to the road. From the cost point of view, there is
nothing to attract cargo owners from using roads to the railway.
Primarily, if it can be operated efficiently, rail should be substantially cheaper than road
transportation. For example, whereas about 30 tonnes can be transported per vehicle with
transportation by truck, by rail a 40 ft container can carry 40 wagons of 26 to 28 tonnes
each; making it possible to transport over 1,000 tonnes.
(In response to the inquiry on whether ordinary freight vehicles can use the Nacala Corridor
rail line developed by Vale), the business community has not been duly informed about this
development and information on the conditions of use and other details has not been
sufficiently shared. CEAR (Central East African. Railways Company) need to conduct
public relations activities.
Reinforcement of the organisational structure and the improvement of efficiency are urgent
challenges for CEAR. There are a shortage of locomotives and freight vehicles as well as
the low service level from the deterioration of the tracks. Rebuilding work is necessary.
Malawi continues to be in need of road improvement and must utilise the railway
infrastructure already in place. Malawi has not fully utilised the railway to Lake Malawi,
which is a resource they already possess, which is wasteful. Primarily the railway is a
cheaper transport mean than roads and methods of utilisation should be examined.
Data Collection Survey on Nacala Corridor Integrated Development in Southern Africa Final Report
2-31
Expectations for the Nacala Corridor
Due to the problems of poor security around Beira Port, traffic congestion, expensive
warehousing, etc., increased use of Nacala Port is desired.
From the geographical conditions, dredging is continuously required at Beira Port. It is
used as a feeder port (with Durban as the main port).
Nacala Port, as a deep East African port can be an alternative to Dar es Salaam and Durban
Ports.
The merits include, 1) compared to other ports, access to Nacala Port involves the shortest
distance, and 2) Nacala is a deep port and use of large vessels is possible. Also, there is a lot
of trade between Zambia and China, and Nacala enjoys a geographically conducive
location to connection to East Asia.
Although currently it is not being used, development of dry ports can be a milestone
towards the use of the Port. If dry ports are developed, offices can be opening up for the
preparations for the use of the Nacala Corridor. Other transportation companies have also
shown interest in development of dry ports.
If the Nacala Corridor can operate fully, a spin off effect in the eastern parts of Zambia can
be expected.
Nacala Port is largely regarded as the “port for coal exportation”. Being a deep port,
shifting from other ports may be expected. Illovo, a sugar company in Malawi, has recently
started using Nacala Port.
2.4.2 Comprehensive Analysis on Transport Corridors Related to Zambia and Malawi
(1) Nacala Railway Corridor and Nacala Port
1) Transit Time and Cost
Under the present conditions, the Nacala Corridor has an advantage over other transport
corridors in terms of transport cost when transporting goods from Chipata, Lilongwe and
Blantyre to Nacala Port. However, there are no advantages when transporting goods from
Lusaka and Ndola in Zambia. After upgrading the railway from Nkaya to Mchinji, as well as
improvement of the operation capacity of CEAR and construction of a multi-modal dry port in
Chipata, the transport cost from Lusaka to Nacala Port through the Nacala Corridor will
become the cheapest among the other corridors.
On the other hand, the current challenge of the Nacala Corridor is transport time. At present,
the time required for the transport of goods from Chipata and Lilongwe to Nacala Port by
Nacala Railway is the longest among all the corridors. After the upgrading of the railway and
installation of a dry port in Chipata, the transport time from Chipata, Lilongwe and Blantyre to
the Port will become the shortest. However, despite the longest distance to its port, the
North-South Corridor will maintain the shortest transport time when transporting goods from
Lusaka. This is due to the improved roads which allow high speed transport by truck and the
excellent efficiency of the port operation.
Data Collection Survey on Nacala Corridor Integrated Development in Southern Africa Final Report
2-32
2) Conditions and Potentials of the Port
Being one of the deepest natural ports in Africa, Nacala Port has an advantage of being able to
accept large scale vessels. In addition, the Port currently has a relatively short transit time
because it is less crowded than others.
On the other hand, the Port has big challenges in terms of its facilities. The infrastructure
related to the railway is not developed well, and warehouses and handling facilities are also
not sufficient. Because of these reasons, only a few freight service companies are located in
the port, which further leads to the limited number of vessels arriving in the port.
3) Security, Safety and Other Related Conditions
With difficulties in securing financial sources for maintenance of their roads, the modal shift
to railway has become an urgent challenge in Zambia and Malawi. The Nacala Railway
Corridor, with the upgraded railway from the port to Nkaya in Malawi and with the expected
upgrading for the remaining section connecting to Chipata in Zambia which has already been
committed by a private group, would provide a solution to this challenge. Moreover, a new
line connecting Chipata and Serenje is also expected to be developed in the long term.
On the other hand, there are still many challenges as follows;
Nacala Port is not well known among carriers, but it is recognised as a port mainly for coal.
Security in railway transport is weak due to the lack of a tracking system.
Road transport with large trucks is difficult because there are unpaved roads in and around
the borders of Malawi and Mozambique.
(2) Beira Corridor and Beira Port
1) Transit Time and Cost
The Beira Road Corridor has an advantage in terms of transport time when transporting goods
from Chipata, Lilongwe and Blantyre to Nacala Port. The transport time of the Beira Road
Corridor comes in second place when transporting goods from Lusaka and also Ndola to the
port, following the time required travelling to Durban Port through the North-South Corridor.
The transport cost of the Beira Corridor is also relatively low compared to the other transport
corridors except for that of the Nacala Railway Corridor.
2) Conditions and Potentials of the Port
The Beira Corridor connects to Zimbabwe, Zambia, Malawi and DRC with Beira Port
functioning as their trading port. Zimbabwe and DRC are large countries that import many
commodities, thus the access to these countries is an advantage of Beira Port.
The challenge of the port is its shallow depth and accretion of sand which requires periodical
dredging. Due to its characteristics, Beira Port can only be used by small and medium scale
vessels and the port is positioned as a feeder port to Durban Port. If transport time to Durban is
counted in the total transport time, it will require an additional ten days.
Data Collection Survey on Nacala Corridor Integrated Development in Southern Africa Final Report
2-33
3) Security, Safety and Other Related Conditions
The roads in the Beira Corridor are comparatively flat and large trucks can pass easily.
However, safety is a large challenge in this corridor; the corridor is reported to have poor
safety and terrible traffic jams in and around Beira Port. High storage cost is also a
disadvantage of Beira Port. The safety of the corridor in Zimbabwe is also reported to be quite
inadequate.
Furthermore, the Beira Corridor Group, which was the coordinating institution facilitating
trade on the corridor, closed its operation in 2000.
(3) North – South Corridor and Durban Port
1) Transit Time and Cost
Thanks to the good road conditions and highly efficient operation of Durban Port, the
transport time from Lusaka to Durban Port through the North-South Road Corridor is the
shortest among all the transport corridors. The railway transport of the North-South Corridor
takes an additional day compared to the road transport, but the cost is cheaper; it is the same as
the lowest cost of the Beira Corridor.
The challenge of the North–South Corridor is its high cost for road transport. The cost from
Chipata, Lilongwe and Blantyre to Durban Port becomes higher than other corridors,
corresponding to its distance.
2) Conditions and Potentials of the Port
The advantage of Durban Port is its already established position as a primary hub-port in the
Southern African region. The port has a very large capacity as a container terminal with a long
berth length with a scale that is totally different from the other ports. Even yet, their handling
charge is relatively low.
The challenge of Durban Port is that they still need to expand its capacity. Therefore, the
improvement of the berths is under preparation.
3) Security, Safety and Other Related Conditions
The North-South Corridor has many advantages. One is that the transport system has already
been developed and established for the transportation of copper in Zambia. Many foreign
companies currently operating in Zambia have established various supply systems utilising
Durban Port.
Even though the North–South Corridor is an established route, the distance is long and the
transport cost by truck is relatively high. Furthermore, due to high traffic on the corridor, the
road conditions are getting worse in scattered sections.
Currently, many trucks from Durban Port pass through a small part of Zimbabwe and enter
into Zambia through the Livingstone border post or Chirundu border post. However, it is
reported that the drivers are charged with many taxes or penalties (including bribes) to pass
Data Collection Survey on Nacala Corridor Integrated Development in Southern Africa Final Report
2-34
through Zimbabwe. This situation of the corridor is expected to be improved by shifting the
route via Botswana after the construction of Kazungula Bridge in 2019.
(4) Dar es Salaam Corridor and Dar es Salaam Port
1) Transit Time and Cost
The Dar es Salaam Corridor has competitiveness in terms of cost when transporting goods
from Lusaka to Dar es Salaam Port by railway transport. However, the transport cost of the
corridor for both of rail and road is basically expensive because of its long distance and
transport time. Furthermore, handling charge in the port is also very high.
2) Conditions and Potentials of the Port
Dar es Salaam Port is relatively shallow and is used by small and medium class vessels, thus,
it is recognised as a feeder port. However, Dar es Salaam Port is located near some of the
greatest ports such as the Port of Mombasa in Kenya and the Port of Zanzibar. Therefore, it is
highly convenient for feeder transport.
The Port is already busy and its handling charge is high.
3) Security, Safety and Other Related Conditions
There is an advantage that the DCC, a coordination institution to organise the corridor
development, has been established with the support of the WB and is playing its designated
role.
(5) Viewpoints from Zambia and Malawi
1) Zambia
Since Zambia is a land-locked country, development of transport corridors and their effective
use in accordance with their purposes are essential for development of economic sectors.
At present, the North-South Corridor with Durban Port and the Dar es Salaam Corridor with
Dar es Salaam Port are Zambia’s primary corridors from the viewpoints of reliability, safety,
capacity and development of supply chains.
On the other hand, the Nacala Corridor is not yet recognised as an important corridor for
Zambia. This may be partly because the advantages of the Nacala Corridor are not felt in
Lusaka and the central areas of Zambia. It is also partly because the transport system
consisting of railways and trunk roads has not yet been improved enough. Moreover, Nacala
Port has not been functioning very well, resulting that the number of vessels arriving at Nacala
Port is not as high as the other major ports. However, it is expected that the volume of cargos
moving through the Nacala Corridor would significantly increase when it improves its
competitiveness in terms of transport cost and time between Lusaka and Nacala Port after the
completion of upgrading of the railway up to Chipata and the installation of a multi-modal dry
port there.
Data Collection Survey on Nacala Corridor Integrated Development in Southern Africa Final Report
2-35
2) Malawi
Similar to the case of Zambia, efficient and effective utilisation of transport corridors is
important for the development of Malawi’s economic sectors.
At present, they use the Beira Corridor mainly because it is easy to get access by truck and the
distance is shorter than other corridors to sea ports. The Nacala Corridor has not been used
because its road conditions are poor in Mozambique, the rail section between Mchinji and
Nkaya is not good in terms of infrastructure and operation, and related cargo facilities, such as
warehouses, have not well developed. However, thanks to the improvement of the railway up
to Nkaya from Nacala Port, Malawian cargoes have started utilising the Nacala Corridor
recently. After the completion of the expected upgrading up to Mchinji from Nkaya, more
cargos would use the Nacala Corridor.
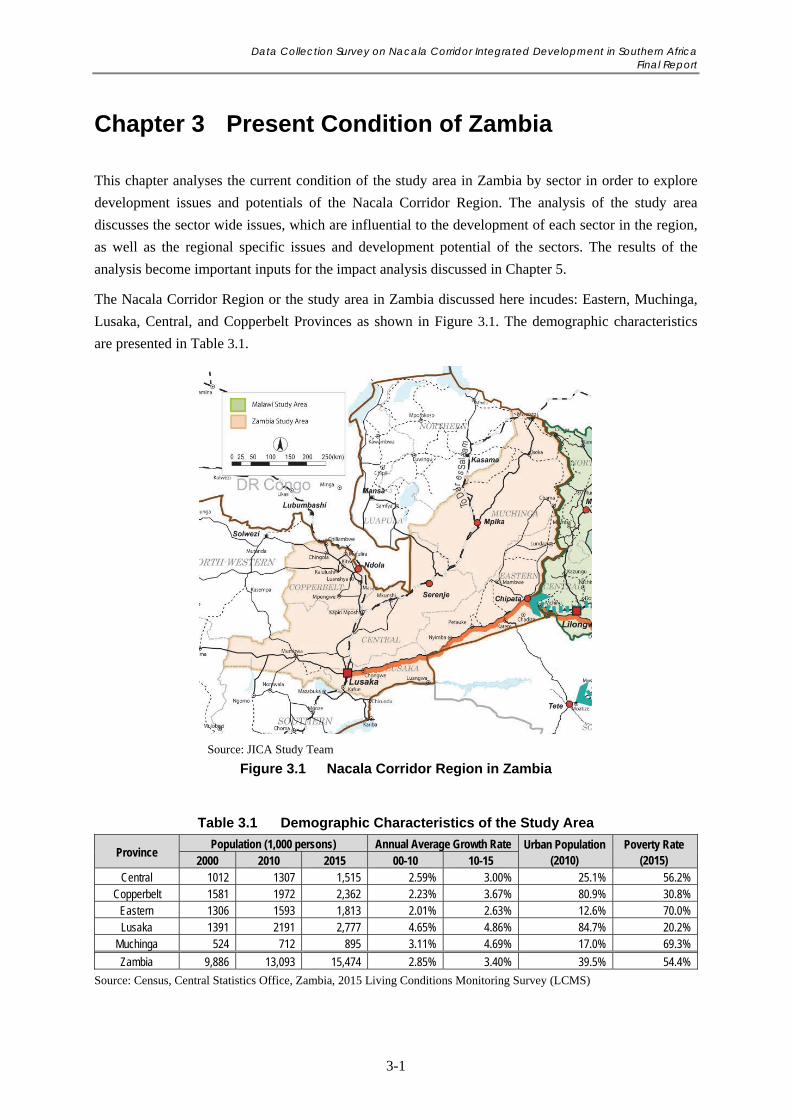
Data Collection Survey on Nacala Corridor Integrated Development in Southern Africa Final Report
3-1
Chapter 3 Present Condition of Zambia
This chapter analyses the current condition of the study area in Zambia by sector in order to explore
development issues and potentials of the Nacala Corridor Region. The analysis of the study area
discusses the sector wide issues, which are influential to the development of each sector in the region,
as well as the regional specific issues and development potential of the sectors. The results of the
analysis become important inputs for the impact analysis discussed in Chapter 5.
The Nacala Corridor Region or the study area in Zambia discussed here incudes: Eastern, Muchinga,
Lusaka, Central, and Copperbelt Provinces as shown in Figure 3.1. The demographic characteristics
are presented in Table 3.1.
Source: JICA Study Team
Figure 3.1 Nacala Corridor Region in Zambia
Table 3.1 Demographic Characteristics of the Study Area
Province Population (1,000 persons) Annual Average Growth Rate Urban Population
(2010) Poverty Rate
(2015) 2000 2010 2015 00-10 10-15 Central 1012 1307 1,515 2.59% 3.00% 25.1% 56.2%
Copperbelt 1581 1972 2,362 2.23% 3.67% 80.9% 30.8% Eastern 1306 1593 1,813 2.01% 2.63% 12.6% 70.0% Lusaka 1391 2191 2,777 4.65% 4.86% 84.7% 20.2%
Muchinga 524 712 895 3.11% 4.69% 17.0% 69.3%
Zambia 9,886 13,093 15,474 2.85% 3.40% 39.5% 54.4%
Source: Census, Central Statistics Office, Zambia, 2015 Living Conditions Monitoring Survey (LCMS)
Data Collection Survey on Nacala Corridor Integrated Development in Southern Africa Final Report
3-2
3.1 Agriculture
3.1.1 Overview of the Agriculture
Agriculture in Zambia is characterised by dual structures consisting of subsistence small scale
agriculture and large/medium scale agribusiness (commercial farming under favourable
natural condition). The sector generates approximately 10% of GDP of Zambia and provides
livelihoods for more than 70% of the population. The sector absorbs about 67% of the labour
force and remains the main source of income and employment for both females and males.
Agriculture has led to an increase in rural incomes and contributed to poverty reduction and
food and nutrition security1.
Zambia's total land area is 75 million ha (752,614 km2), of which 58% (44 million ha) is
classified as medium to high potential for agricultural production in terms of natural
conditions. Depending on the agro-ecological condition, various agriculture products are
grown such as maize, soya beans, groundnuts, wheat, cotton, tobacco, sugar cane, coffee and
horticulture crops. Livestock rearing and fisheries were complementary livelihoods next to
crop production for small scale farmers, but large scale firms stared dealing as agribusiness.
In order to enhance agriculture development to contribute to economic growth, the Second
National Agriculture Policy (SNAP) 2016-2020, a renewed policy of the National Agriculture
Policy (NAP) 2004-2015, provides a framework that will promote sustainable agricultural
diversification, agricultural commercialization, private sector participation and inclusive
agricultural growth.
The SNAP is consistent with the National Agricultural Investment Plan (NAIP) 2014-2018
under the Comprehensive Africa Agriculture Development Programme (CAADP)2 framework
and also in line with the Vision 2030, long term policy of Zambia.
3.1.2 Agriculture Condition
(1) Land Use and Availability
Land is not fully utilised for agriculture at the present, even though Zambia still has a large
expanse of vacant land. Medium-high agricultural potential land is estimated at approximately
44 million ha, 58% of Zambia land area, of which 14%, about 6 million ha, is under
cultivation. Additionally, the land with potential for irrigation is estimated at around 2.75
million ha, of which no more than 156,000 ha is developed, mostly on commercial farms for
sugar, wheat and plantation crops.
There are two types of land category and tenure system in the country; state land and
customary land, while the tenure systems are leasehold tenure and customary tenure. The
majority of state land is owned by large scale commercial farmers that cultivate over 20 ha of
1 Government of Zambia, “Second National Agricultural Policy 2016” 2 CAADP is a framework for agricultural transformation, wealth creation, food security and nutrition, economic growth and prosperity for all; Zambia CAADP focuses on six implementation areas of which agricultural marketing development and investment promotion.
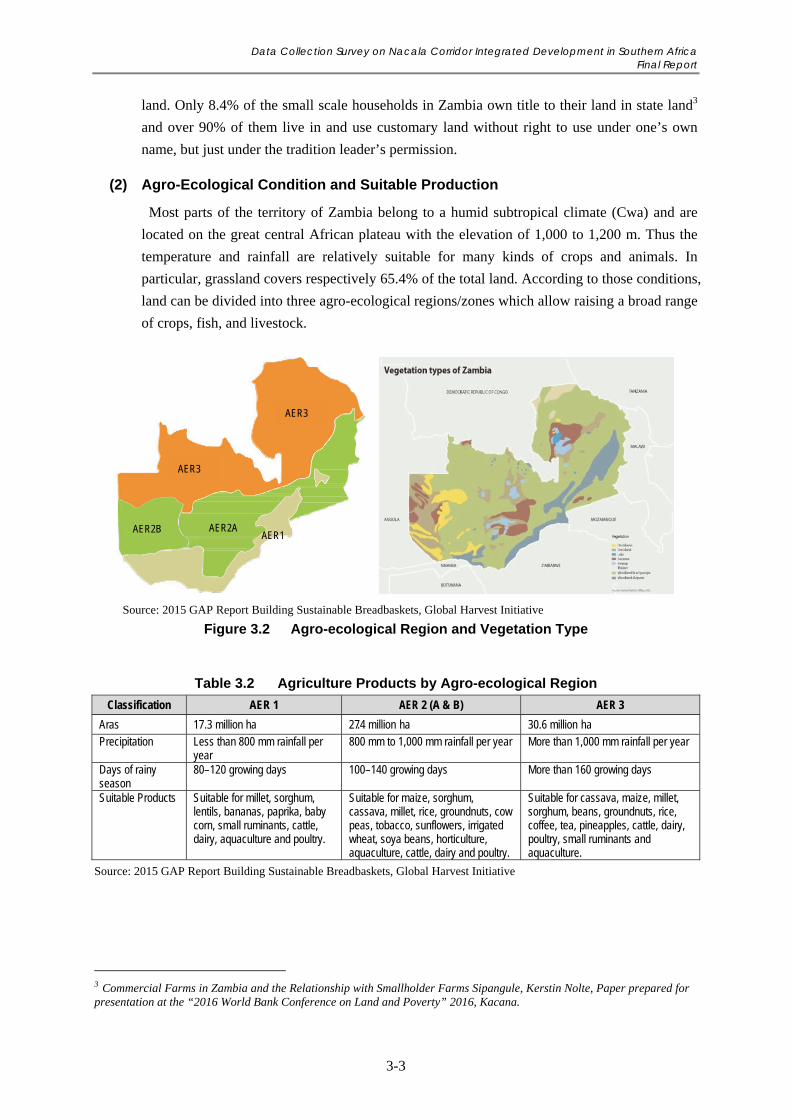
Data Collection Survey on Nacala Corridor Integrated Development in Southern Africa Final Report
3-3
land. Only 8.4% of the small scale households in Zambia own title to their land in state land3
and over 90% of them live in and use customary land without right to use under one’s own
name, but just under the tradition leader’s permission.
(2) Agro-Ecological Condition and Suitable Production
Most parts of the territory of Zambia belong to a humid subtropical climate (Cwa) and are
located on the great central African plateau with the elevation of 1,000 to 1,200 m. Thus the
temperature and rainfall are relatively suitable for many kinds of crops and animals. In
particular, grassland covers respectively 65.4% of the total land. According to those conditions,
land can be divided into three agro-ecological regions/zones which allow raising a broad range
of crops, fish, and livestock.
Source: 2015 GAP Report Building Sustainable Breadbaskets, Global Harvest Initiative
Figure 3.2 Agro-ecological Region and Vegetation Type
Table 3.2 Agriculture Products by Agro-ecological Region
Classification AER 1 AER 2 (A & B) AER 3
Aras 17.3 million ha 27.4 million ha 30.6 million ha Precipitation Less than 800 mm rainfall per
year 800 mm to 1,000 mm rainfall per year More than 1,000 mm rainfall per year
Days of rainy season
80–120 growing days 100–140 growing days More than 160 growing days
Suitable Products Suitable for millet, sorghum, lentils, bananas, paprika, baby corn, small ruminants, cattle, dairy, aquaculture and poultry.
Suitable for maize, sorghum, cassava, millet, rice, groundnuts, cow peas, tobacco, sunflowers, irrigated wheat, soya beans, horticulture, aquaculture, cattle, dairy and poultry.
Suitable for cassava, maize, millet, sorghum, beans, groundnuts, rice, coffee, tea, pineapples, cattle, dairy, poultry, small ruminants and aquaculture.
Source: 2015 GAP Report Building Sustainable Breadbaskets, Global Harvest Initiative
3 Commercial Farms in Zambia and the Relationship with Smallholder Farms Sipangule, Kerstin Nolte, Paper prepared for presentation at the “2016 World Bank Conference on Land and Poverty” 2016, Kacana.
AER1 AER2B AER2A
AER3
AER3
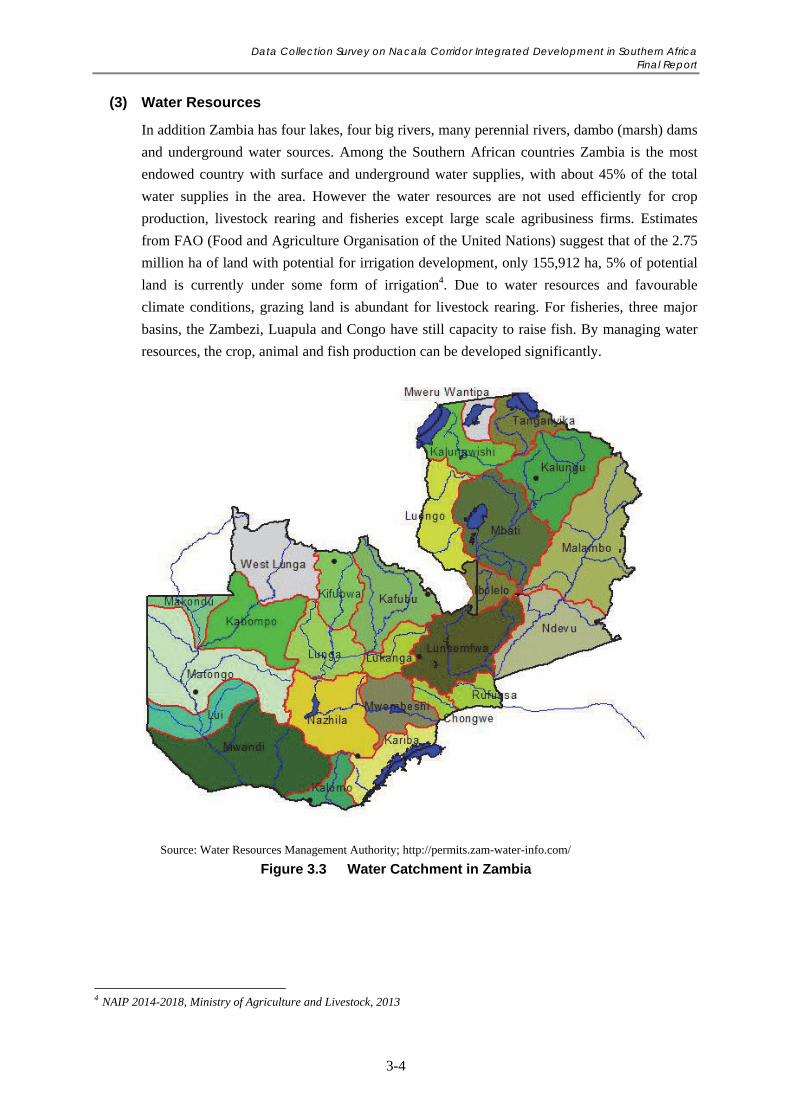
Data Collection Survey on Nacala Corridor Integrated Development in Southern Africa Final Report
3-4
(3) Water Resources
In addition Zambia has four lakes, four big rivers, many perennial rivers, dambo (marsh) dams
and underground water sources. Among the Southern African countries Zambia is the most
endowed country with surface and underground water supplies, with about 45% of the total
water supplies in the area. However the water resources are not used efficiently for crop
production, livestock rearing and fisheries except large scale agribusiness firms. Estimates
from FAO (Food and Agriculture Organisation of the United Nations) suggest that of the 2.75
million ha of land with potential for irrigation development, only 155,912 ha, 5% of potential
land is currently under some form of irrigation4. Due to water resources and favourable
climate conditions, grazing land is abundant for livestock rearing. For fisheries, three major
basins, the Zambezi, Luapula and Congo have still capacity to raise fish. By managing water
resources, the crop, animal and fish production can be developed significantly.
Source: Water Resources Management Authority; http://permits.zam-water-info.com/
Figure 3.3 Water Catchment in Zambia
4 NAIP 2014-2018, Ministry of Agriculture and Livestock, 2013
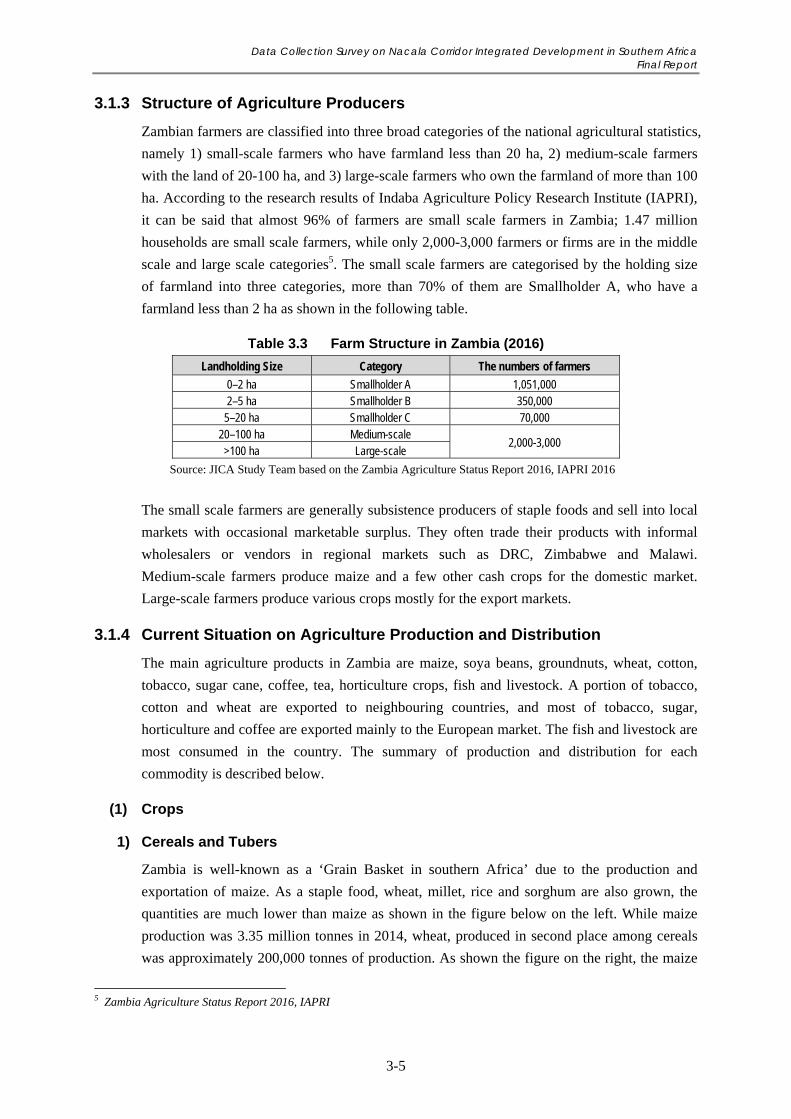
Data Collection Survey on Nacala Corridor Integrated Development in Southern Africa Final Report
3-5
3.1.3 Structure of Agriculture Producers
Zambian farmers are classified into three broad categories of the national agricultural statistics,
namely 1) small-scale farmers who have farmland less than 20 ha, 2) medium-scale farmers
with the land of 20-100 ha, and 3) large-scale farmers who own the farmland of more than 100
ha. According to the research results of Indaba Agriculture Policy Research Institute (IAPRI),
it can be said that almost 96% of farmers are small scale farmers in Zambia; 1.47 million
households are small scale farmers, while only 2,000-3,000 farmers or firms are in the middle
scale and large scale categories5. The small scale farmers are categorised by the holding size
of farmland into three categories, more than 70% of them are Smallholder A, who have a
farmland less than 2 ha as shown in the following table.
Table 3.3 Farm Structure in Zambia (2016)
Landholding Size Category The numbers of farmers
0–2 ha Smallholder A 1,051,000 2–5 ha Smallholder B 350,000
5–20 ha Smallholder C 70,000 20–100 ha Medium-scale
2,000-3,000 >100 ha Large-scale
Source: JICA Study Team based on the Zambia Agriculture Status Report 2016, IAPRI 2016
The small scale farmers are generally subsistence producers of staple foods and sell into local
markets with occasional marketable surplus. They often trade their products with informal
wholesalers or vendors in regional markets such as DRC, Zimbabwe and Malawi.
Medium-scale farmers produce maize and a few other cash crops for the domestic market.
Large-scale farmers produce various crops mostly for the export markets.
3.1.4 Current Situation on Agriculture Production and Distribution
The main agriculture products in Zambia are maize, soya beans, groundnuts, wheat, cotton,
tobacco, sugar cane, coffee, tea, horticulture crops, fish and livestock. A portion of tobacco,
cotton and wheat are exported to neighbouring countries, and most of tobacco, sugar,
horticulture and coffee are exported mainly to the European market. The fish and livestock are
most consumed in the country. The summary of production and distribution for each
commodity is described below.
(1) Crops
1) Cereals and Tubers
Zambia is well-known as a ‘Grain Basket in southern Africa’ due to the production and
exportation of maize. As a staple food, wheat, millet, rice and sorghum are also grown, the
quantities are much lower than maize as shown in the figure below on the left. While maize
production was 3.35 million tonnes in 2014, wheat, produced in second place among cereals
was approximately 200,000 tonnes of production. As shown the figure on the right, the maize
5 Zambia Agriculture Status Report 2016, IAPRI
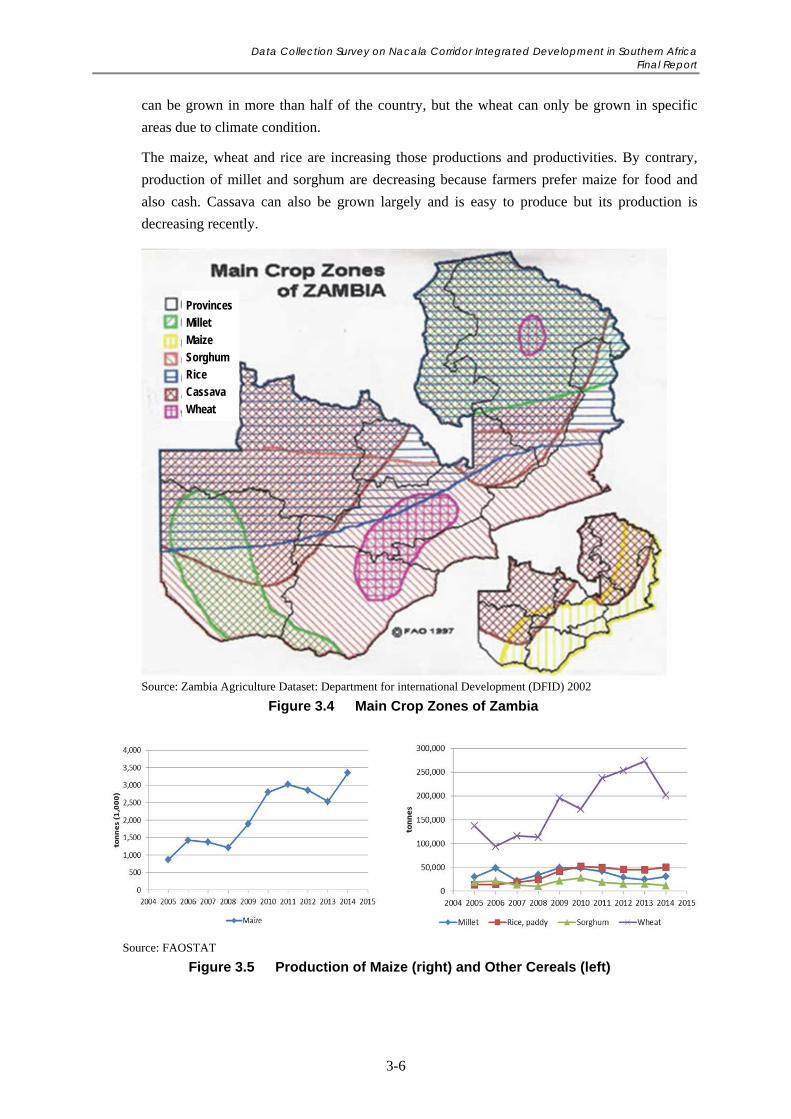
Data Collection Survey on Nacala Corridor Integrated Development in Southern Africa Final Report
3-6
can be grown in more than half of the country, but the wheat can only be grown in specific
areas due to climate condition.
The maize, wheat and rice are increasing those productions and productivities. By contrary,
production of millet and sorghum are decreasing because farmers prefer maize for food and
also cash. Cassava can also be grown largely and is easy to produce but its production is
decreasing recently.
Source: FAOSTAT
Figure 3.5 Production of Maize (right) and Other Cereals (left)
Source: Zambia Agriculture Dataset: Department for international Development (DFID) 2002
Figure 3.4 Main Crop Zones of Zambia
Provinces
Millet
Maize
Sorghum
Rice
Cassava
Wheat
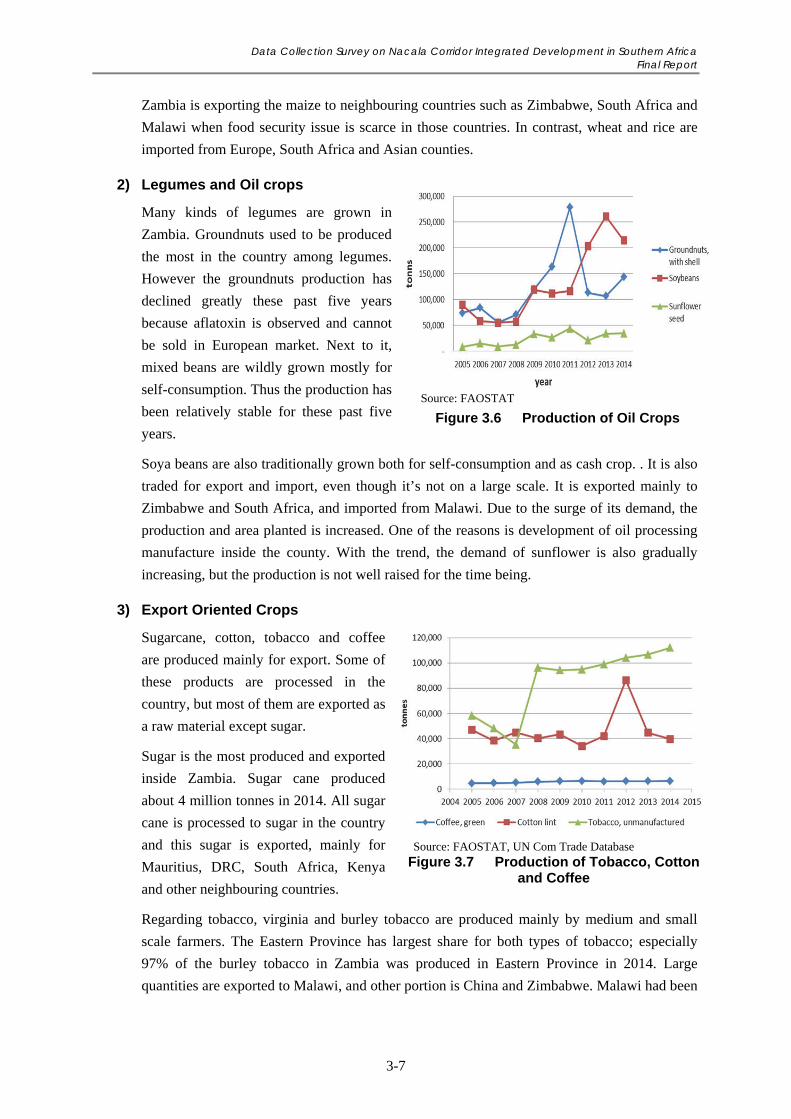
Data Collection Survey on Nacala Corridor Integrated Development in Southern Africa Final Report
3-7
Zambia is exporting the maize to neighbouring countries such as Zimbabwe, South Africa and
Malawi when food security issue is scarce in those countries. In contrast, wheat and rice are
imported from Europe, South Africa and Asian counties.
2) Legumes and Oil crops
Many kinds of legumes are grown in
Zambia. Groundnuts used to be produced
the most in the country among legumes.
However the groundnuts production has
declined greatly these past five years
because aflatoxin is observed and cannot
be sold in European market. Next to it,
mixed beans are wildly grown mostly for
self-consumption. Thus the production has
been relatively stable for these past five
years.
Soya beans are also traditionally grown both for self-consumption and as cash crop. . It is also
traded for export and import, even though it’s not on a large scale. It is exported mainly to
Zimbabwe and South Africa, and imported from Malawi. Due to the surge of its demand, the
production and area planted is increased. One of the reasons is development of oil processing
manufacture inside the county. With the trend, the demand of sunflower is also gradually
increasing, but the production is not well raised for the time being.
3) Export Oriented Crops
Sugarcane, cotton, tobacco and coffee
are produced mainly for export. Some of
these products are processed in the
country, but most of them are exported as
a raw material except sugar.
Sugar is the most produced and exported
inside Zambia. Sugar cane produced
about 4 million tonnes in 2014. All sugar
cane is processed to sugar in the country
and this sugar is exported, mainly for
Mauritius, DRC, South Africa, Kenya
and other neighbouring countries.
Regarding tobacco, virginia and burley tobacco are produced mainly by medium and small
scale farmers. The Eastern Province has largest share for both types of tobacco; especially
97% of the burley tobacco in Zambia was produced in Eastern Province in 2014. Large
quantities are exported to Malawi, and other portion is China and Zimbabwe. Malawi had been
Source: FAOSTAT
Figure 3.6 Production of Oil Crops
Source: FAOSTAT, UN Com Trade Database Figure 3.7 Production of Tobacco, Cotton
and Coffee
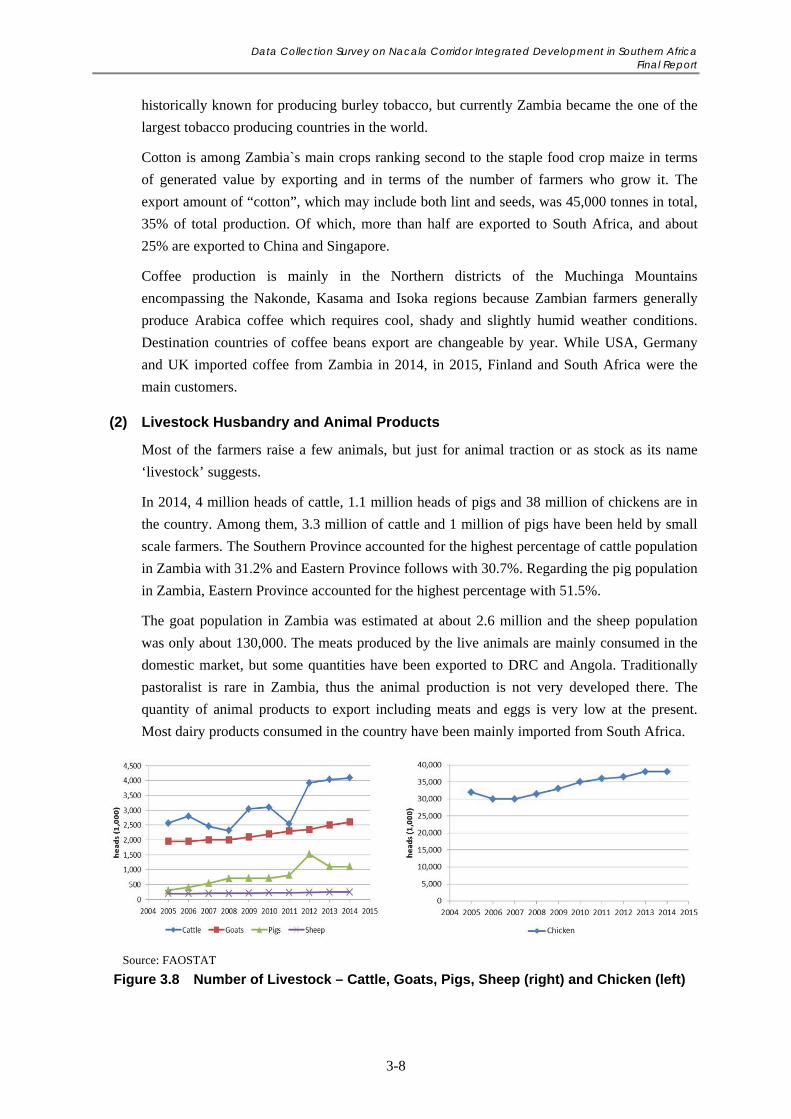
Data Collection Survey on Nacala Corridor Integrated Development in Southern Africa Final Report
3-8
historically known for producing burley tobacco, but currently Zambia became the one of the
largest tobacco producing countries in the world.
Cotton is among Zambia`s main crops ranking second to the staple food crop maize in terms
of generated value by exporting and in terms of the number of farmers who grow it. The
export amount of “cotton”, which may include both lint and seeds, was 45,000 tonnes in total,
35% of total production. Of which, more than half are exported to South Africa, and about
25% are exported to China and Singapore.
Coffee production is mainly in the Northern districts of the Muchinga Mountains
encompassing the Nakonde, Kasama and Isoka regions because Zambian farmers generally
produce Arabica coffee which requires cool, shady and slightly humid weather conditions.
Destination countries of coffee beans export are changeable by year. While USA, Germany
and UK imported coffee from Zambia in 2014, in 2015, Finland and South Africa were the
main customers.
(2) Livestock Husbandry and Animal Products
Most of the farmers raise a few animals, but just for animal traction or as stock as its name
‘livestock’ suggests.
In 2014, 4 million heads of cattle, 1.1 million heads of pigs and 38 million of chickens are in
the country. Among them, 3.3 million of cattle and 1 million of pigs have been held by small
scale farmers. The Southern Province accounted for the highest percentage of cattle population
in Zambia with 31.2% and Eastern Province follows with 30.7%. Regarding the pig population
in Zambia, Eastern Province accounted for the highest percentage with 51.5%.
The goat population in Zambia was estimated at about 2.6 million and the sheep population
was only about 130,000. The meats produced by the live animals are mainly consumed in the
domestic market, but some quantities have been exported to DRC and Angola. Traditionally
pastoralist is rare in Zambia, thus the animal production is not very developed there. The
quantity of animal products to export including meats and eggs is very low at the present.
Most dairy products consumed in the country have been mainly imported from South Africa.
Source: FAOSTAT
Figure 3.8 Number of Livestock – Cattle, Goats, Pigs, Sheep (right) and Chicken (left)
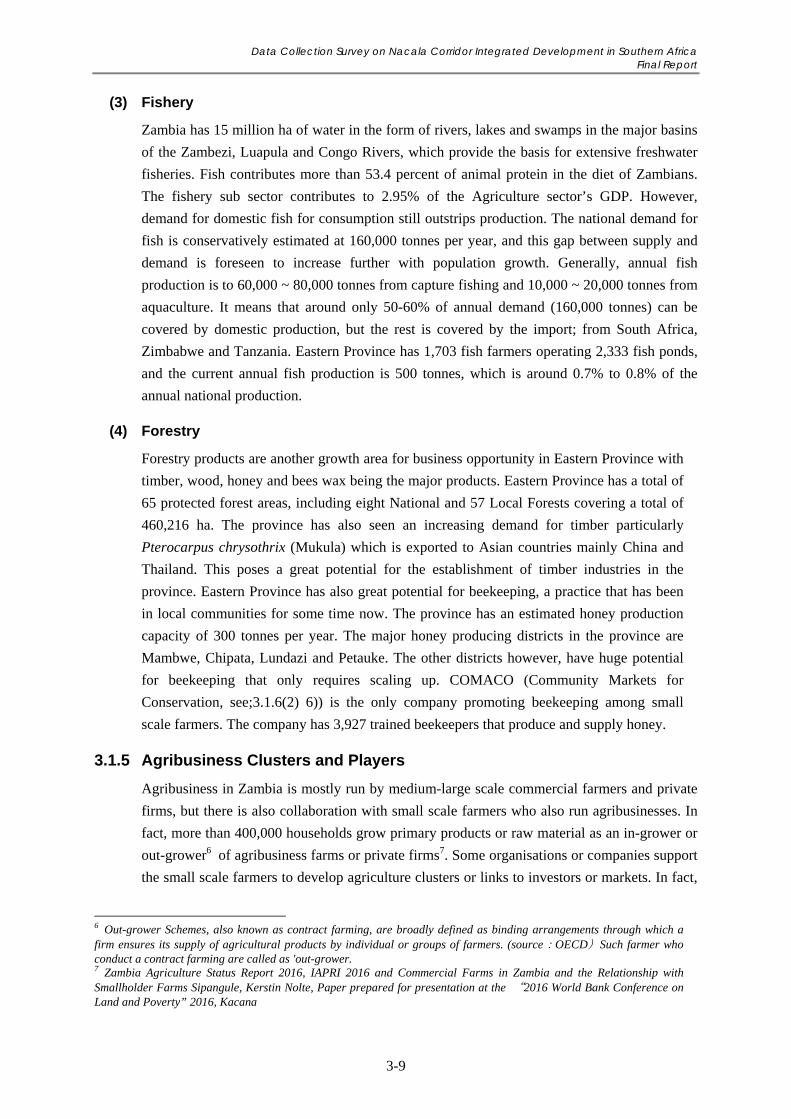
Data Collection Survey on Nacala Corridor Integrated Development in Southern Africa Final Report
3-9
(3) Fishery
Zambia has 15 million ha of water in the form of rivers, lakes and swamps in the major basins
of the Zambezi, Luapula and Congo Rivers, which provide the basis for extensive freshwater
fisheries. Fish contributes more than 53.4 percent of animal protein in the diet of Zambians.
The fishery sub sector contributes to 2.95% of the Agriculture sector’s GDP. However,
demand for domestic fish for consumption still outstrips production. The national demand for
fish is conservatively estimated at 160,000 tonnes per year, and this gap between supply and
demand is foreseen to increase further with population growth. Generally, annual fish
production is to 60,000 ~ 80,000 tonnes from capture fishing and 10,000 ~ 20,000 tonnes from
aquaculture. It means that around only 50-60% of annual demand (160,000 tonnes) can be
covered by domestic production, but the rest is covered by the import; from South Africa,
Zimbabwe and Tanzania. Eastern Province has 1,703 fish farmers operating 2,333 fish ponds,
and the current annual fish production is 500 tonnes, which is around 0.7% to 0.8% of the
annual national production.
(4) Forestry
Forestry products are another growth area for business opportunity in Eastern Province with
timber, wood, honey and bees wax being the major products. Eastern Province has a total of
65 protected forest areas, including eight National and 57 Local Forests covering a total of
460,216 ha. The province has also seen an increasing demand for timber particularly
Pterocarpus chrysothrix (Mukula) which is exported to Asian countries mainly China and
Thailand. This poses a great potential for the establishment of timber industries in the
province. Eastern Province has also great potential for beekeeping, a practice that has been
in local communities for some time now. The province has an estimated honey production
capacity of 300 tonnes per year. The major honey producing districts in the province are
Mambwe, Chipata, Lundazi and Petauke. The other districts however, have huge potential
for beekeeping that only requires scaling up. COMACO (Community Markets for
Conservation, see;3.1.6(2) 6)) is the only company promoting beekeeping among small
scale farmers. The company has 3,927 trained beekeepers that produce and supply honey.
3.1.5 Agribusiness Clusters and Players
Agribusiness in Zambia is mostly run by medium-large scale commercial farmers and private
firms, but there is also collaboration with small scale farmers who also run agribusinesses. In
fact, more than 400,000 households grow primary products or raw material as an in-grower or
out-grower6 of agribusiness farms or private firms7. Some organisations or companies support
the small scale farmers to develop agriculture clusters or links to investors or markets. In fact,
6 Out-grower Schemes, also known as contract farming, are broadly defined as binding arrangements through which a firm ensures its supply of agricultural products by individual or groups of farmers. (source:OECD)Such farmer who conduct a contract farming are called as 'out-grower. 7 Zambia Agriculture Status Report 2016, IAPRI 2016 and Commercial Farms in Zambia and the Relationship with Smallholder Farms Sipangule, Kerstin Nolte, Paper prepared for presentation at the “2016 World Bank Conference on Land and Poverty” 2016, Kacana
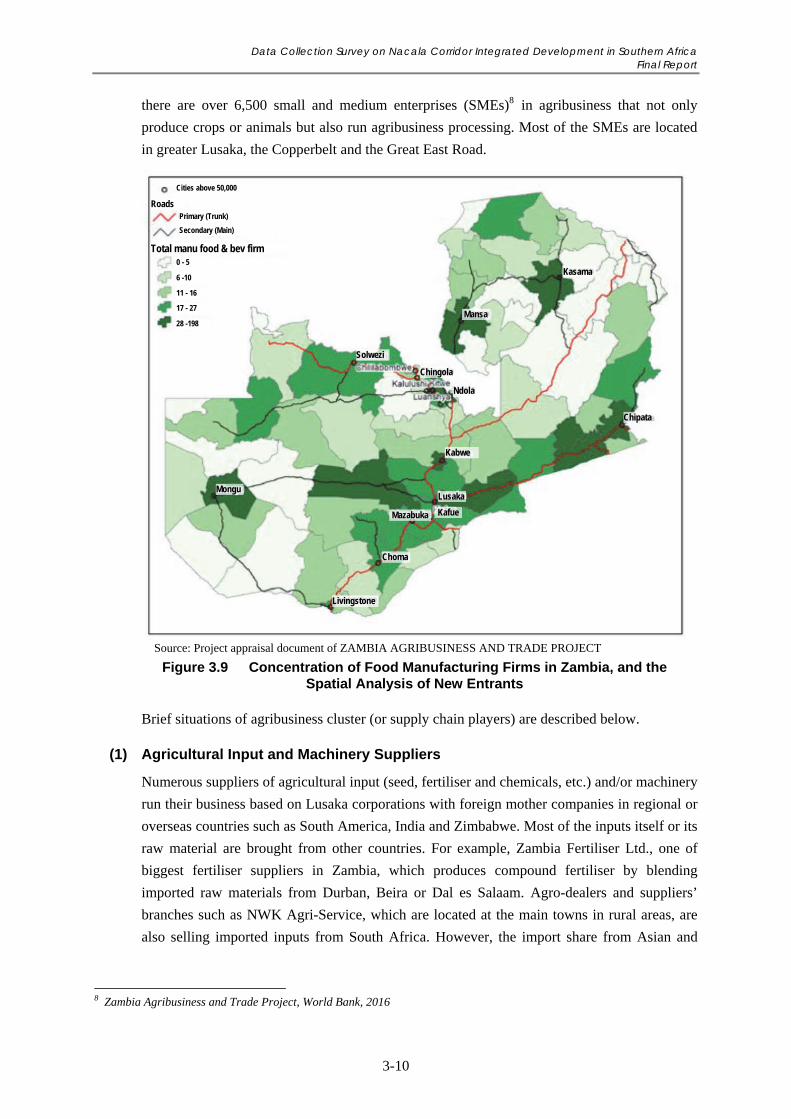
Data Collection Survey on Nacala Corridor Integrated Development in Southern Africa Final Report
3-10
there are over 6,500 small and medium enterprises (SMEs)8 in agribusiness that not only
produce crops or animals but also run agribusiness processing. Most of the SMEs are located
in greater Lusaka, the Copperbelt and the Great East Road.
Brief situations of agribusiness cluster (or supply chain players) are described below.
(1) Agricultural Input and Machinery Suppliers
Numerous suppliers of agricultural input (seed, fertiliser and chemicals, etc.) and/or machinery
run their business based on Lusaka corporations with foreign mother companies in regional or
overseas countries such as South America, India and Zimbabwe. Most of the inputs itself or its
raw material are brought from other countries. For example, Zambia Fertiliser Ltd., one of
biggest fertiliser suppliers in Zambia, which produces compound fertiliser by blending
imported raw materials from Durban, Beira or Dal es Salaam. Agro-dealers and suppliers’
branches such as NWK Agri-Service, which are located at the main towns in rural areas, are
also selling imported inputs from South Africa. However, the import share from Asian and
8 Zambia Agribusiness and Trade Project, World Bank, 2016
Source: Project appraisal document of ZAMBIA AGRIBUSINESS AND TRADE PROJECT
Figure 3.9 Concentration of Food Manufacturing Firms in Zambia, and the Spatial Analysis of New Entrants
Chipata
Kabwe
Lusaka Mongu
Livingstone
Choma
Mazabuka Kafue
Ndola
Solwezi
Chingola
Mansa
Kasama
Primary (Trunk)
Secondary (Main)
Roads
Cities above 50,000
Total manu food & bev firm 0 - 5
6 -10
11 - 16
17 - 27
28 -198
Data Collection Survey on Nacala Corridor Integrated Development in Southern Africa Final Report
3-11
Middle East countries has increased in recent years9. The feed and medicines for livestock and
fish farming are available at the agro-dealers’ store in the rural area.
As stated, most of the agricultural inputs including feed and medicines for animal and fish
husbandry rely on imports or are produced in Lusaka using imported raw materials. These are,
therefore, very expensive and not affordable for small scale farmers because transportation
cost is added to the input price. Particularly, it is said that feed accounts for about 60% to 70%
of the production costs of animals and fish so farmers cannot raise the production and
productivity optimally10.
Needless to say, all equipment and machinery are also imported mainly from South Africa, EU
and Asia, such as India and China, recently.
(2) Primary Producers
The primary agriculture producers in Zambian provide the raw materials for agro-related
industries which accounts for 84% of the manufacturing value addition in the country11.
Medium/large scale commercial farmers and firms produce mostly cash crops such as tobacco,
cotton, horticulture products, soya beans, wheat and a small quantity of coffee for domestic
and international markets. Among farmers, there are those who process secondary products
such as raw sugar and maize mills. By contrary, the latter produces mainly primary products
or raw material for agribusiness firms unless they consume processed products locally.
Small scale farmers also grow the tobacco, cotton, horticulture crops, soya bean and wheat as
well as maize and raise animals and fish mainly for self-consumption. However their maize is
often exported to neighbouring countries such as DRC, Malawi, Zimbabwe and African Great
Lake region. The fish and animals are mostly consumed in domestic markets rather than trade
with neighbouring countries because domestic demand has been increasing in the recent
years12.
Except for the commodities produced on companies own farms, the primary products are
purchased and transported by agro-processing industry companies, general commercial firms
or transporters, or sometimes farmers’ cooperatives or associations. Tobacco and cotton used
to be transported to South Africa but a share destined for Asian countries has also increased
recently.
(3) Agro-Processing Industry Firms
The agro-processing industry has been developing in the country in recent years due to an
increase of food demand in and around the country.
Due to the import restrictions of edible oil from 2015, the oil processing industry has also been
developed tremendously. Sugar and edible oil are the main export commodities to regional 9 Comtrade 2010-2015 10 Draft of Livestock Policy. Ministry of Fisheries and Livestock, 2015 11 Country report to the 71st Plenary Meeting of the International Cotton Advisory Committee to be held from 7-12 October 2012 at Interlaken, Switzerland, Cotton Board of Zambia 12 According to Interview with Zambian Development Agency and Ministry of Livestock and Fishery
Data Collection Survey on Nacala Corridor Integrated Development in Southern Africa Final Report
3-12
markets such as DRC, Zimbabwe and South Africa at present. However, most of the
agro-industrial companies are facing a shortage of primary products as raw materials.
According to Mount Meru Millers Zambia Limited, although the demand of sunflower oil has
been increased in Zambia and also in Malawi, the domestic demand cannot be fulfilled due to
shortage of sunflower seeds as raw material. This company has started to promote sunflower
production in Central Province in order to ensure to obtain raw material. To fulfil the raw
material stably, Tradekings is contracting with 830 farmers to procure Irish potatoes as raw
material and processed confectioneries such as cookies and snacks.
As for animal products, Zambeef Products PLC, one of the largest agro-industry companies,
also has a problem with the shortage of feeder calves for the meat products. The company
purchases certain aged feeder calves from small scale farmers because the rearing calves
requires a lot of time and effort. However, the company has a difficulty to purchase a large
number of calves regularly because the number of calves which can be reared by one small
scale farmer is limited and most of rearing places are scatted and located in remote areas; thus,
it is difficult to access to a number of feeder calves at one time. Therefore, this company has
not yet exported meat, the main product, while exports several products such as cereal crops
and feed to Zimbabwe, Rwanda, Angola and Mozambique.
The fishery, aquaculture in particular, has not been well developed even though there is a large
water body suitable to fishery in the country. One of the reasons is the difficulty of fish feed
procurement which are not affordable or available. The trade of fish products is mostly by the
informal sector except Yelelo, a leading company of aquaculture business exporting formally
in Kasumbalesa in DRC. On the other hands, Skretting, the largest fish feed production
company has opened feed plant at Siavonga near Lake Kariba in April 2017. The investment is
expected to serve as a catalyst for fishery development in Zambia.
(4) Retailers
The major grocery retailers in Zambia are supermarkets with South Africa’s capital such as
Shoprite, Game, Spar and Pick’n Pay. Such kinds of supermarkets have procured merchandise
through its own distribution line from original countries. However, other than commodities
which are produced in certain quantities, those supermarkets purchase local products at the
present such as perishable commodities; vegetables, fruits, meat and fish and as grocery food
such as maize mealie, wheat flour and cooking oil. Shoprite and Game buy the commodities
from local wholesalers and Spar contracts with farmers and buys products directly. At present,
supermarkets owned by Indian, Chinese or Thai companies have increased.
Those supermarkets are oriented toward foreigners and wealthy people, while most of the
Zambians use local markets and vendors who sell local products.
(5) Trading Companies
Thousands of companies are trading primary products and processed food in Zambia to sell
domestic or international markets. Same as the above mentioned agro-industry processing
firms or retailers, some trading companies contract with farmers or local traders, while some
Data Collection Survey on Nacala Corridor Integrated Development in Southern Africa Final Report
3-13
just buy products according to their own demands without contract. But the ones who need
certain quantities of products regularly tend to make a contract with farmers through the
cooperatives, associations or individually. In that case, the companies provide agriculture
inputs and techniques for the production in many cases. For example, Cargill, one of biggest
grain majors in the world, provides such services for small scale farmers as well as conducting
organisation training sessions and launching a maize mill in Chipata and a soya bean crush
and oil refinery factory in Lusaka to enable them to join commodity value chains. NWK
Agri-Services13, handling staple food and pulse crops and cotton, provides pre-financing to
small holders to allow them to access input and grow products.
Out of contract or linked with agribusiness firms, the primary products, especially maize, soya
beans, and wheat produced by small scale farmers, are distributed inside and outside the
country through private transport and/or logistics organisations such as AFGRI and Zambian
Commodity Exchange (ZAMACE)14.
3.1.6 Related Policies, Programmes and Projects
In order to achieve food security, and develop the agriculture sector driven by large scale
commercial farmers or agribusiness companies, the GOZ has been preparing and reforming
regulation, institutions and laws for accelerating agribusiness. In addition the GOZ also
facilitates small scale farmers to obtain farming inputs and techniques with the assistance of
donors and to work with the agribusiness players. Related current development policies and
movement with international donors and investors are described briefly below.
(1) Development Policies, Strategies and Plans
The GOZ has participated in the CAADP since 2011 through the facilitation by the COMESA.
Aligned with CAADP, the GOZ has launched the revised National Agricultural Policy (NAP)
and National Agricultural Investment Plan (NAIP) in 2013. The policy and the plan focus on
the development of sustainable, dynamic, diversified and competitive agricultural sector,
which assures food security15.
In accordance with NAIP, the main goal of agriculture programmes and projects is always
food security but is shifting to market oriented agriculture including enhancement of
agribusiness for export. Regarding fisheries and livestock, since the Ministry of Fisheries and
Livestock (MFL) has established in 2015, the ministry has prepared its own new policies
fisheries and livestock respectively. The fisheries are focusing on export the same as
self-sufficiency, while the livestock sub-sector is targeting national socio-economic
13 NWK Agri-Services stated operation under the Dunavant name since May 2000 and changed its corporate name as NWK Limited, a major South African based agribusinness that acquired a majority shareholding in October 2013. NWK Limited in South Africa holds has 60% of interest of the NWK Agri-Services in Zambia and Louis Dreyfus Commodities (Middle-East and Africa) Trading (LDC) that is based in Dubai shares 40%. 14 a private limited liability company incorporated under the Companies Act in 2007 with assistance from USAIS to improve agriculture trade through the the implementation of the Warehouse Receipt System (WRS). 15 National Agricultural Policy (NAP) and National Agricultural Investment Plan (NAIP)2014-2018, MOA,2013
Data Collection Survey on Nacala Corridor Integrated Development in Southern Africa Final Report
3-14
development and food and nutrition security16. In any case, diversification of production is a
key issue in the agriculture policies. On that occasion, the diversification and export-oriented
agriculture is the 1st outcome in the strategy of economic diversification and job creation in the
new national development plan17.
In order to developer competitive agriculture sector including livestock and fisheries, the
irrigation development is necessary. As above-mentioned, Zambia’s irrigation potential is
estimated at 2.75 million ha of which 523,000 ha can be economically developed, this
variance on figure is different by source though. If irrigation scheme is developed, yield of
major crops can be increased 1.5 to 3 times more than the one with conventional production.
Therefore the government has intended to develop more irrigation scheme for small scale
farmers. However, most of schemes developed by the government or NGOs in the past are
ruined due to poor management of facilities. It is related to instructional aspects of farmers in
rural areas, most of farmers water management groups are not well functioned. Thus to
promote more irrigation agriculture, it is important to identify the suitable sites and choose
types of crops, as well as to organise and train thoroughly beneficially farmers considering
traditional socio-economic situation of the site.
(2) Development Programmes and Projects
The following points are presenting related programmes and projects at the small scale farmer
level.
1) Farm Block Development Programme18
For promoting commercial agriculture for economic development by utilising the land
resources, the GOZ has undertaken a number of measures to encourage domestic and
international investors like reinforcement of fiscal and institutional incentives. As one of the
measures, ‘Farm Block Development Programme’ was determined in 2002 aiming at poverty
reduction through regional development conducted by the investment promotion. The
programmes has been carried out by the Zambia Development Agency (ZDA) and many
related institutions.
The programme aims to achieve economic diversification and growth, national food security
and poverty reduction by developing rural areas through the commercialization of agricultural
land. In the initial plan, the government is to identify a Farm Block on the scale of 100,000 ha
in each province, and to provide and install basic infrastructure and facilities such as trunk
roads, bridges, electricity, dams, schools and health facilities in the block. The core investor
being a lead investor for each block is expected to develop the infrastructure for their business
within the allocated plots in the Farm Block and to manage the appropriate agribusiness
activities. They are also expected to contribute to agricultural development in the area, for
16 Based on interview with Animal Production Department in the Ministry of Fisheries and Livestock and ‘Draft Livestock Policy’ 2015 17 National Agriculture Investment Plan 2014–2018, MOA and Livestock,2013 18 Agriculture Sector Leaflet, Zambia Development Agency, 2014
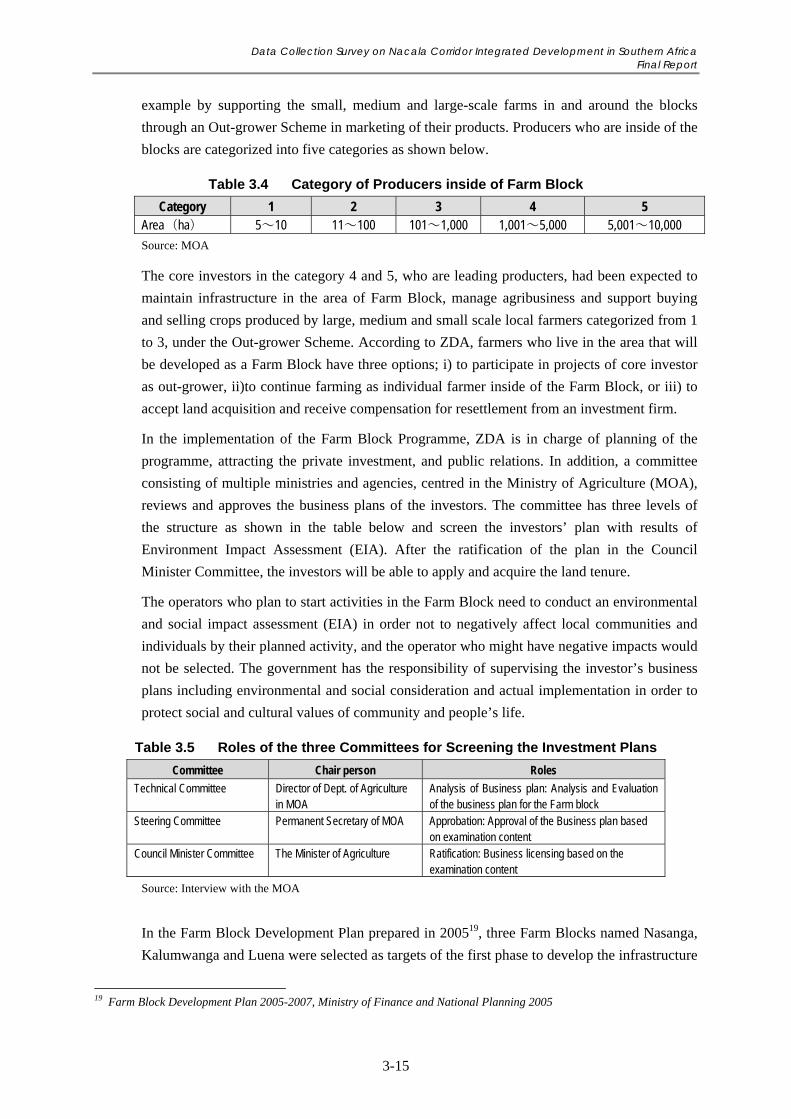
Data Collection Survey on Nacala Corridor Integrated Development in Southern Africa Final Report
3-15
example by supporting the small, medium and large-scale farms in and around the blocks
through an Out-grower Scheme in marketing of their products. Producers who are inside of the
blocks are categorized into five categories as shown below.
Table 3.4 Category of Producers inside of Farm Block
Category 1 2 3 4 5 Area(ha) 5~10 11~100 101~1,000 1,001~5,000 5,001~10,000
Source: MOA
The core investors in the category 4 and 5, who are leading producters, had been expected to
maintain infrastructure in the area of Farm Block, manage agribusiness and support buying
and selling crops produced by large, medium and small scale local farmers categorized from 1
to 3, under the Out-grower Scheme. According to ZDA, farmers who live in the area that will
be developed as a Farm Block have three options; i) to participate in projects of core investor
as out-grower, ii)to continue farming as individual farmer inside of the Farm Block, or iii) to
accept land acquisition and receive compensation for resettlement from an investment firm.
In the implementation of the Farm Block Programme, ZDA is in charge of planning of the
programme, attracting the private investment, and public relations. In addition, a committee
consisting of multiple ministries and agencies, centred in the Ministry of Agriculture (MOA),
reviews and approves the business plans of the investors. The committee has three levels of
the structure as shown in the table below and screen the investors’ plan with results of
Environment Impact Assessment (EIA). After the ratification of the plan in the Council
Minister Committee, the investors will be able to apply and acquire the land tenure.
The operators who plan to start activities in the Farm Block need to conduct an environmental
and social impact assessment (EIA) in order not to negatively affect local communities and
individuals by their planned activity, and the operator who might have negative impacts would
not be selected. The government has the responsibility of supervising the investor’s business
plans including environmental and social consideration and actual implementation in order to
protect social and cultural values of community and people’s life.
Table 3.5 Roles of the three Committees for Screening the Investment Plans
Committee Chair person Roles
Technical Committee Director of Dept. of Agriculture in MOA
Analysis of Business plan: Analysis and Evaluation of the business plan for the Farm block
Steering Committee Permanent Secretary of MOA Approbation: Approval of the Business plan based on examination content
Council Minister Committee The Minister of Agriculture Ratification: Business licensing based on the examination content
Source: Interview with the MOA
In the Farm Block Development Plan prepared in 200519, three Farm Blocks named Nasanga,
Kalumwanga and Luena were selected as targets of the first phase to develop the infrastructure
19 Farm Block Development Plan 2005-2007, Ministry of Finance and National Planning 2005
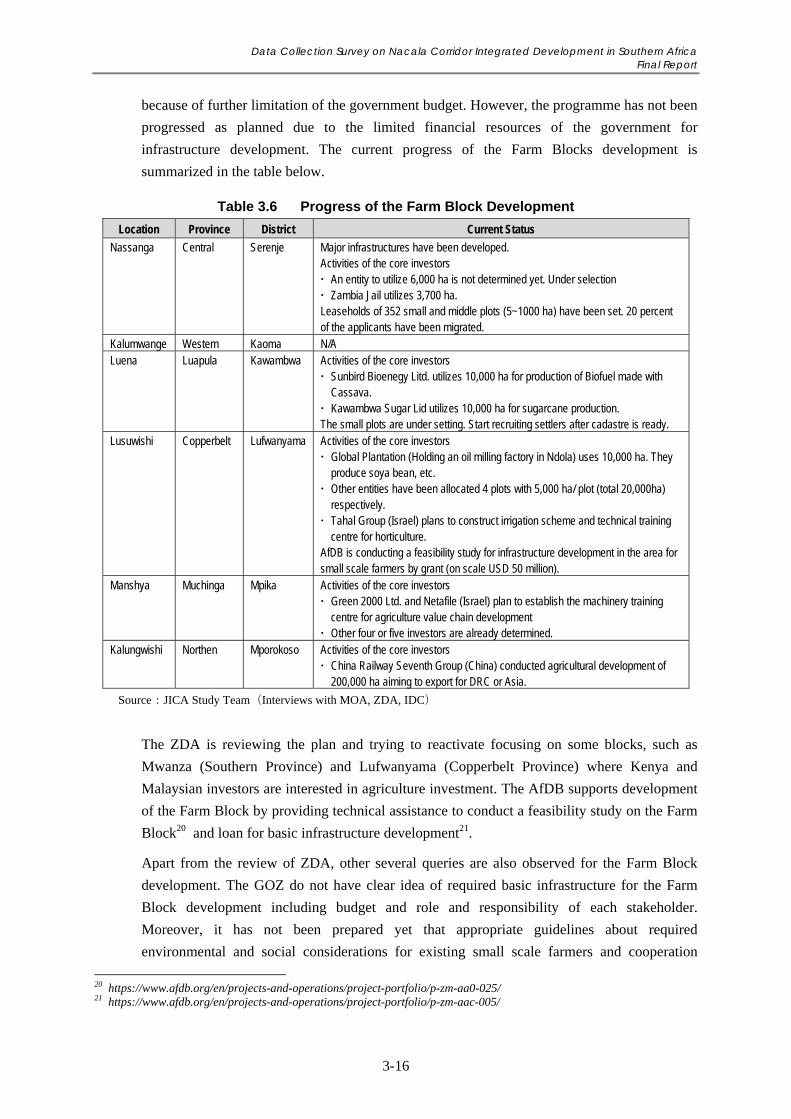
Data Collection Survey on Nacala Corridor Integrated Development in Southern Africa Final Report
3-16
because of further limitation of the government budget. However, the programme has not been
progressed as planned due to the limited financial resources of the government for
infrastructure development. The current progress of the Farm Blocks development is
summarized in the table below.
Table 3.6 Progress of the Farm Block Development
Location Province District Current Status
Nassanga Central Serenje Major infrastructures have been developed. Activities of the core investors An entity to utilize 6,000 ha is not determined yet. Under selection Zambia Jail utilizes 3,700 ha. Leaseholds of 352 small and middle plots (5~1000 ha) have been set. 20 percent of the applicants have been migrated.
Kalumwange Western Kaoma N/A Luena Luapula Kawambwa Activities of the core investors
Sunbird Bioenegy Litd. utilizes 10,000 ha for production of Biofuel made with Cassava. Kawambwa Sugar Lid utilizes 10,000 ha for sugarcane production. The small plots are under setting. Start recruiting settlers after cadastre is ready.
Lusuwishi Copperbelt Lufwanyama Activities of the core investors Global Plantation (Holding an oil milling factory in Ndola) uses 10,000 ha. They
produce soya bean, etc. Other entities have been allocated 4 plots with 5,000 ha/ plot (total 20,000ha)
respectively. Tahal Group (Israel) plans to construct irrigation scheme and technical training
centre for horticulture. AfDB is conducting a feasibility study for infrastructure development in the area for small scale farmers by grant (on scale USD 50 million).
Manshya Muchinga Mpika Activities of the core investors Green 2000 Ltd. and Netafile (Israel) plan to establish the machinery training
centre for agriculture value chain development Other four or five investors are already determined.
Kalungwishi Northen Mporokoso Activities of the core investors China Railway Seventh Group (China) conducted agricultural development of
200,000 ha aiming to export for DRC or Asia.
Source:JICA Study Team(Interviews with MOA, ZDA, IDC)
The ZDA is reviewing the plan and trying to reactivate focusing on some blocks, such as
Mwanza (Southern Province) and Lufwanyama (Copperbelt Province) where Kenya and
Malaysian investors are interested in agriculture investment. The AfDB supports development
of the Farm Block by providing technical assistance to conduct a feasibility study on the Farm
Block20 and loan for basic infrastructure development21.
Apart from the review of ZDA, other several queries are also observed for the Farm Block
development. The GOZ do not have clear idea of required basic infrastructure for the Farm
Block development including budget and role and responsibility of each stakeholder.
Moreover, it has not been prepared yet that appropriate guidelines about required
environmental and social considerations for existing small scale farmers and cooperation
20 https://www.afdb.org/en/projects-and-operations/project-portfolio/p-zm-aa0-025/ 21 https://www.afdb.org/en/projects-and-operations/project-portfolio/p-zm-aac-005/
Data Collection Survey on Nacala Corridor Integrated Development in Southern Africa Final Report
3-17
methods applied between medium-large scale farmers and small scale farmers in their
production and access to market from the Farm Block, etc.
2) Zambia Agribusiness and Trade Project
Under the financial support of World Bank, Zambia Agribusiness and Trade Project was
lunched 2016 and will be implemented until 2022. It aims to improve and develop market
linkage in agribusiness for ‘emerging and poor farmers’ especially small and small-medium
enterprises. The project consists of three components namely: i) Market Linkages in
Agribusiness; ii) Strengthening the Regulatory and Institutional Framework for Agribusiness
and Trade; and iii) Project Management and Monitoring and Evaluation. Leading by the
Ministry of Commerce, Trade and Industry (Ministry of Commerce, Trade and Industry:
MOCTI), MOA and MFL are implementation the project with other partners. Since the project
has just started, the result has not been reported yet.
3) FISP (Farmer Input Support Programme) Electric Voucher
The GOZ introduced input subsidies in 2002/03 through the creation of the Fertilizer Support
Programme (FSP), and the Farmer Input Support Programme (FISP) is its successor which
began in 2009/10. The Program started aiming to increase maize production through the
provision of fertilizer and improved maize seed, while at the same time creating an
environment for private sector input supply chains to develop. The target crop is increased to
cover others such as groundnuts, soya bean, other beans, rice, cotton, etc., and the scale of its
fertilizer distribution was expanded from 48,000 tonnes in 2002/03 to 214,000 tonnes in
2015/1622.
In the 2015/2016, MOA introduced the FISP Electronic Voucher initiative. The 'E-voucher'
system enables farmers to receive the subsidy from the government to purchase inputs by
pre-paid VISA bank card. In 2015/16, 0.24 million farmers in Southern, Lusaka, Central and
Copperbelt districts received subsidy of the FISP through E-voucher not physical inputs
purchased by the government. The ‘E-voucher’ system promotes private sector’s participation
in agricultural inputs, enables small scale farmers to obtain inputs timely and purchase a wide
range of recommended inputs such as veterinary drugs, agricultural equipment, livestock and
juvenile fish. Therefore, the 'E-voucher' system can be said to have the potential to accelerate
diversification of the small scale farmers. Now, the GOZ has extended the program to 39
additional districts covering 602,521 farmers during the 2016/2017 season23. Provided that,
due to the review of the concept of the FISP program to help farmers with the potential to
grow, farmers have to raise the ZMW400 deposit fees to access inputs.
22 Statement by Minister of Agriculture and Livestock on “The Preparedness of the Farmer Input Support Program (FISP) for the 2015/16 Agricultural Season." 23 http://www.musika.org.zm/article/84-fisp-electronic-voucher-program-to-promote-diversification
Data Collection Survey on Nacala Corridor Integrated Development in Southern Africa Final Report
3-18
4) Smallholder Agribusiness Promotion Programme (SAPP)24
The Smallholder Agribusiness Promotion Programme (SAPP) is a seven years programme
from 2011 to 2017 costing approximately USD 25 million under the support of IFAD. The
goal of SAPP is to “increase the income levels of poor rural households involved in
production, value adding and trade of agricultural commodities including animal products”.
The purpose is to “increase the volume and value of agribusiness based on the output of
small-scale producers”. The programme has two main components as i) More Efficient Value
Chains and ii) Enabling Environment for Agribusiness Development, which have two
sub-components respectively.
5) Enhanced Smallholder Livestock Investment Project (E-SLIP)25
The Enhanced-Smallholder Livestock Investment Project (E-SLIP) is a seven years
programme from May 2015 to April 2022 approved by MOZ in September 2014. It is a
follow-on project to the Smallholder Livestock Investment Project (SLIP) which closed on
31st March 2015. The goal is to sustainably improve the production and productivity of small
scale producers' livestock systems. The programme has two components namely, i)
Sustainable animal disease control and ii) Sustainable livestock production. This is a
nation-wide programme but the target areas are districts prone to outbreaks of Contagious
Bovine Pleuropneumonia (CBPP) or East Coast Fever (ECF) and districts to which these
diseases may spread.
The MFL led the implementation. However a lack of extension offers under MFL and their
weak capacities were key challenges. Additionally seamless transition between SLIP and
E-SLIP were not done, so it did not result in quick-wins for sustained beneficiaries trust and
belief in the E-SLIP Programme.
6) Community Markets for Conservation (COMACO)26
COMACO began in 2003 in Zambia’s Luangwa Valley as an NGO activity for secure food
sources and income of small scale farmers by conserving the environment and properly
utilising natural resources. This activity is developed as a COMACO as a limited-by-guarantee
company in collaboration with the Government of Norway, German International Cooperation
Corporation (GIZ), United States Agency for International Development (USAID) and several
NGOs. The COMACO extends its services to over 140,000 small scale farmers, manufactures
twelve value-added products, and supports economic incentives for achieving conservation
and improved livelihood results.
24Based on interviews, and the website of IFAD and Supervision Report of SAAP and Final Programme Designe Report of E-SAPP 25 Based on interviews, and the website of IFAD and Supervision Report of SAAP and Final Programme Design Report of E-SAPP 26 Based on interview results and presentation sheet provided by COMACO
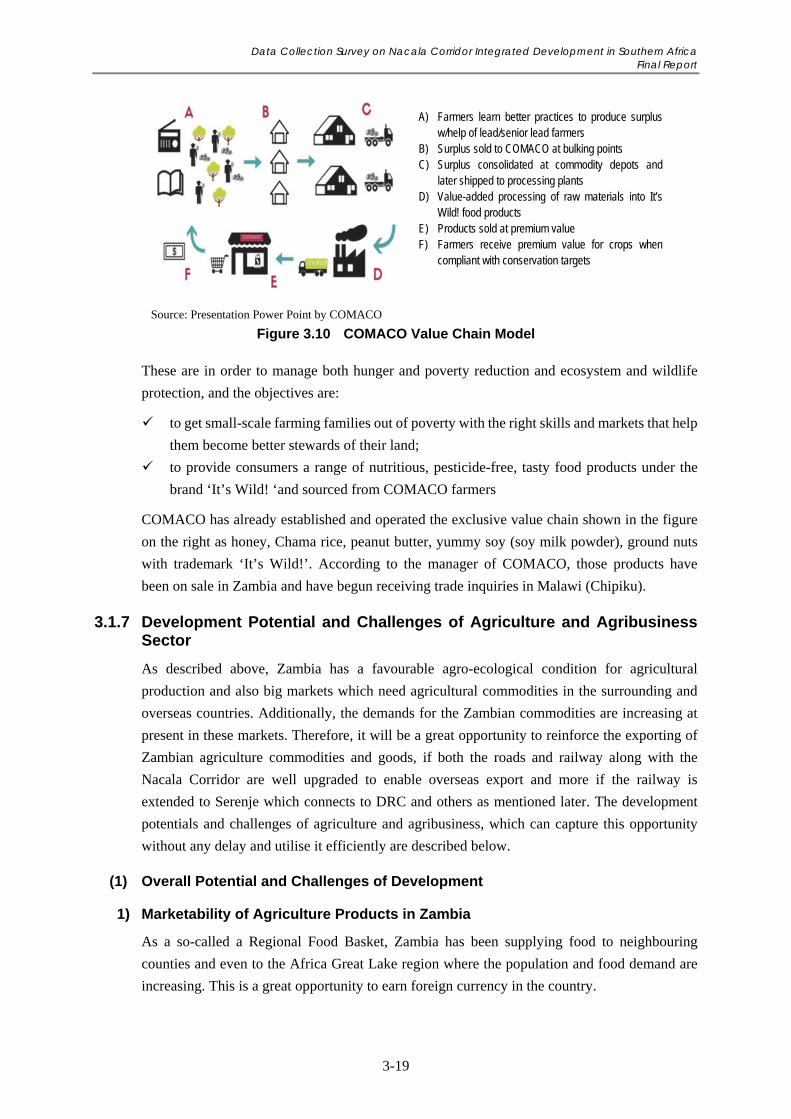
Data Collection Survey on Nacala Corridor Integrated Development in Southern Africa Final Report
3-19
Source: Presentation Power Point by COMACO
Figure 3.10 COMACO Value Chain Model
These are in order to manage both hunger and poverty reduction and ecosystem and wildlife
protection, and the objectives are:
to get small-scale farming families out of poverty with the right skills and markets that help
them become better stewards of their land;
to provide consumers a range of nutritious, pesticide-free, tasty food products under the
brand ‘It’s Wild! ‘and sourced from COMACO farmers
COMACO has already established and operated the exclusive value chain shown in the figure
on the right as honey, Chama rice, peanut butter, yummy soy (soy milk powder), ground nuts
with trademark ‘It’s Wild!’. According to the manager of COMACO, those products have
been on sale in Zambia and have begun receiving trade inquiries in Malawi (Chipiku).
3.1.7 Development Potential and Challenges of Agriculture and Agribusiness Sector
As described above, Zambia has a favourable agro-ecological condition for agricultural
production and also big markets which need agricultural commodities in the surrounding and
overseas countries. Additionally, the demands for the Zambian commodities are increasing at
present in these markets. Therefore, it will be a great opportunity to reinforce the exporting of
Zambian agriculture commodities and goods, if both the roads and railway along with the
Nacala Corridor are well upgraded to enable overseas export and more if the railway is
extended to Serenje which connects to DRC and others as mentioned later. The development
potentials and challenges of agriculture and agribusiness, which can capture this opportunity
without any delay and utilise it efficiently are described below.
(1) Overall Potential and Challenges of Development
1) Marketability of Agriculture Products in Zambia
As a so-called a Regional Food Basket, Zambia has been supplying food to neighbouring
counties and even to the Africa Great Lake region where the population and food demand are
increasing. This is a great opportunity to earn foreign currency in the country.
A) Farmers learn better practices to produce surplus w/help of lead/senior lead farmers
B) Surplus sold to COMACO at bulking points C) Surplus consolidated at commodity depots and
later shipped to processing plants D) Value-added processing of raw materials into It’s
Wild! food products E) Products sold at premium value F) Farmers receive premium value for crops when
compliant with conservation targets
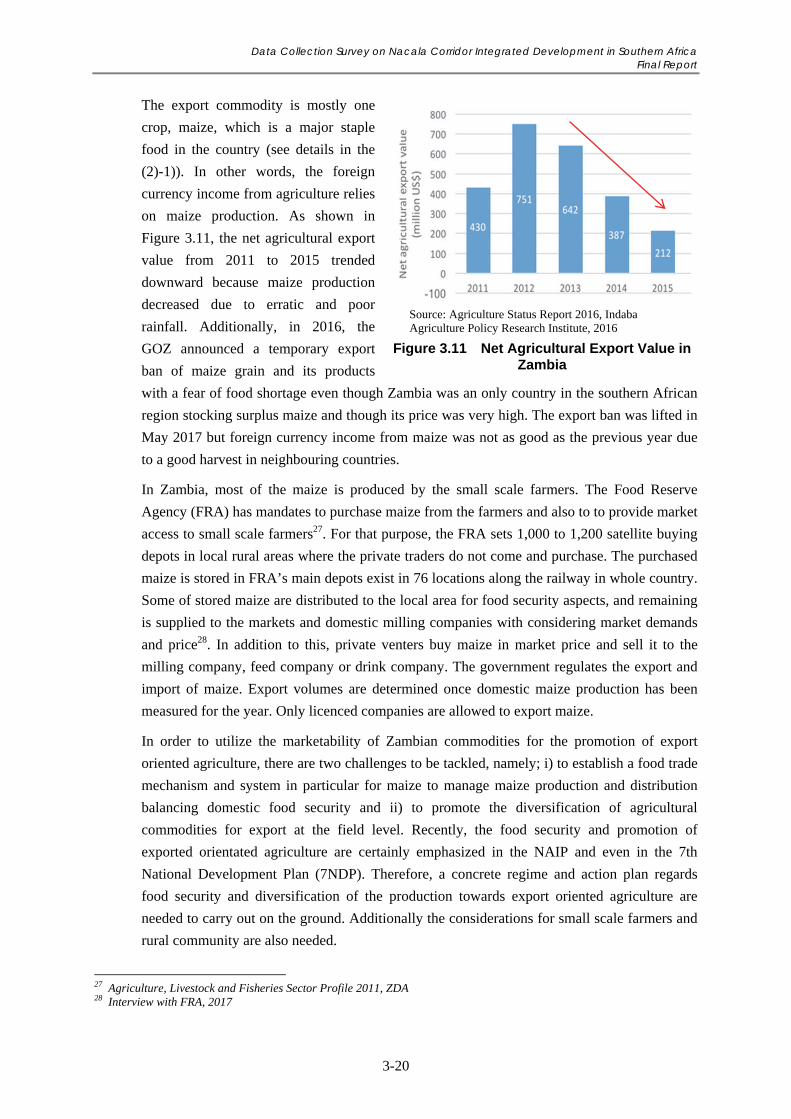
Data Collection Survey on Nacala Corridor Integrated Development in Southern Africa Final Report
3-20
The export commodity is mostly one
crop, maize, which is a major staple
food in the country (see details in the
(2)-1)). In other words, the foreign
currency income from agriculture relies
on maize production. As shown in
Figure 3.11, the net agricultural export
value from 2011 to 2015 trended
downward because maize production
decreased due to erratic and poor
rainfall. Additionally, in 2016, the
GOZ announced a temporary export
ban of maize grain and its products
with a fear of food shortage even though Zambia was an only country in the southern African
region stocking surplus maize and though its price was very high. The export ban was lifted in
May 2017 but foreign currency income from maize was not as good as the previous year due
to a good harvest in neighbouring countries.
In Zambia, most of the maize is produced by the small scale farmers. The Food Reserve
Agency (FRA) has mandates to purchase maize from the farmers and also to to provide market
access to small scale farmers27. For that purpose, the FRA sets 1,000 to 1,200 satellite buying
depots in local rural areas where the private traders do not come and purchase. The purchased
maize is stored in FRA’s main depots exist in 76 locations along the railway in whole country.
Some of stored maize are distributed to the local area for food security aspects, and remaining
is supplied to the markets and domestic milling companies with considering market demands
and price28. In addition to this, private venters buy maize in market price and sell it to the
milling company, feed company or drink company. The government regulates the export and
import of maize. Export volumes are determined once domestic maize production has been
measured for the year. Only licenced companies are allowed to export maize.
In order to utilize the marketability of Zambian commodities for the promotion of export
oriented agriculture, there are two challenges to be tackled, namely; i) to establish a food trade
mechanism and system in particular for maize to manage maize production and distribution
balancing domestic food security and ii) to promote the diversification of agricultural
commodities for export at the field level. Recently, the food security and promotion of
exported orientated agriculture are certainly emphasized in the NAIP and even in the 7th
National Development Plan (7NDP). Therefore, a concrete regime and action plan regards
food security and diversification of the production towards export oriented agriculture are
needed to carry out on the ground. Additionally the considerations for small scale farmers and
rural community are also needed.
27 Agriculture, Livestock and Fisheries Sector Profile 2011, ZDA 28 Interview with FRA, 2017
Source: Agriculture Status Report 2016, Indaba Agriculture Policy Research Institute, 2016
Figure 3.11 Net Agricultural Export Value in Zambia
Data Collection Survey on Nacala Corridor Integrated Development in Southern Africa Final Report
3-21
2) Possibility of Diversification of Agriculture and Agribusiness
Although, various agricultural products can produced under preferable natural condition in
Zambia, most of the farmers, regardless their farming scale, produce only limited varieties of
crops and livestock.
Under the agricultural situation, the NAIP put the crop diversification as a top priority in order
to meet national needs and to promote exports, focusing on maize, legumes, oil seed crops,
other cereal crops, root and tuber crops and horticultural crops. Among these crops, the
legumes and oil seeds are demanded highly in both formal and informal markets. According to
the Mount Meru Millers Zambian Limited and an agricultural cooperative in Petauke, the
demands for the processed products like vegetable oils and flours are also increasing in
domestic and international markets.
Besides, the NAIP has mentioned the importance of the livestock and aquaculture sector for
agriculture and economic development. The livestock sector, in particular, has a development
potential in the light of rising meat demand in and outside the country. In fact, the GOZ was
concluded MOU with the government of Saudi Arabia to raise and export one million goats
and sheep in 2016, and made up the Goats and Sheep Task Force in MFL, MOA and MOCTI
in 201729. Since large quantities of crop residues can be expected for animal feed production
in the country, by utilising the existing resources, livestock development is to be done as an
agricultural diversification.
3) Rural Development Opportunities utilize Emerging of Agribusiness by Private Investment
As mentioned before, the ‘Farm Block Development Programme’ to promote agribusiness by
private sectors has been conducted to achieve economic diversification and growth, national
food security and poverty reduction in rural areas. If the programme can promote to increase
primary production and to develop agribusiness by the private entities, it is a great opportunity
to develop the agricultural sector, especially to develop the value chains of the crops and
integrated regional agricultural clusters.
The investors should include some activities to contribute to rural development in
collaboration with local small scale farmers in their business plans in the framework of the
programme. According to ZDA and MOA who are main implementation body of the
programme, the core investors have no mandatory obligations to apply Out-grower Scheme, to
take similar actions or to employ the farmers who request in the their business plans. However,
the investors are required to involve such support activities for small scale farmers in their
plan, which is one of condition to be ratified by the GOZ. Therefore, it is expected that
through this program, the small scale farmers living in and around the Farm Block will be
out-growers or employees of the farms or factories developed by the investments if they wish
so with their own will..
29 Lusaka Time on 8th August 2017
Data Collection Survey on Nacala Corridor Integrated Development in Southern Africa Final Report
3-22
At the present, the programme has not been progressed as planned due to the delay of
infrastructure development caused by several reasons, but seven Farm Blocks have achieved
some progress more and less particularly as mentioned in 3.1.6(2). It might need to review and
reform the programme including the necessary considerations of small scale farmers to
implement the programme smoothly and bring early benefits to the investor and the local
communities.
The intervention of commercial farms led by private investors has the possibility to create
negative impacts in rural areas, such as ‘land issue’ or ‘social discord’, although bringing
positive impacts such as improved market access or job creation in rural areas. Therefore,
including the progressed seven Farm Blocks, it should be considered to secure the rights of
small scale farmers and communities in the implementation of the programme in order to
achieve sound contribute of the investments to rural development in collaboration with local
small scale farmers which supress the any negative impacts.
4) Empowerment of Small Scale Farmers and Extension System
The empowerment of small scale farmers can be a key to promote export oriented agriculture
and agribusiness through the collaboration between small scale farmers and private investors
as described earlier. If the small scale farmers have capacity in terms of production and
stability of the products, they will have bargaining power and be able to negotiate with traders,
commercial farmers or private investors for trade or contract as an out-grower. Once the
empowerment of small scale farmers enables the creation of a healthy and transparently
relationship with traders and/or commercial farmers or firms are established, the relationship
and the agribusiness may be sustainable.
In order to realise this, a problem is raised: weak extension services30 and lack of numbers
and capacities of governmental officers. In fact, one extension worker should cover about
1,000 farmers who are living scattered place in rural area.
New Extension Strategy31 also raised poor extension planning, under performing livestock
extension services and Farmer Training Centres (FTCs), as well as low capacity of officers,
especially market oriented production systems. According to a press, MOA is going to hire
additional extension workers32 to support small scale farmers and also commercial farmers. In
this occasion, by reviewing capacity building programme, the government should reconstruct
existent extension system; capacity of officers especially in market oriented agriculture and
agribusiness, and location of FTC, etc. in collaboration with the Zambia National Farmers
Union (ZNFU) dispatches its full-time staff providing various forms of extension services and
also private sectors.
30 Interview with MFL 31 The National Agricultural Extension & Advisory Services Strategy, 2016-2020, MOA, 2016 32 https://www.daily-mail.co.zm/extension-officers-recruited/ , https://www.africanfarming.com/field-extension-officers/
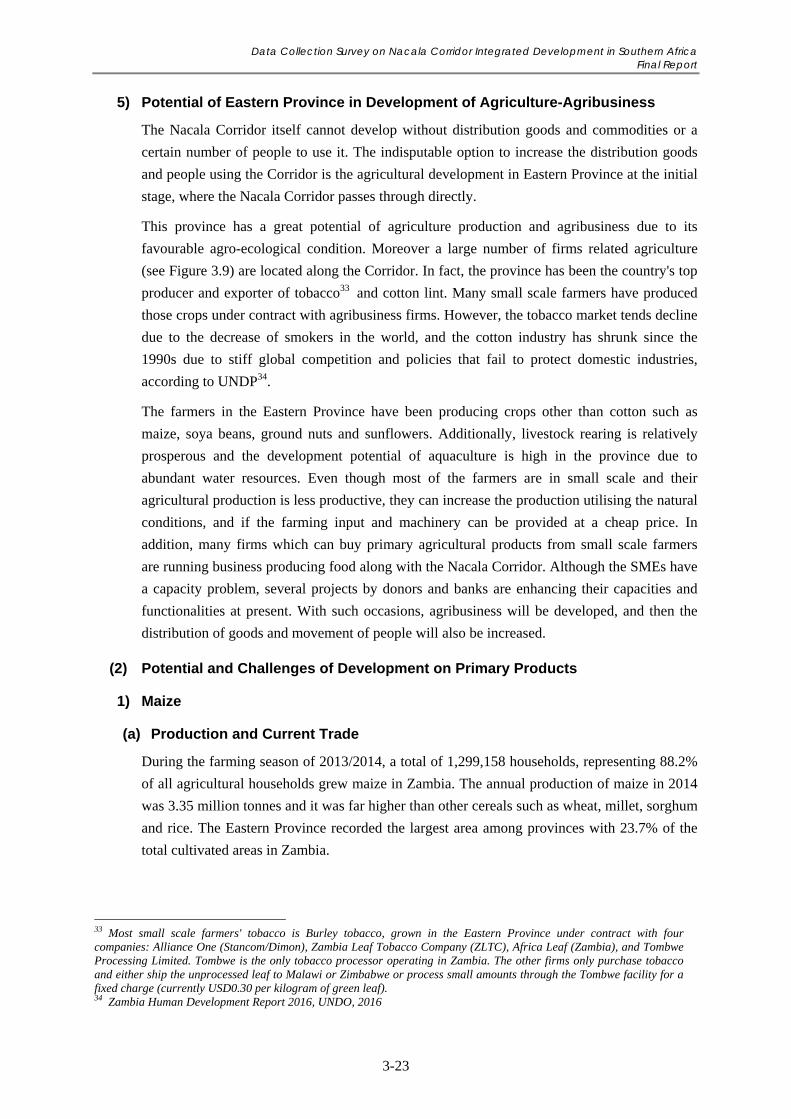
Data Collection Survey on Nacala Corridor Integrated Development in Southern Africa Final Report
3-23
5) Potential of Eastern Province in Development of Agriculture-Agribusiness
The Nacala Corridor itself cannot develop without distribution goods and commodities or a
certain number of people to use it. The indisputable option to increase the distribution goods
and people using the Corridor is the agricultural development in Eastern Province at the initial
stage, where the Nacala Corridor passes through directly.
This province has a great potential of agriculture production and agribusiness due to its
favourable agro-ecological condition. Moreover a large number of firms related agriculture
(see Figure 3.9) are located along the Corridor. In fact, the province has been the country's top
producer and exporter of tobacco33 and cotton lint. Many small scale farmers have produced
those crops under contract with agribusiness firms. However, the tobacco market tends decline
due to the decrease of smokers in the world, and the cotton industry has shrunk since the
1990s due to stiff global competition and policies that fail to protect domestic industries,
according to UNDP34.
The farmers in the Eastern Province have been producing crops other than cotton such as
maize, soya beans, ground nuts and sunflowers. Additionally, livestock rearing is relatively
prosperous and the development potential of aquaculture is high in the province due to
abundant water resources. Even though most of the farmers are in small scale and their
agricultural production is less productive, they can increase the production utilising the natural
conditions, and if the farming input and machinery can be provided at a cheap price. In
addition, many firms which can buy primary agricultural products from small scale farmers
are running business producing food along with the Nacala Corridor. Although the SMEs have
a capacity problem, several projects by donors and banks are enhancing their capacities and
functionalities at present. With such occasions, agribusiness will be developed, and then the
distribution of goods and movement of people will also be increased.
(2) Potential and Challenges of Development on Primary Products
1) Maize
(a) Production and Current Trade
During the farming season of 2013/2014, a total of 1,299,158 households, representing 88.2%
of all agricultural households grew maize in Zambia. The annual production of maize in 2014
was 3.35 million tonnes and it was far higher than other cereals such as wheat, millet, sorghum
and rice. The Eastern Province recorded the largest area among provinces with 23.7% of the
total cultivated areas in Zambia.
33 Most small scale farmers' tobacco is Burley tobacco, grown in the Eastern Province under contract with four companies: Alliance One (Stancom/Dimon), Zambia Leaf Tobacco Company (ZLTC), Africa Leaf (Zambia), and Tombwe Processing Limited. Tombwe is the only tobacco processor operating in Zambia. The other firms only purchase tobacco and either ship the unprocessed leaf to Malawi or Zimbabwe or process small amounts through the Tombwe facility for a fixed charge (currently USD0.30 per kilogram of green leaf). 34 Zambia Human Development Report 2016, UNDO, 2016
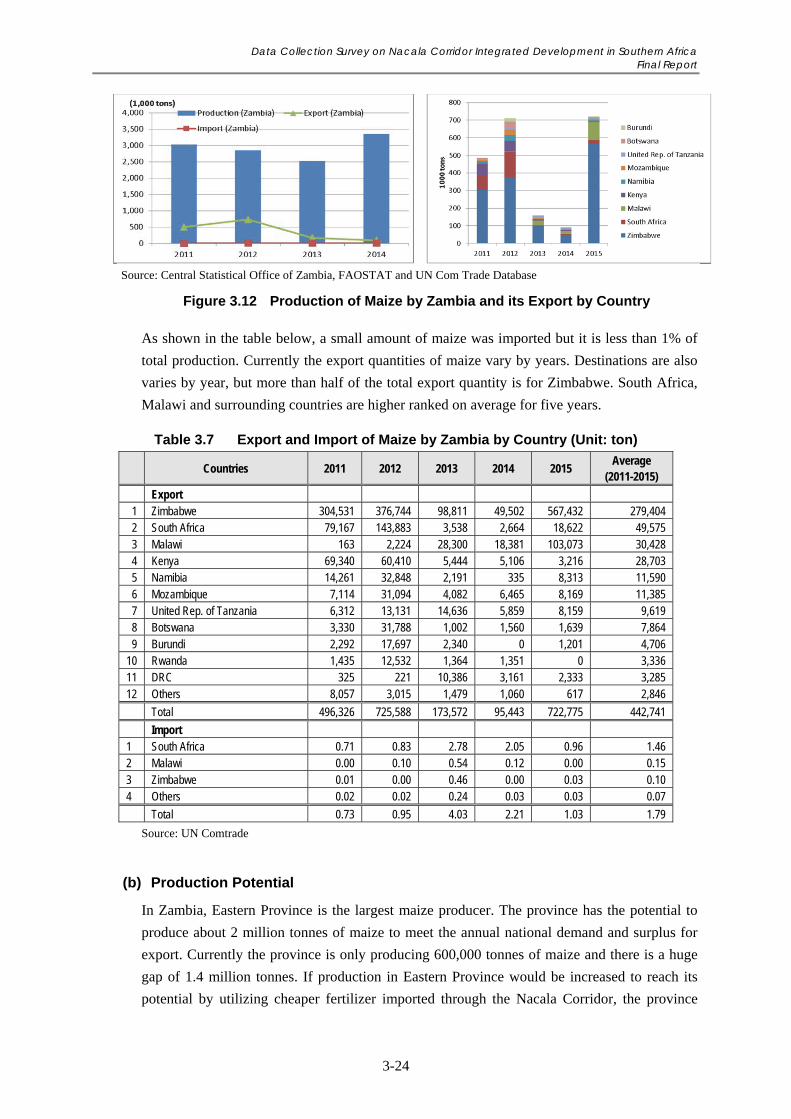
Data Collection Survey on Nacala Corridor Integrated Development in Southern Africa Final Report
3-24
As shown in the table below, a small amount of maize was imported but it is less than 1% of
total production. Currently the export quantities of maize vary by years. Destinations are also
varies by year, but more than half of the total export quantity is for Zimbabwe. South Africa,
Malawi and surrounding countries are higher ranked on average for five years.
Table 3.7 Export and Import of Maize by Zambia by Country (Unit: ton)
Countries 2011 2012 2013 2014 2015 Average
(2011-2015)
Export 1 Zimbabwe 304,531 376,744 98,811 49,502 567,432 279,404 2 South Africa 79,167 143,883 3,538 2,664 18,622 49,575 3 Malawi 163 2,224 28,300 18,381 103,073 30,428 4 Kenya 69,340 60,410 5,444 5,106 3,216 28,703 5 Namibia 14,261 32,848 2,191 335 8,313 11,590 6 Mozambique 7,114 31,094 4,082 6,465 8,169 11,385 7 United Rep. of Tanzania 6,312 13,131 14,636 5,859 8,159 9,619 8 Botswana 3,330 31,788 1,002 1,560 1,639 7,864 9 Burundi 2,292 17,697 2,340 0 1,201 4,706
10 Rwanda 1,435 12,532 1,364 1,351 0 3,336 11 DRC 325 221 10,386 3,161 2,333 3,285 12 Others 8,057 3,015 1,479 1,060 617 2,846
Total 496,326 725,588 173,572 95,443 722,775 442,741
Import 1 South Africa 0.71 0.83 2.78 2.05 0.96 1.46 2 Malawi 0.00 0.10 0.54 0.12 0.00 0.15 3 Zimbabwe 0.01 0.00 0.46 0.00 0.03 0.10 4 Others 0.02 0.02 0.24 0.03 0.03 0.07
Total 0.73 0.95 4.03 2.21 1.03 1.79
Source: UN Comtrade
(b) Production Potential
In Zambia, Eastern Province is the largest maize producer. The province has the potential to
produce about 2 million tonnes of maize to meet the annual national demand and surplus for
export. Currently the province is only producing 600,000 tonnes of maize and there is a huge
gap of 1.4 million tonnes. If production in Eastern Province would be increased to reach its
potential by utilizing cheaper fertilizer imported through the Nacala Corridor, the province
Figure 3.12 Production of Maize by Zambia and its Export by Country
Source: Central Statistical Office of Zambia, FAOSTAT and UN Com Trade Database
Data Collection Survey on Nacala Corridor Integrated Development in Southern Africa Final Report
3-25
would be capable of feeding the whole nation. Moreover, the import of cheaper fertiliser and
promotion of appropriate fertiliser application might be a necessary condition to produce
surplus for export.
(c) Potential Market in the Integrated Region (COMESA, SADC and EAC)
As of September 2017, COMESA has nineteen member states, SADC has fourteen and EAC
has six. If area of COMESA, SADC and EAC is assumed as one integrated regional market, it
consists of 27 countries. The scale of the commodities’ market in the integrated region is
estimated based on current trade volumes.
The integrated region with relatively large markets of imported maize such as Libya, South
Africa and Zimbabwe have increased import, and other countries like Kenya, Botswana,
Namibia, Mauritius and Swaziland have also been increasing import, although the amounts are
still smaller. Therefore, Zambia can expect to increase the export of maize to these
neighbouring countries.
Currently Zambia is one of the second largest exporters of maize in the region. The
competitors of maize exporters are South Africa, champion of the region, and Uganda,
Tanzania and others which changes year by year.
Source: Central Statistical Office of Zambia, FAOSTAT and UN Com Trade Database
Figure 3.13 Import of Maize by Country in the Integrated Region
Data Collection Survey on Nacala Corridor Integrated Development in Southern Africa Final Report
3-26
Table 3.8 Import of Maize by Country in COMESA, SADC and EAC (Unit: 1,000 ton)
Importer 2011 2012 2013 2014 2015 1 South Africa 109.96 308.82 4.04 86.57 697.32 2 Libya, State of 333.77 626.74 660.69 877.42 638.66 3 Zimbabwe 457.79 433.06 303.45 287.43 571.78 4 Kenya 353.31 324.62 93.47 458.94 250.35 5 Botswana 64.12 74.31 190.06 196.99 209.98 6 Namibia 58.71 66.81 166.94 104.31 140.65 7 Mauritius 92.78 89.64 99.74 90.23 109.76 8 Swaziland 0.00 80.15 75.32 84.92 95.78 9 Mozambique 87.37 6.54 38.06 151.50 119.12 10 Rwanda 66.56 101.15 62.94 89.60 0.00 11 Others 103.83 148.16 231.08 127.09 286.39
Total 1,728.21 2,260.00 1,925.78 2,555.00 3,119.78
Source; UN Comtrade, ITC35
Table 3.9 Export of Maize by Country in COMESA, SADC and EAC (Unit: 1,000 ton)
Exporter 2011 2012 2013 2014 2015 1 South Africa 2,975.95 1,578.87 2,603.10 2,147.84 762.24 2 Zambia 492.52 687.79 173.57 95.44 722.78 3 Uganda 95.44 177.95 103.95 112.93 281.09 4 United Rep. of Tanzania 2.94 175.30 40.45 274.43 57.76 5 Malawi 357.25 0.83 1.86 3.85 1.51 6 Ethiopia 60.15 0.00 0.00 0.00 0.43 7 Mozambique 14.38 7.00 1.45 38.83 0.10 8 Egypt 2.26 4.40 2.46 4.10 5.86 9 Kenya 12.02 4.23 1.26 1.98 0.00 10 Rwanda 2.74 7.25 7.49 1.80 1.86 11 others 11.62 7.54 5.20 4.12 5.41
Total 4,027.27 2,651.14 2,940.78 2,685.30 1,839.04
Source; UN Comtrade, ITC
2) Soya Bean
(a) Production and Current Trade
In 2014, the total amount of soya bean production was 214,179 tonnes in Zambia36 and only
36,824 tonnes was produced by small and medium scale farmers37. So, soya beans are
produced mainly by medium-large scale farmers or commercial farms in Zambia. The current
trade of soya beans by Zambia is not large. It is exported mainly to Zimbabwe, South Africa
and Botswana, and imported from Malawi and others.
35 Data of Egypt is not included due to its uncertainness 36 FAO stat data (dated on Sep 7, 2017) 37 Post Harvest Survey 2013 – 2014 Agriculture Season (Small and Medium Scale Farms), Central Statistical office of Zambia
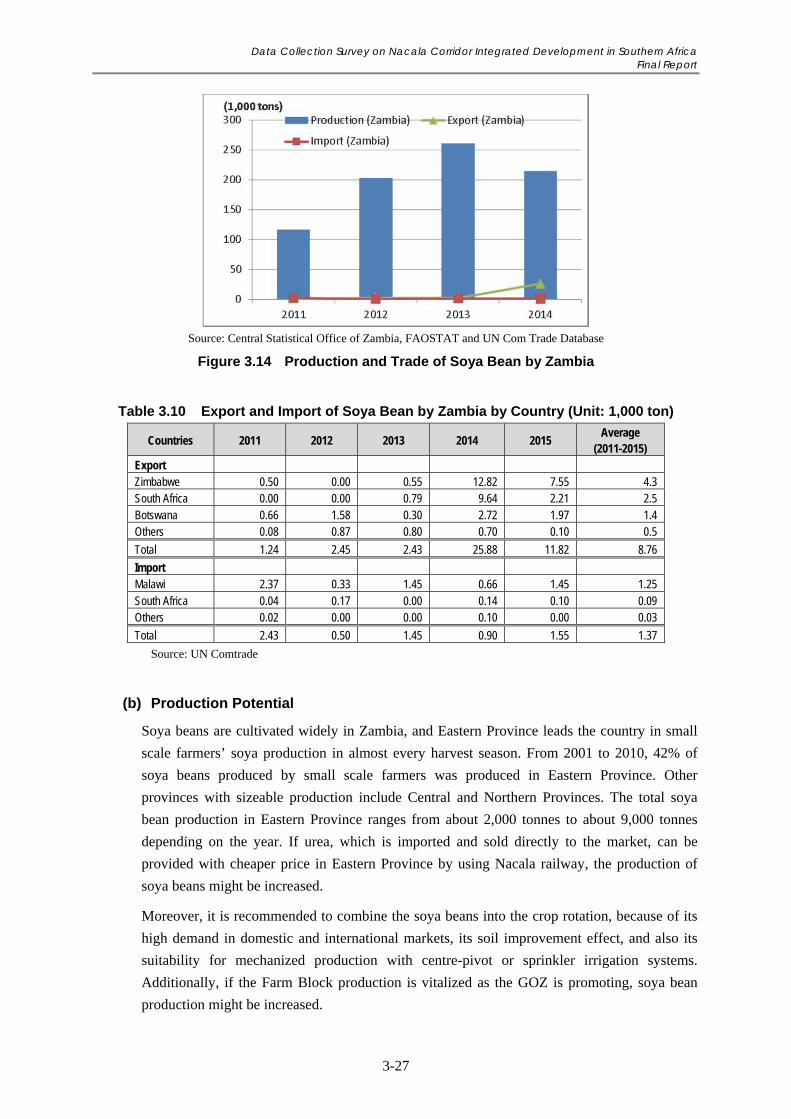
Data Collection Survey on Nacala Corridor Integrated Development in Southern Africa Final Report
3-27
Source: Central Statistical Office of Zambia, FAOSTAT and UN Com Trade Database
Figure 3.14 Production and Trade of Soya Bean by Zambia
Table 3.10 Export and Import of Soya Bean by Zambia by Country (Unit: 1,000 ton)
Countries 2011 2012 2013 2014 2015 Average
(2011-2015) Export Zimbabwe 0.50 0.00 0.55 12.82 7.55 4.3 South Africa 0.00 0.00 0.79 9.64 2.21 2.5 Botswana 0.66 1.58 0.30 2.72 1.97 1.4 Others 0.08 0.87 0.80 0.70 0.10 0.5
Total 1.24 2.45 2.43 25.88 11.82 8.76
Import Malawi 2.37 0.33 1.45 0.66 1.45 1.25 South Africa 0.04 0.17 0.00 0.14 0.10 0.09 Others 0.02 0.00 0.00 0.10 0.00 0.03
Total 2.43 0.50 1.45 0.90 1.55 1.37
Source: UN Comtrade
(b) Production Potential
Soya beans are cultivated widely in Zambia, and Eastern Province leads the country in small
scale farmers’ soya production in almost every harvest season. From 2001 to 2010, 42% of
soya beans produced by small scale farmers was produced in Eastern Province. Other
provinces with sizeable production include Central and Northern Provinces. The total soya
bean production in Eastern Province ranges from about 2,000 tonnes to about 9,000 tonnes
depending on the year. If urea, which is imported and sold directly to the market, can be
provided with cheaper price in Eastern Province by using Nacala railway, the production of
soya beans might be increased.
Moreover, it is recommended to combine the soya beans into the crop rotation, because of its
high demand in domestic and international markets, its soil improvement effect, and also its
suitability for mechanized production with centre-pivot or sprinkler irrigation systems.
Additionally, if the Farm Block production is vitalized as the GOZ is promoting, soya bean
production might be increased.
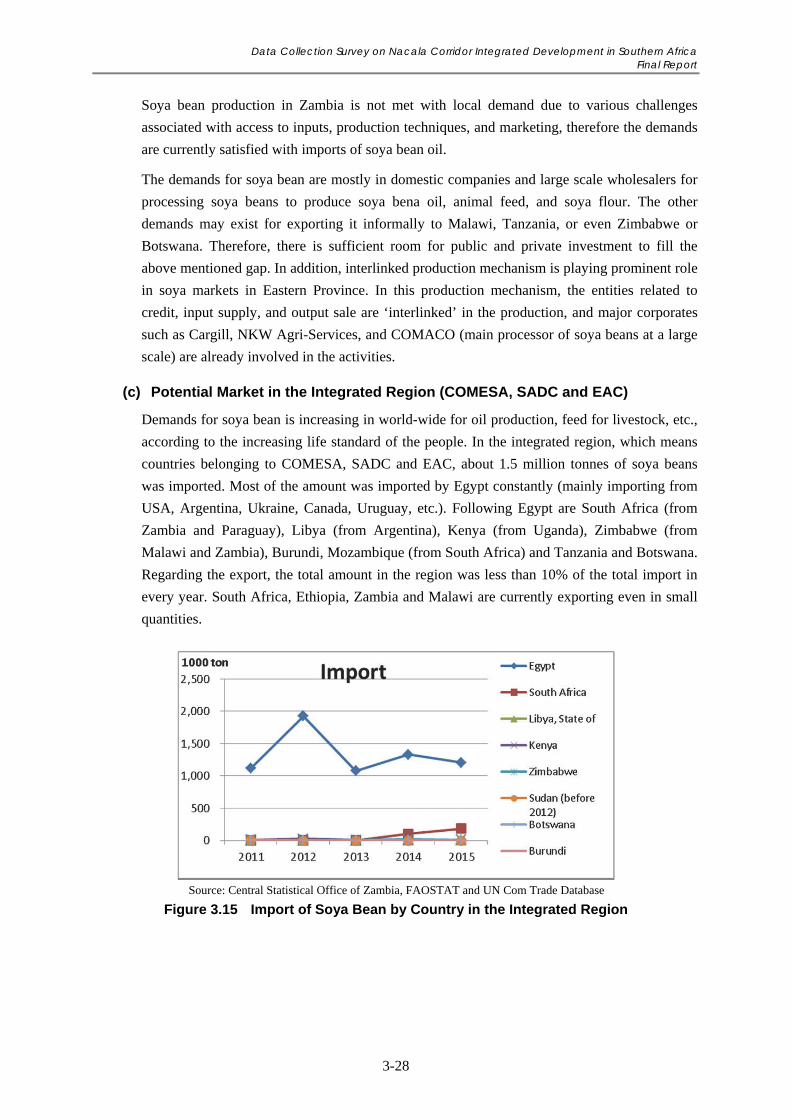
Data Collection Survey on Nacala Corridor Integrated Development in Southern Africa Final Report
3-28
Soya bean production in Zambia is not met with local demand due to various challenges
associated with access to inputs, production techniques, and marketing, therefore the demands
are currently satisfied with imports of soya bean oil.
The demands for soya bean are mostly in domestic companies and large scale wholesalers for
processing soya beans to produce soya bena oil, animal feed, and soya flour. The other
demands may exist for exporting it informally to Malawi, Tanzania, or even Zimbabwe or
Botswana. Therefore, there is sufficient room for public and private investment to fill the
above mentioned gap. In addition, interlinked production mechanism is playing prominent role
in soya markets in Eastern Province. In this production mechanism, the entities related to
credit, input supply, and output sale are ‘interlinked’ in the production, and major corporates
such as Cargill, NKW Agri-Services, and COMACO (main processor of soya beans at a large
scale) are already involved in the activities.
(c) Potential Market in the Integrated Region (COMESA, SADC and EAC)
Demands for soya bean is increasing in world-wide for oil production, feed for livestock, etc.,
according to the increasing life standard of the people. In the integrated region, which means
countries belonging to COMESA, SADC and EAC, about 1.5 million tonnes of soya beans
was imported. Most of the amount was imported by Egypt constantly (mainly importing from
USA, Argentina, Ukraine, Canada, Uruguay, etc.). Following Egypt are South Africa (from
Zambia and Paraguay), Libya (from Argentina), Kenya (from Uganda), Zimbabwe (from
Malawi and Zambia), Burundi, Mozambique (from South Africa) and Tanzania and Botswana.
Regarding the export, the total amount in the region was less than 10% of the total import in
every year. South Africa, Ethiopia, Zambia and Malawi are currently exporting even in small
quantities.
Source: Central Statistical Office of Zambia, FAOSTAT and UN Com Trade Database
Figure 3.15 Import of Soya Bean by Country in the Integrated Region
Data Collection Survey on Nacala Corridor Integrated Development in Southern Africa Final Report
3-29
Table 3.11 Import of Soya Bean by Country in COMESA, SADC and EAC (Unit: 1,000 ton)
Importer 2011 2012 2013 2014 2015
1 Egypt 1,115.80 1,922.85 1,079.71 1,331.44 1,206.49 2 South Africa 1.54 0.98 4.46 103.64 182.15 3 Libya, State of 0.00 0.13 0.03 0.20 3.30 4 Kenya 12.57 27.25 6.35 4.23 10.23 5 Zimbabwe 3.26 0.46 5.17 17.38 14.24 6 Sudan (before 2012) 6.99 0.00 0.00 0.00 0.00 7 Botswana 3.18 3.53 2.33 0.36 1.95 8 Burundi 8.80 3.77 0.00 0.01 0.00 9 Mozambique 1.61 3.22 0.84 0.72 3.49 10 United Rep. of Tanzania 0.31 0.92 0.72 3.06 0.75 11 Others 7.16 6.31 3.52 3.95 4.13
Total 1,161.21 1,969.41 1,103.12 1,464.98 1,426.73
Source; UN Comtrade, ITC
Table 3.12 Export of Soya Bean by Country in COMESA, SADC and EAC (Unit: 1,000 ton)
Exporter 2011 2012 2013 2014 2015
1 South Africa 44.73 160.20 17.65 1.92 5.68 2 Ethiopia 1.00 4.22 36.56 35.53 32.70 3 Malawi 5.04 4.56 14.33 23.24 9.56 4 Zambia 1.24 2.45 2.43 25.88 11.82 5 Uganda 1.80 2.75 2.06 1.36 7.79 6 Egypt 0.08 1.10 0.07 1.18 0.65 7 United Rep. of Tanzania 0.55 0.22 1.93 0.53 0.00 8 Mozambique 0.03 0.00 1.06 1.50 0.09 9 Kenya 0.34 1.40 0.15 0.00 0.25 10 Djibouti 0.00 0.00 0.22 0.92 0.66 11 others 0.63 0.49 0.72 1.26 0.33
Total 56.06 177.87 77.88 94.58 69.86
Source; UN Comtrade, ITC
3) Wheat
(a) Production and Current Trade
Wheat is one of the important crops in Zambia. Its recent annual domestic production is
between 200,000 to 270,000 tonnes. In Zambia, the production of the maize is the largest,
followed by soya bean and wheat in turn. Usually, commercial farmers in large- or
middle-scale prefer to produce soya beans in the rainy season and wheat (with irrigation) in
the dry season.
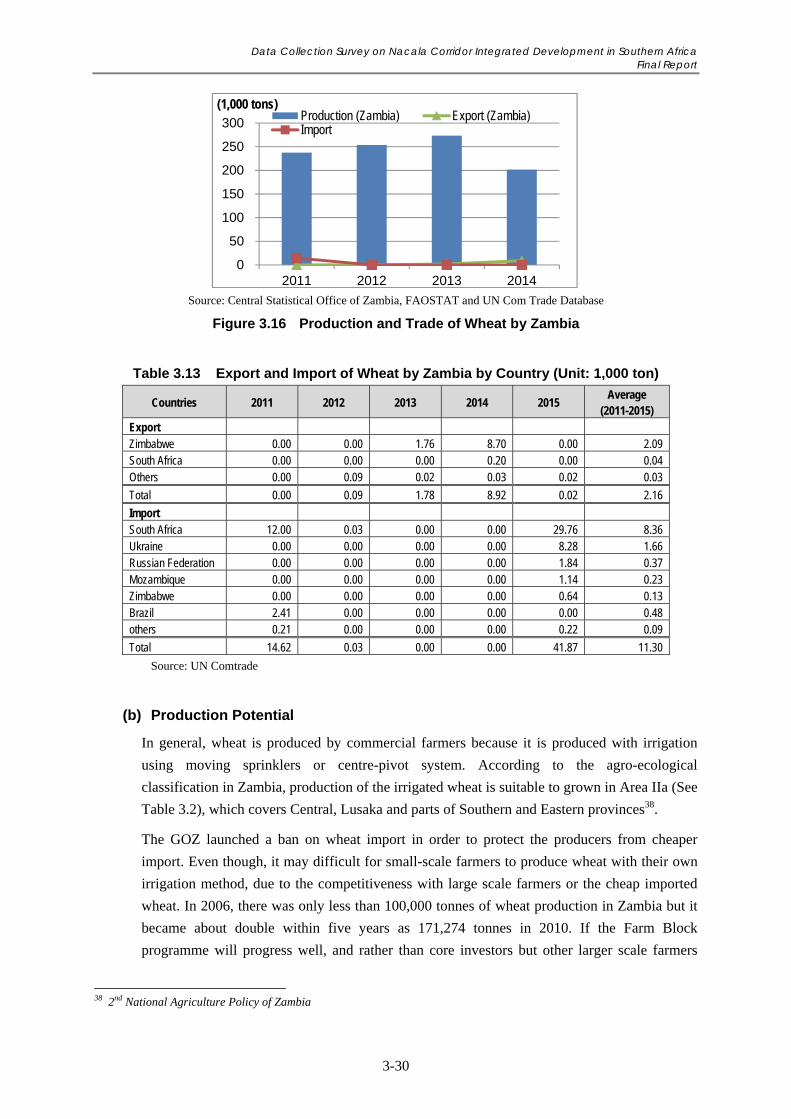
Data Collection Survey on Nacala Corridor Integrated Development in Southern Africa Final Report
3-30
Source: Central Statistical Office of Zambia, FAOSTAT and UN Com Trade Database
Figure 3.16 Production and Trade of Wheat by Zambia
Table 3.13 Export and Import of Wheat by Zambia by Country (Unit: 1,000 ton)
Countries 2011 2012 2013 2014 2015 Average
(2011-2015) Export Zimbabwe 0.00 0.00 1.76 8.70 0.00 2.09 South Africa 0.00 0.00 0.00 0.20 0.00 0.04 Others 0.00 0.09 0.02 0.03 0.02 0.03
Total 0.00 0.09 1.78 8.92 0.02 2.16
Import South Africa 12.00 0.03 0.00 0.00 29.76 8.36 Ukraine 0.00 0.00 0.00 0.00 8.28 1.66 Russian Federation 0.00 0.00 0.00 0.00 1.84 0.37 Mozambique 0.00 0.00 0.00 0.00 1.14 0.23 Zimbabwe 0.00 0.00 0.00 0.00 0.64 0.13 Brazil 2.41 0.00 0.00 0.00 0.00 0.48 others 0.21 0.00 0.00 0.00 0.22 0.09
Total 14.62 0.03 0.00 0.00 41.87 11.30
Source: UN Comtrade
(b) Production Potential
In general, wheat is produced by commercial farmers because it is produced with irrigation
using moving sprinklers or centre-pivot system. According to the agro-ecological
classification in Zambia, production of the irrigated wheat is suitable to grown in Area IIa (See
Table 3.2), which covers Central, Lusaka and parts of Southern and Eastern provinces38.
The GOZ launched a ban on wheat import in order to protect the producers from cheaper
import. Even though, it may difficult for small-scale farmers to produce wheat with their own
irrigation method, due to the competitiveness with large scale farmers or the cheap imported
wheat. In 2006, there was only less than 100,000 tonnes of wheat production in Zambia but it
became about double within five years as 171,274 tonnes in 2010. If the Farm Block
programme will progress well, and rather than core investors but other larger scale farmers
38 2nd National Agriculture Policy of Zambia
0
50
100
150
200
250
300
2011 2012 2013 2014
(1,000 tons)Production (Zambia) Export (Zambia)Import
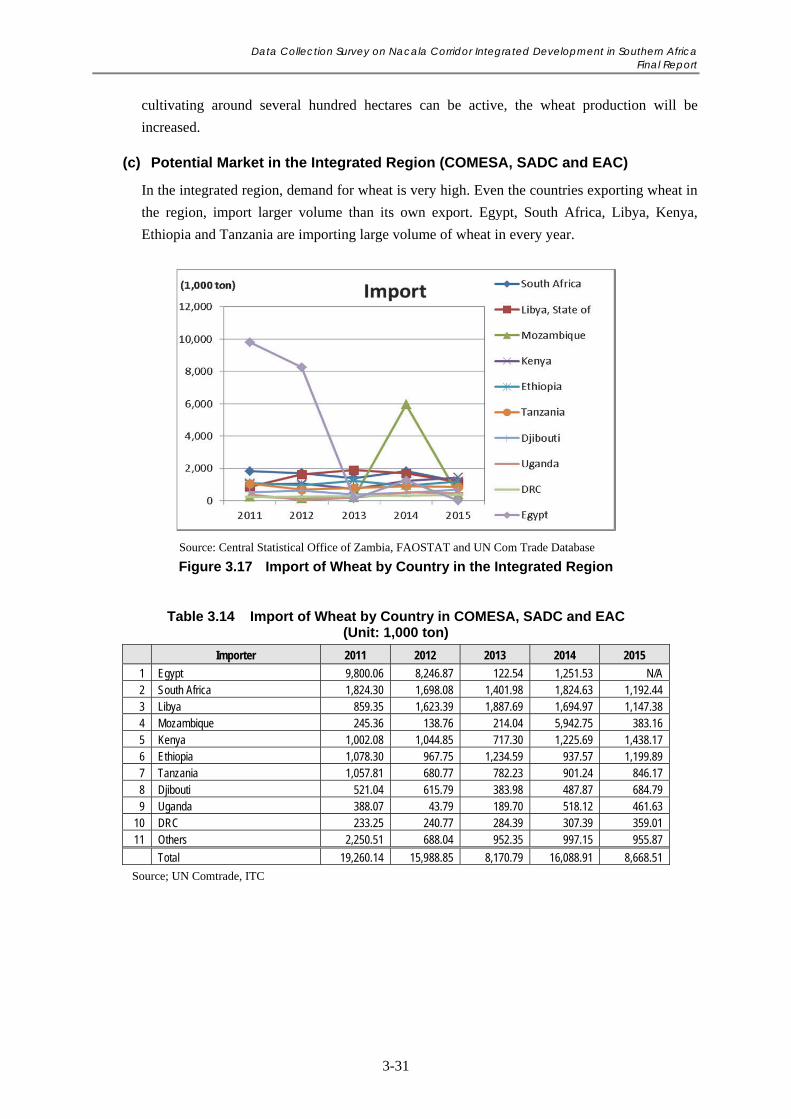
Data Collection Survey on Nacala Corridor Integrated Development in Southern Africa Final Report
3-31
cultivating around several hundred hectares can be active, the wheat production will be
increased.
(c) Potential Market in the Integrated Region (COMESA, SADC and EAC)
In the integrated region, demand for wheat is very high. Even the countries exporting wheat in
the region, import larger volume than its own export. Egypt, South Africa, Libya, Kenya,
Ethiopia and Tanzania are importing large volume of wheat in every year.
Source: Central Statistical Office of Zambia, FAOSTAT and UN Com Trade Database
Figure 3.17 Import of Wheat by Country in the Integrated Region
Table 3.14 Import of Wheat by Country in COMESA, SADC and EAC (Unit: 1,000 ton)
Importer 2011 2012 2013 2014 2015
1 Egypt 9,800.06 8,246.87 122.54 1,251.53 N/A 2 South Africa 1,824.30 1,698.08 1,401.98 1,824.63 1,192.44 3 Libya 859.35 1,623.39 1,887.69 1,694.97 1,147.38 4 Mozambique 245.36 138.76 214.04 5,942.75 383.16 5 Kenya 1,002.08 1,044.85 717.30 1,225.69 1,438.17 6 Ethiopia 1,078.30 967.75 1,234.59 937.57 1,199.89 7 Tanzania 1,057.81 680.77 782.23 901.24 846.17 8 Djibouti 521.04 615.79 383.98 487.87 684.79 9 Uganda 388.07 43.79 189.70 518.12 461.63
10 DRC 233.25 240.77 284.39 307.39 359.01 11 Others 2,250.51 688.04 952.35 997.15 955.87
Total 19,260.14 15,988.85 8,170.79 16,088.91 8,668.51
Source; UN Comtrade, ITC
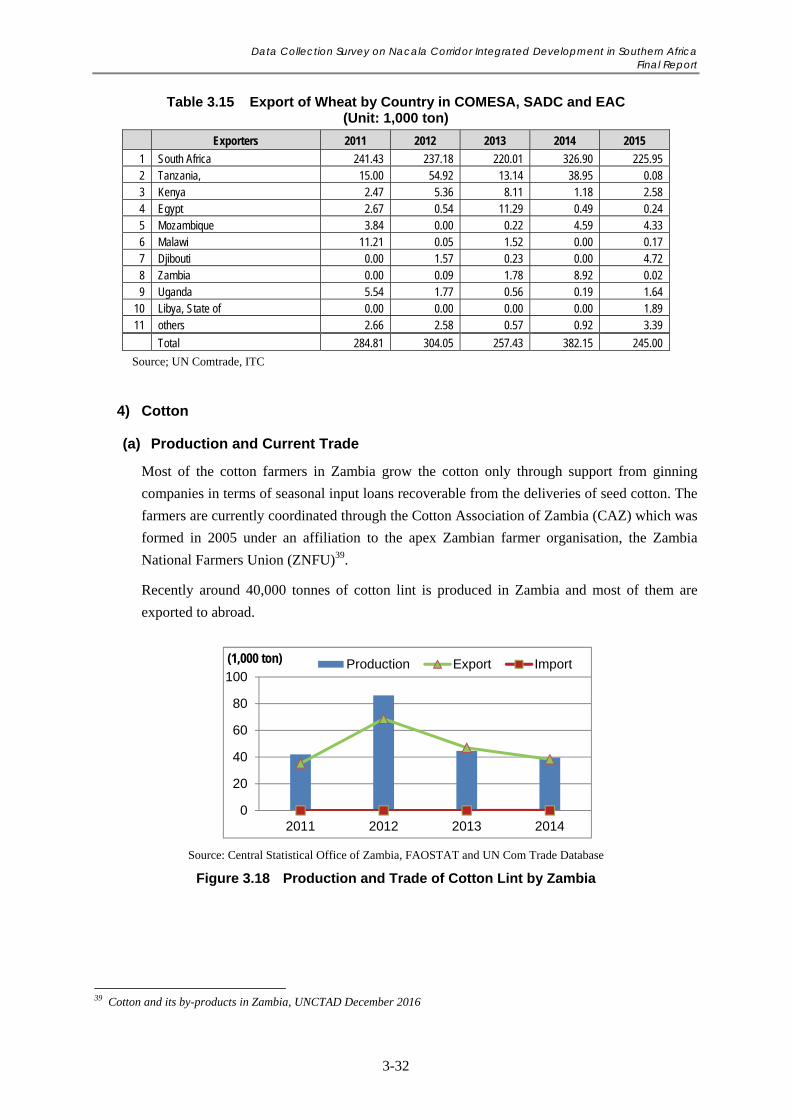
Data Collection Survey on Nacala Corridor Integrated Development in Southern Africa Final Report
3-32
Table 3.15 Export of Wheat by Country in COMESA, SADC and EAC (Unit: 1,000 ton)
Exporters 2011 2012 2013 2014 2015
1 South Africa 241.43 237.18 220.01 326.90 225.95 2 Tanzania, 15.00 54.92 13.14 38.95 0.08 3 Kenya 2.47 5.36 8.11 1.18 2.58 4 Egypt 2.67 0.54 11.29 0.49 0.24 5 Mozambique 3.84 0.00 0.22 4.59 4.33 6 Malawi 11.21 0.05 1.52 0.00 0.17 7 Djibouti 0.00 1.57 0.23 0.00 4.72 8 Zambia 0.00 0.09 1.78 8.92 0.02 9 Uganda 5.54 1.77 0.56 0.19 1.64
10 Libya, State of 0.00 0.00 0.00 0.00 1.89 11 others 2.66 2.58 0.57 0.92 3.39
Total 284.81 304.05 257.43 382.15 245.00
Source; UN Comtrade, ITC
4) Cotton
(a) Production and Current Trade
Most of the cotton farmers in Zambia grow the cotton only through support from ginning
companies in terms of seasonal input loans recoverable from the deliveries of seed cotton. The
farmers are currently coordinated through the Cotton Association of Zambia (CAZ) which was
formed in 2005 under an affiliation to the apex Zambian farmer organisation, the Zambia
National Farmers Union (ZNFU)39.
Recently around 40,000 tonnes of cotton lint is produced in Zambia and most of them are
exported to abroad.
Source: Central Statistical Office of Zambia, FAOSTAT and UN Com Trade Database
Figure 3.18 Production and Trade of Cotton Lint by Zambia
39 Cotton and its by-products in Zambia, UNCTAD December 2016
0
20
40
60
80
100
2011 2012 2013 2014
(1,000 ton) Production Export Import
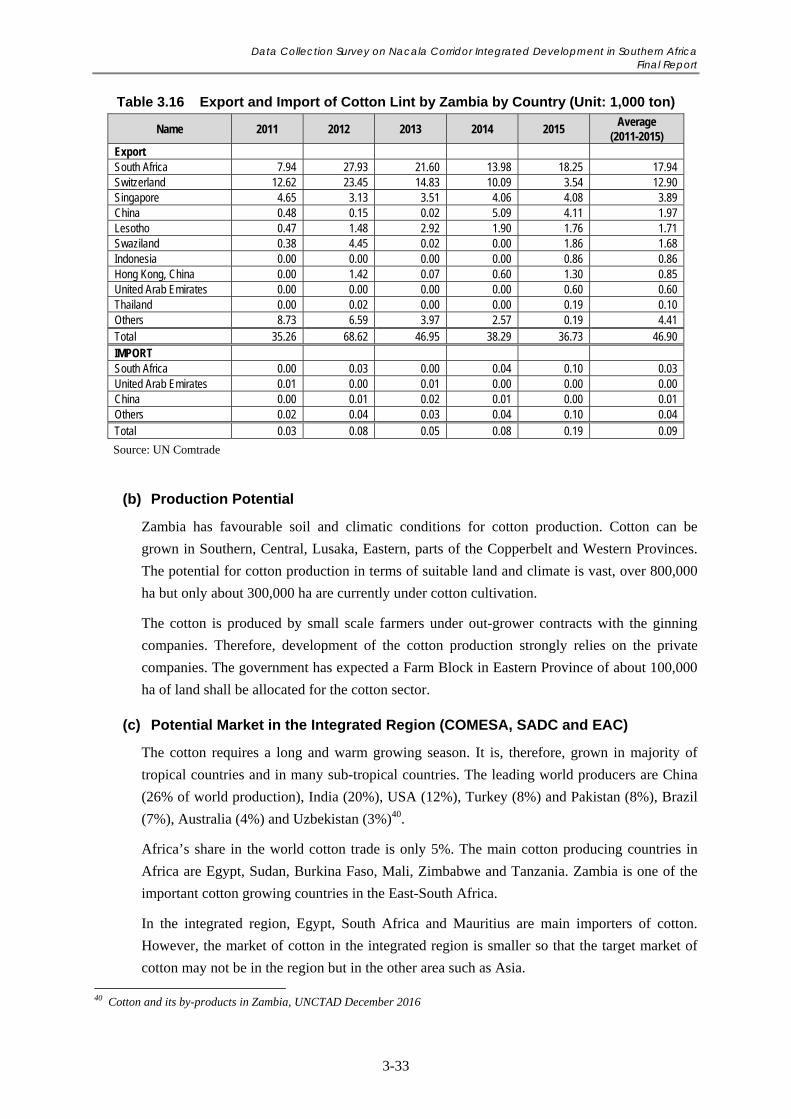
Data Collection Survey on Nacala Corridor Integrated Development in Southern Africa Final Report
3-33
Table 3.16 Export and Import of Cotton Lint by Zambia by Country (Unit: 1,000 ton)
Name 2011 2012 2013 2014 2015 Average
(2011-2015) Export South Africa 7.94 27.93 21.60 13.98 18.25 17.94 Switzerland 12.62 23.45 14.83 10.09 3.54 12.90 Singapore 4.65 3.13 3.51 4.06 4.08 3.89 China 0.48 0.15 0.02 5.09 4.11 1.97 Lesotho 0.47 1.48 2.92 1.90 1.76 1.71 Swaziland 0.38 4.45 0.02 0.00 1.86 1.68 Indonesia 0.00 0.00 0.00 0.00 0.86 0.86 Hong Kong, China 0.00 1.42 0.07 0.60 1.30 0.85 United Arab Emirates 0.00 0.00 0.00 0.00 0.60 0.60 Thailand 0.00 0.02 0.00 0.00 0.19 0.10 Others 8.73 6.59 3.97 2.57 0.19 4.41 Total 35.26 68.62 46.95 38.29 36.73 46.90 IMPORT South Africa 0.00 0.03 0.00 0.04 0.10 0.03 United Arab Emirates 0.01 0.00 0.01 0.00 0.00 0.00 China 0.00 0.01 0.02 0.01 0.00 0.01 Others 0.02 0.04 0.03 0.04 0.10 0.04 Total 0.03 0.08 0.05 0.08 0.19 0.09
Source: UN Comtrade
(b) Production Potential
Zambia has favourable soil and climatic conditions for cotton production. Cotton can be
grown in Southern, Central, Lusaka, Eastern, parts of the Copperbelt and Western Provinces.
The potential for cotton production in terms of suitable land and climate is vast, over 800,000
ha but only about 300,000 ha are currently under cotton cultivation.
The cotton is produced by small scale farmers under out-grower contracts with the ginning
companies. Therefore, development of the cotton production strongly relies on the private
companies. The government has expected a Farm Block in Eastern Province of about 100,000
ha of land shall be allocated for the cotton sector.
(c) Potential Market in the Integrated Region (COMESA, SADC and EAC)
The cotton requires a long and warm growing season. It is, therefore, grown in majority of
tropical countries and in many sub-tropical countries. The leading world producers are China
(26% of world production), India (20%), USA (12%), Turkey (8%) and Pakistan (8%), Brazil
(7%), Australia (4%) and Uzbekistan (3%)40.
Africa’s share in the world cotton trade is only 5%. The main cotton producing countries in
Africa are Egypt, Sudan, Burkina Faso, Mali, Zimbabwe and Tanzania. Zambia is one of the
important cotton growing countries in the East-South Africa.
In the integrated region, Egypt, South Africa and Mauritius are main importers of cotton.
However, the market of cotton in the integrated region is smaller so that the target market of
cotton may not be in the region but in the other area such as Asia. 40 Cotton and its by-products in Zambia, UNCTAD December 2016
Data Collection Survey on Nacala Corridor Integrated Development in Southern Africa Final Report
3-34
Source: Central Statistical Office of Zambia, FAOSTAT and UN Com Trade Database
Figure 3.19 Import of Cotton Lint by County in the Integrated Region
Table 3.17 Import of Cotton Lint by Country in COMESA, SADC and EAC (Unit: 1,000 ton)
Importer 2011 2012 2013 2014 2015
1 Egypt 43.65 12.88 70.03 75.35 70.32 2 Mauritius 22.32 19.19 21.61 19.41 27.27 3 Mozambique 0.00 0.00 0.00 0.00 0.44 4 South Africa 32.99 39.13 41.61 28.00 9.66 5 Lesotho 16.56 8.70 N/A 1.53 1.24 6 Swaziland 0.31 0.95 1.47 1.61 2.14 7 Tanzania, United Republic of 0.02 0.01 0.00 0.00 0.00 8 Zimbabwe 0.62 5.72 8.30 0.65 1.26 9 Djibouti 0.13 0.79 1.25 1.09 0.77
10 Kenya 1.95 0.10 0.08 0.08 0.01 11 Others 2.44 3.25 5.32 9.64 4.83
Total 120.97 90.70 149.67 137.36 117.93
Source; UN Comtrade, ITC
Table 3.18 Export of Cotton Lint by Country in COMESA, SADC and EAC (Unit: 1,000 ton)
Exporters 2011 2012 2013 2014 2015
1 Egypt 61.22 72.97 42.03 24.76 47.83 2 Zambia 35.26 68.62 46.95 38.29 36.73 3 Tanzania, United Republic of 30.33 92.82 68.27 35.69 23.61 4 Mozambique 8.95 2.19 53.80 23.42 21.64 5 Zimbabwe 89.47 132.37 58.39 40.04 34.18 6 South Africa 11.11 12.57 4.89 3.44 4.89 7 Uganda 1.58 3.90 2.40 1.60 1.11 8 Madagascar 0.30 0.77 3.67 7.90 8.46 9 Malawi 9.46 26.25 11.45 11.47 16.09
10 Lesotho 0.01 0.02 N/A 0.09 0.00 11 Others 6.99 0.02 0.55 0.07 1.63
Total 254.67 412.49 292.39 186.77 196.16
Source; UN Comtrade, ITC
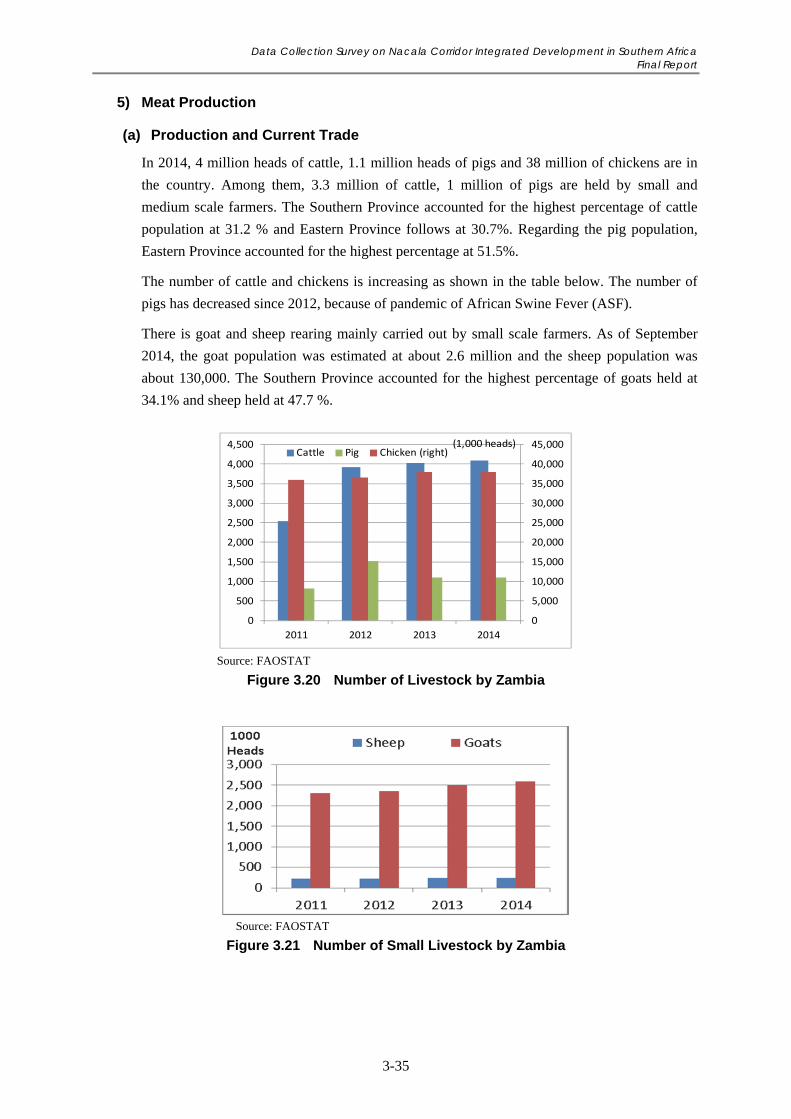
Data Collection Survey on Nacala Corridor Integrated Development in Southern Africa Final Report
3-35
5) Meat Production
(a) Production and Current Trade
In 2014, 4 million heads of cattle, 1.1 million heads of pigs and 38 million of chickens are in
the country. Among them, 3.3 million of cattle, 1 million of pigs are held by small and
medium scale farmers. The Southern Province accounted for the highest percentage of cattle
population at 31.2 % and Eastern Province follows at 30.7%. Regarding the pig population,
Eastern Province accounted for the highest percentage at 51.5%.
The number of cattle and chickens is increasing as shown in the table below. The number of
pigs has decreased since 2012, because of pandemic of African Swine Fever (ASF).
There is goat and sheep rearing mainly carried out by small scale farmers. As of September
2014, the goat population was estimated at about 2.6 million and the sheep population was
about 130,000. The Southern Province accounted for the highest percentage of goats held at
34.1% and sheep held at 47.7 %.
Source: FAOSTAT
Figure 3.20 Number of Livestock by Zambia
Source: FAOSTAT
Figure 3.21 Number of Small Livestock by Zambia
0
5,000
10,000
15,000
20,000
25,000
30,000
35,000
40,000
45,000
0
500
1,000
1,500
2,000
2,500
3,000
3,500
4,000
4,500
2011 2012 2013 2014
Cattle Pig Chicken (right)(1,000 heads)
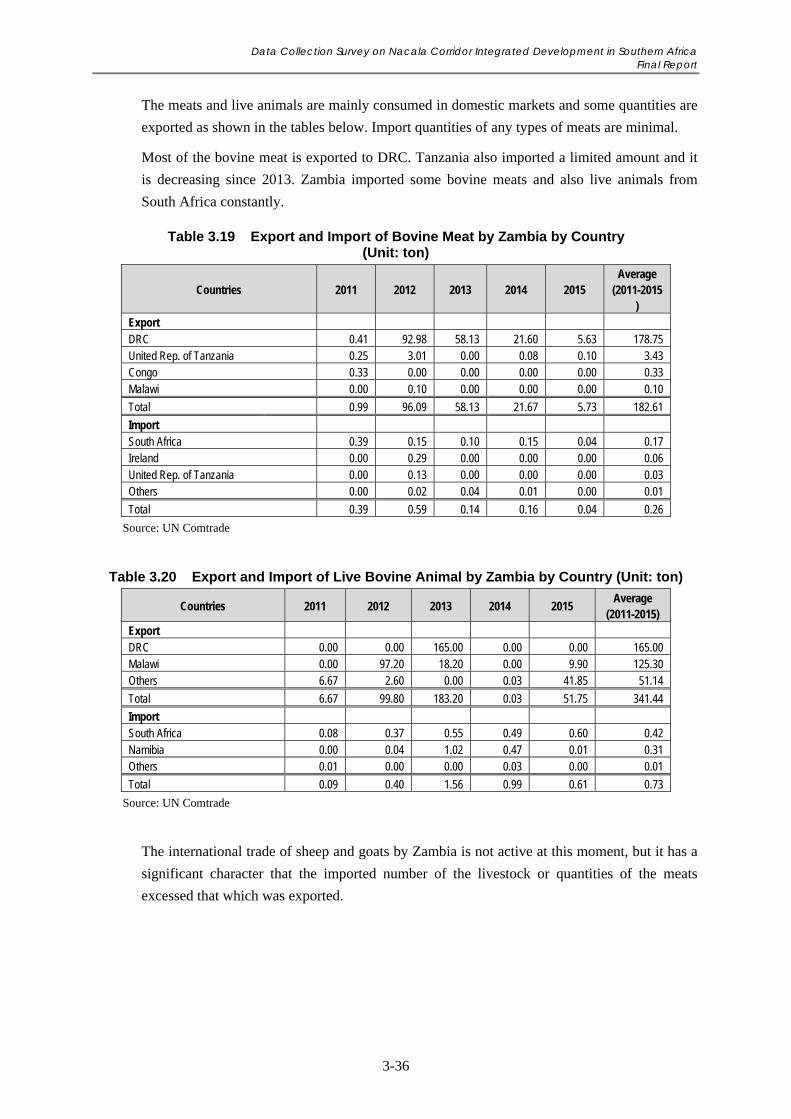
Data Collection Survey on Nacala Corridor Integrated Development in Southern Africa Final Report
3-36
The meats and live animals are mainly consumed in domestic markets and some quantities are
exported as shown in the tables below. Import quantities of any types of meats are minimal.
Most of the bovine meat is exported to DRC. Tanzania also imported a limited amount and it
is decreasing since 2013. Zambia imported some bovine meats and also live animals from
South Africa constantly.
Table 3.19 Export and Import of Bovine Meat by Zambia by Country (Unit: ton)
Countries 2011 2012 2013 2014 2015 Average
(2011-2015)
Export DRC 0.41 92.98 58.13 21.60 5.63 178.75 United Rep. of Tanzania 0.25 3.01 0.00 0.08 0.10 3.43 Congo 0.33 0.00 0.00 0.00 0.00 0.33 Malawi 0.00 0.10 0.00 0.00 0.00 0.10
Total 0.99 96.09 58.13 21.67 5.73 182.61
Import South Africa 0.39 0.15 0.10 0.15 0.04 0.17 Ireland 0.00 0.29 0.00 0.00 0.00 0.06 United Rep. of Tanzania 0.00 0.13 0.00 0.00 0.00 0.03 Others 0.00 0.02 0.04 0.01 0.00 0.01
Total 0.39 0.59 0.14 0.16 0.04 0.26
Source: UN Comtrade
Table 3.20 Export and Import of Live Bovine Animal by Zambia by Country (Unit: ton)
Countries 2011 2012 2013 2014 2015 Average
(2011-2015) Export DRC 0.00 0.00 165.00 0.00 0.00 165.00 Malawi 0.00 97.20 18.20 0.00 9.90 125.30 Others 6.67 2.60 0.00 0.03 41.85 51.14
Total 6.67 99.80 183.20 0.03 51.75 341.44
Import South Africa 0.08 0.37 0.55 0.49 0.60 0.42 Namibia 0.00 0.04 1.02 0.47 0.01 0.31 Others 0.01 0.00 0.00 0.03 0.00 0.01
Total 0.09 0.40 1.56 0.99 0.61 0.73
Source: UN Comtrade
The international trade of sheep and goats by Zambia is not active at this moment, but it has a
significant character that the imported number of the livestock or quantities of the meats
excessed that which was exported.
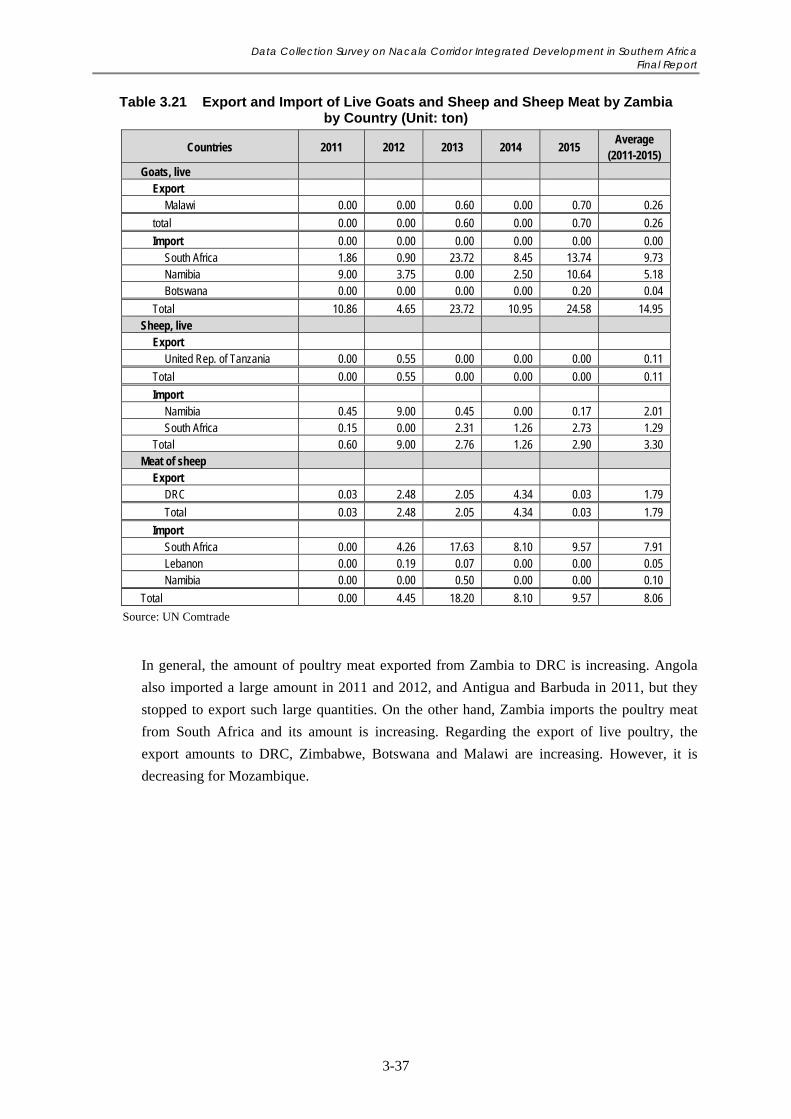
Data Collection Survey on Nacala Corridor Integrated Development in Southern Africa Final Report
3-37
Table 3.21 Export and Import of Live Goats and Sheep and Sheep Meat by Zambia by Country (Unit: ton)
Countries 2011 2012 2013 2014 2015 Average
(2011-2015) Goats, live
Export Malawi 0.00 0.00 0.60 0.00 0.70 0.26
total 0.00 0.00 0.60 0.00 0.70 0.26
Import 0.00 0.00 0.00 0.00 0.00 0.00 South Africa 1.86 0.90 23.72 8.45 13.74 9.73 Namibia 9.00 3.75 0.00 2.50 10.64 5.18 Botswana 0.00 0.00 0.00 0.00 0.20 0.04
Total 10.86 4.65 23.72 10.95 24.58 14.95 Sheep, live
Export United Rep. of Tanzania 0.00 0.55 0.00 0.00 0.00 0.11
Total 0.00 0.55 0.00 0.00 0.00 0.11
Import Namibia 0.45 9.00 0.45 0.00 0.17 2.01 South Africa 0.15 0.00 2.31 1.26 2.73 1.29
Total 0.60 9.00 2.76 1.26 2.90 3.30 Meat of sheep
Export DRC 0.03 2.48 2.05 4.34 0.03 1.79
Total 0.03 2.48 2.05 4.34 0.03 1.79
Import South Africa 0.00 4.26 17.63 8.10 9.57 7.91 Lebanon 0.00 0.19 0.07 0.00 0.00 0.05 Namibia 0.00 0.00 0.50 0.00 0.00 0.10
Total 0.00 4.45 18.20 8.10 9.57 8.06
Source: UN Comtrade
In general, the amount of poultry meat exported from Zambia to DRC is increasing. Angola
also imported a large amount in 2011 and 2012, and Antigua and Barbuda in 2011, but they
stopped to export such large quantities. On the other hand, Zambia imports the poultry meat
from South Africa and its amount is increasing. Regarding the export of live poultry, the
export amounts to DRC, Zimbabwe, Botswana and Malawi are increasing. However, it is
decreasing for Mozambique.
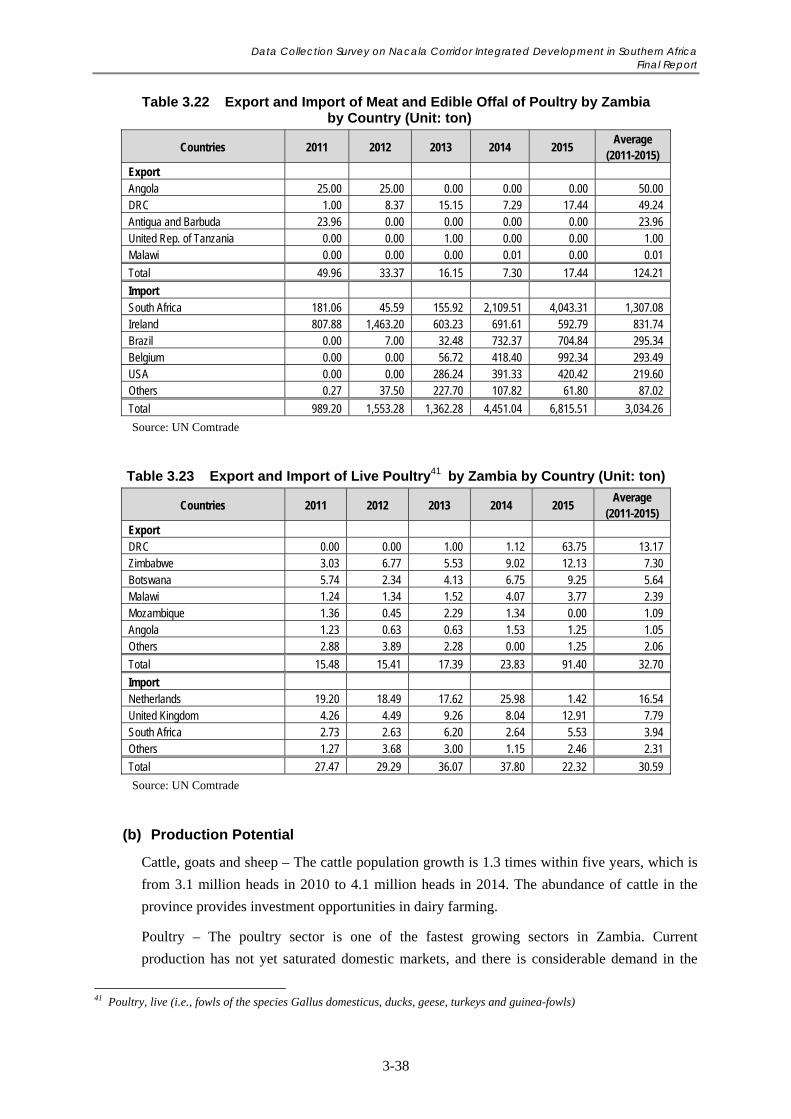
Data Collection Survey on Nacala Corridor Integrated Development in Southern Africa Final Report
3-38
Table 3.22 Export and Import of Meat and Edible Offal of Poultry by Zambia by Country (Unit: ton)
Countries 2011 2012 2013 2014 2015 Average
(2011-2015) Export Angola 25.00 25.00 0.00 0.00 0.00 50.00 DRC 1.00 8.37 15.15 7.29 17.44 49.24 Antigua and Barbuda 23.96 0.00 0.00 0.00 0.00 23.96 United Rep. of Tanzania 0.00 0.00 1.00 0.00 0.00 1.00 Malawi 0.00 0.00 0.00 0.01 0.00 0.01
Total 49.96 33.37 16.15 7.30 17.44 124.21
Import South Africa 181.06 45.59 155.92 2,109.51 4,043.31 1,307.08 Ireland 807.88 1,463.20 603.23 691.61 592.79 831.74 Brazil 0.00 7.00 32.48 732.37 704.84 295.34 Belgium 0.00 0.00 56.72 418.40 992.34 293.49 USA 0.00 0.00 286.24 391.33 420.42 219.60 Others 0.27 37.50 227.70 107.82 61.80 87.02
Total 989.20 1,553.28 1,362.28 4,451.04 6,815.51 3,034.26
Source: UN Comtrade
Table 3.23 Export and Import of Live Poultry41 by Zambia by Country (Unit: ton)
Countries 2011 2012 2013 2014 2015 Average
(2011-2015) Export DRC 0.00 0.00 1.00 1.12 63.75 13.17 Zimbabwe 3.03 6.77 5.53 9.02 12.13 7.30 Botswana 5.74 2.34 4.13 6.75 9.25 5.64 Malawi 1.24 1.34 1.52 4.07 3.77 2.39 Mozambique 1.36 0.45 2.29 1.34 0.00 1.09 Angola 1.23 0.63 0.63 1.53 1.25 1.05 Others 2.88 3.89 2.28 0.00 1.25 2.06
Total 15.48 15.41 17.39 23.83 91.40 32.70
Import Netherlands 19.20 18.49 17.62 25.98 1.42 16.54 United Kingdom 4.26 4.49 9.26 8.04 12.91 7.79 South Africa 2.73 2.63 6.20 2.64 5.53 3.94 Others 1.27 3.68 3.00 1.15 2.46 2.31
Total 27.47 29.29 36.07 37.80 22.32 30.59
Source: UN Comtrade
(b) Production Potential
Cattle, goats and sheep – The cattle population growth is 1.3 times within five years, which is
from 3.1 million heads in 2010 to 4.1 million heads in 2014. The abundance of cattle in the
province provides investment opportunities in dairy farming.
Poultry – The poultry sector is one of the fastest growing sectors in Zambia. Current
production has not yet saturated domestic markets, and there is considerable demand in the
41 Poultry, live (i.e., fowls of the species Gallus domesticus, ducks, geese, turkeys and guinea-fowls)
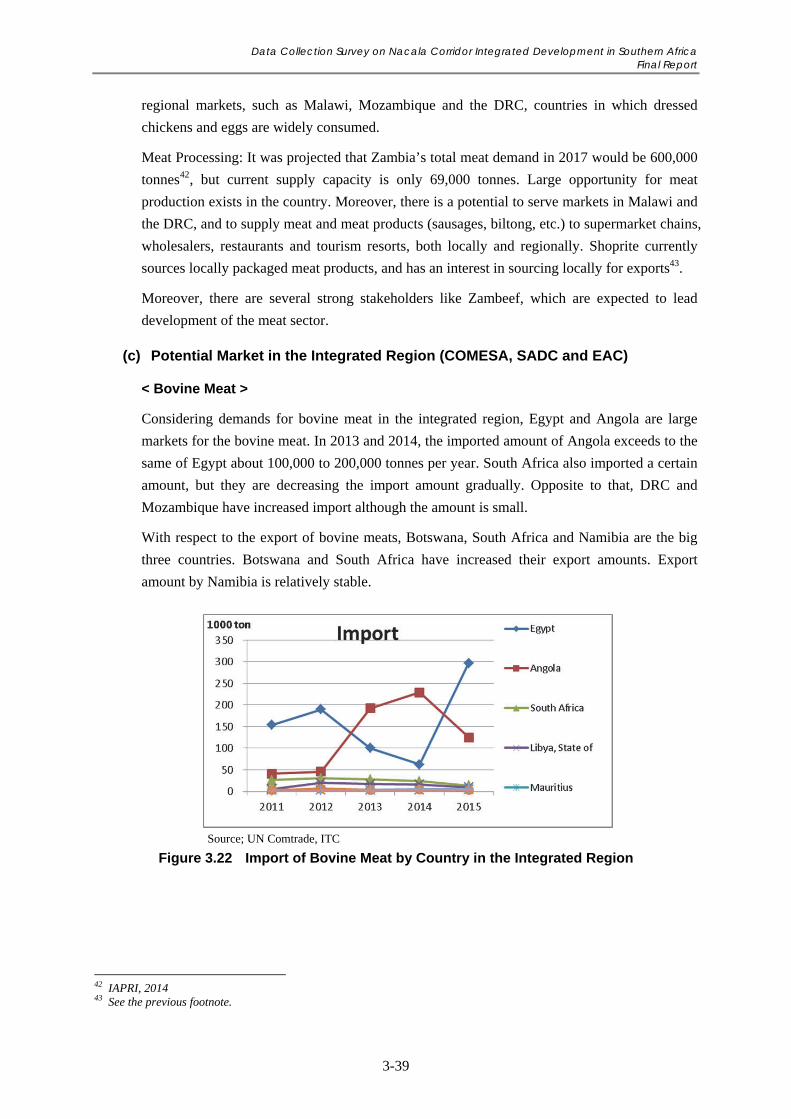
Data Collection Survey on Nacala Corridor Integrated Development in Southern Africa Final Report
3-39
regional markets, such as Malawi, Mozambique and the DRC, countries in which dressed
chickens and eggs are widely consumed.
Meat Processing: It was projected that Zambia’s total meat demand in 2017 would be 600,000
tonnes42, but current supply capacity is only 69,000 tonnes. Large opportunity for meat
production exists in the country. Moreover, there is a potential to serve markets in Malawi and
the DRC, and to supply meat and meat products (sausages, biltong, etc.) to supermarket chains,
wholesalers, restaurants and tourism resorts, both locally and regionally. Shoprite currently
sources locally packaged meat products, and has an interest in sourcing locally for exports43.
Moreover, there are several strong stakeholders like Zambeef, which are expected to lead
development of the meat sector.
(c) Potential Market in the Integrated Region (COMESA, SADC and EAC)
< Bovine Meat >
Considering demands for bovine meat in the integrated region, Egypt and Angola are large
markets for the bovine meat. In 2013 and 2014, the imported amount of Angola exceeds to the
same of Egypt about 100,000 to 200,000 tonnes per year. South Africa also imported a certain
amount, but they are decreasing the import amount gradually. Opposite to that, DRC and
Mozambique have increased import although the amount is small.
With respect to the export of bovine meats, Botswana, South Africa and Namibia are the big
three countries. Botswana and South Africa have increased their export amounts. Export
amount by Namibia is relatively stable.
Source; UN Comtrade, ITC
Figure 3.22 Import of Bovine Meat by Country in the Integrated Region
42 IAPRI, 2014 43 See the previous footnote.
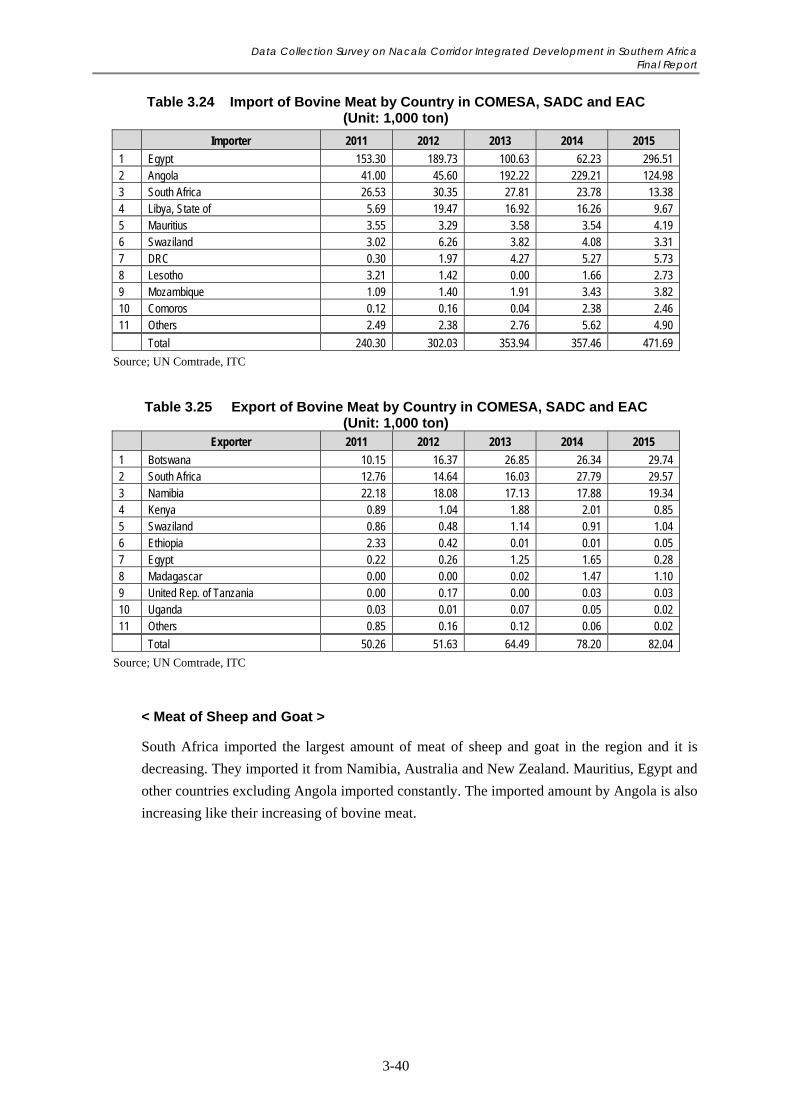
Data Collection Survey on Nacala Corridor Integrated Development in Southern Africa Final Report
3-40
Table 3.24 Import of Bovine Meat by Country in COMESA, SADC and EAC (Unit: 1,000 ton)
Importer 2011 2012 2013 2014 2015
1 Egypt 153.30 189.73 100.63 62.23 296.51 2 Angola 41.00 45.60 192.22 229.21 124.98 3 South Africa 26.53 30.35 27.81 23.78 13.38 4 Libya, State of 5.69 19.47 16.92 16.26 9.67 5 Mauritius 3.55 3.29 3.58 3.54 4.19 6 Swaziland 3.02 6.26 3.82 4.08 3.31 7 DRC 0.30 1.97 4.27 5.27 5.73 8 Lesotho 3.21 1.42 0.00 1.66 2.73 9 Mozambique 1.09 1.40 1.91 3.43 3.82 10 Comoros 0.12 0.16 0.04 2.38 2.46 11 Others 2.49 2.38 2.76 5.62 4.90
Total 240.30 302.03 353.94 357.46 471.69
Source; UN Comtrade, ITC
Table 3.25 Export of Bovine Meat by Country in COMESA, SADC and EAC (Unit: 1,000 ton)
Exporter 2011 2012 2013 2014 2015
1 Botswana 10.15 16.37 26.85 26.34 29.74 2 South Africa 12.76 14.64 16.03 27.79 29.57 3 Namibia 22.18 18.08 17.13 17.88 19.34 4 Kenya 0.89 1.04 1.88 2.01 0.85 5 Swaziland 0.86 0.48 1.14 0.91 1.04 6 Ethiopia 2.33 0.42 0.01 0.01 0.05 7 Egypt 0.22 0.26 1.25 1.65 0.28 8 Madagascar 0.00 0.00 0.02 1.47 1.10 9 United Rep. of Tanzania 0.00 0.17 0.00 0.03 0.03 10 Uganda 0.03 0.01 0.07 0.05 0.02 11 Others 0.85 0.16 0.12 0.06 0.02
Total 50.26 51.63 64.49 78.20 82.04
Source; UN Comtrade, ITC
< Meat of Sheep and Goat >
South Africa imported the largest amount of meat of sheep and goat in the region and it is
decreasing. They imported it from Namibia, Australia and New Zealand. Mauritius, Egypt and
other countries excluding Angola imported constantly. The imported amount by Angola is also
increasing like their increasing of bovine meat.
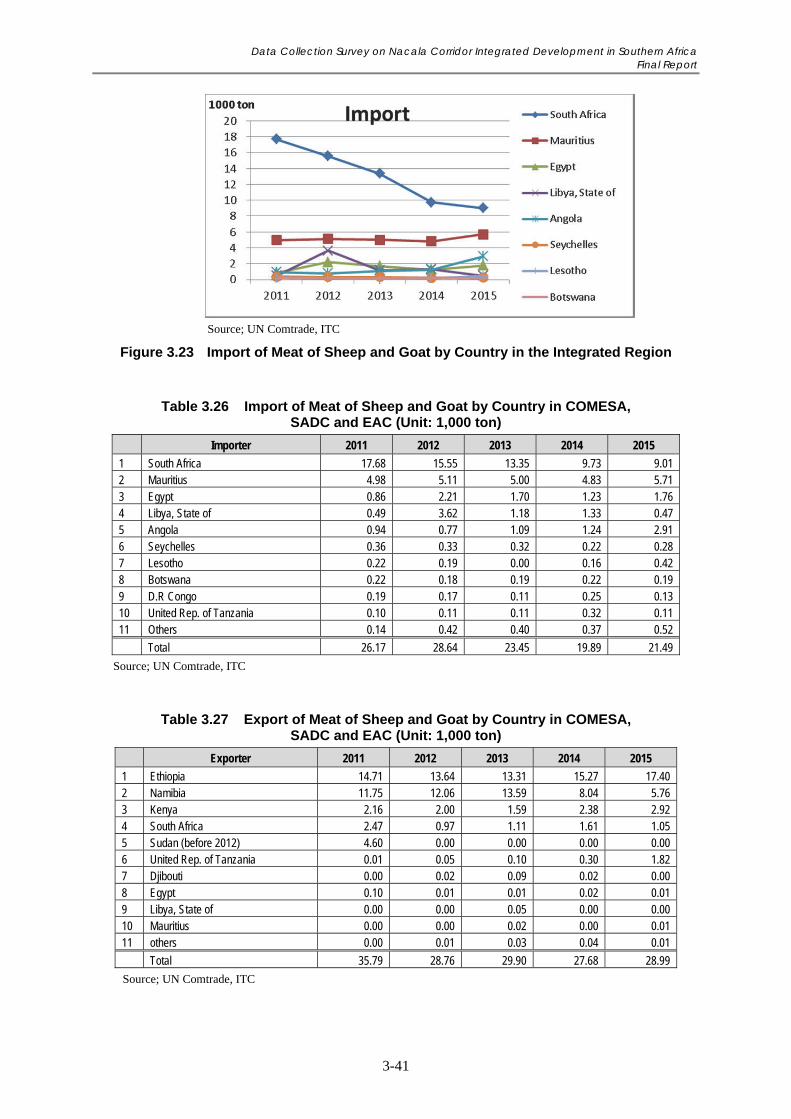
Data Collection Survey on Nacala Corridor Integrated Development in Southern Africa Final Report
3-41
Source; UN Comtrade, ITC
Figure 3.23 Import of Meat of Sheep and Goat by Country in the Integrated Region
Table 3.26 Import of Meat of Sheep and Goat by Country in COMESA, SADC and EAC (Unit: 1,000 ton)
Importer 2011 2012 2013 2014 2015
1 South Africa 17.68 15.55 13.35 9.73 9.01 2 Mauritius 4.98 5.11 5.00 4.83 5.71 3 Egypt 0.86 2.21 1.70 1.23 1.76 4 Libya, State of 0.49 3.62 1.18 1.33 0.47 5 Angola 0.94 0.77 1.09 1.24 2.91 6 Seychelles 0.36 0.33 0.32 0.22 0.28 7 Lesotho 0.22 0.19 0.00 0.16 0.42 8 Botswana 0.22 0.18 0.19 0.22 0.19 9 D.R Congo 0.19 0.17 0.11 0.25 0.13 10 United Rep. of Tanzania 0.10 0.11 0.11 0.32 0.11 11 Others 0.14 0.42 0.40 0.37 0.52
Total 26.17 28.64 23.45 19.89 21.49
Source; UN Comtrade, ITC
Table 3.27 Export of Meat of Sheep and Goat by Country in COMESA, SADC and EAC (Unit: 1,000 ton)
Exporter 2011 2012 2013 2014 2015
1 Ethiopia 14.71 13.64 13.31 15.27 17.40 2 Namibia 11.75 12.06 13.59 8.04 5.76 3 Kenya 2.16 2.00 1.59 2.38 2.92 4 South Africa 2.47 0.97 1.11 1.61 1.05 5 Sudan (before 2012) 4.60 0.00 0.00 0.00 0.00 6 United Rep. of Tanzania 0.01 0.05 0.10 0.30 1.82 7 Djibouti 0.00 0.02 0.09 0.02 0.00 8 Egypt 0.10 0.01 0.01 0.02 0.01 9 Libya, State of 0.00 0.00 0.05 0.00 0.00 10 Mauritius 0.00 0.00 0.02 0.00 0.01 11 others 0.00 0.01 0.03 0.04 0.01
Total 35.79 28.76 29.90 27.68 28.99
Source; UN Comtrade, ITC
Data Collection Survey on Nacala Corridor Integrated Development in Southern Africa Final Report
3-42
<Poultry>
The imported volume in Uganda, Zambia, Tanzania, Mozambique and Zimbabwe is
increasing gradually although in a small amount. The import of Botswana, Namibia and
Lesotho are stable. South Africa, Zimbabwe and Zambia import the poultry meat but also
export an excess amount of it, so they are basically exporters of the poultry meat.
Table 3.28 Import of Poultry Meat by Country in COMESA, SADC and EAC (Unit: 1,000 ton)
Importer 2011 2012 2013 2014 2015
1 South Africa 9.28 8.27 8.29 8.62 4.65 2 Botswana 3.28 2.67 2.94 2.72 2.98 3 Uganda 1.77 1.80 1.70 3.36 3.60 4 Zambia 1.86 2.20 2.84 2.74 3.17 5 Egypt 0.03 7.41 1.94 3.31 0.28 6 United Rep. of Tanzania 1.29 1.34 1.64 3.93 2.40 7 Mozambique 1.13 0.74 3.01 3.67 3.30 8 Namibia 1.65 2.06 2.16 2.17 1.84 9 Zimbabwe 0.92 1.70 1.59 2.26 2.79 10 Lesotho 1.91 1.49 2.61 1.43 1.41 others 10.65 11.36 10.51 10.86 12.14
Total 33.76 41.05 39.21 45.07 38.55
Source; UN Comtrade, ITC
Table 3.29 Export of Poultry Meat by Country in COMESA, SADC and EAC (Unit: 1,000 ton)
Exporter 2011 2012 2013 2014 2015
1 South Africa 12.97 9.85 10.37 10.82 5.87 2 Malawi 0.16 19.64 0.12 0.29 0.57 3 Zimbabwe 1.71 1.83 2.14 2.90 3.03 4 Zambia 1.10 1.03 1.49 2.40 2.88 5 Kenya 0.99 0.99 1.76 1.68 1.84 6 Mauritius 1.43 1.67 1.08 0.68 0.81 7 Swaziland 1.04 1.59 1.10 0.44 1.18 8 Uganda 0.54 0.12 0.08 0.24 0.54 9 Egypt 0.34 0.05 0.07 0.47 0.12 10 Madagascar 0.00 0.01 0.00 0.02 0.02 Others 0.04 0.01 0.06 0.06 0.05
Total 20.31 36.79 18.25 20.00 16.93
Source; UN Comtrade, ITC
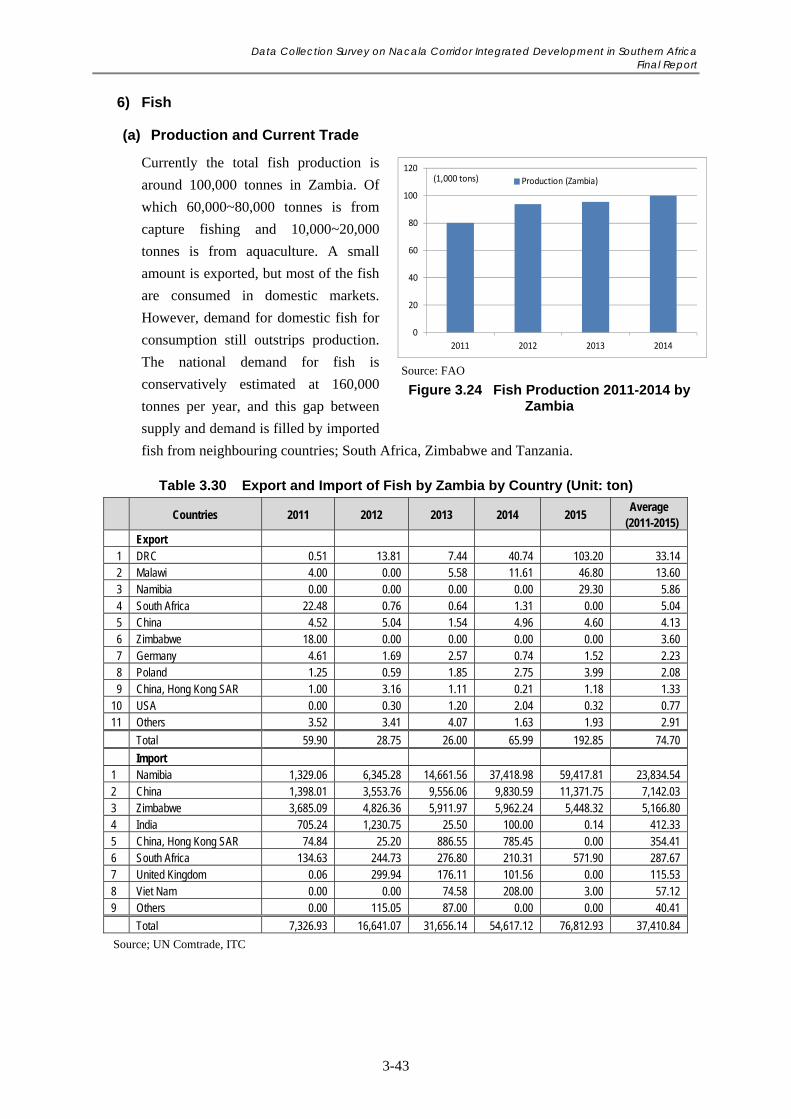
Data Collection Survey on Nacala Corridor Integrated Development in Southern Africa Final Report
3-43
6) Fish
(a) Production and Current Trade
Currently the total fish production is
around 100,000 tonnes in Zambia. Of
which 60,000~80,000 tonnes is from
capture fishing and 10,000~20,000
tonnes is from aquaculture. A small
amount is exported, but most of the fish
are consumed in domestic markets.
However, demand for domestic fish for
consumption still outstrips production.
The national demand for fish is
conservatively estimated at 160,000
tonnes per year, and this gap between
supply and demand is filled by imported
fish from neighbouring countries; South Africa, Zimbabwe and Tanzania.
Table 3.30 Export and Import of Fish by Zambia by Country (Unit: ton)
Countries 2011 2012 2013 2014 2015
Average (2011-2015)
Export 1 DRC 0.51 13.81 7.44 40.74 103.20 33.14 2 Malawi 4.00 0.00 5.58 11.61 46.80 13.60 3 Namibia 0.00 0.00 0.00 0.00 29.30 5.86 4 South Africa 22.48 0.76 0.64 1.31 0.00 5.04 5 China 4.52 5.04 1.54 4.96 4.60 4.13 6 Zimbabwe 18.00 0.00 0.00 0.00 0.00 3.60 7 Germany 4.61 1.69 2.57 0.74 1.52 2.23 8 Poland 1.25 0.59 1.85 2.75 3.99 2.08 9 China, Hong Kong SAR 1.00 3.16 1.11 0.21 1.18 1.33
10 USA 0.00 0.30 1.20 2.04 0.32 0.77 11 Others 3.52 3.41 4.07 1.63 1.93 2.91
Total 59.90 28.75 26.00 65.99 192.85 74.70
Import 1 Namibia 1,329.06 6,345.28 14,661.56 37,418.98 59,417.81 23,834.54 2 China 1,398.01 3,553.76 9,556.06 9,830.59 11,371.75 7,142.03 3 Zimbabwe 3,685.09 4,826.36 5,911.97 5,962.24 5,448.32 5,166.80 4 India 705.24 1,230.75 25.50 100.00 0.14 412.33 5 China, Hong Kong SAR 74.84 25.20 886.55 785.45 0.00 354.41 6 South Africa 134.63 244.73 276.80 210.31 571.90 287.67 7 United Kingdom 0.06 299.94 176.11 101.56 0.00 115.53 8 Viet Nam 0.00 0.00 74.58 208.00 3.00 57.12 9 Others 0.00 115.05 87.00 0.00 0.00 40.41
Total 7,326.93 16,641.07 31,656.14 54,617.12 76,812.93 37,410.84
Source; UN Comtrade, ITC
0
20
40
60
80
100
120
2011 2012 2013 2014
Production (Zambia)(1,000 tons)
Source: FAO
Figure 3.24 Fish Production 2011-2014 by Zambia
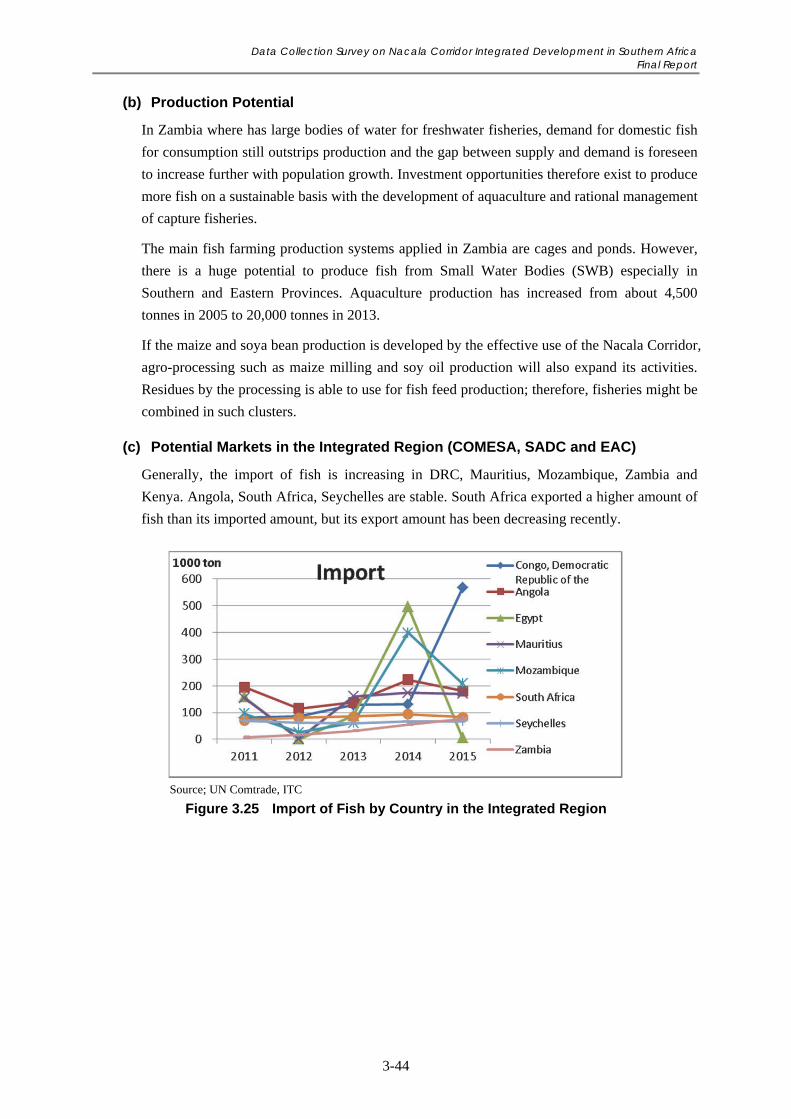
Data Collection Survey on Nacala Corridor Integrated Development in Southern Africa Final Report
3-44
(b) Production Potential
In Zambia where has large bodies of water for freshwater fisheries, demand for domestic fish
for consumption still outstrips production and the gap between supply and demand is foreseen
to increase further with population growth. Investment opportunities therefore exist to produce
more fish on a sustainable basis with the development of aquaculture and rational management
of capture fisheries.
The main fish farming production systems applied in Zambia are cages and ponds. However,
there is a huge potential to produce fish from Small Water Bodies (SWB) especially in
Southern and Eastern Provinces. Aquaculture production has increased from about 4,500
tonnes in 2005 to 20,000 tonnes in 2013.
If the maize and soya bean production is developed by the effective use of the Nacala Corridor,
agro-processing such as maize milling and soy oil production will also expand its activities.
Residues by the processing is able to use for fish feed production; therefore, fisheries might be
combined in such clusters.
(c) Potential Markets in the Integrated Region (COMESA, SADC and EAC)
Generally, the import of fish is increasing in DRC, Mauritius, Mozambique, Zambia and
Kenya. Angola, South Africa, Seychelles are stable. South Africa exported a higher amount of
fish than its imported amount, but its export amount has been decreasing recently.
Source; UN Comtrade, ITC
Figure 3.25 Import of Fish by Country in the Integrated Region
Data Collection Survey on Nacala Corridor Integrated Development in Southern Africa Final Report
3-45
Table 3.31 Import of Fish by Country in COMESA, SADC and EAC (Unit: 1,000 ton)
Importer 2011 2012 2013 2014 2015
1 DRC 80.66 86.37 127.75 130.32 566.23 2 Angola 194.80 114.56 137.32 222.76 180.63 3 Egypt 158.21 0.02 87.11 494.96 5.93 4 Mauritius 154.26 1.56 160.55 173.19 170.06 5 Mozambique 96.07 25.38 61.39 397.73 207.98 6 South Africa 71.25 80.92 85.67 93.64 82.96 7 Seychelles 69.88 62.93 60.69 67.01 67.62 8 Zambia 7.95 17.10 31.73 55.03 77.06 9 Namibia 69.75 9.69 12.40 14.10 17.81 10 Kenya 15.66 15.93 13.13 21.96 22.16 11 Others 54.69 52.16 72.25 88.62 71.95
Total 973.19 466.61 849.97 1,759.31 1,470.38
Source; UN Comtrade, ITC
Table 3.32 Export of Fish by Country in COMESA, SADC and EAC (Unit: 1,000 ton)
Exporter 2011 2012 2013 2014 2015
1 Namibia 319.06 312.47 367.72 73.62 346.30 2 South Africa 330.61 134.56 100.12 36.22 88.96 3 United Rep. of Tanzania 37.27 33.76 33.66 38.21 30.92 4 Mauritius 25.61 37.62 40.48 6.77 57.11 5 Uganda 19.30 11.42 20.18 17.94 17.97 6 Egypt 9.76 0.03 18.08 19.63 0.22 7 Kenya 9.97 10.65 8.93 7.45 6.63 8 Seychelles 9.48 0.61 7.96 0.08 0.63 9 Mozambique 3.93 4.15 4.79 8.11 8.70 10 Zimbabwe 2.01 2.52 2.01 0.08 5.82 11 Others 5.56 2.68 6.94 5.38 9.95
Total 772.55 550.47 610.86 213.49 573.21
Source; UN Comtrade, ITC
(3) Potential and Challenges of Development on Processed Products
1) Edible Oil (Sunflower oil and soya bean oil)
(a) Production and Current Trade
While Zambia has a certain amount of domestic production of soya bean oil, it also has
several-fold import of production; it does not have enough capacity to export. Regarding
sunflower oil, it has the same or larger amount of export with/than production, although
varying from year to year (main destinations are DRC, Malawi and others).
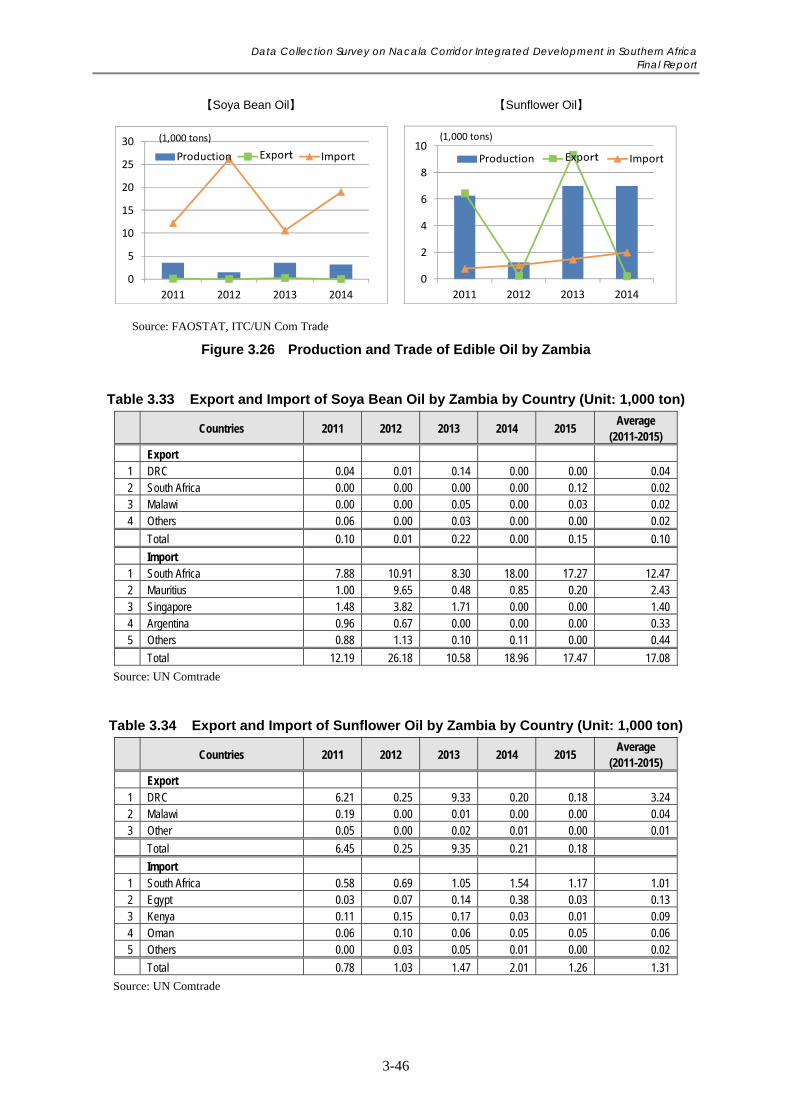
Data Collection Survey on Nacala Corridor Integrated Development in Southern Africa Final Report
3-46
【Soya Bean Oil】 【Sunflower Oil】
Source: FAOSTAT, ITC/UN Com Trade
Figure 3.26 Production and Trade of Edible Oil by Zambia
Table 3.33 Export and Import of Soya Bean Oil by Zambia by Country (Unit: 1,000 ton)
Countries 2011 2012 2013 2014 2015 Average
(2011-2015)
Export 1 DRC 0.04 0.01 0.14 0.00 0.00 0.04 2 South Africa 0.00 0.00 0.00 0.00 0.12 0.02 3 Malawi 0.00 0.00 0.05 0.00 0.03 0.02 4 Others 0.06 0.00 0.03 0.00 0.00 0.02
Total 0.10 0.01 0.22 0.00 0.15 0.10
Import 1 South Africa 7.88 10.91 8.30 18.00 17.27 12.47 2 Mauritius 1.00 9.65 0.48 0.85 0.20 2.43 3 Singapore 1.48 3.82 1.71 0.00 0.00 1.40 4 Argentina 0.96 0.67 0.00 0.00 0.00 0.33 5 Others 0.88 1.13 0.10 0.11 0.00 0.44
Total 12.19 26.18 10.58 18.96 17.47 17.08
Source: UN Comtrade
Table 3.34 Export and Import of Sunflower Oil by Zambia by Country (Unit: 1,000 ton)
Countries 2011 2012 2013 2014 2015 Average
(2011-2015)
Export 1 DRC 6.21 0.25 9.33 0.20 0.18 3.24 2 Malawi 0.19 0.00 0.01 0.00 0.00 0.04 3 Other 0.05 0.00 0.02 0.01 0.00 0.01
Total 6.45 0.25 9.35 0.21 0.18
Import 1 South Africa 0.58 0.69 1.05 1.54 1.17 1.01 2 Egypt 0.03 0.07 0.14 0.38 0.03 0.13 3 Kenya 0.11 0.15 0.17 0.03 0.01 0.09 4 Oman 0.06 0.10 0.06 0.05 0.05 0.06 5 Others 0.00 0.03 0.05 0.01 0.00 0.02
Total 0.78 1.03 1.47 2.01 1.26 1.31
Source: UN Comtrade
0
5
10
15
20
25
30
2011 2012 2013 2014
Production Export Import
(1,000 tons)
0
2
4
6
8
10
2011 2012 2013 2014
Production Export Import
(1,000 tons)
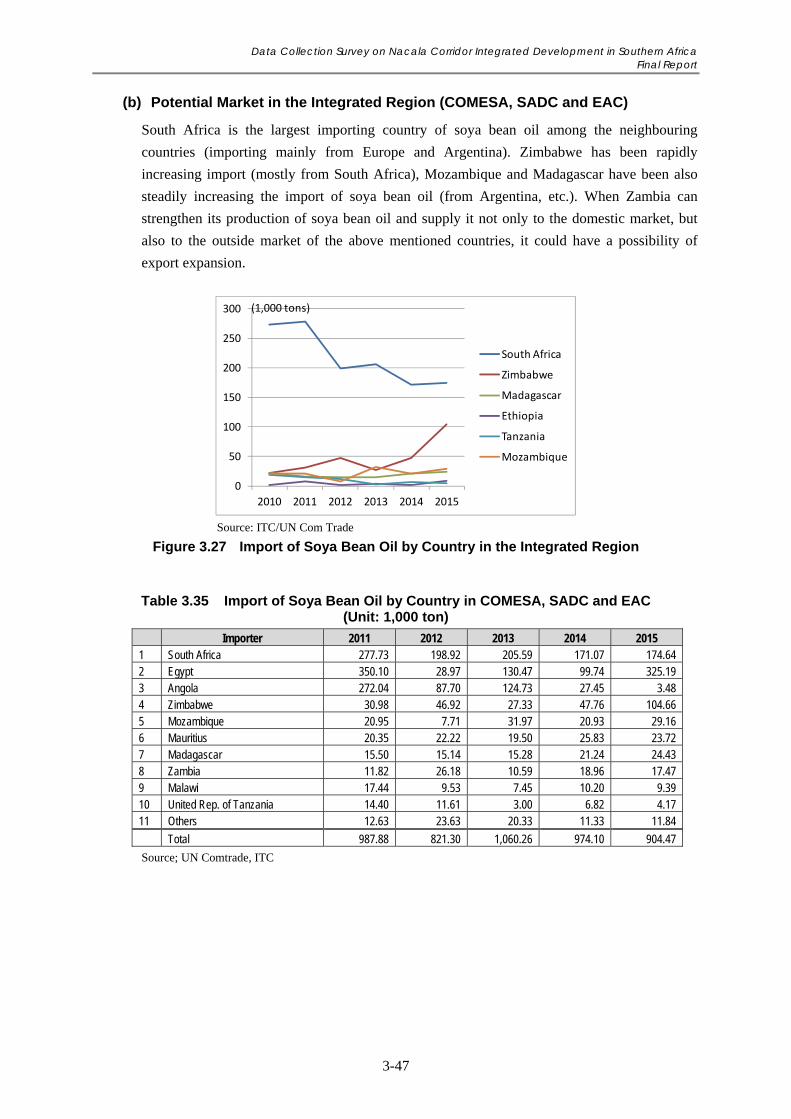
Data Collection Survey on Nacala Corridor Integrated Development in Southern Africa Final Report
3-47
(b) Potential Market in the Integrated Region (COMESA, SADC and EAC)
South Africa is the largest importing country of soya bean oil among the neighbouring
countries (importing mainly from Europe and Argentina). Zimbabwe has been rapidly
increasing import (mostly from South Africa), Mozambique and Madagascar have been also
steadily increasing the import of soya bean oil (from Argentina, etc.). When Zambia can
strengthen its production of soya bean oil and supply it not only to the domestic market, but
also to the outside market of the above mentioned countries, it could have a possibility of
export expansion.
Source: ITC/UN Com Trade
Figure 3.27 Import of Soya Bean Oil by Country in the Integrated Region
Table 3.35 Import of Soya Bean Oil by Country in COMESA, SADC and EAC (Unit: 1,000 ton)
Importer 2011 2012 2013 2014 2015 1 South Africa 277.73 198.92 205.59 171.07 174.64 2 Egypt 350.10 28.97 130.47 99.74 325.19 3 Angola 272.04 87.70 124.73 27.45 3.48 4 Zimbabwe 30.98 46.92 27.33 47.76 104.66 5 Mozambique 20.95 7.71 31.97 20.93 29.16 6 Mauritius 20.35 22.22 19.50 25.83 23.72 7 Madagascar 15.50 15.14 15.28 21.24 24.43 8 Zambia 11.82 26.18 10.59 18.96 17.47 9 Malawi 17.44 9.53 7.45 10.20 9.39 10 United Rep. of Tanzania 14.40 11.61 3.00 6.82 4.17 11 Others 12.63 23.63 20.33 11.33 11.84
Total 987.88 821.30 1,060.26 974.10 904.47
Source; UN Comtrade, ITC
0
50
100
150
200
250
300
2010 2011 2012 2013 2014 2015
South Africa
Zimbabwe
Madagascar
Ethiopia
Tanzania
Mozambique
(1,000 tons)
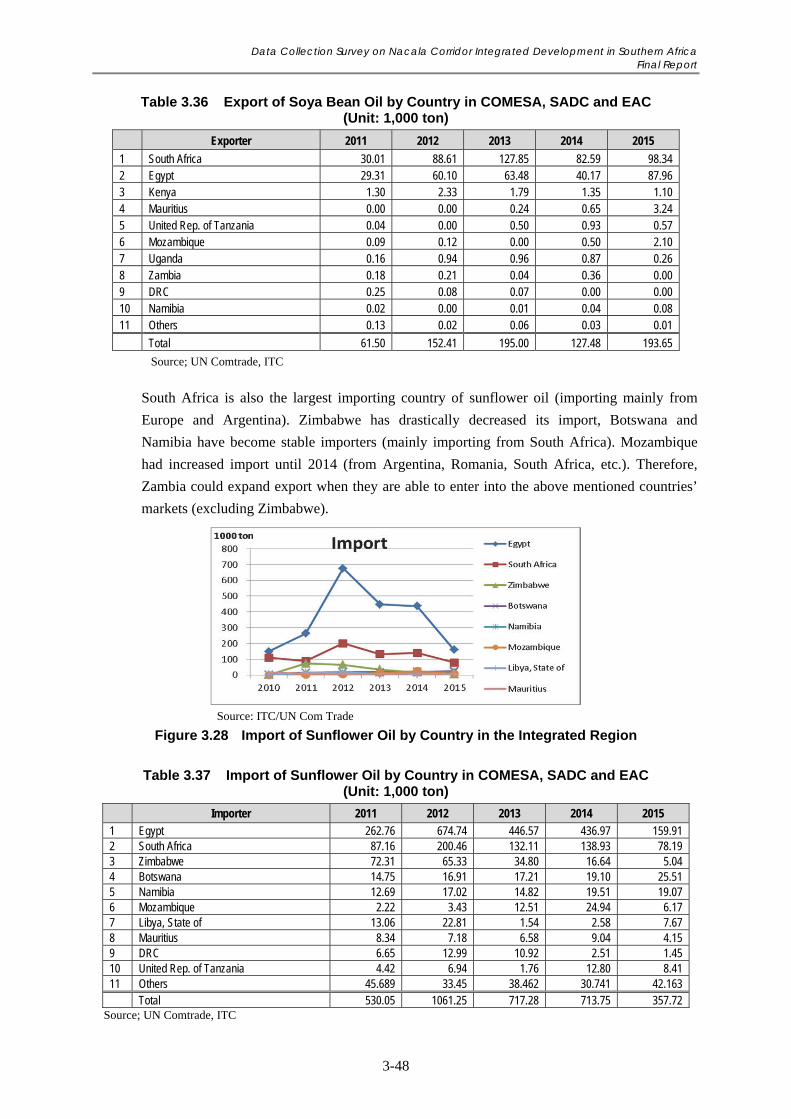
Data Collection Survey on Nacala Corridor Integrated Development in Southern Africa Final Report
3-48
Table 3.36 Export of Soya Bean Oil by Country in COMESA, SADC and EAC (Unit: 1,000 ton)
Exporter 2011 2012 2013 2014 2015
1 South Africa 30.01 88.61 127.85 82.59 98.34 2 Egypt 29.31 60.10 63.48 40.17 87.96 3 Kenya 1.30 2.33 1.79 1.35 1.10 4 Mauritius 0.00 0.00 0.24 0.65 3.24 5 United Rep. of Tanzania 0.04 0.00 0.50 0.93 0.57 6 Mozambique 0.09 0.12 0.00 0.50 2.10 7 Uganda 0.16 0.94 0.96 0.87 0.26 8 Zambia 0.18 0.21 0.04 0.36 0.00 9 DRC 0.25 0.08 0.07 0.00 0.00 10 Namibia 0.02 0.00 0.01 0.04 0.08 11 Others 0.13 0.02 0.06 0.03 0.01
Total 61.50 152.41 195.00 127.48 193.65
Source; UN Comtrade, ITC
South Africa is also the largest importing country of sunflower oil (importing mainly from
Europe and Argentina). Zimbabwe has drastically decreased its import, Botswana and
Namibia have become stable importers (mainly importing from South Africa). Mozambique
had increased import until 2014 (from Argentina, Romania, South Africa, etc.). Therefore,
Zambia could expand export when they are able to enter into the above mentioned countries’
markets (excluding Zimbabwe).
Source: ITC/UN Com Trade
Figure 3.28 Import of Sunflower Oil by Country in the Integrated Region
Table 3.37 Import of Sunflower Oil by Country in COMESA, SADC and EAC (Unit: 1,000 ton)
Importer 2011 2012 2013 2014 2015
1 Egypt 262.76 674.74 446.57 436.97 159.91 2 South Africa 87.16 200.46 132.11 138.93 78.19 3 Zimbabwe 72.31 65.33 34.80 16.64 5.04 4 Botswana 14.75 16.91 17.21 19.10 25.51 5 Namibia 12.69 17.02 14.82 19.51 19.07 6 Mozambique 2.22 3.43 12.51 24.94 6.17 7 Libya, State of 13.06 22.81 1.54 2.58 7.67 8 Mauritius 8.34 7.18 6.58 9.04 4.15 9 DRC 6.65 12.99 10.92 2.51 1.45 10 United Rep. of Tanzania 4.42 6.94 1.76 12.80 8.41 11 Others 45.689 33.45 38.462 30.741 42.163 Total 530.05 1061.25 717.28 713.75 357.72
Source; UN Comtrade, ITC
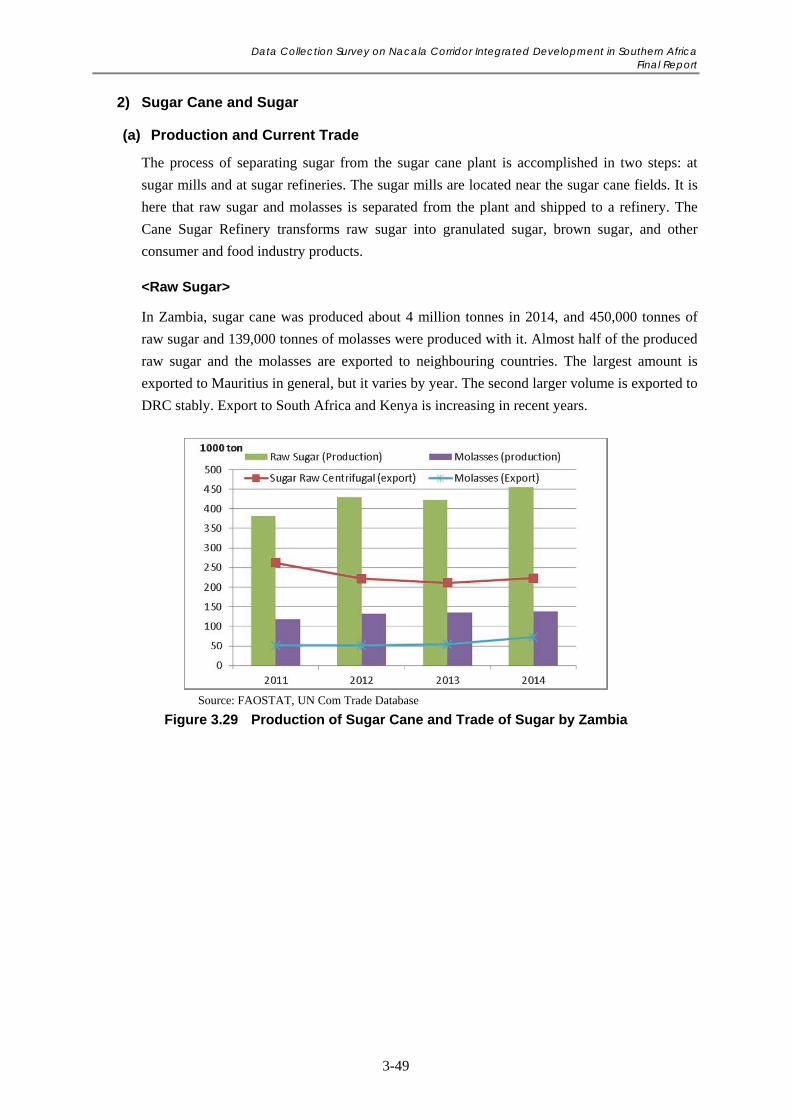
Data Collection Survey on Nacala Corridor Integrated Development in Southern Africa Final Report
3-49
2) Sugar Cane and Sugar
(a) Production and Current Trade
The process of separating sugar from the sugar cane plant is accomplished in two steps: at
sugar mills and at sugar refineries. The sugar mills are located near the sugar cane fields. It is
here that raw sugar and molasses is separated from the plant and shipped to a refinery. The
Cane Sugar Refinery transforms raw sugar into granulated sugar, brown sugar, and other
consumer and food industry products.
<Raw Sugar>
In Zambia, sugar cane was produced about 4 million tonnes in 2014, and 450,000 tonnes of
raw sugar and 139,000 tonnes of molasses were produced with it. Almost half of the produced
raw sugar and the molasses are exported to neighbouring countries. The largest amount is
exported to Mauritius in general, but it varies by year. The second larger volume is exported to
DRC stably. Export to South Africa and Kenya is increasing in recent years.
Source: FAOSTAT, UN Com Trade Database
Figure 3.29 Production of Sugar Cane and Trade of Sugar by Zambia
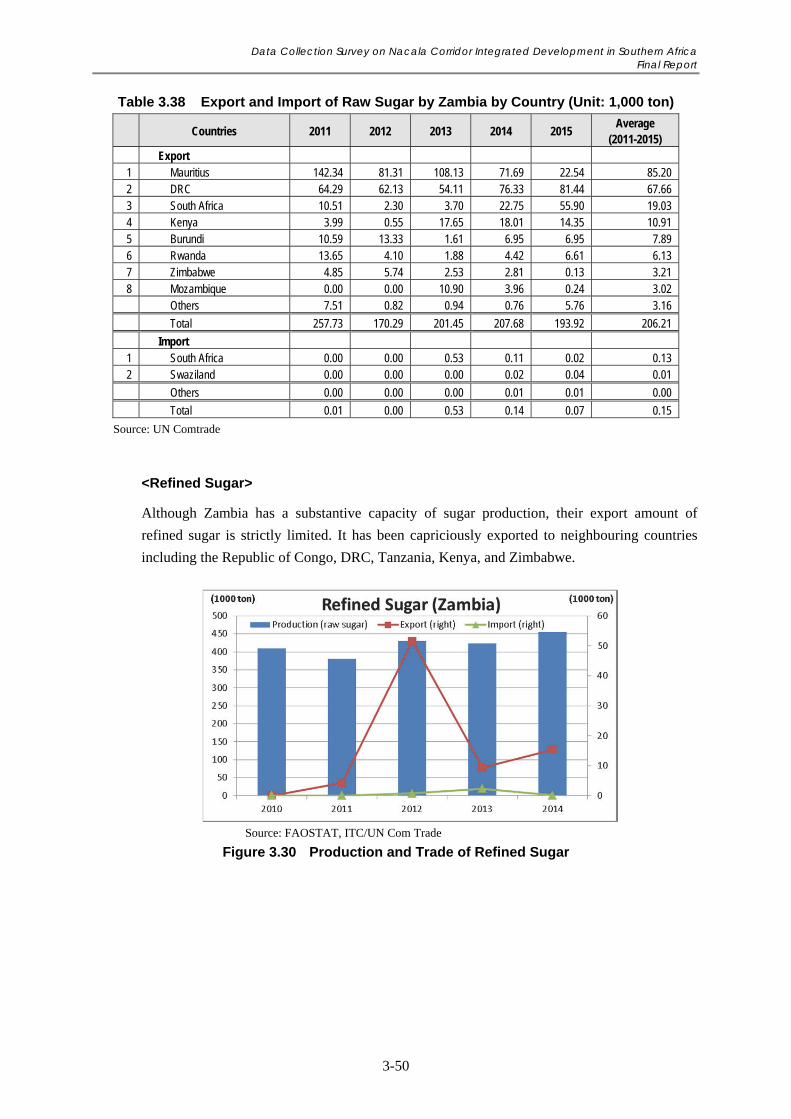
Data Collection Survey on Nacala Corridor Integrated Development in Southern Africa Final Report
3-50
Table 3.38 Export and Import of Raw Sugar by Zambia by Country (Unit: 1,000 ton)
Countries 2011 2012 2013 2014 2015 Average
(2011-2015) Export
1 Mauritius 142.34 81.31 108.13 71.69 22.54 85.20 2 DRC 64.29 62.13 54.11 76.33 81.44 67.66 3 South Africa 10.51 2.30 3.70 22.75 55.90 19.03 4 Kenya 3.99 0.55 17.65 18.01 14.35 10.91 5 Burundi 10.59 13.33 1.61 6.95 6.95 7.89 6 Rwanda 13.65 4.10 1.88 4.42 6.61 6.13 7 Zimbabwe 4.85 5.74 2.53 2.81 0.13 3.21 8 Mozambique 0.00 0.00 10.90 3.96 0.24 3.02
Others 7.51 0.82 0.94 0.76 5.76 3.16
Total 257.73 170.29 201.45 207.68 193.92 206.21
Import 1 South Africa 0.00 0.00 0.53 0.11 0.02 0.13 2 Swaziland 0.00 0.00 0.00 0.02 0.04 0.01
Others 0.00 0.00 0.00 0.01 0.01 0.00
Total 0.01 0.00 0.53 0.14 0.07 0.15
Source: UN Comtrade
<Refined Sugar>
Although Zambia has a substantive capacity of sugar production, their export amount of
refined sugar is strictly limited. It has been capriciously exported to neighbouring countries
including the Republic of Congo, DRC, Tanzania, Kenya, and Zimbabwe.
Source: FAOSTAT, ITC/UN Com Trade
Figure 3.30 Production and Trade of Refined Sugar
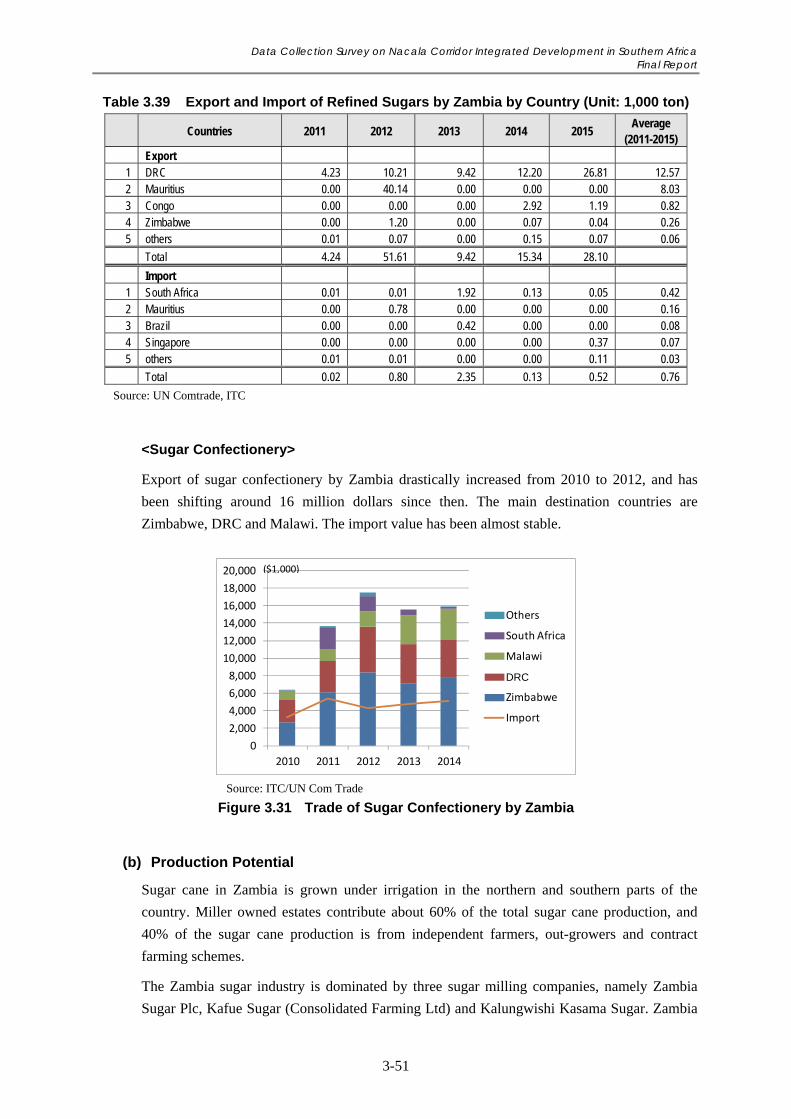
Data Collection Survey on Nacala Corridor Integrated Development in Southern Africa Final Report
3-51
Table 3.39 Export and Import of Refined Sugars by Zambia by Country (Unit: 1,000 ton)
Countries 2011 2012 2013 2014 2015 Average
(2011-2015) Export
1 DRC 4.23 10.21 9.42 12.20 26.81 12.57 2 Mauritius 0.00 40.14 0.00 0.00 0.00 8.03 3 Congo 0.00 0.00 0.00 2.92 1.19 0.82 4 Zimbabwe 0.00 1.20 0.00 0.07 0.04 0.26 5 others 0.01 0.07 0.00 0.15 0.07 0.06
Total 4.24 51.61 9.42 15.34 28.10
Import 1 South Africa 0.01 0.01 1.92 0.13 0.05 0.42 2 Mauritius 0.00 0.78 0.00 0.00 0.00 0.16 3 Brazil 0.00 0.00 0.42 0.00 0.00 0.08 4 Singapore 0.00 0.00 0.00 0.00 0.37 0.07 5 others 0.01 0.01 0.00 0.00 0.11 0.03
Total 0.02 0.80 2.35 0.13 0.52 0.76
Source: UN Comtrade, ITC
<Sugar Confectionery>
Export of sugar confectionery by Zambia drastically increased from 2010 to 2012, and has
been shifting around 16 million dollars since then. The main destination countries are
Zimbabwe, DRC and Malawi. The import value has been almost stable.
Source: ITC/UN Com Trade
Figure 3.31 Trade of Sugar Confectionery by Zambia
(b) Production Potential
Sugar cane in Zambia is grown under irrigation in the northern and southern parts of the
country. Miller owned estates contribute about 60% of the total sugar cane production, and
40% of the sugar cane production is from independent farmers, out-growers and contract
farming schemes.
The Zambia sugar industry is dominated by three sugar milling companies, namely Zambia
Sugar Plc, Kafue Sugar (Consolidated Farming Ltd) and Kalungwishi Kasama Sugar. Zambia
0
2,000
4,000
6,000
8,000
10,000
12,000
14,000
16,000
18,000
20,000
2010 2011 2012 2013 2014
Others
South Africa
Malawi
DR Congo
Zimbabwe
Import
($1,000)
DRC
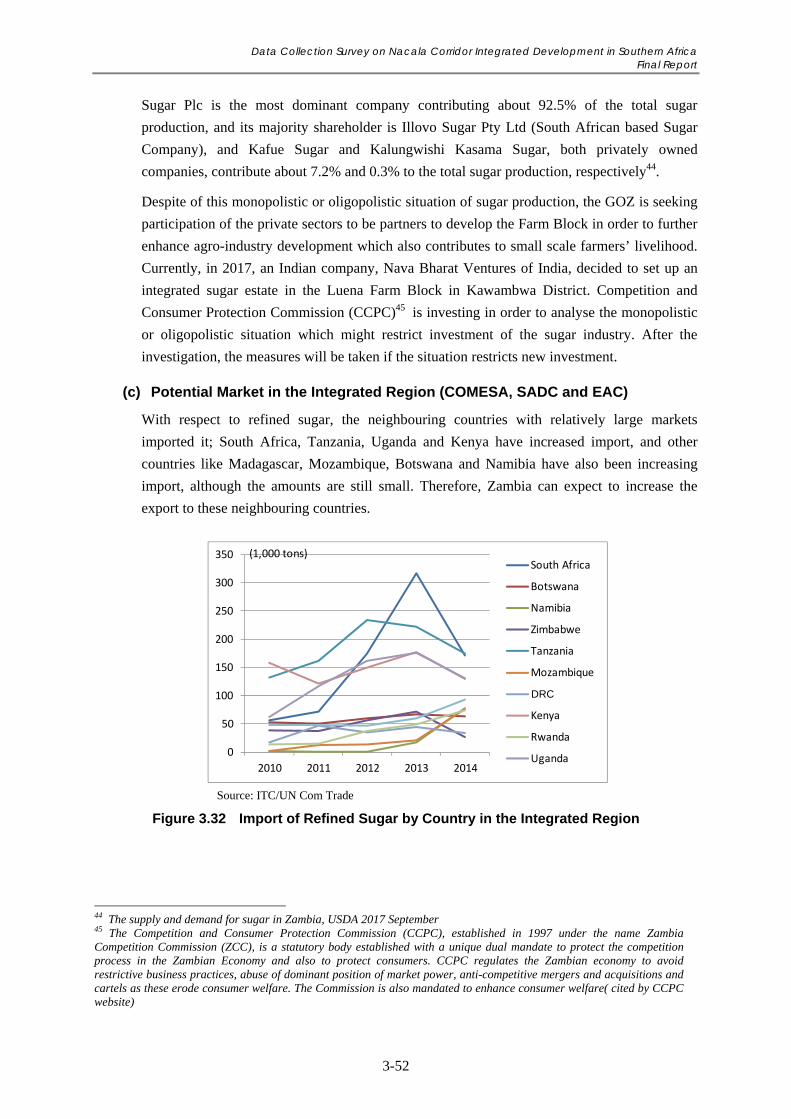
Data Collection Survey on Nacala Corridor Integrated Development in Southern Africa Final Report
3-52
Sugar Plc is the most dominant company contributing about 92.5% of the total sugar
production, and its majority shareholder is Illovo Sugar Pty Ltd (South African based Sugar
Company), and Kafue Sugar and Kalungwishi Kasama Sugar, both privately owned
companies, contribute about 7.2% and 0.3% to the total sugar production, respectively44.
Despite of this monopolistic or oligopolistic situation of sugar production, the GOZ is seeking
participation of the private sectors to be partners to develop the Farm Block in order to further
enhance agro-industry development which also contributes to small scale farmers’ livelihood.
Currently, in 2017, an Indian company, Nava Bharat Ventures of India, decided to set up an
integrated sugar estate in the Luena Farm Block in Kawambwa District. Competition and
Consumer Protection Commission (CCPC)45 is investing in order to analyse the monopolistic
or oligopolistic situation which might restrict investment of the sugar industry. After the
investigation, the measures will be taken if the situation restricts new investment.
(c) Potential Market in the Integrated Region (COMESA, SADC and EAC)
With respect to refined sugar, the neighbouring countries with relatively large markets
imported it; South Africa, Tanzania, Uganda and Kenya have increased import, and other
countries like Madagascar, Mozambique, Botswana and Namibia have also been increasing
import, although the amounts are still small. Therefore, Zambia can expect to increase the
export to these neighbouring countries.
Source: ITC/UN Com Trade
Figure 3.32 Import of Refined Sugar by Country in the Integrated Region
44 The supply and demand for sugar in Zambia, USDA 2017 September 45 The Competition and Consumer Protection Commission (CCPC), established in 1997 under the name Zambia Competition Commission (ZCC), is a statutory body established with a unique dual mandate to protect the competition process in the Zambian Economy and also to protect consumers. CCPC regulates the Zambian economy to avoid restrictive business practices, abuse of dominant position of market power, anti-competitive mergers and acquisitions and cartels as these erode consumer welfare. The Commission is also mandated to enhance consumer welfare( cited by CCPC website)
0
50
100
150
200
250
300
350
2010 2011 2012 2013 2014
South Africa
Botswana
Namibia
Zimbabwe
Tanzania
Mozambique
DR Congo
Kenya
Rwanda
Uganda
(1,000 tons)
DRC
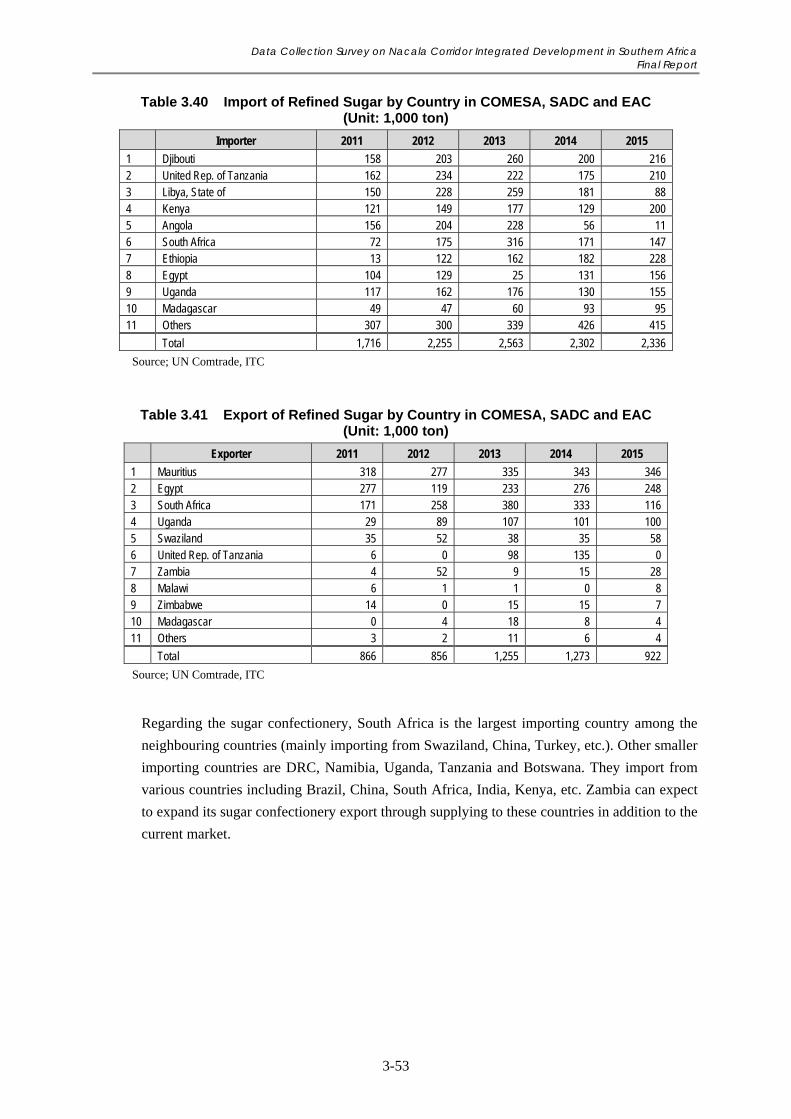
Data Collection Survey on Nacala Corridor Integrated Development in Southern Africa Final Report
3-53
Table 3.40 Import of Refined Sugar by Country in COMESA, SADC and EAC (Unit: 1,000 ton)
Importer 2011 2012 2013 2014 2015
1 Djibouti 158 203 260 200 216 2 United Rep. of Tanzania 162 234 222 175 210 3 Libya, State of 150 228 259 181 88 4 Kenya 121 149 177 129 200 5 Angola 156 204 228 56 11 6 South Africa 72 175 316 171 147 7 Ethiopia 13 122 162 182 228 8 Egypt 104 129 25 131 156 9 Uganda 117 162 176 130 155 10 Madagascar 49 47 60 93 95 11 Others 307 300 339 426 415
Total 1,716 2,255 2,563 2,302 2,336
Source; UN Comtrade, ITC
Table 3.41 Export of Refined Sugar by Country in COMESA, SADC and EAC (Unit: 1,000 ton)
Exporter 2011 2012 2013 2014 2015
1 Mauritius 318 277 335 343 346 2 Egypt 277 119 233 276 248 3 South Africa 171 258 380 333 116 4 Uganda 29 89 107 101 100 5 Swaziland 35 52 38 35 58 6 United Rep. of Tanzania 6 0 98 135 0 7 Zambia 4 52 9 15 28 8 Malawi 6 1 1 0 8 9 Zimbabwe 14 0 15 15 7 10 Madagascar 0 4 18 8 4 11 Others 3 2 11 6 4
Total 866 856 1,255 1,273 922
Source; UN Comtrade, ITC
Regarding the sugar confectionery, South Africa is the largest importing country among the
neighbouring countries (mainly importing from Swaziland, China, Turkey, etc.). Other smaller
importing countries are DRC, Namibia, Uganda, Tanzania and Botswana. They import from
various countries including Brazil, China, South Africa, India, Kenya, etc. Zambia can expect
to expand its sugar confectionery export through supplying to these countries in addition to the
current market.
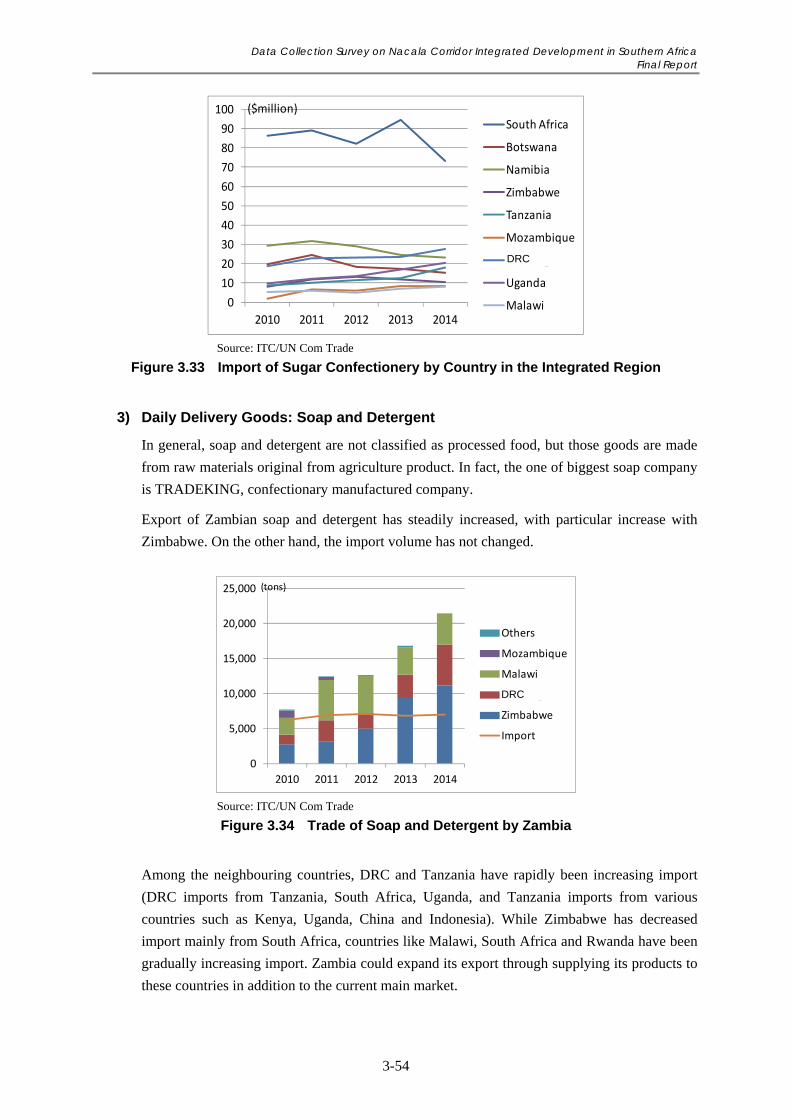
Data Collection Survey on Nacala Corridor Integrated Development in Southern Africa Final Report
3-54
Source: ITC/UN Com Trade
Figure 3.33 Import of Sugar Confectionery by Country in the Integrated Region
3) Daily Delivery Goods: Soap and Detergent
In general, soap and detergent are not classified as processed food, but those goods are made
from raw materials original from agriculture product. In fact, the one of biggest soap company
is TRADEKING, confectionary manufactured company.
Export of Zambian soap and detergent has steadily increased, with particular increase with
Zimbabwe. On the other hand, the import volume has not changed.
Source: ITC/UN Com Trade
Figure 3.34 Trade of Soap and Detergent by Zambia
Among the neighbouring countries, DRC and Tanzania have rapidly been increasing import
(DRC imports from Tanzania, South Africa, Uganda, and Tanzania imports from various
countries such as Kenya, Uganda, China and Indonesia). While Zimbabwe has decreased
import mainly from South Africa, countries like Malawi, South Africa and Rwanda have been
gradually increasing import. Zambia could expand its export through supplying its products to
these countries in addition to the current main market.
0
10
20
30
40
50
60
70
80
90
100
2010 2011 2012 2013 2014
South Africa
Botswana
Namibia
Zimbabwe
Tanzania
Mozambique
DR Congo
Uganda
Malawi
($million)
DRC
0
5,000
10,000
15,000
20,000
25,000
2010 2011 2012 2013 2014
Others
Mozambique
Malawi
DR Congo
Zimbabwe
Import
(tons)
DRC
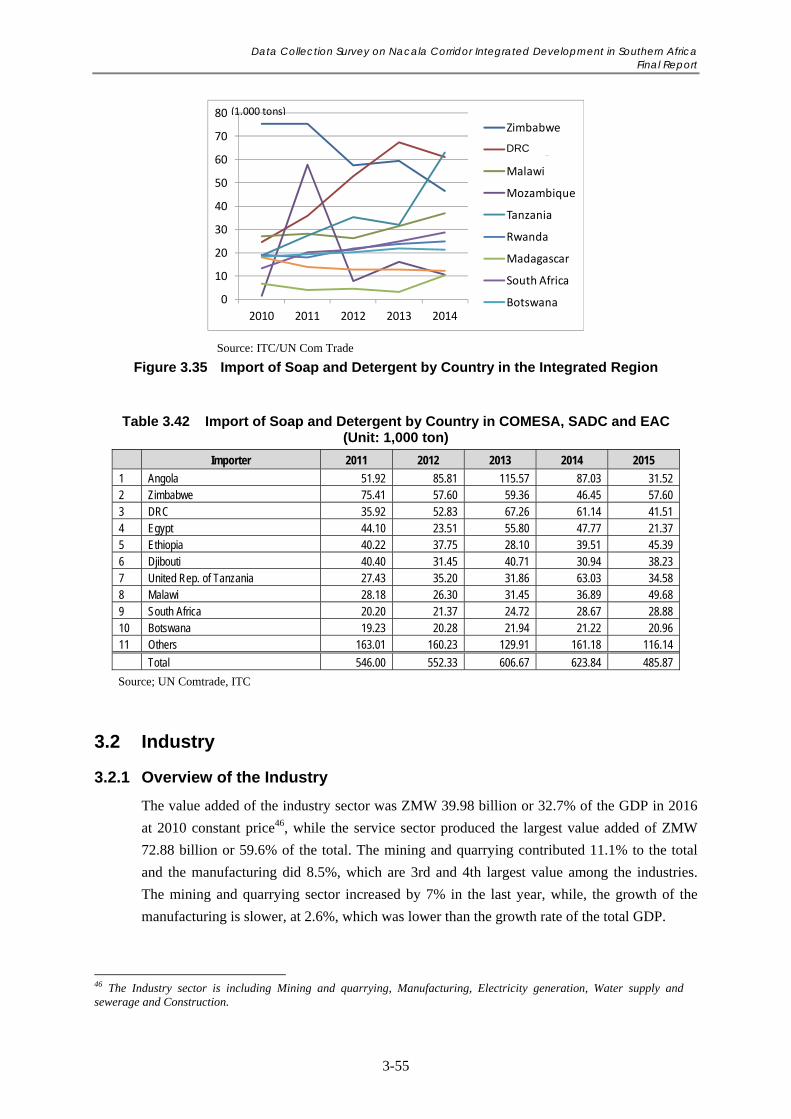
Data Collection Survey on Nacala Corridor Integrated Development in Southern Africa Final Report
3-55
Source: ITC/UN Com Trade
Figure 3.35 Import of Soap and Detergent by Country in the Integrated Region
Table 3.42 Import of Soap and Detergent by Country in COMESA, SADC and EAC (Unit: 1,000 ton)
Importer 2011 2012 2013 2014 2015
1 Angola 51.92 85.81 115.57 87.03 31.52 2 Zimbabwe 75.41 57.60 59.36 46.45 57.60 3 DRC 35.92 52.83 67.26 61.14 41.51 4 Egypt 44.10 23.51 55.80 47.77 21.37 5 Ethiopia 40.22 37.75 28.10 39.51 45.39 6 Djibouti 40.40 31.45 40.71 30.94 38.23 7 United Rep. of Tanzania 27.43 35.20 31.86 63.03 34.58 8 Malawi 28.18 26.30 31.45 36.89 49.68 9 South Africa 20.20 21.37 24.72 28.67 28.88 10 Botswana 19.23 20.28 21.94 21.22 20.96 11 Others 163.01 160.23 129.91 161.18 116.14
Total 546.00 552.33 606.67 623.84 485.87
Source; UN Comtrade, ITC
3.2 Industry
3.2.1 Overview of the Industry
The value added of the industry sector was ZMW 39.98 billion or 32.7% of the GDP in 2016
at 2010 constant price46, while the service sector produced the largest value added of ZMW
72.88 billion or 59.6% of the total. The mining and quarrying contributed 11.1% to the total
and the manufacturing did 8.5%, which are 3rd and 4th largest value among the industries.
The mining and quarrying sector increased by 7% in the last year, while, the growth of the
manufacturing is slower, at 2.6%, which was lower than the growth rate of the total GDP.
46 The Industry sector is including Mining and quarrying, Manufacturing, Electricity generation, Water supply and sewerage and Construction.
0
10
20
30
40
50
60
70
80
2010 2011 2012 2013 2014
Zimbabwe
DR Congo
Malawi
Mozambique
Tanzania
Rwanda
Madagascar
South Africa
Botswana
(1,000 tons)
DRC
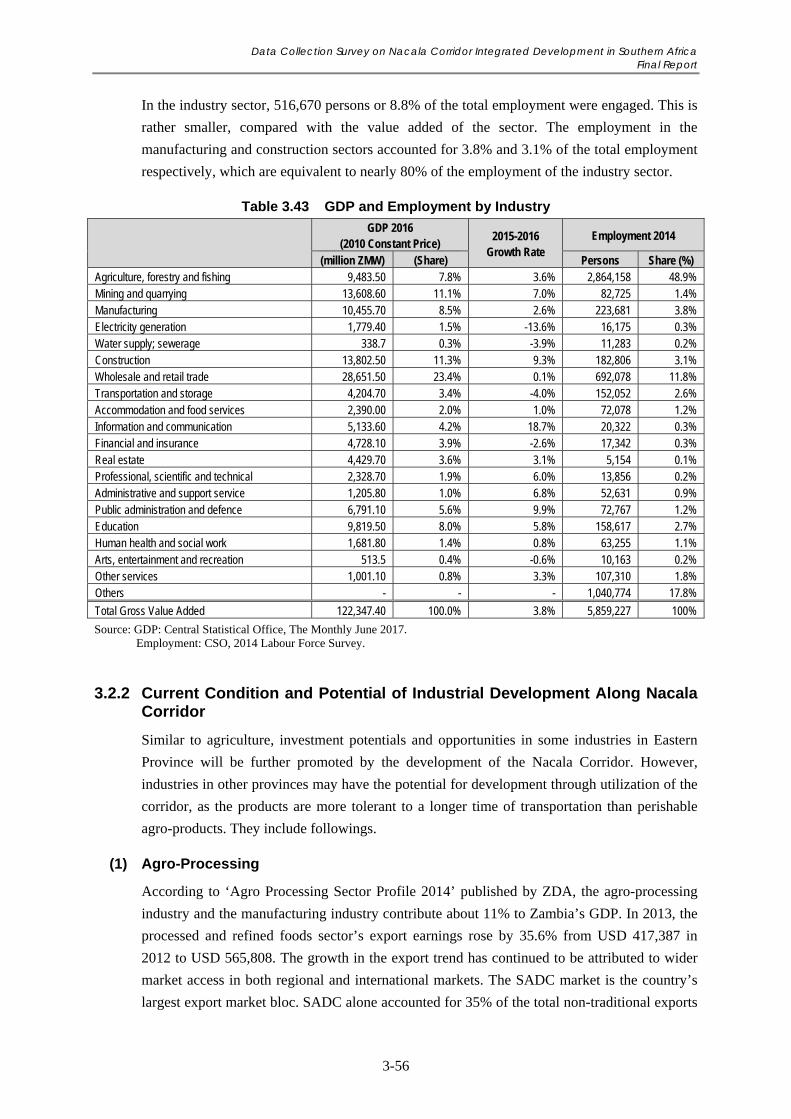
Data Collection Survey on Nacala Corridor Integrated Development in Southern Africa Final Report
3-56
In the industry sector, 516,670 persons or 8.8% of the total employment were engaged. This is
rather smaller, compared with the value added of the sector. The employment in the
manufacturing and construction sectors accounted for 3.8% and 3.1% of the total employment
respectively, which are equivalent to nearly 80% of the employment of the industry sector.
Table 3.43 GDP and Employment by Industry
GDP 2016
(2010 Constant Price) 2015-2016
Growth Rate Employment 2014
(million ZMW) (Share) Persons Share (%) Agriculture, forestry and fishing 9,483.50 7.8% 3.6% 2,864,158 48.9% Mining and quarrying 13,608.60 11.1% 7.0% 82,725 1.4% Manufacturing 10,455.70 8.5% 2.6% 223,681 3.8% Electricity generation 1,779.40 1.5% -13.6% 16,175 0.3% Water supply; sewerage 338.7 0.3% -3.9% 11,283 0.2% Construction 13,802.50 11.3% 9.3% 182,806 3.1% Wholesale and retail trade 28,651.50 23.4% 0.1% 692,078 11.8% Transportation and storage 4,204.70 3.4% -4.0% 152,052 2.6% Accommodation and food services 2,390.00 2.0% 1.0% 72,078 1.2% Information and communication 5,133.60 4.2% 18.7% 20,322 0.3% Financial and insurance 4,728.10 3.9% -2.6% 17,342 0.3% Real estate 4,429.70 3.6% 3.1% 5,154 0.1% Professional, scientific and technical 2,328.70 1.9% 6.0% 13,856 0.2% Administrative and support service 1,205.80 1.0% 6.8% 52,631 0.9% Public administration and defence 6,791.10 5.6% 9.9% 72,767 1.2% Education 9,819.50 8.0% 5.8% 158,617 2.7% Human health and social work 1,681.80 1.4% 0.8% 63,255 1.1% Arts, entertainment and recreation 513.5 0.4% -0.6% 10,163 0.2% Other services 1,001.10 0.8% 3.3% 107,310 1.8% Others - - - 1,040,774 17.8%
Total Gross Value Added 122,347.40 100.0% 3.8% 5,859,227 100%
Source: GDP: Central Statistical Office, The Monthly June 2017. Employment: CSO, 2014 Labour Force Survey.
3.2.2 Current Condition and Potential of Industrial Development Along Nacala Corridor
Similar to agriculture, investment potentials and opportunities in some industries in Eastern
Province will be further promoted by the development of the Nacala Corridor. However,
industries in other provinces may have the potential for development through utilization of the
corridor, as the products are more tolerant to a longer time of transportation than perishable
agro-products. They include followings.
(1) Agro-Processing
According to ‘Agro Processing Sector Profile 2014’ published by ZDA, the agro-processing
industry and the manufacturing industry contribute about 11% to Zambia’s GDP. In 2013, the
processed and refined foods sector’s export earnings rose by 35.6% from USD 417,387 in
2012 to USD 565,808. The growth in the export trend has continued to be attributed to wider
market access in both regional and international markets. The SADC market is the country’s
largest export market bloc. SADC alone accounted for 35% of the total non-traditional exports
Data Collection Survey on Nacala Corridor Integrated Development in Southern Africa Final Report
3-57
(NTEs) in 2013. South Africa accounted for 72%, followed by Tanzania and Namibia with
less than 10% each. The COMESA region is also important market for Zambia’s NTEs
exports. DRC is by far the largest market, followed by Zimbabwe, Malawi, Namibia and
Tanzania. The total export to COMESA and SADC excluding South Africa amounted to 78%
of total NTEs47.
The sector has continued to be dominated by Zambia Sugar Plc which is the largest sugar
producer in Zambia with an estimated market share of about 90%. The company grows over
65% of its own cane on over 16,550 ha, and the rest of the cane is grown by Out- grower
Schemes such as the Magobbo, Manyoyo and Kaleya48. Other large scale processor includes
soya bean processors such as COMACO, Mount Meru and Tiger Animal Feeds, as well as
meat processors such as Zambeef and TradeKing, one of the largest FMCG (fast moving
consumer goods) manufacturers in the Southern African region. The expansion of the business
of these companies and other small scale producers largely depends on the growth of demand
in the Southern and Eastern African countries mentioned above, and the development of the
Nacala Corridor will stimulate the trade of agro-processed products along the corridor.
(2) Steel, Metal Fabrication and Parts49
Zambia has identified steel and copper fabrication, among many engineering products, as
targets for accelerating growth of engineering products industries in Zambia. Over the last five
years, several steel making and copper fabrication companies have emerged dynamically in
Zambia. Basic metals and fabricated engineering products accounted for 25% of the total
manufacturing GDP. This category covers the companies’ manufacturing of products from
copper and steel, include copper wire, cable and rods, alloys and ingots, carbon brushes,
switch-gears, pipes and railway sleepers. Steel products include deformed bar, flat bar and
metal tubes. While the recent development of the steel sector in Zambia has been remarkable,
there are many opportunities for more investment to catch sharply increasing demands in both
the Zambian and the regional markets. The country constantly records trade deficit in the iron
and steel products, and therefore; exports of the Zambian-made steel products are to be
encouraged. It is required that Zambia increases its ranges of steel products and also increases
its integration along the long production (supply) chain of the iron and steel sector. As regards
the resources, steel scrap is the main source of raw material for steelmaking in Zambia.
However, Zambia has huge reserves of iron ores, which can be used to produce steel products
using the Direct Reduced Iron (DRI) technology. When the feasibility of DRI production in
Zambia becomes clearer, investment opportunities in the iron and steel sector in Zambia will
47 ZDA, “Agro Processing Sector Profile 2014” 48 Ibid. 49 The Best of Zambia http://thebestofzambia.com/directory/manufacturing-and-wholesale/materials-and-merchants/steel/; http://thebestofzambia.com/directory/manufacturing-and-wholesale/industrial-products/metal-fabrication-and-parts/ ZDA, “Sub-Sector Profile: Iron and Steel”, August 2012.
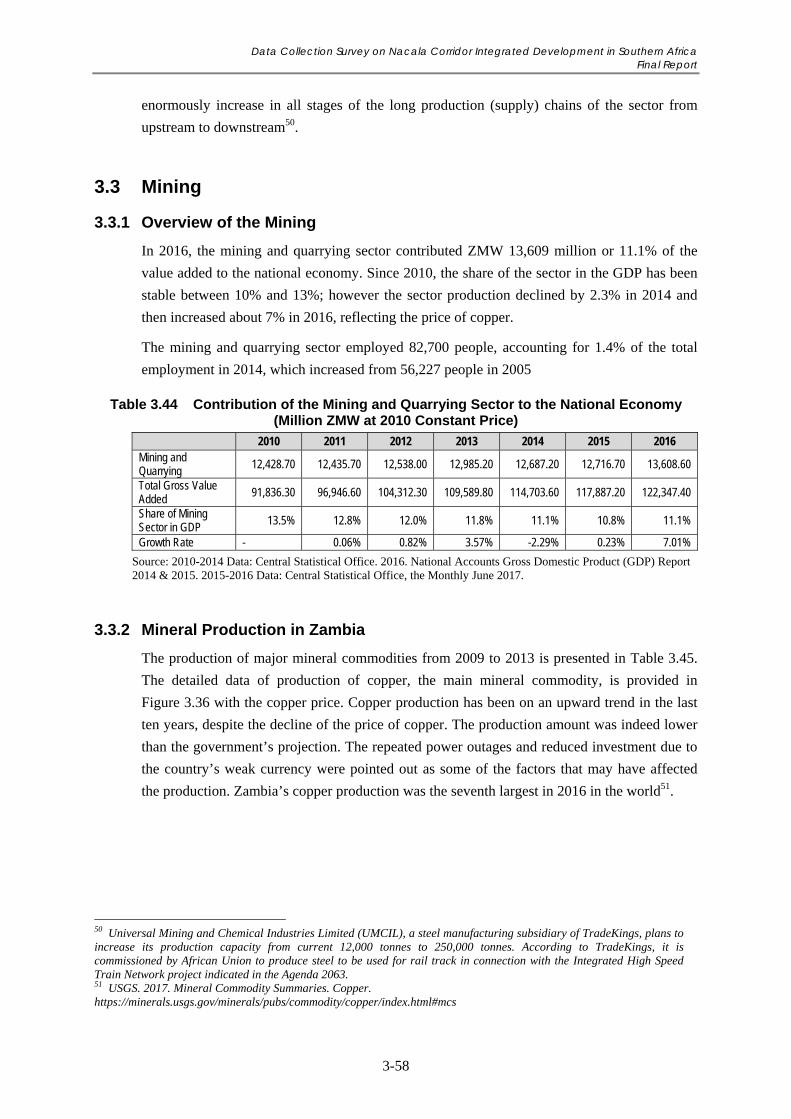
Data Collection Survey on Nacala Corridor Integrated Development in Southern Africa Final Report
3-58
enormously increase in all stages of the long production (supply) chains of the sector from
upstream to downstream50.
3.3 Mining
3.3.1 Overview of the Mining
In 2016, the mining and quarrying sector contributed ZMW 13,609 million or 11.1% of the
value added to the national economy. Since 2010, the share of the sector in the GDP has been
stable between 10% and 13%; however the sector production declined by 2.3% in 2014 and
then increased about 7% in 2016, reflecting the price of copper.
The mining and quarrying sector employed 82,700 people, accounting for 1.4% of the total
employment in 2014, which increased from 56,227 people in 2005
Table 3.44 Contribution of the Mining and Quarrying Sector to the National Economy (Million ZMW at 2010 Constant Price)
2010 2011 2012 2013 2014 2015 2016 Mining and Quarrying 12,428.70 12,435.70 12,538.00 12,985.20 12,687.20 12,716.70 13,608.60
Total Gross Value Added 91,836.30 96,946.60 104,312.30 109,589.80 114,703.60 117,887.20 122,347.40
Share of Mining Sector in GDP 13.5% 12.8% 12.0% 11.8% 11.1% 10.8% 11.1%
Growth Rate - 0.06% 0.82% 3.57% -2.29% 0.23% 7.01%
Source: 2010-2014 Data: Central Statistical Office. 2016. National Accounts Gross Domestic Product (GDP) Report 2014 & 2015. 2015-2016 Data: Central Statistical Office, the Monthly June 2017.
3.3.2 Mineral Production in Zambia
The production of major mineral commodities from 2009 to 2013 is presented in Table 3.45.
The detailed data of production of copper, the main mineral commodity, is provided in
Figure 3.36 with the copper price. Copper production has been on an upward trend in the last
ten years, despite the decline of the price of copper. The production amount was indeed lower
than the government’s projection. The repeated power outages and reduced investment due to
the country’s weak currency were pointed out as some of the factors that may have affected
the production. Zambia’s copper production was the seventh largest in 2016 in the world51.
50 Universal Mining and Chemical Industries Limited (UMCIL), a steel manufacturing subsidiary of TradeKings, plans to increase its production capacity from current 12,000 tonnes to 250,000 tonnes. According to TradeKings, it is commissioned by African Union to produce steel to be used for rail track in connection with the Integrated High Speed Train Network project indicated in the Agenda 2063. 51 USGS. 2017. Mineral Commodity Summaries. Copper. https://minerals.usgs.gov/minerals/pubs/commodity/copper/index.html#mcs
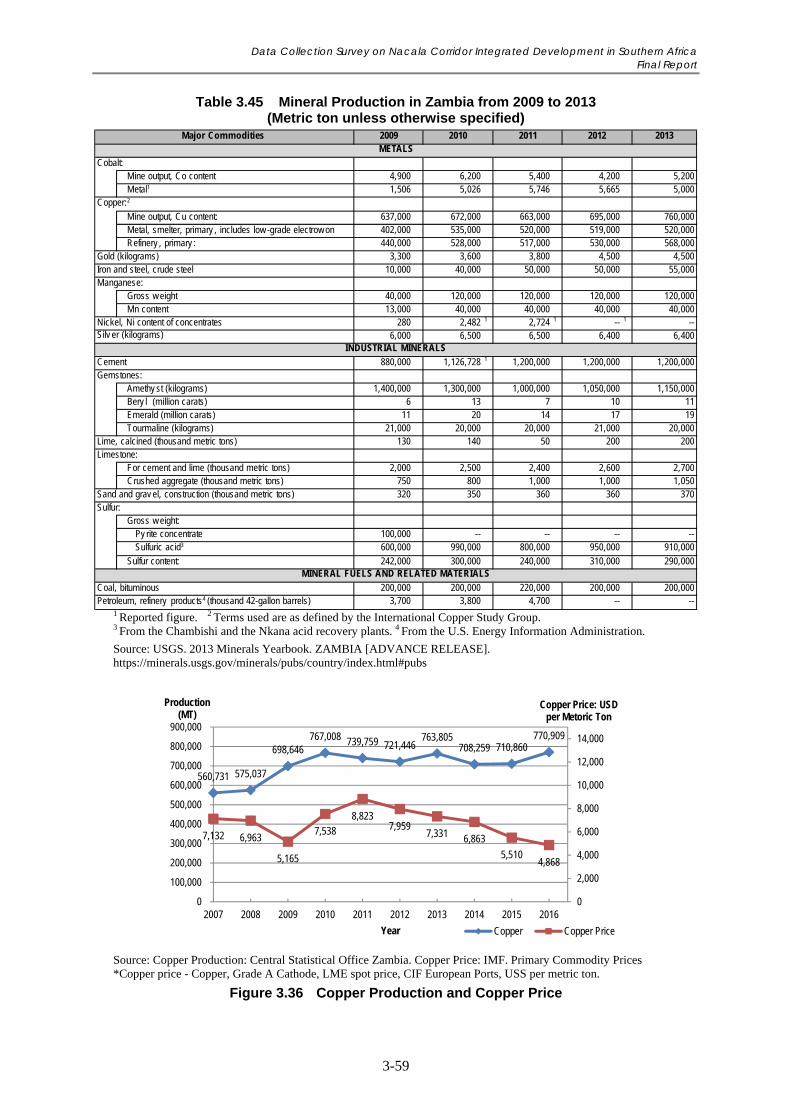
Data Collection Survey on Nacala Corridor Integrated Development in Southern Africa Final Report
3-59
Table 3.45 Mineral Production in Zambia from 2009 to 2013 (Metric ton unless otherwise specified)
1 Reported figure. 2 Terms used are as defined by the International Copper Study Group. 3 From the Chambishi and the Nkana acid recovery plants. 4 From the U.S. Energy Information Administration.
Source: USGS. 2013 Minerals Yearbook. ZAMBIA [ADVANCE RELEASE]. https://minerals.usgs.gov/minerals/pubs/country/index.html#pubs
Source: Copper Production: Central Statistical Office Zambia. Copper Price: IMF. Primary Commodity Prices *Copper price - Copper, Grade A Cathode, LME spot price, CIF European Ports, USS per metric ton.
Figure 3.36 Copper Production and Copper Price
2013
Cobalt: Mine output, Co content 4,900 6,200 5,400 4,200 5,200Metal1 1,506 5,026 5,746 5,665 5,000
Copper:2
Mine output, Cu content: 637,000 672,000 663,000 695,000 760,000Metal, smelter, primary , includes low -grade electrow on 402,000 535,000 520,000 519,000 520,000Refinery , primary : 440,000 528,000 517,000 530,000 568,000
Gold (kilograms) 3,300 3,600 3,800 4,500 4,500Iron and steel, crude steel 10,000 40,000 50,000 50,000 55,000Manganese:
Gross w eight 40,000 120,000 120,000 120,000 120,000Mn content 13,000 40,000 40,000 40,000 40,000
Nickel, Ni content of concentrates 280 2,482 1 2,724 1 -- 1 --6,000 6,500 6,500 6,400 6,400
Cement 880,000 1,126,728 1 1,200,000 1,200,000 1,200,000Gemstones:
Amethy st (kilograms) 1,400,000 1,300,000 1,000,000 1,050,000 1,150,000Bery l (million carats) 6 13 7 10 11Emerald (million carats) 11 20 14 17 19Tourmaline (kilograms) 21,000 20,000 20,000 21,000 20,000
Lime, calcined (thousand metric tons) 130 140 50 200 200Limestone:
For cement and lime (thousand metric tons) 2,000 2,500 2,400 2,600 2,700Crushed aggregate (thousand metric tons) 750 800 1,000 1,000 1,050
Sand and grav el, construction (thousand metric tons) 320 350 360 360 370Sulfur:
Gross w eight: Py rite concentrate 100,000 -- -- -- --Sulfuric acid3 600,000 990,000 800,000 950,000 910,000
Sulfur content: 242,000 300,000 240,000 310,000 290,000
Coal, bituminous 200,000 200,000 220,000 200,000 200,000Petroleum, refinery products4 (thousand 42-gallon barrels) 3,700 3,800 4,700 -- --
Silv er (kilograms)
METALS
INDUSTRIAL MINERALS
MINERAL FUELS AND RELATED MATERIALS
Major Commodities 2009 2010 2011 2012
560,731 575,037
698,646 767,008 739,759 721,446
763,805 708,259 710,860
770,909
7,132 6,963
5,165
7,538 8,823
7,959 7,331 6,863
5,510 4,868
0
2,000
4,000
6,000
8,000
10,000
12,000
14,000
0
100,000
200,000
300,000
400,000
500,000
600,000
700,000
800,000
900,000
2007 2008 2009 2010 2011 2012 2013 2014 2015 2016
Copper Price: USD per Metoric Ton
Production (MT)
Year Copper Copper Price
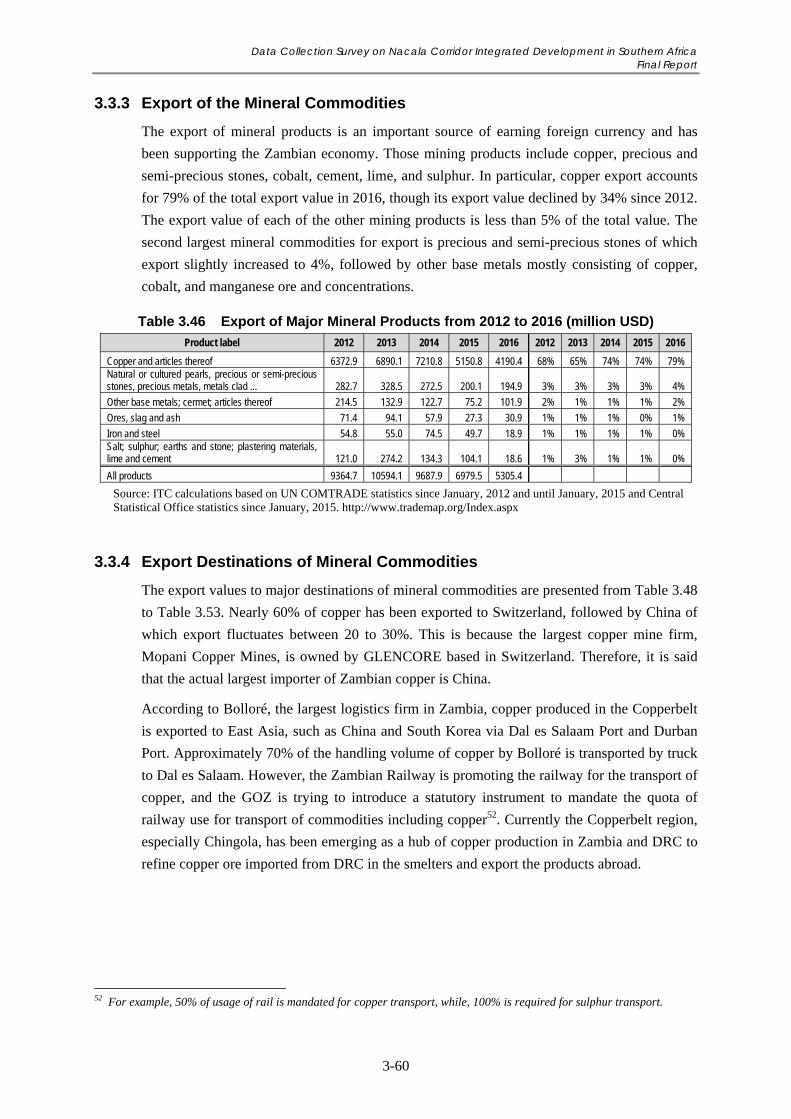
Data Collection Survey on Nacala Corridor Integrated Development in Southern Africa Final Report
3-60
3.3.3 Export of the Mineral Commodities
The export of mineral products is an important source of earning foreign currency and has
been supporting the Zambian economy. Those mining products include copper, precious and
semi-precious stones, cobalt, cement, lime, and sulphur. In particular, copper export accounts
for 79% of the total export value in 2016, though its export value declined by 34% since 2012.
The export value of each of the other mining products is less than 5% of the total value. The
second largest mineral commodities for export is precious and semi-precious stones of which
export slightly increased to 4%, followed by other base metals mostly consisting of copper,
cobalt, and manganese ore and concentrations.
Table 3.46 Export of Major Mineral Products from 2012 to 2016 (million USD)
Product label 2012 2013 2014 2015 2016 2012 2013 2014 2015 2016
Copper and articles thereof 6372.9 6890.1 7210.8 5150.8 4190.4 68% 65% 74% 74% 79% Natural or cultured pearls, precious or semi-precious stones, precious metals, metals clad ... 282.7 328.5 272.5 200.1 194.9 3% 3% 3% 3% 4%
Other base metals; cermet; articles thereof 214.5 132.9 122.7 75.2 101.9 2% 1% 1% 1% 2%
Ores, slag and ash 71.4 94.1 57.9 27.3 30.9 1% 1% 1% 0% 1%
Iron and steel 54.8 55.0 74.5 49.7 18.9 1% 1% 1% 1% 0% Salt; sulphur; earths and stone; plastering materials, lime and cement 121.0 274.2 134.3 104.1 18.6 1% 3% 1% 1% 0%
All products 9364.7 10594.1 9687.9 6979.5 5305.4
Source: ITC calculations based on UN COMTRADE statistics since January, 2012 and until January, 2015 and Central Statistical Office statistics since January, 2015. http://www.trademap.org/Index.aspx
3.3.4 Export Destinations of Mineral Commodities
The export values to major destinations of mineral commodities are presented from Table 3.48
to Table 3.53. Nearly 60% of copper has been exported to Switzerland, followed by China of
which export fluctuates between 20 to 30%. This is because the largest copper mine firm,
Mopani Copper Mines, is owned by GLENCORE based in Switzerland. Therefore, it is said
that the actual largest importer of Zambian copper is China.
According to Bolloré, the largest logistics firm in Zambia, copper produced in the Copperbelt
is exported to East Asia, such as China and South Korea via Dal es Salaam Port and Durban
Port. Approximately 70% of the handling volume of copper by Bolloré is transported by truck
to Dal es Salaam. However, the Zambian Railway is promoting the railway for the transport of
copper, and the GOZ is trying to introduce a statutory instrument to mandate the quota of
railway use for transport of commodities including copper52. Currently the Copperbelt region,
especially Chingola, has been emerging as a hub of copper production in Zambia and DRC to
refine copper ore imported from DRC in the smelters and export the products abroad.
52 For example, 50% of usage of rail is mandated for copper transport, while, 100% is required for sulphur transport.
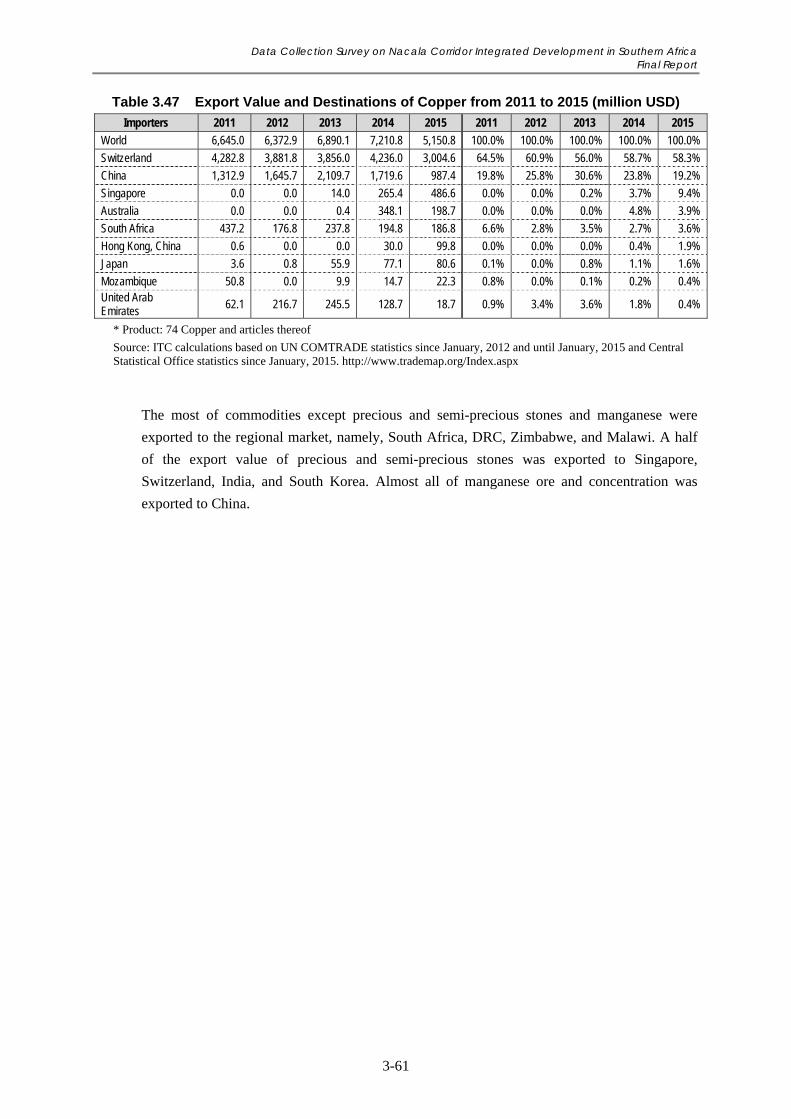
Data Collection Survey on Nacala Corridor Integrated Development in Southern Africa Final Report
3-61
Table 3.47 Export Value and Destinations of Copper from 2011 to 2015 (million USD)
Importers 2011 2012 2013 2014 2015 2011 2012 2013 2014 2015
World 6,645.0 6,372.9 6,890.1 7,210.8 5,150.8 100.0% 100.0% 100.0% 100.0% 100.0%
Switzerland 4,282.8 3,881.8 3,856.0 4,236.0 3,004.6 64.5% 60.9% 56.0% 58.7% 58.3%
China 1,312.9 1,645.7 2,109.7 1,719.6 987.4 19.8% 25.8% 30.6% 23.8% 19.2%
Singapore 0.0 0.0 14.0 265.4 486.6 0.0% 0.0% 0.2% 3.7% 9.4%
Australia 0.0 0.0 0.4 348.1 198.7 0.0% 0.0% 0.0% 4.8% 3.9%
South Africa 437.2 176.8 237.8 194.8 186.8 6.6% 2.8% 3.5% 2.7% 3.6%
Hong Kong, China 0.6 0.0 0.0 30.0 99.8 0.0% 0.0% 0.0% 0.4% 1.9%
Japan 3.6 0.8 55.9 77.1 80.6 0.1% 0.0% 0.8% 1.1% 1.6%
Mozambique 50.8 0.0 9.9 14.7 22.3 0.8% 0.0% 0.1% 0.2% 0.4% United Arab Emirates 62.1 216.7 245.5 128.7 18.7 0.9% 3.4% 3.6% 1.8% 0.4%
* Product: 74 Copper and articles thereof
Source: ITC calculations based on UN COMTRADE statistics since January, 2012 and until January, 2015 and Central Statistical Office statistics since January, 2015. http://www.trademap.org/Index.aspx
The most of commodities except precious and semi-precious stones and manganese were
exported to the regional market, namely, South Africa, DRC, Zimbabwe, and Malawi. A half
of the export value of precious and semi-precious stones was exported to Singapore,
Switzerland, India, and South Korea. Almost all of manganese ore and concentration was
exported to China.
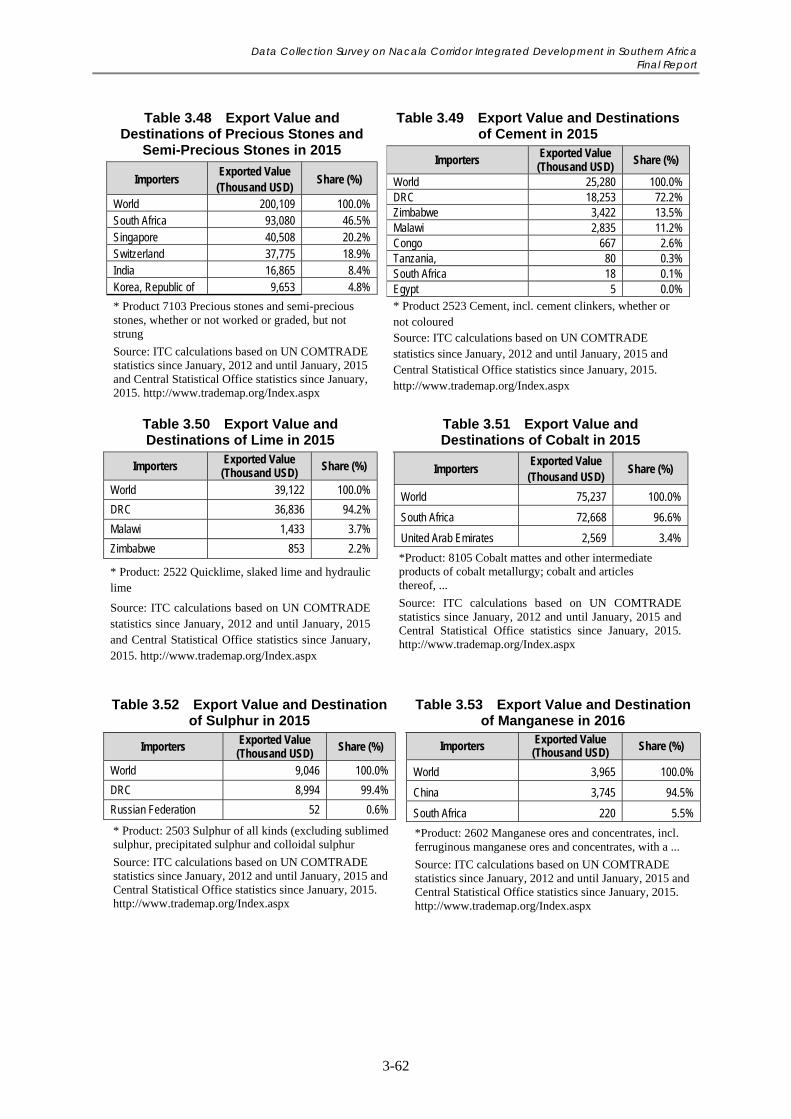
Data Collection Survey on Nacala Corridor Integrated Development in Southern Africa Final Report
3-62
Table 3.48 Export Value and Destinations of Precious Stones and
Semi-Precious Stones in 2015
Importers Exported Value (Thousand USD)
Share (%)
World 200,109 100.0% South Africa 93,080 46.5% Singapore 40,508 20.2% Switzerland 37,775 18.9% India 16,865 8.4% Korea, Republic of 9,653 4.8%
* Product 7103 Precious stones and semi-precious stones, whether or not worked or graded, but not strung
Source: ITC calculations based on UN COMTRADE statistics since January, 2012 and until January, 2015 and Central Statistical Office statistics since January, 2015. http://www.trademap.org/Index.aspx
Table 3.49 Export Value and Destinations of Cement in 2015
Importers Exported Value (Thousand USD)
Share (%)
World 25,280 100.0% DRC 18,253 72.2% Zimbabwe 3,422 13.5% Malawi 2,835 11.2% Congo 667 2.6% Tanzania, 80 0.3% South Africa 18 0.1% Egypt 5 0.0% * Product 2523 Cement, incl. cement clinkers, whether or not coloured Source: ITC calculations based on UN COMTRADE statistics since January, 2012 and until January, 2015 and Central Statistical Office statistics since January, 2015. http://www.trademap.org/Index.aspx
Table 3.50 Export Value and Destinations of Lime in 2015
Importers Exported Value (Thousand USD)
Share (%)
World 39,122 100.0%
DRC 36,836 94.2%
Malawi 1,433 3.7%
Zimbabwe 853 2.2%
* Product: 2522 Quicklime, slaked lime and hydraulic lime
Source: ITC calculations based on UN COMTRADE statistics since January, 2012 and until January, 2015 and Central Statistical Office statistics since January, 2015. http://www.trademap.org/Index.aspx
Importers Exported Value (Thousand USD)
Share (%)
World 75,237 100.0%
South Africa 72,668 96.6%
United Arab Emirates 2,569 3.4%
*Product: 8105 Cobalt mattes and other intermediate products of cobalt metallurgy; cobalt and articles thereof, ...
Source: ITC calculations based on UN COMTRADE statistics since January, 2012 and until January, 2015 and Central Statistical Office statistics since January, 2015. http://www.trademap.org/Index.aspx
Table 3.51 Export Value and Destinations of Cobalt in 2015
Table 3.52 Export Value and Destination of Sulphur in 2015
Importers Exported Value (Thousand USD)
Share (%)
World 9,046 100.0%
DRC 8,994 99.4%
Russian Federation 52 0.6%
* Product: 2503 Sulphur of all kinds (excluding sublimed sulphur, precipitated sulphur and colloidal sulphur
Source: ITC calculations based on UN COMTRADE statistics since January, 2012 and until January, 2015 and Central Statistical Office statistics since January, 2015. http://www.trademap.org/Index.aspx
Importers Exported Value (Thousand USD) Share (%)
World 3,965 100.0%
China 3,745 94.5%
South Africa 220 5.5%
*Product: 2602 Manganese ores and concentrates, incl. ferruginous manganese ores and concentrates, with a ...
Source: ITC calculations based on UN COMTRADE statistics since January, 2012 and until January, 2015 and Central Statistical Office statistics since January, 2015. http://www.trademap.org/Index.aspx
Table 3.53 Export Value and Destination of Manganese in 2016
Data Collection Survey on Nacala Corridor Integrated Development in Southern Africa Final Report
3-63
3.3.5 Government Policy of Mining Sector
The economic development of Zambia is dependent on mining. Copper contributes
approximately 77% to total exports. The government has considered that the diversification of
the economic development is essential.
In the 7NDP 2017-2021, “A Diversified and Export-Oriented Mining Sector” is the 2nd
Development Outcome to achieve the goal. The Plan emphasises on broadening the range of
minerals to cover non-traditional mining of gemstones, gold and industrial minerals as well as
promotion of value addition to mining products and include energy and material efficiency
strategies to increase productivity and reduce environmental pollution. In addition, the Plan
also focuses on formalising and empowering small-scale miners to make them more
productive, supporting the development of lapidaries and local auction sales of gemstones and
enhancing the capacity of local businesses to participate in the mining value chains and boost
export revenue.
The following are the strategies and programmes identified under the Development Outcome.
Strategy 1: Promote the exploitation of gemstones and industrial minerals
Programmes:
a) Geological information generation and provision; b) Mineral processing technology development; c) Small-scale miners’ empowerment; d) Small-scale mines regulatory framework enforcement; e) Market linkages development; f) Strategic environmental assessment and risk management; and g) Mineral exploration promotion
Strategy 2: Promote local and foreign participation in mining value chains and
industrialisation
Programmes:
a) Capacity development; b) Policy and regulatory framework review and enhancement; c) Access to finance promotion; d) Mining value-chain development; e) Research, innovation and technology promotion; and f) Investment Promotion
Strategy 3: Promote petroleum and gas exploration
Programmes:
a) Policy and regulatory framework review and enhancement; b) Capacity development; c) Geological and geophysical information generation and provision; and d) Environmental management
Strategy 4: Promote small-scale mining
Programmes:
a) Small-scale miners’ empowerment;
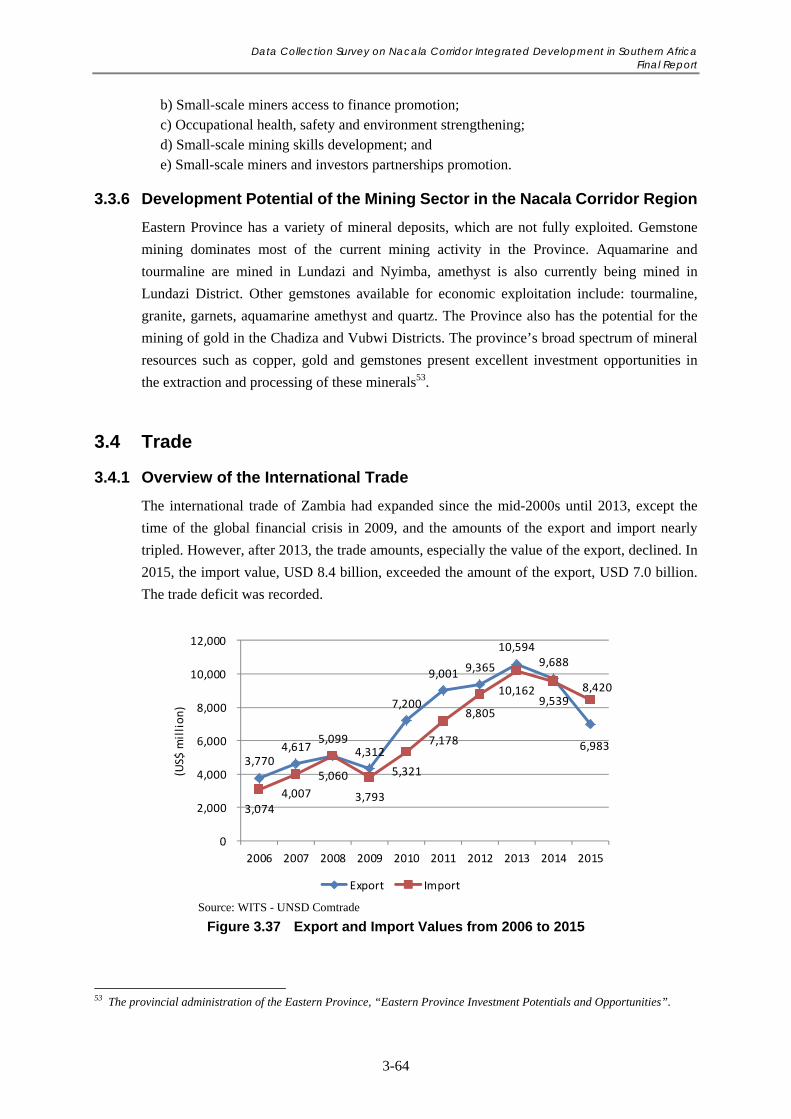
Data Collection Survey on Nacala Corridor Integrated Development in Southern Africa Final Report
3-64
b) Small-scale miners access to finance promotion; c) Occupational health, safety and environment strengthening; d) Small-scale mining skills development; and e) Small-scale miners and investors partnerships promotion.
3.3.6 Development Potential of the Mining Sector in the Nacala Corridor Region
Eastern Province has a variety of mineral deposits, which are not fully exploited. Gemstone
mining dominates most of the current mining activity in the Province. Aquamarine and
tourmaline are mined in Lundazi and Nyimba, amethyst is also currently being mined in
Lundazi District. Other gemstones available for economic exploitation include: tourmaline,
granite, garnets, aquamarine amethyst and quartz. The Province also has the potential for the
mining of gold in the Chadiza and Vubwi Districts. The province’s broad spectrum of mineral
resources such as copper, gold and gemstones present excellent investment opportunities in
the extraction and processing of these minerals53.
3.4 Trade
3.4.1 Overview of the International Trade
The international trade of Zambia had expanded since the mid-2000s until 2013, except the
time of the global financial crisis in 2009, and the amounts of the export and import nearly
tripled. However, after 2013, the trade amounts, especially the value of the export, declined. In
2015, the import value, USD 8.4 billion, exceeded the amount of the export, USD 7.0 billion.
The trade deficit was recorded.
Source: WITS - UNSD Comtrade
Figure 3.37 Export and Import Values from 2006 to 2015
53 The provincial administration of the Eastern Province, “Eastern Province Investment Potentials and Opportunities”.
3,770 4,617
5,099 4,312
7,200
9,001 9,365
10,594 9,688
6,983
3,074 4,007
5,060
3,793
5,321
7,178
8,805
10,162 9,539
8,420
0
2,000
4,000
6,000
8,000
10,000
12,000
2006 2007 2008 2009 2010 2011 2012 2013 2014 2015
(US$
million)
Export Import
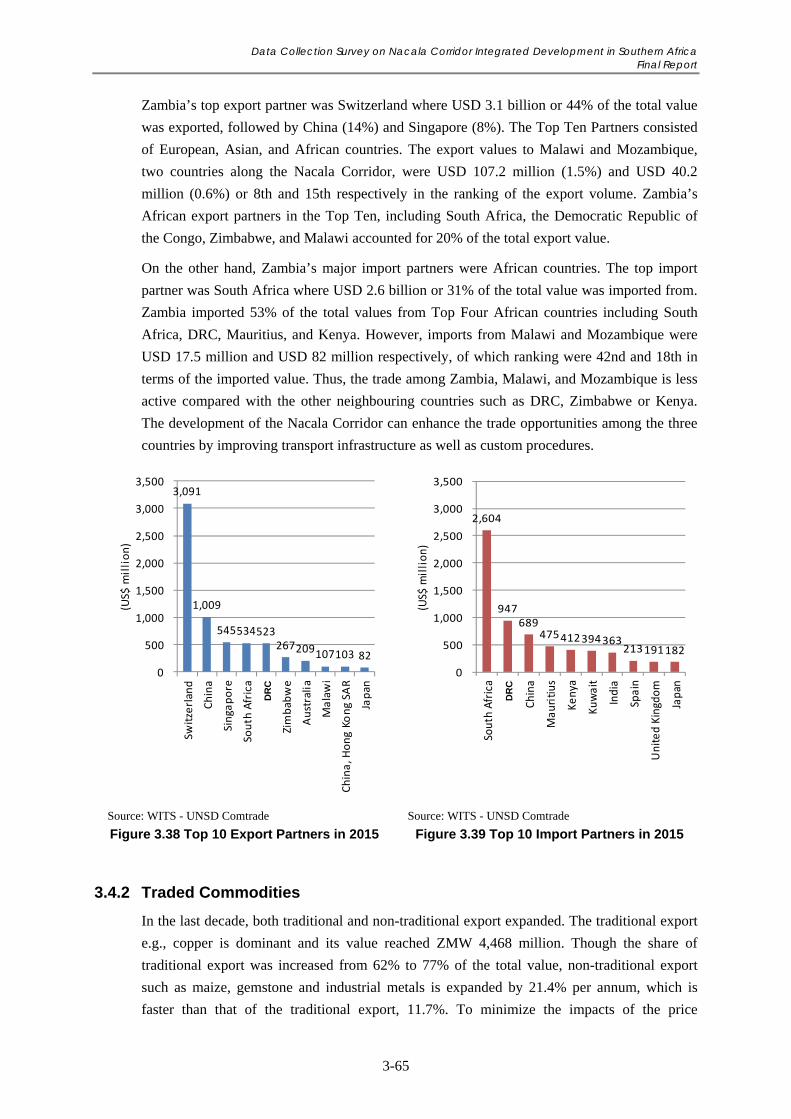
Data Collection Survey on Nacala Corridor Integrated Development in Southern Africa Final Report
3-65
Zambia’s top export partner was Switzerland where USD 3.1 billion or 44% of the total value
was exported, followed by China (14%) and Singapore (8%). The Top Ten Partners consisted
of European, Asian, and African countries. The export values to Malawi and Mozambique,
two countries along the Nacala Corridor, were USD 107.2 million (1.5%) and USD 40.2
million (0.6%) or 8th and 15th respectively in the ranking of the export volume. Zambia’s
African export partners in the Top Ten, including South Africa, the Democratic Republic of
the Congo, Zimbabwe, and Malawi accounted for 20% of the total export value.
On the other hand, Zambia’s major import partners were African countries. The top import
partner was South Africa where USD 2.6 billion or 31% of the total value was imported from.
Zambia imported 53% of the total values from Top Four African countries including South
Africa, DRC, Mauritius, and Kenya. However, imports from Malawi and Mozambique were
USD 17.5 million and USD 82 million respectively, of which ranking were 42nd and 18th in
terms of the imported value. Thus, the trade among Zambia, Malawi, and Mozambique is less
active compared with the other neighbouring countries such as DRC, Zimbabwe or Kenya.
The development of the Nacala Corridor can enhance the trade opportunities among the three
countries by improving transport infrastructure as well as custom procedures.
Source: WITS - UNSD Comtrade
Figure 3.38 Top 10 Export Partners in 2015
Source: WITS - UNSD Comtrade
Figure 3.39 Top 10 Import Partners in 2015
3.4.2 Traded Commodities
In the last decade, both traditional and non-traditional export expanded. The traditional export
e.g., copper is dominant and its value reached ZMW 4,468 million. Though the share of
traditional export was increased from 62% to 77% of the total value, non-traditional export
such as maize, gemstone and industrial metals is expanded by 21.4% per annum, which is
faster than that of the traditional export, 11.7%. To minimize the impacts of the price
3,091
1,009
545 534 523 267 209 107 103 82
0
500
1,000
1,500
2,000
2,500
3,000
3,500
Switzerland
China
Singapore
South Africa
Dem. Rep. of the Congo
Zimbabwe
Australia
Malawi
China, H
ong Kong SA
R
Japan
(US$
million)
2,604
947 689
475 412 394 363 213 191 182
0
500
1,000
1,500
2,000
2,500
3,000
3,500South Africa
Dem. Rep. of the Congo
China
Mauritius
Kenya
Kuwait
India
Spain
United Kingdom
Japan
(US$
million)
DR
C
DR
C
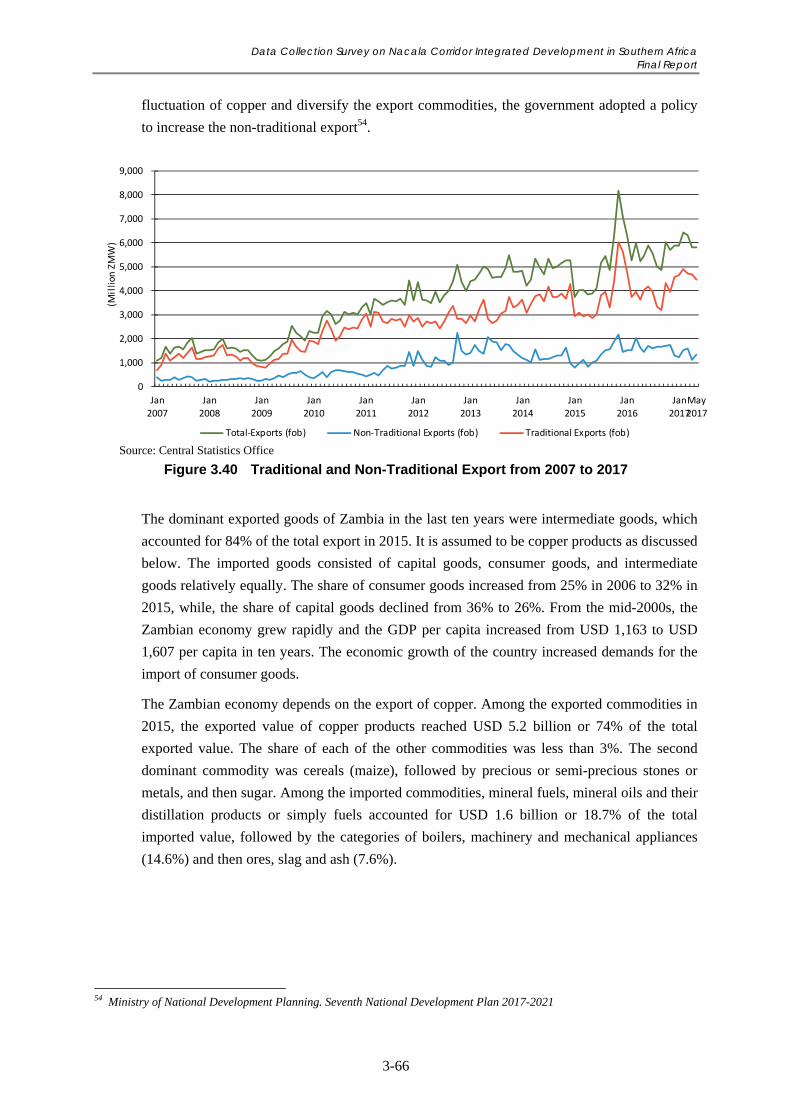
Data Collection Survey on Nacala Corridor Integrated Development in Southern Africa Final Report
3-66
fluctuation of copper and diversify the export commodities, the government adopted a policy
to increase the non-traditional export54.
Source: Central Statistics Office
Figure 3.40 Traditional and Non-Traditional Export from 2007 to 2017
The dominant exported goods of Zambia in the last ten years were intermediate goods, which
accounted for 84% of the total export in 2015. It is assumed to be copper products as discussed
below. The imported goods consisted of capital goods, consumer goods, and intermediate
goods relatively equally. The share of consumer goods increased from 25% in 2006 to 32% in
2015, while, the share of capital goods declined from 36% to 26%. From the mid-2000s, the
Zambian economy grew rapidly and the GDP per capita increased from USD 1,163 to USD
1,607 per capita in ten years. The economic growth of the country increased demands for the
import of consumer goods.
The Zambian economy depends on the export of copper. Among the exported commodities in
2015, the exported value of copper products reached USD 5.2 billion or 74% of the total
exported value. The share of each of the other commodities was less than 3%. The second
dominant commodity was cereals (maize), followed by precious or semi-precious stones or
metals, and then sugar. Among the imported commodities, mineral fuels, mineral oils and their
distillation products or simply fuels accounted for USD 1.6 billion or 18.7% of the total
imported value, followed by the categories of boilers, machinery and mechanical appliances
(14.6%) and then ores, slag and ash (7.6%).
54 Ministry of National Development Planning. Seventh National Development Plan 2017-2021
0
1,000
2,000
3,000
4,000
5,000
6,000
7,000
8,000
9,000
Jan
2007
Jan
2008
Jan
2009
Jan
2010
Jan
2011
Jan
2012
Jan
2013
Jan
2014
Jan
2015
Jan
2016
Jan
2017
May
2017
(Million
ZMW)
Total‐Exports (fob) Non‐Traditional Exports (fob) Traditional Exports (fob)
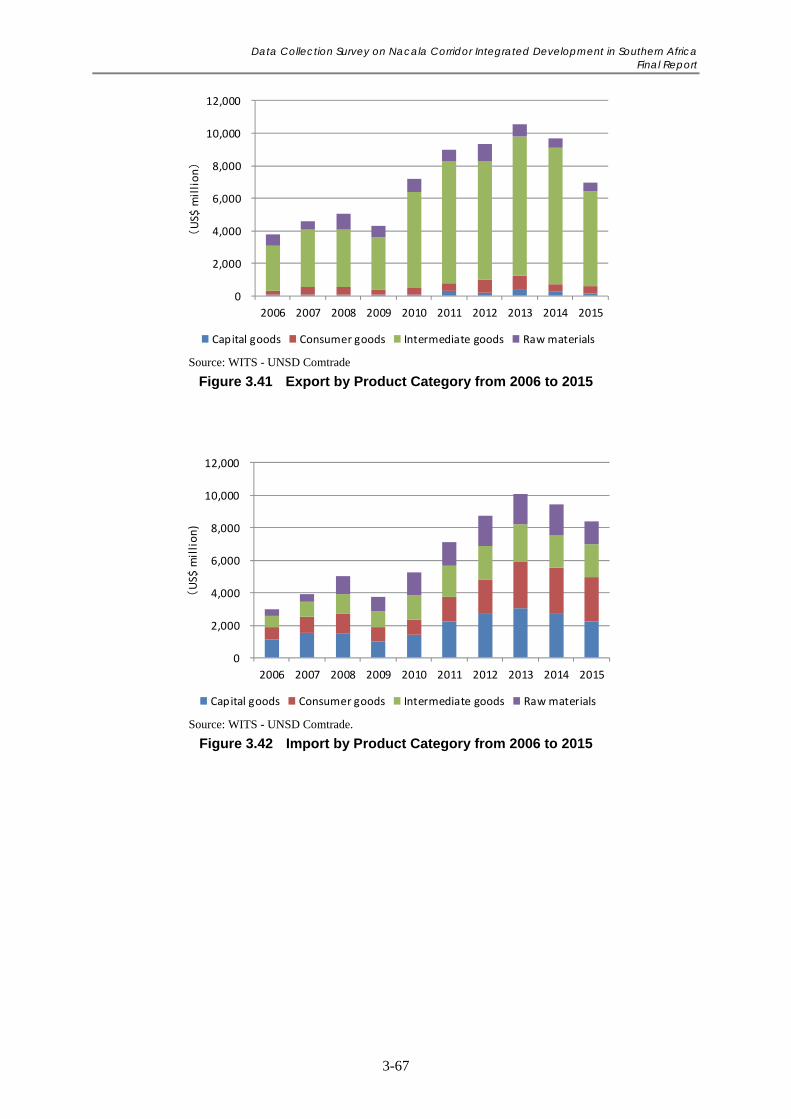
Data Collection Survey on Nacala Corridor Integrated Development in Southern Africa Final Report
3-67
Source: WITS - UNSD Comtrade
Figure 3.41 Export by Product Category from 2006 to 2015
Source: WITS - UNSD Comtrade.
Figure 3.42 Import by Product Category from 2006 to 2015
0
2,000
4,000
6,000
8,000
10,000
12,000
2006 2007 2008 2009 2010 2011 2012 2013 2014 2015
(US$
million)
Capital goods Consumer goods Intermediate goods Raw materials
0
2,000
4,000
6,000
8,000
10,000
12,000
2006 2007 2008 2009 2010 2011 2012 2013 2014 2015
(US$
million)
Capital goods Consumer goods Intermediate goods Raw materials
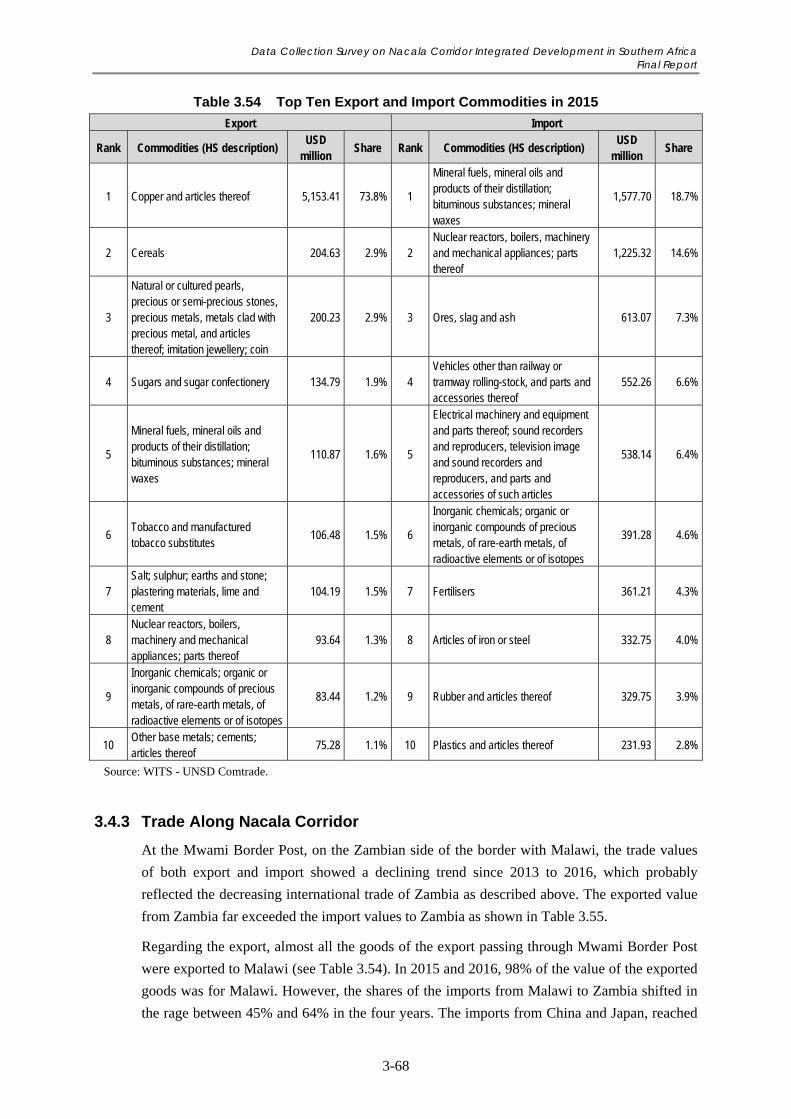
Data Collection Survey on Nacala Corridor Integrated Development in Southern Africa Final Report
3-68
Table 3.54 Top Ten Export and Import Commodities in 2015
Export Import
Rank Commodities (HS description) USD
million Share Rank Commodities (HS description)
USD million
Share
1 Copper and articles thereof 5,153.41 73.8% 1
Mineral fuels, mineral oils and products of their distillation; bituminous substances; mineral waxes
1,577.70 18.7%
2 Cereals 204.63 2.9% 2 Nuclear reactors, boilers, machinery and mechanical appliances; parts thereof
1,225.32 14.6%
3
Natural or cultured pearls, precious or semi-precious stones, precious metals, metals clad with precious metal, and articles thereof; imitation jewellery; coin
200.23 2.9% 3 Ores, slag and ash 613.07 7.3%
4 Sugars and sugar confectionery 134.79 1.9% 4 Vehicles other than railway or tramway rolling-stock, and parts and accessories thereof
552.26 6.6%
5
Mineral fuels, mineral oils and products of their distillation; bituminous substances; mineral waxes
110.87 1.6% 5
Electrical machinery and equipment and parts thereof; sound recorders and reproducers, television image and sound recorders and reproducers, and parts and accessories of such articles
538.14 6.4%
6 Tobacco and manufactured tobacco substitutes
106.48 1.5% 6
Inorganic chemicals; organic or inorganic compounds of precious metals, of rare-earth metals, of radioactive elements or of isotopes
391.28 4.6%
7 Salt; sulphur; earths and stone; plastering materials, lime and cement
104.19 1.5% 7 Fertilisers 361.21 4.3%
8 Nuclear reactors, boilers, machinery and mechanical appliances; parts thereof
93.64 1.3% 8 Articles of iron or steel 332.75 4.0%
9
Inorganic chemicals; organic or inorganic compounds of precious metals, of rare-earth metals, of radioactive elements or of isotopes
83.44 1.2% 9 Rubber and articles thereof 329.75 3.9%
10 Other base metals; cements; articles thereof
75.28 1.1% 10 Plastics and articles thereof 231.93 2.8%
Source: WITS - UNSD Comtrade.
3.4.3 Trade Along Nacala Corridor
At the Mwami Border Post, on the Zambian side of the border with Malawi, the trade values
of both export and import showed a declining trend since 2013 to 2016, which probably
reflected the decreasing international trade of Zambia as described above. The exported value
from Zambia far exceeded the import values to Zambia as shown in Table 3.55.
Regarding the export, almost all the goods of the export passing through Mwami Border Post
were exported to Malawi (see Table 3.54). In 2015 and 2016, 98% of the value of the exported
goods was for Malawi. However, the shares of the imports from Malawi to Zambia shifted in
the rage between 45% and 64% in the four years. The imports from China and Japan, reached
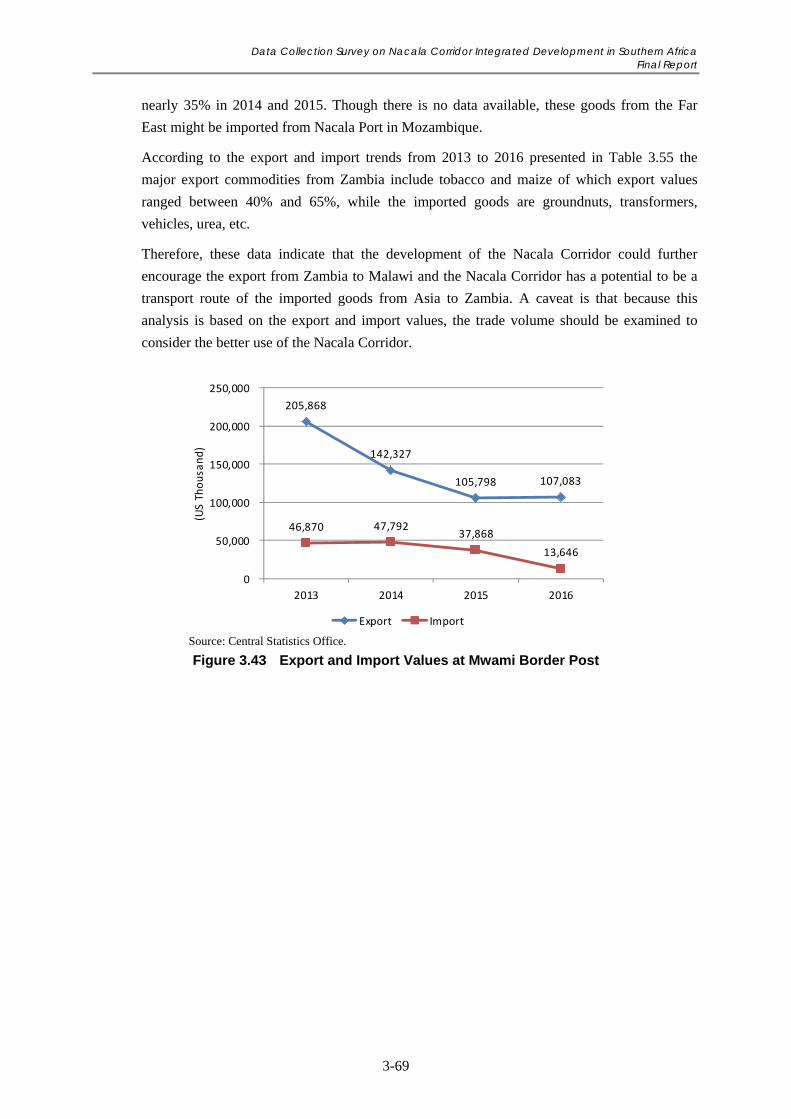
Data Collection Survey on Nacala Corridor Integrated Development in Southern Africa Final Report
3-69
nearly 35% in 2014 and 2015. Though there is no data available, these goods from the Far
East might be imported from Nacala Port in Mozambique.
According to the export and import trends from 2013 to 2016 presented in Table 3.55 the
major export commodities from Zambia include tobacco and maize of which export values
ranged between 40% and 65%, while the imported goods are groundnuts, transformers,
vehicles, urea, etc.
Therefore, these data indicate that the development of the Nacala Corridor could further
encourage the export from Zambia to Malawi and the Nacala Corridor has a potential to be a
transport route of the imported goods from Asia to Zambia. A caveat is that because this
analysis is based on the export and import values, the trade volume should be examined to
consider the better use of the Nacala Corridor.
Source: Central Statistics Office.
Figure 3.43 Export and Import Values at Mwami Border Post
205,868
142,327
105,798 107,083
46,870 47,792 37,868
13,646
0
50,000
100,000
150,000
200,000
250,000
2013 2014 2015 2016
(US Thousand)
Export Import
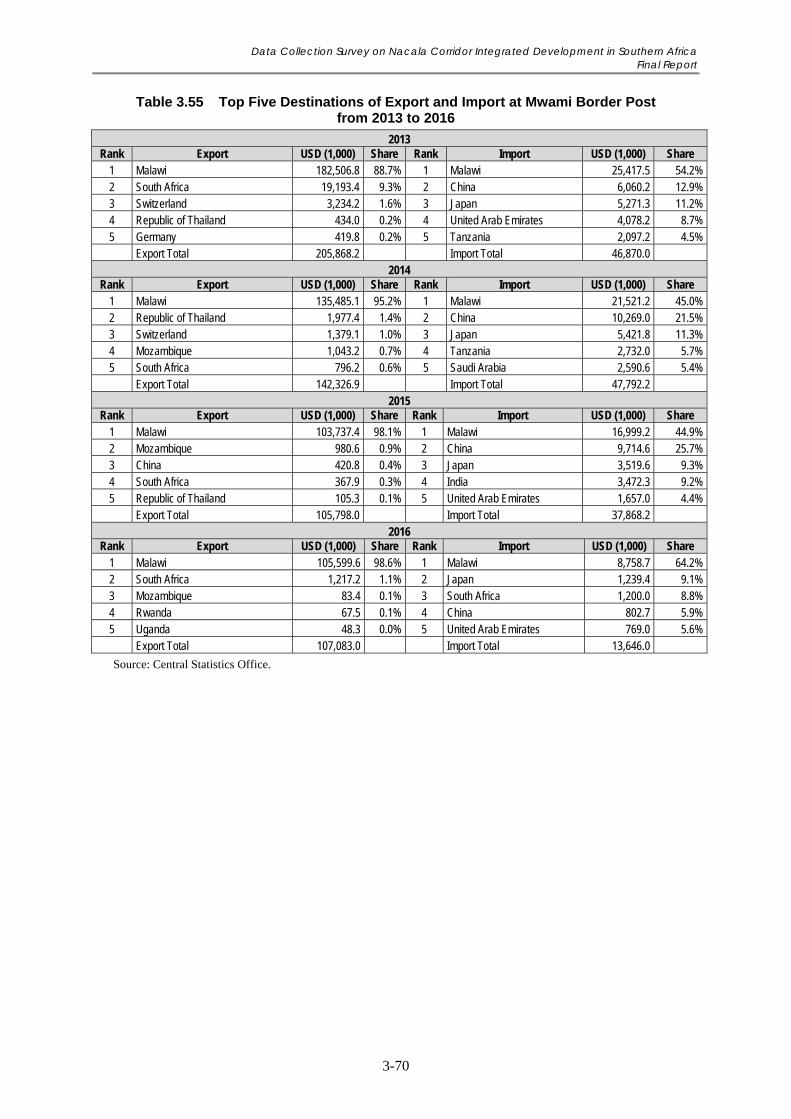
Data Collection Survey on Nacala Corridor Integrated Development in Southern Africa Final Report
3-70
Table 3.55 Top Five Destinations of Export and Import at Mwami Border Post from 2013 to 2016
2013 Rank Export USD (1,000) Share Rank Import USD (1,000) Share
1 Malawi 182,506.8 88.7% 1 Malawi 25,417.5 54.2% 2 South Africa 19,193.4 9.3% 2 China 6,060.2 12.9% 3 Switzerland 3,234.2 1.6% 3 Japan 5,271.3 11.2% 4 Republic of Thailand 434.0 0.2% 4 United Arab Emirates 4,078.2 8.7% 5 Germany 419.8 0.2% 5 Tanzania 2,097.2 4.5% Export Total 205,868.2 Import Total 46,870.0
2014 Rank Export USD (1,000) Share Rank Import USD (1,000) Share
1 Malawi 135,485.1 95.2% 1 Malawi 21,521.2 45.0% 2 Republic of Thailand 1,977.4 1.4% 2 China 10,269.0 21.5% 3 Switzerland 1,379.1 1.0% 3 Japan 5,421.8 11.3% 4 Mozambique 1,043.2 0.7% 4 Tanzania 2,732.0 5.7% 5 South Africa 796.2 0.6% 5 Saudi Arabia 2,590.6 5.4%
Export Total 142,326.9 Import Total 47,792.2 2015
Rank Export USD (1,000) Share Rank Import USD (1,000) Share 1 Malawi 103,737.4 98.1% 1 Malawi 16,999.2 44.9% 2 Mozambique 980.6 0.9% 2 China 9,714.6 25.7% 3 China 420.8 0.4% 3 Japan 3,519.6 9.3% 4 South Africa 367.9 0.3% 4 India 3,472.3 9.2% 5 Republic of Thailand 105.3 0.1% 5 United Arab Emirates 1,657.0 4.4%
Export Total 105,798.0 Import Total 37,868.2 2016
Rank Export USD (1,000) Share Rank Import USD (1,000) Share 1 Malawi 105,599.6 98.6% 1 Malawi 8,758.7 64.2% 2 South Africa 1,217.2 1.1% 2 Japan 1,239.4 9.1% 3 Mozambique 83.4 0.1% 3 South Africa 1,200.0 8.8% 4 Rwanda 67.5 0.1% 4 China 802.7 5.9% 5 Uganda 48.3 0.0% 5 United Arab Emirates 769.0 5.6%
Export Total 107,083.0 Import Total 13,646.0
Source: Central Statistics Office.
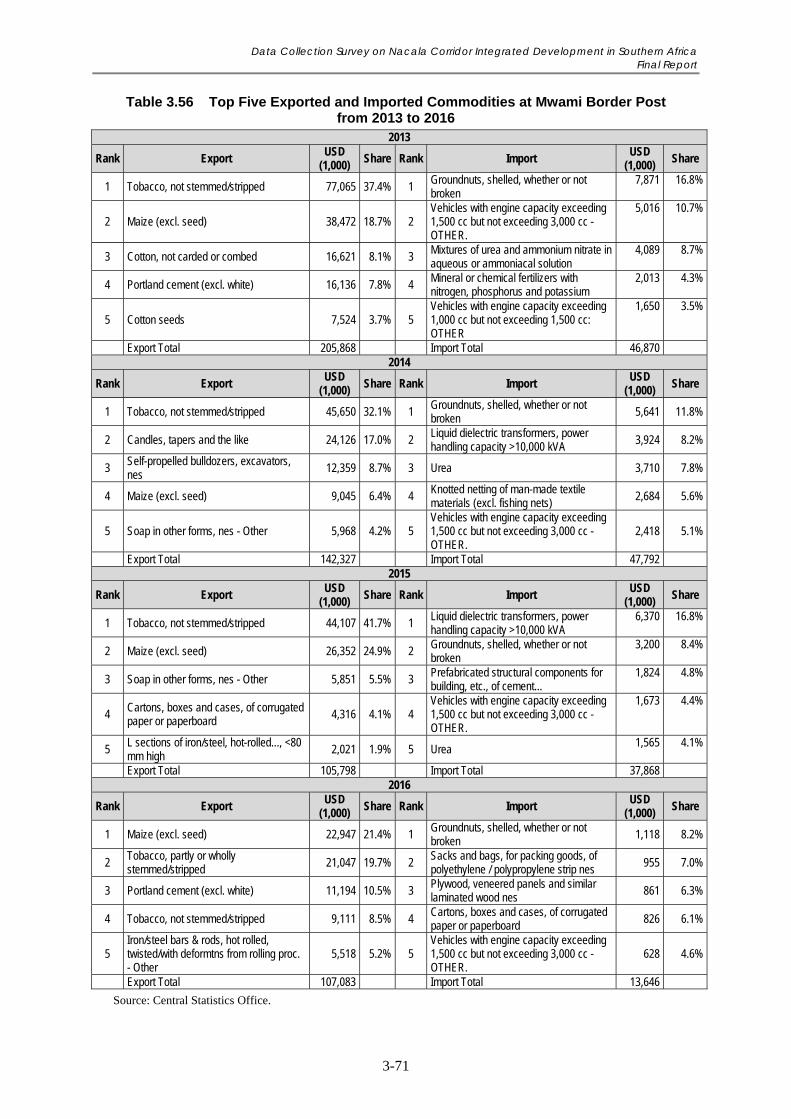
Data Collection Survey on Nacala Corridor Integrated Development in Southern Africa Final Report
3-71
Table 3.56 Top Five Exported and Imported Commodities at Mwami Border Post from 2013 to 2016
2013
Rank Export USD
(1,000) Share Rank Import
USD (1,000)
Share
1 Tobacco, not stemmed/stripped 77,065 37.4% 1 Groundnuts, shelled, whether or not broken
7,871 16.8%
2 Maize (excl. seed) 38,472 18.7% 2 Vehicles with engine capacity exceeding 1,500 cc but not exceeding 3,000 cc - OTHER.
5,016 10.7%
3 Cotton, not carded or combed 16,621 8.1% 3 Mixtures of urea and ammonium nitrate in aqueous or ammoniacal solution
4,089 8.7%
4 Portland cement (excl. white) 16,136 7.8% 4 Mineral or chemical fertilizers with nitrogen, phosphorus and potassium
2,013 4.3%
5 Cotton seeds 7,524 3.7% 5 Vehicles with engine capacity exceeding 1,000 cc but not exceeding 1,500 cc: OTHER
1,650 3.5%
Export Total 205,868 Import Total 46,870 2014
Rank Export USD
(1,000) Share Rank Import
USD (1,000)
Share
1 Tobacco, not stemmed/stripped 45,650 32.1% 1 Groundnuts, shelled, whether or not broken 5,641 11.8%
2 Candles, tapers and the like 24,126 17.0% 2 Liquid dielectric transformers, power handling capacity >10,000 kVA 3,924 8.2%
3 Self-propelled bulldozers, excavators, nes 12,359 8.7% 3 Urea 3,710 7.8%
4 Maize (excl. seed) 9,045 6.4% 4 Knotted netting of man-made textile materials (excl. fishing nets) 2,684 5.6%
5 Soap in other forms, nes - Other 5,968 4.2% 5 Vehicles with engine capacity exceeding 1,500 cc but not exceeding 3,000 cc - OTHER.
2,418 5.1%
Export Total 142,327 Import Total 47,792 2015
Rank Export USD
(1,000) Share Rank Import
USD (1,000)
Share
1 Tobacco, not stemmed/stripped 44,107 41.7% 1 Liquid dielectric transformers, power handling capacity >10,000 kVA
6,370 16.8%
2 Maize (excl. seed) 26,352 24.9% 2 Groundnuts, shelled, whether or not broken
3,200 8.4%
3 Soap in other forms, nes - Other 5,851 5.5% 3 Prefabricated structural components for building, etc., of cement...
1,824 4.8%
4 Cartons, boxes and cases, of corrugated paper or paperboard
4,316 4.1% 4 Vehicles with engine capacity exceeding 1,500 cc but not exceeding 3,000 cc - OTHER.
1,673 4.4%
5 L sections of iron/steel, hot-rolled..., <80 mm high
2,021 1.9% 5 Urea 1,565 4.1%
Export Total 105,798 Import Total 37,868 2016
Rank Export USD
(1,000) Share Rank Import
USD (1,000)
Share
1 Maize (excl. seed) 22,947 21.4% 1 Groundnuts, shelled, whether or not broken 1,118 8.2%
2 Tobacco, partly or wholly stemmed/stripped 21,047 19.7% 2 Sacks and bags, for packing goods, of
polyethylene / polypropylene strip nes 955 7.0%
3 Portland cement (excl. white) 11,194 10.5% 3 Plywood, veneered panels and similar laminated wood nes 861 6.3%
4 Tobacco, not stemmed/stripped 9,111 8.5% 4 Cartons, boxes and cases, of corrugated paper or paperboard
826 6.1%
5 Iron/steel bars & rods, hot rolled, twisted/with deformtns from rolling proc. - Other
5,518 5.2% 5 Vehicles with engine capacity exceeding 1,500 cc but not exceeding 3,000 cc - OTHER.
628 4.6%
Export Total 107,083 Import Total 13,646
Source: Central Statistics Office.
Data Collection Survey on Nacala Corridor Integrated Development in Southern Africa Final Report
3-72
3.4.4 Development Potential and Challenges of the Trade Sector in the Nacala Corridor Region
A long-standing development issue of the trade sector in Zambia is diversification of the
export commodities. The expansion of non-traditional export of agricultural and mining
commodities and tourism is strongly needed for economic diversification. The 7NDP
identified eight constraints to economic diversification, including inadequate infrastructure,
cost and limited availability of the long-term finance, inadequate water resource and supply,
lower labour productivity, limited access to land, inadequate skills and innovation, high cost of
transportation, and insufficient market information system and economy wide coordination.
To address these constraints, while the 7NDP suggests three strategies for trade promotion
relevant to this study namely:
1) Improvement of trade facilitation: transport infrastructure development, corridor
development, border management, and OSBP establishment;
2) Improvement of logistics management: intercountry trade centre and dry port
development; and
3) International cooperation: COMESA, EAC-SADC Tripartite Framework
implementation etc.
The development of the Nacala Corridor Region with the Nacala Corridor is in line with this
newly published plan. Eastern Province has a great development potential of agriculture and
the mining sector. With the development of the Nacala Corridor, therefore, the expansion of
exports of cereals such as maize and non-traditional mining products such as precious and
non-precious stones can be expected, although the current exported values are less than 3% of
the total. In particular, maize and tobacco are two major commodities exported through
Mwami Border Post to Malawi. The improvement of the Nacala Corridor, including OSBP
and extension of the railway from Chipata can contribute to increase of the export of these
commodities to Malawi.
In the neighbouring countries of Zambia, the integrated region trade with Malawi and
Mozambique is less active, compared with DRC and Zimbabwe. The development of the
Nacala Corridor connecting Zambia with Malawi and Mozambique can increase a trade
opportunity with these two countries, especially with Mozambique.
Nevertheless, the trade on the Nacala Corridor is not expanding as discussed. This is because
the Corridor is primarily used for the trade with Malawi where the market is not large. Thus, it
is crucial to promote international trade through the Nacala Corridor, in addition to the
intra-region trade with the neighbouring countries. Moreover, the cost reduction of the
transport of the fuel, the largest value of the imported commodity by the use of the railway of
the Nacala Corridor can contribute to the reduction of the trade deficit.
Thus, a strategy to expand international trade, both export and import on the Nacala Corridor
is required for Zambia’s trade sector. The rehabilitation and upgrading of the railway of the
Malawi section is a necessary component to support the promotion of international trade
between Zambia and Malawi and Mozambique.
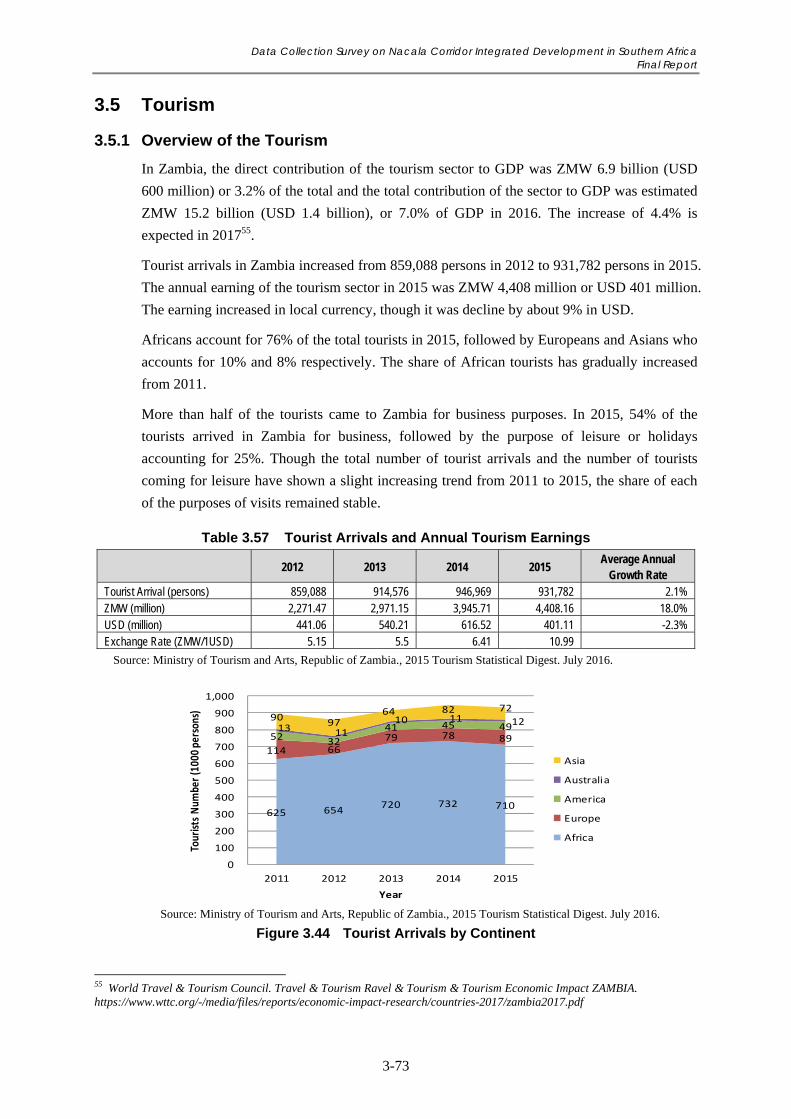
Data Collection Survey on Nacala Corridor Integrated Development in Southern Africa Final Report
3-73
3.5 Tourism
3.5.1 Overview of the Tourism
In Zambia, the direct contribution of the tourism sector to GDP was ZMW 6.9 billion (USD
600 million) or 3.2% of the total and the total contribution of the sector to GDP was estimated
ZMW 15.2 billion (USD 1.4 billion), or 7.0% of GDP in 2016. The increase of 4.4% is
expected in 201755.
Tourist arrivals in Zambia increased from 859,088 persons in 2012 to 931,782 persons in 2015.
The annual earning of the tourism sector in 2015 was ZMW 4,408 million or USD 401 million.
The earning increased in local currency, though it was decline by about 9% in USD.
Africans account for 76% of the total tourists in 2015, followed by Europeans and Asians who
accounts for 10% and 8% respectively. The share of African tourists has gradually increased
from 2011.
More than half of the tourists came to Zambia for business purposes. In 2015, 54% of the
tourists arrived in Zambia for business, followed by the purpose of leisure or holidays
accounting for 25%. Though the total number of tourist arrivals and the number of tourists
coming for leisure have shown a slight increasing trend from 2011 to 2015, the share of each
of the purposes of visits remained stable.
Table 3.57 Tourist Arrivals and Annual Tourism Earnings
2012 2013 2014 2015 Average Annual
Growth Rate Tourist Arrival (persons) 859,088 914,576 946,969 931,782 2.1% ZMW (million) 2,271.47 2,971.15 3,945.71 4,408.16 18.0% USD (million) 441.06 540.21 616.52 401.11 -2.3% Exchange Rate (ZMW/1USD) 5.15 5.5 6.41 10.99
Source: Ministry of Tourism and Arts, Republic of Zambia., 2015 Tourism Statistical Digest. July 2016.
Source: Ministry of Tourism and Arts, Republic of Zambia., 2015 Tourism Statistical Digest. July 2016.
Figure 3.44 Tourist Arrivals by Continent
55 World Travel & Tourism Council. Travel & Tourism Ravel & Tourism & Tourism Economic Impact ZAMBIA. https://www.wttc.org/-/media/files/reports/economic-impact-research/countries-2017/zambia2017.pdf
625 654 720 732 710
52 32
41 45 49 13 11 10 11 12 90
97 64 82 72
114 66 79 78 89
0
100
200
300
400
500
600
700
800
900
1,000
2011 2012 2013 2014 2015
Tourists Num
ber (100
0 pe
rson
s)
Year
Asia
Australia
America
Europe
Africa
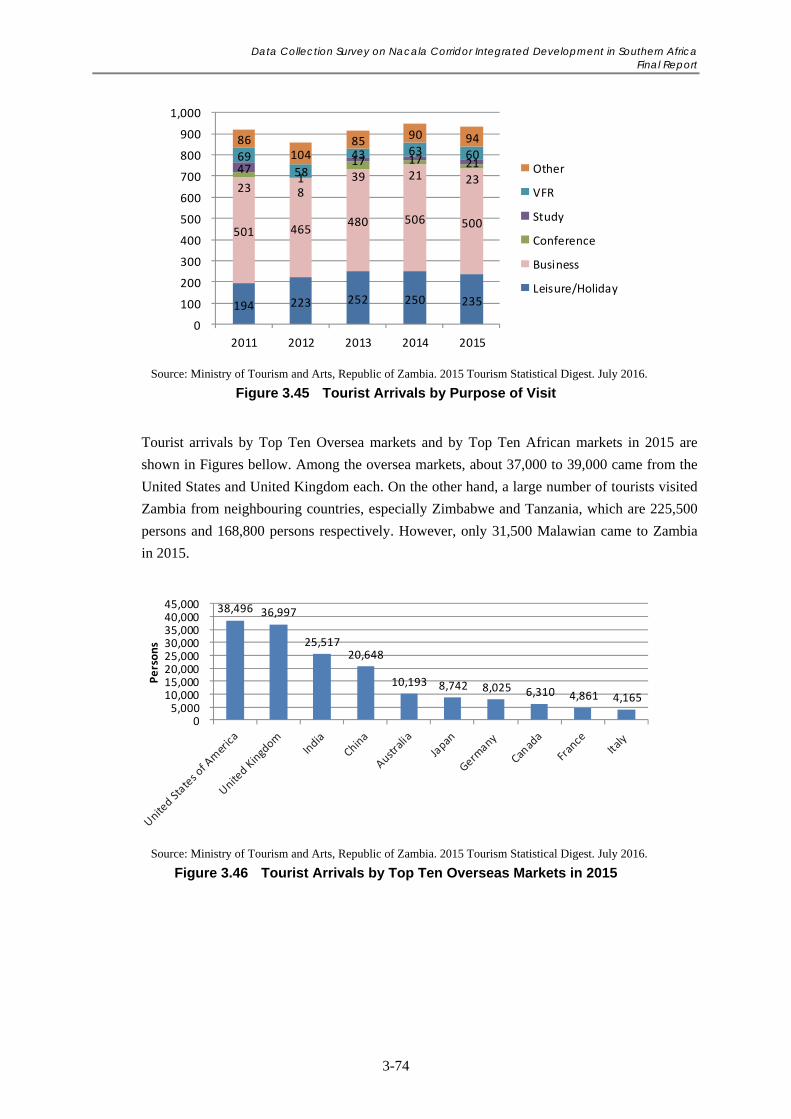
Data Collection Survey on Nacala Corridor Integrated Development in Southern Africa Final Report
3-74
Source: Ministry of Tourism and Arts, Republic of Zambia. 2015 Tourism Statistical Digest. July 2016.
Figure 3.45 Tourist Arrivals by Purpose of Visit
Tourist arrivals by Top Ten Oversea markets and by Top Ten African markets in 2015 are
shown in Figures bellow. Among the oversea markets, about 37,000 to 39,000 came from the
United States and United Kingdom each. On the other hand, a large number of tourists visited
Zambia from neighbouring countries, especially Zimbabwe and Tanzania, which are 225,500
persons and 168,800 persons respectively. However, only 31,500 Malawian came to Zambia
in 2015.
Source: Ministry of Tourism and Arts, Republic of Zambia. 2015 Tourism Statistical Digest. July 2016.
Figure 3.46 Tourist Arrivals by Top Ten Overseas Markets in 2015
194 223 252 250 235
501 465 480 506 500
23 8 39 21 23
47 1
17 17 21 69
58
43 63 60 86
104 85 90 94
0
100
200
300
400
500
600
700
800
900
1,000
2011 2012 2013 2014 2015
Other
VFR
Study
Conference
Business
Leisure/Holiday
38,496 36,997
25,517 20,648
10,193 8,742 8,025 6,310 4,861 4,165
05,000
10,00015,00020,00025,00030,00035,00040,00045,000
Persons
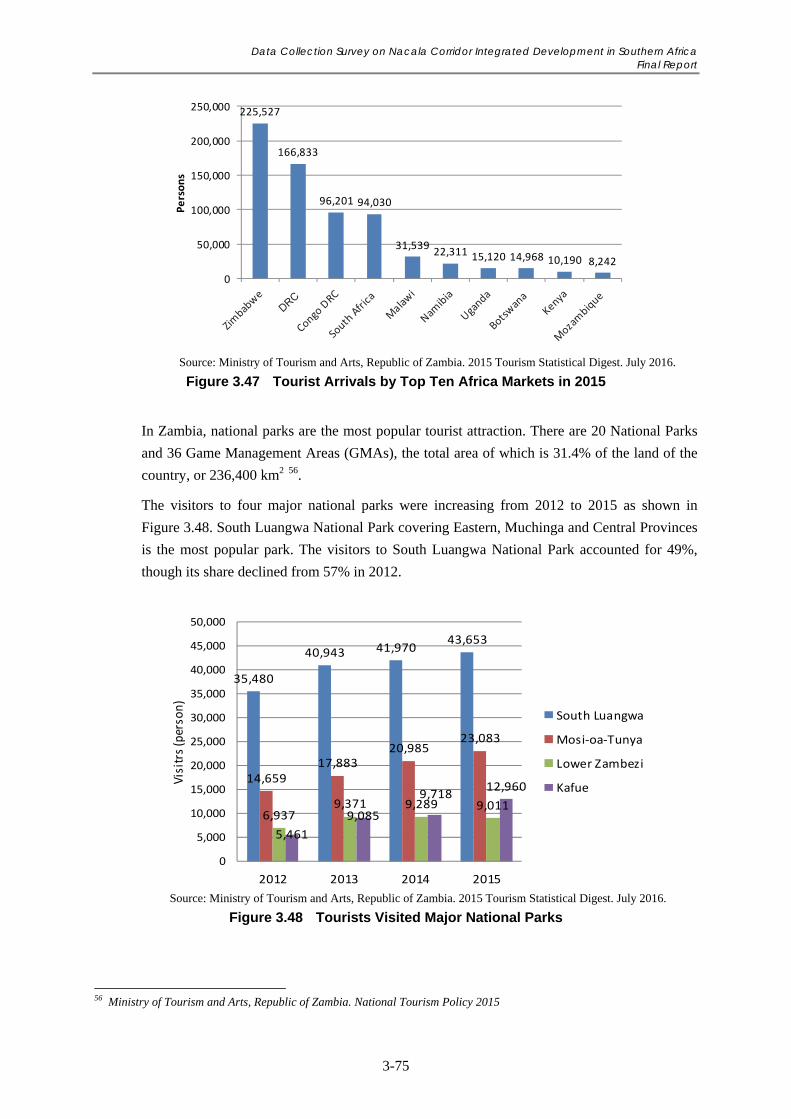
Data Collection Survey on Nacala Corridor Integrated Development in Southern Africa Final Report
3-75
Source: Ministry of Tourism and Arts, Republic of Zambia. 2015 Tourism Statistical Digest. July 2016.
Figure 3.47 Tourist Arrivals by Top Ten Africa Markets in 2015
In Zambia, national parks are the most popular tourist attraction. There are 20 National Parks
and 36 Game Management Areas (GMAs), the total area of which is 31.4% of the land of the
country, or 236,400 km2 56.
The visitors to four major national parks were increasing from 2012 to 2015 as shown in
Figure 3.48. South Luangwa National Park covering Eastern, Muchinga and Central Provinces
is the most popular park. The visitors to South Luangwa National Park accounted for 49%,
though its share declined from 57% in 2012.
Source: Ministry of Tourism and Arts, Republic of Zambia. 2015 Tourism Statistical Digest. July 2016.
Figure 3.48 Tourists Visited Major National Parks
56 Ministry of Tourism and Arts, Republic of Zambia. National Tourism Policy 2015
225,527
166,833
96,201 94,030
31,53922,311 15,120 14,968 10,190 8,242
0
50,000
100,000
150,000
200,000
250,000
Persons
35,480
40,943 41,97043,653
14,65917,883
20,98523,083
6,9379,371 9,289 9,011
5,461
9,085
9,71812,960
0
5,000
10,000
15,000
20,000
25,000
30,000
35,000
40,000
45,000
50,000
2012 2013 2014 2015
Visitrs (person)
South Luangwa
Mosi‐oa‐Tunya
Lower Zambezi
Kafue
Data Collection Survey on Nacala Corridor Integrated Development in Southern Africa Final Report
3-76
3.5.2 Tourism Sector of the Nacala Corridor Region
Tourism, including arts and culture, is the second major economic activity (next to
agriculture/agribusiness sector) in Eastern Province. Tourism is a major contributor to
socioeconomic development in the province as it is an important source of jobs, and
generation in both the private and public sectors. The main tourism activities in the province
include hotel and lodge accommodation, game viewing, safari walking, game hunting and
cultural ceremonies.
Eastern Province has three National Wildlife Parks–South Luangwa (9,050 km2), Lukusuzi
(2,720 km2) and Luambe (254 km2), and four Game Management Areas (GMAs)–Lupande
(4,840 km2), Lumimba (4,500 km2), West Petauke (4,140 km2) and Sandwe (1,530 km2)–
which act as buffer zones to the National Wildlife Parks, allowing for free movement of
animals between the Parks and GMAs. The National Wildlife Parks and GMAs in the
province have the largest variety of animals and bird life in Africa. Although most of the
South Luangwa National Wildlife Park lies outside Eastern Province, its management and
the only public road access is from the province.
In the country, Naconde, on the border with Tanzania, and Kenneth Kaunda International
Airport in Lusaka are the two busiest ports to receive tourists in 2015. Among 932,000 tourist
arrivals in 2015, about 20% entered the country through each of the two ports, followed by
Chirundu, on the border with Zimbabwe where 15% of the tourists arrived.
There are three ports of entry in Eastern Province, namely Chanida, the border with
Mozambique, Mfuwe International Airport at South Luangwa National Park, and Mwami, the
border with Malawi on the Nacala Corridor. The number of tourists who entered Zambia
through the Mwami border in 2015 was 30,063 tourists and the largest visitors at the border,
45,370 tourists recorded in 2013 during the last five years.
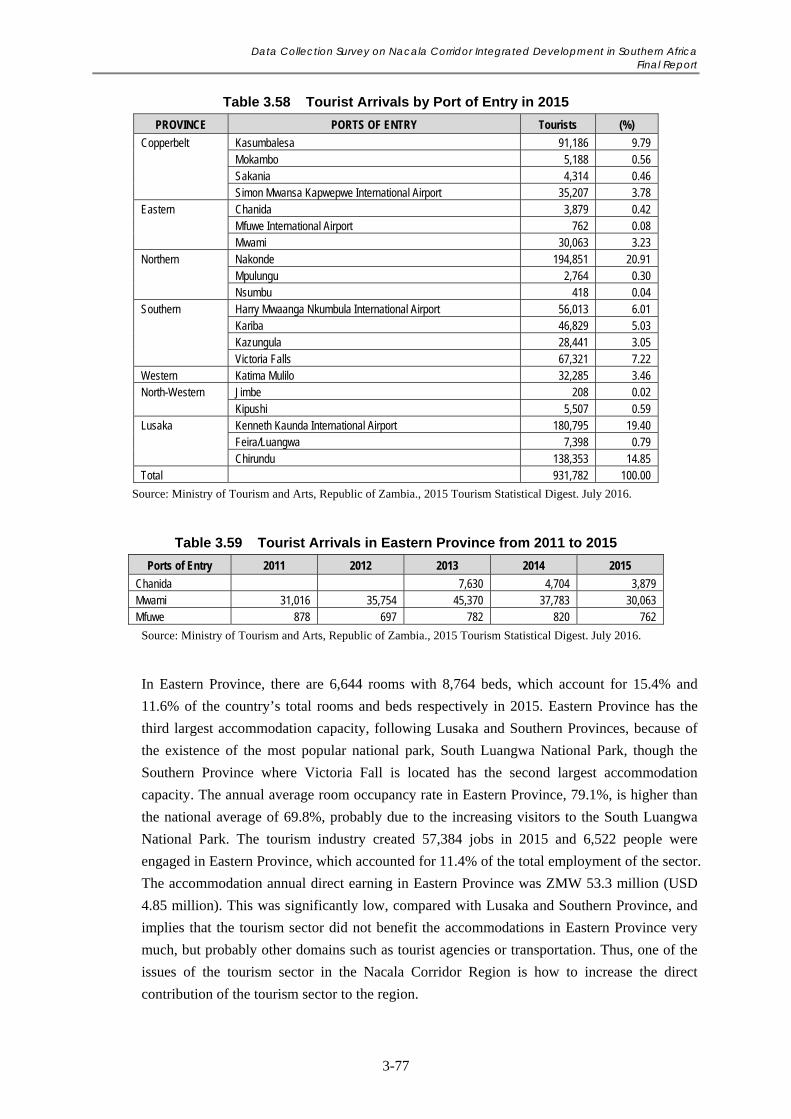
Data Collection Survey on Nacala Corridor Integrated Development in Southern Africa Final Report
3-77
Table 3.58 Tourist Arrivals by Port of Entry in 2015
PROVINCE PORTS OF ENTRY Tourists (%)
Copperbelt Kasumbalesa 91,186 9.79 Mokambo 5,188 0.56 Sakania 4,314 0.46 Simon Mwansa Kapwepwe International Airport 35,207 3.78
Eastern Chanida 3,879 0.42 Mfuwe International Airport 762 0.08 Mwami 30,063 3.23
Northern Nakonde 194,851 20.91 Mpulungu 2,764 0.30 Nsumbu 418 0.04
Southern Harry Mwaanga Nkumbula International Airport 56,013 6.01 Kariba 46,829 5.03 Kazungula 28,441 3.05 Victoria Falls 67,321 7.22
Western Katima Mulilo 32,285 3.46 North-Western Jimbe 208 0.02
Kipushi 5,507 0.59 Lusaka Kenneth Kaunda International Airport 180,795 19.40
Feira/Luangwa 7,398 0.79 Chirundu 138,353 14.85
Total 931,782 100.00
Source: Ministry of Tourism and Arts, Republic of Zambia., 2015 Tourism Statistical Digest. July 2016.
Table 3.59 Tourist Arrivals in Eastern Province from 2011 to 2015
Ports of Entry 2011 2012 2013 2014 2015
Chanida 7,630 4,704 3,879 Mwami 31,016 35,754 45,370 37,783 30,063 Mfuwe 878 697 782 820 762
Source: Ministry of Tourism and Arts, Republic of Zambia., 2015 Tourism Statistical Digest. July 2016.
In Eastern Province, there are 6,644 rooms with 8,764 beds, which account for 15.4% and
11.6% of the country’s total rooms and beds respectively in 2015. Eastern Province has the
third largest accommodation capacity, following Lusaka and Southern Provinces, because of
the existence of the most popular national park, South Luangwa National Park, though the
Southern Province where Victoria Fall is located has the second largest accommodation
capacity. The annual average room occupancy rate in Eastern Province, 79.1%, is higher than
the national average of 69.8%, probably due to the increasing visitors to the South Luangwa
National Park. The tourism industry created 57,384 jobs in 2015 and 6,522 people were
engaged in Eastern Province, which accounted for 11.4% of the total employment of the sector.
The accommodation annual direct earning in Eastern Province was ZMW 53.3 million (USD
4.85 million). This was significantly low, compared with Lusaka and Southern Province, and
implies that the tourism sector did not benefit the accommodations in Eastern Province very
much, but probably other domains such as tourist agencies or transportation. Thus, one of the
issues of the tourism sector in the Nacala Corridor Region is how to increase the direct
contribution of the tourism sector to the region.
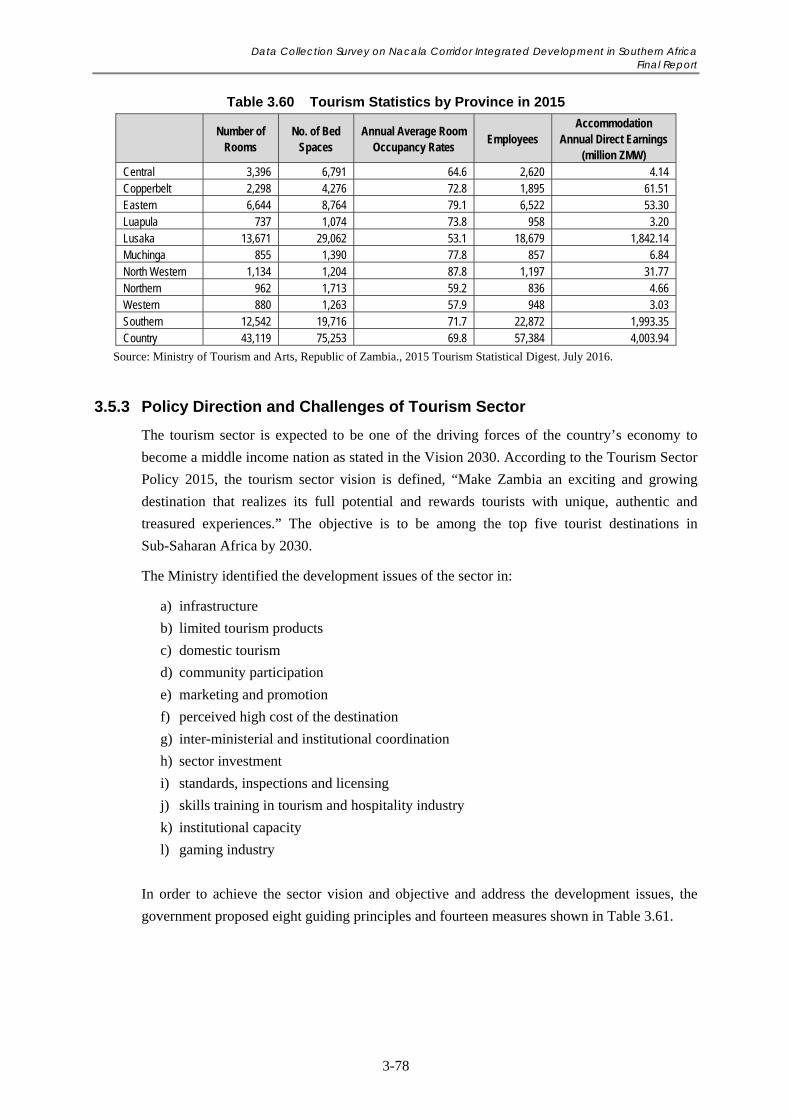
Data Collection Survey on Nacala Corridor Integrated Development in Southern Africa Final Report
3-78
Table 3.60 Tourism Statistics by Province in 2015
Number of
Rooms No. of Bed
Spaces Annual Average Room
Occupancy Rates Employees
Accommodation Annual Direct Earnings
(million ZMW) Central 3,396 6,791 64.6 2,620 4.14 Copperbelt 2,298 4,276 72.8 1,895 61.51 Eastern 6,644 8,764 79.1 6,522 53.30 Luapula 737 1,074 73.8 958 3.20 Lusaka 13,671 29,062 53.1 18,679 1,842.14 Muchinga 855 1,390 77.8 857 6.84 North Western 1,134 1,204 87.8 1,197 31.77 Northern 962 1,713 59.2 836 4.66 Western 880 1,263 57.9 948 3.03 Southern 12,542 19,716 71.7 22,872 1,993.35 Country 43,119 75,253 69.8 57,384 4,003.94
Source: Ministry of Tourism and Arts, Republic of Zambia., 2015 Tourism Statistical Digest. July 2016.
3.5.3 Policy Direction and Challenges of Tourism Sector
The tourism sector is expected to be one of the driving forces of the country’s economy to
become a middle income nation as stated in the Vision 2030. According to the Tourism Sector
Policy 2015, the tourism sector vision is defined, “Make Zambia an exciting and growing
destination that realizes its full potential and rewards tourists with unique, authentic and
treasured experiences.” The objective is to be among the top five tourist destinations in
Sub-Saharan Africa by 2030.
The Ministry identified the development issues of the sector in:
a) infrastructure
b) limited tourism products
c) domestic tourism
d) community participation
e) marketing and promotion
f) perceived high cost of the destination
g) inter-ministerial and institutional coordination
h) sector investment
i) standards, inspections and licensing
j) skills training in tourism and hospitality industry
k) institutional capacity
l) gaming industry
In order to achieve the sector vision and objective and address the development issues, the
government proposed eight guiding principles and fourteen measures shown in Table 3.61.
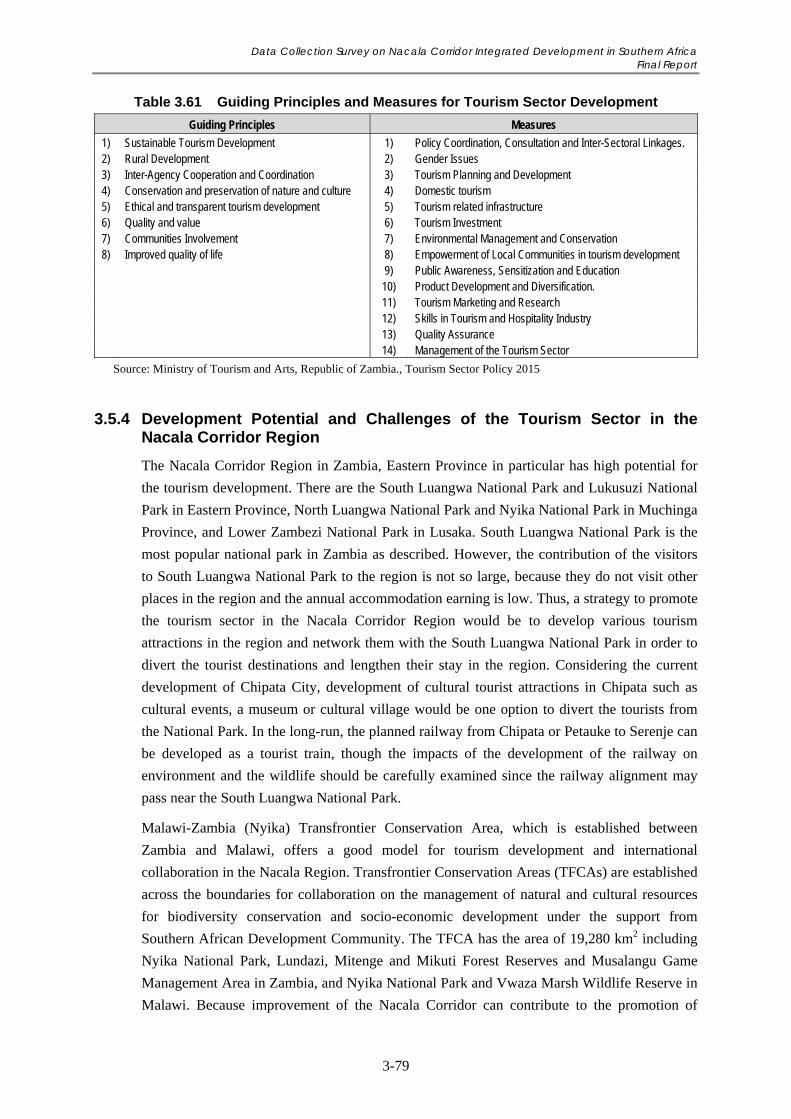
Data Collection Survey on Nacala Corridor Integrated Development in Southern Africa Final Report
3-79
Table 3.61 Guiding Principles and Measures for Tourism Sector Development
Guiding Principles Measures
1) Sustainable Tourism Development 1) Policy Coordination, Consultation and Inter-Sectoral Linkages. 2) Rural Development 2) Gender Issues 3) Inter-Agency Cooperation and Coordination 3) Tourism Planning and Development 4) Conservation and preservation of nature and culture 4) Domestic tourism 5) Ethical and transparent tourism development 5) Tourism related infrastructure 6) Quality and value 6) Tourism Investment 7) Communities Involvement 7) Environmental Management and Conservation 8) Improved quality of life 8) Empowerment of Local Communities in tourism development 9) Public Awareness, Sensitization and Education 10) Product Development and Diversification. 11) Tourism Marketing and Research 12) Skills in Tourism and Hospitality Industry 13) Quality Assurance 14) Management of the Tourism Sector
Source: Ministry of Tourism and Arts, Republic of Zambia., Tourism Sector Policy 2015
3.5.4 Development Potential and Challenges of the Tourism Sector in the Nacala Corridor Region
The Nacala Corridor Region in Zambia, Eastern Province in particular has high potential for
the tourism development. There are the South Luangwa National Park and Lukusuzi National
Park in Eastern Province, North Luangwa National Park and Nyika National Park in Muchinga
Province, and Lower Zambezi National Park in Lusaka. South Luangwa National Park is the
most popular national park in Zambia as described. However, the contribution of the visitors
to South Luangwa National Park to the region is not so large, because they do not visit other
places in the region and the annual accommodation earning is low. Thus, a strategy to promote
the tourism sector in the Nacala Corridor Region would be to develop various tourism
attractions in the region and network them with the South Luangwa National Park in order to
divert the tourist destinations and lengthen their stay in the region. Considering the current
development of Chipata City, development of cultural tourist attractions in Chipata such as
cultural events, a museum or cultural village would be one option to divert the tourists from
the National Park. In the long-run, the planned railway from Chipata or Petauke to Serenje can
be developed as a tourist train, though the impacts of the development of the railway on
environment and the wildlife should be carefully examined since the railway alignment may
pass near the South Luangwa National Park.
Malawi-Zambia (Nyika) Transfrontier Conservation Area, which is established between
Zambia and Malawi, offers a good model for tourism development and international
collaboration in the Nacala Region. Transfrontier Conservation Areas (TFCAs) are established
across the boundaries for collaboration on the management of natural and cultural resources
for biodiversity conservation and socio-economic development under the support from
Southern African Development Community. The TFCA has the area of 19,280 km2 including
Nyika National Park, Lundazi, Mitenge and Mikuti Forest Reserves and Musalangu Game
Management Area in Zambia, and Nyika National Park and Vwaza Marsh Wildlife Reserve in
Malawi. Because improvement of the Nacala Corridor can contribute to the promotion of
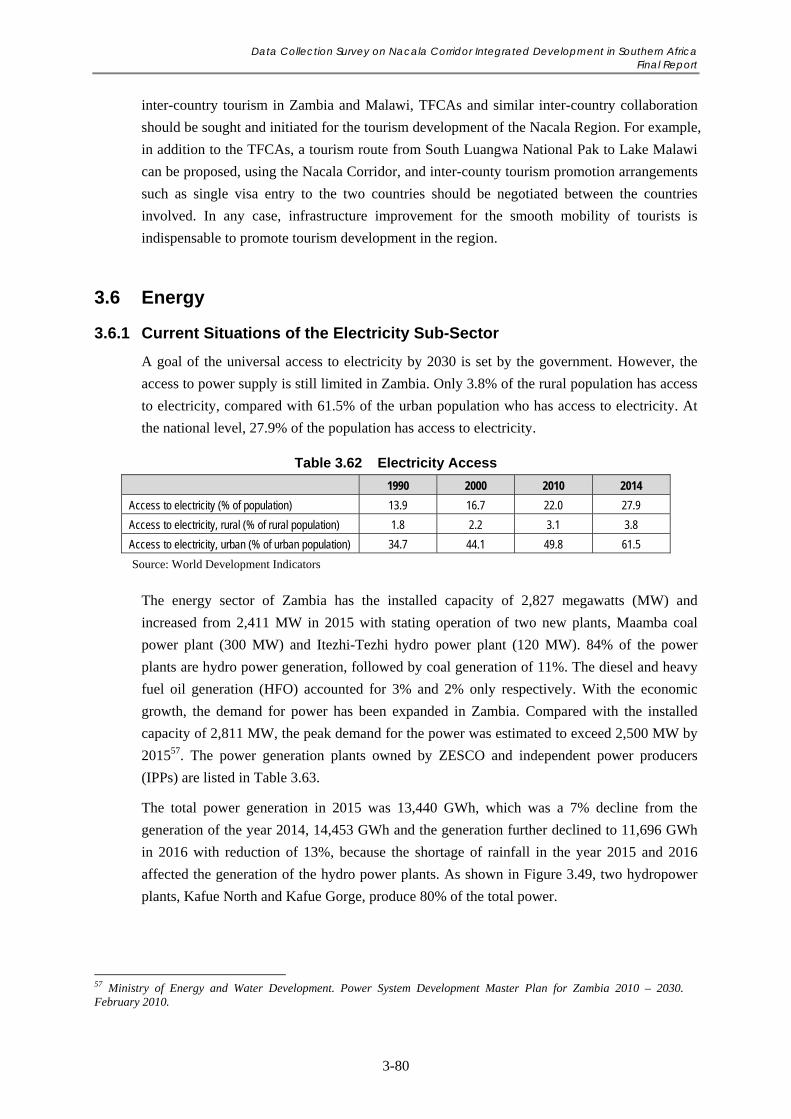
Data Collection Survey on Nacala Corridor Integrated Development in Southern Africa Final Report
3-80
inter-country tourism in Zambia and Malawi, TFCAs and similar inter-country collaboration
should be sought and initiated for the tourism development of the Nacala Region. For example,
in addition to the TFCAs, a tourism route from South Luangwa National Pak to Lake Malawi
can be proposed, using the Nacala Corridor, and inter-county tourism promotion arrangements
such as single visa entry to the two countries should be negotiated between the countries
involved. In any case, infrastructure improvement for the smooth mobility of tourists is
indispensable to promote tourism development in the region.
3.6 Energy
3.6.1 Current Situations of the Electricity Sub-Sector
A goal of the universal access to electricity by 2030 is set by the government. However, the
access to power supply is still limited in Zambia. Only 3.8% of the rural population has access
to electricity, compared with 61.5% of the urban population who has access to electricity. At
the national level, 27.9% of the population has access to electricity.
Table 3.62 Electricity Access
1990 2000 2010 2014
Access to electricity (% of population) 13.9 16.7 22.0 27.9
Access to electricity, rural (% of rural population) 1.8 2.2 3.1 3.8
Access to electricity, urban (% of urban population) 34.7 44.1 49.8 61.5
Source: World Development Indicators
The energy sector of Zambia has the installed capacity of 2,827 megawatts (MW) and
increased from 2,411 MW in 2015 with stating operation of two new plants, Maamba coal
power plant (300 MW) and Itezhi-Tezhi hydro power plant (120 MW). 84% of the power
plants are hydro power generation, followed by coal generation of 11%. The diesel and heavy
fuel oil generation (HFO) accounted for 3% and 2% only respectively. With the economic
growth, the demand for power has been expanded in Zambia. Compared with the installed
capacity of 2,811 MW, the peak demand for the power was estimated to exceed 2,500 MW by
201557. The power generation plants owned by ZESCO and independent power producers
(IPPs) are listed in Table 3.63.
The total power generation in 2015 was 13,440 GWh, which was a 7% decline from the
generation of the year 2014, 14,453 GWh and the generation further declined to 11,696 GWh
in 2016 with reduction of 13%, because the shortage of rainfall in the year 2015 and 2016
affected the generation of the hydro power plants. As shown in Figure 3.49, two hydropower
plants, Kafue North and Kafue Gorge, produce 80% of the total power.
57 Ministry of Energy and Water Development. Power System Development Master Plan for Zambia 2010 – 2030. February 2010.
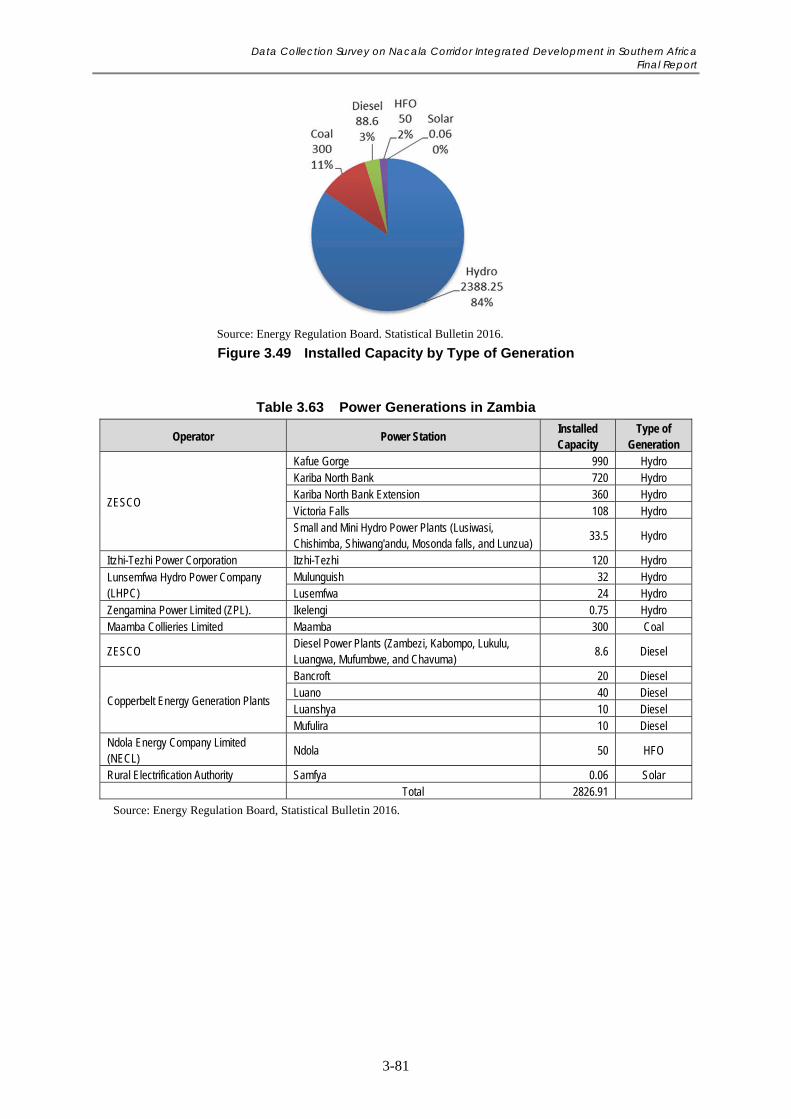
Data Collection Survey on Nacala Corridor Integrated Development in Southern Africa Final Report
3-81
Source: Energy Regulation Board. Statistical Bulletin 2016.
Figure 3.49 Installed Capacity by Type of Generation
Table 3.63 Power Generations in Zambia
Operator Power Station Installed Capacity
Type of Generation
ZESCO
Kafue Gorge 990 Hydro Kariba North Bank 720 Hydro Kariba North Bank Extension 360 Hydro Victoria Falls 108 Hydro Small and Mini Hydro Power Plants (Lusiwasi, Chishimba, Shiwang'andu, Mosonda falls, and Lunzua)
33.5 Hydro
Itzhi-Tezhi Power Corporation Itzhi-Tezhi 120 Hydro Lunsemfwa Hydro Power Company (LHPC)
Mulunguish 32 Hydro Lusemfwa 24 Hydro
Zengamina Power Limited (ZPL). Ikelengi 0.75 Hydro Maamba Collieries Limited Maamba 300 Coal
ZESCO Diesel Power Plants (Zambezi, Kabompo, Lukulu, Luangwa, Mufumbwe, and Chavuma)
8.6 Diesel
Copperbelt Energy Generation Plants
Bancroft 20 Diesel Luano 40 Diesel Luanshya 10 Diesel Mufulira 10 Diesel
Ndola Energy Company Limited (NECL)
Ndola 50 HFO
Rural Electrification Authority Samfya 0.06 Solar Total 2826.91
Source: Energy Regulation Board, Statistical Bulletin 2016.
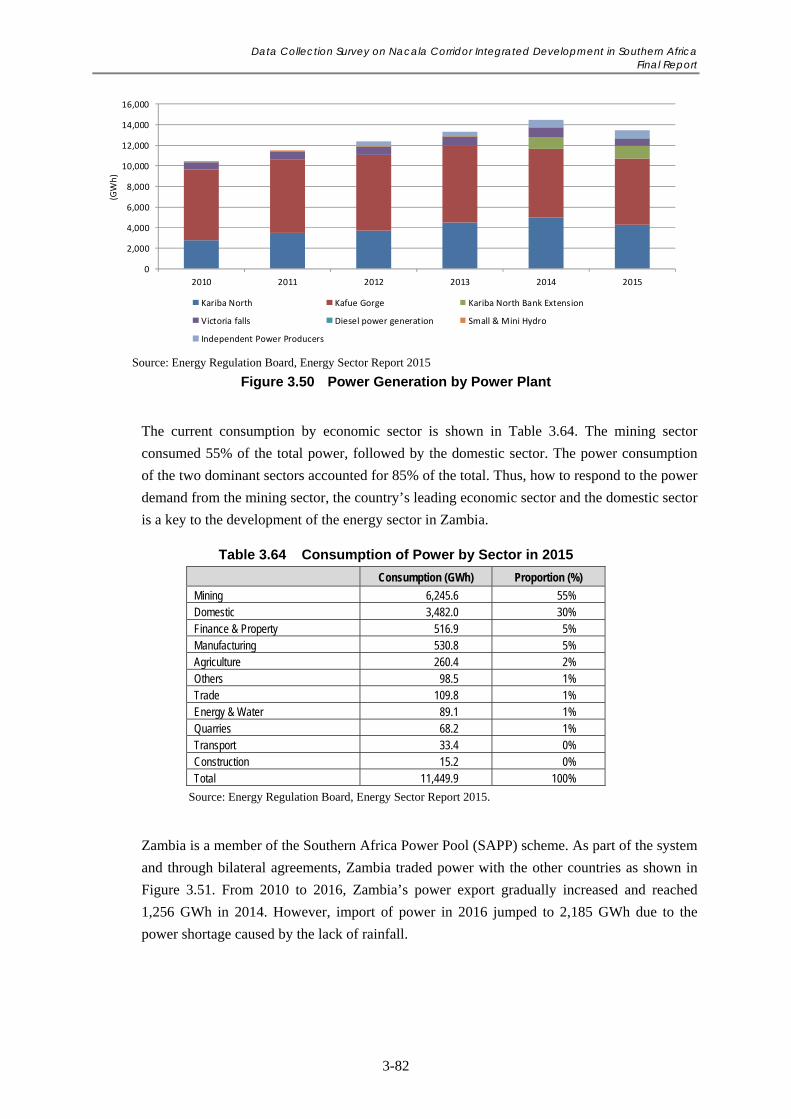
Data Collection Survey on Nacala Corridor Integrated Development in Southern Africa Final Report
3-82
Source: Energy Regulation Board, Energy Sector Report 2015
Figure 3.50 Power Generation by Power Plant
The current consumption by economic sector is shown in Table 3.64. The mining sector
consumed 55% of the total power, followed by the domestic sector. The power consumption
of the two dominant sectors accounted for 85% of the total. Thus, how to respond to the power
demand from the mining sector, the country’s leading economic sector and the domestic sector
is a key to the development of the energy sector in Zambia.
Table 3.64 Consumption of Power by Sector in 2015
Consumption (GWh) Proportion (%)
Mining 6,245.6 55% Domestic 3,482.0 30% Finance & Property 516.9 5% Manufacturing 530.8 5% Agriculture 260.4 2% Others 98.5 1% Trade 109.8 1% Energy & Water 89.1 1% Quarries 68.2 1% Transport 33.4 0% Construction 15.2 0% Total 11,449.9 100%
Source: Energy Regulation Board, Energy Sector Report 2015.
Zambia is a member of the Southern Africa Power Pool (SAPP) scheme. As part of the system
and through bilateral agreements, Zambia traded power with the other countries as shown in
Figure 3.51. From 2010 to 2016, Zambia’s power export gradually increased and reached
1,256 GWh in 2014. However, import of power in 2016 jumped to 2,185 GWh due to the
power shortage caused by the lack of rainfall.
0
2,000
4,000
6,000
8,000
10,000
12,000
14,000
16,000
2010 2011 2012 2013 2014 2015
(GWh)
Kariba North Kafue Gorge Kariba North Bank Extension
Victoria falls Diesel power generation Small & Mini Hydro
Independent Power Producers
Data Collection Survey on Nacala Corridor Integrated Development in Southern Africa Final Report
3-83
Source: Energy Regulation Board, Energy Sector Report 2015 and Statistical Bulletin 2016.
Figure 3.51 Power Import and Export
3.6.2 Current Situations of the Petroleum Sub-Sector
The Zambia imports petroleum through Tanzania-Zambia Mafuta (TAZAMA) Pipelines
Limited, the share of which was jointly owned by the governments of Zambia and Tanzania.
TAZAM has 1,705 kilometre long pipelines to transport petroleum feedstock from Dar es
Salaam to Ndola, Zambia, which is processed by INDENI Refinery. The processed various
petroleum products are distributed to the Ndola Fuel Terminal and Government storage depots
and then to Oil Marketing Companies (OMCs)58.
The petroleum that Zambia imports is divided into two categories: feedstock and refined
petroleum. Refined petroleum such as refined petroleum and diesel is transported by road. As
Figure 3.52 shows, the government import of feedstock exhibits a decreasing trend. The
amount of the import of feedstock dropped to 483,887 tonnes in 2016. On the other hand, the
import of finished products from 2011 to 2016, steadily increased, though with slight
fluctuations. The import of diesel became more than doubled to 415,796 m3 from 2010, while
the import of refined petroleum was 259,905 m3 in 2016. The enactment of S.I. No 21 of 2016
which permits the import of diesel by authorized OMCs resulted in the reduction of the import
of diesel by the government in 2016.
The largest amount of petroleum product refined by INDENI in 2016 was diesel of 261,829
tonnes, followed by petrol 95,285 tonnes and kerosene of 15,737 tonnes. INDENI production
and the imported refined petroleum account for 50% each of the total petrol and diesel of the
country. The international oil prices and the exchange rate of the Zambian Kwacha to USD are
two key factors to determine the prices of the petroleum products59.
58 Energy Regulation Board. Statistical Bulletin 2016. http://www.tazama.co.zm/ 59 Ministry of National Development Planning. Seventh National Development Plan 2017-2021
Data Collection Survey on Nacala Corridor Integrated Development in Southern Africa Final Report
3-84
Source: Energy Regulation Board, Energy Sector Report 2015 and Statistical Bulletin 2016.
Figure 3.52 Government Import of Petroleum Feedstock and Finished Products from 2011 to 2016
Source: Energy Regulation Board, Statistical Bulletin 2016.
Figure 3.53 Refinery Production of Petroleum Products in 2016
In 2015, the total national consumption of petroleum products was 1,379,781 tonnes. Diesel
was the most consumed at 818,418 tonnes, followed by petrol at 366,524 tonnes and Heavy
Fuel Oils at 129,149 tonnes. The consumption of these products rapidly increased from 2010
to 2015 due to the economic growth and the increase of vehicles. The least amount consumed
product was LPG at 3,230 tonnes, though the consumption of LPG and Jet-A1 are growing.
Only the consumption of kerosene is remained stable at 18,300 tonnes60.
60 Energy Regulation Board. Energy Sector Report 2015
577,098
642,683606,463
559,916
643,180
483,887
197,442
283,759
429,378389,183
519,948
415,796
71,005 145,374 249,208 264,777 294,876 259,9050
100,000
200,000
300,000
400,000
500,000
600,000
700,000
0
100,000
200,000
300,000
400,000
500,000
600,000
2011 2012 2013 2014 2015 2016
Petroleum Feed Stok (M
T)
Diesel and Petrol (m
3)
Diesel Petrol Petroluem feedstock
95,285
212,638
18,4999,464 4,839
102,133
0
50,000
100,000
150,000
200,000
250,000
PETROL DIESEL KEROSENE JET A1 BUTANE/LPG
HFO
(MT)
Data Collection Survey on Nacala Corridor Integrated Development in Southern Africa Final Report
3-85
Table 3.65 National Fuel Consumption from 2010 to 2015 (metric ton)
M Heavy Fuel
Oils LP Gas Jet-A1 Kerosene
Unleaded Petrol
Diesel Total
2010 46,845 1,848 29,130 17,330 160,982 496,568 752,703 2011 49,461 2,424 32,593 19,898 182,123 577,836 864,335 2012 60,222 658 49,477 14,669 234,224 675,756 1,035,006 2013 50,793 3,021 49,613 12,315 275,604 676,078 1,067,425 2014 116,821 3,680 38,049 13,776 304,562 700,577 1,177,465 2015 129,149 3,230 44,160 18,300 366,524 818,418 1,379,781
Annual Average Growth Rate 2010-2015
22.5% 11.8% 8.7% 1.1% 17.9% 10.5% 12.9%
Source: Energy Regulation Board. Energy Sector Report 2015.
3.6.3 Development Potential and Challenges of the Energy Sector
The primary issue that the energy sector in Zambia is facing is to increase the capacity of
power generation. Despite 6,000 MW potential of the hydropower resources in the country,
the current capacity is only 2,827 MW. The country has uncultivated coal reserves to be
developed. With the expected demand increase of 150 to 200 MW per year, the peak demand
will reach 3,000 MW by 2020. Lack of investment in power plants and transmission due to the
deficient of incentives, with climate change, severely affect the capacity to generate sufficient
power. Moreover, diversification of the energy mix including coal and renewable energy is
strongly required to cope with the impact of the climate change. Meanwhile, in the petroleum
sub-sector, inefficient petroleum supply value chain and fluctuation of the prices of fuel are
identified as major challenges61.
The major projects under implementation and planned to address the development issues and
implement the energy policy are listed in Table 3.66. Among the project, “the Construction of
the Mozambique - Zambia Interconnector, Telecommunications and a Coal Generation Power
Plant” and “the project of a 300 megawatts power plant in Chipata” could significantly
increase the development potential of the Nacala Corridor Region. The Mozambique-Zambia
Power Interconnector Project is currently in the tendering process of a consultant for the
feasibility studies under the SAPP. The F/S will be financed by AfDB through the NEPAD
Infrastructure Project Preparation Facility (NEPAD-IPPF)62.
In the petroleum sub-sector, Zambia has only one pipeline owned by TAZAMA running from
Dar es Salaam, which was constructed in 1968. In addition to the import through TAZAM,
fuel is imported through road. For example, ZESCO imported over 100 tonnes of natural gas
per month in 2015 via Beira Port63. Currently TAZAMA is proposing two projects for pipeline
construction for gas and finished petroleum to meet increasing demands and to secure the
supply of the energy in the country, both of which intend to import fuel from Dar es Salaam.
According to the interview, the Ministry of Energy has a plan to develop a gas pipeline from
61 Ministry of National Development Planning. Seventh National Development Plan 2017-2021 62 Southern African Power Pool Website. http://www.sapp.co.zw/docs/24-04-17_Mozambique-Zambia_Request%20for%20Expression%20of%20Interest_rev.pdf 63 ZESCO imported a total of 148 MW in September, 2015 via Beira Port. http://www.zambiainvest.com/energy/zambia-proposes-natural-gas-pipeline-from-mozambique-to-boost-energy-imports
Data Collection Survey on Nacala Corridor Integrated Development in Southern Africa Final Report
3-86
Tete to Chipata. In terms of energy security from a geographical perspective, it may be
preferable to construct another gas pipeline in the south-east region, which is much shorter
than Dar es Salaam pipeline and close to Lusaka as well. This pipeline is also able to provide
the energy to Malawian market and then benefit the Nacala Corridor Region.
Table 3.66 Major Projects in the Energy Sector
Project Name Description 1 Development of Kafue
Gorge lower hydro power project*1
The Kafue Gorge lower hydro power project will be located in Kafue Gorge, about 65 km upstream of the confluence of the Kafue and Zambezi Rivers and 9 km downstream of the existing 990 MW Kafue Gorge hydropower plant. Once developed, the power plant will have an installed capacity of 750 MW. The project is estimated to cost USD1.94 billion and will be developed under a PPP on a Build, Own, Operate and Transfer (BOOT) basis with ZESCO.
2 Construction of the Mozambique – Zambia Interconnector, Telecommunications and a Coal Generation Power Plant*2
The project is to interconnect ZESCO’s transmission system to that of EdM through a 330 kV or 400kV transmission line from Chipata West substation in Zambia to the existing Songo Substation or the new proposed Cataxa Substation in Mozambique. EdM and ZESCO may establish a partnership to develop suitable new coal power generation up to 1200 MW, utilising the natural resource in the Tete Province for power generation to the domestic and regional markets. The aforesaid interconnections shall make it possible for bilateral power and telecommunications trade between EdM and ZESCO Limited as well as trade with other members of the Southern African Power Pool (SAPP), the East African Power Pool (EAPP) and any other interested entity.
3 Kariba Dam Rehabilitation Project*3
The project includes a series of rehabilitation works for its continued safe operation. The works will include 1. reshaping of the plunge pool to limit scouring and erosion that could potentially undermine the dam foundations; and, 2. refurbishment of the spillway and associated infrastructure to improve the dam’s stability and operations. The total cost of the works of works is estimated at USD294 million. The Governments of Zambia and Zimbabwe have mobilized financing from the African Development Bank, the European Union, the Government of Sweden, and the World Bank to support the Zambezi River Authority in implementation of the project.
4 Batoka Energy Project*4
The project is to develop 2,400 MW Batoka Gorge hydroelectric schemes, the cost of which is estimated USD6 billion financed by AfDB. The construction phase is expected to begin later this year or in early 2018 under an arrangement between Zambezi River Authority.
5 Electricity Transmission and Distribution System Rehabilitation Project for Zambia*5
The project will reinforce and upgrade the power transmission and distribution infrastructure in Lusaka Area as a priority to increase the capacity and improve the reliability of the electricity network for consumers throughout the area. This programme is expected to provide access to reliable, clean and affordable electricity services to at least 63,000 households, or about 300,000 people, to social and public infrastructure and to eligible Micro Small Enterprises (MSEs). 2013-2019. Co-financed by European Investment Bank, the World Bank and ZESCO Limited.
6 ElectriFI (Electrification Financing Initiative)*6
ElectriFI is a financing scheme to bridge the gaps in structuring and financing, stimulate the private sector, and mobilise financiers. ElectriFI provides financial support primarily through risk capital and encourages the adoption of renewable energy, with a particular emphasis on decentralised energy solutions by providing interim financing solutions to help projects overcome obstacles or otherwise reach a sufficiently mature stage that could attract private financiers. The maximum amount of any financing solution is EUR 10 million (or local currency equivalent).
7 300 megawatts Power Plant Development in Chipata*7
The project is to develop 300 a megawatts coal thermal power plant in Chipata by a South African company. A potential site is a site along Mwami border road just after the railway line crossing. The coal is imported from Tete in Mozambique via the Nacala Corridor. The project cost would be USD 900 million. F/S is currently conducted and completed by 2019. The construction is expected to start in 2020.
8 Combined cycle gas fired power plant*8
TAZAMA proposes to construct a combined cycle gas fired power plant in Chinsali by importing and transmitting gas from Tanzania and Mozambique through Dar es Salaam via a 36-inch pipeline. The plant could have 400 MW to 1,200 MW capacities and the pipeline will be 1,100 km length to be built alongside the existing TAZAMA crude oil pipeline. The estimated cost is USD 900 million including USD 400 million for a 400 MW power plant and USD 500 million for a 1,100 km length Dar es Salaam-Chinsali pipeline.
9 Petroleum Pipeline Project*8
The project is to build an 18-inch finished product pipeline with a delivery capacity of 4.0 million tonnes per annum with depots at Morogoro, Makambako, Mbeya and Mpika for the supply of diesel and petroleum products to southern Tanzania, Malawi, Zambia and Congo. The pipeline will be possibly extended to Solwezi and Lusaka depots. The cost is estimated to be USD 1.5 billion including an 18-inch pipeline complete with pump stations and a supervisory control and data acquisition system.
10 Rural Electrification Projects*9
1,217 Rural Growth Centres (RGCs) are targeted throughout the country for electrification during the period 2008 to 2030. The project scheme includes grid extension, mini hydro (from 200 kw to 10 mw) development, solar mini grids, solar home system installations, biomass and biogas, and wind. A total of 413 RGCs are targeted to be implemented from 2017 to 2021 at a total cost of ZMW1, 302.4 million.
Source:
*1 Energy Regulation Board, Energy Sector Report 2015. P. 17.
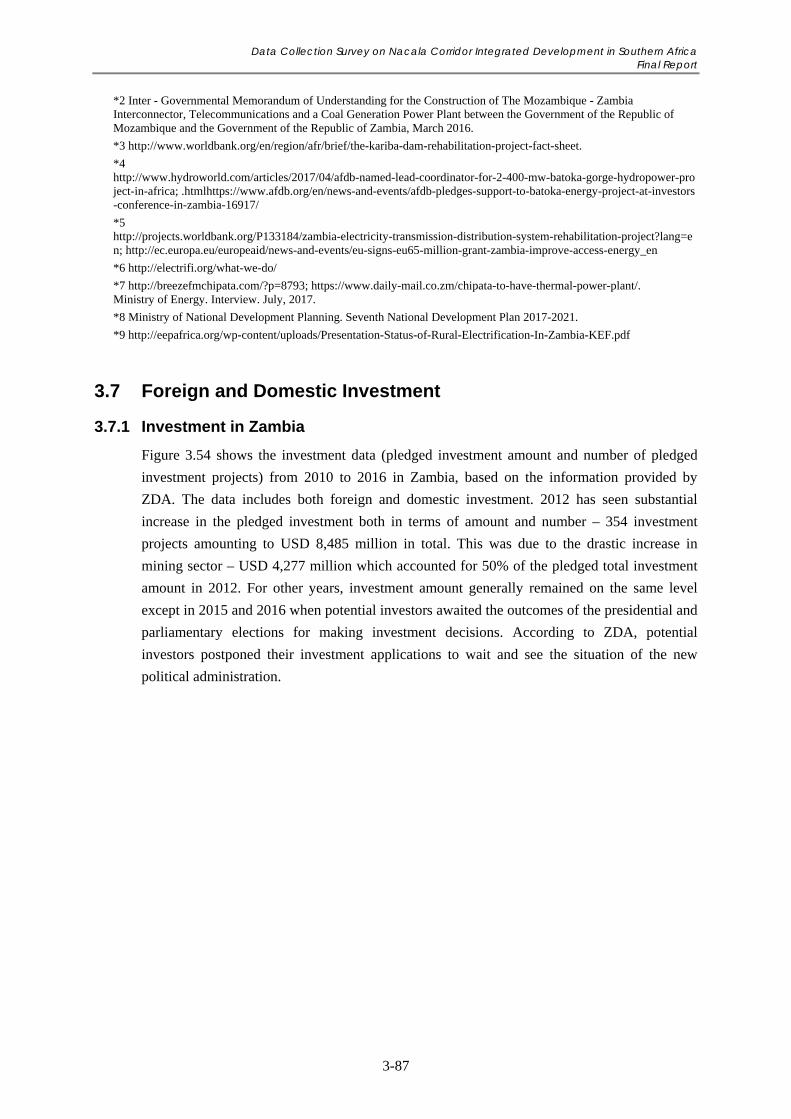
Data Collection Survey on Nacala Corridor Integrated Development in Southern Africa Final Report
3-87
*2 Inter - Governmental Memorandum of Understanding for the Construction of The Mozambique - Zambia Interconnector, Telecommunications and a Coal Generation Power Plant between the Government of the Republic of Mozambique and the Government of the Republic of Zambia, March 2016.
*3 http://www.worldbank.org/en/region/afr/brief/the-kariba-dam-rehabilitation-project-fact-sheet.
*4 http://www.hydroworld.com/articles/2017/04/afdb-named-lead-coordinator-for-2-400-mw-batoka-gorge-hydropower-project-in-africa; .htmlhttps://www.afdb.org/en/news-and-events/afdb-pledges-support-to-batoka-energy-project-at-investors-conference-in-zambia-16917/
*5 http://projects.worldbank.org/P133184/zambia-electricity-transmission-distribution-system-rehabilitation-project?lang=en; http://ec.europa.eu/europeaid/news-and-events/eu-signs-eu65-million-grant-zambia-improve-access-energy_en
*6 http://electrifi.org/what-we-do/
*7 http://breezefmchipata.com/?p=8793; https://www.daily-mail.co.zm/chipata-to-have-thermal-power-plant/. Ministry of Energy. Interview. July, 2017.
*8 Ministry of National Development Planning. Seventh National Development Plan 2017-2021.
*9 http://eepafrica.org/wp-content/uploads/Presentation-Status-of-Rural-Electrification-In-Zambia-KEF.pdf
3.7 Foreign and Domestic Investment
3.7.1 Investment in Zambia
Figure 3.54 shows the investment data (pledged investment amount and number of pledged
investment projects) from 2010 to 2016 in Zambia, based on the information provided by
ZDA. The data includes both foreign and domestic investment. 2012 has seen substantial
increase in the pledged investment both in terms of amount and number – 354 investment
projects amounting to USD 8,485 million in total. This was due to the drastic increase in
mining sector – USD 4,277 million which accounted for 50% of the pledged total investment
amount in 2012. For other years, investment amount generally remained on the same level
except in 2015 and 2016 when potential investors awaited the outcomes of the presidential and
parliamentary elections for making investment decisions. According to ZDA, potential
investors postponed their investment applications to wait and see the situation of the new
political administration.
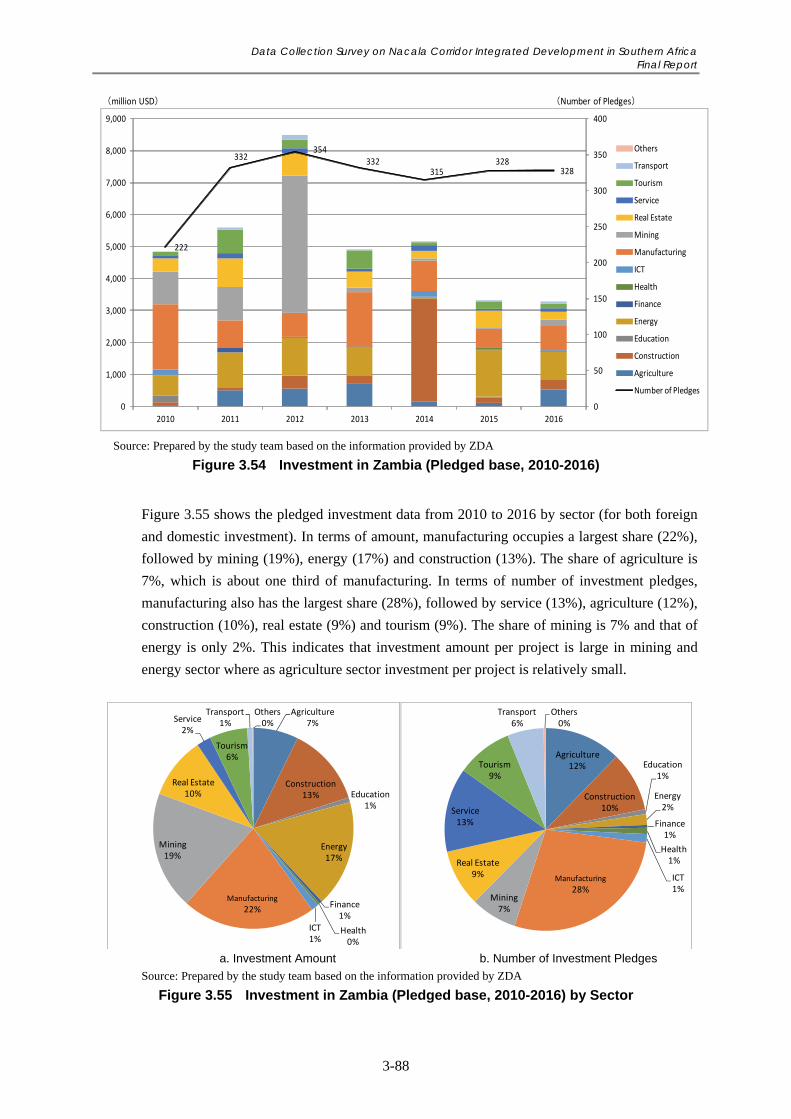
Data Collection Survey on Nacala Corridor Integrated Development in Southern Africa Final Report
3-88
Source: Prepared by the study team based on the information provided by ZDA
Figure 3.54 Investment in Zambia (Pledged base, 2010-2016)
Figure 3.55 shows the pledged investment data from 2010 to 2016 by sector (for both foreign
and domestic investment). In terms of amount, manufacturing occupies a largest share (22%),
followed by mining (19%), energy (17%) and construction (13%). The share of agriculture is
7%, which is about one third of manufacturing. In terms of number of investment pledges,
manufacturing also has the largest share (28%), followed by service (13%), agriculture (12%),
construction (10%), real estate (9%) and tourism (9%). The share of mining is 7% and that of
energy is only 2%. This indicates that investment amount per project is large in mining and
energy sector where as agriculture sector investment per project is relatively small.
a. Investment Amount b. Number of Investment Pledges
Source: Prepared by the study team based on the information provided by ZDA
Figure 3.55 Investment in Zambia (Pledged base, 2010-2016) by Sector
222
332354
332315
328328
0
50
100
150
200
250
300
350
400
0
1,000
2,000
3,000
4,000
5,000
6,000
7,000
8,000
9,000
2010 2011 2012 2013 2014 2015 2016
Others
Transport
Tourism
Service
Real Estate
Mining
Manufacturing
ICT
Health
Finance
Energy
Education
Construction
Agriculture
Number of Pledges
(million USD) (Number of Pledges)
Agriculture7%
Construction13% Education
1%
Energy17%
Finance1%
Health0%
ICT1%
Manufacturing
22%
Mining19%
Real Estate10%
Service2%
Tourism6%
Transport1%
Others0%
Agriculture12%
Construction10%
Education1%
Energy2%
Finance1%
Health1%
ICT1%
Manufacturing
28%Mining7%
Real Estate9%
Service13%
Tourism9%
Transport6%
Others0%
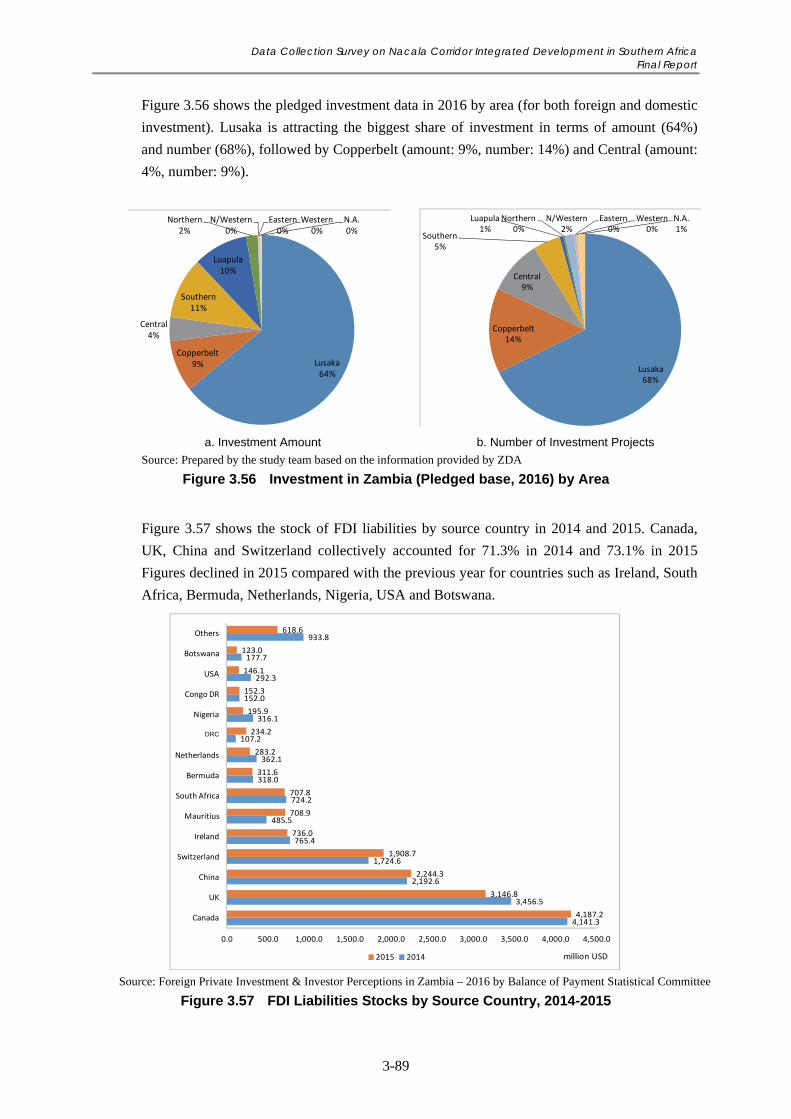
Data Collection Survey on Nacala Corridor Integrated Development in Southern Africa Final Report
3-89
Figure 3.56 shows the pledged investment data in 2016 by area (for both foreign and domestic
investment). Lusaka is attracting the biggest share of investment in terms of amount (64%)
and number (68%), followed by Copperbelt (amount: 9%, number: 14%) and Central (amount:
4%, number: 9%).
a. Investment Amount b. Number of Investment Projects
Source: Prepared by the study team based on the information provided by ZDA
Figure 3.56 Investment in Zambia (Pledged base, 2016) by Area
Figure 3.57 shows the stock of FDI liabilities by source country in 2014 and 2015. Canada,
UK, China and Switzerland collectively accounted for 71.3% in 2014 and 73.1% in 2015
Figures declined in 2015 compared with the previous year for countries such as Ireland, South
Africa, Bermuda, Netherlands, Nigeria, USA and Botswana.
Source: Foreign Private Investment & Investor Perceptions in Zambia – 2016 by Balance of Payment Statistical Committee
Figure 3.57 FDI Liabilities Stocks by Source Country, 2014-2015
4,141.3
3,456.5
2,192.6
1,724.6
765.4
485.5
724.2
318.0
362.1
107.2
316.1
152.0
292.3
177.7
933.8
4,187.2
3,146.8
2,244.3
1,908.7
736.0
708.9
707.8
311.6
283.2
234.2
195.9
152.3
146.1
123.0
618.6
0.0 500.0 1,000.0 1,500.0 2,000.0 2,500.0 3,000.0 3,500.0 4,000.0 4,500.0
Canada
UK
China
Switzerland
Ireland
Mauritius
South Africa
Bermuda
Netherlands
France
Nigeria
Congo DR
USA
Botswana
Others
2015 2014 million USD
DRC
Lusaka64%
Copperbelt9%
Central4%
Southern11%
Luapula10%
Northern2%
N/Western0%
Eastern0%
Western0%
N.A.0%
Lusaka68%
Copperbelt14%
Central9%
Southern5%
Luapula1%
Northern0%
N/Western2%
Eastern0%
Western0%
N.A.1%
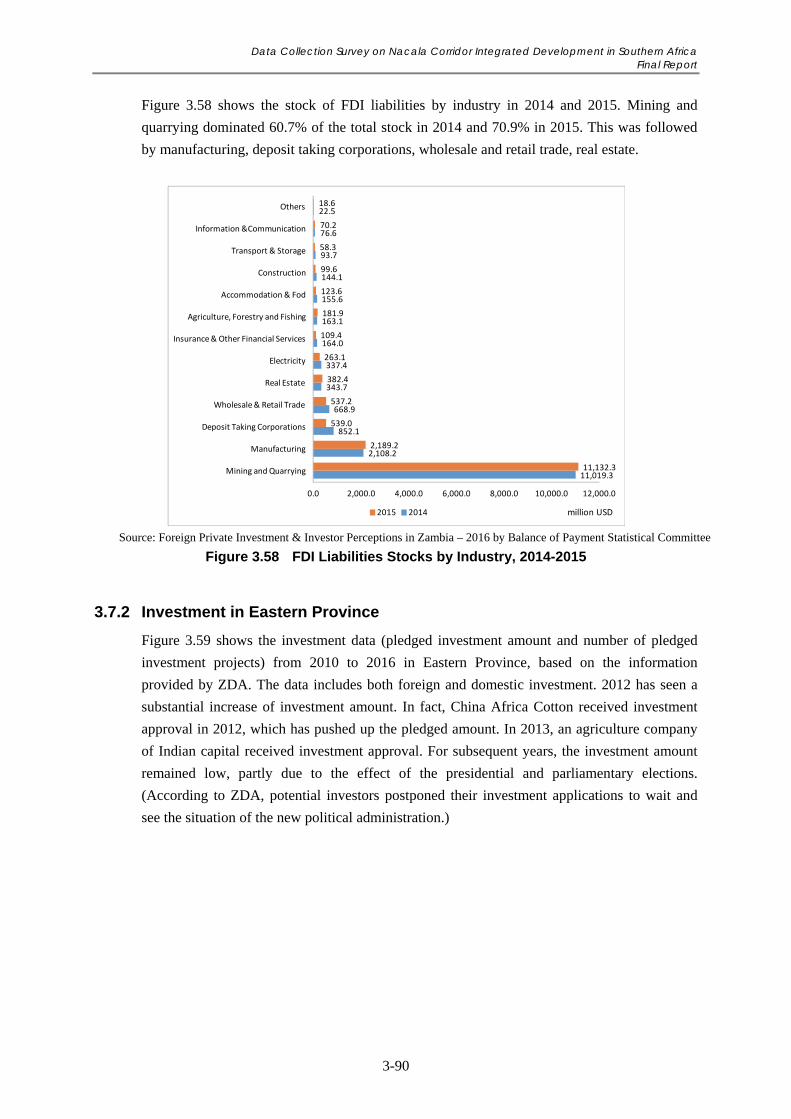
Data Collection Survey on Nacala Corridor Integrated Development in Southern Africa Final Report
3-90
Figure 3.58 shows the stock of FDI liabilities by industry in 2014 and 2015. Mining and
quarrying dominated 60.7% of the total stock in 2014 and 70.9% in 2015. This was followed
by manufacturing, deposit taking corporations, wholesale and retail trade, real estate.
Source: Foreign Private Investment & Investor Perceptions in Zambia – 2016 by Balance of Payment Statistical Committee
Figure 3.58 FDI Liabilities Stocks by Industry, 2014-2015
3.7.2 Investment in Eastern Province
Figure 3.59 shows the investment data (pledged investment amount and number of pledged
investment projects) from 2010 to 2016 in Eastern Province, based on the information
provided by ZDA. The data includes both foreign and domestic investment. 2012 has seen a
substantial increase of investment amount. In fact, China Africa Cotton received investment
approval in 2012, which has pushed up the pledged amount. In 2013, an agriculture company
of Indian capital received investment approval. For subsequent years, the investment amount
remained low, partly due to the effect of the presidential and parliamentary elections.
(According to ZDA, potential investors postponed their investment applications to wait and
see the situation of the new political administration.)
11,019.3
2,108.2
852.1
668.9
343.7
337.4
164.0
163.1
155.6
144.1
93.7
76.6
22.5
11,132.3
2,189.2
539.0
537.2
382.4
263.1
109.4
181.9
123.6
99.6
58.3
70.2
18.6
0.0 2,000.0 4,000.0 6,000.0 8,000.0 10,000.0 12,000.0
Mining and Quarrying
Manufacturing
Deposit Taking Corporations
Wholesale & Retail Trade
Real Estate
Electricity
Insurance & Other Financial Services
Agriculture, Forestry and Fishing
Accommodation & Fod
Construction
Transport & Storage
Information &Communication
Others
2015 2014 million USD
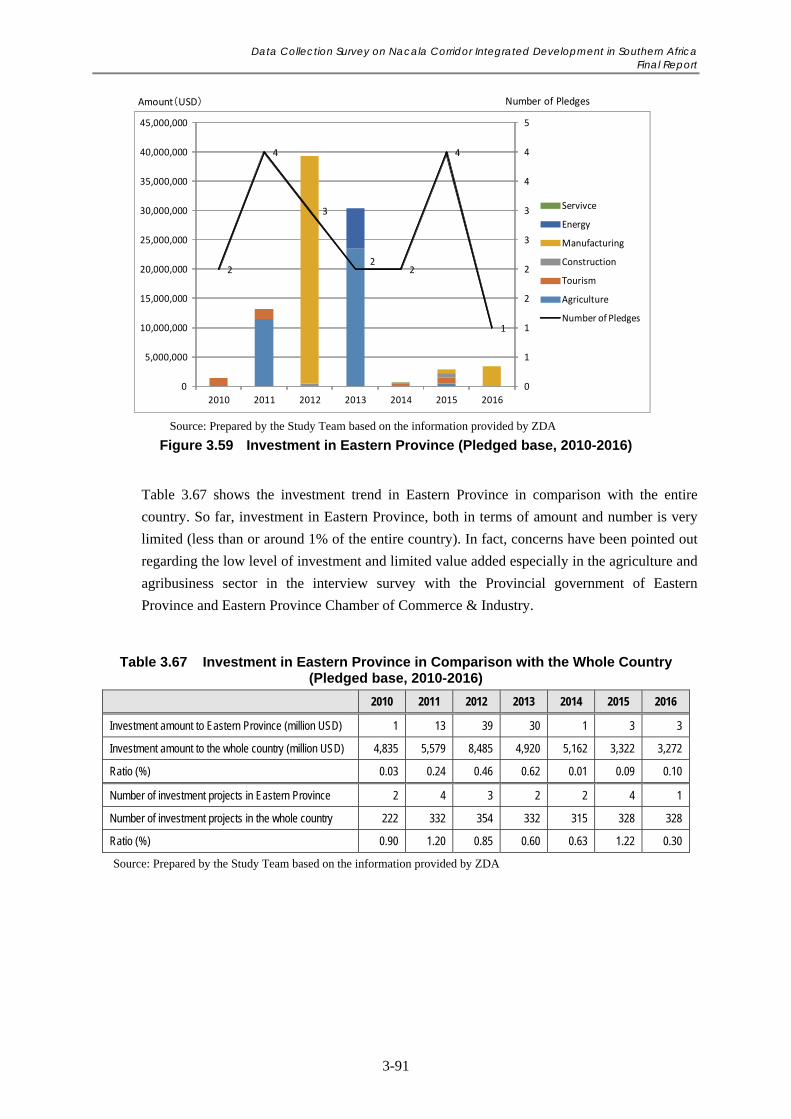
Data Collection Survey on Nacala Corridor Integrated Development in Southern Africa Final Report
3-91
Source: Prepared by the Study Team based on the information provided by ZDA
Figure 3.59 Investment in Eastern Province (Pledged base, 2010-2016)
Table 3.67 shows the investment trend in Eastern Province in comparison with the entire
country. So far, investment in Eastern Province, both in terms of amount and number is very
limited (less than or around 1% of the entire country). In fact, concerns have been pointed out
regarding the low level of investment and limited value added especially in the agriculture and
agribusiness sector in the interview survey with the Provincial government of Eastern
Province and Eastern Province Chamber of Commerce & Industry.
Table 3.67 Investment in Eastern Province in Comparison with the Whole Country (Pledged base, 2010-2016)
2010 2011 2012 2013 2014 2015 2016
Investment amount to Eastern Province (million USD) 1 13 39 30 1 3 3
Investment amount to the whole country (million USD) 4,835 5,579 8,485 4,920 5,162 3,322 3,272
Ratio (%) 0.03 0.24 0.46 0.62 0.01 0.09 0.10
Number of investment projects in Eastern Province 2 4 3 2 2 4 1
Number of investment projects in the whole country 222 332 354 332 315 328 328
Ratio (%) 0.90 1.20 0.85 0.60 0.63 1.22 0.30
Source: Prepared by the Study Team based on the information provided by ZDA
Amount(USD)
2
4
3
22
4
1
0
1
1
2
2
3
3
4
4
5
0
5,000,000
10,000,000
15,000,000
20,000,000
25,000,000
30,000,000
35,000,000
40,000,000
45,000,000
2010 2011 2012 2013 2014 2015 2016
Servivce
Energy
Manufacturing
Construction
Tourism
Agriculture
Number of Pledges
Number of Pledges
Data Collection Survey on Nacala Corridor Integrated Development in Southern Africa Final Report
3-92
3.8 Transport Infrastructure and Logistics
This section analyses the current situation of the transport and logistic sector of Zambia and
the study area in general, since the current situation of the Nacala Corridor was discussed in
Chapter 2.
3.8.1 Current Transport Sector
(1) Plans and Policies
MTC has published the 2016 National Transport Policy (ZNTP) based on review of 2002
National Transport Policy in order to ensure that it responds to emerging challenges of the
transport infrastructure and service provision.
ZNTP recognises the importance of an efficient transport system in the country especially
since Zambia is a landlocked country and serves as a transport hub for transit traffic entering
other nations. Furthermore, the Policy also states that transport is critical to the economic
development of Zambia and highlights that railway transport is the backbone of Zambia's
transport system. As part of the solutions to the current transport problems, the policy outlines
the under-listed measures:
Strengthen the Ministry responsible for transport to ensure that it plays its role of
effective coordination and regulation of the transport sector;
Create capacity commensurate with the transport requirements of the economy by
ensuring that sufficient resources are invested in the transport sector;
Allocate available resources among the various transport modes so that the resultant
modal mix meets transport requirements at optimum cost to both the provider and the
user;
Promote transport pricing that will ensure a reasonable return on transport investments;
Recognise and account for environmental concerns within the transport sector in line with
the National Environmental Action Plan;
Introduce sound management through appropriate policies and institutions in the transport
sector that will lead to rapid sustainable development and poverty reduction.
In 2017, the GOZ prepared the National Transport Master Plan (ZNTMP). ZNTMP aims to
support the achievement of this vision by providing a guide for the development of the
transport sector over the next twenty years, by addressing the strategic considerations.
1) Transport Modes
To sustain the growth, Zambia needs to upgrade its transportation infrastructure. Zambia is a
landlocked country in the centre of the Southern African Region, and to this effect heavily
relies on her neighbours for vital routes to various import and export destinations. The
transport sector consists of five modes:
Roads
Railways
Aviation
Data Collection Survey on Nacala Corridor Integrated Development in Southern Africa Final Report
3-93
Waterway
Pipeline: TAZAMA pipeline for crude oil importation
The state of transport infrastructure, however, remains inadequate to sustain and match the
desired levels of growth due to weak structural and management capacity resulting in over
commitments, high cost of construction and low investment.
Table 3.68 Yearly Finding Requirement (USD) for the Transport Sector 2013-2016
Sector 2013 2014 2015 2016 Total
Roads 4,254,494 7,694,155 11,444,202 8,359,32 31,752,171 Railway 812,765 432,865 142,560 - 1,526,640
Air 1,265,840 1,305,612 - - 2,571,455 Water 18,176 21,900 25,125 27,867 93,068
Total 6,351,275 9,454,535 11,611,887 8,522,637 35,940,334
Source: ZNTMP
2) Responsible Organisation for Transport Sector
The overall management and responsibility for the transport sector in Zambia is under the
authority of the MTC, Ministry of Works & Supply (MWS) and Ministry of Housing &
Infrastructure Development (MHID). The roles of each Ministry are as follows:
MTC: Policy and programme planning
MWS: Asset management
MHID: Implementation management
3.8.2 Road Sub-Sector
(1) Key Agencies for Road Sub-Sector
Zambia’s road network is currently managed by The Road Development Agency (RDA),
which reports to the MHID. The Road Transportation & Safety Agency (RTSA) and the
National Road Fund Agency (NRFA) are responsible for road safety and managing the sector
funds respectively.
1) Road Development Agency (RDA), set up under the Public Road Act No. 12, 2002
RDA is the most important agency in Zambia, concerning the Road Sector. RDA is mandated
with and actually issues, selects, and supervises all road construction and maintenance
contracts (with private contractors), as well as managing weigh bridges and highway operation.
RDA also assesses road conditions and conducts annual traffic counts as part of its highway
management.
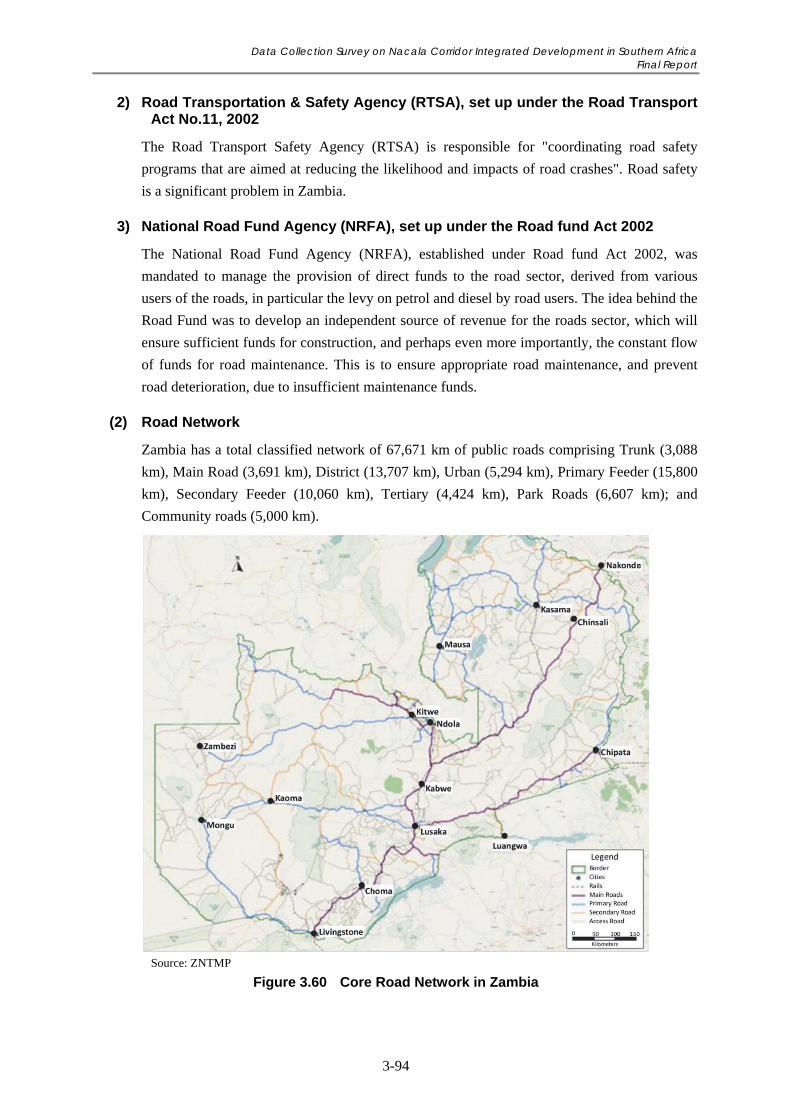
Data Collection Survey on Nacala Corridor Integrated Development in Southern Africa Final Report
3-94
2) Road Transportation & Safety Agency (RTSA), set up under the Road Transport Act No.11, 2002
The Road Transport Safety Agency (RTSA) is responsible for "coordinating road safety
programs that are aimed at reducing the likelihood and impacts of road crashes". Road safety
is a significant problem in Zambia.
3) National Road Fund Agency (NRFA), set up under the Road fund Act 2002
The National Road Fund Agency (NRFA), established under Road fund Act 2002, was
mandated to manage the provision of direct funds to the road sector, derived from various
users of the roads, in particular the levy on petrol and diesel by road users. The idea behind the
Road Fund was to develop an independent source of revenue for the roads sector, which will
ensure sufficient funds for construction, and perhaps even more importantly, the constant flow
of funds for road maintenance. This is to ensure appropriate road maintenance, and prevent
road deterioration, due to insufficient maintenance funds.
(2) Road Network
Zambia has a total classified network of 67,671 km of public roads comprising Trunk (3,088
km), Main Road (3,691 km), District (13,707 km), Urban (5,294 km), Primary Feeder (15,800
km), Secondary Feeder (10,060 km), Tertiary (4,424 km), Park Roads (6,607 km); and
Community roads (5,000 km).
Source: ZNTMP
Figure 3.60 Core Road Network in Zambia
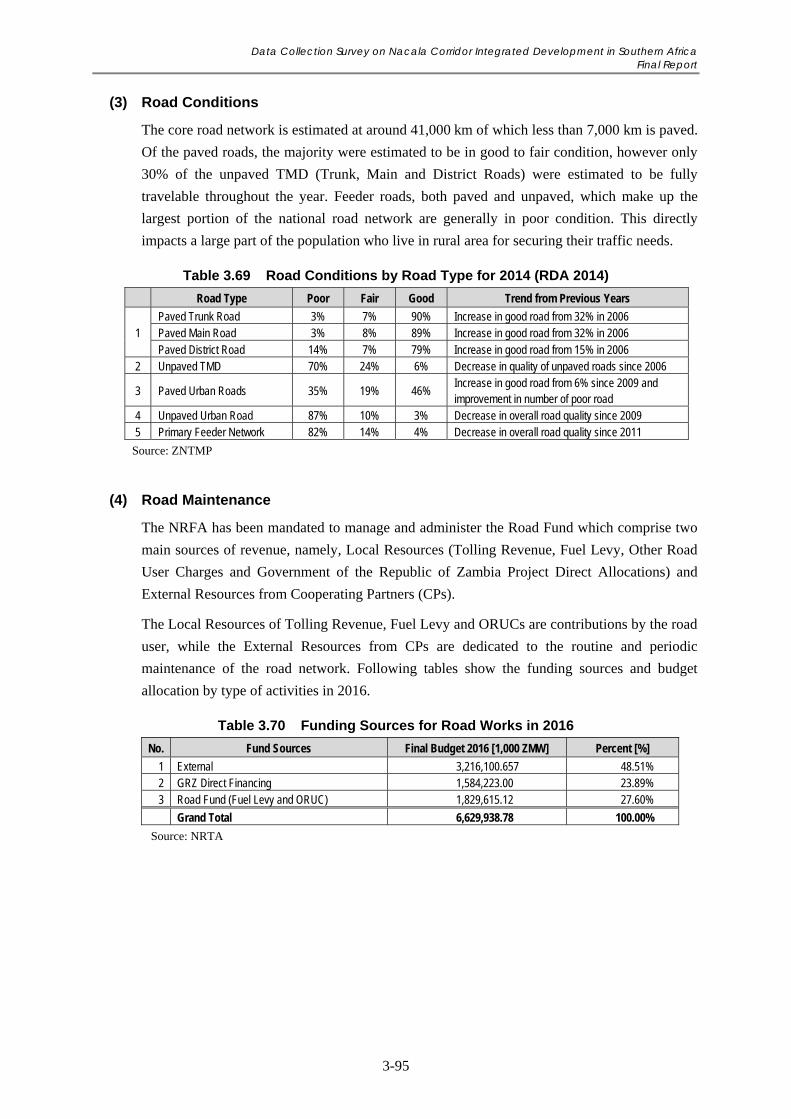
Data Collection Survey on Nacala Corridor Integrated Development in Southern Africa Final Report
3-95
(3) Road Conditions
The core road network is estimated at around 41,000 km of which less than 7,000 km is paved.
Of the paved roads, the majority were estimated to be in good to fair condition, however only
30% of the unpaved TMD (Trunk, Main and District Roads) were estimated to be fully
travelable throughout the year. Feeder roads, both paved and unpaved, which make up the
largest portion of the national road network are generally in poor condition. This directly
impacts a large part of the population who live in rural area for securing their traffic needs.
Table 3.69 Road Conditions by Road Type for 2014 (RDA 2014)
Road Type Poor Fair Good Trend from Previous Years
1 Paved Trunk Road 3% 7% 90% Increase in good road from 32% in 2006 Paved Main Road 3% 8% 89% Increase in good road from 32% in 2006 Paved District Road 14% 7% 79% Increase in good road from 15% in 2006
2 Unpaved TMD 70% 24% 6% Decrease in quality of unpaved roads since 2006
3 Paved Urban Roads 35% 19% 46% Increase in good road from 6% since 2009 and improvement in number of poor road
4 Unpaved Urban Road 87% 10% 3% Decrease in overall road quality since 2009 5 Primary Feeder Network 82% 14% 4% Decrease in overall road quality since 2011
Source: ZNTMP
(4) Road Maintenance
The NRFA has been mandated to manage and administer the Road Fund which comprise two
main sources of revenue, namely, Local Resources (Tolling Revenue, Fuel Levy, Other Road
User Charges and Government of the Republic of Zambia Project Direct Allocations) and
External Resources from Cooperating Partners (CPs).
The Local Resources of Tolling Revenue, Fuel Levy and ORUCs are contributions by the road
user, while the External Resources from CPs are dedicated to the routine and periodic
maintenance of the road network. Following tables show the funding sources and budget
allocation by type of activities in 2016.
Table 3.70 Funding Sources for Road Works in 2016
No. Fund Sources Final Budget 2016 [1,000 ZMW] Percent [%]
1 External 3,216,100.657 48.51% 2 GRZ Direct Financing 1,584,223.00 23.89% 3 Road Fund (Fuel Levy and ORUC) 1,829,615.12 27.60%
Grand Total 6,629,938.78 100.00%
Source: NRTA
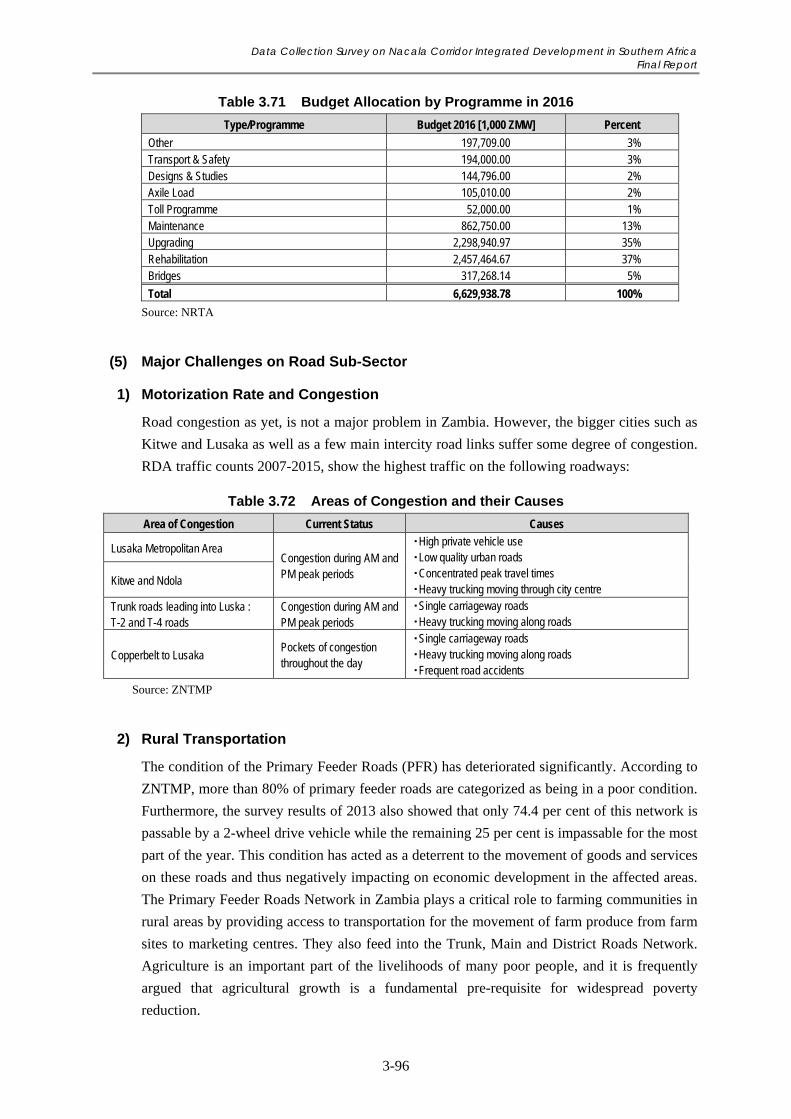
Data Collection Survey on Nacala Corridor Integrated Development in Southern Africa Final Report
3-96
Table 3.71 Budget Allocation by Programme in 2016
Type/Programme Budget 2016 [1,000 ZMW] Percent
Other 197,709.00 3% Transport & Safety 194,000.00 3% Designs & Studies 144,796.00 2% Axile Load 105,010.00 2% Toll Programme 52,000.00 1% Maintenance 862,750.00 13% Upgrading 2,298,940.97 35% Rehabilitation 2,457,464.67 37% Bridges 317,268.14 5%
Total 6,629,938.78 100%
Source: NRTA
(5) Major Challenges on Road Sub-Sector
1) Motorization Rate and Congestion
Road congestion as yet, is not a major problem in Zambia. However, the bigger cities such as
Kitwe and Lusaka as well as a few main intercity road links suffer some degree of congestion.
RDA traffic counts 2007-2015, show the highest traffic on the following roadways:
Table 3.72 Areas of Congestion and their Causes
Area of Congestion Current Status Causes
Lusaka Metropolitan Area Congestion during AM and PM peak periods
・High private vehicle use ・Low quality urban roads ・Concentrated peak travel times ・Heavy trucking moving through city centre
Kitwe and Ndola
Trunk roads leading into Luska : T-2 and T-4 roads
Congestion during AM and PM peak periods
・Single carriageway roads ・Heavy trucking moving along roads
Copperbelt to Lusaka Pockets of congestion throughout the day
・Single carriageway roads ・Heavy trucking moving along roads ・Frequent road accidents
Source: ZNTMP
2) Rural Transportation
The condition of the Primary Feeder Roads (PFR) has deteriorated significantly. According to
ZNTMP, more than 80% of primary feeder roads are categorized as being in a poor condition.
Furthermore, the survey results of 2013 also showed that only 74.4 per cent of this network is
passable by a 2-wheel drive vehicle while the remaining 25 per cent is impassable for the most
part of the year. This condition has acted as a deterrent to the movement of goods and services
on these roads and thus negatively impacting on economic development in the affected areas.
The Primary Feeder Roads Network in Zambia plays a critical role to farming communities in
rural areas by providing access to transportation for the movement of farm produce from farm
sites to marketing centres. They also feed into the Trunk, Main and District Roads Network.
Agriculture is an important part of the livelihoods of many poor people, and it is frequently
argued that agricultural growth is a fundamental pre-requisite for widespread poverty
reduction.
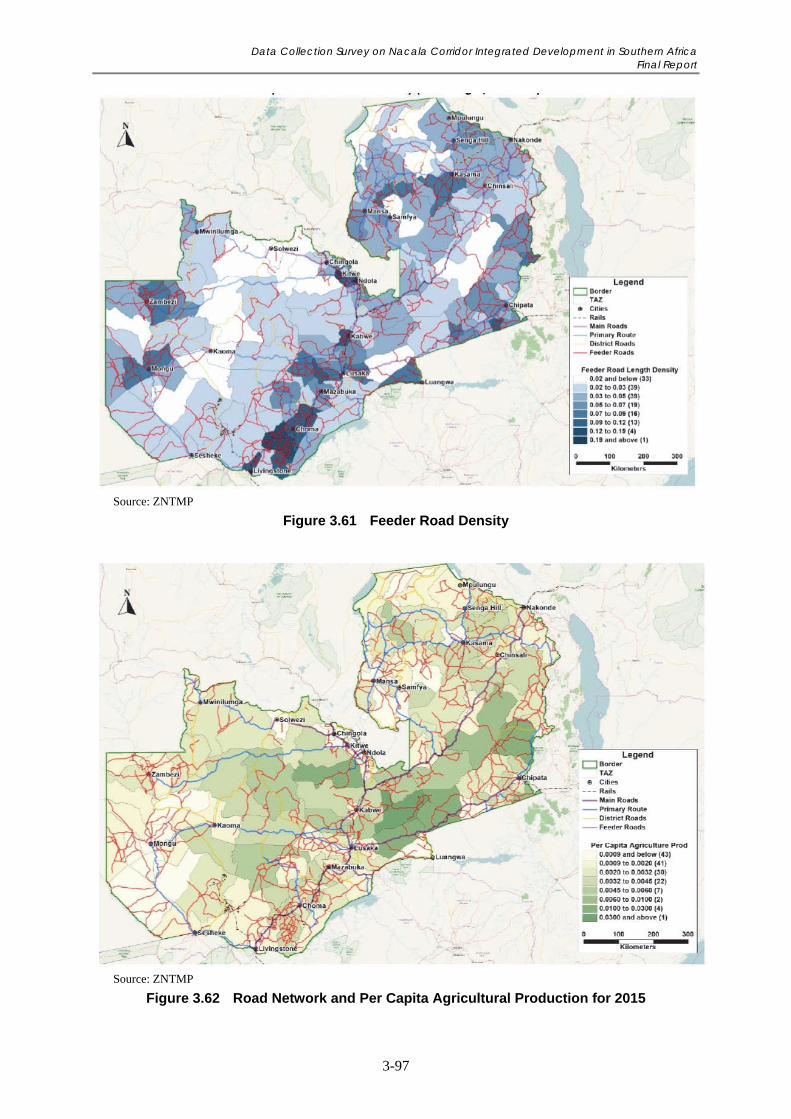
Data Collection Survey on Nacala Corridor Integrated Development in Southern Africa Final Report
3-97
Source: ZNTMP
Figure 3.61 Feeder Road Density
Source: ZNTMP
Figure 3.62 Road Network and Per Capita Agricultural Production for 2015
Data Collection Survey on Nacala Corridor Integrated Development in Southern Africa Final Report
3-98
3) Key Sector Development Projects
In this context, the GOZ has been forging the way ahead with the following projects.
RDA annual maintenance: Annual maintenance projects for the RDA (ongoing)
Link Zambia 8000: Strategic road improvement project for all of Zambia (in progress)
LSK 400: Strategic road improvement project for Lusaka (in progress)
CB 400: Strategic road improvement project for Copper-belt (in progress)
Urban Roads Program: 40 projects for 700 km upgrading local road networks (in progress)
Pave Zambia 2000: Urban road project utilizing cost effective materials to improve urban
roads across Zambia (in progress)
Lusaka Decongestion Project: Lusaka Traffic Decongestion Project Implementation (in
progress)
Feeder Roads Program (Countrywide Roll-Out of the Output and Performance based Road
Contracts - OPRC Region I (Eastern, Luanpula, Northern and Muchinga Provinces)
financed by WB): 20 projects for 650 km of rural access roads (in progress)
City Bypass Road Program: Bypass roads at major urban areas to remove through traffic
from urban centres (Lusaka, Kabwe, Kapiri Mposhi, Kitwe, Chingola, Choma, Mazabuka,
Livingstone) (planning)
T2 Road Upgrade: Upgrade of T2 road to dual carriageway between Lusaka to Ndola
(approx. 350 km) (procurement)
Toll Roads Program: Comprehensive toll gates program including operations (in progress)
3.8.3 Rail Sub-Sector
(1) Key Agencies for Rail Sub-Sector
The main railway lines are Zambia Railways Limited (ZRL) which is owned by the
Government and the TAZARA line which links Zambia with Tanzania, and is jointly owned
by the Zambian and Tanzanian governments. In 2003, the operations of the ZRL were given
concession to Railway Systems of Zambia (RSZ). However, in 2012, ZRL replaced the
concession by RSZ.
According to the latest information, GOZ intends to divide ZRL into ZRL and ZRA (Zambia
Railway Authority). Functions and roles of ZRA will be same as RDA of road sector.
1) Railway Network
(a) Main Lines
ZRL: 1,248 km in total
Mainline – Victoria Falls Bridge to Kitwe: 848 km
Various Branch Lines: 149 km
Choma – Masuku Line: 65 km
Mulobezi Line: 162 km
Chipata – Mchinii Line: 24 km
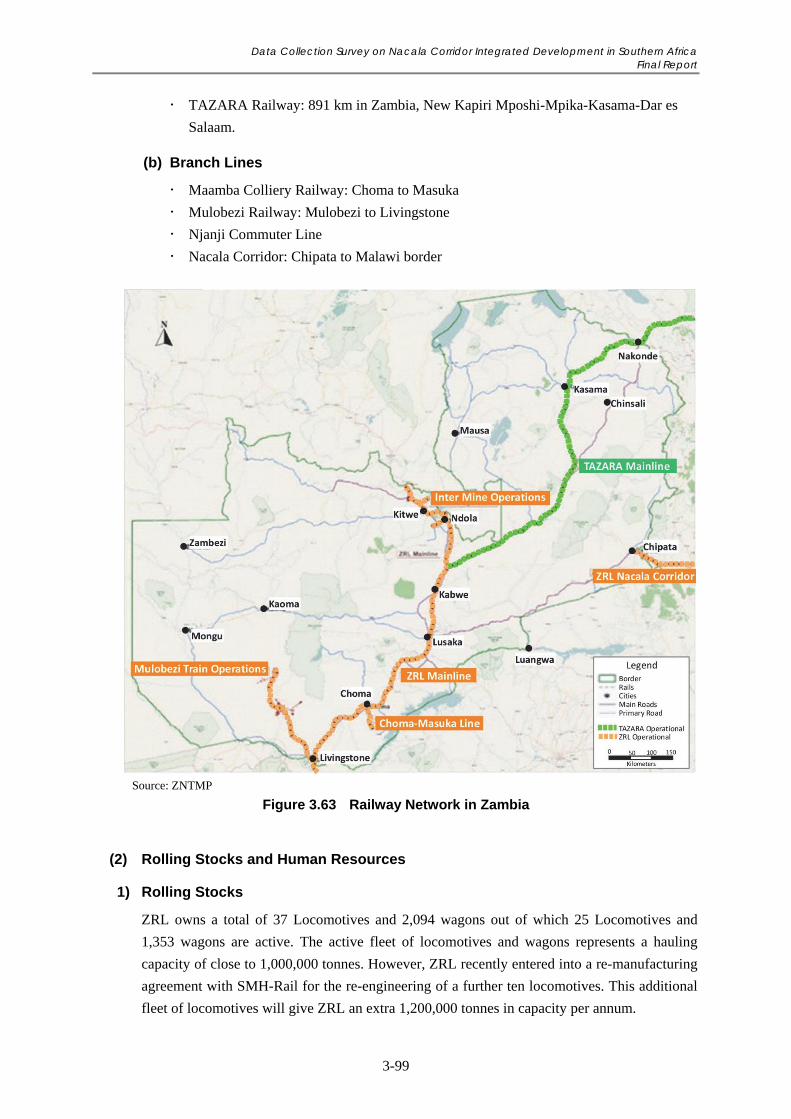
Data Collection Survey on Nacala Corridor Integrated Development in Southern Africa Final Report
3-99
TAZARA Railway: 891 km in Zambia, New Kapiri Mposhi-Mpika-Kasama-Dar es
Salaam.
(b) Branch Lines
Maamba Colliery Railway: Choma to Masuka
Mulobezi Railway: Mulobezi to Livingstone
Njanji Commuter Line
Nacala Corridor: Chipata to Malawi border
Source: ZNTMP
Figure 3.63 Railway Network in Zambia
(2) Rolling Stocks and Human Resources
1) Rolling Stocks
ZRL owns a total of 37 Locomotives and 2,094 wagons out of which 25 Locomotives and
1,353 wagons are active. The active fleet of locomotives and wagons represents a hauling
capacity of close to 1,000,000 tonnes. However, ZRL recently entered into a re-manufacturing
agreement with SMH-Rail for the re-engineering of a further ten locomotives. This additional
fleet of locomotives will give ZRL an extra 1,200,000 tonnes in capacity per annum.
Data Collection Survey on Nacala Corridor Integrated Development in Southern Africa Final Report
3-100
2) Human Resources
Currently ZRL has a total workforce of 1,124 employees of which 89% of the total staff
establishment are directly linked to operations. There is a staff reservoir with rail operations
experience in total around 1,000 employees.
(a) Service Provided
ZRL – Zambia Railways Limited
The current ZRL total route length is 1,248 km of single track mainline. It provides
service along seven mainline routes, only two of which provide passenger services, the
rest being reserved for freight trains. Although there is growth in usage and passenger
ridership, the market share has decreased preventing ZRL from increasing its supply
to match the increasing demand. In order to truly compete with road borne freight
transport, the railway sector needs to increase its operating frequency and speeds to
reduce the costs borne by the shipper. This however requires accurate investment in
the railroad, completion of maintenance backlogging, etc.
TAZARA – Tanzania - Zambia Railway Authority
The TAZARA system connects Zambia with the port of Dar es Salaam in Tanzania,
the route has a length of 1,860 km and connects with Zambia Railway Line (ZRL) at
New Kapiri - Mposhi. The average travel time according to TAZARA management is
roughly 48 hours. Freight train travel times are even longer at approximately 3 - 4
days, this is a result of difficult track conditions and low priority status on the mainline.
TAZARA has fallen into a dilapidated state both in terms of rolling stock and track
maintenance resulting in low speeds and market share, the route fails to compete with
road borne cargo hauling.
(3) Major Challenges on Rail Sub-Sector
The Zambian railways generally operate well below their original design capacity, and cannot
increase their volume due to poor track condition, lack of locomotive and wagon availability
and low operating capital. The rail network remains the dominant mode of transportation for
goods on the local and international routes. The biggest single setback suffered by the rail
mode against road, in terms of competing for the market share is the low average speeds of rail
transport, resulting from the poor state of the rail track, rolling stock and signalling system.
There are two major railway systems operating ZRL and the TAZARA.
Table 3.73 ZRL Market Share in 2013
Sector of the Economy Market Share Mining Sector (Imports and Exports of Mining Products) 9%
Inter-mine Movements 15% Agriculture Sector 5%
Construction Sector 2% Energy 15%
Others and Over Boarder Traffic 25% Average Market Share 12%
Year Market Share
Target Achievement by ZRL
2013 8% 9% 2014 10% 11%
Freight Passenger
Source: ZNTMP
Data Collection Survey on Nacala Corridor Integrated Development in Southern Africa Final Report
3-101
ZRL’s Strategic Business Plan, 2013 indicates the following weaknesses and threats to ZRL,
in the period 2014 - 2018:
Poor State of the Rail Track – Due to the current condition of the rail track, freight and
passenger trains move at an average speed of only 20 km/hr. This has resulted in long transit
time, and overall inefficiency of the train service.
Lack of Reliable and Adequate Rolling Stock – The current rolling stock (wagons and
locomotives) are also in a deplorable state, and therefore cannot fully support the
transportation of both freight and passengers in a sustainable manner.
Problems in Contiguous Rail Administrations – Zambia being a land locked country, ZRL
is linked to neighbouring railway administrations and, therefore, the performance of these rail
entities have a great impact on ZRL as over-border traffic must be hauled through other
countries to different ports, such as, Durban and Dar-E-Salaam.
(4) Key Sector Development Projects
The Government intends to expand its railway network in the country to develop the surface
transport sector. The development of rail routes linking important exit points is not only vital
for facilitating smooth access to the outside world but also for the overall boosting of trade in
the sub region and making Zambia a competitive country for doing business.
The main railway lines are Zambia Railways which is owned by the government and the
TAZARA line which links Zambia with Tanzania, jointly owned by the Zambian and
Tanzanian governments. The recent opening of the Chipata-Mchinji railway link provides
connectivity into the Malawi railway network and further connects Zambia to the northern
Mozambique railway network thereby opening up new and exciting opportunities for the
private sector in Zambia, Malawi, and Mozambique. The government is seeking private sector
participation in the development and rehabilitation of the railway infrastructure. Key sector
development projects in the Rail Sub-Sectors include:
TAZARA - Kasama-Nkonde Rerouting: Rerouting and upgrading of rail section for safety and speed (contracting)
TAZARA - Kapiri-Kasama track rehabilitation :Rehabilitation of rail sections (contracting)
ZRL - annual maintenance: Maintenance of all aspects of ZRL infrastructure (ongoing) ZRL - Comprehensive rehabilitation: Rehabilitation of essential infrastructures and
rolling stock (in progress) ZRL - Mainline signalling: 2 Phase project implementing signalling systems on ZRL
mainline (in progress) Serenje - Chipata greenfield railway: 388 km of track providing connection to the Port of
Beira, Mozambique (procurement) Greenfield freight railways: Kafue - Lion’s Den, Potential connections to Mpulungu, and
Shesheke (planning) Fast passenger rail: Upgraded passenger rail between Kafue - Chingola (planning) Establishment of the Railway Development Agency (planning)
Data Collection Survey on Nacala Corridor Integrated Development in Southern Africa Final Report
3-102
(5) New Transport Quota System proposed by ZRL
The total heavy bulky cargo market in the transport sector is around 11 million tonnes and is
expected to grow to 18 million tonnes by 2020. The prevailing market share for rail is 9%.
Further, the Zambian transport sector is largely composed of foreign road haulers that account
for about 85% of the total road fleet currently traversing Zambia’s road network. This entails
that the revenue generated by these foreign road companies is all externalised to their
countries of origin but the cost of maintaining roads in Zambia is financed by the people of
Zambia thereby creating a huge economic imbalance and a negative contribution to the
economic development of Zambia.
Given this background, considering the expected benefits of using rail transport for heavy and
bulky cargo hauling, ZRA proposes the enactment of a statutory instrument in the Zambian
transport sector to regulate the movement of cargo in the country.
Table 3.74 Proposed New Transport Quota System by ZRL
Commodity Current Estimated Annual Tonnage
Proposed Rail Quota Expected Guaranteed
Rail Tonnage Copper/ Copper-Cobalt Concentrates 1,300,000 50% 650,000
Sugar 400,000 50% 200,000 Coal - Local 350,000 50% 175,000 Coal – Imported 340,000 50% 170,000 Cement 3,300,000 50% 1,650,000 Sulphur 100,000 100% 100,000 Fuels – Local 500,000 50% 250,00 Fuels – Imported 700,000 60% 420,000 Total 6,990,000 - 3,765,000 Other Commodities (Lime, fertiliser, Maize etc.) 4,010,000 Status - Quo -
Grand Total 11,000,000 - -
Source: ZRL
3.8.4 Aviation Sub-Sector
(1) Key Agencies for Aviation Sub-Sector
The aviation sub sector is regulated by the Civil Aviation Authority (CAA) which is an Agent
of the Government under the MTC. The CAA took over the responsibility of the predecessor
Department of Civil Aviation (DCA) in charge of regulation, certification and licensing of the
aviation industry in Zambia.
(2) Aviation Network
There are four international airports, five secondary airfields and five airstrips serving the
international and domestic flights. The Kenneth Kaunda International Airport is Zambia’s
main airport connecting the country with the rest of the world. This is complimented by three
smaller airports at Ndola, Livingstone and Mfuwe, as well as secondary airfields at Chipata,
Kitwe, Kasama, Mongu, Solwezi and Mansa.
Data Collection Survey on Nacala Corridor Integrated Development in Southern Africa Final Report
3-103
1) Service Provided
Zambia has no national airline but is served by a number of airlines that connect to
international routes via Johannesburg, Durban, Cape Town, Addis Ababa, Nairobi, London,
Amsterdam, Dubai and Dar es Salaam. Proflight Zambia is a privately run airline with
proposed regional flights to Johannesburg and Congo DRC as well as local flights to various
destinations within the country. The country recently adapted an “open sky policy” and is
currently promoting the establishment of an air cargo hub for the Southern African region.
2) Key Sector Development Projects
In 2011, Jacobs Consultancy prepared for the then National Airports Corporation limited a
"Feasibility Study for the Zambia Airport Master Plan". The Study includes detailed feasibility
studies for each of the four International Airports.
Based on this Study, GOZ has embarked on a programme to improve the infrastructure at all
the international airports. This is being done in collaboration with private sector participation.
The developments include runways, terminals and auxiliary facilities in and around the
airports such as hotels, shopping malls, conference facilities etc. The scope for private sector
participation in the development of airports also exists in the identified airfields at Chipata,
Kitwe, Kasama, Mongu, Solwezi and Mansa.
Kenneth Kaunda International Airport Upgrade Project: This airport will serve the Lusaka
provinces in carrying both passengers and goods (in progress)
Copperbelt International Airport: This airport will serve the Copperbelt and Northwestern
provinces in carrying both passengers and goods (in progress)
Mfuwe International Airport: This airport will serve Eastern and Muchinga Provinces in
carrying both passengers and goods (financing/negotiation)
Provincial Aerodrome Program: Ten key provincial airports for rehabilitation, organised
into Lots 1, 2 and 3 (in progress)
CAA Expansion and Capacity Building: There is a need for the capacity building of
technical personnel, especially with regard to Economic Regulation, Approved Training
Organisation (ATO) Certification, General Surveillance and Resolution of Safety
Concerns. (planning)
ZASTI Capacity Building: Four projects focused on bringing ZASTI up to international
standards as a centre of excellence for aviation training in the region (in progress)
Nationwide adaptation or design of road portions as emergency landing areas to facilitate
for the Zambia Aeronautical Search and Rescue Organisation (ZASARO): There is need
for nationwide adaptation or design of road portions as emergency landing areas for aircraft
in distress or search and rescue missions. The Road Development Agency (RDA) should be
mandated to spearhead this project. (planning)
Data Collection Survey on Nacala Corridor Integrated Development in Southern Africa Final Report
3-104
3.8.5 Waterway Sub-Sector
(1) Key Agencies for Waterway Sub-Sector
The Department of Maritime and Inland Waterways was established in the Ministry of
Communications and Transport by a Ministerial Administrative Directive in 1994 without any
legal instrument. However, the Harbour Master and the surveyor of Vessels are mandated
through Cap 466 of the laws of Zambia to enforce safety regulation on waterways and ports.
Plans are underway to review Inland Waterways Act Cap 466 and the Merchant Shipping Act
Cap 468 of the laws of Zambia. The Department is however responsible for all matters relating
to the Inland Water Transport and ports & shipping.
(2) Waterway Network
Zambia has an approximately 2,700 km network of navigational canals and waterways.
However, the water transport mode has not been utilized to a significant degree due to the lack
of maintenance of inland waterways and canals. Zambia has a large portion of its population
dependent on waterways for their basic transport needs. The management, regulation and
funding of this sub-sector is under the authority of the Department of Maritime and Inland
Waterways which is part of the MTC.
(3) Key Sector Development Project
Canals are a major issue in the navigability of Zambia’s waterways. This is especially the case
in swamp areas where changing water levels and canal conditions can cut off dependent
populations. Dredgers are used to clear canals but this equipment is in disrepair. A small
number of dredgers are able to work although their capacity is insufficient to keep up with
demand. Overall, the resources needed to maintain the canals in a good state of repair have not
been allocated. The following projects are ongoing.
Mupulungu Harbour Modernization: Complete modernization of Mupulungu Harbour on
Lake Tanganyika (in progress)
Port Terminal Facilities (Inland Container Depot, ICD) Rehabilitation Program: Dar es
Salaam - Mukuba Depot, Mumbasa Copper Yard, Walvis Bay ICD (privately financed) (in
progress)
Harbor rehabilitation projects: Projects distributed across Zambia for harbor rehabilitation:
Lake Tanganika, Lake Mweru, Lake Banguelu, Lake Kariba, Zambezi River, Kafue River,
Chambeshi River (in progress)
Canal Rehabilitation projects: Provincial canal projects distributed across Zambia
including a limited number of large scale canal projects (in progress)
Inland Waterways Master Plan: Long term strategy and prioritization of investments
(conceptual)
(4) Dry Port Project
Zambia does not have direct access to the sea. However, it does have numerous overland
connections to foreign ports. At the most important of these ports, Walvis Bay and the Port of
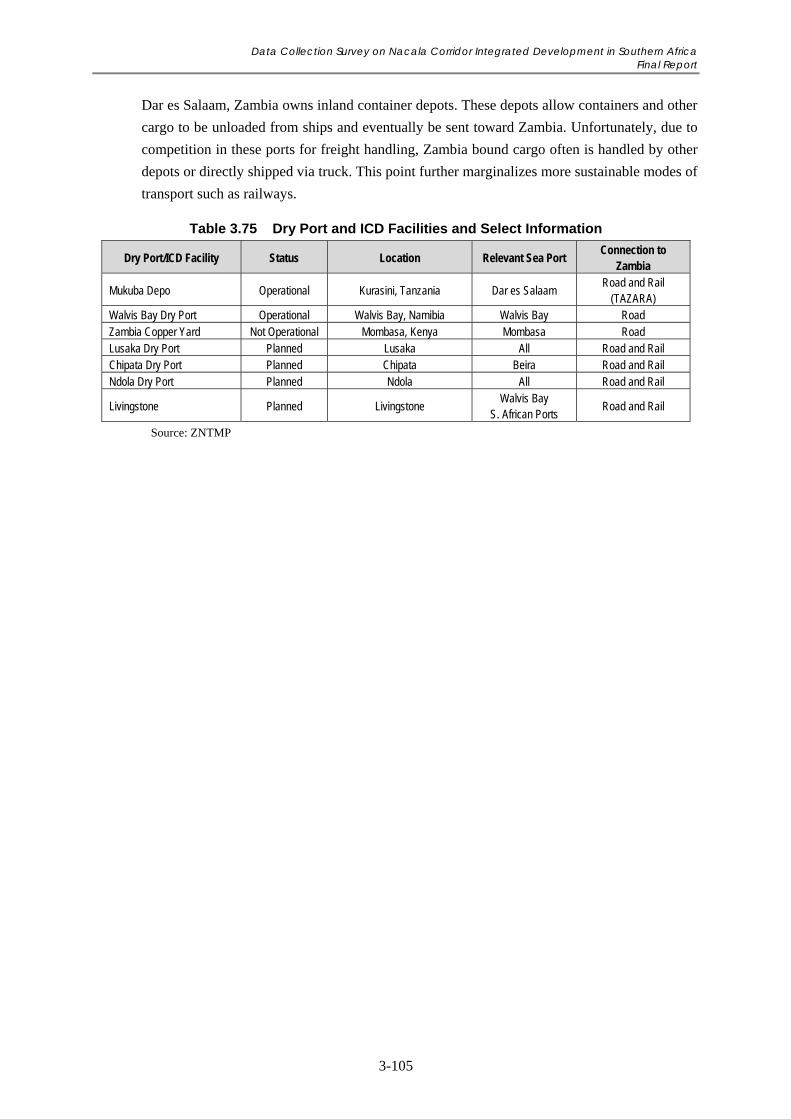
Data Collection Survey on Nacala Corridor Integrated Development in Southern Africa Final Report
3-105
Dar es Salaam, Zambia owns inland container depots. These depots allow containers and other
cargo to be unloaded from ships and eventually be sent toward Zambia. Unfortunately, due to
competition in these ports for freight handling, Zambia bound cargo often is handled by other
depots or directly shipped via truck. This point further marginalizes more sustainable modes of
transport such as railways.
Table 3.75 Dry Port and ICD Facilities and Select Information
Dry Port/ICD Facility Status Location Relevant Sea Port Connection to
Zambia
Mukuba Depo Operational Kurasini, Tanzania Dar es Salaam Road and Rail
(TAZARA) Walvis Bay Dry Port Operational Walvis Bay, Namibia Walvis Bay Road Zambia Copper Yard Not Operational Mombasa, Kenya Mombasa Road Lusaka Dry Port Planned Lusaka All Road and Rail Chipata Dry Port Planned Chipata Beira Road and Rail Ndola Dry Port Planned Ndola All Road and Rail
Livingstone Planned Livingstone Walvis Bay
S. African Ports Road and Rail
Source: ZNTMP
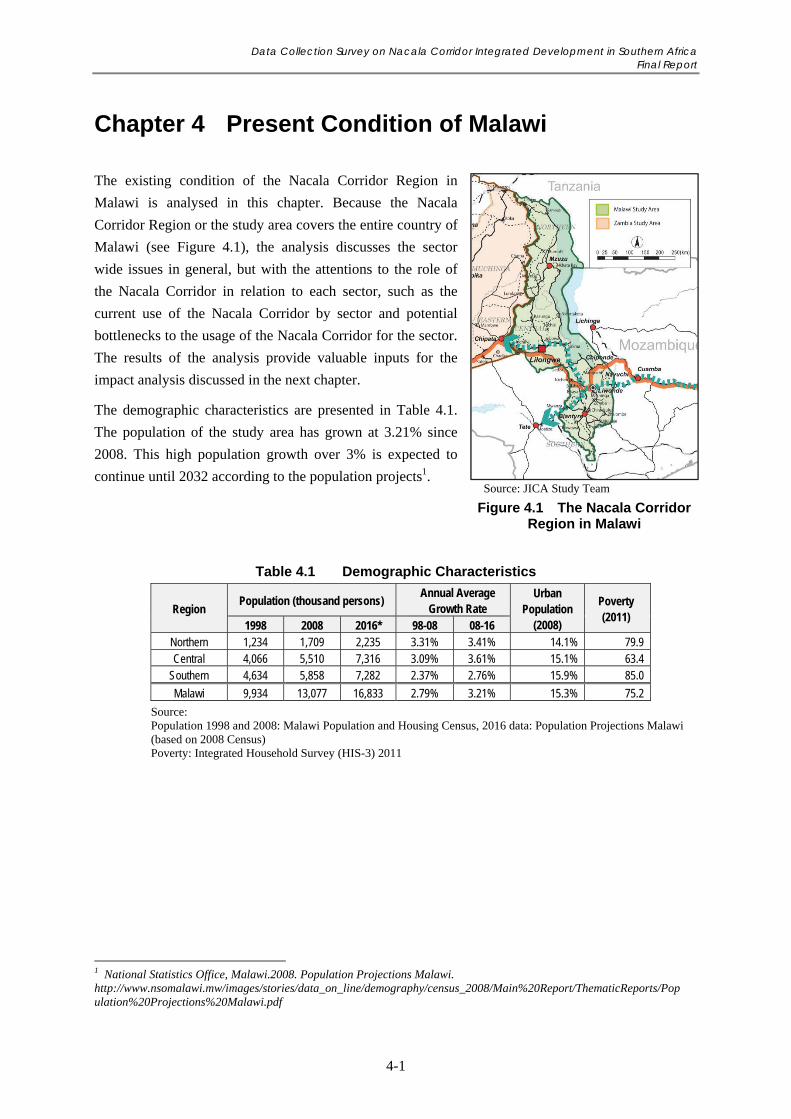
Data Collection Survey on Nacala Corridor Integrated Development in Southern Africa Final Report
4-1
Chapter 4 Present Condition of Malawi
The existing condition of the Nacala Corridor Region in
Malawi is analysed in this chapter. Because the Nacala
Corridor Region or the study area covers the entire country of
Malawi (see Figure 4.1), the analysis discusses the sector
wide issues in general, but with the attentions to the role of
the Nacala Corridor in relation to each sector, such as the
current use of the Nacala Corridor by sector and potential
bottlenecks to the usage of the Nacala Corridor for the sector.
The results of the analysis provide valuable inputs for the
impact analysis discussed in the next chapter.
The demographic characteristics are presented in Table 4.1.
The population of the study area has grown at 3.21% since
2008. This high population growth over 3% is expected to
continue until 2032 according to the population projects1.
Table 4.1 Demographic Characteristics
Region Population (thousand persons)
Annual Average Growth Rate
Urban Population
(2008)
Poverty (2011)
1998 2008 2016* 98-08 08-16 Northern 1,234 1,709 2,235 3.31% 3.41% 14.1% 79.9 Central 4,066 5,510 7,316 3.09% 3.61% 15.1% 63.4
Southern 4,634 5,858 7,282 2.37% 2.76% 15.9% 85.0
Malawi 9,934 13,077 16,833 2.79% 3.21% 15.3% 75.2
Source: Population 1998 and 2008: Malawi Population and Housing Census, 2016 data: Population Projections Malawi (based on 2008 Census) Poverty: Integrated Household Survey (HIS-3) 2011
1 National Statistics Office, Malawi.2008. Population Projections Malawi. http://www.nsomalawi.mw/images/stories/data_on_line/demography/census_2008/Main%20Report/ThematicReports/Population%20Projections%20Malawi.pdf
Source: JICA Study Team
Figure 4.1 The Nacala Corridor Region in Malawi
Data Collection Survey on Nacala Corridor Integrated Development in Southern Africa Final Report
4-2
4.1 Agriculture
4.1.1 Overview of the Agriculture2
Malawi is characterised as ‘an agriculture-based economy’. According to the 2016 Annual
Economic Report of Ministry of Finance, Economic Planning and Development in Malawi,
agriculture, including forestry and fishery, accounted for 28.6% of the GDP in 2015 and
generated over 80% of national export earnings in 2014. The 2013 Malawi Labour Force
Survey report indicates that agriculture employs 64.1% of the country’s workforce between
15-64 years.
The agriculture sector in Malawi is comprised of the small scale farmers operating less than 5
ha of land and the commercial agriculture (estate) sub-sector, with more than 70% of
agricultural GDP coming from small scale farmers. These farmers mostly grow food crops,
such as maize, rice, cassava, sweet and irish potatoes, and legumes to meet the subsistence
requirements of their households, as well as cash crops, such as tobacco, tea, sugarcane and
coffee. The estate subsector focuses primarily on the commercial production of high-value
cash crops as tobacco, tea, sugarcane, coffee, and macadamia, all of which contribute
significantly to the agricultural exports of the country. The estate subsector also provides
opportunities of contract farming called Out-grower Scheme for small scale farmers.
The total land area under cultivation is about 2.5 million ha, of which 0.1 million ha are
irrigated as of 2014. Most of crop production is practiced under rain-fed condition and
affected by erratic rain, drought and flood as well as by low access of farm inputs and
agricultural technologies. Hence the crop production and productivity always low, which is a
critical issue in the country.
In the light of current situation and in alignment with several international agreements and
protocols on agriculture, including CAADP and regional commitments under SADC and the
COMESA, the National Agriculture Policy in Malawi (NAP) defined the vision for
development of the agricultural sector in Malawi for the five years (2016 to 2020). The
emphasis of this policy is on achieving farmer-led agriculture transformation and
commercialization that entails treating farming as a business.
4.1.2 Agriculture Condition
(1) Land Use and Availability
The arable land is mostly used for agriculture production by small scale farmers under rain-fed
conditions in Malawi. The country has approximately 12 million ha of which 2.4 million ha is
water area thus 9.4 million is land. Among the land area, according to the FAO data in 2014,
about 60% of total land is used for agriculture (5.9 million ha), 34% is forestry (1.7 million ha)
and 6% is for other use (0.4 million ha) 3. With the increasing human population recently, the
2 Based on the Ministry of Agriculture, Irrigation and Water Development (MOAIWD,) “National Agriculture Policy”, September 2016. 3 FAOSTAT Country Indicators (http://www.fao.org/faostat/en/#country/130)
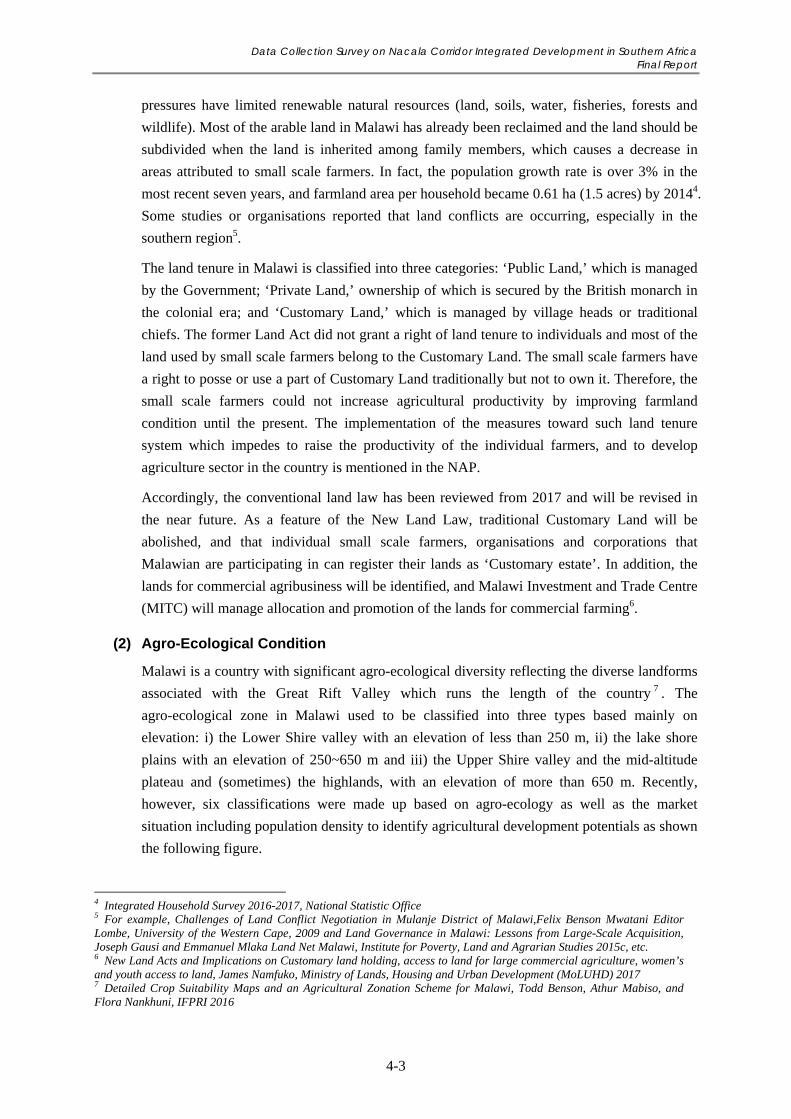
Data Collection Survey on Nacala Corridor Integrated Development in Southern Africa Final Report
4-3
pressures have limited renewable natural resources (land, soils, water, fisheries, forests and
wildlife). Most of the arable land in Malawi has already been reclaimed and the land should be
subdivided when the land is inherited among family members, which causes a decrease in
areas attributed to small scale farmers. In fact, the population growth rate is over 3% in the
most recent seven years, and farmland area per household became 0.61 ha (1.5 acres) by 20144.
Some studies or organisations reported that land conflicts are occurring, especially in the
southern region5.
The land tenure in Malawi is classified into three categories: ‘Public Land,’ which is managed
by the Government; ‘Private Land,’ ownership of which is secured by the British monarch in
the colonial era; and ‘Customary Land,’ which is managed by village heads or traditional
chiefs. The former Land Act did not grant a right of land tenure to individuals and most of the
land used by small scale farmers belong to the Customary Land. The small scale farmers have
a right to posse or use a part of Customary Land traditionally but not to own it. Therefore, the
small scale farmers could not increase agricultural productivity by improving farmland
condition until the present. The implementation of the measures toward such land tenure
system which impedes to raise the productivity of the individual farmers, and to develop
agriculture sector in the country is mentioned in the NAP.
Accordingly, the conventional land law has been reviewed from 2017 and will be revised in
the near future. As a feature of the New Land Law, traditional Customary Land will be
abolished, and that individual small scale farmers, organisations and corporations that
Malawian are participating in can register their lands as ‘Customary estate’. In addition, the
lands for commercial agribusiness will be identified, and Malawi Investment and Trade Centre
(MITC) will manage allocation and promotion of the lands for commercial farming6.
(2) Agro-Ecological Condition
Malawi is a country with significant agro-ecological diversity reflecting the diverse landforms
associated with the Great Rift Valley which runs the length of the country 7 . The
agro-ecological zone in Malawi used to be classified into three types based mainly on
elevation: i) the Lower Shire valley with an elevation of less than 250 m, ii) the lake shore
plains with an elevation of 250~650 m and iii) the Upper Shire valley and the mid-altitude
plateau and (sometimes) the highlands, with an elevation of more than 650 m. Recently,
however, six classifications were made up based on agro-ecology as well as the market
situation including population density to identify agricultural development potentials as shown
the following figure.
4 Integrated Household Survey 2016-2017, National Statistic Office 5 For example, Challenges of Land Conflict Negotiation in Mulanje District of Malawi,Felix Benson Mwatani Editor Lombe, University of the Western Cape, 2009 and Land Governance in Malawi: Lessons from Large-Scale Acquisition, Joseph Gausi and Emmanuel Mlaka Land Net Malawi, Institute for Poverty, Land and Agrarian Studies 2015c, etc. 6 New Land Acts and Implications on Customary land holding, access to land for large commercial agriculture, women’s and youth access to land, James Namfuko, Ministry of Lands, Housing and Urban Development (MoLUHD) 2017 7 Detailed Crop Suitability Maps and an Agricultural Zonation Scheme for Malawi, Todd Benson, Athur Mabiso, and Flora Nankhuni, IFPRI 2016
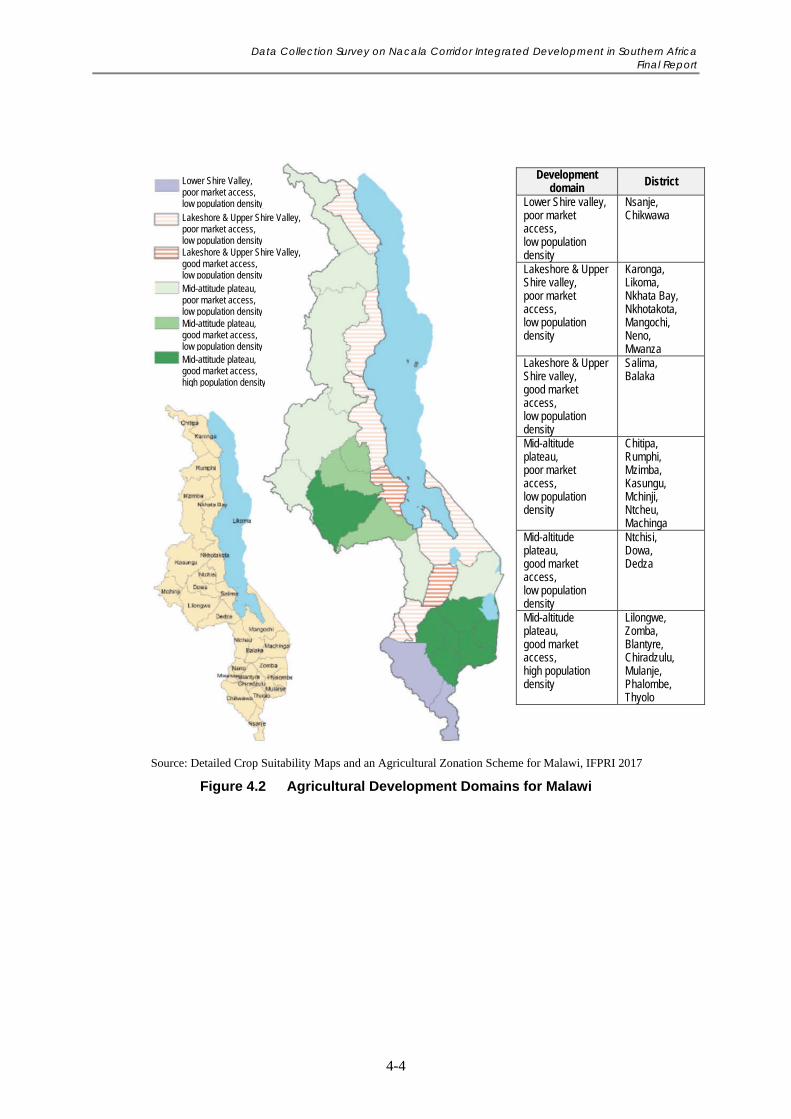
Data Collection Survey on Nacala Corridor Integrated Development in Southern Africa Final Report
4-4
Source: Detailed Crop Suitability Maps and an Agricultural Zonation Scheme for Malawi, IFPRI 2017
Figure 4.2 Agricultural Development Domains for Malawi
Development domain District
Lower Shire valley, poor market access, low population density
Nsanje, Chikwawa
Lakeshore & Upper Shire valley, poor market access, low population density
Karonga, Likoma, Nkhata Bay, Nkhotakota, Mangochi, Neno, Mwanza
Lakeshore & Upper Shire valley, good market access, low population density
Salima, Balaka
Mid-altitude plateau, poor market access, low population density
Chitipa, Rumphi, Mzimba, Kasungu, Mchinji, Ntcheu, Machinga
Mid-altitude plateau, good market access, low population density
Ntchisi, Dowa, Dedza
Mid-altitude plateau, good market access, high population density
Lilongwe, Zomba, Blantyre, Chiradzulu, Mulanje, Phalombe, Thyolo
Lower Shire Valley, poor market access, low population density Lakeshore & Upper Shire Valley, poor market access, low population density Lakeshore & Upper Shire Valley, good market access, low population density Mid-attitude plateau, poor market access, low population density Mid-attitude plateau, good market access, low population density Mid-attitude plateau, good market access, high population density
Data Collection Survey on Nacala Corridor Integrated Development in Southern Africa Final Report
4-5
(3) Water Resources8
It is said that Malawi has significant
volume of water resources, which are
stocked in its lakes, rivers and aquifers.
However, as the surface water is limited,
seasonally distributed and increasingly
becoming scarce, it utilisation is competed
over by individuals and various social and
economic sectors due to population
pressure, deforestation and successive
droughts by climate change.
About 3,000 cubic metres of water per
capita are renewed by rainfall etc. in rivers
and lakes annually. However, only 300
cubic metres per capita are available in the
dry season due to seasonal variable
distribution of rainfall and water
resources9.
On the other hand, groundwater sources are widespread throughout the country but have not
been well developed. The development and utilisation and management of groundwater lacked
sustainable strategies for a long time. In accordance with the Water Resources Act in 2013, the
National Water Resources Authority (NWRA) was established to control and manage the
country’s water resources10. For agriculture purposes, it will be expected to use abundant
water resources properly to promote irrigated agriculture and fisheries.
4.1.3 Structure of Agriculture Producers
More than 98% of agriculture producers are small scale farmers with less than 5 ha of
farmland and a small number of large farmers and firms called estate subsectors in Malawi.
In order to obtain staple food, 80% of small scale farmers focus on growing maize and to some
extent legumes and vegetables interred or mixed in maize field under a ‘Maize Based Farming
System’. In fact, maize production occupied 67% of all cultivated land by 2014 and
approximately 80% shared by staple crop production including maize, cassava and rice. As a
cash crop, tobacco is grown dominantly the same as maize, which shares about 55% of all
income from agricultural export in 201511. However, the demand of tobacco has been
decreasing. In Malawi, there are few cash crops can be replaced to the tobacco and other cash
8 Analysis of water governance in Malawi: Towards as favourable enable environment?, Journal of Water, Sanitation and Hygiene for development, June 2014 9 Policies Influencing Patterns of use of Water Resources in Malawi, D. H. Ng'ong'ola Mvalo & Company, Legal Practitioners and Consultants,1999 10 Water Resources Act 2013, Parliament 15th March 2013, Government of Malawi 11 UN Comtrade, https://comtrade.un.org/data/
Source: Journal of Water, Sanitation and Hygiene for development
Figure 4.3 Distribution of Water
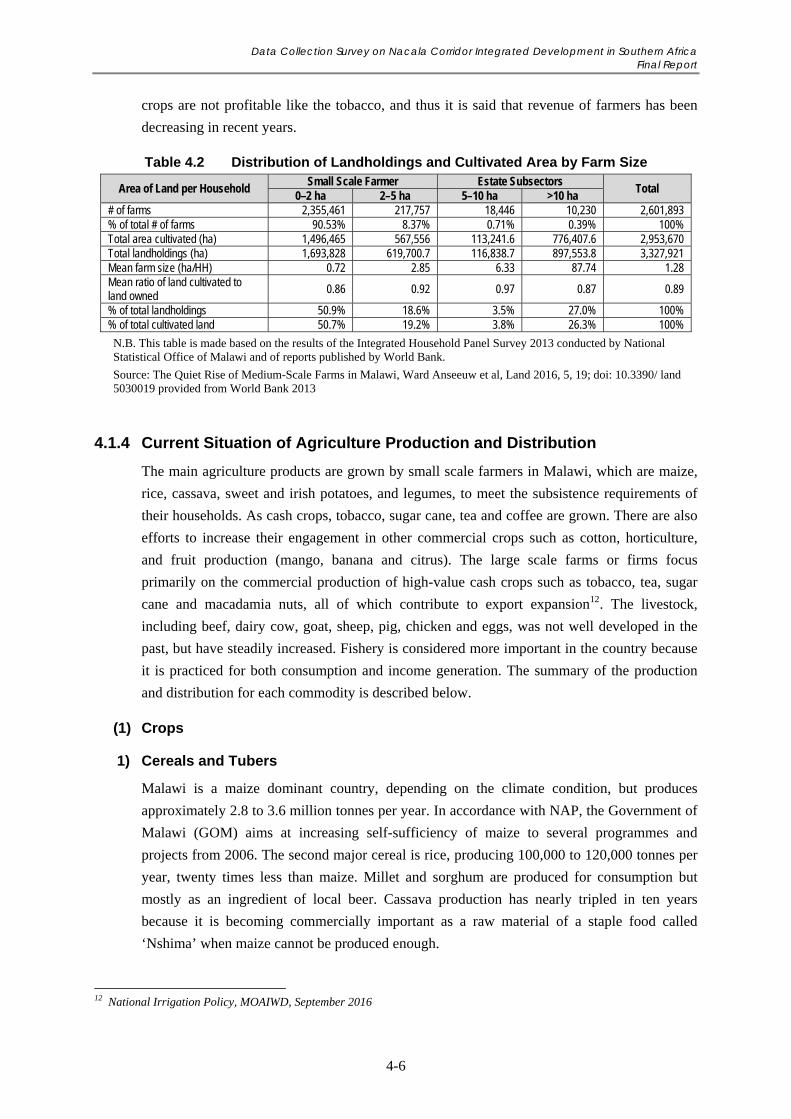
Data Collection Survey on Nacala Corridor Integrated Development in Southern Africa Final Report
4-6
crops are not profitable like the tobacco, and thus it is said that revenue of farmers has been
decreasing in recent years.
Table 4.2 Distribution of Landholdings and Cultivated Area by Farm Size
Area of Land per Household Small Scale Farmer Estate Subsectors
Total 0–2 ha 2–5 ha 5–10 ha >10 ha
# of farms 2,355,461 217,757 18,446 10,230 2,601,893 % of total # of farms 90.53% 8.37% 0.71% 0.39% 100% Total area cultivated (ha) 1,496,465 567,556 113,241.6 776,407.6 2,953,670 Total landholdings (ha) 1,693,828 619,700.7 116,838.7 897,553.8 3,327,921 Mean farm size (ha/HH) 0.72 2.85 6.33 87.74 1.28 Mean ratio of land cultivated to land owned
0.86 0.92 0.97 0.87 0.89
% of total landholdings 50.9% 18.6% 3.5% 27.0% 100% % of total cultivated land 50.7% 19.2% 3.8% 26.3% 100%
N.B. This table is made based on the results of the Integrated Household Panel Survey 2013 conducted by National Statistical Office of Malawi and of reports published by World Bank.
Source: The Quiet Rise of Medium-Scale Farms in Malawi, Ward Anseeuw et al, Land 2016, 5, 19; doi: 10.3390/ land 5030019 provided from World Bank 2013
4.1.4 Current Situation of Agriculture Production and Distribution
The main agriculture products are grown by small scale farmers in Malawi, which are maize,
rice, cassava, sweet and irish potatoes, and legumes, to meet the subsistence requirements of
their households. As cash crops, tobacco, sugar cane, tea and coffee are grown. There are also
efforts to increase their engagement in other commercial crops such as cotton, horticulture,
and fruit production (mango, banana and citrus). The large scale farms or firms focus
primarily on the commercial production of high-value cash crops such as tobacco, tea, sugar
cane and macadamia nuts, all of which contribute to export expansion12. The livestock,
including beef, dairy cow, goat, sheep, pig, chicken and eggs, was not well developed in the
past, but have steadily increased. Fishery is considered more important in the country because
it is practiced for both consumption and income generation. The summary of the production
and distribution for each commodity is described below.
(1) Crops
1) Cereals and Tubers
Malawi is a maize dominant country, depending on the climate condition, but produces
approximately 2.8 to 3.6 million tonnes per year. In accordance with NAP, the Government of
Malawi (GOM) aims at increasing self-sufficiency of maize to several programmes and
projects from 2006. The second major cereal is rice, producing 100,000 to 120,000 tonnes per
year, twenty times less than maize. Millet and sorghum are produced for consumption but
mostly as an ingredient of local beer. Cassava production has nearly tripled in ten years
because it is becoming commercially important as a raw material of a staple food called
‘Nshima’ when maize cannot be produced enough.
12 National Irrigation Policy, MOAIWD, September 2016
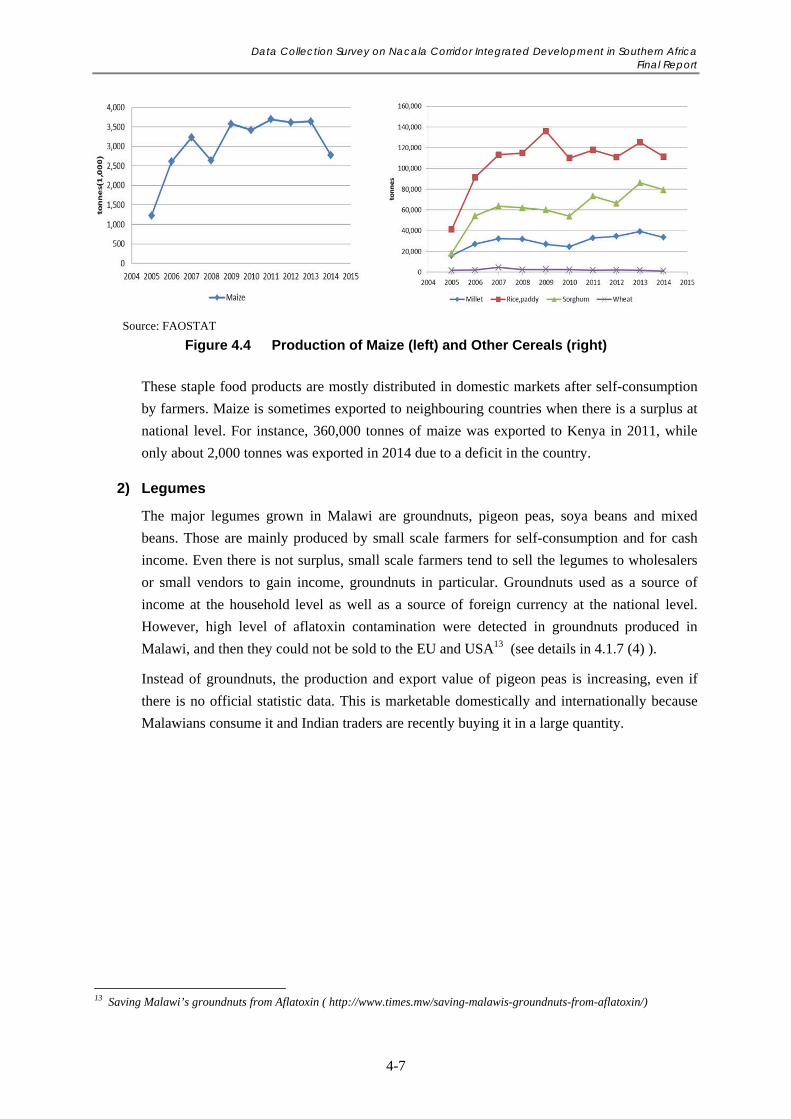
Data Collection Survey on Nacala Corridor Integrated Development in Southern Africa Final Report
4-7
Source: FAOSTAT
Figure 4.4 Production of Maize (left) and Other Cereals (right)
These staple food products are mostly distributed in domestic markets after self-consumption
by farmers. Maize is sometimes exported to neighbouring countries when there is a surplus at
national level. For instance, 360,000 tonnes of maize was exported to Kenya in 2011, while
only about 2,000 tonnes was exported in 2014 due to a deficit in the country.
2) Legumes
The major legumes grown in Malawi are groundnuts, pigeon peas, soya beans and mixed
beans. Those are mainly produced by small scale farmers for self-consumption and for cash
income. Even there is not surplus, small scale farmers tend to sell the legumes to wholesalers
or small vendors to gain income, groundnuts in particular. Groundnuts used as a source of
income at the household level as well as a source of foreign currency at the national level.
However, high level of aflatoxin contamination were detected in groundnuts produced in
Malawi, and then they could not be sold to the EU and USA13 (see details in 4.1.7 (4) ).
Instead of groundnuts, the production and export value of pigeon peas is increasing, even if
there is no official statistic data. This is marketable domestically and internationally because
Malawians consume it and Indian traders are recently buying it in a large quantity.
13 Saving Malawi’s groundnuts from Aflatoxin ( http://www.times.mw/saving-malawis-groundnuts-from-aflatoxin/)
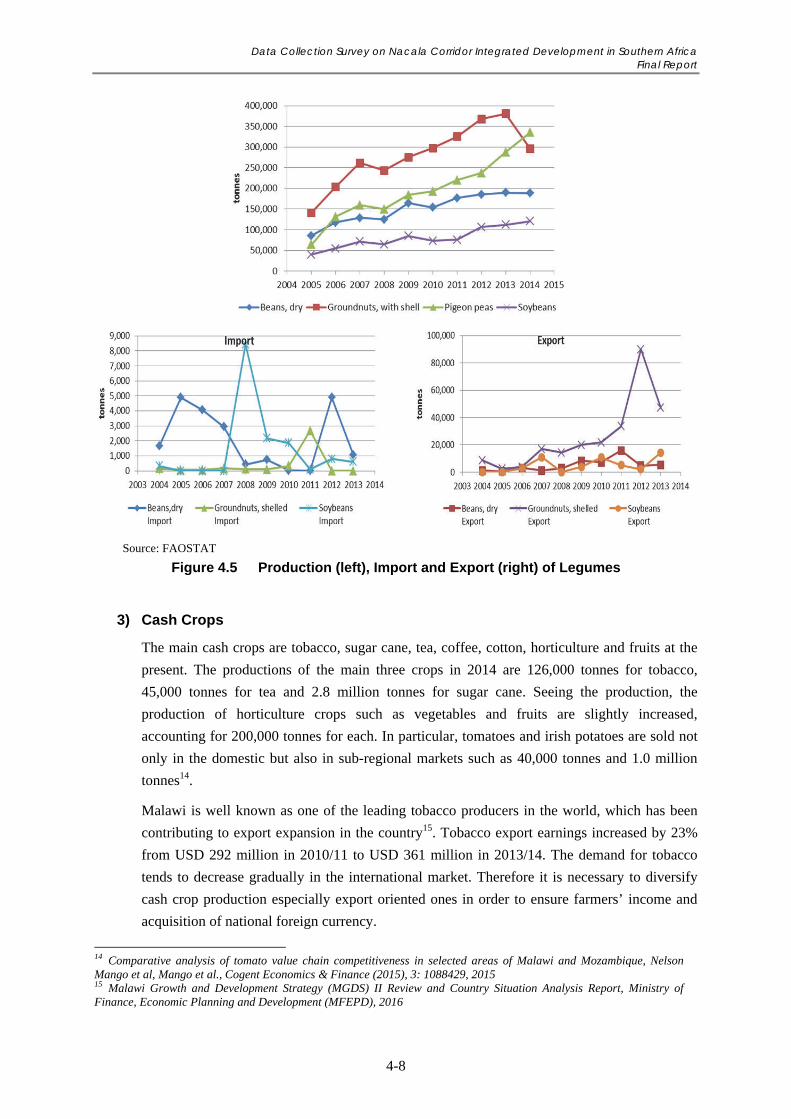
Data Collection Survey on Nacala Corridor Integrated Development in Southern Africa Final Report
4-8
Source: FAOSTAT
Figure 4.5 Production (left), Import and Export (right) of Legumes
3) Cash Crops
The main cash crops are tobacco, sugar cane, tea, coffee, cotton, horticulture and fruits at the
present. The productions of the main three crops in 2014 are 126,000 tonnes for tobacco,
45,000 tonnes for tea and 2.8 million tonnes for sugar cane. Seeing the production, the
production of horticulture crops such as vegetables and fruits are slightly increased,
accounting for 200,000 tonnes for each. In particular, tomatoes and irish potatoes are sold not
only in the domestic but also in sub-regional markets such as 40,000 tonnes and 1.0 million
tonnes14.
Malawi is well known as one of the leading tobacco producers in the world, which has been
contributing to export expansion in the country15. Tobacco export earnings increased by 23%
from USD 292 million in 2010/11 to USD 361 million in 2013/14. The demand for tobacco
tends to decrease gradually in the international market. Therefore it is necessary to diversify
cash crop production especially export oriented ones in order to ensure farmers’ income and
acquisition of national foreign currency.
14 Comparative analysis of tomato value chain competitiveness in selected areas of Malawi and Mozambique, Nelson Mango et al, Mango et al., Cogent Economics & Finance (2015), 3: 1088429, 2015 15 Malawi Growth and Development Strategy (MGDS) II Review and Country Situation Analysis Report, Ministry of Finance, Economic Planning and Development (MFEPD), 2016
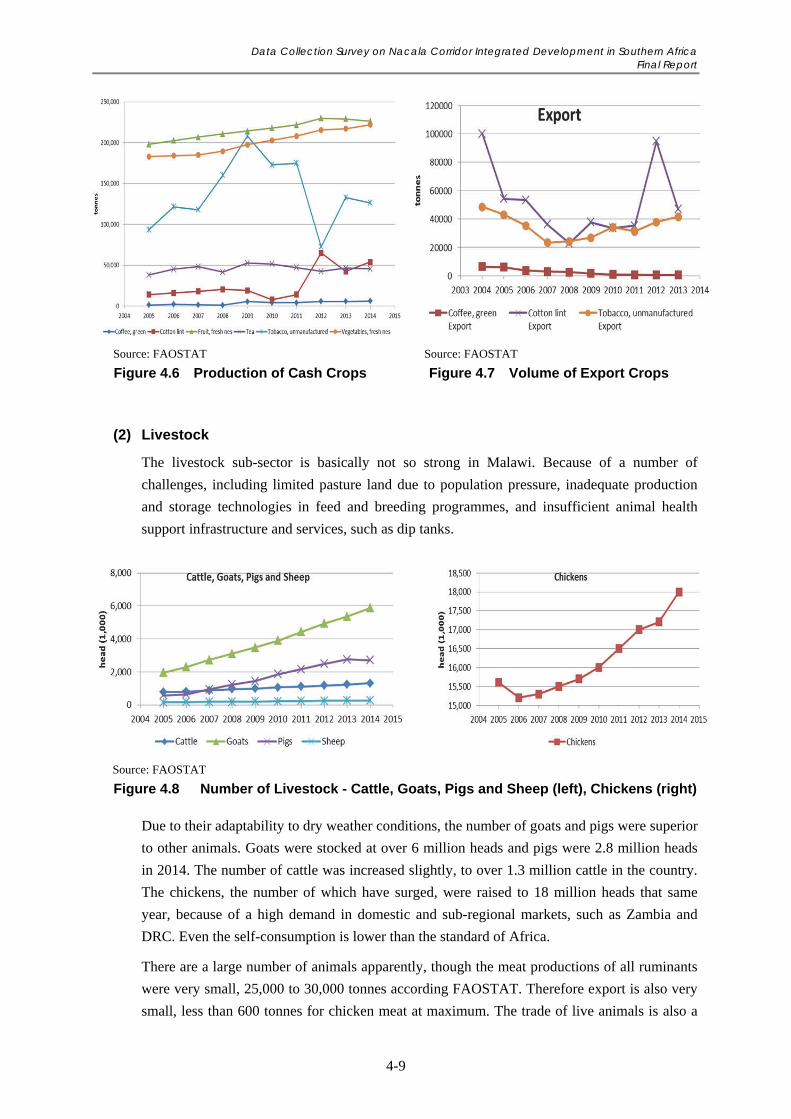
Data Collection Survey on Nacala Corridor Integrated Development in Southern Africa Final Report
4-9
Source: FAOSTAT
Figure 4.6 Production of Cash Crops
Source: FAOSTAT
Figure 4.7 Volume of Export Crops
(2) Livestock
The livestock sub-sector is basically not so strong in Malawi. Because of a number of
challenges, including limited pasture land due to population pressure, inadequate production
and storage technologies in feed and breeding programmes, and insufficient animal health
support infrastructure and services, such as dip tanks.
Source: FAOSTAT
Figure 4.8 Number of Livestock - Cattle, Goats, Pigs and Sheep (left), Chickens (right)
Due to their adaptability to dry weather conditions, the number of goats and pigs were superior
to other animals. Goats were stocked at over 6 million heads and pigs were 2.8 million heads
in 2014. The number of cattle was increased slightly, to over 1.3 million cattle in the country.
The chickens, the number of which have surged, were raised to 18 million heads that same
year, because of a high demand in domestic and sub-regional markets, such as Zambia and
DRC. Even the self-consumption is lower than the standard of Africa.
There are a large number of animals apparently, though the meat productions of all ruminants
were very small, 25,000 to 30,000 tonnes according FAOSTAT. Therefore export is also very
small, less than 600 tonnes for chicken meat at maximum. The trade of live animals is also a
Data Collection Survey on Nacala Corridor Integrated Development in Southern Africa Final Report
4-10
small number, less than 300 heads of cattle. Both small scale farmers and estate subsectors are
involved in animal production, with more intensive production systems found on estate farms.
(3) Fishery
The fishery sub-sector could have been developed in Malawi since one fifth of national land is
water area, but the production of commercial fishery has not been increased until the present.
One of the major problems identified with commercial aquaculture is that the species cultured
are slow growing and have a poor feed conversion, making the products of aquaculture
expensive to produce16.
The fish production in capture fisheries varies annually with estimates by year, but averaging
70,000 tonnes per year. The estimated fish production has increased for the past decade mainly
due to the promotion of offshore deep water fishing in Lake Malawi. The aquaculture has not
been developed even though it has potential for fishery development in order to increase the
production. Thus fish production by the aquaculture has estimated at 4,800 tonnes in 2014,
even total fish production was reached around 100,000 tonnes17.
The fish provided 70% of the animal protein intake of the Malawi population and 40% of total
protein supply for the country twenty years ago. These figures have declined as rapid
population growth over the last thirty years. The per capita consumption of fish in Malawi has
subsequently fallen by more than 60%, from 14 kg per person per year in the 1970s, to about
5.6 kg in 201118.
(4) Forestry
The forests plays a critical role in the country, the same as other sub-Saharan countries, as a
source of food and livelihood; timber, fruit, firewood, and charcoal production, etc.
As mentioned above, Malawi’s forest cover is about 3.2 million ha, 34% of the total land area
in 2014, while 13% of forest has disappeared compared to 5.6 million ha, 47% of the total land
in 197519. That deforestation is the major challenge associated with land cleaning (slash and
burn) and the increasing demand for charcoal and firewood as fuel20.
In the light of this situation, the GOM has been promoting plantation and agroforestry, which
can improve soil fertility, reduce soil erosion, and help addressing climate change.
Nevertheless, the adoption of agroforestry among farmers is low due to the long time horizon
for obtaining a return on the investments in trees.
16 National Agriculture Policy, MOAIWD, September 2016 17 National Agriculture Policy, MOAIWD, September 2016 18 National Fisheries Policy 2012-2017, Ministry of Agriculture and Food Security (former name of MOAIWD), 2012 19 Status of Forests and Tree Management in Malawi, Coordination Union for Rehabilitation of the Environment (CURE),2010 20 National Agriculture Policy, MOAIWD, September 2016
Data Collection Survey on Nacala Corridor Integrated Development in Southern Africa Final Report
4-11
4.1.5 Agribusiness Clusters and Players
Since the national economy in Malawi is dependent on agriculture, related business is
developed in the country. The major stakeholders of agribusiness are suppliers of agricultural
inputs and materials, farmers producing primary products, large scale agro-processing
industries, retailers, and transport companies. Farmers produce primary products in rural areas,
while medium and large companies, which sell agricultural inputs, trade commodities or
process foods in a large quantity, are located in urban areas such as Lilongwe and Blantyre, or
primary production places such as Salima. Agro-dealers, who sell agricultural inputs and also
trade as a retailer or wholesaler are located in rural areas, but some of them do not function
well due to the lack of financial sources and business capacity21. Instead of agribusiness
companies, National Smallholder Farmers Association (NASFAM) and Farmers Union of
Malawi (FUM) are trying to provide agricultural inputs and technical and marketing services
in rural areas22. Brief situations of agribusiness clusters (or supply chain players) are described
below.
(1) Agricultural Input and Machinery Suppliers
Farmers World is one of the biggest Malawian agribusiness companies providing farming
inputs and technical services in cooperation with the governmental and non-governmental
programmes and projects. Most farmers obtain farming input through NASFAM, FUM or
governmental projects such as the Fertiliser Support Programme (see 4.1.6 (2) 4)), or purchase
those inputs within the realms of possibility in financial source or market accessibility. More
than the financial situation of individual farmers, it should be noted that the inputs, especially
fertiliser, are too expensive for small scale farmers to obtain due to transportation cost; there is
no fertiliser manufacturing companies in Malawi. All input, equipment and machinery are
imported mainly from South Africa, EU and Asia, such as India and China, recently.
(2) Primary Producers
As mentioned above, most of the exported commodities are primary products such as tobacco,
tea, sugar, coffee, maize, rice and groundnuts. The number of medium and large scale
producers is increasing in Malawi recently by consolidating small scale farmers’ land by
themselves or the government for producing certain quantity of products. The small scale
farmers used to sell their agriculture products to small vendors or agro dealers individually
right after harvesting, but there are several types of production and marketing methods
recently. For example, the small scale farmers grow and trade under the In-grower23 or
Out-grower Scheme associating with commercial farms or trading or processing firms, or
21 Agribusiness SMEs in Malawi, USAID, 2014 22 According to interview with NASFAM and FUM 23 The out-grower is an individual farmer or farmers groups which agree on trading agriculture products with a company, whereas the in-grower is a farmer who grows certain products autonomously using farm field, technical services and inputs provided by landowner (large scale farmer or company). Generally the products or the amount sold are shared in a certain percentage(i.g. 50:50) between in-grower and the land owner, which is similar to ‘Tenant Farmer’ in Japan, (Reference: Grow Africa Smallholder working Group Briefing paper "Women smallholders" :https://www.growafrica.com/groups/smallholder-working-group-briefing-paper-women-smallholders)
Data Collection Survey on Nacala Corridor Integrated Development in Southern Africa Final Report
4-12
collective selling with farmers associations or cooperatives, or selling products through private
wholesalers such as the Agricultural Development and Marketing Corporation (ADMARC)
and commodity exchanges companies (see detail in the sections below).
(3) Agro Processing Industry Firms
Except sugar processed in the southern region, Malawi has been mostly exporting the primary
commodities for the gain of foreign currency. In recent years, several agro- processing
companies are established in major cities such as Blantyre, Lilongwe and Salima.
In the case of cooking oil, only traders which are permitted to import by the GOM can import
the cooking oil. Such import licenced traders are mainly based in Blantyre and distribute their
products to the whole country. Small and medium enterprises (SMEs), which occupy 90% of
all manufactures24, are starting to process cooking oil to supply domestic and regional markets
at present25.
The agro processing industry has been active in Salima in the Central Region. Mtalimanja
Holdings has been producing, threshing, polishing and selling rice in Nkhotakota since its
establishment in 2011. 10,000 farmer households which are formed into four cooperatives are
producing rice as out growers under the contract with the company. With the assistance of the
land procurement by the Green Belt Initiative (GBI, see details in 4.1.6), the Malawi Mangoes
(operation) Limited established also in 2011 focuses on producing fruit juice with high market
value such as mango juice, and have established a new value chain of mango juice including a
network of mango farmers. Salima Sugar Company was established in 2016 with the
assistance of the GBI as PPP between an Indian company and the GOM for sugar production
mainly for exporting to regional markets.
(4) Retailers
Currently many grocery retailers run businesses in Malawi. Most of the supermarkets are from
South Africa such as Shoprite, Game and Spar, but Chipiku store is originally from Malawi.
Those supermarkets purchase local products at the present such as perishable commodities;
vegetables, fruits, meat and fish and grocery food such as maize flour, wheat flour and
cooking oil. Additionally the Chipiku store purchases confectioneries such as biscuits, candy
and chewing gum from South Africa and Zambia because these are not produced in the
country.
(5) Trading Companies
Thousands of commodity traders are running their own businesses formally and informally in
Malawi and in regional markets. Since most of the agribusiness players are small scale farmers
and SEMs in Malawi, there is particularity of trade system of commodities.
24 Malawi Country Commercial Guide, https://www.export.gov/article?id=Malawi-agricultural-products 25 Trade Policy Reviews, Government of Malawi and WTO, 2016
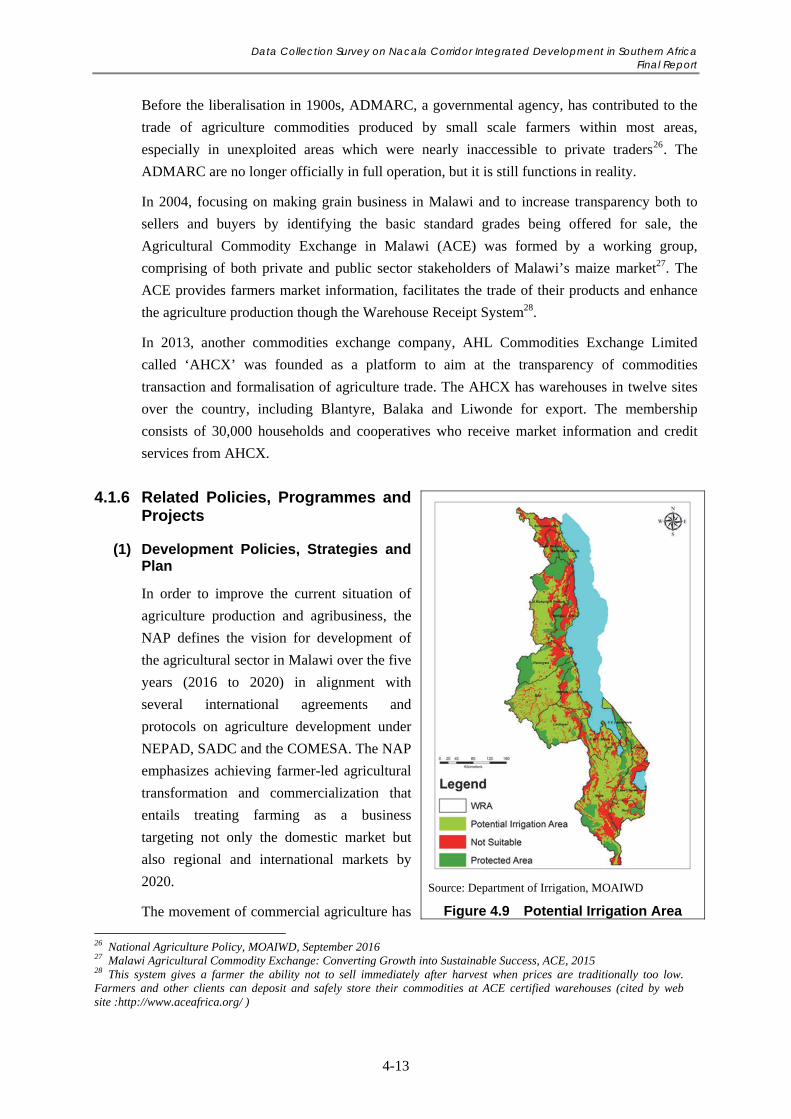
Data Collection Survey on Nacala Corridor Integrated Development in Southern Africa Final Report
4-13
Before the liberalisation in 1900s, ADMARC, a governmental agency, has contributed to the
trade of agriculture commodities produced by small scale farmers within most areas,
especially in unexploited areas which were nearly inaccessible to private traders26. The
ADMARC are no longer officially in full operation, but it is still functions in reality.
In 2004, focusing on making grain business in Malawi and to increase transparency both to
sellers and buyers by identifying the basic standard grades being offered for sale, the
Agricultural Commodity Exchange in Malawi (ACE) was formed by a working group,
comprising of both private and public sector stakeholders of Malawi’s maize market27. The
ACE provides farmers market information, facilitates the trade of their products and enhance
the agriculture production though the Warehouse Receipt System28.
In 2013, another commodities exchange company, AHL Commodities Exchange Limited
called ‘AHCX’ was founded as a platform to aim at the transparency of commodities
transaction and formalisation of agriculture trade. The AHCX has warehouses in twelve sites
over the country, including Blantyre, Balaka and Liwonde for export. The membership
consists of 30,000 households and cooperatives who receive market information and credit
services from AHCX.
4.1.6 Related Policies, Programmes and Projects
(1) Development Policies, Strategies and Plan
In order to improve the current situation of
agriculture production and agribusiness, the
NAP defines the vision for development of
the agricultural sector in Malawi over the five
years (2016 to 2020) in alignment with
several international agreements and
protocols on agriculture development under
NEPAD, SADC and the COMESA. The NAP
emphasizes achieving farmer-led agricultural
transformation and commercialization that
entails treating farming as a business
targeting not only the domestic market but
also regional and international markets by
2020.
The movement of commercial agriculture has
26 National Agriculture Policy, MOAIWD, September 2016 27 Malawi Agricultural Commodity Exchange: Converting Growth into Sustainable Success, ACE, 2015 28 This system gives a farmer the ability not to sell immediately after harvest when prices are traditionally too low. Farmers and other clients can deposit and safely store their commodities at ACE certified warehouses (cited by web site :http://www.aceafrica.org/ )
Source: Department of Irrigation, MOAIWD
Figure 4.9 Potential Irrigation Area
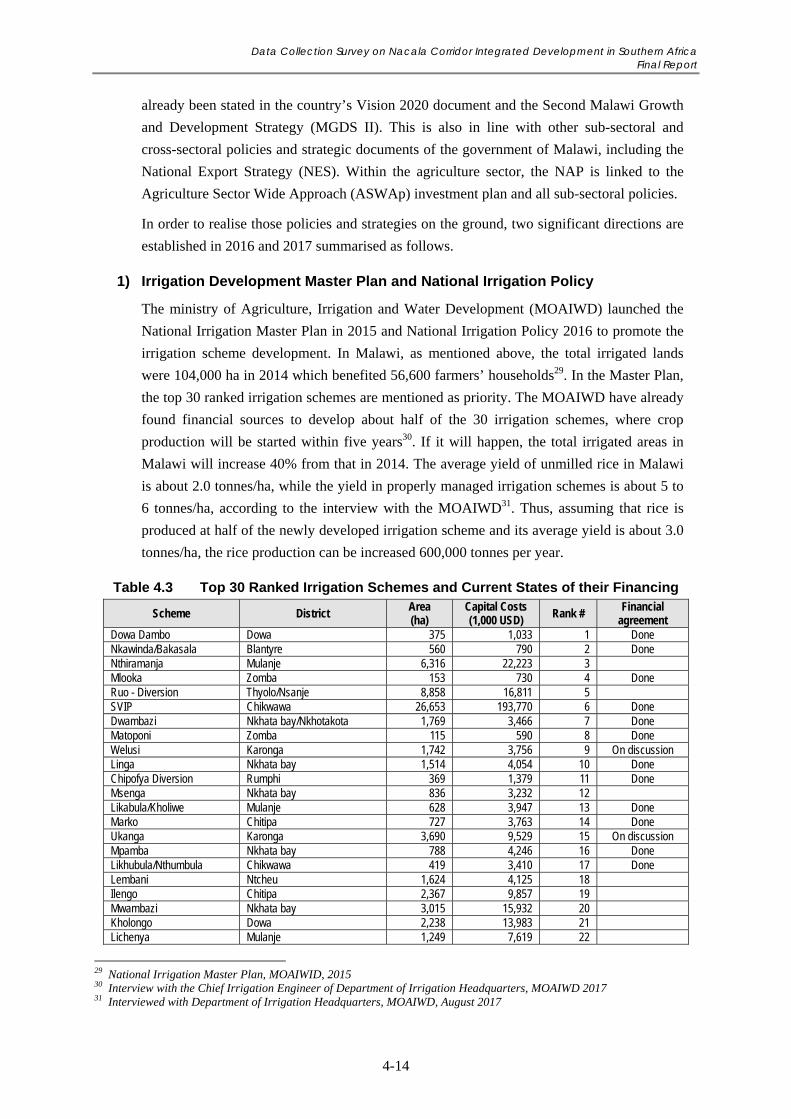
Data Collection Survey on Nacala Corridor Integrated Development in Southern Africa Final Report
4-14
already been stated in the country’s Vision 2020 document and the Second Malawi Growth
and Development Strategy (MGDS II). This is also in line with other sub-sectoral and
cross-sectoral policies and strategic documents of the government of Malawi, including the
National Export Strategy (NES). Within the agriculture sector, the NAP is linked to the
Agriculture Sector Wide Approach (ASWAp) investment plan and all sub-sectoral policies.
In order to realise those policies and strategies on the ground, two significant directions are
established in 2016 and 2017 summarised as follows.
1) Irrigation Development Master Plan and National Irrigation Policy
The ministry of Agriculture, Irrigation and Water Development (MOAIWD) launched the
National Irrigation Master Plan in 2015 and National Irrigation Policy 2016 to promote the
irrigation scheme development. In Malawi, as mentioned above, the total irrigated lands
were 104,000 ha in 2014 which benefited 56,600 farmers’ households29. In the Master Plan,
the top 30 ranked irrigation schemes are mentioned as priority. The MOAIWD have already
found financial sources to develop about half of the 30 irrigation schemes, where crop
production will be started within five years30. If it will happen, the total irrigated areas in
Malawi will increase 40% from that in 2014. The average yield of unmilled rice in Malawi
is about 2.0 tonnes/ha, while the yield in properly managed irrigation schemes is about 5 to
6 tonnes/ha, according to the interview with the MOAIWD31. Thus, assuming that rice is
produced at half of the newly developed irrigation scheme and its average yield is about 3.0
tonnes/ha, the rice production can be increased 600,000 tonnes per year.
Table 4.3 Top 30 Ranked Irrigation Schemes and Current States of their Financing
Scheme District Area (ha)
Capital Costs (1,000 USD)
Rank # Financial
agreement Dowa Dambo Dowa 375 1,033 1 Done Nkawinda/Bakasala Blantyre 560 790 2 Done Nthiramanja Mulanje 6,316 22,223 3 Mlooka Zomba 153 730 4 Done Ruo - Diversion Thyolo/Nsanje 8,858 16,811 5 SVIP Chikwawa 26,653 193,770 6 Done Dwambazi Nkhata bay/Nkhotakota 1,769 3,466 7 Done Matoponi Zomba 115 590 8 Done Welusi Karonga 1,742 3,756 9 On discussion Linga Nkhata bay 1,514 4,054 10 Done Chipofya Diversion Rumphi 369 1,379 11 Done Msenga Nkhata bay 836 3,232 12 Likabula/Kholiwe Mulanje 628 3,947 13 Done Marko Chitipa 727 3,763 14 Done Ukanga Karonga 3,690 9,529 15 On discussion Mpamba Nkhata bay 788 4,246 16 Done Likhubula/Nthumbula Chikwawa 419 3,410 17 Done Lembani Ntcheu 1,624 4,125 18 Ilengo Chitipa 2,367 9,857 19 Mwambazi Nkhata bay 3,015 15,932 20 Kholongo Dowa 2,238 13,983 21 Lichenya Mulanje 1,249 7,619 22
29 National Irrigation Master Plan, MOAIWID, 2015 30 Interview with the Chief Irrigation Engineer of Department of Irrigation Headquarters, MOAIWD 2017 31 Interviewed with Department of Irrigation Headquarters, MOAIWD, August 2017
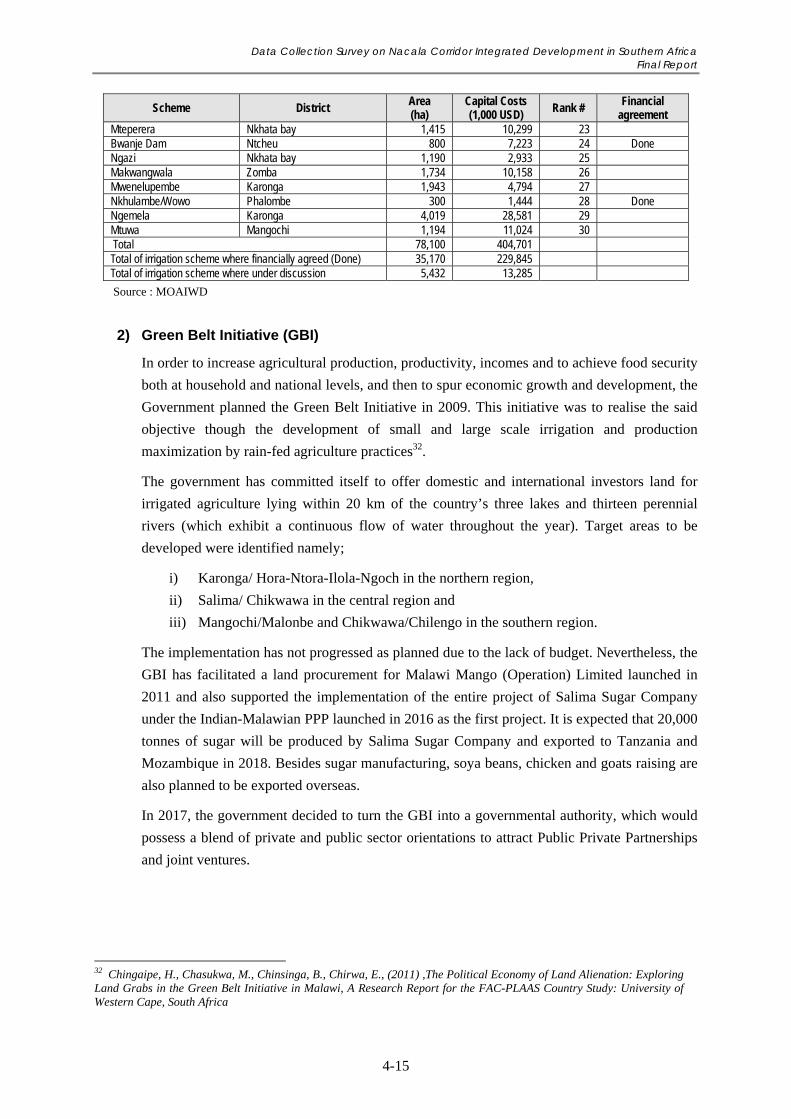
Data Collection Survey on Nacala Corridor Integrated Development in Southern Africa Final Report
4-15
Scheme District Area (ha)
Capital Costs (1,000 USD)
Rank # Financial
agreement Mteperera Nkhata bay 1,415 10,299 23 Bwanje Dam Ntcheu 800 7,223 24 Done Ngazi Nkhata bay 1,190 2,933 25 Makwangwala Zomba 1,734 10,158 26 Mwenelupembe Karonga 1,943 4,794 27 Nkhulambe/Wowo Phalombe 300 1,444 28 Done Ngemela Karonga 4,019 28,581 29 Mtuwa Mangochi 1,194 11,024 30 Total 78,100 404,701 Total of irrigation scheme where financially agreed (Done) 35,170 229,845 Total of irrigation scheme where under discussion 5,432 13,285
Source : MOAIWD
2) Green Belt Initiative (GBI)
In order to increase agricultural production, productivity, incomes and to achieve food security
both at household and national levels, and then to spur economic growth and development, the
Government planned the Green Belt Initiative in 2009. This initiative was to realise the said
objective though the development of small and large scale irrigation and production
maximization by rain-fed agriculture practices32.
The government has committed itself to offer domestic and international investors land for
irrigated agriculture lying within 20 km of the country’s three lakes and thirteen perennial
rivers (which exhibit a continuous flow of water throughout the year). Target areas to be
developed were identified namely;
i) Karonga/ Hora-Ntora-Ilola-Ngoch in the northern region,
ii) Salima/ Chikwawa in the central region and
iii) Mangochi/Malonbe and Chikwawa/Chilengo in the southern region.
The implementation has not progressed as planned due to the lack of budget. Nevertheless, the
GBI has facilitated a land procurement for Malawi Mango (Operation) Limited launched in
2011 and also supported the implementation of the entire project of Salima Sugar Company
under the Indian-Malawian PPP launched in 2016 as the first project. It is expected that 20,000
tonnes of sugar will be produced by Salima Sugar Company and exported to Tanzania and
Mozambique in 2018. Besides sugar manufacturing, soya beans, chicken and goats raising are
also planned to be exported overseas.
In 2017, the government decided to turn the GBI into a governmental authority, which would
possess a blend of private and public sector orientations to attract Public Private Partnerships
and joint ventures.
32 Chingaipe, H., Chasukwa, M., Chinsinga, B., Chirwa, E., (2011) ,The Political Economy of Land Alienation: Exploring Land Grabs in the Green Belt Initiative in Malawi, A Research Report for the FAC-PLAAS Country Study: University of Western Cape, South Africa
Data Collection Survey on Nacala Corridor Integrated Development in Southern Africa Final Report
4-16
(2) Development Projects and Programmes
Various projects are planned and implemented to develop the agriculture sector by the Malawi
government and donors. Some of these projects are expected to promote the utilization of the
Nacala Corridor, or to be promoted by the further utilization of the corridor. These are
described as follows.
1) Shire Valley Irrigation Project33
The Shire Valley Irrigation Project (SVIP) will be the largest single investment in the
agricultural sector in Malawi. The SVIP will ensure irrigated agriculture and stable production
not depended on rainfall. The SVIP is expected to be transformational investment not only for
the Shire Valley but also for Malawi by enabling fully commercial agricultural production
with irrigation, supporting establishment of land ownership for small scale farmers under the
modern land tenure system and utilising a private operator for the provision of irrigated water
supply services. The project lasts from 2017 to 2021, including detailed design, works,
construction supervision, community engagement, land demarcation, agricultural development,
support for farmers’ organisations and Out-grower Schemes, relocation and compensation of
affected households. The tentative total cost estimates currently stand at around USD 260
million covering an area of about 21,500 ha, which will be financed by the GOM, World Bank,
AfDB, other donors, funds and investment agencies.
2) Malawi Agricultural Commercialisation Project34
The objective of the Agricultural Commercialization Project for Malawi (AGCOM) is to
accelerate the commercialization of agriculture value chain products selected under the project,
with close synergy with the SVIP. This project is expected to support 70,000 farmers and 300
producer organisations. In order to create a conductive environment for farmers and
agribusinesses to operate in, the project will support last-mile infrastructure such as feeder
roads and electricity, as well as supporting agribusiness reforms and strengthening the
warehouse receipt system in Malawi. A major activity of the project will be to help establish
productive alliances between producer organisations, other value chain actors and product
off-takers. AGCOM will also support the creation of business enabling services by improving
access to finance, standards and certification, and trade facilitation. The project (USD 95
million) is funded from the World Bank’s International Development Association (IDA), and
is expected to close in 2023. It will be implemented under the joint leadership of the
MOAIWD and the Ministry of Industry, Trade and Tourism (MOITT).
3) Agro-Processing Special Economic Zone (AP-SEZ)
The MITC has planned to develop an Agro-Processing Special Economic Zone (AP-SEZ) in
order to support the promotion of commercial farming for priority crops identified in the NES.
33 World Bank, “Malawi: Shire Valley Irrigation Project (WB-P158805) Joint AfDB Preparation-WB/FAO Pre-Appraisal Mission (October 31-November 18, 2016)” 34 World Bank, “World Bank Helps Malawi Commercialize Agriculture”, May 23, 2017. (http://www.worldbank.org/en/news/press-release/2017/05/23/world-bank-helps-malawi-commercialize-agriculture)
Data Collection Survey on Nacala Corridor Integrated Development in Southern Africa Final Report
4-17
It aims at promoting value added products through the Nacala Corridor to Malawi's regional
markets comprising of Mozambique, Zambia, South Africa, DRC, Zimbabwe and Tanzania.
MITC has also established an office in Tete, Mozambique in order to facilitate exporting of
Malawi's products beyond Nacala corridor zones35.
The AP-SEZ was proposed to EIF (Enhanced Integrated Framework, a multi-donor financed
financial and technical support programme under the auspices of the WTO) in 2014, as a three
years project, costing around USD 3 million. It set three prioritized export-oriented clusters for
diversification: i) oil seed products : cooking oil, soaps, lubricants, fertilizer, snacks,
confectionery, etc., ii) sugar cane products : sugar, high value sugar through branding and
sugar confectionery, and iii) manufactures : beverages, agro-processing (including value added
dairy and maize, wheat, horticulture and legume products), plastics and packaging,
assembly36.
However, the proposal was rejected and the MITC is currently discussing with the World
Bank to revise the plan including candidate sites for SEZ, policy for operation, related
legislations and organisations of SEZ37.
4) Farm Inputs Subsidy Programme (FISP)
In order to enhance food self-sufficiency by small scale farmers, the FISP launched in 2005 to
enable farmers access to improved agricultural inputs such as fertiliser, hybrid seed and
pesticides at reduced prices in exchange of vouchers or coupons.
According to a country report FAO38, Maize productivity has risen significantly to two times
more and increased crop income 8.2% more than those who were not beneficiaries of the
programme. However, it is necessary to target and distribute the vouchers to the poorest and
most venerable farmers. The FISP is criticised as creating the dependency of farmers39 and
impeding private input market development40.
According to Review and Country Situation Analysis Report of MGDS II, a question is raised
whether to target to poorest and most venerable farmers or to focus more on high growth
sub-sectors with potential for more widespread benefits for a larger number of Malawians and
to generate higher agricultural value added. The latter approach would necessarily involve
35 AfDB,” Invitation to Express Interest in Consultancy Services – MALAWI - Agro-Processing Special Economic Zone (AP-SEZ)”, August 2, 2015 (https://www.afdb.org/en/documents/document/eoi-malawi-consultancy-services-agro-processing-special-economic-zone-ap-sez-08-2015-54796/); “MITC in awareness campaign drive on value-added export amid COMESA and SADC's demand for Malawi's products”, The Maravi Post, April 27, 2016 (http://menafn.com/1094730031/MITC-in-awareness-caign-drive-on-value-added-export-amid-COMESA-and-SADCs-demand-for-Malawis-products) 36 MOITT, “Enhanced Integrated Framework – Tier 2 Project Proposal: Malawi Agro-Processing and Value Addition Project”, April 2014. 37 Based on the interview with MITC in July 2017. 38 Review of food and agricultural policies in Malawi Country Report 2014, FAO 2015 39 Impact of the input Subsidy Programmes in Malawi on the Food Security Status of Smallholders Households, Elizabeth Tendai Mukozho, 2015 40 Measuring the impacts of Malawi’s farm input subsidy programme, Christopher Chibwana, US Agency for International Development, African Journal of Agriculture and Resource Economics Volume 9 Number 2 pages 132-147
Data Collection Survey on Nacala Corridor Integrated Development in Southern Africa Final Report
4-18
diversifying from the heavy bias on maize and tobacco, creating space for the development of
other agricultural value chains with identified high export potential41.
5) Projects for Aflatoxin Control
Aflatoxins are highly toxic to humans and animals. Aflatoxin-producing moulds affect grain
and other food crops – maize and groundnuts in particular. It is not only in Malawi, millions of
people living in Africa are exposed to high, unsafe levels of aflatoxins through their diet. Even
though food safety standards have been established in each country, some of them do not
conform to the international standard on food safety. Meanwhile, even the standard conforms
to the international standard is set in a country, farmers cannot produce commodities satisfied
the requirements due to several reasons ; the standard is not recognized among local farmers.
Therefore, farmers miss out on export opportunities42.
On 2012, the African Union launched the Partnership for Aflatoxin Control in Africa (PACA)
that aimed to protect the products from the effects of aflatoxins, and prepared PACA Strategy
2013-2022. The Malawi was selected as one of the six countries where implement pilot
activities. One of the pilot activities is called Country-led Situation Analysis and Action
Planning (C-SAAP), and based on this results, the GOM centred by MOITT prepared a
Malawi Programme for Aflatoxin Control (MAPAC) as national program to control the
aflatoxins’ affects.
The MAPAC has a vision that “MAPAC envisions Malawian farmers, farm households and
consumers living healthier and more prosperous lives as a result of reducing aflatoxin
exposure to achieve safe levels.” And it sets goals that 1) Increase Malawian farmers’ (with a
particular emphasis on small scale ones) income by enabling sustained market access; 2)
Improve Malawian consumers’ health & nutrition by reducing their aflatoxin exposure to safe
levels, and 3) Support food security through improving the quality and safety of groundnuts
and maize (and other crops) produced by Malawian farmers.
The major objective to prepare the MAPAC is to set an integrated vision, priority of the
activities, coordination among related institutions and implementation structure. For that
reason, their activities are mainly pilot investigations rather than implementation of concrete
measures. At the end of 2017, they will prepare the MAPAC II including more detailed
activities.
So far, the activities related to the aflatoxin control in Malawi have been supported by USAID
or Bill & Melinda Gates Foundation, etc. Since the MAPAC prepared in 2014, the World
Bank, IFAD, EU, etc., as shown in the table below are supporting the activities in several
projects.
41 Malawi Growth and Development Strategy (MGDS) II Review and Country Situation Analysis Report, Ministry of Finance, Economic Planning and Development (MFEPD), March 2016 42 http://www.aflatoxinpartnership.org/?q=aflatoxins
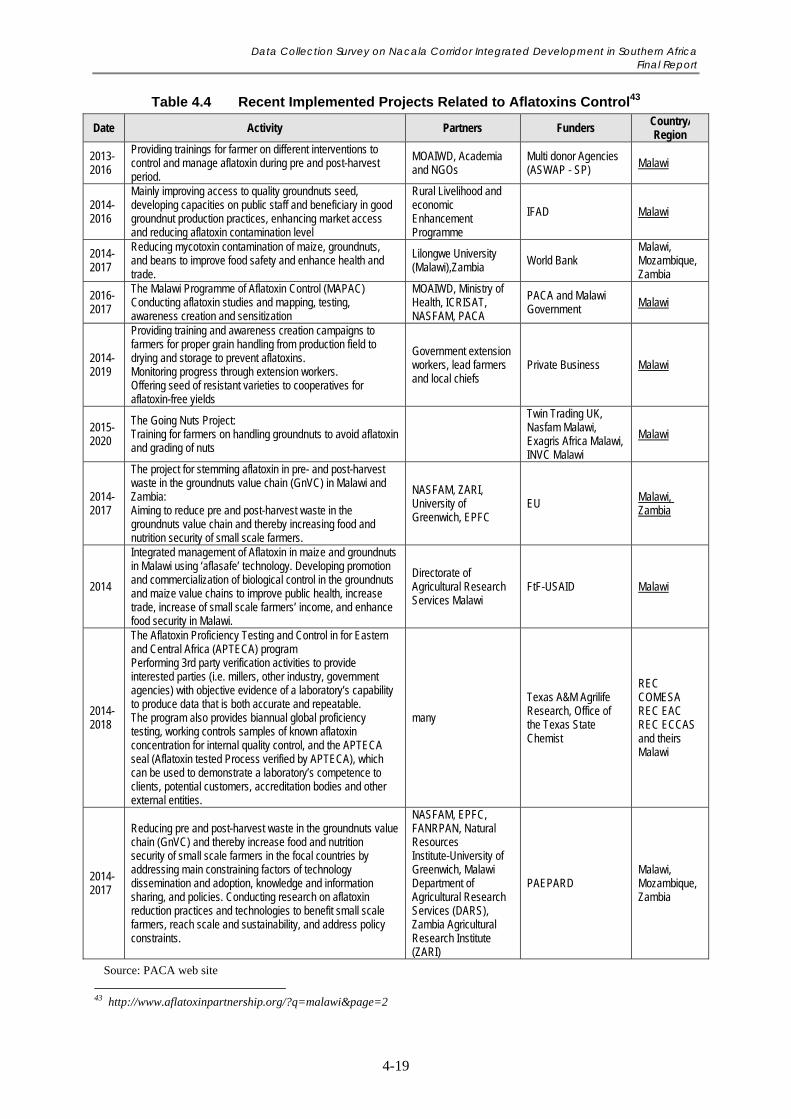
Data Collection Survey on Nacala Corridor Integrated Development in Southern Africa Final Report
4-19
Table 4.4 Recent Implemented Projects Related to Aflatoxins Control43
Date Activity Partners Funders Country/ Region
2013-2016
Providing trainings for farmer on different interventions to control and manage aflatoxin during pre and post-harvest period.
MOAIWD, Academia and NGOs
Multi donor Agencies (ASWAP - SP) Malawi
2014-2016
Mainly improving access to quality groundnuts seed, developing capacities on public staff and beneficiary in good groundnut production practices, enhancing market access and reducing aflatoxin contamination level
Rural Livelihood and economic Enhancement Programme
IFAD Malawi
2014-2017
Reducing mycotoxin contamination of maize, groundnuts, and beans to improve food safety and enhance health and trade.
Lilongwe University (Malawi),Zambia World Bank
Malawi, Mozambique, Zambia
2016-2017
The Malawi Programme of Aflatoxin Control (MAPAC) Conducting aflatoxin studies and mapping, testing, awareness creation and sensitization
MOAIWD, Ministry of Health, ICRISAT, NASFAM, PACA
PACA and Malawi Government Malawi
2014-2019
Providing training and awareness creation campaigns to farmers for proper grain handling from production field to drying and storage to prevent aflatoxins. Monitoring progress through extension workers. Offering seed of resistant varieties to cooperatives for aflatoxin-free yields
Government extension workers, lead farmers and local chiefs
Private Business Malawi
2015-2020
The Going Nuts Project: Training for farmers on handling groundnuts to avoid aflatoxin and grading of nuts
Twin Trading UK, Nasfam Malawi, Exagris Africa Malawi, INVC Malawi
Malawi
2014-2017
The project for stemming aflatoxin in pre- and post-harvest waste in the groundnuts value chain (GnVC) in Malawi and Zambia: Aiming to reduce pre and post-harvest waste in the groundnuts value chain and thereby increasing food and nutrition security of small scale farmers.
NASFAM, ZARI, University of Greenwich, EPFC
EU Malawi, Zambia
2014
Integrated management of Aflatoxin in maize and groundnuts in Malawi using ‘aflasafe’ technology. Developing promotion and commercialization of biological control in the groundnuts and maize value chains to improve public health, increase trade, increase of small scale farmers’ income, and enhance food security in Malawi.
Directorate of Agricultural Research Services Malawi
FtF-USAID Malawi
2014-2018
The Aflatoxin Proficiency Testing and Control in for Eastern and Central Africa (APTECA) program Performing 3rd party verification activities to provide interested parties (i.e. millers, other industry, government agencies) with objective evidence of a laboratory’s capability to produce data that is both accurate and repeatable. The program also provides biannual global proficiency testing, working controls samples of known aflatoxin concentration for internal quality control, and the APTECA seal (Aflatoxin tested Process verified by APTECA), which can be used to demonstrate a laboratory’s competence to clients, potential customers, accreditation bodies and other external entities.
many
Texas A&M Agrilife Research, Office of the Texas State Chemist
REC COMESA REC EAC REC ECCAS and theirs Malawi
2014-2017
Reducing pre and post-harvest waste in the groundnuts value chain (GnVC) and thereby increase food and nutrition security of small scale farmers in the focal countries by addressing main constraining factors of technology dissemination and adoption, knowledge and information sharing, and policies. Conducting research on aflatoxin reduction practices and technologies to benefit small scale farmers, reach scale and sustainability, and address policy constraints.
NASFAM, EPFC, FANRPAN, Natural Resources Institute-University of Greenwich, Malawi Department of Agricultural Research Services (DARS), Zambia Agricultural Research Institute (ZARI)
PAEPARD Malawi, Mozambique, Zambia
Source: PACA web site
43 http://www.aflatoxinpartnership.org/?q=malawi&page=2
Data Collection Survey on Nacala Corridor Integrated Development in Southern Africa Final Report
4-20
4.1.7 Development Potential and Challenges of Agriculture and Agribusiness Sector
The development of the Nacala Corridor and the railway in particular, is ardently desired by
Malawian exporters and entrepreneurs as a more prioritized route for export, which enables
the reduction of transport time and cost, as well as the risk of delay in delivery44. At the same
time, the development of the Nacala Corridor is also expected to reduce input cost for the
agriculture and agro-process industry, as it reduces transportation cost45.
The development of agriculture sector in accordance with national policy is influenced
strongly by domestic trade and export expansion and diversification dependent the
convenience of the Nacala Corridor. Based on the current situation of agriculture production in
Malawi, which is dominated by small scale farmers, the following section summarize
development potential and challenges by analysing the current usability of the Nacala Corridor
and the demand of the agriculture markets in and outside country. Additionally, several
agriculture and agro-processing products which are identified as potential commodities for
export and economic growth in the previous study46 are shown below.
(1) Overall Potentials and Challenges of Development
1) Irrigation Development
As shown in 4.1.6 above, in collaboration with private sector, agricultural infrastructure and
activities to reinforce market linkage have been implemented for the promotion of market (or
export) oriented agriculture that one of the objectives of the NAS at the present in Malawi. If
the irrigation development promoted by MOAIWD is accomplished as planned, the irrigable
areas will increase by 40% from those in 2014, expecting the increase and stable agriculture
production. In addition, if the linkage between farmers and markets progresses in these
irrigated areas, farmers can sell agricultural products sustainably without fear of food
shortages. As a result, this will contribute to the development of farmers and local economies.
Meanwhile, aiming at the agribusiness development, GBI has been developing large and small
irrigation schemes and improving productivity of rain-fed agriculture under the PPP. In fact,
the Salima Sugar Company, which started business under the GBI, employs 350 local small
scale farmers as in-growers and is going to expand out-growers, and plans to develop
agribusiness with local small scale farmers in the future. The program such as irrigation
development should be planned and implemented considering the protection of rights of small
scale farmers and rural communities.
44 According to the Export Development Fund of Malawi, delays in delivery through the Beira corridor cause default of contract by traders, that lead to bad debt loss for the Fund 45 Some companies such as Farmers World (agro-dealer) and Optichem (fertilizer manufacturer) already use the Nacala railway for import and export. They expect the improvement of cost and reliability of the railway transportation. 46 JICA (Mitsubishi UFJ Research and Consulting/PADECO), “Data Collection Survey for Potential Industries in Malawi”, August 2013
Data Collection Survey on Nacala Corridor Integrated Development in Southern Africa Final Report
4-21
2) Diversification of Extension Service
Considering the importance of the access to agriculture advisory service for agriculture
development, the current situation on extension service has been apparently improved in late
years through reinforcement of the extension system like the “Pluralistic and Demand-Driven
Extension System47” by utilising farmer’s cooperatives, associations, and NGOs as extension
service providers and “Farmer to Farmer Extension Approach” defined as the provision of
technical trainings extension by lead farmers to other farmers. The farmers are requiring
advices for the increase of agricultural production and market information in order to change
their subsistence agriculture to market oriented one. However, the extension officers of
MOAIWD, as well as farmers’ organisations and lead farmers have less opportunity to learn
such updated technologies and information, which is the critical issue to be solved48. Recently,
not only the government and farmers organisations, but also the private companies including
traders and distributors are expected to provide such information of commodity markets and
agriculture techniques related to ‘market oriented agriculture’ to farmers to link them with
markets both in the country and overseas.
3) Functionality Reinforcement of Farmers Organisations
FUM and NASFAM have been implementing several good practices such as collective
procurement of inputs, farming experience and knowledge sharing, and market linkage,
which have become certain good results. Due to the limited number of public agriculture
extension officers, the GOM is considering the cooperatives as an important player for
agriculture extension and development. The GOM is also trying to duplicate good practices
of FUM and NASFAM though the capacity building of farmers and cooperatives in
cooperation with donors and NGOs.
In this way, farmers’ organisations (cooperatives and associations) are strengthened
functionally as agri-business operators in order to maintain small scale farmers’ livelihood
and then create a proper market competition with private traders. It is effective to collect
products through farmer’s organisations for agro processing business and export, as one of
their fundamental activities. For this purpose, many farmers’ organisations have been
established with the support of the government and NGOs, or by farmers themselves.
However, only 234 organisations were active among the 681 organisations registered
formally by 2012, meaning that more than half of them are not functional at present
according to the Department of Agriculture Extension Services49.
47 The GOM introduced a policy that promotes the provision of decentralized, demand-driven services and encourages the participation of many service providers in agricultural extension in new extension policy in 2000. Farmers Organizations, NGOs and private sectors have been providing technical services not only technics as well as management skills or financial services for rural farmers. However, government officers are always vacant in rural area, it is difficult to support farmers and to coordinate among all extension player to emerge synergy. A new extension strategy which is compiled and dev underway in 2017 is expected to tackle challenges of such extension services for agriculture development. 48 Malawi Growth and Development Strategy (MGDS) II Review and Country Situation Analysis Report, Ministry of Finance, Economic Planning and Development (MFEPD), March 2016 49 The Malawian co-operative movement: insights for resilience, Alexander Borda-Rodriguez and Sara Vicari, February 2014
Data Collection Survey on Nacala Corridor Integrated Development in Southern Africa Final Report
4-22
As one of the reasons, many farmer’s organizations have financial problems to operate
marketing and provide training on capacity development of the members in the
organisations. Therefore it is favourable to raise farmer’s organisations by supporting them
in finance and capacity.
4) Linking between Farmers and Markets with Rural Infrastructure
Despite of all efforts made by the government for market access improvement, market linkage
with the small scale farmers remains weak. In the light of this circumstance, ACE and AHCX
have been trying to enhance market access to farmers by setting up shipping points and
warehouses in the local cities, providing market information though SMS and creating credit
access, etc.50. In addition to such kind of activities by private traders, the infrastructure
development related to land transportation, air transportation, and water transport is also
necessary in order to reinforce linkage between small scale farmers to the markets.
At present, small scale farmers dispersed in rural areas carry their products with a high
transportation cost to the market and sell, because investment and development of the
necessary infrastructures such as warehouses to collect products and rural roads are not
sufficiently done especially in rural areas. As a result, small scale farmers should sell small-lot
of products to vendors coming irregularly and/or informal markets near their production areas.
In consequence, the profitability of agriculture will decline, and it will be impossible to buy
expensive agricultural inputs. In this way, the small scale farmers will fall into a vicious circle
as less agriculture investment brings lower productivity, which leads less income from
agriculture. The traders also cannot collect a certain amount of agricultural products and sell it
to domestic and overseas markets taking advantage of scale with cheaper cost of transport.
If warehouses and rural roads to facilitate access to main roads including Nacala Corridor are
developed, farmers can accumulate a certain amount of their products with cheaper
transportation costs from the production place to the collection site. If this brings sufficient
agricultural income to the farmers, they stop "informal" sales and distributors will be able to
collect a certain amount of crops more efficiently and steadily. Furthermore, if the distributors
are able to select sales markets to maximise profit by trading the agricultural products, it can
be leading to raise income of farmers as virtuous circle.
5) Accumulation of Knowledge on Aflatoxin Control
As mentioned in the 4.1.6 (2)-5), through implementation of various projects at present,
knowledges on technical measures concerning production and post-harvest at the farmer level
has been gathered and tried in fields such as the utilization of aflatoxin free seed or
improvement of shelled method in post-harvest. Meanwhile, challenges in the value chain
such as the inability to test and certify the aflatoxin in Malawi are also apparent. From now on,
it is necessary to consider how to combine these findings to create a comprehensive
countermeasure with considering incentives for exporters who finally owning risks in the
50 Interview from MOAIWD and Auction Holdings Limited Commodity Exchange (AHCX)
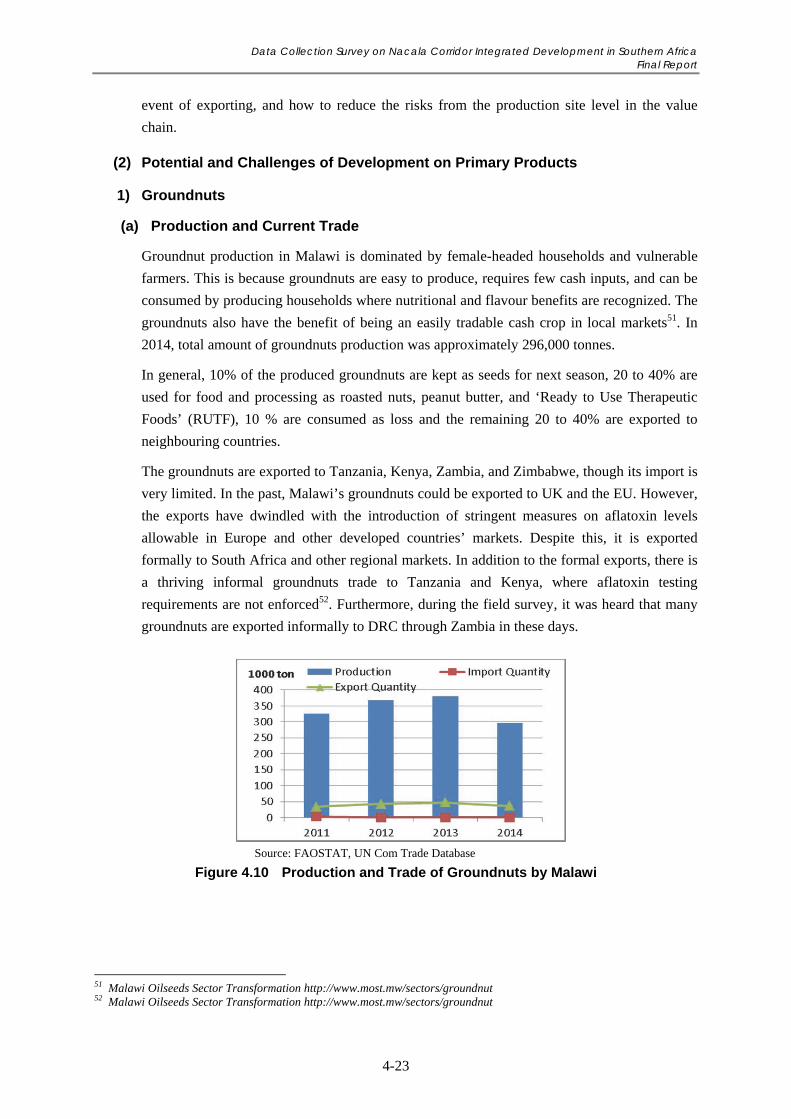
Data Collection Survey on Nacala Corridor Integrated Development in Southern Africa Final Report
4-23
event of exporting, and how to reduce the risks from the production site level in the value
chain.
(2) Potential and Challenges of Development on Primary Products
1) Groundnuts
(a) Production and Current Trade
Groundnut production in Malawi is dominated by female-headed households and vulnerable
farmers. This is because groundnuts are easy to produce, requires few cash inputs, and can be
consumed by producing households where nutritional and flavour benefits are recognized. The
groundnuts also have the benefit of being an easily tradable cash crop in local markets51. In
2014, total amount of groundnuts production was approximately 296,000 tonnes.
In general, 10% of the produced groundnuts are kept as seeds for next season, 20 to 40% are
used for food and processing as roasted nuts, peanut butter, and ‘Ready to Use Therapeutic
Foods’ (RUTF), 10 % are consumed as loss and the remaining 20 to 40% are exported to
neighbouring countries.
The groundnuts are exported to Tanzania, Kenya, Zambia, and Zimbabwe, though its import is
very limited. In the past, Malawi’s groundnuts could be exported to UK and the EU. However,
the exports have dwindled with the introduction of stringent measures on aflatoxin levels
allowable in Europe and other developed countries’ markets. Despite this, it is exported
formally to South Africa and other regional markets. In addition to the formal exports, there is
a thriving informal groundnuts trade to Tanzania and Kenya, where aflatoxin testing
requirements are not enforced52. Furthermore, during the field survey, it was heard that many
groundnuts are exported informally to DRC through Zambia in these days.
Source: FAOSTAT, UN Com Trade Database
Figure 4.10 Production and Trade of Groundnuts by Malawi
51 Malawi Oilseeds Sector Transformation http://www.most.mw/sectors/groundnut 52 Malawi Oilseeds Sector Transformation http://www.most.mw/sectors/groundnut
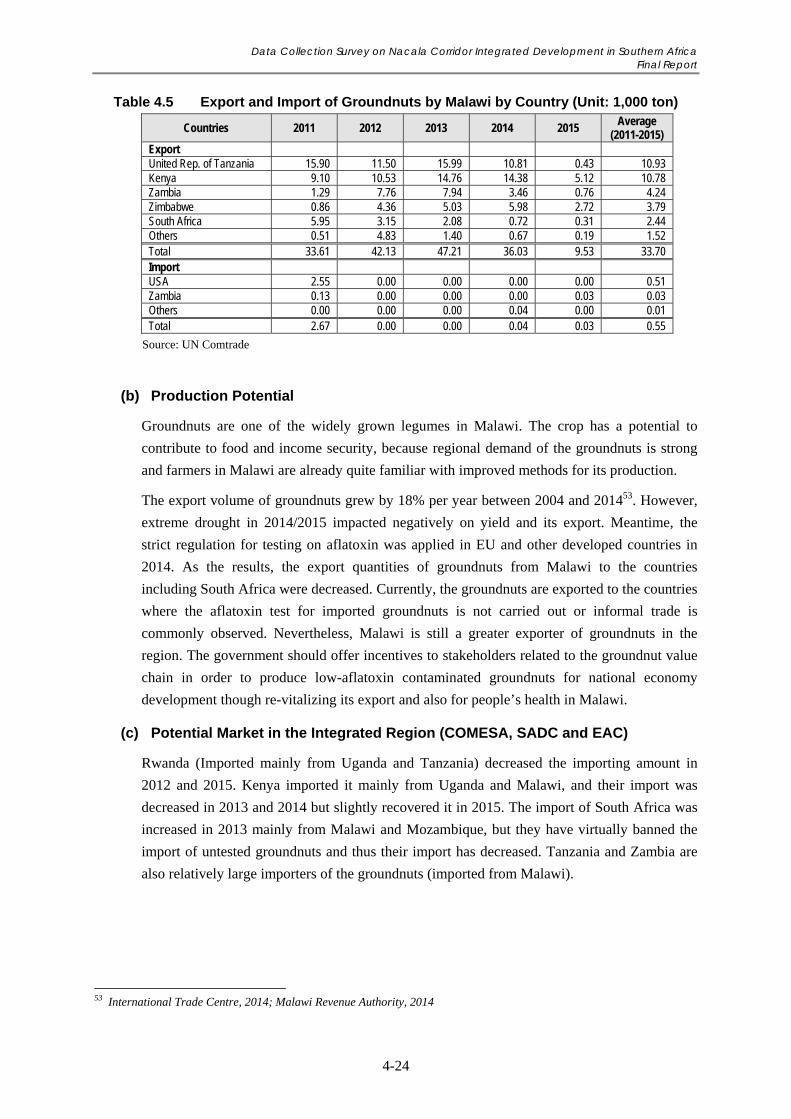
Data Collection Survey on Nacala Corridor Integrated Development in Southern Africa Final Report
4-24
Table 4.5 Export and Import of Groundnuts by Malawi by Country (Unit: 1,000 ton)
Countries 2011 2012 2013 2014 2015 Average
(2011-2015) Export United Rep. of Tanzania 15.90 11.50 15.99 10.81 0.43 10.93 Kenya 9.10 10.53 14.76 14.38 5.12 10.78 Zambia 1.29 7.76 7.94 3.46 0.76 4.24 Zimbabwe 0.86 4.36 5.03 5.98 2.72 3.79 South Africa 5.95 3.15 2.08 0.72 0.31 2.44 Others 0.51 4.83 1.40 0.67 0.19 1.52 Total 33.61 42.13 47.21 36.03 9.53 33.70 Import USA 2.55 0.00 0.00 0.00 0.00 0.51 Zambia 0.13 0.00 0.00 0.00 0.03 0.03 Others 0.00 0.00 0.00 0.04 0.00 0.01 Total 2.67 0.00 0.00 0.04 0.03 0.55
Source: UN Comtrade
(b) Production Potential
Groundnuts are one of the widely grown legumes in Malawi. The crop has a potential to
contribute to food and income security, because regional demand of the groundnuts is strong
and farmers in Malawi are already quite familiar with improved methods for its production.
The export volume of groundnuts grew by 18% per year between 2004 and 201453. However,
extreme drought in 2014/2015 impacted negatively on yield and its export. Meantime, the
strict regulation for testing on aflatoxin was applied in EU and other developed countries in
2014. As the results, the export quantities of groundnuts from Malawi to the countries
including South Africa were decreased. Currently, the groundnuts are exported to the countries
where the aflatoxin test for imported groundnuts is not carried out or informal trade is
commonly observed. Nevertheless, Malawi is still a greater exporter of groundnuts in the
region. The government should offer incentives to stakeholders related to the groundnut value
chain in order to produce low-aflatoxin contaminated groundnuts for national economy
development though re-vitalizing its export and also for people’s health in Malawi.
(c) Potential Market in the Integrated Region (COMESA, SADC and EAC)
Rwanda (Imported mainly from Uganda and Tanzania) decreased the importing amount in
2012 and 2015. Kenya imported it mainly from Uganda and Malawi, and their import was
decreased in 2013 and 2014 but slightly recovered it in 2015. The import of South Africa was
increased in 2013 mainly from Malawi and Mozambique, but they have virtually banned the
import of untested groundnuts and thus their import has decreased. Tanzania and Zambia are
also relatively large importers of the groundnuts (imported from Malawi).
53 International Trade Centre, 2014; Malawi Revenue Authority, 2014
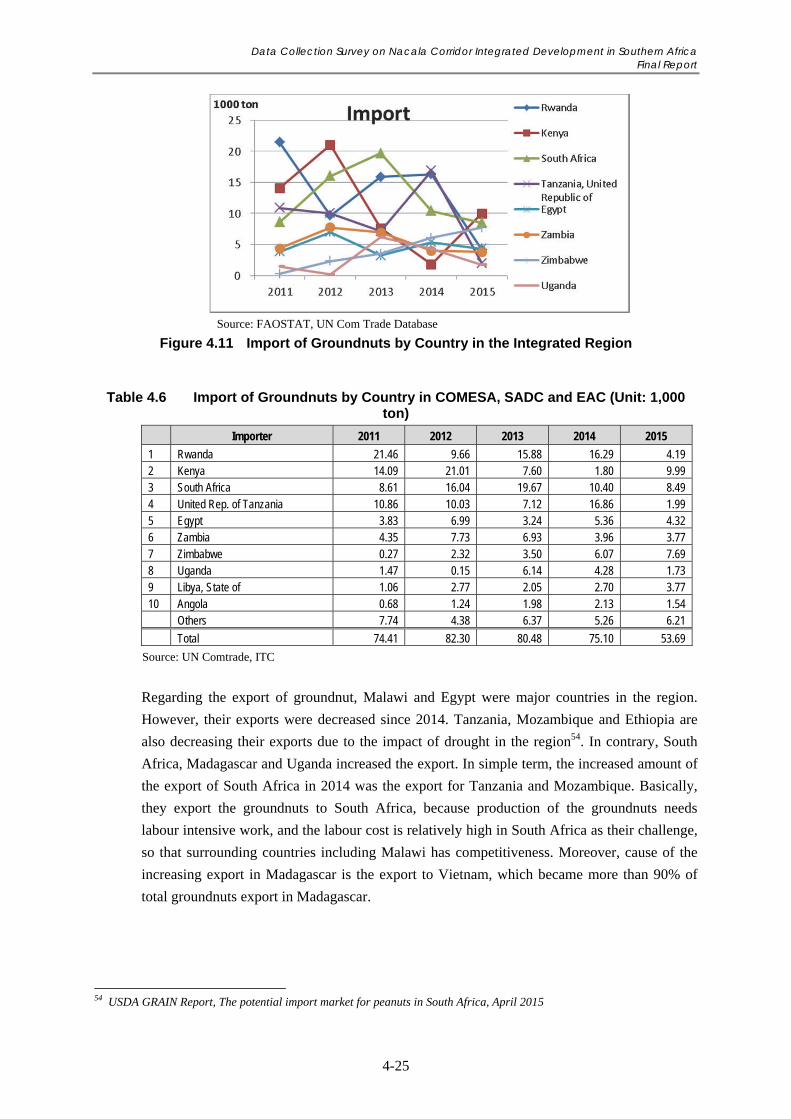
Data Collection Survey on Nacala Corridor Integrated Development in Southern Africa Final Report
4-25
Source: FAOSTAT, UN Com Trade Database
Figure 4.11 Import of Groundnuts by Country in the Integrated Region
Table 4.6 Import of Groundnuts by Country in COMESA, SADC and EAC (Unit: 1,000 ton)
Importer 2011 2012 2013 2014 2015
1 Rwanda 21.46 9.66 15.88 16.29 4.19 2 Kenya 14.09 21.01 7.60 1.80 9.99 3 South Africa 8.61 16.04 19.67 10.40 8.49 4 United Rep. of Tanzania 10.86 10.03 7.12 16.86 1.99 5 Egypt 3.83 6.99 3.24 5.36 4.32 6 Zambia 4.35 7.73 6.93 3.96 3.77 7 Zimbabwe 0.27 2.32 3.50 6.07 7.69 8 Uganda 1.47 0.15 6.14 4.28 1.73 9 Libya, State of 1.06 2.77 2.05 2.70 3.77 10 Angola 0.68 1.24 1.98 2.13 1.54 Others 7.74 4.38 6.37 5.26 6.21
Total 74.41 82.30 80.48 75.10 53.69
Source: UN Comtrade, ITC
Regarding the export of groundnut, Malawi and Egypt were major countries in the region.
However, their exports were decreased since 2014. Tanzania, Mozambique and Ethiopia are
also decreasing their exports due to the impact of drought in the region54. In contrary, South
Africa, Madagascar and Uganda increased the export. In simple term, the increased amount of
the export of South Africa in 2014 was the export for Tanzania and Mozambique. Basically,
they export the groundnuts to South Africa, because production of the groundnuts needs
labour intensive work, and the labour cost is relatively high in South Africa as their challenge,
so that surrounding countries including Malawi has competitiveness. Moreover, cause of the
increasing export in Madagascar is the export to Vietnam, which became more than 90% of
total groundnuts export in Madagascar.
54 USDA GRAIN Report, The potential import market for peanuts in South Africa, April 2015
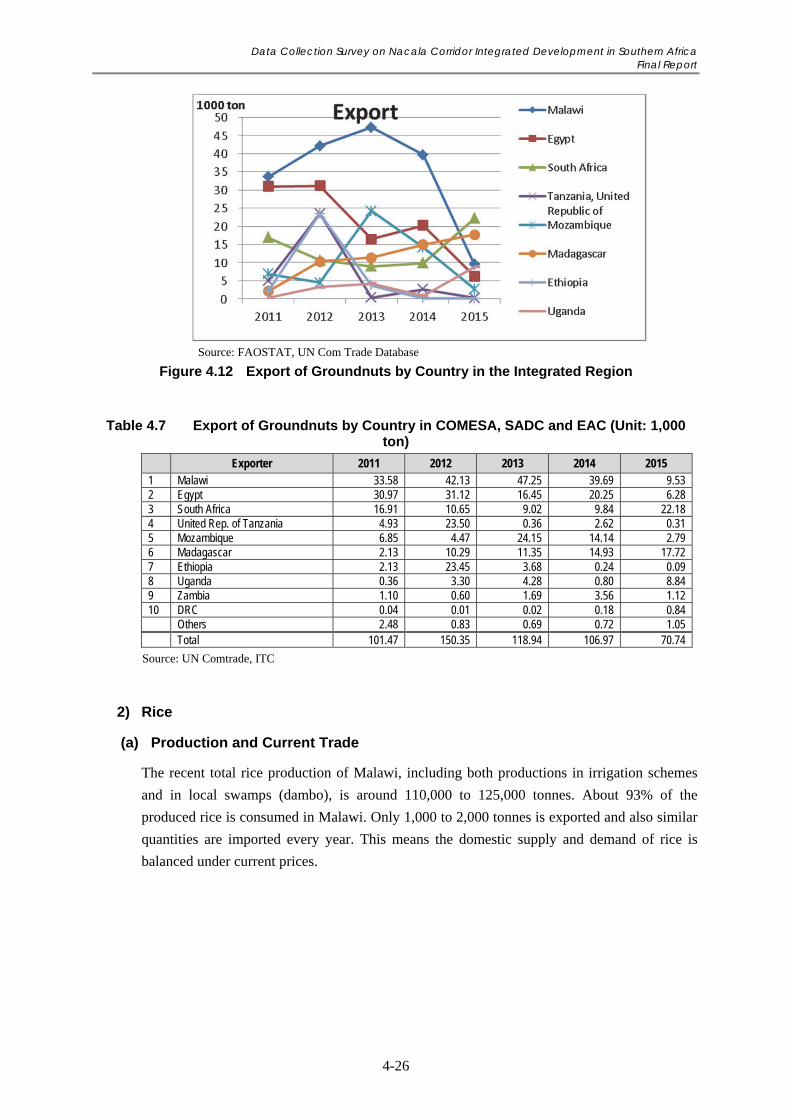
Data Collection Survey on Nacala Corridor Integrated Development in Southern Africa Final Report
4-26
Source: FAOSTAT, UN Com Trade Database
Figure 4.12 Export of Groundnuts by Country in the Integrated Region
Table 4.7 Export of Groundnuts by Country in COMESA, SADC and EAC (Unit: 1,000 ton)
Exporter 2011 2012 2013 2014 2015 1 Malawi 33.58 42.13 47.25 39.69 9.53 2 Egypt 30.97 31.12 16.45 20.25 6.28 3 South Africa 16.91 10.65 9.02 9.84 22.18 4 United Rep. of Tanzania 4.93 23.50 0.36 2.62 0.31 5 Mozambique 6.85 4.47 24.15 14.14 2.79 6 Madagascar 2.13 10.29 11.35 14.93 17.72 7 Ethiopia 2.13 23.45 3.68 0.24 0.09 8 Uganda 0.36 3.30 4.28 0.80 8.84 9 Zambia 1.10 0.60 1.69 3.56 1.12 10 DRC 0.04 0.01 0.02 0.18 0.84 Others 2.48 0.83 0.69 0.72 1.05 Total 101.47 150.35 118.94 106.97 70.74
Source: UN Comtrade, ITC
2) Rice
(a) Production and Current Trade
The recent total rice production of Malawi, including both productions in irrigation schemes
and in local swamps (dambo), is around 110,000 to 125,000 tonnes. About 93% of the
produced rice is consumed in Malawi. Only 1,000 to 2,000 tonnes is exported and also similar
quantities are imported every year. This means the domestic supply and demand of rice is
balanced under current prices.
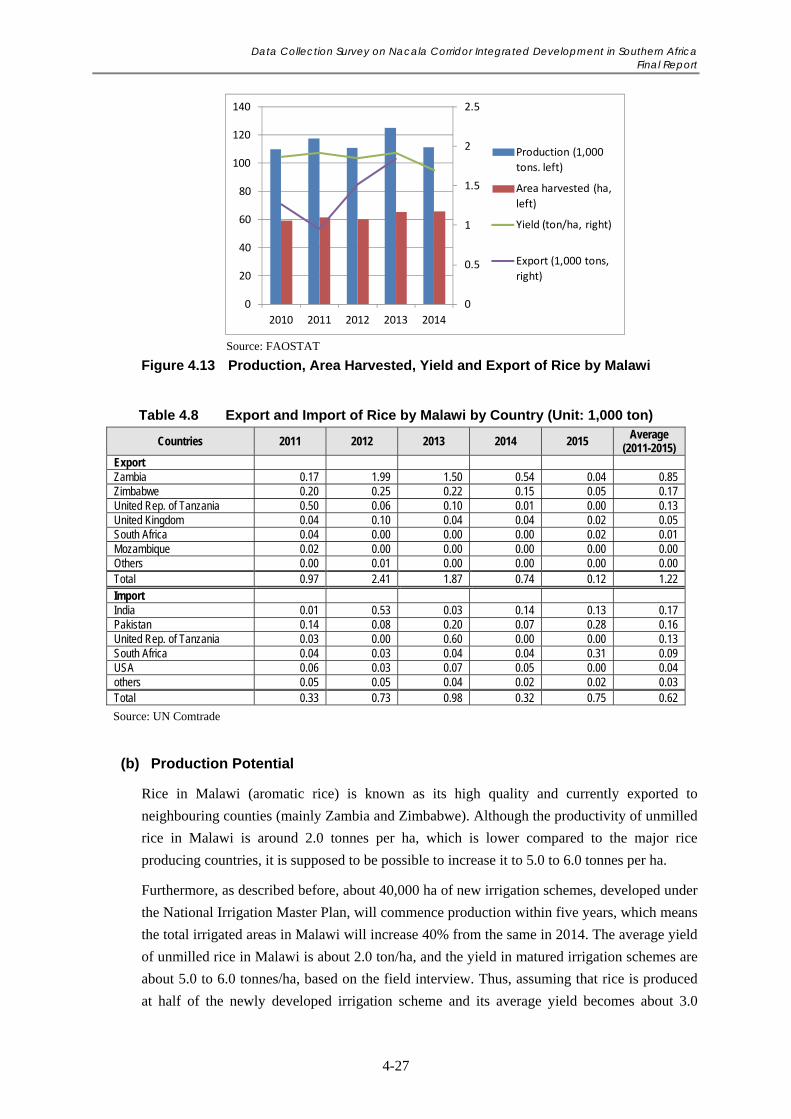
Data Collection Survey on Nacala Corridor Integrated Development in Southern Africa Final Report
4-27
Source: FAOSTAT
Figure 4.13 Production, Area Harvested, Yield and Export of Rice by Malawi
Table 4.8 Export and Import of Rice by Malawi by Country (Unit: 1,000 ton)
Countries 2011 2012 2013 2014 2015 Average
(2011-2015) Export Zambia 0.17 1.99 1.50 0.54 0.04 0.85 Zimbabwe 0.20 0.25 0.22 0.15 0.05 0.17 United Rep. of Tanzania 0.50 0.06 0.10 0.01 0.00 0.13 United Kingdom 0.04 0.10 0.04 0.04 0.02 0.05 South Africa 0.04 0.00 0.00 0.00 0.02 0.01 Mozambique 0.02 0.00 0.00 0.00 0.00 0.00 Others 0.00 0.01 0.00 0.00 0.00 0.00 Total 0.97 2.41 1.87 0.74 0.12 1.22 Import India 0.01 0.53 0.03 0.14 0.13 0.17 Pakistan 0.14 0.08 0.20 0.07 0.28 0.16 United Rep. of Tanzania 0.03 0.00 0.60 0.00 0.00 0.13 South Africa 0.04 0.03 0.04 0.04 0.31 0.09 USA 0.06 0.03 0.07 0.05 0.00 0.04 others 0.05 0.05 0.04 0.02 0.02 0.03 Total 0.33 0.73 0.98 0.32 0.75 0.62
Source: UN Comtrade
(b) Production Potential
Rice in Malawi (aromatic rice) is known as its high quality and currently exported to
neighbouring counties (mainly Zambia and Zimbabwe). Although the productivity of unmilled
rice in Malawi is around 2.0 tonnes per ha, which is lower compared to the major rice
producing countries, it is supposed to be possible to increase it to 5.0 to 6.0 tonnes per ha.
Furthermore, as described before, about 40,000 ha of new irrigation schemes, developed under
the National Irrigation Master Plan, will commence production within five years, which means
the total irrigated areas in Malawi will increase 40% from the same in 2014. The average yield
of unmilled rice in Malawi is about 2.0 ton/ha, and the yield in matured irrigation schemes are
about 5.0 to 6.0 tonnes/ha, based on the field interview. Thus, assuming that rice is produced
at half of the newly developed irrigation scheme and its average yield becomes about 3.0
0
0.5
1
1.5
2
2.5
0
20
40
60
80
100
120
140
2010 2011 2012 2013 2014
Production (1,000
tons. left)
Area harvested (ha,
left)
Yield (ton/ha, right)
Export (1,000 tons,
right)
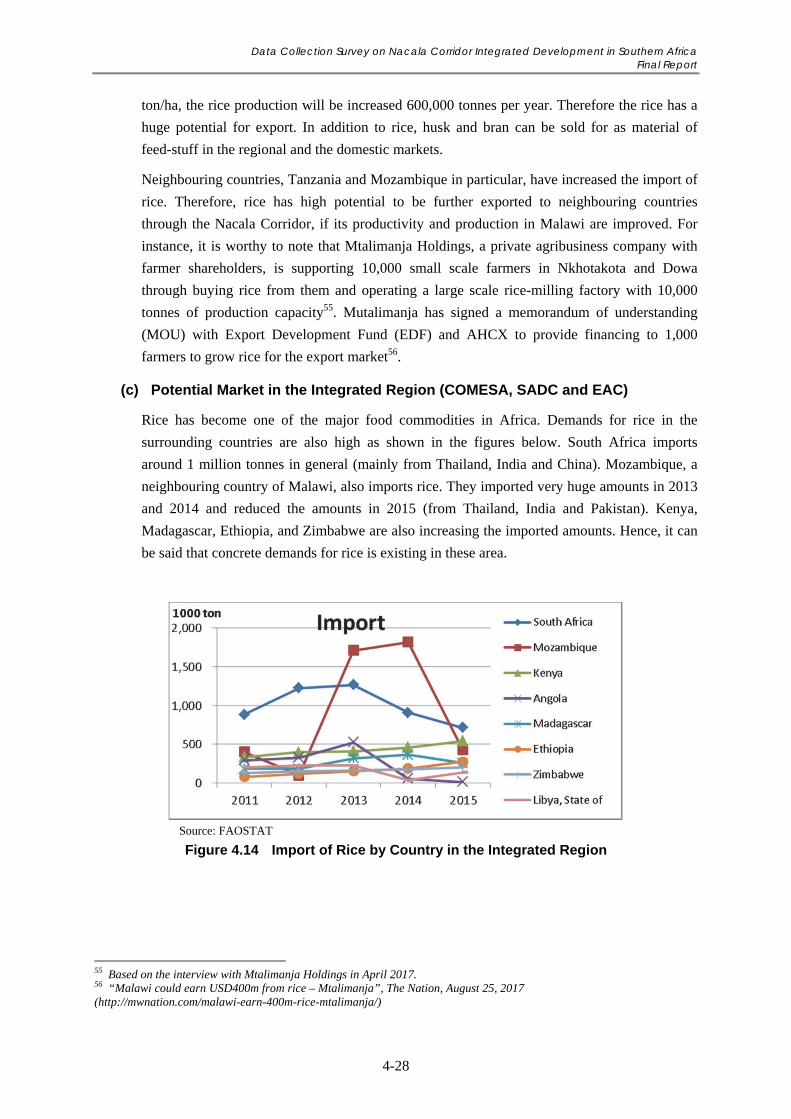
Data Collection Survey on Nacala Corridor Integrated Development in Southern Africa Final Report
4-28
ton/ha, the rice production will be increased 600,000 tonnes per year. Therefore the rice has a
huge potential for export. In addition to rice, husk and bran can be sold for as material of
feed-stuff in the regional and the domestic markets.
Neighbouring countries, Tanzania and Mozambique in particular, have increased the import of
rice. Therefore, rice has high potential to be further exported to neighbouring countries
through the Nacala Corridor, if its productivity and production in Malawi are improved. For
instance, it is worthy to note that Mtalimanja Holdings, a private agribusiness company with
farmer shareholders, is supporting 10,000 small scale farmers in Nkhotakota and Dowa
through buying rice from them and operating a large scale rice-milling factory with 10,000
tonnes of production capacity55. Mutalimanja has signed a memorandum of understanding
(MOU) with Export Development Fund (EDF) and AHCX to provide financing to 1,000
farmers to grow rice for the export market56.
(c) Potential Market in the Integrated Region (COMESA, SADC and EAC)
Rice has become one of the major food commodities in Africa. Demands for rice in the
surrounding countries are also high as shown in the figures below. South Africa imports
around 1 million tonnes in general (mainly from Thailand, India and China). Mozambique, a
neighbouring country of Malawi, also imports rice. They imported very huge amounts in 2013
and 2014 and reduced the amounts in 2015 (from Thailand, India and Pakistan). Kenya,
Madagascar, Ethiopia, and Zimbabwe are also increasing the imported amounts. Hence, it can
be said that concrete demands for rice is existing in these area.
Source: FAOSTAT
Figure 4.14 Import of Rice by Country in the Integrated Region
55 Based on the interview with Mtalimanja Holdings in April 2017. 56 “Malawi could earn USD400m from rice – Mtalimanja”, The Nation, August 25, 2017 (http://mwnation.com/malawi-earn-400m-rice-mtalimanja/)
Data Collection Survey on Nacala Corridor Integrated Development in Southern Africa Final Report
4-29
Table 4.9 Import of Rice by Country in COMESA, SADC and EAC (Unit: 1,000 ton)
Importer 2011 2012 2013 2014 2015
1 South Africa 885.87 1,228.89 1,267.83 910.52 717.77 2 Mozambique 400.98 100.79 1,713.58 1,820.04 432.18 3 Kenya 337.45 399.70 409.58 459.17 542.15 4 Angola 295.08 328.47 526.16 55.32 16.78 5 Madagascar 182.78 183.89 318.15 366.00 259.48 6 Ethiopia 80.39 122.88 153.76 187.72 275.47 7 Zimbabwe 129.14 153.30 159.93 175.71 201.88 8 Libya, State of 205.11 223.39 225.97 33.98 136.79 9 Uganda 92.84 133.96 115.64 172.05 122.87 10 Djibouti 49.18 68.87 108.54 112.14 180.73
Total 3,115.59 3,523.98 5,486.95 2,682.30 3,272.14
Source: UN Comtrade, ITC
Table 4.10 Export of Rice by Country in COMESA, SADC and EAC (Unit: 1,000 ton)
Exporter 2011 2012 2013 2014 2015
1 Egypt 17.10 84.61 199.32 30.00 77.06 2 South Africa 75.94 74.85 75.81 71.39 70.28 3 Uganda 18.44 38.89 36.97 28.69 24.19 4 Tanzania, United Republic of 12.72 5.43 20.00 19.19 1.05 5 Rwanda 0.12 3.59 12.33 14.90 16.62 6 Botswana 0.98 1.06 16.48 0.50 0.47 7 Kenya 5.35 7.47 1.63 0.74 0.11 8 Mozambique 1.90 0.00 0.12 0.46 0.00 9 Mauritius 0.84 0.07 1.31 1.91 0.05 10 Malawi 0.73 0.75 1.63 0.50 0.05
Total 135.28 218.84 366.53 169.18 190.80
Source: UN Comtrade, ITC
3) Legumes
(a) Production and Current Trade
Production of legumes in Malawi has been increasing in the last decade, because legumes are
important food for nutrition, especially for small scale farmers. The legumes produced in
Malawi are exported mainly for India, UAE and Zimbabwe. In general Malawi imports a
certain amount of legumes from Mozambique, but depending on the year it may export in
contrary.
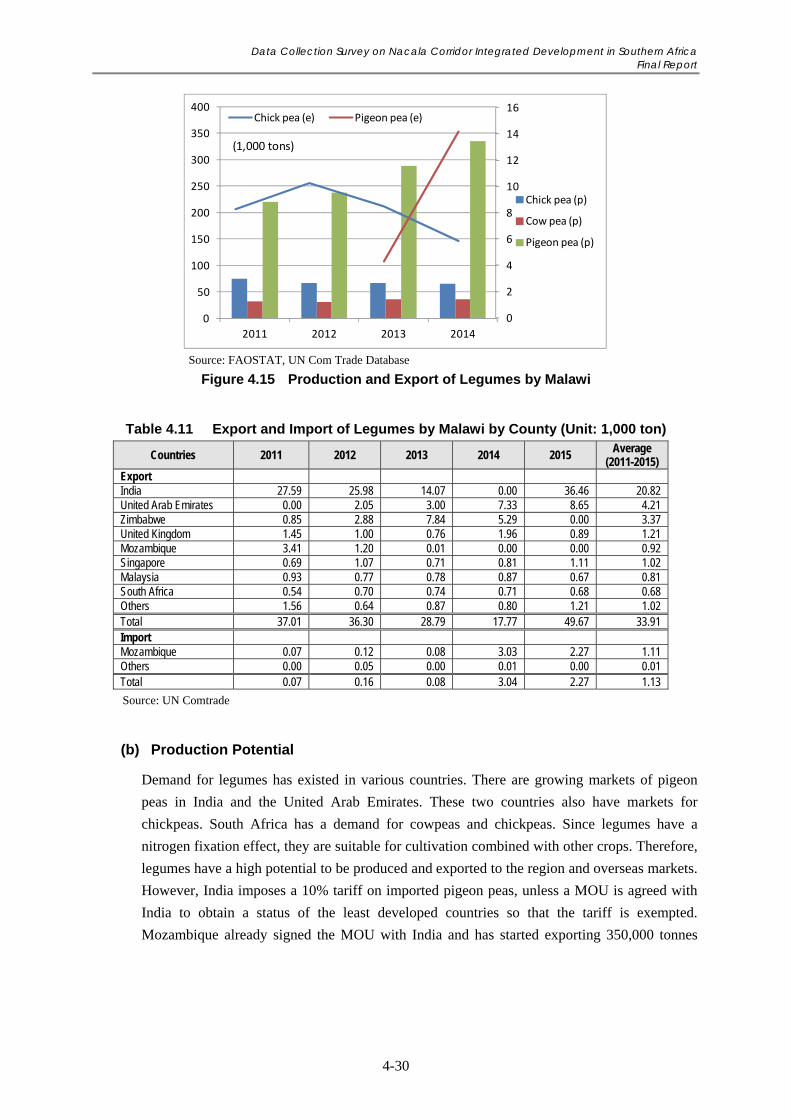
Data Collection Survey on Nacala Corridor Integrated Development in Southern Africa Final Report
4-30
Source: FAOSTAT, UN Com Trade Database
Figure 4.15 Production and Export of Legumes by Malawi
Table 4.11 Export and Import of Legumes by Malawi by County (Unit: 1,000 ton)
Countries 2011 2012 2013 2014 2015 Average
(2011-2015) Export India 27.59 25.98 14.07 0.00 36.46 20.82 United Arab Emirates 0.00 2.05 3.00 7.33 8.65 4.21 Zimbabwe 0.85 2.88 7.84 5.29 0.00 3.37 United Kingdom 1.45 1.00 0.76 1.96 0.89 1.21 Mozambique 3.41 1.20 0.01 0.00 0.00 0.92 Singapore 0.69 1.07 0.71 0.81 1.11 1.02 Malaysia 0.93 0.77 0.78 0.87 0.67 0.81 South Africa 0.54 0.70 0.74 0.71 0.68 0.68 Others 1.56 0.64 0.87 0.80 1.21 1.02 Total 37.01 36.30 28.79 17.77 49.67 33.91 Import Mozambique 0.07 0.12 0.08 3.03 2.27 1.11 Others 0.00 0.05 0.00 0.01 0.00 0.01 Total 0.07 0.16 0.08 3.04 2.27 1.13
Source: UN Comtrade
(b) Production Potential
Demand for legumes has existed in various countries. There are growing markets of pigeon
peas in India and the United Arab Emirates. These two countries also have markets for
chickpeas. South Africa has a demand for cowpeas and chickpeas. Since legumes have a
nitrogen fixation effect, they are suitable for cultivation combined with other crops. Therefore,
legumes have a high potential to be produced and exported to the region and overseas markets.
However, India imposes a 10% tariff on imported pigeon peas, unless a MOU is agreed with
India to obtain a status of the least developed countries so that the tariff is exempted.
Mozambique already signed the MOU with India and has started exporting 350,000 tonnes
0
50
100
150
200
250
300
350
400
2011 2012 2013 2014
Chick pea (p)
Cow pea (p)
Pigeon pea (p)
0
2
4
6
8
10
12
14
16Chick pea (e) Pigeon pea (e)
(1,000 tons)
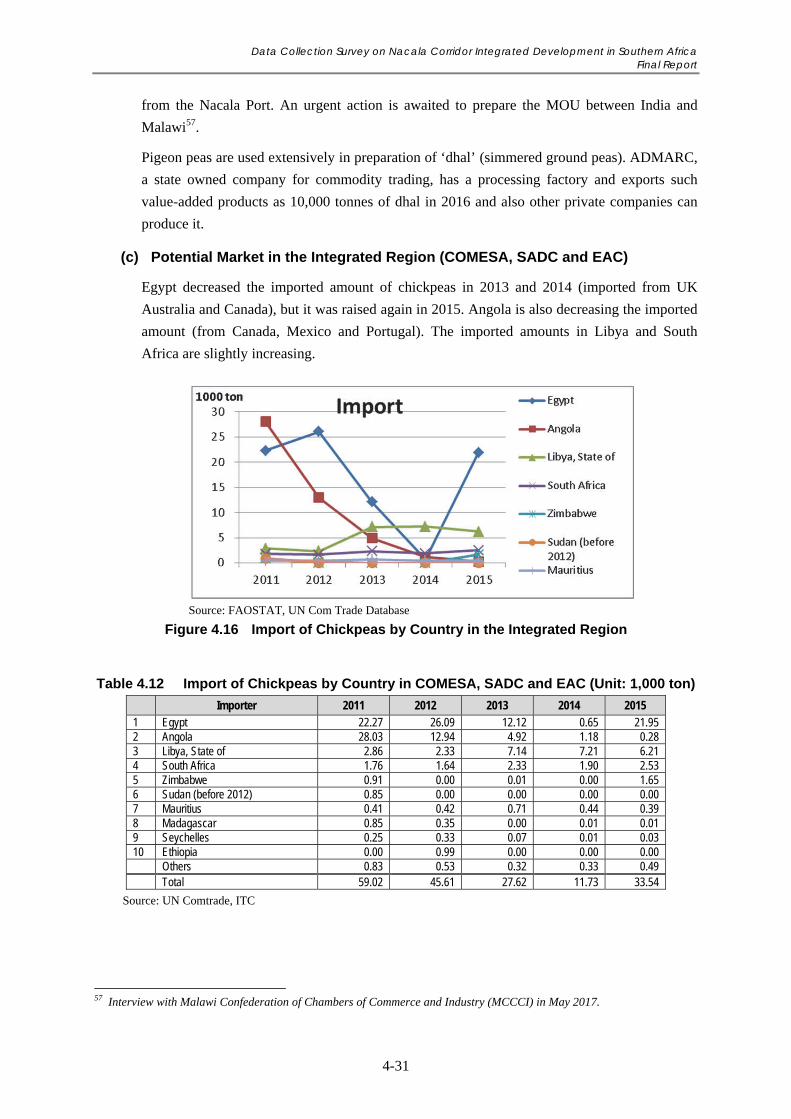
Data Collection Survey on Nacala Corridor Integrated Development in Southern Africa Final Report
4-31
from the Nacala Port. An urgent action is awaited to prepare the MOU between India and
Malawi57.
Pigeon peas are used extensively in preparation of ‘dhal’ (simmered ground peas). ADMARC,
a state owned company for commodity trading, has a processing factory and exports such
value-added products as 10,000 tonnes of dhal in 2016 and also other private companies can
produce it.
(c) Potential Market in the Integrated Region (COMESA, SADC and EAC)
Egypt decreased the imported amount of chickpeas in 2013 and 2014 (imported from UK
Australia and Canada), but it was raised again in 2015. Angola is also decreasing the imported
amount (from Canada, Mexico and Portugal). The imported amounts in Libya and South
Africa are slightly increasing.
Source: FAOSTAT, UN Com Trade Database
Figure 4.16 Import of Chickpeas by Country in the Integrated Region
Table 4.12 Import of Chickpeas by Country in COMESA, SADC and EAC (Unit: 1,000 ton)
Importer 2011 2012 2013 2014 2015 1 Egypt 22.27 26.09 12.12 0.65 21.95 2 Angola 28.03 12.94 4.92 1.18 0.28 3 Libya, State of 2.86 2.33 7.14 7.21 6.21 4 South Africa 1.76 1.64 2.33 1.90 2.53 5 Zimbabwe 0.91 0.00 0.01 0.00 1.65 6 Sudan (before 2012) 0.85 0.00 0.00 0.00 0.00 7 Mauritius 0.41 0.42 0.71 0.44 0.39 8 Madagascar 0.85 0.35 0.00 0.01 0.01 9 Seychelles 0.25 0.33 0.07 0.01 0.03 10 Ethiopia 0.00 0.99 0.00 0.00 0.00 Others 0.83 0.53 0.32 0.33 0.49 Total 59.02 45.61 27.62 11.73 33.54
Source: UN Comtrade, ITC
57 Interview with Malawi Confederation of Chambers of Commerce and Industry (MCCCI) in May 2017.
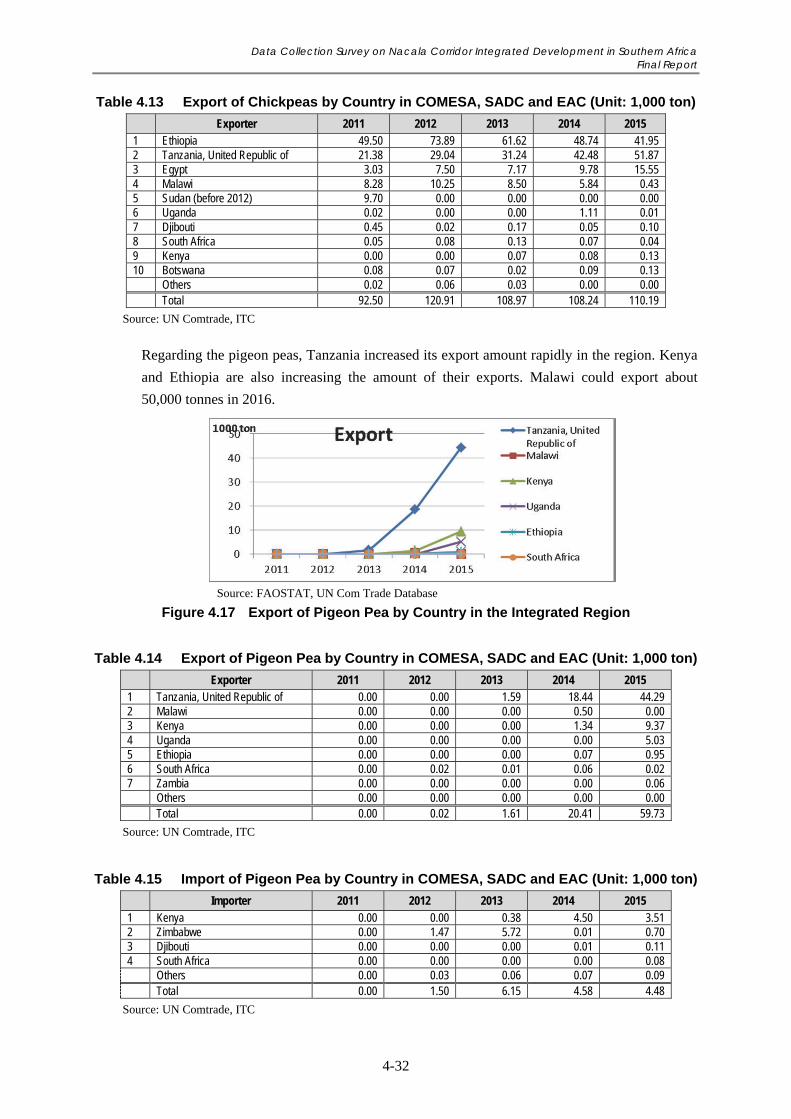
Data Collection Survey on Nacala Corridor Integrated Development in Southern Africa Final Report
4-32
Table 4.13 Export of Chickpeas by Country in COMESA, SADC and EAC (Unit: 1,000 ton)
Exporter 2011 2012 2013 2014 2015 1 Ethiopia 49.50 73.89 61.62 48.74 41.95 2 Tanzania, United Republic of 21.38 29.04 31.24 42.48 51.87 3 Egypt 3.03 7.50 7.17 9.78 15.55 4 Malawi 8.28 10.25 8.50 5.84 0.43 5 Sudan (before 2012) 9.70 0.00 0.00 0.00 0.00 6 Uganda 0.02 0.00 0.00 1.11 0.01 7 Djibouti 0.45 0.02 0.17 0.05 0.10 8 South Africa 0.05 0.08 0.13 0.07 0.04 9 Kenya 0.00 0.00 0.07 0.08 0.13 10 Botswana 0.08 0.07 0.02 0.09 0.13 Others 0.02 0.06 0.03 0.00 0.00 Total 92.50 120.91 108.97 108.24 110.19
Source: UN Comtrade, ITC
Regarding the pigeon peas, Tanzania increased its export amount rapidly in the region. Kenya
and Ethiopia are also increasing the amount of their exports. Malawi could export about
50,000 tonnes in 2016.
Source: FAOSTAT, UN Com Trade Database
Figure 4.17 Export of Pigeon Pea by Country in the Integrated Region
Table 4.14 Export of Pigeon Pea by Country in COMESA, SADC and EAC (Unit: 1,000 ton)
Exporter 2011 2012 2013 2014 2015 1 Tanzania, United Republic of 0.00 0.00 1.59 18.44 44.29 2 Malawi 0.00 0.00 0.00 0.50 0.00 3 Kenya 0.00 0.00 0.00 1.34 9.37 4 Uganda 0.00 0.00 0.00 0.00 5.03 5 Ethiopia 0.00 0.00 0.00 0.07 0.95 6 South Africa 0.00 0.02 0.01 0.06 0.02 7 Zambia 0.00 0.00 0.00 0.00 0.06 Others 0.00 0.00 0.00 0.00 0.00 Total 0.00 0.02 1.61 20.41 59.73
Source: UN Comtrade, ITC
Table 4.15 Import of Pigeon Pea by Country in COMESA, SADC and EAC (Unit: 1,000 ton)
Importer 2011 2012 2013 2014 2015 1 Kenya 0.00 0.00 0.38 4.50 3.51 2 Zimbabwe 0.00 1.47 5.72 0.01 0.70 3 Djibouti 0.00 0.00 0.00 0.01 0.11 4 South Africa 0.00 0.00 0.00 0.00 0.08 Others 0.00 0.03 0.06 0.07 0.09 Total 0.00 1.50 6.15 4.58 4.48
Source: UN Comtrade, ITC
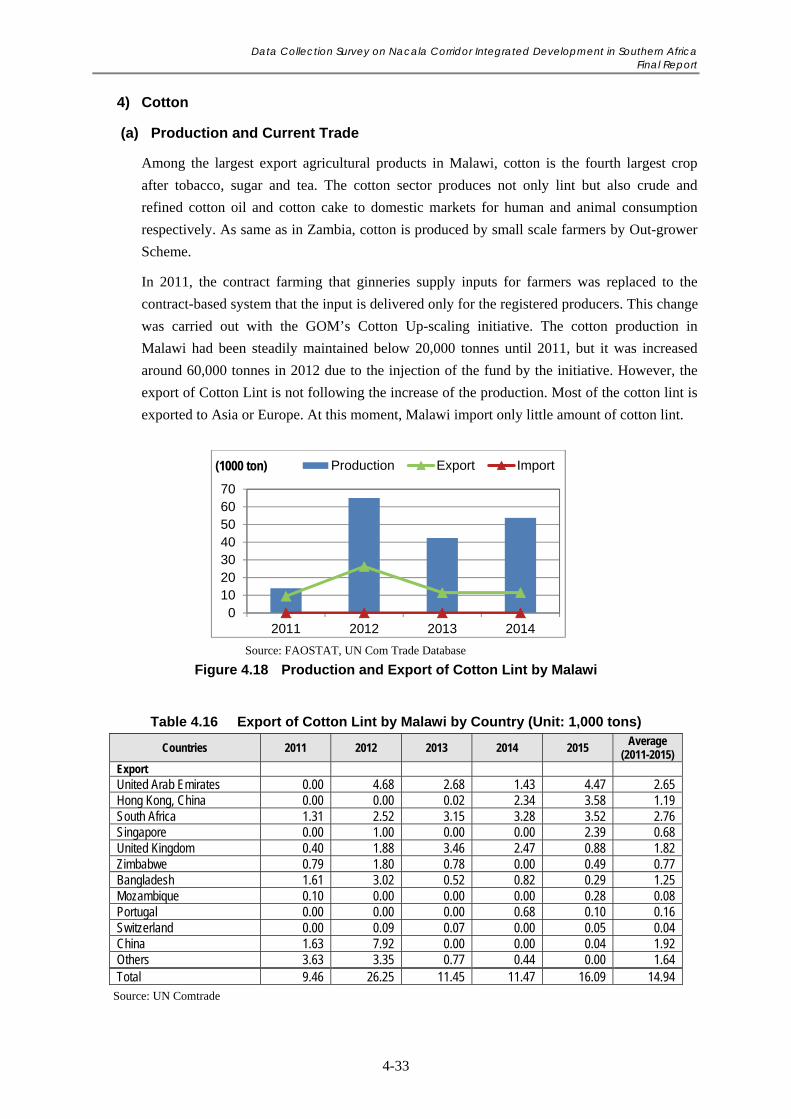
Data Collection Survey on Nacala Corridor Integrated Development in Southern Africa Final Report
4-33
4) Cotton
(a) Production and Current Trade
Among the largest export agricultural products in Malawi, cotton is the fourth largest crop
after tobacco, sugar and tea. The cotton sector produces not only lint but also crude and
refined cotton oil and cotton cake to domestic markets for human and animal consumption
respectively. As same as in Zambia, cotton is produced by small scale farmers by Out-grower
Scheme.
In 2011, the contract farming that ginneries supply inputs for farmers was replaced to the
contract-based system that the input is delivered only for the registered producers. This change
was carried out with the GOM’s Cotton Up-scaling initiative. The cotton production in
Malawi had been steadily maintained below 20,000 tonnes until 2011, but it was increased
around 60,000 tonnes in 2012 due to the injection of the fund by the initiative. However, the
export of Cotton Lint is not following the increase of the production. Most of the cotton lint is
exported to Asia or Europe. At this moment, Malawi import only little amount of cotton lint.
Source: FAOSTAT, UN Com Trade Database
Figure 4.18 Production and Export of Cotton Lint by Malawi
Table 4.16 Export of Cotton Lint by Malawi by Country (Unit: 1,000 tons)
Countries 2011 2012 2013 2014 2015 Average
(2011-2015) Export United Arab Emirates 0.00 4.68 2.68 1.43 4.47 2.65 Hong Kong, China 0.00 0.00 0.02 2.34 3.58 1.19 South Africa 1.31 2.52 3.15 3.28 3.52 2.76 Singapore 0.00 1.00 0.00 0.00 2.39 0.68 United Kingdom 0.40 1.88 3.46 2.47 0.88 1.82 Zimbabwe 0.79 1.80 0.78 0.00 0.49 0.77 Bangladesh 1.61 3.02 0.52 0.82 0.29 1.25 Mozambique 0.10 0.00 0.00 0.00 0.28 0.08 Portugal 0.00 0.00 0.00 0.68 0.10 0.16 Switzerland 0.00 0.09 0.07 0.00 0.05 0.04 China 1.63 7.92 0.00 0.00 0.04 1.92 Others 3.63 3.35 0.77 0.44 0.00 1.64
Total 9.46 26.25 11.45 11.47 16.09 14.94 Source: UN Comtrade
010203040506070
2011 2012 2013 2014
(1000 ton) Production Export Import
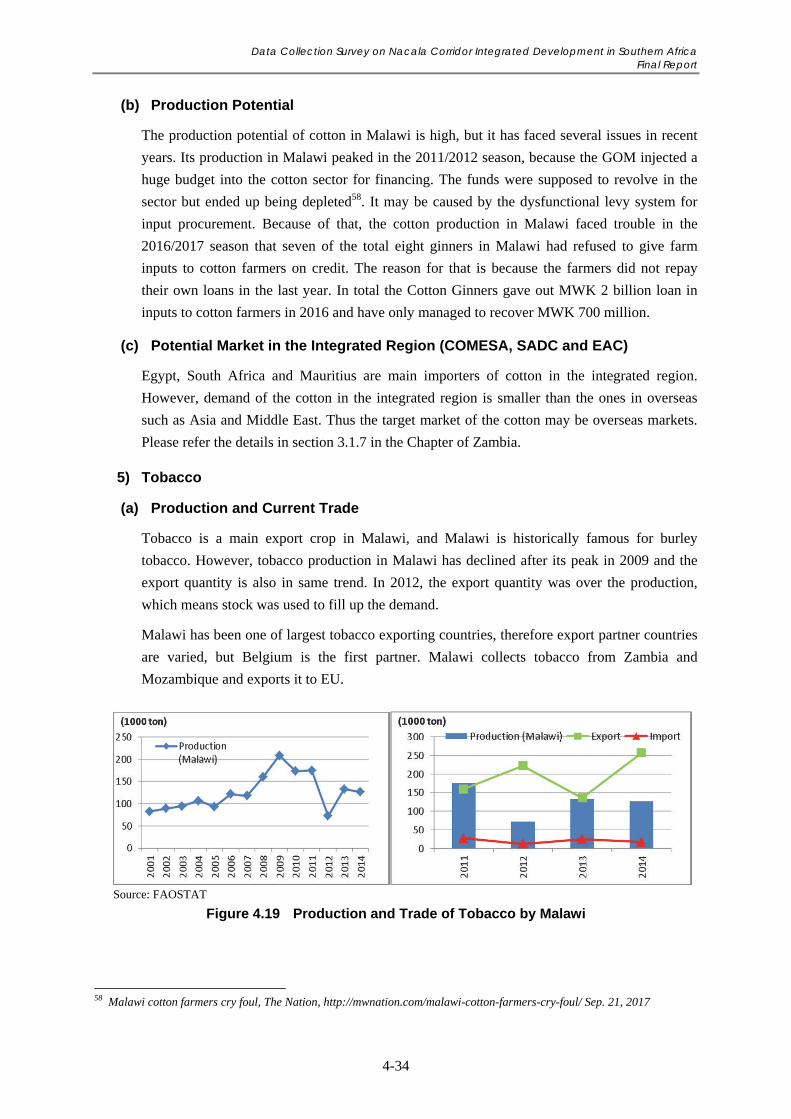
Data Collection Survey on Nacala Corridor Integrated Development in Southern Africa Final Report
4-34
(b) Production Potential
The production potential of cotton in Malawi is high, but it has faced several issues in recent
years. Its production in Malawi peaked in the 2011/2012 season, because the GOM injected a
huge budget into the cotton sector for financing. The funds were supposed to revolve in the
sector but ended up being depleted58. It may be caused by the dysfunctional levy system for
input procurement. Because of that, the cotton production in Malawi faced trouble in the
2016/2017 season that seven of the total eight ginners in Malawi had refused to give farm
inputs to cotton farmers on credit. The reason for that is because the farmers did not repay
their own loans in the last year. In total the Cotton Ginners gave out MWK 2 billion loan in
inputs to cotton farmers in 2016 and have only managed to recover MWK 700 million.
(c) Potential Market in the Integrated Region (COMESA, SADC and EAC)
Egypt, South Africa and Mauritius are main importers of cotton in the integrated region.
However, demand of the cotton in the integrated region is smaller than the ones in overseas
such as Asia and Middle East. Thus the target market of the cotton may be overseas markets.
Please refer the details in section 3.1.7 in the Chapter of Zambia.
5) Tobacco
(a) Production and Current Trade
Tobacco is a main export crop in Malawi, and Malawi is historically famous for burley
tobacco. However, tobacco production in Malawi has declined after its peak in 2009 and the
export quantity is also in same trend. In 2012, the export quantity was over the production,
which means stock was used to fill up the demand.
Malawi has been one of largest tobacco exporting countries, therefore export partner countries
are varied, but Belgium is the first partner. Malawi collects tobacco from Zambia and
Mozambique and exports it to EU.
Source: FAOSTAT
Figure 4.19 Production and Trade of Tobacco by Malawi
58 Malawi cotton farmers cry foul, The Nation, http://mwnation.com/malawi-cotton-farmers-cry-foul/ Sep. 21, 2017
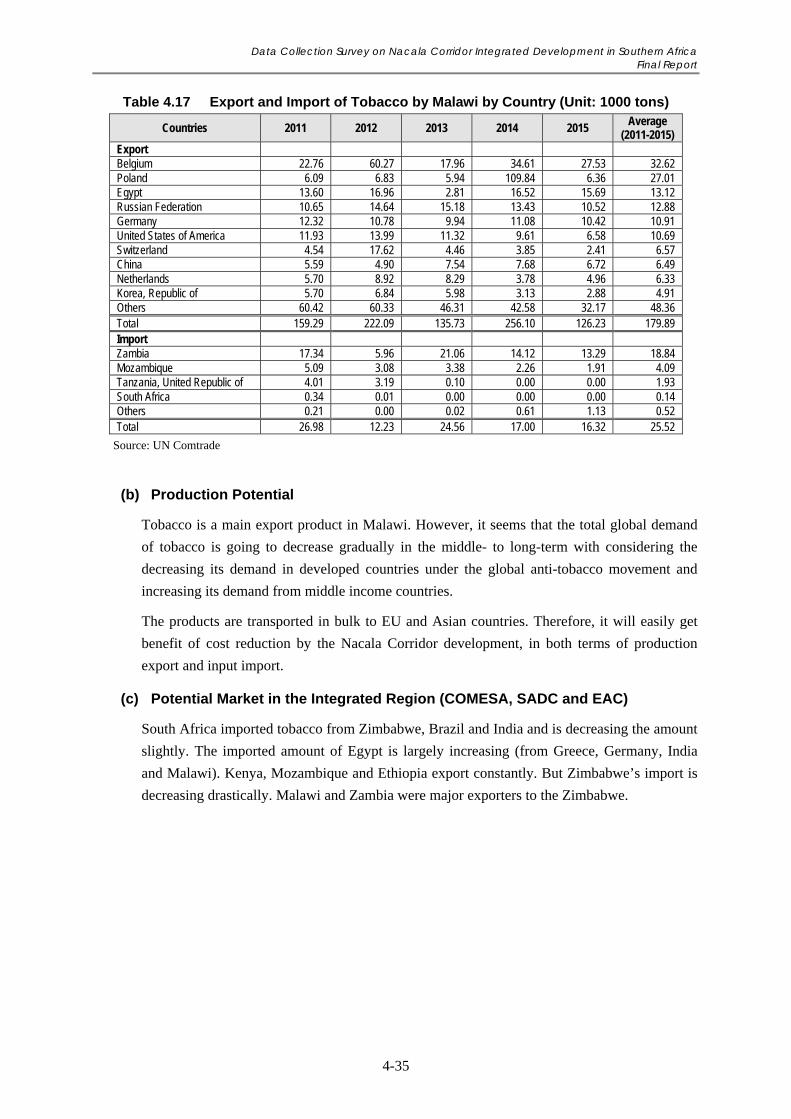
Data Collection Survey on Nacala Corridor Integrated Development in Southern Africa Final Report
4-35
Table 4.17 Export and Import of Tobacco by Malawi by Country (Unit: 1000 tons)
Countries 2011 2012 2013 2014 2015 Average
(2011-2015) Export Belgium 22.76 60.27 17.96 34.61 27.53 32.62 Poland 6.09 6.83 5.94 109.84 6.36 27.01 Egypt 13.60 16.96 2.81 16.52 15.69 13.12 Russian Federation 10.65 14.64 15.18 13.43 10.52 12.88 Germany 12.32 10.78 9.94 11.08 10.42 10.91 United States of America 11.93 13.99 11.32 9.61 6.58 10.69 Switzerland 4.54 17.62 4.46 3.85 2.41 6.57 China 5.59 4.90 7.54 7.68 6.72 6.49 Netherlands 5.70 8.92 8.29 3.78 4.96 6.33 Korea, Republic of 5.70 6.84 5.98 3.13 2.88 4.91 Others 60.42 60.33 46.31 42.58 32.17 48.36 Total 159.29 222.09 135.73 256.10 126.23 179.89 Import Zambia 17.34 5.96 21.06 14.12 13.29 18.84 Mozambique 5.09 3.08 3.38 2.26 1.91 4.09 Tanzania, United Republic of 4.01 3.19 0.10 0.00 0.00 1.93 South Africa 0.34 0.01 0.00 0.00 0.00 0.14 Others 0.21 0.00 0.02 0.61 1.13 0.52 Total 26.98 12.23 24.56 17.00 16.32 25.52
Source: UN Comtrade
(b) Production Potential
Tobacco is a main export product in Malawi. However, it seems that the total global demand
of tobacco is going to decrease gradually in the middle- to long-term with considering the
decreasing its demand in developed countries under the global anti-tobacco movement and
increasing its demand from middle income countries.
The products are transported in bulk to EU and Asian countries. Therefore, it will easily get
benefit of cost reduction by the Nacala Corridor development, in both terms of production
export and input import.
(c) Potential Market in the Integrated Region (COMESA, SADC and EAC)
South Africa imported tobacco from Zimbabwe, Brazil and India and is decreasing the amount
slightly. The imported amount of Egypt is largely increasing (from Greece, Germany, India
and Malawi). Kenya, Mozambique and Ethiopia export constantly. But Zimbabwe’s import is
decreasing drastically. Malawi and Zambia were major exporters to the Zimbabwe.
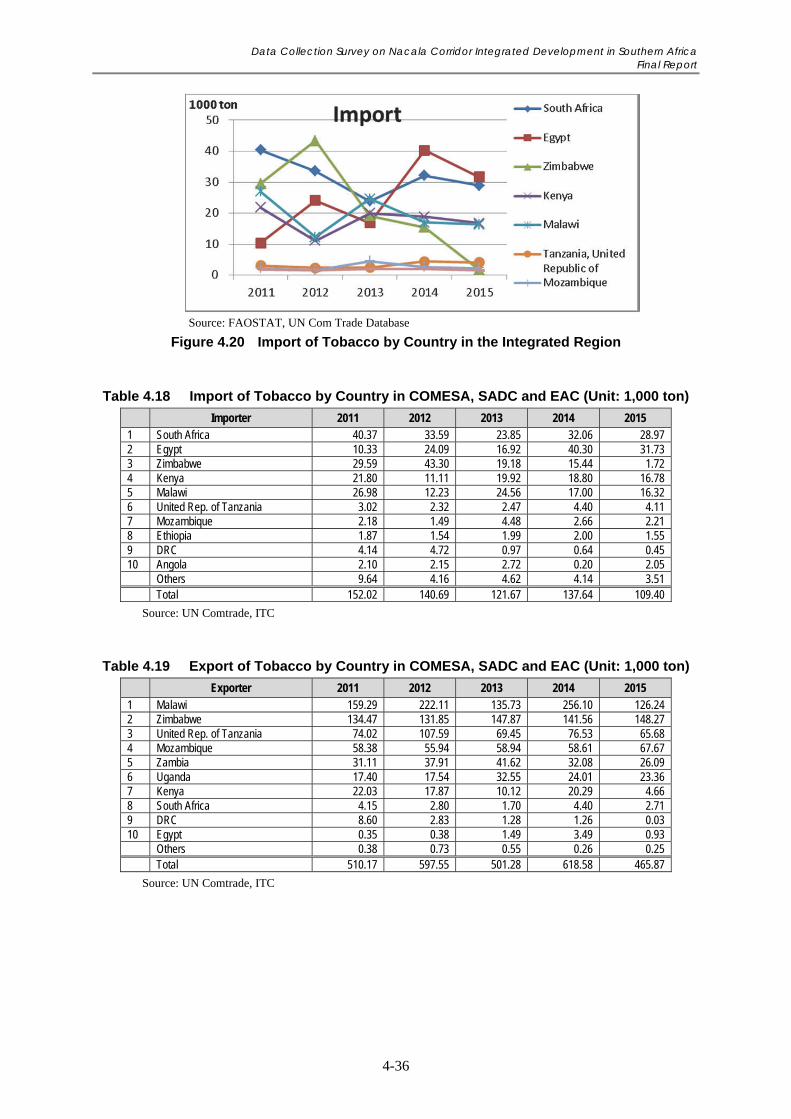
Data Collection Survey on Nacala Corridor Integrated Development in Southern Africa Final Report
4-36
Source: FAOSTAT, UN Com Trade Database
Figure 4.20 Import of Tobacco by Country in the Integrated Region
Table 4.18 Import of Tobacco by Country in COMESA, SADC and EAC (Unit: 1,000 ton)
Importer 2011 2012 2013 2014 2015 1 South Africa 40.37 33.59 23.85 32.06 28.97 2 Egypt 10.33 24.09 16.92 40.30 31.73 3 Zimbabwe 29.59 43.30 19.18 15.44 1.72 4 Kenya 21.80 11.11 19.92 18.80 16.78 5 Malawi 26.98 12.23 24.56 17.00 16.32 6 United Rep. of Tanzania 3.02 2.32 2.47 4.40 4.11 7 Mozambique 2.18 1.49 4.48 2.66 2.21 8 Ethiopia 1.87 1.54 1.99 2.00 1.55 9 DRC 4.14 4.72 0.97 0.64 0.45 10 Angola 2.10 2.15 2.72 0.20 2.05 Others 9.64 4.16 4.62 4.14 3.51 Total 152.02 140.69 121.67 137.64 109.40
Source: UN Comtrade, ITC
Table 4.19 Export of Tobacco by Country in COMESA, SADC and EAC (Unit: 1,000 ton)
Exporter 2011 2012 2013 2014 2015 1 Malawi 159.29 222.11 135.73 256.10 126.24 2 Zimbabwe 134.47 131.85 147.87 141.56 148.27 3 United Rep. of Tanzania 74.02 107.59 69.45 76.53 65.68 4 Mozambique 58.38 55.94 58.94 58.61 67.67 5 Zambia 31.11 37.91 41.62 32.08 26.09 6 Uganda 17.40 17.54 32.55 24.01 23.36 7 Kenya 22.03 17.87 10.12 20.29 4.66 8 South Africa 4.15 2.80 1.70 4.40 2.71 9 DRC 8.60 2.83 1.28 1.26 0.03 10 Egypt 0.35 0.38 1.49 3.49 0.93 Others 0.38 0.73 0.55 0.26 0.25 Total 510.17 597.55 501.28 618.58 465.87
Source: UN Comtrade, ITC
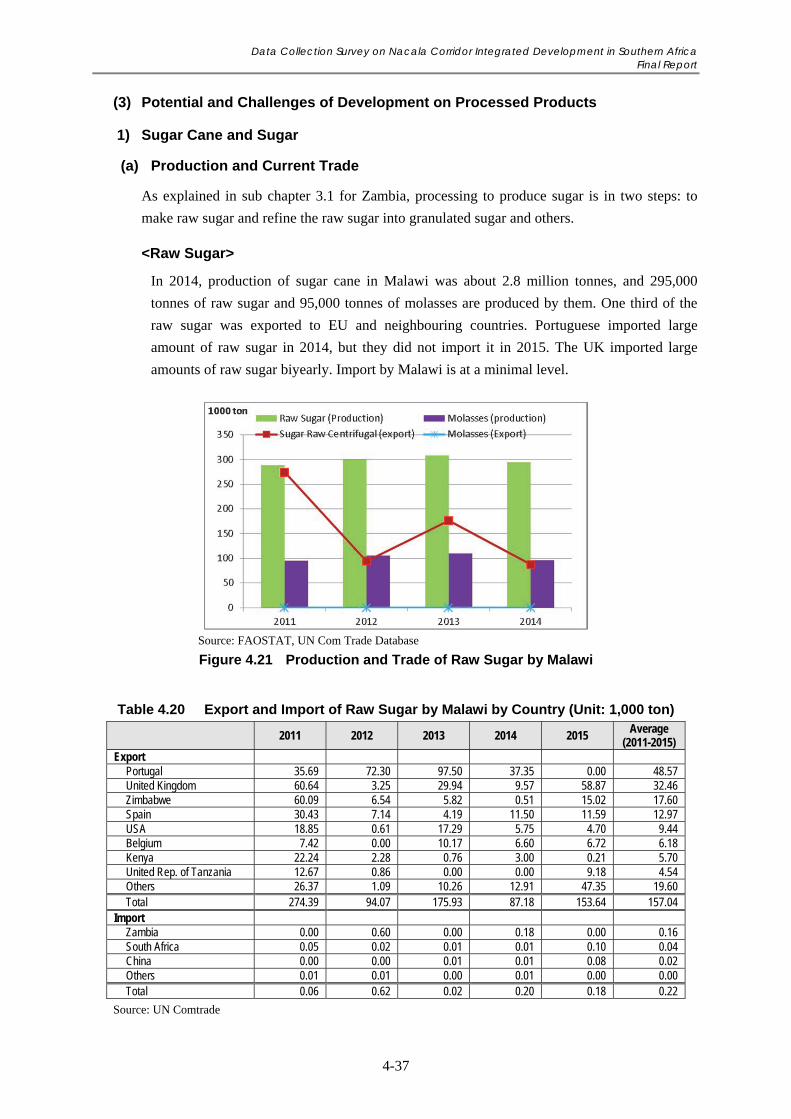
Data Collection Survey on Nacala Corridor Integrated Development in Southern Africa Final Report
4-37
(3) Potential and Challenges of Development on Processed Products
1) Sugar Cane and Sugar
(a) Production and Current Trade
As explained in sub chapter 3.1 for Zambia, processing to produce sugar is in two steps: to
make raw sugar and refine the raw sugar into granulated sugar and others.
<Raw Sugar>
In 2014, production of sugar cane in Malawi was about 2.8 million tonnes, and 295,000
tonnes of raw sugar and 95,000 tonnes of molasses are produced by them. One third of the
raw sugar was exported to EU and neighbouring countries. Portuguese imported large
amount of raw sugar in 2014, but they did not import it in 2015. The UK imported large
amounts of raw sugar biyearly. Import by Malawi is at a minimal level.
Source: FAOSTAT, UN Com Trade Database Figure 4.21 Production and Trade of Raw Sugar by Malawi
Table 4.20 Export and Import of Raw Sugar by Malawi by Country (Unit: 1,000 ton)
2011 2012 2013 2014 2015 Average
(2011-2015) Export
Portugal 35.69 72.30 97.50 37.35 0.00 48.57 United Kingdom 60.64 3.25 29.94 9.57 58.87 32.46 Zimbabwe 60.09 6.54 5.82 0.51 15.02 17.60 Spain 30.43 7.14 4.19 11.50 11.59 12.97 USA 18.85 0.61 17.29 5.75 4.70 9.44 Belgium 7.42 0.00 10.17 6.60 6.72 6.18 Kenya 22.24 2.28 0.76 3.00 0.21 5.70 United Rep. of Tanzania 12.67 0.86 0.00 0.00 9.18 4.54 Others 26.37 1.09 10.26 12.91 47.35 19.60 Total 274.39 94.07 175.93 87.18 153.64 157.04
Import Zambia 0.00 0.60 0.00 0.18 0.00 0.16 South Africa 0.05 0.02 0.01 0.01 0.10 0.04 China 0.00 0.00 0.01 0.01 0.08 0.02 Others 0.01 0.01 0.00 0.01 0.00 0.00 Total 0.06 0.62 0.02 0.20 0.18 0.22
Source: UN Comtrade
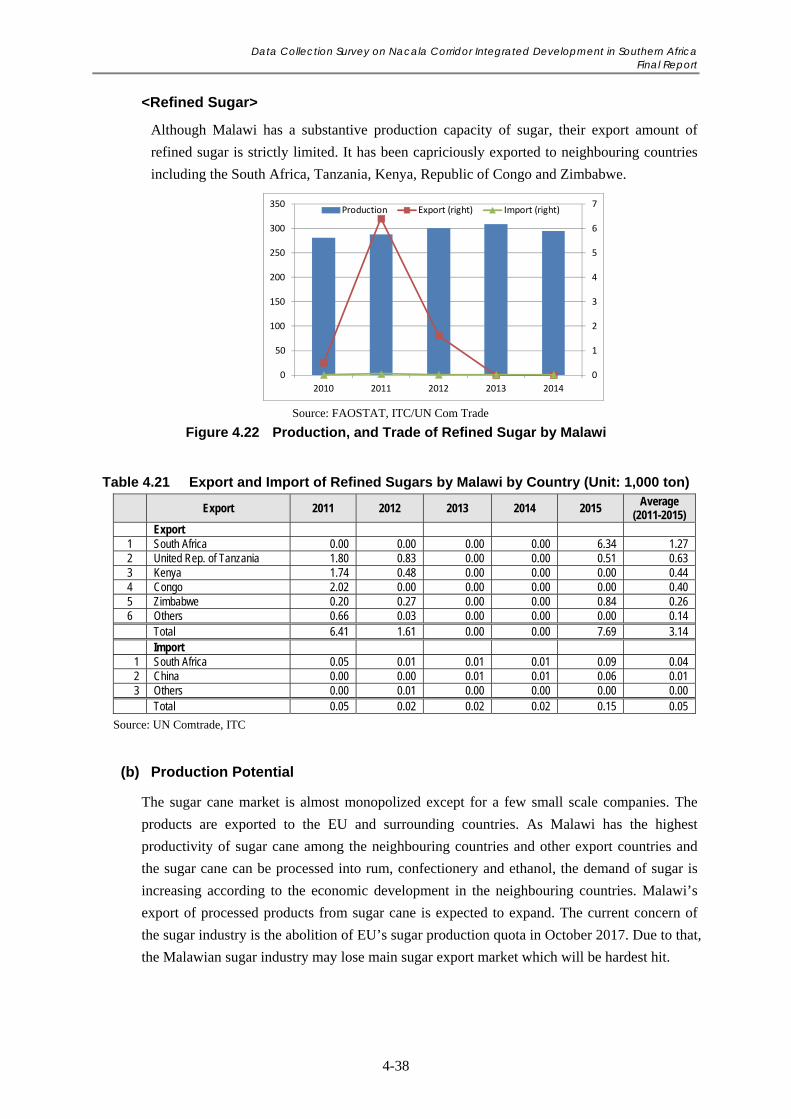
Data Collection Survey on Nacala Corridor Integrated Development in Southern Africa Final Report
4-38
<Refined Sugar>
Although Malawi has a substantive production capacity of sugar, their export amount of
refined sugar is strictly limited. It has been capriciously exported to neighbouring countries
including the South Africa, Tanzania, Kenya, Republic of Congo and Zimbabwe.
Source: FAOSTAT, ITC/UN Com Trade
Figure 4.22 Production, and Trade of Refined Sugar by Malawi
Table 4.21 Export and Import of Refined Sugars by Malawi by Country (Unit: 1,000 ton)
Export 2011 2012 2013 2014 2015 Average
(2011-2015) Export
1 South Africa 0.00 0.00 0.00 0.00 6.34 1.27 2 United Rep. of Tanzania 1.80 0.83 0.00 0.00 0.51 0.63 3 Kenya 1.74 0.48 0.00 0.00 0.00 0.44 4 Congo 2.02 0.00 0.00 0.00 0.00 0.40 5 Zimbabwe 0.20 0.27 0.00 0.00 0.84 0.26 6 Others 0.66 0.03 0.00 0.00 0.00 0.14
Total 6.41 1.61 0.00 0.00 7.69 3.14 Import
1 South Africa 0.05 0.01 0.01 0.01 0.09 0.04 2 China 0.00 0.00 0.01 0.01 0.06 0.01 3 Others 0.00 0.01 0.00 0.00 0.00 0.00 Total 0.05 0.02 0.02 0.02 0.15 0.05
Source: UN Comtrade, ITC
(b) Production Potential
The sugar cane market is almost monopolized except for a few small scale companies. The
products are exported to the EU and surrounding countries. As Malawi has the highest
productivity of sugar cane among the neighbouring countries and other export countries and
the sugar cane can be processed into rum, confectionery and ethanol, the demand of sugar is
increasing according to the economic development in the neighbouring countries. Malawi’s
export of processed products from sugar cane is expected to expand. The current concern of
the sugar industry is the abolition of EU’s sugar production quota in October 2017. Due to that,
the Malawian sugar industry may lose main sugar export market which will be hardest hit.
0
1
2
3
4
5
6
7
0
50
100
150
200
250
300
350
2010 2011 2012 2013 2014
Production Export (right) Import (right)
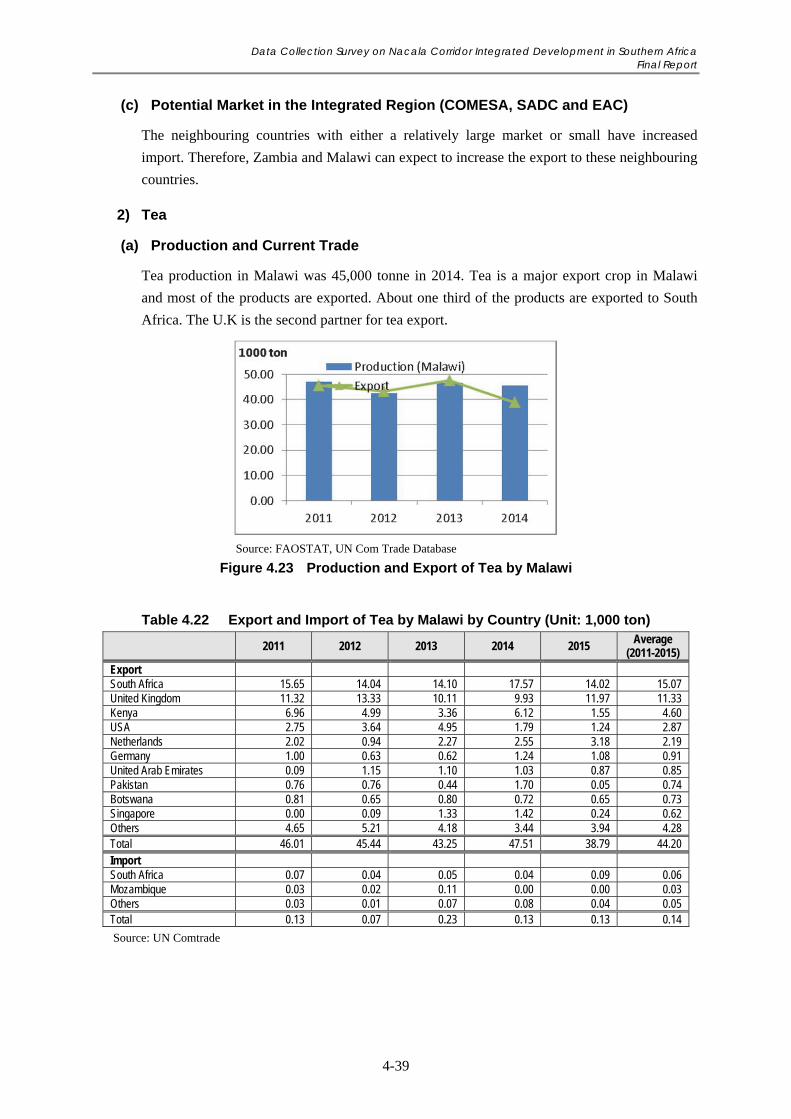
Data Collection Survey on Nacala Corridor Integrated Development in Southern Africa Final Report
4-39
(c) Potential Market in the Integrated Region (COMESA, SADC and EAC)
The neighbouring countries with either a relatively large market or small have increased
import. Therefore, Zambia and Malawi can expect to increase the export to these neighbouring
countries.
2) Tea
(a) Production and Current Trade
Tea production in Malawi was 45,000 tonne in 2014. Tea is a major export crop in Malawi
and most of the products are exported. About one third of the products are exported to South
Africa. The U.K is the second partner for tea export.
Source: FAOSTAT, UN Com Trade Database
Figure 4.23 Production and Export of Tea by Malawi
Table 4.22 Export and Import of Tea by Malawi by Country (Unit: 1,000 ton)
2011 2012 2013 2014 2015 Average
(2011-2015) Export South Africa 15.65 14.04 14.10 17.57 14.02 15.07 United Kingdom 11.32 13.33 10.11 9.93 11.97 11.33 Kenya 6.96 4.99 3.36 6.12 1.55 4.60 USA 2.75 3.64 4.95 1.79 1.24 2.87 Netherlands 2.02 0.94 2.27 2.55 3.18 2.19 Germany 1.00 0.63 0.62 1.24 1.08 0.91 United Arab Emirates 0.09 1.15 1.10 1.03 0.87 0.85 Pakistan 0.76 0.76 0.44 1.70 0.05 0.74 Botswana 0.81 0.65 0.80 0.72 0.65 0.73 Singapore 0.00 0.09 1.33 1.42 0.24 0.62 Others 4.65 5.21 4.18 3.44 3.94 4.28 Total 46.01 45.44 43.25 47.51 38.79 44.20 Import South Africa 0.07 0.04 0.05 0.04 0.09 0.06 Mozambique 0.03 0.02 0.11 0.00 0.00 0.03 Others 0.03 0.01 0.07 0.08 0.04 0.05 Total 0.13 0.07 0.23 0.13 0.13 0.14
Source: UN Comtrade
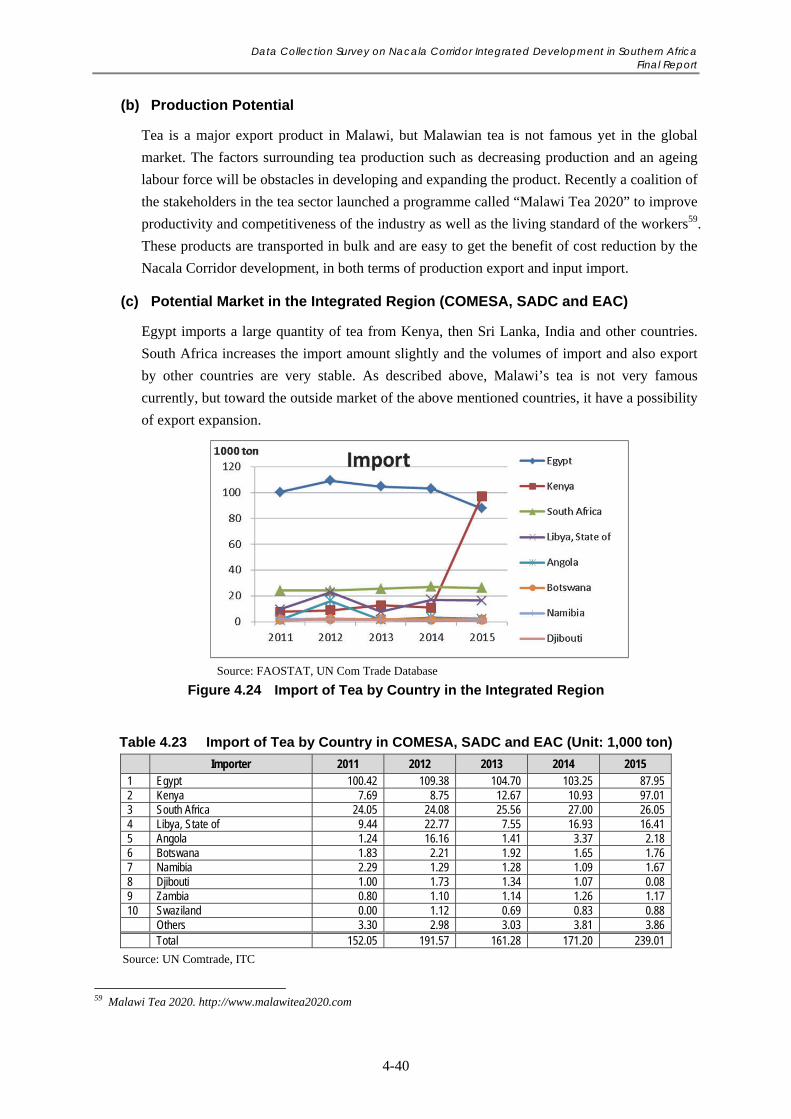
Data Collection Survey on Nacala Corridor Integrated Development in Southern Africa Final Report
4-40
(b) Production Potential
Tea is a major export product in Malawi, but Malawian tea is not famous yet in the global
market. The factors surrounding tea production such as decreasing production and an ageing
labour force will be obstacles in developing and expanding the product. Recently a coalition of
the stakeholders in the tea sector launched a programme called “Malawi Tea 2020” to improve
productivity and competitiveness of the industry as well as the living standard of the workers59.
These products are transported in bulk and are easy to get the benefit of cost reduction by the
Nacala Corridor development, in both terms of production export and input import.
(c) Potential Market in the Integrated Region (COMESA, SADC and EAC)
Egypt imports a large quantity of tea from Kenya, then Sri Lanka, India and other countries.
South Africa increases the import amount slightly and the volumes of import and also export
by other countries are very stable. As described above, Malawi’s tea is not very famous
currently, but toward the outside market of the above mentioned countries, it have a possibility
of export expansion.
Source: FAOSTAT, UN Com Trade Database
Figure 4.24 Import of Tea by Country in the Integrated Region
Table 4.23 Import of Tea by Country in COMESA, SADC and EAC (Unit: 1,000 ton)
Importer 2011 2012 2013 2014 2015 1 Egypt 100.42 109.38 104.70 103.25 87.95 2 Kenya 7.69 8.75 12.67 10.93 97.01 3 South Africa 24.05 24.08 25.56 27.00 26.05 4 Libya, State of 9.44 22.77 7.55 16.93 16.41 5 Angola 1.24 16.16 1.41 3.37 2.18 6 Botswana 1.83 2.21 1.92 1.65 1.76 7 Namibia 2.29 1.29 1.28 1.09 1.67 8 Djibouti 1.00 1.73 1.34 1.07 0.08 9 Zambia 0.80 1.10 1.14 1.26 1.17 10 Swaziland 0.00 1.12 0.69 0.83 0.88 Others 3.30 2.98 3.03 3.81 3.86 Total 152.05 191.57 161.28 171.20 239.01
Source: UN Comtrade, ITC
59 Malawi Tea 2020. http://www.malawitea2020.com
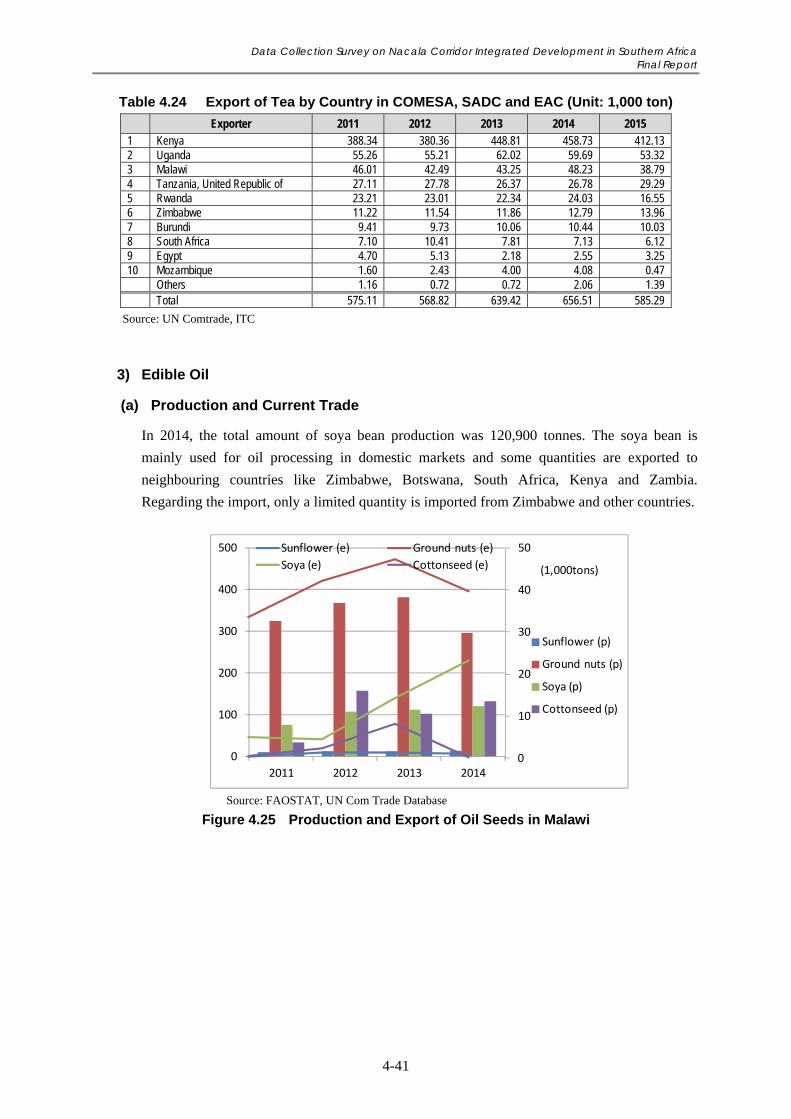
Data Collection Survey on Nacala Corridor Integrated Development in Southern Africa Final Report
4-41
Table 4.24 Export of Tea by Country in COMESA, SADC and EAC (Unit: 1,000 ton)
Exporter 2011 2012 2013 2014 2015 1 Kenya 388.34 380.36 448.81 458.73 412.13 2 Uganda 55.26 55.21 62.02 59.69 53.32 3 Malawi 46.01 42.49 43.25 48.23 38.79 4 Tanzania, United Republic of 27.11 27.78 26.37 26.78 29.29 5 Rwanda 23.21 23.01 22.34 24.03 16.55 6 Zimbabwe 11.22 11.54 11.86 12.79 13.96 7 Burundi 9.41 9.73 10.06 10.44 10.03 8 South Africa 7.10 10.41 7.81 7.13 6.12 9 Egypt 4.70 5.13 2.18 2.55 3.25 10 Mozambique 1.60 2.43 4.00 4.08 0.47 Others 1.16 0.72 0.72 2.06 1.39 Total 575.11 568.82 639.42 656.51 585.29
Source: UN Comtrade, ITC
3) Edible Oil
(a) Production and Current Trade
In 2014, the total amount of soya bean production was 120,900 tonnes. The soya bean is
mainly used for oil processing in domestic markets and some quantities are exported to
neighbouring countries like Zimbabwe, Botswana, South Africa, Kenya and Zambia.
Regarding the import, only a limited quantity is imported from Zimbabwe and other countries.
Source: FAOSTAT, UN Com Trade Database
Figure 4.25 Production and Export of Oil Seeds in Malawi
0
100
200
300
400
500
2011 2012 2013 2014
Sunflower (p)
Ground nuts (p)
Soya (p)
Cottonseed (p)
0
10
20
30
40
50Sunflower (e) Ground nuts (e)
Soya (e) Cottonseed (e) (1,000tons)
Data Collection Survey on Nacala Corridor Integrated Development in Southern Africa Final Report
4-42
Table 4.25 Export and Import of Soya Beans by Malawi by Country (Unit: 1,000 ton)
2011 2012 2013 2014 2015 Average
(2011-2015) Export Zimbabwe 2.21 0.45 6.39 9.68 6.75 5.09 Botswana 0.95 1.72 6.38 1.67 0.00 2.14 South Africa 0.16 0.03 0.51 5.71 0.98 1.48 Kenya 0.34 0.03 0.15 3.59 0.24 0.87 Zambia 1.06 0.02 0.85 0.69 1.47 0.82 Others 0.33 2.31 0.06 1.15 0.12 0.79 Total 5.04 4.56 14.33 22.48 9.56 11.19 Import Zimbabwe 0.05 0.74 0.11 0.08 0.02 0.20 USA 0.00 0.60 0.36 0.00 0.00 0.19 Italy 0.00 0.40 0.00 0.49 0.00 0.18 Zambia 0.03 0.52 0.13 0.03 0.00 0.14 South Africa 0.01 0.00 0.00 0.40 0.03 0.09 Mozambique 0.00 0.02 0.00 0.11 0.00 0.03 Others 0.00 0.00 0.00 0.01 0.00 0.00 Total 0.09 2.28 0.60 1.12 0.05 0.83
Source: UN Comtrade
Malawi totally depends on import for soya bean oil and has only a negligible amount of
sunflower oil export, with almost the same amount of domestic production and import.
【Soya Bean Oil】 【Sunflower Oil】
Source: FAOSTAT, ITC/UN Com Trade Figure 4.26 Production and Trade of Edible Oil by Malawi
Table 4.26 Import of Soya Bean Oil by Malawi by Country (Unit: 1,000 ton)
Countries 2011 2012 2013 2014 2015 Average
(2011-2015) Argentina 14.07 5.85 3.82 6.20 4.41 6.87 South Africa 1.33 1.20 0.90 2.63 1.47 1.50 Kenya 0.75 2.28 0.00 0.00 0.00 0.61 Malaysia 0.00 0.00 0.35 0.46 2.17 0.59 Zambia 0.00 0.06 0.21 0.21 0.32 0.16 Others 1.29 0.15 2.17 0.70 1.01 1.07 Total 17.44 9.53 7.45 10.20 9.39 10.80
Source: UN Comtrade
0
5
10
15
20
2011 2012 2013 2014
Production Export Import
(1,000 tons)
0
1
2
3
4
2011 2012 2013 2014
Production Export Import
(1,000 tons)
Data Collection Survey on Nacala Corridor Integrated Development in Southern Africa Final Report
4-43
(b) Production Potential
Four kinds of oil seeds (sunflower, groundnut, soya, and cotton) listed in NES have a high
demand both from domestic and international markets since they can be processed into various
products including cooking oil. Although most of the companies processing oil seed in Malawi
produce and sell their products for local markets in an oligopolistic structure, it would be
possible for the companies who could acquire sufficient production capacity of edible oil to
meet the demand in the surrounding countries.
(c) Potential Market in the Integrated Region (COMESA, SADC and EAC)
As described in 3.1.7, the market of edible oils is expanding in neighbouring countries,
therefore, Malawi could expand its export when they are able to enter into the countries’
markets.
4.2 Industry
4.2.1 Overview of the Industry
In Malawi, the industry sector has not yet developed, vis-à-vis the service and the agriculture
sector. The value added of the industry sector was MWK 187.82 billion or 14.4% of the GDP
in 2016 at the 2010 constant price, whereas the service sector made the largest contribution of
MWK 665.45 billion or 50.9% of the value added to the national economy, followed by the
primary sector of which accounted for 28.6% of the GDP. The industry grew at 1.62% from
2015 to 2016, which is slightly lower than the growth of GDP, 2.74%. In the industry sector,
the manufacturing sector contributed MWK 123.16 billion or 9.4% to the GDP, which
accounted for 65.6% of the total of the industry sector. However, the construction sector has
grown much faster than the manufacturing from 2015 to 2016.
In 2016, 472,332 persons or 7.4% of the total employment were engaged in the industry sector.
The manufacturing sector employed 261,697 persons or 4.1% of the total, followed by the
construction sector accounting for 2.6% of the total employment. The majority of the
population in Malawi is still engaged in the primary industry of agriculture, forestry and
fishery, the share of which exceeded 60% of the total employment.
Data Collection Survey on Nacala Corridor Integrated Development in Southern Africa Final Report
4-44
Table 4.27 GDP 2016 at 2010 Constant Price
Sector GDP 2016 (2010 Constant Price) 2015-2016
Growth Rate (million MWK) (Share) Agriculture, forestry and fishing 364,471 27.9% -0.17% Mining and quarrying 11,647 0.9% 0.43% Manufacturing 123,159 9.4% 1.37% Electricity, gas and water supply 16,020 1.2% 0.41% Construction 37,002 2.8% 3.41% Wholesale and retail trade 208,044 15.9% 2.04% Transportation and storage 35,580 2.7% 4.66% Accommodation and food services 25,957 2.0% 5.71% Information and communication 57,844 4.4% 4.80% Financial and insurance services 68,320 5.2% 5.48% Real estate activities 101,287 7.7% 3.05% Professional and support services 4,001 0.3% 3.71% Public administration and defence 27,123 2.1% 6.24% Education 35,308 2.7% 7.92% Health and social work activities 35,777 2.7% 7.18% Other Services 66,210 5.1% 5.48% GDP at constant market prices 1,306,937 100.0% 2.74%
Source: Ministry of Finance, Economic Planning and Development. Annual Economic Report 2017.
Table 4.28 Employment by Industry 2013
Sector Employment 2013
Persons Share (%) Agriculture, forestry and fishing 4,091,415 64.1% Mining and quarrying 19,149 0.3% Manufacturing 261,697 4.1% Electricity, gas, steam and air conditioning supply 12,766 0.2% Water supply, sewerage, waste management and remediation activities 12,766 0.2% Construction 165,954 2.6% Wholesale and retail trade and repair of motor vehicles 1,034,024 16.2% Transport, storage and communication 127,657 2.0% Accommodation and food services activities 44,680 0.7% Professional, scientific and technical 12,766 0.2% Administrative and support services 44,680 0.7% Public administration and defence 127,657 2.0% Education 140,423 2.2% Human health and social work 89,360 1.4% Other service 114,892 1.8% Activities of households as employers 82,977 1.3% Total 6,382,863 100.0%
Source: National Statistical Office. Labour Force Survey 2013
4.2.2 Current Condition and Potential of Industrial Development Along Nacala Corridor
Similar to agriculture, a previous study shows the potential for growth and export of some
industry sectors60. Among them, the following are considered to be promoted through the
development of the Nacala Corridor.
60 JICA (Mitsubishi UFJ Research and Consulting/PADECO), “Data Collection Survey for Potential Industries in Malawi”, August 2013.
Data Collection Survey on Nacala Corridor Integrated Development in Southern Africa Final Report
4-45
(1) Agro-processing
Apart from the agro-processing products mentioned in the previous section, the following
products has the potential for growth with fulfilling the increasing demand in domestic and
neighbouring countries’ markets.
Beer: The Carlsberg Malawi Ltd, 60% invested by the headquarters in Denmark and 40% by
local Press Corporation, produces beer in Malawi which is the only production base of
Carlsberg in Africa61. As the NES also regards beverages including beer as high value added
products with high export potential and gives policy support, the Nacala Corridor is expected
to be utilized as one of the main export routes for the product. Although 1,000 to 2,500 tons of
beer has been exported per year mainly to Mozambique, a high tariff rate on imported beer in
Mozambique (20%) has to be reduced for further facilitation and expansion of Malawi’s beer
exports.
(2) Plastic Packaging
Plastic Packages produced in Malawi have a certain export share to neighbouring counties.
The NES regards the plastic packaging industry as a necessary sector for the export of
agro-processing products with add-valuing. A working group on packaging is organised under
the Trade, Industry and Private Sector Development Sector Wide Approach (TIP SWAp) of
NES to introduce a strategy to increase added value of packaging, through the collaboration
and division of labour between expert agro-processors and packaging manufacturers. When
this strategy is successfully implemented, further expansion of distribution of the products in
the region through the Nacala Corridor could be expected. At the same time, the distribution
of the material for packaging (pellet) which is mostly imported via the Beira Port, is expected
to fully shift to the Nacala Corridor when it is developed.
4.3 Mining
4.3.1 Overview of the Mining
Unlike Zambia, the mining and quarrying sector in Malawi brings about limited contribution
to the national economy, of which accounts for 1% or less from 2011 to 2016. In 2016, the
contribution of the mining sector to GDP was 0.9%. The activities related to the mineral
production in Malawi is artisanal and small scale and mostly for domestic consumption.
Table 4.29 Contribution of Mining and Quarrying Sector to the National Economy (Million MWK at 2010 Constant Price)
2011 2012 2013 2014 2015 2016
Mining and Quarrying 9,786 11,240 12,091 11,467 11,597 11,647 GDP at constant market prices 1,069,252 1,091,543 1,157,601 1,231,911 1,272,067 1,306,937 Mining Sector Share in GDP 0.92% 1.03% 1.04% 0.93% 0.91% 0.89% Mining Sector Growth Rate - 15% 8% -5% 1% 0%
Source: Ministry of Finance, Economic Planning and Development. Annual Economic Report 2014 and 2017.
61 In August 2016, the ownership was sold to the French private company, Groupe Castel.
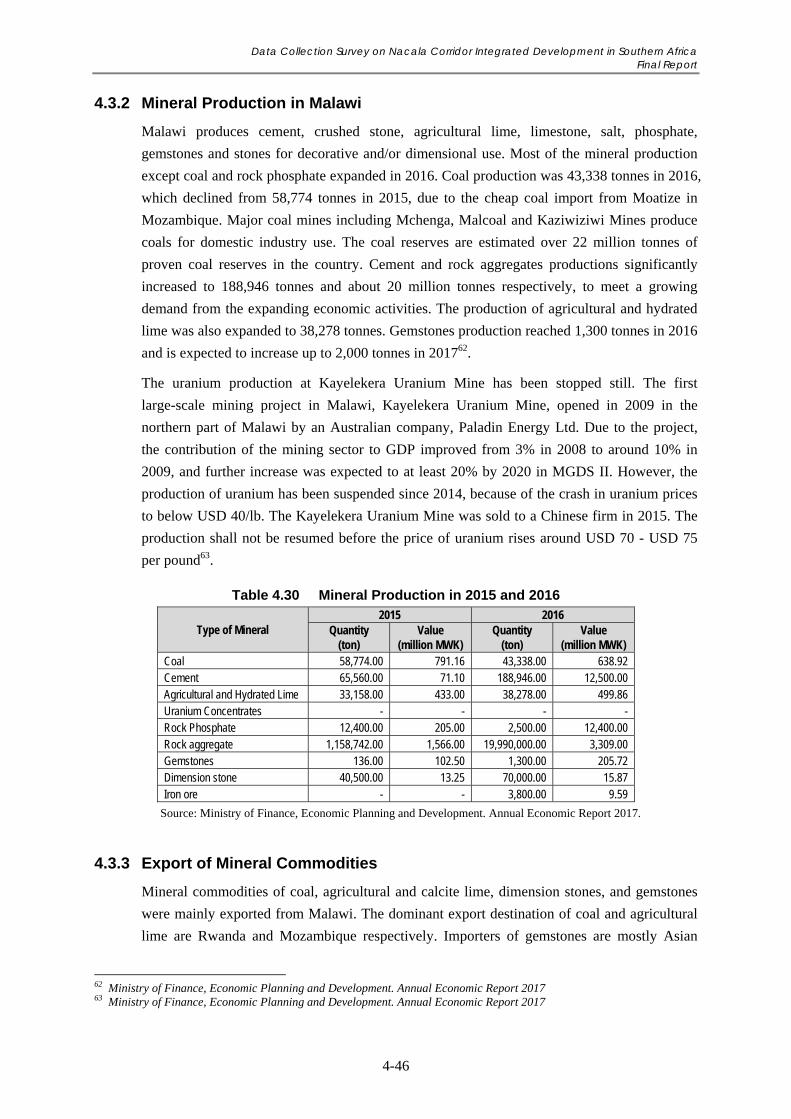
Data Collection Survey on Nacala Corridor Integrated Development in Southern Africa Final Report
4-46
4.3.2 Mineral Production in Malawi
Malawi produces cement, crushed stone, agricultural lime, limestone, salt, phosphate,
gemstones and stones for decorative and/or dimensional use. Most of the mineral production
except coal and rock phosphate expanded in 2016. Coal production was 43,338 tonnes in 2016,
which declined from 58,774 tonnes in 2015, due to the cheap coal import from Moatize in
Mozambique. Major coal mines including Mchenga, Malcoal and Kaziwiziwi Mines produce
coals for domestic industry use. The coal reserves are estimated over 22 million tonnes of
proven coal reserves in the country. Cement and rock aggregates productions significantly
increased to 188,946 tonnes and about 20 million tonnes respectively, to meet a growing
demand from the expanding economic activities. The production of agricultural and hydrated
lime was also expanded to 38,278 tonnes. Gemstones production reached 1,300 tonnes in 2016
and is expected to increase up to 2,000 tonnes in 201762.
The uranium production at Kayelekera Uranium Mine has been stopped still. The first
large-scale mining project in Malawi, Kayelekera Uranium Mine, opened in 2009 in the
northern part of Malawi by an Australian company, Paladin Energy Ltd. Due to the project,
the contribution of the mining sector to GDP improved from 3% in 2008 to around 10% in
2009, and further increase was expected to at least 20% by 2020 in MGDS II. However, the
production of uranium has been suspended since 2014, because of the crash in uranium prices
to below USD 40/lb. The Kayelekera Uranium Mine was sold to a Chinese firm in 2015. The
production shall not be resumed before the price of uranium rises around USD 70 - USD 75
per pound63.
Table 4.30 Mineral Production in 2015 and 2016
Type of Mineral 2015 2016
Quantity (ton)
Value (million MWK)
Quantity (ton)
Value (million MWK)
Coal 58,774.00 791.16 43,338.00 638.92 Cement 65,560.00 71.10 188,946.00 12,500.00 Agricultural and Hydrated Lime 33,158.00 433.00 38,278.00 499.86 Uranium Concentrates - - - - Rock Phosphate 12,400.00 205.00 2,500.00 12,400.00 Rock aggregate 1,158,742.00 1,566.00 19,990,000.00 3,309.00 Gemstones 136.00 102.50 1,300.00 205.72 Dimension stone 40,500.00 13.25 70,000.00 15.87 Iron ore - - 3,800.00 9.59
Source: Ministry of Finance, Economic Planning and Development. Annual Economic Report 2017.
4.3.3 Export of Mineral Commodities
Mineral commodities of coal, agricultural and calcite lime, dimension stones, and gemstones
were mainly exported from Malawi. The dominant export destination of coal and agricultural
lime are Rwanda and Mozambique respectively. Importers of gemstones are mostly Asian
62 Ministry of Finance, Economic Planning and Development. Annual Economic Report 2017 63 Ministry of Finance, Economic Planning and Development. Annual Economic Report 2017
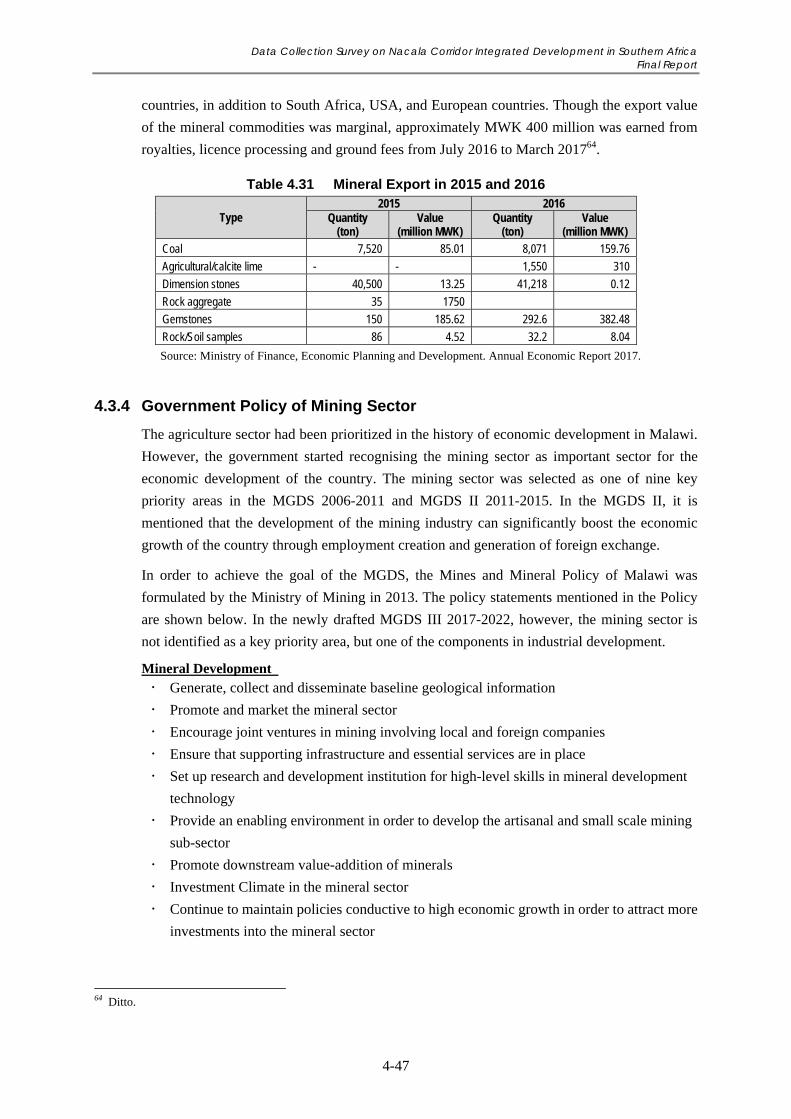
Data Collection Survey on Nacala Corridor Integrated Development in Southern Africa Final Report
4-47
countries, in addition to South Africa, USA, and European countries. Though the export value
of the mineral commodities was marginal, approximately MWK 400 million was earned from
royalties, licence processing and ground fees from July 2016 to March 201764.
Table 4.31 Mineral Export in 2015 and 2016
Type 2015 2016
Quantity (ton)
Value (million MWK)
Quantity (ton)
Value (million MWK)
Coal 7,520 85.01 8,071 159.76
Agricultural/calcite lime - - 1,550 310
Dimension stones 40,500 13.25 41,218 0.12
Rock aggregate 35 1750
Gemstones 150 185.62 292.6 382.48
Rock/Soil samples 86 4.52 32.2 8.04
Source: Ministry of Finance, Economic Planning and Development. Annual Economic Report 2017.
4.3.4 Government Policy of Mining Sector
The agriculture sector had been prioritized in the history of economic development in Malawi.
However, the government started recognising the mining sector as important sector for the
economic development of the country. The mining sector was selected as one of nine key
priority areas in the MGDS 2006-2011 and MGDS II 2011-2015. In the MGDS II, it is
mentioned that the development of the mining industry can significantly boost the economic
growth of the country through employment creation and generation of foreign exchange.
In order to achieve the goal of the MGDS, the Mines and Mineral Policy of Malawi was
formulated by the Ministry of Mining in 2013. The policy statements mentioned in the Policy
are shown below. In the newly drafted MGDS III 2017-2022, however, the mining sector is
not identified as a key priority area, but one of the components in industrial development.
Mineral Development Generate, collect and disseminate baseline geological information
Promote and market the mineral sector
Encourage joint ventures in mining involving local and foreign companies
Ensure that supporting infrastructure and essential services are in place
Set up research and development institution for high-level skills in mineral development
technology
Provide an enabling environment in order to develop the artisanal and small scale mining
sub-sector
Promote downstream value-addition of minerals
Investment Climate in the mineral sector
Continue to maintain policies conductive to high economic growth in order to attract more
investments into the mineral sector
64 Ditto.
Data Collection Survey on Nacala Corridor Integrated Development in Southern Africa Final Report
4-48
Introduce and maintain competitive fees which will be reviewed regularly to always be
comparable to those obtainable internationally
Governance Strengthen institutions in the mineral sector
Review the mineral legislation
Put in place a clear, transparent and equitable regulatory framework
Environmental Management Enforce environmentally sustainable mining practices
Social Issues Address social issues in the mining and mineral sector
Regional and International Co-operation Promote regional and international co-operation in the mineral sector
4.3.5 Increased Mining Projects in Recent Years
The government is promoting foreign investments for the mining sector according to the
MGDS and the sector policy mentioned above. Recently, the potential of rare metal and rare
earth elements in Malawi is recognized by some foreign investors in addition to uranium.
Some projects are under exploration and study by foreign companies from Australia, Canada,
China, etc. Among them, the major projects are the Kanyika Niobium Project and the Songwe
Rare Earth Element project, which are expected to improve the outputs of the mining sector
drastically. The outlines of the projects are shown below:
Kanyika Niobium Project Company: Globe Metals and Mining (Australian Company)
Location: Mzimba District in the Northern Region
Products: niobium (3,000 tonnes/year), tantalum, uranium and zircon.
Production: niobium - 3,000 tonnes/year
Employment: 1,000 employment openings, including 100 expats.
Status:
- Mining agreement have been made between Malawi Government and the company
- Feasibility Study and Environmental Impact Assessment: EIA have been conducted
Concerns:
- Relocation of community is delaying because of the relocation of the customary land
ownership and compensation to the community
- The problem of power supply to the project was solved by constructing a small-scale
hydroelectric power plant at Bua River. The thermal power plant at Salima also can be
also used.
Songwe Rare Earth Element Project Company: Mkango Resources (Canadian Company)
Location: Songwe Hill, Phalombe District in the Southern Region
Products: Rare Earth Element (Element 39)
Production: 2,840 tonnes/year
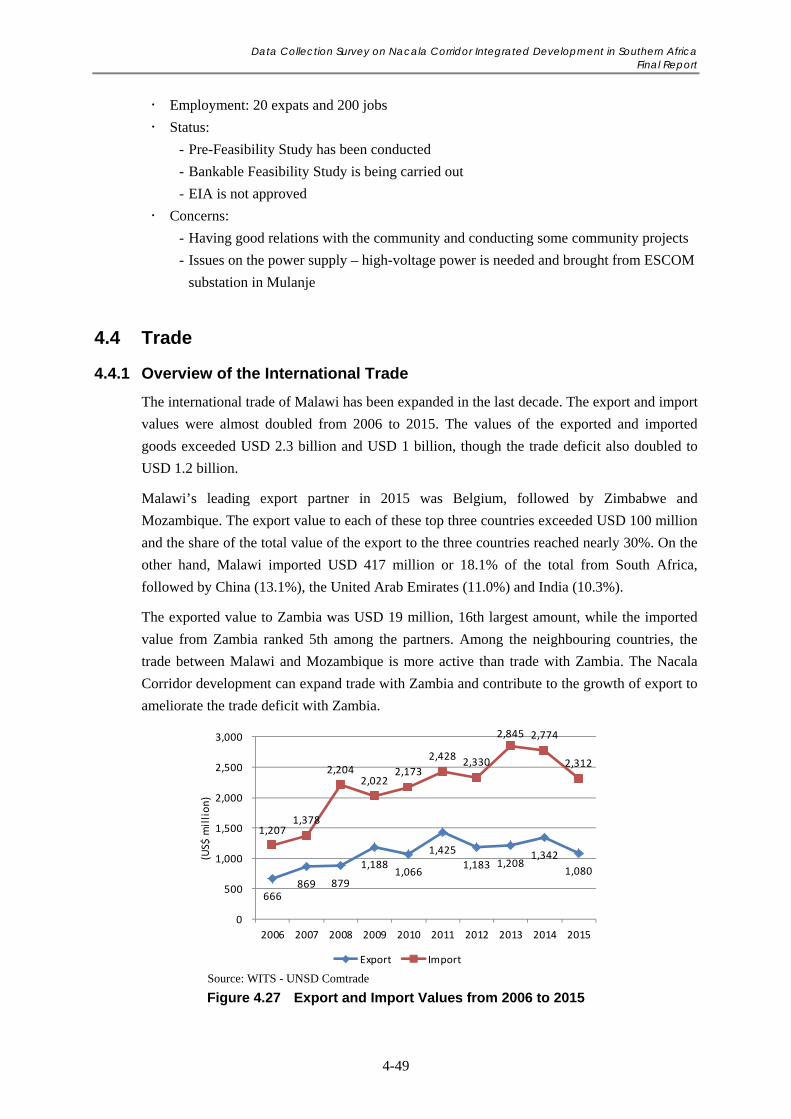
Data Collection Survey on Nacala Corridor Integrated Development in Southern Africa Final Report
4-49
Employment: 20 expats and 200 jobs
Status:
- Pre-Feasibility Study has been conducted
- Bankable Feasibility Study is being carried out
- EIA is not approved
Concerns:
- Having good relations with the community and conducting some community projects
- Issues on the power supply – high-voltage power is needed and brought from ESCOM
substation in Mulanje
4.4 Trade
4.4.1 Overview of the International Trade
The international trade of Malawi has been expanded in the last decade. The export and import
values were almost doubled from 2006 to 2015. The values of the exported and imported
goods exceeded USD 2.3 billion and USD 1 billion, though the trade deficit also doubled to
USD 1.2 billion.
Malawi’s leading export partner in 2015 was Belgium, followed by Zimbabwe and
Mozambique. The export value to each of these top three countries exceeded USD 100 million
and the share of the total value of the export to the three countries reached nearly 30%. On the
other hand, Malawi imported USD 417 million or 18.1% of the total from South Africa,
followed by China (13.1%), the United Arab Emirates (11.0%) and India (10.3%).
The exported value to Zambia was USD 19 million, 16th largest amount, while the imported
value from Zambia ranked 5th among the partners. Among the neighbouring countries, the
trade between Malawi and Mozambique is more active than trade with Zambia. The Nacala
Corridor development can expand trade with Zambia and contribute to the growth of export to
ameliorate the trade deficit with Zambia.
Source: WITS - UNSD Comtrade
Figure 4.27 Export and Import Values from 2006 to 2015
666 869 879
1,188 1,066
1,425
1,183 1,208 1,342
1,080
1,207 1,378
2,204 2,022
2,173
2,428 2,330
2,845 2,774
2,312
0
500
1,000
1,500
2,000
2,500
3,000
2006 2007 2008 2009 2010 2011 2012 2013 2014 2015
(US$
million)
Export Import
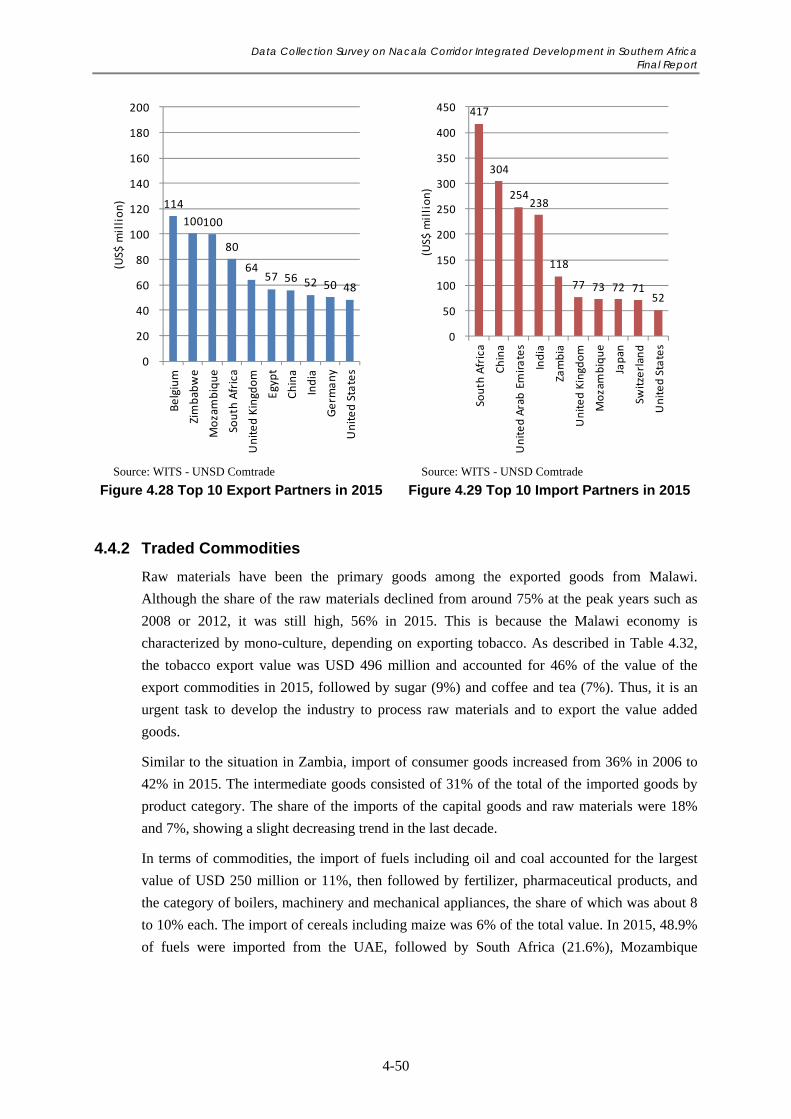
Data Collection Survey on Nacala Corridor Integrated Development in Southern Africa Final Report
4-50
Source: WITS - UNSD Comtrade
Figure 4.28 Top 10 Export Partners in 2015
Source: WITS - UNSD Comtrade
Figure 4.29 Top 10 Import Partners in 2015
4.4.2 Traded Commodities
Raw materials have been the primary goods among the exported goods from Malawi.
Although the share of the raw materials declined from around 75% at the peak years such as
2008 or 2012, it was still high, 56% in 2015. This is because the Malawi economy is
characterized by mono-culture, depending on exporting tobacco. As described in Table 4.32,
the tobacco export value was USD 496 million and accounted for 46% of the value of the
export commodities in 2015, followed by sugar (9%) and coffee and tea (7%). Thus, it is an
urgent task to develop the industry to process raw materials and to export the value added
goods.
Similar to the situation in Zambia, import of consumer goods increased from 36% in 2006 to
42% in 2015. The intermediate goods consisted of 31% of the total of the imported goods by
product category. The share of the imports of the capital goods and raw materials were 18%
and 7%, showing a slight decreasing trend in the last decade.
In terms of commodities, the import of fuels including oil and coal accounted for the largest
value of USD 250 million or 11%, then followed by fertilizer, pharmaceutical products, and
the category of boilers, machinery and mechanical appliances, the share of which was about 8
to 10% each. The import of cereals including maize was 6% of the total value. In 2015, 48.9%
of fuels were imported from the UAE, followed by South Africa (21.6%), Mozambique
114
100 100
80
64 57 56 52 50 48
0
20
40
60
80
100
120
140
160
180
200
Belgium
Zimbabwe
Mozambique
South Africa
United Kingdom
Egypt
China
India
Germ
any
United States
(US$
million)
417
304
254 238
118
77 73 72 71 52
0
50
100
150
200
250
300
350
400
450
South Africa
China
United Arab Emirates
India
Zambia
United Kingdom
Mozambique
Japan
Switzerland
United States
(US$
million)
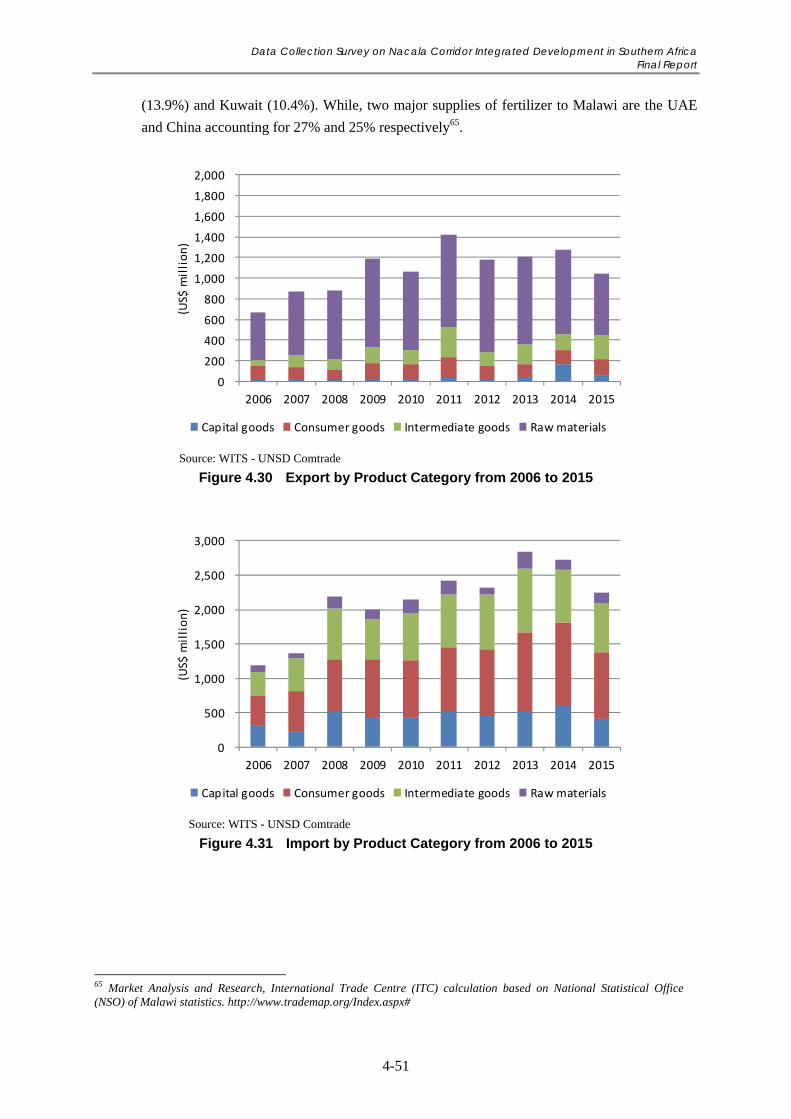
Data Collection Survey on Nacala Corridor Integrated Development in Southern Africa Final Report
4-51
(13.9%) and Kuwait (10.4%). While, two major supplies of fertilizer to Malawi are the UAE
and China accounting for 27% and 25% respectively65.
Source: WITS - UNSD Comtrade
Figure 4.30 Export by Product Category from 2006 to 2015
Source: WITS - UNSD Comtrade
Figure 4.31 Import by Product Category from 2006 to 2015
65 Market Analysis and Research, International Trade Centre (ITC) calculation based on National Statistical Office (NSO) of Malawi statistics. http://www.trademap.org/Index.aspx#
0
200
400
600
800
1,000
1,200
1,400
1,600
1,800
2,000
2006 2007 2008 2009 2010 2011 2012 2013 2014 2015
(US$
million)
Capital goods Consumer goods Intermediate goods Raw materials
0
500
1,000
1,500
2,000
2,500
3,000
2006 2007 2008 2009 2010 2011 2012 2013 2014 2015
(US$
million)
Capital goods Consumer goods Intermediate goods Raw materials
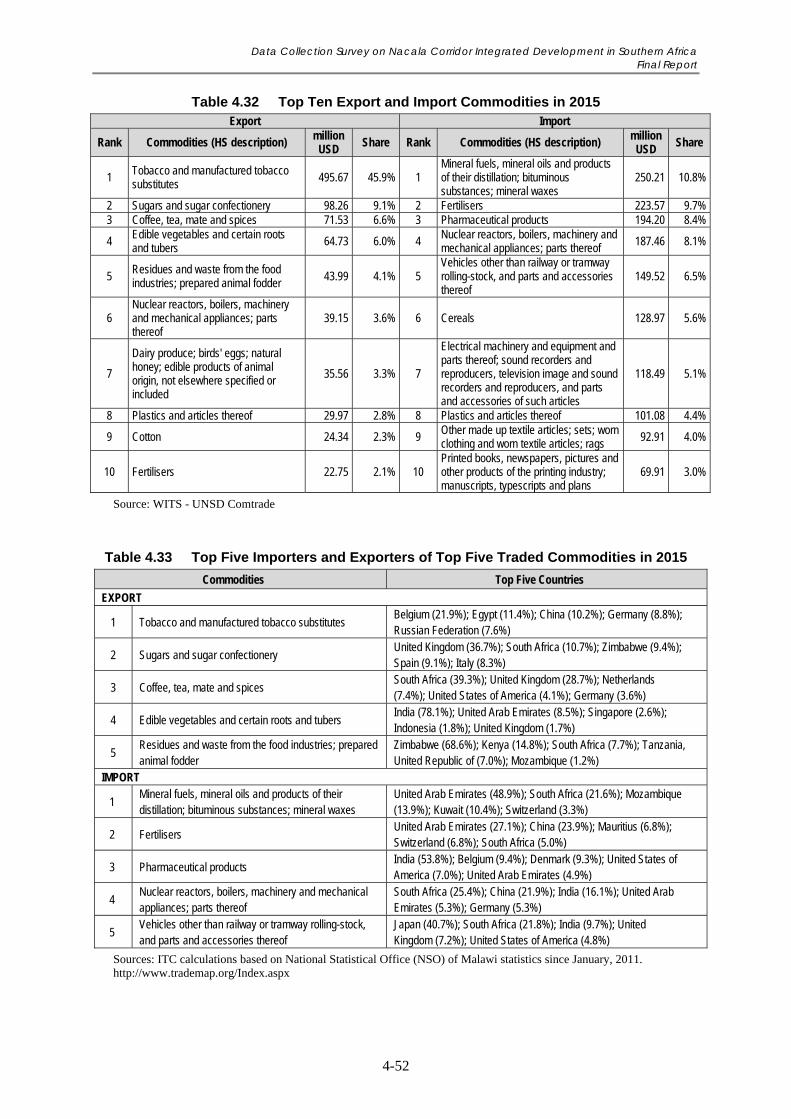
Data Collection Survey on Nacala Corridor Integrated Development in Southern Africa Final Report
4-52
Table 4.32 Top Ten Export and Import Commodities in 2015 Export Import
Rank Commodities (HS description) million USD
Share Rank Commodities (HS description) million USD
Share
1 Tobacco and manufactured tobacco substitutes 495.67 45.9% 1
Mineral fuels, mineral oils and products of their distillation; bituminous substances; mineral waxes
250.21 10.8%
2 Sugars and sugar confectionery 98.26 9.1% 2 Fertilisers 223.57 9.7% 3 Coffee, tea, mate and spices 71.53 6.6% 3 Pharmaceutical products 194.20 8.4%
4 Edible vegetables and certain roots and tubers 64.73 6.0% 4 Nuclear reactors, boilers, machinery and
mechanical appliances; parts thereof 187.46 8.1%
5 Residues and waste from the food industries; prepared animal fodder 43.99 4.1% 5
Vehicles other than railway or tramway rolling-stock, and parts and accessories thereof
149.52 6.5%
6 Nuclear reactors, boilers, machinery and mechanical appliances; parts thereof
39.15 3.6% 6 Cereals 128.97 5.6%
7
Dairy produce; birds' eggs; natural honey; edible products of animal origin, not elsewhere specified or included
35.56 3.3% 7
Electrical machinery and equipment and parts thereof; sound recorders and reproducers, television image and sound recorders and reproducers, and parts and accessories of such articles
118.49 5.1%
8 Plastics and articles thereof 29.97 2.8% 8 Plastics and articles thereof 101.08 4.4%
9 Cotton 24.34 2.3% 9 Other made up textile articles; sets; worn clothing and worn textile articles; rags 92.91 4.0%
10 Fertilisers 22.75 2.1% 10 Printed books, newspapers, pictures and other products of the printing industry; manuscripts, typescripts and plans
69.91 3.0%
Source: WITS - UNSD Comtrade
Table 4.33 Top Five Importers and Exporters of Top Five Traded Commodities in 2015
Commodities Top Five Countries
EXPORT
1 Tobacco and manufactured tobacco substitutes Belgium (21.9%); Egypt (11.4%); China (10.2%); Germany (8.8%); Russian Federation (7.6%)
2 Sugars and sugar confectionery United Kingdom (36.7%); South Africa (10.7%); Zimbabwe (9.4%); Spain (9.1%); Italy (8.3%)
3 Coffee, tea, mate and spices South Africa (39.3%); United Kingdom (28.7%); Netherlands (7.4%); United States of America (4.1%); Germany (3.6%)
4 Edible vegetables and certain roots and tubers India (78.1%); United Arab Emirates (8.5%); Singapore (2.6%); Indonesia (1.8%); United Kingdom (1.7%)
5 Residues and waste from the food industries; prepared animal fodder
Zimbabwe (68.6%); Kenya (14.8%); South Africa (7.7%); Tanzania, United Republic of (7.0%); Mozambique (1.2%)
IMPORT
1 Mineral fuels, mineral oils and products of their distillation; bituminous substances; mineral waxes
United Arab Emirates (48.9%); South Africa (21.6%); Mozambique (13.9%); Kuwait (10.4%); Switzerland (3.3%)
2 Fertilisers United Arab Emirates (27.1%); China (23.9%); Mauritius (6.8%); Switzerland (6.8%); South Africa (5.0%)
3 Pharmaceutical products India (53.8%); Belgium (9.4%); Denmark (9.3%); United States of America (7.0%); United Arab Emirates (4.9%)
4 Nuclear reactors, boilers, machinery and mechanical appliances; parts thereof
South Africa (25.4%); China (21.9%); India (16.1%); United Arab Emirates (5.3%); Germany (5.3%)
5 Vehicles other than railway or tramway rolling-stock, and parts and accessories thereof
Japan (40.7%); South Africa (21.8%); India (9.7%); United Kingdom (7.2%); United States of America (4.8%)
Sources: ITC calculations based on National Statistical Office (NSO) of Malawi statistics since January, 2011. http://www.trademap.org/Index.aspx
Data Collection Survey on Nacala Corridor Integrated Development in Southern Africa Final Report
4-53
4.4.3 Development Potential and Challenges of the Trade Sector in the Nacala Corridor Region
For Malawi’s trade sector, the reduction of the persistent trade deficit is a crucial issue. In
order to expand the export values, industry development is indispensable to produce and
export the value added products, not the raw materials. Although the future of the tobacco
industry is unknown, the development of high-quality tobacco products and establishing a
Malawian brand image of tobacco and tea could contribute to value addition to and the export
of these traditional commodities. Moreover, regarding the expansion of the production of
stable food, maize is important not only for the reduction of the import of maize from Zambia
but also for food security. The development of agro-processing industry development and
capacity building for that purpose is in urgent need.
The development of the Nacala Corridor can promote the export of the agricultural products,
such as tobacco, sugar, tea, and groundnuts by the improved access and reduction of the
transport cost. According to the interviews with the tobacco industry and logistics firms, the
improvement and rehabilitation of the railways of the Nacala Corridor and construction and
expansion of container terminals can significantly improve the transport and expand the export
of tobacco, sugar, and other commodities such as pigeon peas. Meanwhile, the railways have a
potential to reduce the transport cost of the fuel, the largest imported commodity. As discussed
in the trade sector of Zambia, groundnuts are the major commodity exported to Zambia from
Malawi through the Nacala Corridor. The improvement of the Nacala Corridor may be able to
contribute to expansion of the export of groundnuts and other products. The establishment of
the OSBP can reduce the trade barriers by improving the custom procedure, so that the
development of the OSBP on the border with Mozambique should be encouraged as well.
However, the corridor development might have a potential to also increase the import from
Zambia.
4.5 Tourism
4.5.1 Overview of the Tourism
The tourism sector in Malawi contributed MWK 138 billion (USD 194.9 million) to GDP
directly, and MWK 290 billion (USD 409.0 million) to GDP totally, which accounted for
3.4% and 7.2% of total GDP in 2016. The sector is expected to grow by 4.1% in 201766.
The tourist arrival was 804,900 persons in 2015 and has increased by the annual average
growth rate of 1.53% since 2010. Nearly 80% of the tourists came from Africa, followed by
those from Europe, which accounted for 12%. The primary purpose of the visit to Malawi was
work or business related. The visitors coming for business reached 73% of the visitors in 2015
and increased by 15% since 2010, while the tourists for holidays and vacation and for visiting
friends and relatives declined by 7% each.
66 World Travel & Tourism Council. TRAVEL & TOURISM ECONOMIC IMPACT 2017 MALAWI. https://www.wttc.org/-/media/files/reports/economic-impact-research/countries-2017/malawi2017.pdf
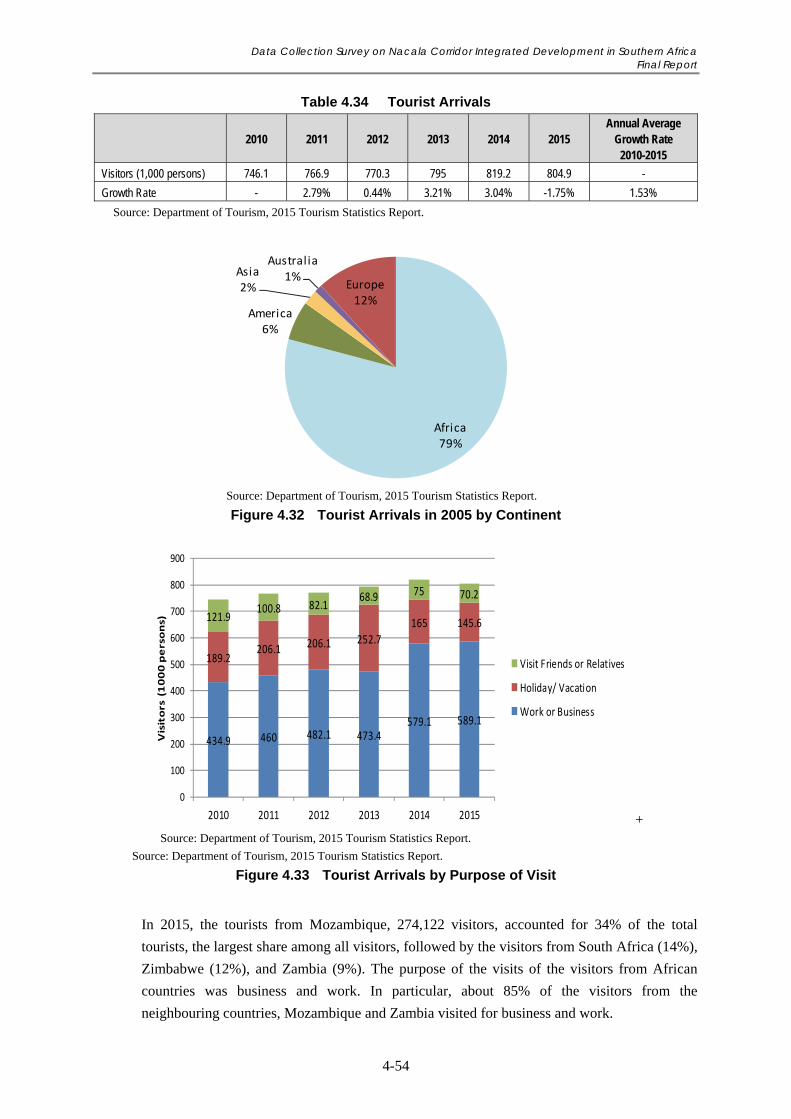
Data Collection Survey on Nacala Corridor Integrated Development in Southern Africa Final Report
4-54
Table 4.34 Tourist Arrivals
2010 2011 2012 2013 2014 2015 Annual Average
Growth Rate 2010-2015
Visitors (1,000 persons) 746.1 766.9 770.3 795 819.2 804.9 -
Growth Rate - 2.79% 0.44% 3.21% 3.04% -1.75% 1.53%
Source: Department of Tourism, 2015 Tourism Statistics Report.
Source: Department of Tourism, 2015 Tourism Statistics Report.
Figure 4.32 Tourist Arrivals in 2005 by Continent
+ Source: Department of Tourism, 2015 Tourism Statistics Report.
Source: Department of Tourism, 2015 Tourism Statistics Report.
Figure 4.33 Tourist Arrivals by Purpose of Visit
In 2015, the tourists from Mozambique, 274,122 visitors, accounted for 34% of the total
tourists, the largest share among all visitors, followed by the visitors from South Africa (14%),
Zimbabwe (12%), and Zambia (9%). The purpose of the visits of the visitors from African
countries was business and work. In particular, about 85% of the visitors from the
neighbouring countries, Mozambique and Zambia visited for business and work.
Africa79%
America6%
Asia2%
Australia1%
Europe12%
434.9 460 482.1 473.4579.1 589.1
189.2206.1 206.1 252.7
165 145.6121.9100.8 82.1
68.9 75 70.2
0
100
200
300
400
500
600
700
800
900
2010 2011 2012 2013 2014 2015
Visitors (1000 persons)
Visit Friends or Relatives
Holiday/ Vacation
Work or Business
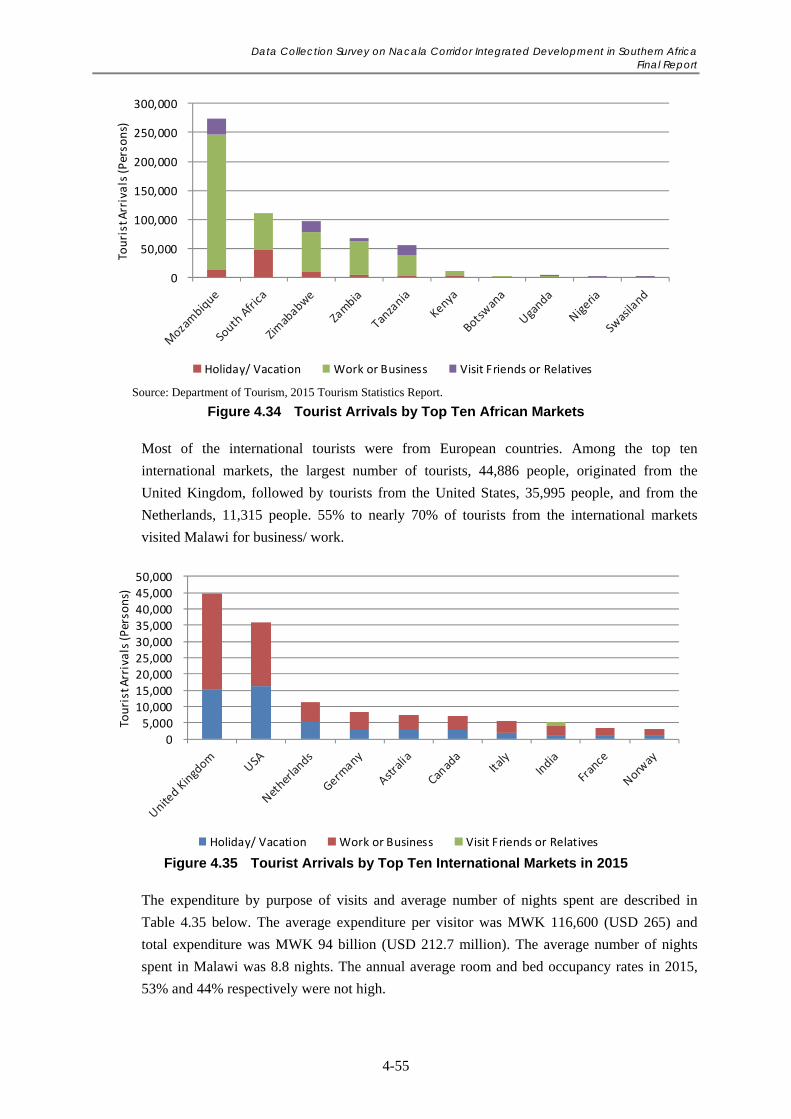
Data Collection Survey on Nacala Corridor Integrated Development in Southern Africa Final Report
4-55
Source: Department of Tourism, 2015 Tourism Statistics Report.
Figure 4.34 Tourist Arrivals by Top Ten African Markets
Most of the international tourists were from European countries. Among the top ten
international markets, the largest number of tourists, 44,886 people, originated from the
United Kingdom, followed by tourists from the United States, 35,995 people, and from the
Netherlands, 11,315 people. 55% to nearly 70% of tourists from the international markets
visited Malawi for business/ work.
Figure 4.35 Tourist Arrivals by Top Ten International Markets in 2015
The expenditure by purpose of visits and average number of nights spent are described in
Table 4.35 below. The average expenditure per visitor was MWK 116,600 (USD 265) and
total expenditure was MWK 94 billion (USD 212.7 million). The average number of nights
spent in Malawi was 8.8 nights. The annual average room and bed occupancy rates in 2015,
53% and 44% respectively were not high.
0
50,000
100,000
150,000
200,000
250,000
300,000
Tourist Arrivals (Persons)
Holiday/ Vacation Work or Business Visit Friends or Relatives
0
5,000
10,000
15,000
20,000
25,000
30,000
35,000
40,000
45,000
50,000
Tourist Arrivals (Persons)
Holiday/ Vacation Work or Business Visit Friends or Relatives
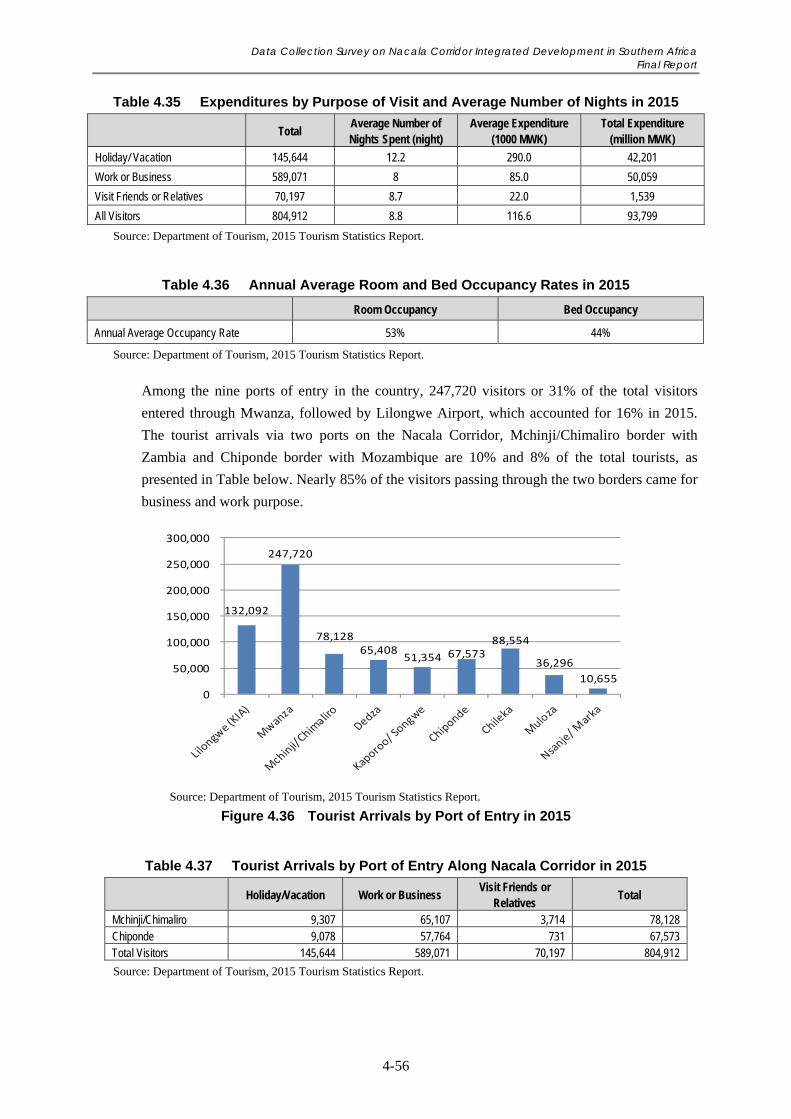
Data Collection Survey on Nacala Corridor Integrated Development in Southern Africa Final Report
4-56
Table 4.35 Expenditures by Purpose of Visit and Average Number of Nights in 2015
Total Average Number of Nights Spent (night)
Average Expenditure (1000 MWK)
Total Expenditure (million MWK)
Holiday/ Vacation 145,644 12.2 290.0 42,201
Work or Business 589,071 8 85.0 50,059
Visit Friends or Relatives 70,197 8.7 22.0 1,539
All Visitors 804,912 8.8 116.6 93,799
Source: Department of Tourism, 2015 Tourism Statistics Report.
Table 4.36 Annual Average Room and Bed Occupancy Rates in 2015
Room Occupancy Bed Occupancy
Annual Average Occupancy Rate 53% 44%
Source: Department of Tourism, 2015 Tourism Statistics Report.
Among the nine ports of entry in the country, 247,720 visitors or 31% of the total visitors
entered through Mwanza, followed by Lilongwe Airport, which accounted for 16% in 2015.
The tourist arrivals via two ports on the Nacala Corridor, Mchinji/Chimaliro border with
Zambia and Chiponde border with Mozambique are 10% and 8% of the total tourists, as
presented in Table below. Nearly 85% of the visitors passing through the two borders came for
business and work purpose.
Source: Department of Tourism, 2015 Tourism Statistics Report.
Figure 4.36 Tourist Arrivals by Port of Entry in 2015
Table 4.37 Tourist Arrivals by Port of Entry Along Nacala Corridor in 2015
Holiday/Vacation Work or Business Visit Friends or
Relatives Total
Mchinji/Chimaliro 9,307 65,107 3,714 78,128 Chiponde 9,078 57,764 731 67,573 Total Visitors 145,644 589,071 70,197 804,912
Source: Department of Tourism, 2015 Tourism Statistics Report.
132,092
247,720
78,128 65,408
51,354 67,573 88,554
36,296
10,655
0
50,000
100,000
150,000
200,000
250,000
300,000
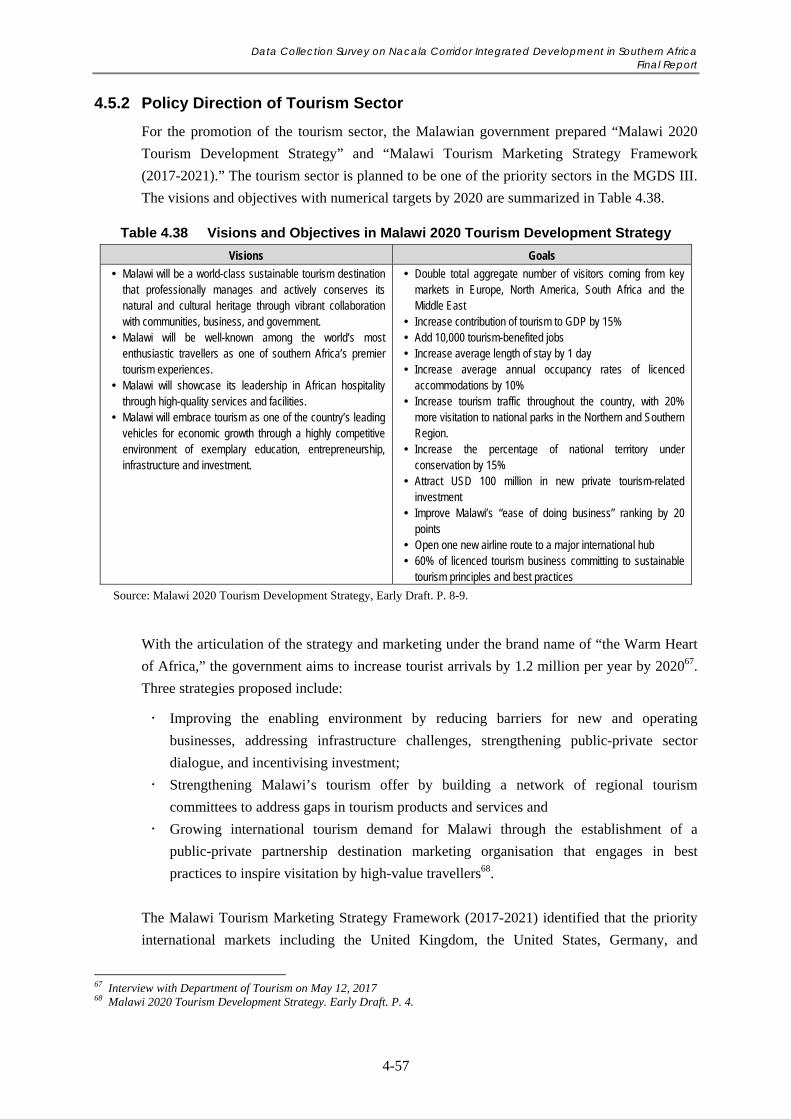
Data Collection Survey on Nacala Corridor Integrated Development in Southern Africa Final Report
4-57
4.5.2 Policy Direction of Tourism Sector
For the promotion of the tourism sector, the Malawian government prepared “Malawi 2020
Tourism Development Strategy” and “Malawi Tourism Marketing Strategy Framework
(2017-2021).” The tourism sector is planned to be one of the priority sectors in the MGDS III.
The visions and objectives with numerical targets by 2020 are summarized in Table 4.38.
Table 4.38 Visions and Objectives in Malawi 2020 Tourism Development Strategy
Visions Goals
Malawi will be a world-class sustainable tourism destination that professionally manages and actively conserves its natural and cultural heritage through vibrant collaboration with communities, business, and government.
Malawi will be well-known among the world’s most enthusiastic travellers as one of southern Africa’s premier tourism experiences.
Malawi will showcase its leadership in African hospitality through high-quality services and facilities.
Malawi will embrace tourism as one of the country’s leading vehicles for economic growth through a highly competitive environment of exemplary education, entrepreneurship, infrastructure and investment.
Double total aggregate number of visitors coming from key markets in Europe, North America, South Africa and the Middle East
Increase contribution of tourism to GDP by 15% Add 10,000 tourism-benefited jobs Increase average length of stay by 1 day Increase average annual occupancy rates of licenced
accommodations by 10% Increase tourism traffic throughout the country, with 20%
more visitation to national parks in the Northern and Southern Region.
Increase the percentage of national territory under conservation by 15%
Attract USD 100 million in new private tourism-related investment
Improve Malawi’s “ease of doing business” ranking by 20 points
Open one new airline route to a major international hub 60% of licenced tourism business committing to sustainable
tourism principles and best practices
Source: Malawi 2020 Tourism Development Strategy, Early Draft. P. 8-9.
With the articulation of the strategy and marketing under the brand name of “the Warm Heart
of Africa,” the government aims to increase tourist arrivals by 1.2 million per year by 202067.
Three strategies proposed include:
Improving the enabling environment by reducing barriers for new and operating
businesses, addressing infrastructure challenges, strengthening public-private sector
dialogue, and incentivising investment;
Strengthening Malawi’s tourism offer by building a network of regional tourism
committees to address gaps in tourism products and services and
Growing international tourism demand for Malawi through the establishment of a
public-private partnership destination marketing organisation that engages in best
practices to inspire visitation by high-value travellers68.
The Malawi Tourism Marketing Strategy Framework (2017-2021) identified that the priority
international markets including the United Kingdom, the United States, Germany, and
67 Interview with Department of Tourism on May 12, 2017 68 Malawi 2020 Tourism Development Strategy. Early Draft. P. 4.
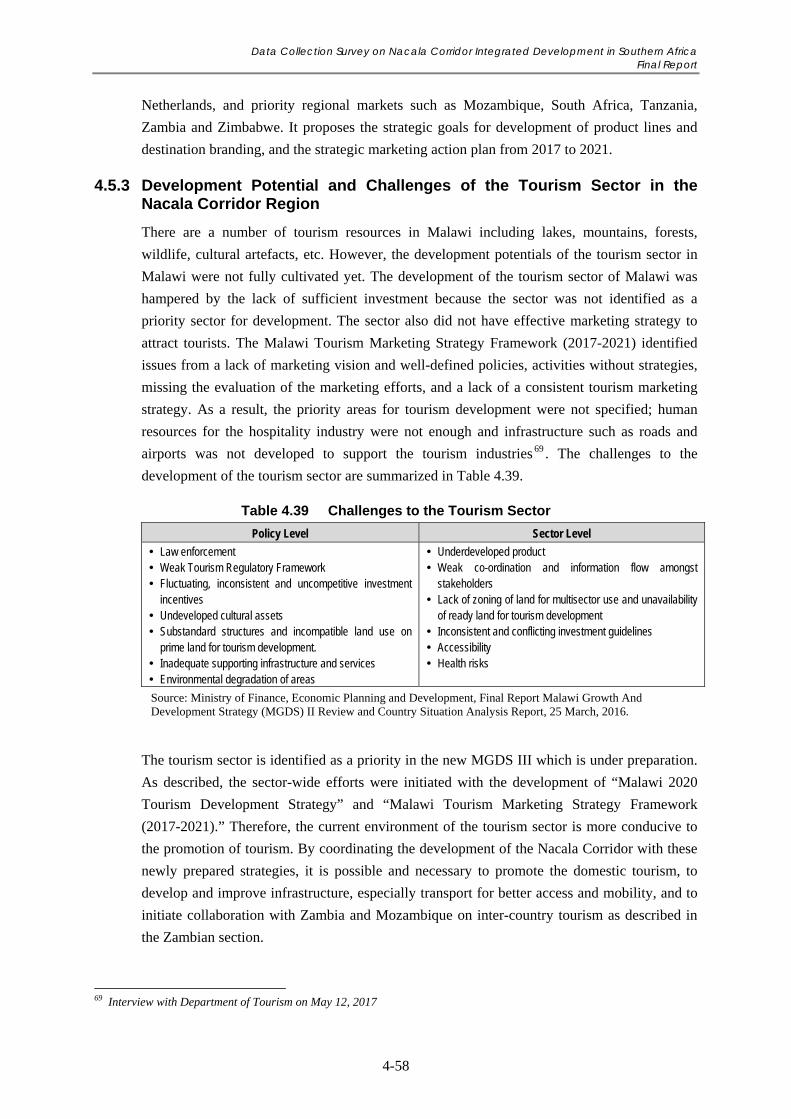
Data Collection Survey on Nacala Corridor Integrated Development in Southern Africa Final Report
4-58
Netherlands, and priority regional markets such as Mozambique, South Africa, Tanzania,
Zambia and Zimbabwe. It proposes the strategic goals for development of product lines and
destination branding, and the strategic marketing action plan from 2017 to 2021.
4.5.3 Development Potential and Challenges of the Tourism Sector in the Nacala Corridor Region
There are a number of tourism resources in Malawi including lakes, mountains, forests,
wildlife, cultural artefacts, etc. However, the development potentials of the tourism sector in
Malawi were not fully cultivated yet. The development of the tourism sector of Malawi was
hampered by the lack of sufficient investment because the sector was not identified as a
priority sector for development. The sector also did not have effective marketing strategy to
attract tourists. The Malawi Tourism Marketing Strategy Framework (2017-2021) identified
issues from a lack of marketing vision and well-defined policies, activities without strategies,
missing the evaluation of the marketing efforts, and a lack of a consistent tourism marketing
strategy. As a result, the priority areas for tourism development were not specified; human
resources for the hospitality industry were not enough and infrastructure such as roads and
airports was not developed to support the tourism industries 69 . The challenges to the
development of the tourism sector are summarized in Table 4.39.
Table 4.39 Challenges to the Tourism Sector
Policy Level Sector Level
Law enforcement Weak Tourism Regulatory Framework Fluctuating, inconsistent and uncompetitive investment
incentives Undeveloped cultural assets Substandard structures and incompatible land use on
prime land for tourism development. Inadequate supporting infrastructure and services Environmental degradation of areas
Underdeveloped product Weak co-ordination and information flow amongst
stakeholders Lack of zoning of land for multisector use and unavailability
of ready land for tourism development Inconsistent and conflicting investment guidelines Accessibility Health risks
Source: Ministry of Finance, Economic Planning and Development, Final Report Malawi Growth And Development Strategy (MGDS) II Review and Country Situation Analysis Report, 25 March, 2016.
The tourism sector is identified as a priority in the new MGDS III which is under preparation.
As described, the sector-wide efforts were initiated with the development of “Malawi 2020
Tourism Development Strategy” and “Malawi Tourism Marketing Strategy Framework
(2017-2021).” Therefore, the current environment of the tourism sector is more conducive to
the promotion of tourism. By coordinating the development of the Nacala Corridor with these
newly prepared strategies, it is possible and necessary to promote the domestic tourism, to
develop and improve infrastructure, especially transport for better access and mobility, and to
initiate collaboration with Zambia and Mozambique on inter-country tourism as described in
the Zambian section.
69 Interview with Department of Tourism on May 12, 2017
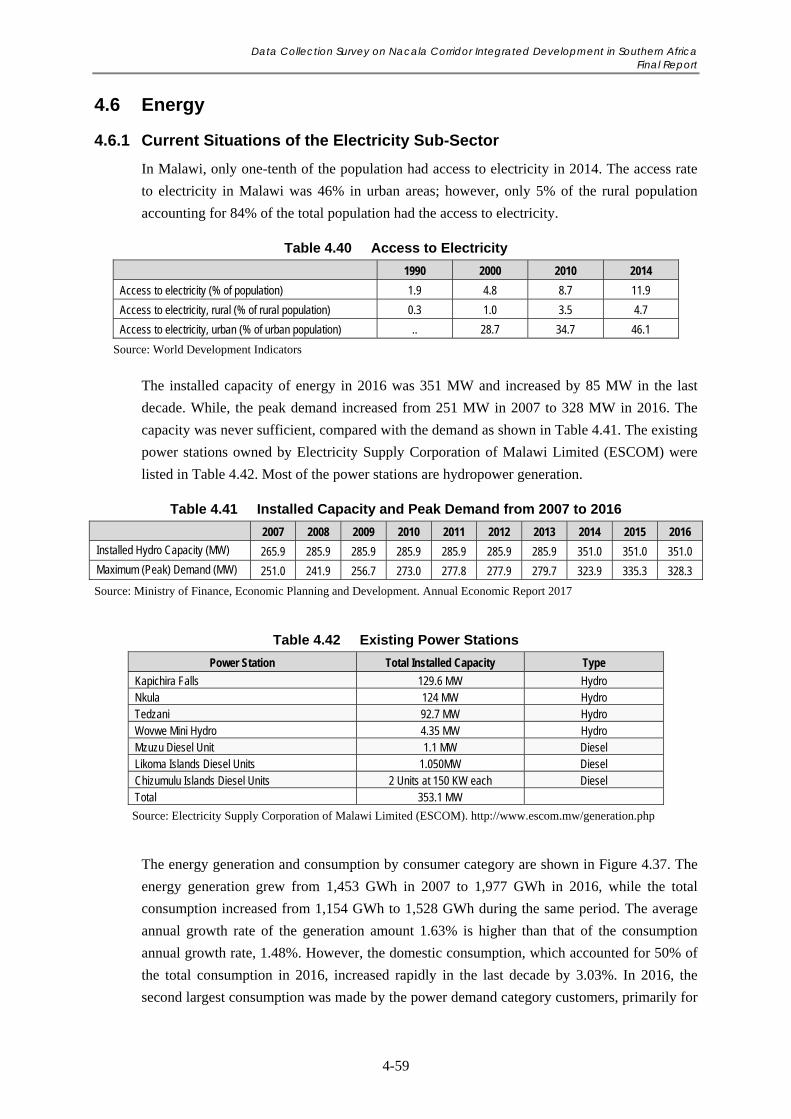
Data Collection Survey on Nacala Corridor Integrated Development in Southern Africa Final Report
4-59
4.6 Energy
4.6.1 Current Situations of the Electricity Sub-Sector
In Malawi, only one-tenth of the population had access to electricity in 2014. The access rate
to electricity in Malawi was 46% in urban areas; however, only 5% of the rural population
accounting for 84% of the total population had the access to electricity.
Table 4.40 Access to Electricity
1990 2000 2010 2014
Access to electricity (% of population) 1.9 4.8 8.7 11.9
Access to electricity, rural (% of rural population) 0.3 1.0 3.5 4.7
Access to electricity, urban (% of urban population) .. 28.7 34.7 46.1
Source: World Development Indicators
The installed capacity of energy in 2016 was 351 MW and increased by 85 MW in the last
decade. While, the peak demand increased from 251 MW in 2007 to 328 MW in 2016. The
capacity was never sufficient, compared with the demand as shown in Table 4.41. The existing
power stations owned by Electricity Supply Corporation of Malawi Limited (ESCOM) were
listed in Table 4.42. Most of the power stations are hydropower generation.
Table 4.41 Installed Capacity and Peak Demand from 2007 to 2016
2007 2008 2009 2010 2011 2012 2013 2014 2015 2016
Installed Hydro Capacity (MW) 265.9 285.9 285.9 285.9 285.9 285.9 285.9 351.0 351.0 351.0
Maximum (Peak) Demand (MW) 251.0 241.9 256.7 273.0 277.8 277.9 279.7 323.9 335.3 328.3
Source: Ministry of Finance, Economic Planning and Development. Annual Economic Report 2017
Table 4.42 Existing Power Stations
Power Station Total Installed Capacity Type
Kapichira Falls 129.6 MW Hydro Nkula 124 MW Hydro Tedzani 92.7 MW Hydro Wovwe Mini Hydro 4.35 MW Hydro Mzuzu Diesel Unit 1.1 MW Diesel Likoma Islands Diesel Units 1.050MW Diesel Chizumulu Islands Diesel Units 2 Units at 150 KW each Diesel Total 353.1 MW
Source: Electricity Supply Corporation of Malawi Limited (ESCOM). http://www.escom.mw/generation.php
The energy generation and consumption by consumer category are shown in Figure 4.37. The
energy generation grew from 1,453 GWh in 2007 to 1,977 GWh in 2016, while the total
consumption increased from 1,154 GWh to 1,528 GWh during the same period. The average
annual growth rate of the generation amount 1.63% is higher than that of the consumption
annual growth rate, 1.48%. However, the domestic consumption, which accounted for 50% of
the total consumption in 2016, increased rapidly in the last decade by 3.03%. In 2016, the
second largest consumption was made by the power demand category customers, primarily for
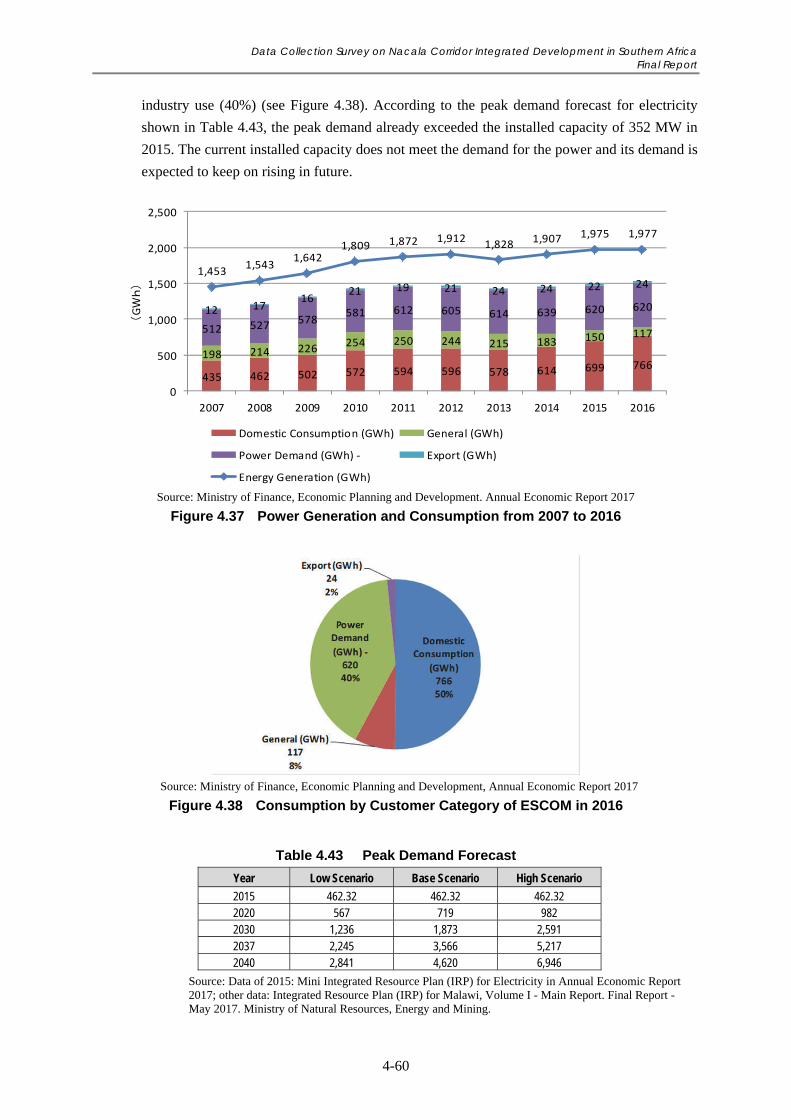
Data Collection Survey on Nacala Corridor Integrated Development in Southern Africa Final Report
4-60
industry use (40%) (see Figure 4.38). According to the peak demand forecast for electricity
shown in Table 4.43, the peak demand already exceeded the installed capacity of 352 MW in
2015. The current installed capacity does not meet the demand for the power and its demand is
expected to keep on rising in future.
Source: Ministry of Finance, Economic Planning and Development. Annual Economic Report 2017
Figure 4.37 Power Generation and Consumption from 2007 to 2016
Source: Ministry of Finance, Economic Planning and Development, Annual Economic Report 2017
Figure 4.38 Consumption by Customer Category of ESCOM in 2016
Table 4.43 Peak Demand Forecast
Year Low Scenario Base Scenario High Scenario
2015 462.32 462.32 462.32 2020 567 719 982 2030 1,236 1,873 2,591 2037 2,245 3,566 5,217 2040 2,841 4,620 6,946
Source: Data of 2015: Mini Integrated Resource Plan (IRP) for Electricity in Annual Economic Report 2017; other data: Integrated Resource Plan (IRP) for Malawi, Volume I - Main Report. Final Report - May 2017. Ministry of Natural Resources, Energy and Mining.
1,4531,543
1,6421,809 1,872 1,912
1,828 1,907 1,975 1,977
435 462 502 572 594 596 578 614 699 766198 214 226
254 250 244 215 183 150 117512 527 578581 612 605 614 639 620 62012 17
1621 19 21 24 24 22 24
0
500
1,000
1,500
2,000
2,500
2007 2008 2009 2010 2011 2012 2013 2014 2015 2016
(GW
h)
Domestic Consumption (GWh) General (GWh)
Power Demand (GWh) ‐ Export (GWh)
Energy Generation (GWh)
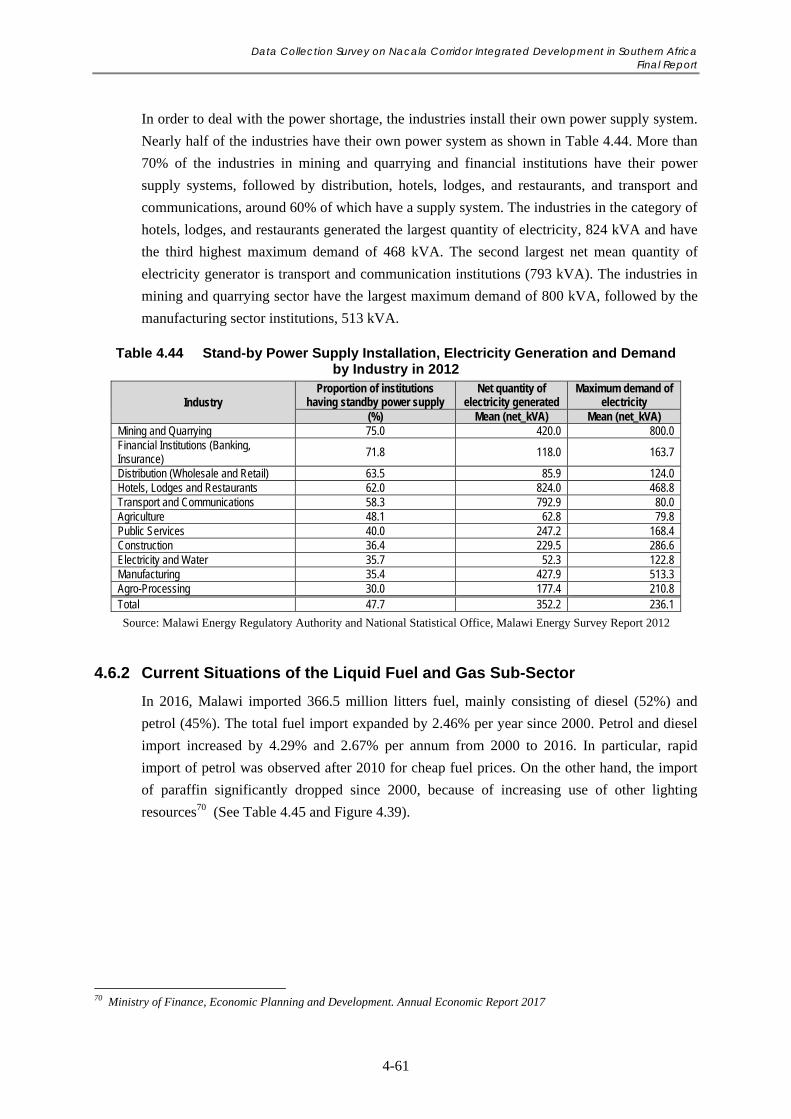
Data Collection Survey on Nacala Corridor Integrated Development in Southern Africa Final Report
4-61
In order to deal with the power shortage, the industries install their own power supply system.
Nearly half of the industries have their own power system as shown in Table 4.44. More than
70% of the industries in mining and quarrying and financial institutions have their power
supply systems, followed by distribution, hotels, lodges, and restaurants, and transport and
communications, around 60% of which have a supply system. The industries in the category of
hotels, lodges, and restaurants generated the largest quantity of electricity, 824 kVA and have
the third highest maximum demand of 468 kVA. The second largest net mean quantity of
electricity generator is transport and communication institutions (793 kVA). The industries in
mining and quarrying sector have the largest maximum demand of 800 kVA, followed by the
manufacturing sector institutions, 513 kVA.
Table 4.44 Stand-by Power Supply Installation, Electricity Generation and Demand by Industry in 2012
Industry Proportion of institutions
having standby power supply Net quantity of
electricity generated Maximum demand of
electricity (%) Mean (net_kVA) Mean (net_kVA)
Mining and Quarrying 75.0 420.0 800.0 Financial Institutions (Banking, Insurance)
71.8 118.0 163.7
Distribution (Wholesale and Retail) 63.5 85.9 124.0 Hotels, Lodges and Restaurants 62.0 824.0 468.8 Transport and Communications 58.3 792.9 80.0 Agriculture 48.1 62.8 79.8 Public Services 40.0 247.2 168.4 Construction 36.4 229.5 286.6 Electricity and Water 35.7 52.3 122.8 Manufacturing 35.4 427.9 513.3 Agro-Processing 30.0 177.4 210.8 Total 47.7 352.2 236.1
Source: Malawi Energy Regulatory Authority and National Statistical Office, Malawi Energy Survey Report 2012
4.6.2 Current Situations of the Liquid Fuel and Gas Sub-Sector
In 2016, Malawi imported 366.5 million litters fuel, mainly consisting of diesel (52%) and
petrol (45%). The total fuel import expanded by 2.46% per year since 2000. Petrol and diesel
import increased by 4.29% and 2.67% per annum from 2000 to 2016. In particular, rapid
import of petrol was observed after 2010 for cheap fuel prices. On the other hand, the import
of paraffin significantly dropped since 2000, because of increasing use of other lighting
resources70 (See Table 4.45 and Figure 4.39).
70 Ministry of Finance, Economic Planning and Development. Annual Economic Report 2017
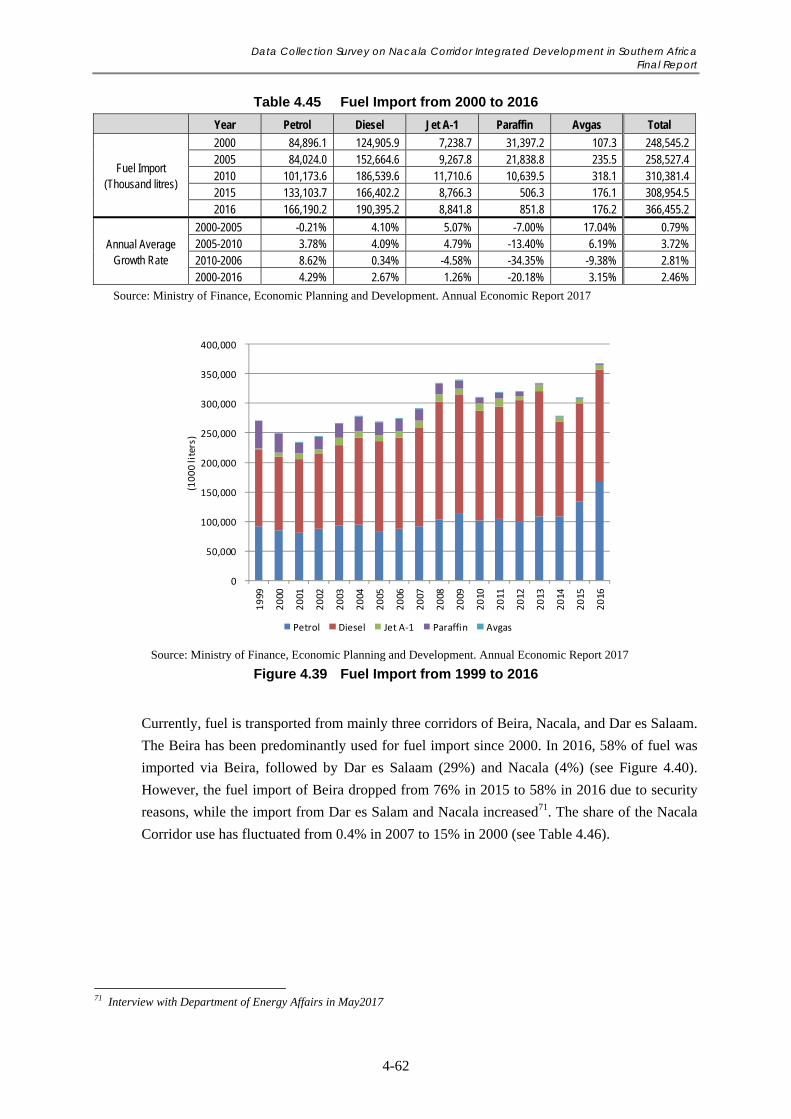
Data Collection Survey on Nacala Corridor Integrated Development in Southern Africa Final Report
4-62
Table 4.45 Fuel Import from 2000 to 2016
Year Petrol Diesel Jet A-1 Paraffin Avgas Total
Fuel Import (Thousand litres)
2000 84,896.1 124,905.9 7,238.7 31,397.2 107.3 248,545.2 2005 84,024.0 152,664.6 9,267.8 21,838.8 235.5 258,527.4 2010 101,173.6 186,539.6 11,710.6 10,639.5 318.1 310,381.4 2015 133,103.7 166,402.2 8,766.3 506.3 176.1 308,954.5 2016 166,190.2 190,395.2 8,841.8 851.8 176.2 366,455.2
Annual Average Growth Rate
2000-2005 -0.21% 4.10% 5.07% -7.00% 17.04% 0.79% 2005-2010 3.78% 4.09% 4.79% -13.40% 6.19% 3.72% 2010-2006 8.62% 0.34% -4.58% -34.35% -9.38% 2.81% 2000-2016 4.29% 2.67% 1.26% -20.18% 3.15% 2.46%
Source: Ministry of Finance, Economic Planning and Development. Annual Economic Report 2017
Source: Ministry of Finance, Economic Planning and Development. Annual Economic Report 2017
Figure 4.39 Fuel Import from 1999 to 2016
Currently, fuel is transported from mainly three corridors of Beira, Nacala, and Dar es Salaam.
The Beira has been predominantly used for fuel import since 2000. In 2016, 58% of fuel was
imported via Beira, followed by Dar es Salaam (29%) and Nacala (4%) (see Figure 4.40).
However, the fuel import of Beira dropped from 76% in 2015 to 58% in 2016 due to security
reasons, while the import from Dar es Salam and Nacala increased71. The share of the Nacala
Corridor use has fluctuated from 0.4% in 2007 to 15% in 2000 (see Table 4.46).
71 Interview with Department of Energy Affairs in May2017
0
50,000
100,000
150,000
200,000
250,000
300,000
350,000
400,000
1999
2000
2001
2002
2003
2004
2005
2006
2007
2008
2009
2010
2011
2012
2013
2014
2015
2016
(1000 liters)
Petrol Diesel Jet A‐1 Paraffin Avgas
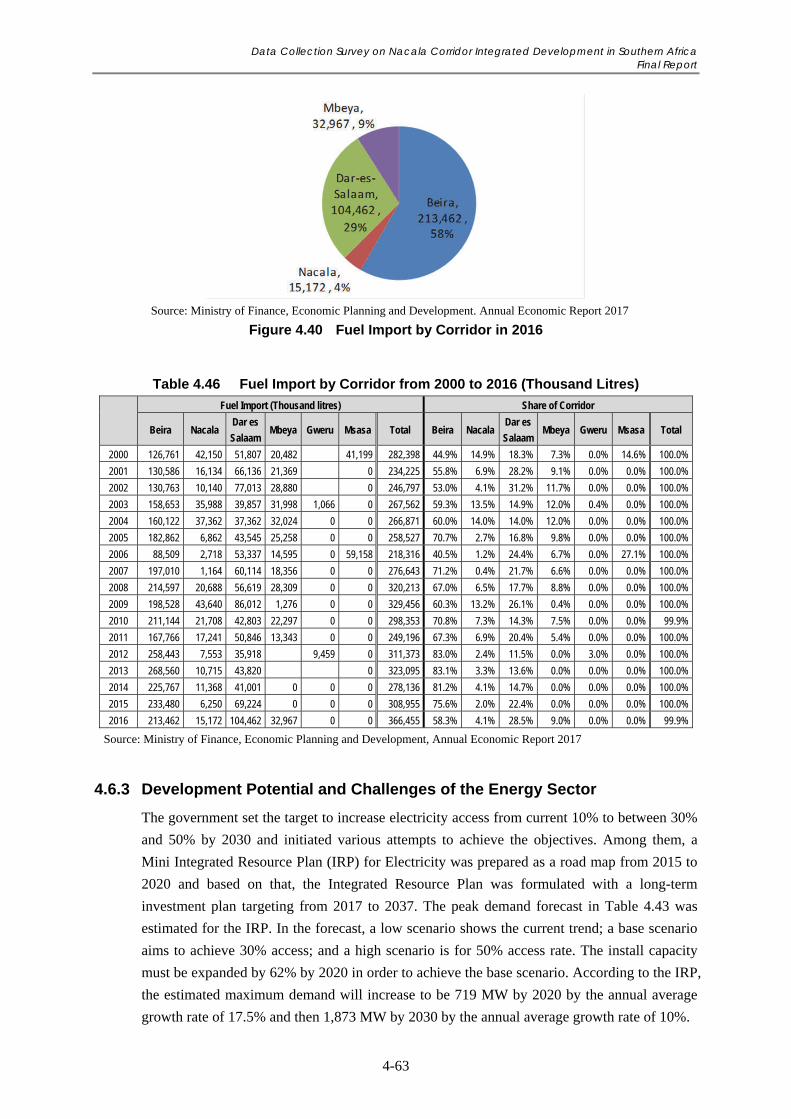
Data Collection Survey on Nacala Corridor Integrated Development in Southern Africa Final Report
4-63
Source: Ministry of Finance, Economic Planning and Development. Annual Economic Report 2017
Figure 4.40 Fuel Import by Corridor in 2016
Table 4.46 Fuel Import by Corridor from 2000 to 2016 (Thousand Litres)
Fuel Import (Thousand litres) Share of Corridor
Beira Nacala Dar es
Salaam Mbeya Gweru Msasa Total Beira Nacala
Dar es
Salaam Mbeya Gweru Msasa Total
2000 126,761 42,150 51,807 20,482 41,199 282,398 44.9% 14.9% 18.3% 7.3% 0.0% 14.6% 100.0%
2001 130,586 16,134 66,136 21,369 0 234,225 55.8% 6.9% 28.2% 9.1% 0.0% 0.0% 100.0%
2002 130,763 10,140 77,013 28,880 0 246,797 53.0% 4.1% 31.2% 11.7% 0.0% 0.0% 100.0%
2003 158,653 35,988 39,857 31,998 1,066 0 267,562 59.3% 13.5% 14.9% 12.0% 0.4% 0.0% 100.0%
2004 160,122 37,362 37,362 32,024 0 0 266,871 60.0% 14.0% 14.0% 12.0% 0.0% 0.0% 100.0%
2005 182,862 6,862 43,545 25,258 0 0 258,527 70.7% 2.7% 16.8% 9.8% 0.0% 0.0% 100.0%
2006 88,509 2,718 53,337 14,595 0 59,158 218,316 40.5% 1.2% 24.4% 6.7% 0.0% 27.1% 100.0%
2007 197,010 1,164 60,114 18,356 0 0 276,643 71.2% 0.4% 21.7% 6.6% 0.0% 0.0% 100.0%
2008 214,597 20,688 56,619 28,309 0 0 320,213 67.0% 6.5% 17.7% 8.8% 0.0% 0.0% 100.0%
2009 198,528 43,640 86,012 1,276 0 0 329,456 60.3% 13.2% 26.1% 0.4% 0.0% 0.0% 100.0%
2010 211,144 21,708 42,803 22,297 0 0 298,353 70.8% 7.3% 14.3% 7.5% 0.0% 0.0% 99.9%
2011 167,766 17,241 50,846 13,343 0 0 249,196 67.3% 6.9% 20.4% 5.4% 0.0% 0.0% 100.0%
2012 258,443 7,553 35,918 9,459 0 311,373 83.0% 2.4% 11.5% 0.0% 3.0% 0.0% 100.0%
2013 268,560 10,715 43,820 0 323,095 83.1% 3.3% 13.6% 0.0% 0.0% 0.0% 100.0%
2014 225,767 11,368 41,001 0 0 0 278,136 81.2% 4.1% 14.7% 0.0% 0.0% 0.0% 100.0%
2015 233,480 6,250 69,224 0 0 0 308,955 75.6% 2.0% 22.4% 0.0% 0.0% 0.0% 100.0%
2016 213,462 15,172 104,462 32,967 0 0 366,455 58.3% 4.1% 28.5% 9.0% 0.0% 0.0% 99.9%
Source: Ministry of Finance, Economic Planning and Development, Annual Economic Report 2017
4.6.3 Development Potential and Challenges of the Energy Sector
The government set the target to increase electricity access from current 10% to between 30%
and 50% by 2030 and initiated various attempts to achieve the objectives. Among them, a
Mini Integrated Resource Plan (IRP) for Electricity was prepared as a road map from 2015 to
2020 and based on that, the Integrated Resource Plan was formulated with a long-term
investment plan targeting from 2017 to 2037. The peak demand forecast in Table 4.43 was
estimated for the IRP. In the forecast, a low scenario shows the current trend; a base scenario
aims to achieve 30% access; and a high scenario is for 50% access rate. The install capacity
must be expanded by 62% by 2020 in order to achieve the base scenario. According to the IRP,
the estimated maximum demand will increase to be 719 MW by 2020 by the annual average
growth rate of 17.5% and then 1,873 MW by 2030 by the annual average growth rate of 10%.
Data Collection Survey on Nacala Corridor Integrated Development in Southern Africa Final Report
4-64
In order to improve the power supply and achieve the stated objective, a number of projects
are proposed and on-going. Major projects are listed in Table 4.47. These projects will
contribute to the expansion of the power supply that benefits development of industry and
welfare of people. Because no projects will be completed until 2020, however, the power
shortage is expected to continue for the coming three years72.
Among them, two transmission line projects between Malawi and Mozambique and Zambia
not only take advantage of the Nacala Corridor development, but also promote development of
the Nacala Corridor Region, while strengthening inter-region cooperation and collaboration.
According to the Malawi Energy Policy 2003, the fuel haulage is determined as 50% from
Nacala, 20% from Dar es Salam ad 30% from Beira, in consideration of transport mode and
geographical distribution. The target of the fuel imports from the Nacala Corridor is high
because rail transport on the corridor is supposed to offer lower cost and sufficient capacity;
however, various problems concerned with capacities, costs, efficiency and functions of the
port handling, infrastructure, etc. inhibit the use of the corridor for fuel imports. The number
of interviews with the government officials and logistics firms confirmed that the import of the
rail transport of the Nacala Corridor is even higher than that of the road transport of Beira.
One of the reasons is because only single supplier of fuels, Mozambique National Petro
Company (PetroMoc) operating in the Nacala results in a lack of competition. The Nacala Port
is not equipped with sufficient infrastructure and facilities such as depot and handling
facilities73. However, it is no doubt that rail transport of the Nacala has the great potential for
cost saving and expansion of fuel imports and the Nacala Port, a natural deep-sea port, has
more advantage over the Beira Port, which is located at the river mouth and needs periodical
dredging. Therefore, it is necessary to improve the functions of the Nacala Port by installing
new facilities and improving its operation, with effort to lower the total cost of the corridor
transport including both rail and port related cost, in order to increase the use of the Nacala
Corridor for fuel import to Malawi.
72 Ministry of Finance, Economic Planning and Development. Annual Economic Report 2017 73 Interviews with Department of Energy Affairs and Malawi Energy Regulation Authority in May2017
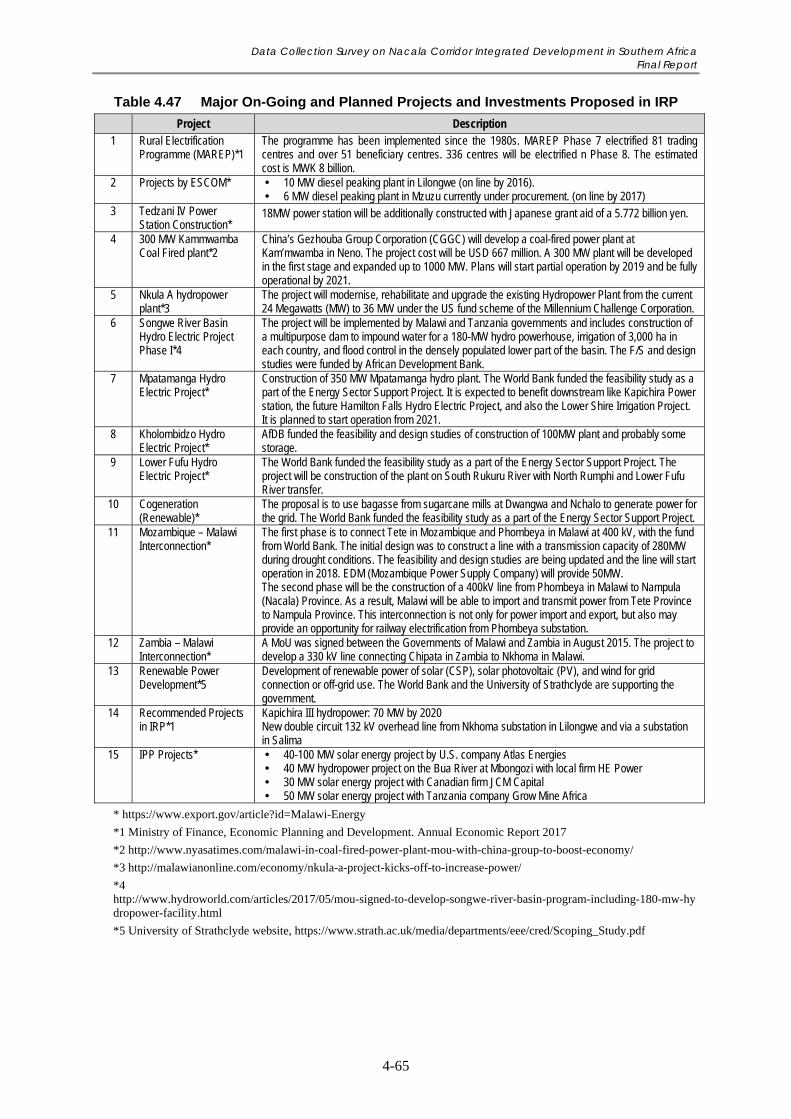
Data Collection Survey on Nacala Corridor Integrated Development in Southern Africa Final Report
4-65
Table 4.47 Major On-Going and Planned Projects and Investments Proposed in IRP
Project Description 1 Rural Electrification
Programme (MAREP)*1 The programme has been implemented since the 1980s. MAREP Phase 7 electrified 81 trading centres and over 51 beneficiary centres. 336 centres will be electrified n Phase 8. The estimated cost is MWK 8 billion.
2 Projects by ESCOM* 10 MW diesel peaking plant in Lilongwe (on line by 2016). 6 MW diesel peaking plant in Mzuzu currently under procurement. (on line by 2017)
3 Tedzani IV Power Station Construction*
18MW power station will be additionally constructed with Japanese grant aid of a 5.772 billion yen.
4 300 MW Kammwamba Coal Fired plant*2
China’s Gezhouba Group Corporation (CGGC) will develop a coal-fired power plant at Kam’mwamba in Neno. The project cost will be USD 667 million. A 300 MW plant will be developed in the first stage and expanded up to 1000 MW. Plans will start partial operation by 2019 and be fully operational by 2021.
5 Nkula A hydropower plant*3
The project will modernise, rehabilitate and upgrade the existing Hydropower Plant from the current 24 Megawatts (MW) to 36 MW under the US fund scheme of the Millennium Challenge Corporation.
6 Songwe River Basin Hydro Electric Project Phase I*4
The project will be implemented by Malawi and Tanzania governments and includes construction of a multipurpose dam to impound water for a 180-MW hydro powerhouse, irrigation of 3,000 ha in each country, and flood control in the densely populated lower part of the basin. The F/S and design studies were funded by African Development Bank.
7 Mpatamanga Hydro Electric Project*
Construction of 350 MW Mpatamanga hydro plant. The World Bank funded the feasibility study as a part of the Energy Sector Support Project. It is expected to benefit downstream like Kapichira Power station, the future Hamilton Falls Hydro Electric Project, and also the Lower Shire Irrigation Project. It is planned to start operation from 2021.
8 Kholombidzo Hydro Electric Project*
AfDB funded the feasibility and design studies of construction of 100MW plant and probably some storage.
9 Lower Fufu Hydro Electric Project*
The World Bank funded the feasibility study as a part of the Energy Sector Support Project. The project will be construction of the plant on South Rukuru River with North Rumphi and Lower Fufu River transfer.
10 Cogeneration (Renewable)*
The proposal is to use bagasse from sugarcane mills at Dwangwa and Nchalo to generate power for the grid. The World Bank funded the feasibility study as a part of the Energy Sector Support Project.
11 Mozambique – Malawi Interconnection*
The first phase is to connect Tete in Mozambique and Phombeya in Malawi at 400 kV, with the fund from World Bank. The initial design was to construct a line with a transmission capacity of 280MW during drought conditions. The feasibility and design studies are being updated and the line will start operation in 2018. EDM (Mozambique Power Supply Company) will provide 50MW. The second phase will be the construction of a 400kV line from Phombeya in Malawi to Nampula (Nacala) Province. As a result, Malawi will be able to import and transmit power from Tete Province to Nampula Province. This interconnection is not only for power import and export, but also may provide an opportunity for railway electrification from Phombeya substation.
12 Zambia – Malawi Interconnection*
A MoU was signed between the Governments of Malawi and Zambia in August 2015. The project to develop a 330 kV line connecting Chipata in Zambia to Nkhoma in Malawi.
13 Renewable Power Development*5
Development of renewable power of solar (CSP), solar photovoltaic (PV), and wind for grid connection or off-grid use. The World Bank and the University of Strathclyde are supporting the government.
14 Recommended Projects in IRP*1
Kapichira III hydropower: 70 MW by 2020 New double circuit 132 kV overhead line from Nkhoma substation in Lilongwe and via a substation in Salima
15 IPP Projects* 40-100 MW solar energy project by U.S. company Atlas Energies 40 MW hydropower project on the Bua River at Mbongozi with local firm HE Power 30 MW solar energy project with Canadian firm JCM Capital 50 MW solar energy project with Tanzania company Grow Mine Africa
* https://www.export.gov/article?id=Malawi-Energy
*1 Ministry of Finance, Economic Planning and Development. Annual Economic Report 2017
*2 http://www.nyasatimes.com/malawi-in-coal-fired-power-plant-mou-with-china-group-to-boost-economy/
*3 http://malawianonline.com/economy/nkula-a-project-kicks-off-to-increase-power/
*4 http://www.hydroworld.com/articles/2017/05/mou-signed-to-develop-songwe-river-basin-program-including-180-mw-hydropower-facility.html
*5 University of Strathclyde website, https://www.strath.ac.uk/media/departments/eee/cred/Scoping_Study.pdf
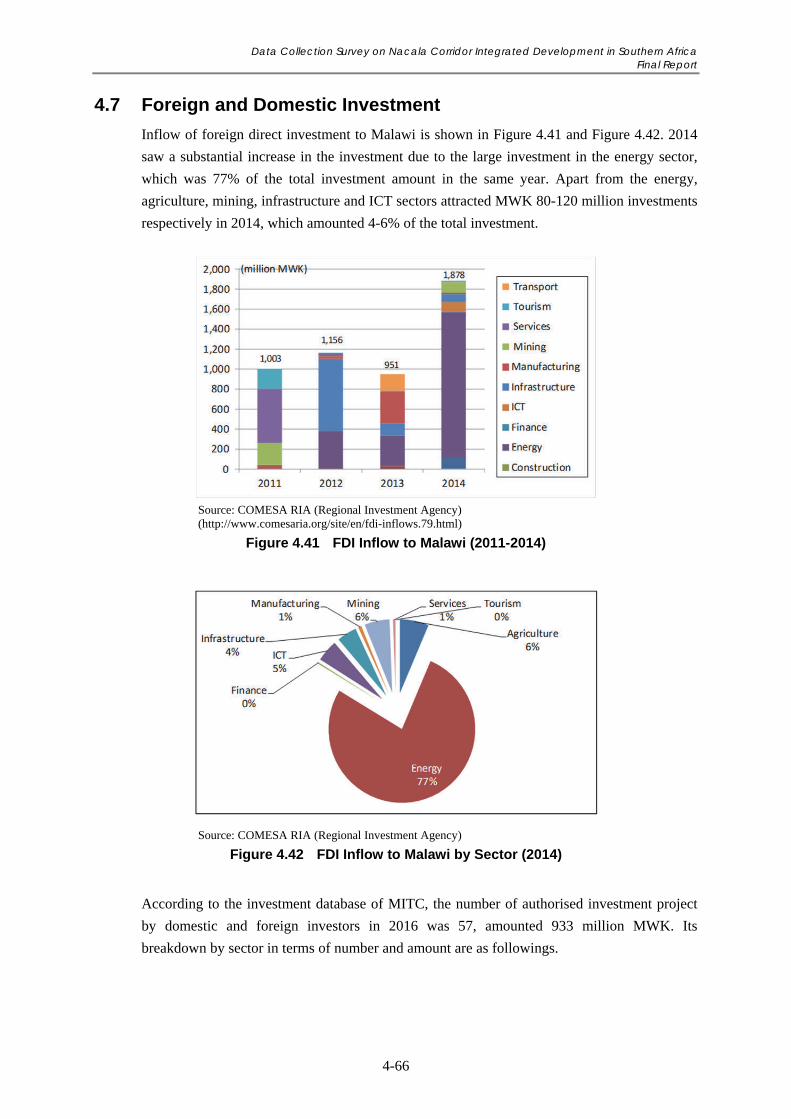
Data Collection Survey on Nacala Corridor Integrated Development in Southern Africa Final Report
4-66
4.7 Foreign and Domestic Investment
Inflow of foreign direct investment to Malawi is shown in Figure 4.41 and Figure 4.42. 2014
saw a substantial increase in the investment due to the large investment in the energy sector,
which was 77% of the total investment amount in the same year. Apart from the energy,
agriculture, mining, infrastructure and ICT sectors attracted MWK 80-120 million investments
respectively in 2014, which amounted 4-6% of the total investment.
Source: COMESA RIA (Regional Investment Agency) (http://www.comesaria.org/site/en/fdi-inflows.79.html)
Figure 4.41 FDI Inflow to Malawi (2011-2014)
Source: COMESA RIA (Regional Investment Agency)
Figure 4.42 FDI Inflow to Malawi by Sector (2014)
According to the investment database of MITC, the number of authorised investment project
by domestic and foreign investors in 2016 was 57, amounted 933 million MWK. Its
breakdown by sector in terms of number and amount are as followings.
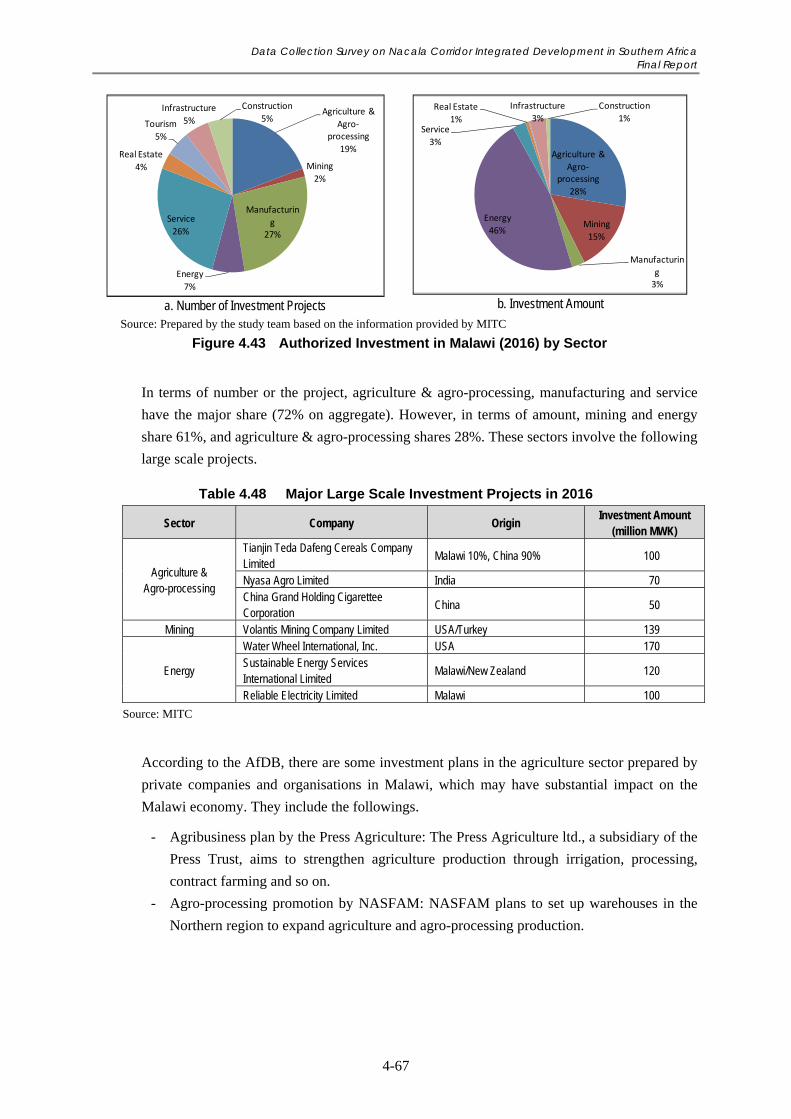
Data Collection Survey on Nacala Corridor Integrated Development in Southern Africa Final Report
4-67
a. Number of Investment Projects
b. Investment Amount
Source: Prepared by the study team based on the information provided by MITC
Figure 4.43 Authorized Investment in Malawi (2016) by Sector
In terms of number or the project, agriculture & agro-processing, manufacturing and service
have the major share (72% on aggregate). However, in terms of amount, mining and energy
share 61%, and agriculture & agro-processing shares 28%. These sectors involve the following
large scale projects.
Table 4.48 Major Large Scale Investment Projects in 2016
Sector Company Origin Investment Amount
(million MWK)
Agriculture & Agro-processing
Tianjin Teda Dafeng Cereals Company Limited
Malawi 10%, China 90% 100
Nyasa Agro Limited India 70 China Grand Holding Cigarettee Corporation
China 50
Mining Volantis Mining Company Limited USA/Turkey 139
Energy
Water Wheel International, Inc. USA 170 Sustainable Energy Services International Limited
Malawi/New Zealand 120
Reliable Electricity Limited Malawi 100
Source: MITC
According to the AfDB, there are some investment plans in the agriculture sector prepared by
private companies and organisations in Malawi, which may have substantial impact on the
Malawi economy. They include the followings.
- Agribusiness plan by the Press Agriculture: The Press Agriculture ltd., a subsidiary of the
Press Trust, aims to strengthen agriculture production through irrigation, processing,
contract farming and so on.
- Agro-processing promotion by NASFAM: NASFAM plans to set up warehouses in the
Northern region to expand agriculture and agro-processing production.
Agriculture &
Agro‐processing
19%
Mining
2%
Manufacturin
g27%
Energy
7%
Service
26%
Real Estate
4%
Tourism
5%
Infrastructure
5%
Construction
5%
Agriculture &
Agro‐processing
28%
Mining
15%
Manufacturin
g3%
Energy
46%
Service
3%
Real Estate
1%
Infrastructure
3%
Construction
1%
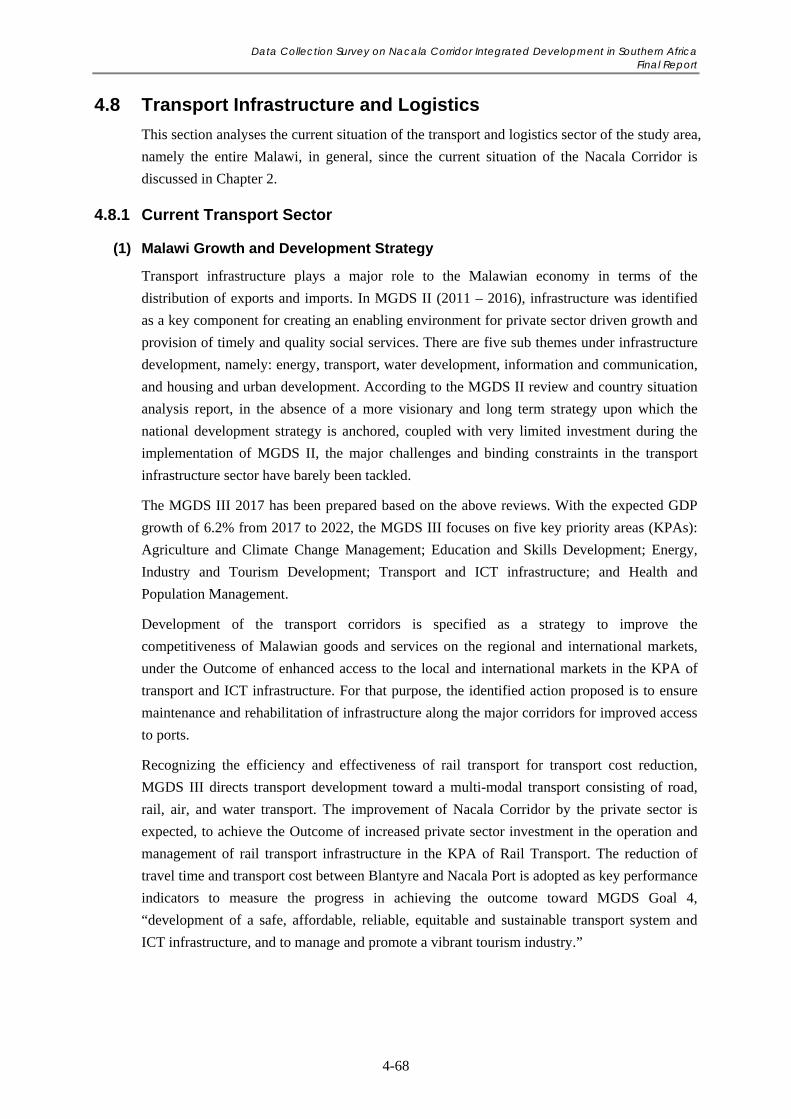
Data Collection Survey on Nacala Corridor Integrated Development in Southern Africa Final Report
4-68
4.8 Transport Infrastructure and Logistics
This section analyses the current situation of the transport and logistics sector of the study area,
namely the entire Malawi, in general, since the current situation of the Nacala Corridor is
discussed in Chapter 2.
4.8.1 Current Transport Sector
(1) Malawi Growth and Development Strategy
Transport infrastructure plays a major role to the Malawian economy in terms of the
distribution of exports and imports. In MGDS II (2011 – 2016), infrastructure was identified
as a key component for creating an enabling environment for private sector driven growth and
provision of timely and quality social services. There are five sub themes under infrastructure
development, namely: energy, transport, water development, information and communication,
and housing and urban development. According to the MGDS II review and country situation
analysis report, in the absence of a more visionary and long term strategy upon which the
national development strategy is anchored, coupled with very limited investment during the
implementation of MGDS II, the major challenges and binding constraints in the transport
infrastructure sector have barely been tackled.
The MGDS III 2017 has been prepared based on the above reviews. With the expected GDP
growth of 6.2% from 2017 to 2022, the MGDS III focuses on five key priority areas (KPAs):
Agriculture and Climate Change Management; Education and Skills Development; Energy,
Industry and Tourism Development; Transport and ICT infrastructure; and Health and
Population Management.
Development of the transport corridors is specified as a strategy to improve the
competitiveness of Malawian goods and services on the regional and international markets,
under the Outcome of enhanced access to the local and international markets in the KPA of
transport and ICT infrastructure. For that purpose, the identified action proposed is to ensure
maintenance and rehabilitation of infrastructure along the major corridors for improved access
to ports.
Recognizing the efficiency and effectiveness of rail transport for transport cost reduction,
MGDS III directs transport development toward a multi-modal transport consisting of road,
rail, air, and water transport. The improvement of Nacala Corridor by the private sector is
expected, to achieve the Outcome of increased private sector investment in the operation and
management of rail transport infrastructure in the KPA of Rail Transport. The reduction of
travel time and transport cost between Blantyre and Nacala Port is adopted as key performance
indicators to measure the progress in achieving the outcome toward MGDS Goal 4,
“development of a safe, affordable, reliable, equitable and sustainable transport system and
ICT infrastructure, and to manage and promote a vibrant tourism industry.”
Data Collection Survey on Nacala Corridor Integrated Development in Southern Africa Final Report
4-69
(2) National Transport Policy (MNTP)
The improvement of Malawi’s transport infrastructure is a priority of MGDS II, which
highlights the link between transport infrastructure and growth and development. The 2015
MNTP is linked to, and reflects the priorities of the National Vision, MGDS II and Economic
Recovery Plan and outlines eight priority areas mentioned below that collectively provide a
comprehensive set of policies, all of which contain policies and strategies for each transport
sub-sector. The vision of MNTP is the development of a coordinated and efficient transport
infrastructure that fosters the safe and competitive operation of viable, affordable, equitable
and sustainable transport services.
The eight priority areas of the MNTP are: transport infrastructure; transport services provision;
NMT; international transport corridors; private sector participation; good governance;
strengthening of institutional framework, and; crosscutting issues.
(3) National Transport Master Plan (MNTMP)
The GOM recognizes the significant role played by the transport sector in attainment of the
sustainable economic and social development of the country. Ministry of Transport and Public
Works (MOTPW) has therefore formulated a comprehensive MNTMP designed to achieve
this goal in 2017. The scope of the master plan covers all modes of transport: roads and road
transport, urban and rural transport, railways, marine, civil aviation and pipeline
The national transport goal is to ensure the provision of a coordinated transport environment
that fosters a safe and competitive operation of commercially viable, financially sustainable,
and environmentally friendly transport services and enterprises. The approach adopted to
achieve this goal is to move from a highly controlled transport sector to a more liberalized
market oriented transport sector. In this liberalized environment, private sector participation in
the provision and operation of transport infrastructure is emphasized, including promotion of
effective and fair competition among and within all modes of transport. The role of the
government becomes that of providing an enabling environment in which the private sector or
other bodies operating commercially can succeed.
MNTMP has been developed with the primary objective of guiding the sustainable
development of an integrated multi modal transport sector over the next twenty years. The
plan provides measures to reduce transport costs and improve GDP. It not only addresses the
current pressing issues such as road safety, but looks forward to meeting the transport needs of
a changed economy in which growth sectors such as mining, oil and tourism will be fostered
through improved transport links.
(4) Transport Modes
Malawi is served by four transport modes namely road, rail, lake and air transport which
consists of a road network with an estimated distance of 15,451 km; 797 km of railway track
from Mchinji border with Zambia to Nsanje boarder with Mozambique and further to the east
from Nkaya to Nayuchi (Entre Lagos) at the Mozambican border; five (major) harbours on
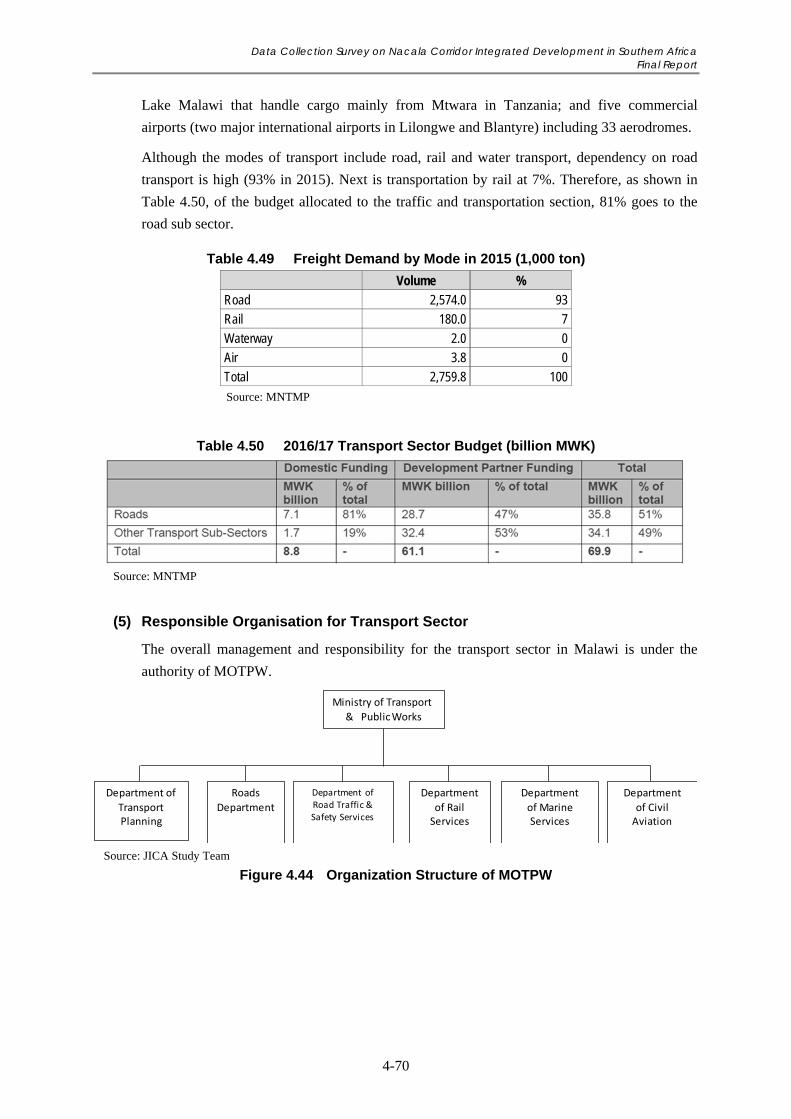
Data Collection Survey on Nacala Corridor Integrated Development in Southern Africa Final Report
4-70
Lake Malawi that handle cargo mainly from Mtwara in Tanzania; and five commercial
airports (two major international airports in Lilongwe and Blantyre) including 33 aerodromes.
Although the modes of transport include road, rail and water transport, dependency on road
transport is high (93% in 2015). Next is transportation by rail at 7%. Therefore, as shown in
Table 4.50, of the budget allocated to the traffic and transportation section, 81% goes to the
road sub sector.
Table 4.49 Freight Demand by Mode in 2015 (1,000 ton)
Volume %
Road 2,574.0 93
Rail 180.0 7
Waterway 2.0 0
Air 3.8 0
Total 2,759.8 100
Source: MNTMP
Table 4.50 2016/17 Transport Sector Budget (billion MWK)
Source: MNTMP
(5) Responsible Organisation for Transport Sector
The overall management and responsibility for the transport sector in Malawi is under the
authority of MOTPW.
Source: JICA Study Team
Figure 4.44 Organization Structure of MOTPW
Ministry of Transport
& Public Works
Department of
Transport Planning
Roads
Department
Department ofRoad Traffic &Safety Services
Department
of RailServices
Department
of Marine Services
Department
of CivilAviation
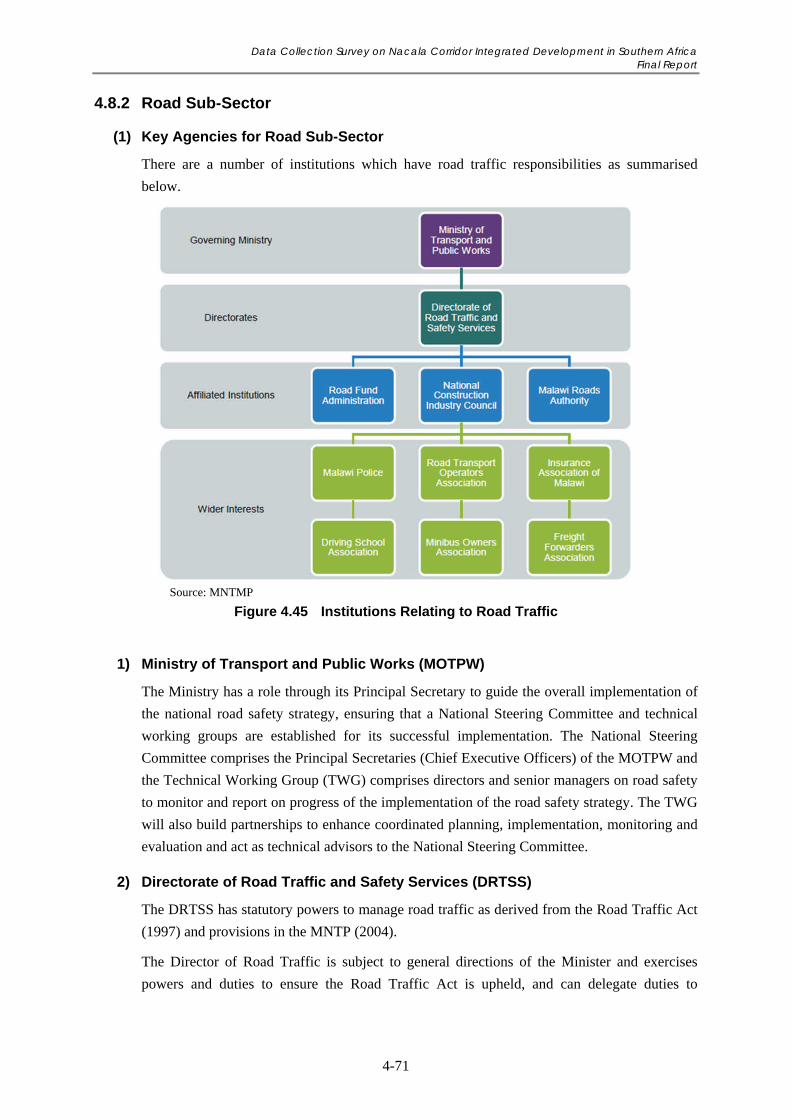
Data Collection Survey on Nacala Corridor Integrated Development in Southern Africa Final Report
4-71
4.8.2 Road Sub-Sector
(1) Key Agencies for Road Sub-Sector
There are a number of institutions which have road traffic responsibilities as summarised
below.
Source: MNTMP
Figure 4.45 Institutions Relating to Road Traffic
1) Ministry of Transport and Public Works (MOTPW)
The Ministry has a role through its Principal Secretary to guide the overall implementation of
the national road safety strategy, ensuring that a National Steering Committee and technical
working groups are established for its successful implementation. The National Steering
Committee comprises the Principal Secretaries (Chief Executive Officers) of the MOTPW and
the Technical Working Group (TWG) comprises directors and senior managers on road safety
to monitor and report on progress of the implementation of the road safety strategy. The TWG
will also build partnerships to enhance coordinated planning, implementation, monitoring and
evaluation and act as technical advisors to the National Steering Committee.
2) Directorate of Road Traffic and Safety Services (DRTSS)
The DRTSS has statutory powers to manage road traffic as derived from the Road Traffic Act
(1997) and provisions in the MNTP (2004).
The Director of Road Traffic is subject to general directions of the Minister and exercises
powers and duties to ensure the Road Traffic Act is upheld, and can delegate duties to
Data Collection Survey on Nacala Corridor Integrated Development in Southern Africa Final Report
4-72
authorised officers. Furthermore, the Ministry has established a Committee for Road Traffic
Law Enforcement who ensures the laws under the Road Traffic Act are enforced.
3) Road Authority (RA)
The RA is a statutory body. RA is the primary agency responsible for the maintenance and
rehabilitation of Malawi’s roads. A Board of Directors governs the RA. Most of the actual
road maintenance and rehabilitation work will be done by contract. The RA is funded by a
dedicated road fund currently financed through user charges. This fund may be supplemented
by the addition of licensing and registration fees currently collected by the Road Traffic
Department. At present the road fund is supplemented by a government subvention plan which
prepares road works programmes for construction, rehabilitation and maintenance annually.
The RA has a significant safety-engineering role in road design, markings, and signs.
Improved road shoulders, for example, might help keep bicycles out of the main traffic lanes
where they are more likely to be involved in road accidents.
4) National Construction Industry Council (NCIC)
The NCIC was established under the NCIC Act (CAP 53.05) 1996 to regulate, promote and
develop the construction industry in Malawi. Its role within the transport sector is to register
all transport infrastructure projects and to provide support to local contractors for road
infrastructure projects. It registers contractors, consultants, material suppliers and
manufacturers and monitors their progress.
5) Road Fund Administration
The Road Fund Administration is a statutory body whose mandates are to raise and administer
funds for construction, maintenance and rehabilitation of public roads, and to account it to the
Ministry of Finance. This institution also manages, administers and accounts the Roads Fund
(comprising of proceeds from fuel levy and transit fees).
(2) Road Network
The classified road network comprises 15,451 km of roads. These include main, secondary,
tertiary, urban and district roads. Figure 4.46 shows the main and secondary roads, which
constitute a comprehensive network. The national highway, M1, spans the length of the
country from Nsanje in the south to Karonga in the north. Malawi’s classified road network is
complemented by another 9,478 km of undesignated community roads, which were identified
in 2005 as being an essential part of the highway infrastructure, and by a wider network of
tracks.
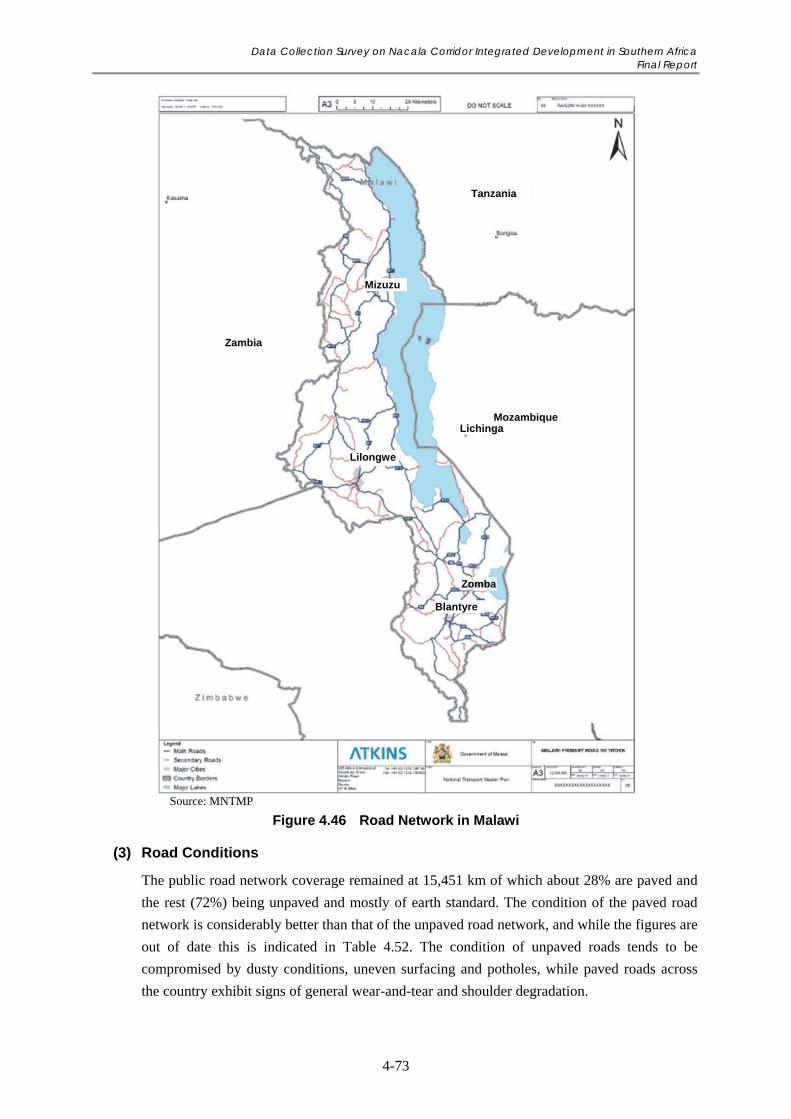
Data Collection Survey on Nacala Corridor Integrated Development in Southern Africa Final Report
4-73
Source: MNTMP
Figure 4.46 Road Network in Malawi
(3) Road Conditions
The public road network coverage remained at 15,451 km of which about 28% are paved and
the rest (72%) being unpaved and mostly of earth standard. The condition of the paved road
network is considerably better than that of the unpaved road network, and while the figures are
out of date this is indicated in Table 4.52. The condition of unpaved roads tends to be
compromised by dusty conditions, uneven surfacing and potholes, while paved roads across
the country exhibit signs of general wear-and-tear and shoulder degradation.
Zomba
Mizuzu
Lichinga
Zambia
Blantyre
Lilongwe
Mozambique
Tanzania
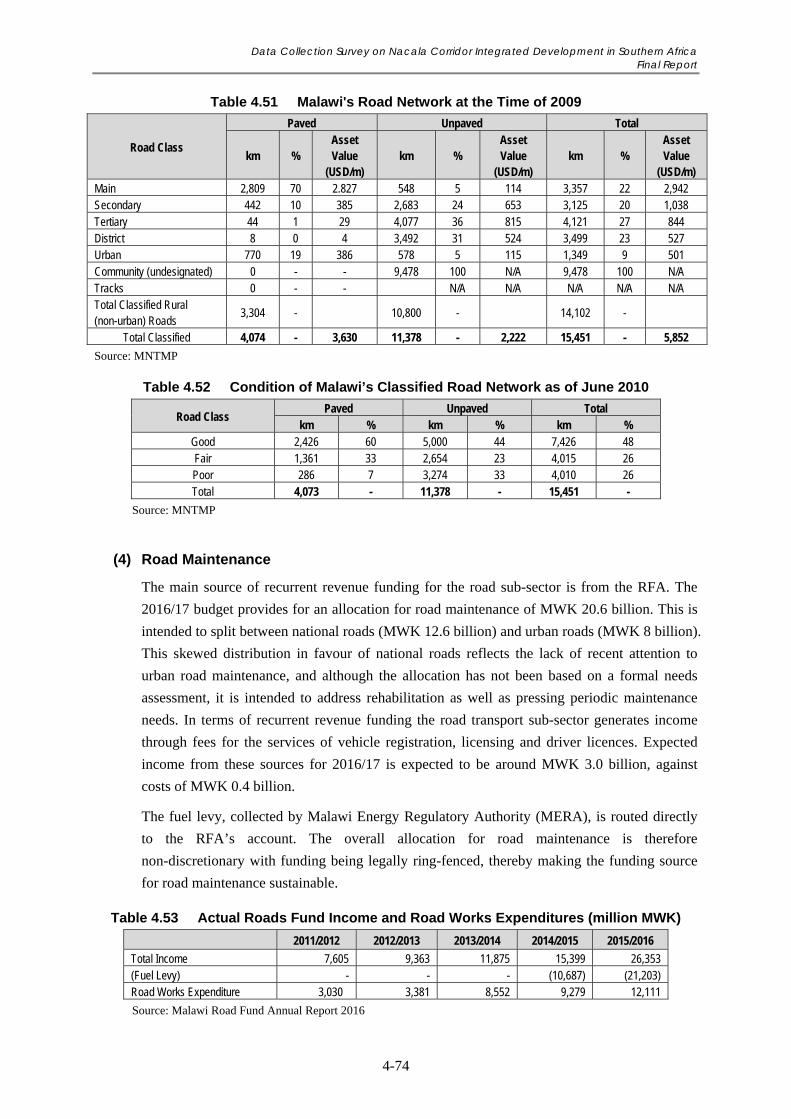
Data Collection Survey on Nacala Corridor Integrated Development in Southern Africa Final Report
4-74
Table 4.51 Malawi's Road Network at the Time of 2009
Road Class
Paved Unpaved Total
km % Asset Value
(USD/m) km %
Asset Value
(USD/m) km %
Asset Value
(USD/m) Main 2,809 70 2.827 548 5 114 3,357 22 2,942 Secondary 442 10 385 2,683 24 653 3,125 20 1,038 Tertiary 44 1 29 4,077 36 815 4,121 27 844 District 8 0 4 3,492 31 524 3,499 23 527 Urban 770 19 386 578 5 115 1,349 9 501 Community (undesignated) 0 - - 9,478 100 N/A 9,478 100 N/A Tracks 0 - - N/A N/A N/A N/A N/A Total Classified Rural (non-urban) Roads
3,304 - 10,800 - 14,102 -
Total Classified 4,074 - 3,630 11,378 - 2,222 15,451 - 5,852
Source: MNTMP
Table 4.52 Condition of Malawi’s Classified Road Network as of June 2010
Road Class Paved Unpaved Total
km % km % km % Good 2,426 60 5,000 44 7,426 48 Fair 1,361 33 2,654 23 4,015 26 Poor 286 7 3,274 33 4,010 26 Total 4,073 - 11,378 - 15,451 -
Source: MNTMP
(4) Road Maintenance
The main source of recurrent revenue funding for the road sub-sector is from the RFA. The
2016/17 budget provides for an allocation for road maintenance of MWK 20.6 billion. This is
intended to split between national roads (MWK 12.6 billion) and urban roads (MWK 8 billion).
This skewed distribution in favour of national roads reflects the lack of recent attention to
urban road maintenance, and although the allocation has not been based on a formal needs
assessment, it is intended to address rehabilitation as well as pressing periodic maintenance
needs. In terms of recurrent revenue funding the road transport sub-sector generates income
through fees for the services of vehicle registration, licensing and driver licences. Expected
income from these sources for 2016/17 is expected to be around MWK 3.0 billion, against
costs of MWK 0.4 billion.
The fuel levy, collected by Malawi Energy Regulatory Authority (MERA), is routed directly
to the RFA’s account. The overall allocation for road maintenance is therefore
non-discretionary with funding being legally ring-fenced, thereby making the funding source
for road maintenance sustainable.
Table 4.53 Actual Roads Fund Income and Road Works Expenditures (million MWK)
2011/2012 2012/2013 2013/2014 2014/2015 2015/2016
Total Income 7,605 9,363 11,875 15,399 26,353 (Fuel Levy) - - - (10,687) (21,203) Road Works Expenditure 3,030 3,381 8,552 9,279 12,111
Source: Malawi Road Fund Annual Report 2016
Data Collection Survey on Nacala Corridor Integrated Development in Southern Africa Final Report
4-75
The fuel levy is forecast to raise MWK 23 billion in 2016/17. The levy provides a reasonably
predictable source of funds, and is sustainable to the extent that it should continue to
contribute an increasing source of funds for road maintenance over the next 20 years.
According to the MNTMP, the total cost for the paved network would be USD 42.4 million
annually. As such the fuel levy at present rate may not rise sufficiently to meet the expected
increase in maintenance costs.
(5) Major Challenges on Road Sub-Sector
Road transport is the dominant mode of transport in Malawi. In this respect, the country has
over the years been constructing, rehabilitating, and upgrading the road infrastructure.
However, most feeder roads still remain in poor condition especially in rural areas. Also, even
in regard to trunk roads, high transportation costs remain prevalent due to insufficient road
development as a result of insufficient funding. The goal is to ensure the provision of a safe,
affordable, accessible and high quality road transport system. In the medium-term improved
road transportation is expected to contribute to:
- Reduced lead times and cost on exports and imports and
- Improved domestic and cross border mobility and connectivity.
1) Key Strategies
Ensuring comprehensive and coordinating planning of road and other modes of
transport;
Providing an adequate network of roads based on appropriate standards;
Enhancing routine road maintenance and upgrading;
Building technical and institutional capacity at all levels;
Promoting competition in the construction industry;
Improving management of a road network throughout the country;
Enhancing axle load control;
Promoting high road safety standards and traffic management and
Enhancing PPPs in the transport system.
2) Eight ‘Action Areas,’ proposed by MNTMP
Increase resources for road sub-sector, particularly rural roads;
Strengthen the domestic trucking industry to reduce transport costs;
Improve road safety;
Improve road infrastructure;
Enhance rural roads and access to services;
Strengthen regulation;
Institutional reform and
Axle load control.
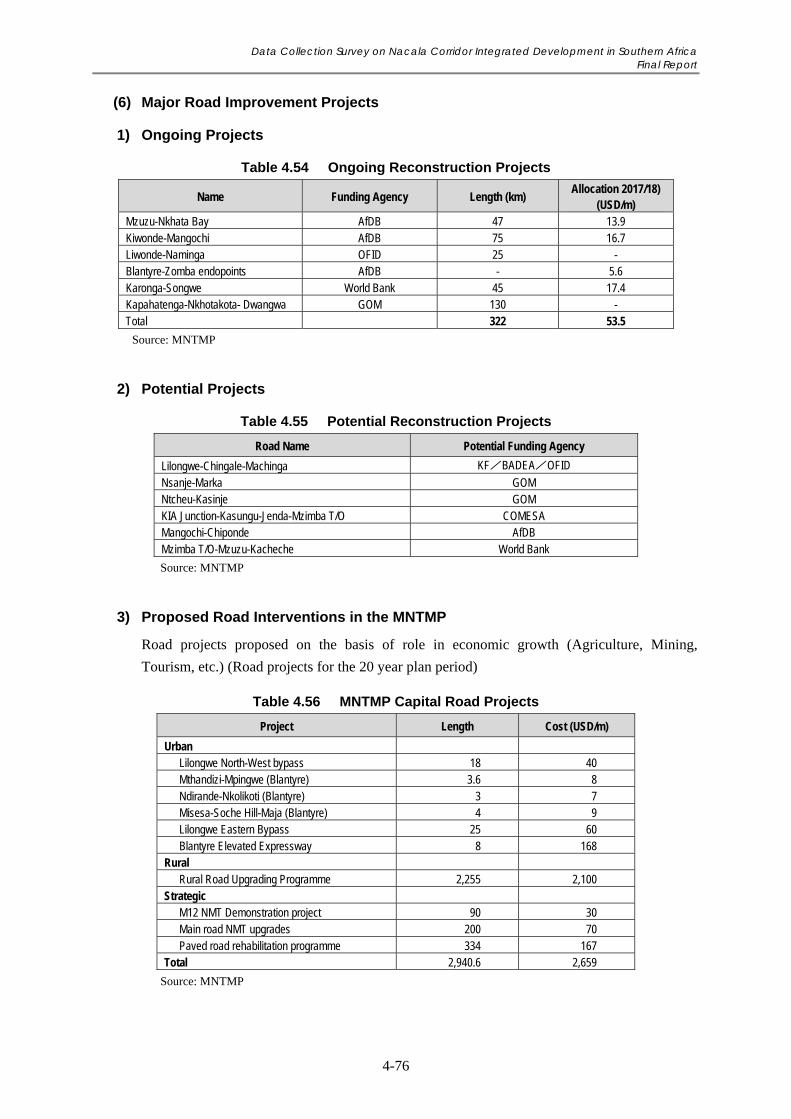
Data Collection Survey on Nacala Corridor Integrated Development in Southern Africa Final Report
4-76
(6) Major Road Improvement Projects
1) Ongoing Projects
Table 4.54 Ongoing Reconstruction Projects
Name Funding Agency Length (km) Allocation 2017/18)
(USD/m) Mzuzu-Nkhata Bay AfDB 47 13.9 Kiwonde-Mangochi AfDB 75 16.7 Liwonde-Naminga OFID 25 - Blantyre-Zomba endopoints AfDB - 5.6 Karonga-Songwe World Bank 45 17.4 Kapahatenga-Nkhotakota- Dwangwa GOM 130 - Total 322 53.5
Source: MNTMP
2) Potential Projects
Table 4.55 Potential Reconstruction Projects
Road Name Potential Funding Agency
Lilongwe-Chingale-Machinga KF/BADEA/OFID
Nsanje-Marka GOM Ntcheu-Kasinje GOM KIA Junction-Kasungu-Jenda-Mzimba T/O COMESA Mangochi-Chiponde AfDB Mzimba T/O-Mzuzu-Kacheche World Bank
Source: MNTMP
3) Proposed Road Interventions in the MNTMP
Road projects proposed on the basis of role in economic growth (Agriculture, Mining,
Tourism, etc.) (Road projects for the 20 year plan period)
Table 4.56 MNTMP Capital Road Projects
Project Length Cost (USD/m)
Urban Lilongwe North-West bypass 18 40 Mthandizi-Mpingwe (Blantyre) 3.6 8 Ndirande-Nkolikoti (Blantyre) 3 7 Misesa-Soche Hill-Maja (Blantyre) 4 9 Lilongwe Eastern Bypass 25 60 Blantyre Elevated Expressway 8 168
Rural Rural Road Upgrading Programme 2,255 2,100
Strategic M12 NMT Demonstration project 90 30 Main road NMT upgrades 200 70 Paved road rehabilitation programme 334 167
Total 2,940.6 2,659
Source: MNTMP
Data Collection Survey on Nacala Corridor Integrated Development in Southern Africa Final Report
4-77
4.8.3 Rail Sub-Sector
(1) Key Agreements for Rail Sub-Sector
1) Concession Agreement
CEAR operate the railway concessions in Malawi. The first concession agreement was signed
by CEAR and the Government of Malawi on 15th November 1999 with the start of operation
from 1st December 1999. This was one of the first genuine private concession agreements (for
rail) in Africa, and in this Malawi set a path that other countries have since followed. The new
owners were the consortium CDN including RDC (Railroad Development Corporation – lead),
ERL (Bermuda), MANICA (Mozambique), Mozambican private investors and CFM
(Mozambique's Port and Railway Administration). CDN formed the concessionaire company
CEAR and began operations on December 1, 1999. It is understood that passenger rail services
were operated as part of a Public Service Obligation (“PSO”) agreement within the 1999
concession, with services subsidised by the State. As part of the 2013 Concession Agreement
the Malawian Government removed the need to provide passenger services as part of a PSO
requirement. Instead the concessionaire is obliged to provide a passenger service as part of
their Corporate and Social Responsibility requirement, thus removing the funding requirement
from the Government.
2) Malawi Railway Corridor Agreement
On 22nd December 2011, the Government of Malawi made the Malawi Railway Corridor
Agreement with VALE. The agreement will run for 30 years from the start of traffic until
2045 with a right to extend by an additional 20 years. In particular, the Corridor Agreement
gave the Vale the powers to build the new railway from Kachaso (on the Mozambique border)
to Nkaya and a requirement to upgrade the rest of the railway as specified in particular the
route from Nkaya to Nayuchi.
Capacity should be reserved on “the Nacala Corridor in order to guarantee access (on the
Nacala – Nkaya route for) transportation services comprising of two trains in each
direction per day of up to 120 wagons per train for Malawi general freight and one
(passenger train) per day...”.
CEAR should have “no obligation to allow other trains to operate over the (entire)
Railway (of Malawi).” This clause gives Vale exclusive rights over this rail route for coal
traffic from Moatize.
The capacity of Nacala railway is 22 million tonnes per year, 18 million of which is covered
by exportation of coal. The capacity available for use by CEAR is 4 million tonnes per year,
although current usages stand at five to six hundred thousand tonnes per year.
3) Tripartite Nacala Development Corridor Agreement
On 27th August 2010 the Governments of Malawi, Zambia and Mozambique signed the
Tripartite Railway Transport Agreement on the Nacala Development Corridor to “cultivate
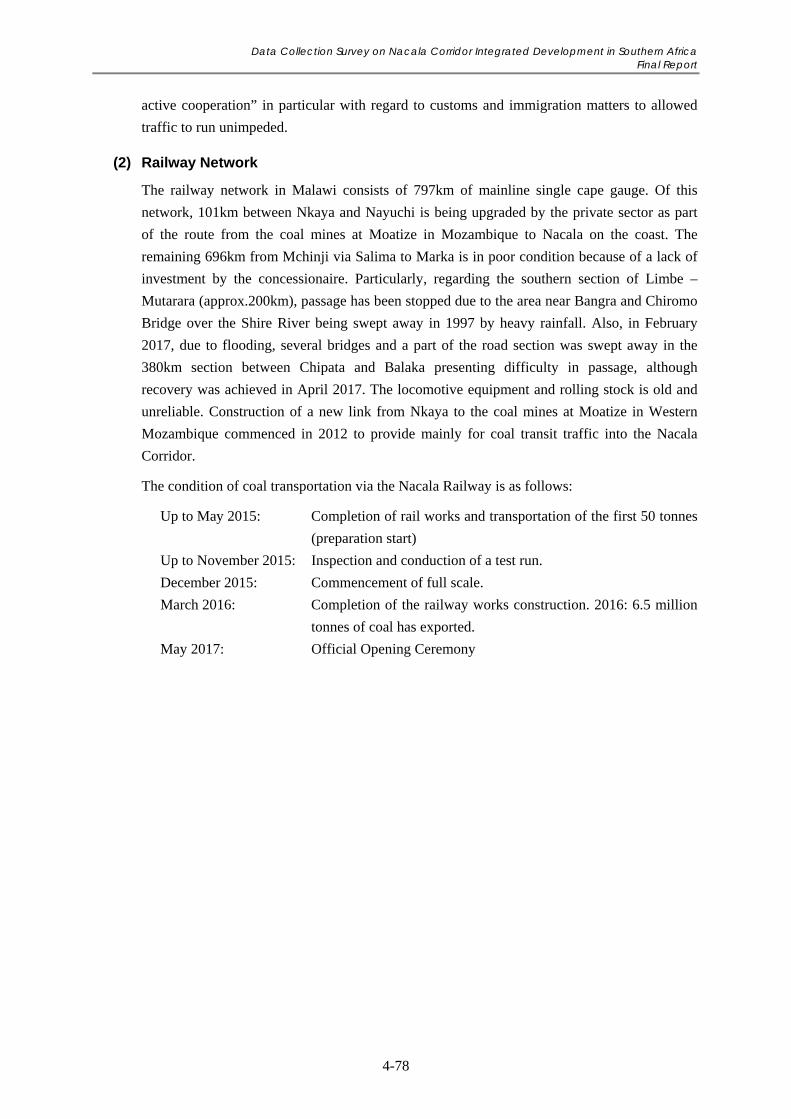
Data Collection Survey on Nacala Corridor Integrated Development in Southern Africa Final Report
4-78
active cooperation” in particular with regard to customs and immigration matters to allowed
traffic to run unimpeded.
(2) Railway Network
The railway network in Malawi consists of 797km of mainline single cape gauge. Of this
network, 101km between Nkaya and Nayuchi is being upgraded by the private sector as part
of the route from the coal mines at Moatize in Mozambique to Nacala on the coast. The
remaining 696km from Mchinji via Salima to Marka is in poor condition because of a lack of
investment by the concessionaire. Particularly, regarding the southern section of Limbe –
Mutarara (approx.200km), passage has been stopped due to the area near Bangra and Chiromo
Bridge over the Shire River being swept away in 1997 by heavy rainfall. Also, in February
2017, due to flooding, several bridges and a part of the road section was swept away in the
380km section between Chipata and Balaka presenting difficulty in passage, although
recovery was achieved in April 2017. The locomotive equipment and rolling stock is old and
unreliable. Construction of a new link from Nkaya to the coal mines at Moatize in Western
Mozambique commenced in 2012 to provide mainly for coal transit traffic into the Nacala
Corridor.
The condition of coal transportation via the Nacala Railway is as follows:
Up to May 2015: Completion of rail works and transportation of the first 50 tonnes
(preparation start)
Up to November 2015: Inspection and conduction of a test run.
December 2015: Commencement of full scale.
March 2016: Completion of the railway works construction. 2016: 6.5 million
tonnes of coal has exported.
May 2017: Official Opening Ceremony
Data Collection Survey on Nacala Corridor Integrated Development in Southern Africa Final Report
4-79
Source: MNTMP
Figure 4.47 Historic Development of the Railway Network in Malawi
Damages by heavy rain in 2017 Feb
Salima
Balaka Nkaya
Limbe
Kchaso
Nayuchi
Makka
Mchinji
Blantyre
Lilongwe
Data Collection Survey on Nacala Corridor Integrated Development in Southern Africa Final Report
4-80
(3) Service Provided
1) Freight Train Services
The freight services have been divided into three categories: Transit, (Malawi) International
and (Malawi) Domestic freight traffic, each of which are operated differently.
(a) Transit
Transit trains account for the majority of traffic on Malawi’s railway network. CLN (Corredor
Logístico Integrado do Norte) are moving increasing volumes of coal traffic, which is
expected to grow to up to eight trains per day each. Each coal train consists of 120 wagons and
four locomotives. Each train is operated as a single block train. This is the most efficient way
of operating freight trains and is consistent with international best practise. In addition, there
has been some transit traffic between Chipata and Nacala although these are currently
irregular. At the moment though this traffic is typically combined with Malawi wagons
to/from Nacala. At the moment the operational practice for these trains is that Zambian
Railways will haul the traffic between Kanengo and Chipata, CEAR haul the traffic between
Kanengo and Entre Lagos, and CDN haul the trains between Entre Lagos and Nacala.
(b) International
These trains are typically formed of traffic to/from the Limbe (south) route although there is
also more irregular traffic to/from the Nkaya – Chipata (north) line. Most Limbe line
international trains are composed of up to 42 wagons, though often smaller, with two
locomotives. The trailing load of trains from Kanengo/Mchinji/Chipata is typically 30-35
bogies. CEAR used to effectively operate a mixed traffic train on a daily (or near daily) basis
but have now attempted to plan on the basis of block movements and weekly train plans.
Trains from Nacala stop at Liwonde to be cleared by customs. This typically takes around one
hour. This is in addition to a further one hour required at the border itself to confirm the train
manifest is consistent with the actual trains seeking to cross. Westbound trains have a similar
arrangement with CDN using Entre Lagos instead of Liwonde. CEAR are currently working
with the Government of Malawi and Mozambique to move the customs clearance to Nkaya
which will save the one hour stops as the train has been stopped at Liwonde and then the train
has to be marshalled at Nkaya anyhow.
(c) Domestic
Domestic services are relatively less common. There is some cement traffic and fertilizer
traffic to/from Kanengo. These wagons are generally carried along with other block
movements to/from Nkaya.
2) Passenger Train Services
The passenger service currently typically operates as a weekly service. It currently only
operates from Limbe via Blantyre to Bilila, and then back to Balaka and then from Balaka to
Nayuchi. And then back to Limbe via Balaka. The passenger service is effectively a local
service only centred in the south and east of the country. In part this is because of the history
Data Collection Survey on Nacala Corridor Integrated Development in Southern Africa Final Report
4-81
of the railway with the line to Lilongwe being closed north of Balaka between 2003 and 2005
and because the service is relatively slow with a large number of local stops.
3) Rolling Stocks
CEAR currently have five main types of locomotive (including 2 on loan from CDN and
excluding 2 locomotives that are no longer operational). Additionally, CEAR operates around
798 wagons (excluding CLN’s Moatize coal fleet and CDN’s fleet). Nearly all of which have
been acquired new or have been refurbished. CEAR also regularly lend or borrow wagons
with CDN on a wooden dollar arrangement to ensure that between the two concessions that
the two fleets are managed optimally.
(4) Major Challenges on Rail Sub-Sector
Although rail volumes as a percentage of all traffic have grown since 2005, rail as a mode
accounted for only 11.7% of exports in 2015 and 5.1% of imports, and an insignificant
percentage of domestic traffic. Rail, therefore, is not a vital part of the existing transport mix
but it could be a vital element of helping improve the Malawi economy and giving shippers
greater modal choice. This point is emphasised in the Malawi NES 2013 – 2018: “The top
priority for the MOTPW is to supply a multi-modal transport system to reduce the dependence
on road transport, particularly for bulk transportation.
On the other hand, the railway infrastructure in the country is in poor condition due to a lack
of maintenance and inadequate investment. A study commissioned to ascertain the investment
required to revamp the rail transport sub sector has revealed that there is a need for urgent
financial injection into this sub-sector for emergency work before overhaul rehabilitation work
can commence. The poor state of the infrastructure has greatly compromised railway safety
and efficiency. The sub-sector is greatly uncompetitive despite the fact that the rail freight cost
is cheaper than road and air transport. Therefore in the MNTMP, by developing efficient and
effective rail networks, the following mid-term objectives have been set, and accordingly, the
chief strategies and necessary projects have been suggested.
Improved regional and international connectivity;
Improved regulatory and institutional framework; and
Improved rail infrastructure and reliability.
1) Key Strategies
Rehabilitating and expanding the railway line and related infrastructure;
Creating linkages to ports, industrial sites and regional and international markets;
Promoting railway safety and environmental protection; and
Improving the operational efficiency and commercial viability of the existing railway
infrastructure and levels of service.
2) Key Potential Investments Based on MNTMP
Moatize avoiding line;
Restoration of Sena (Beira) line north and south options);
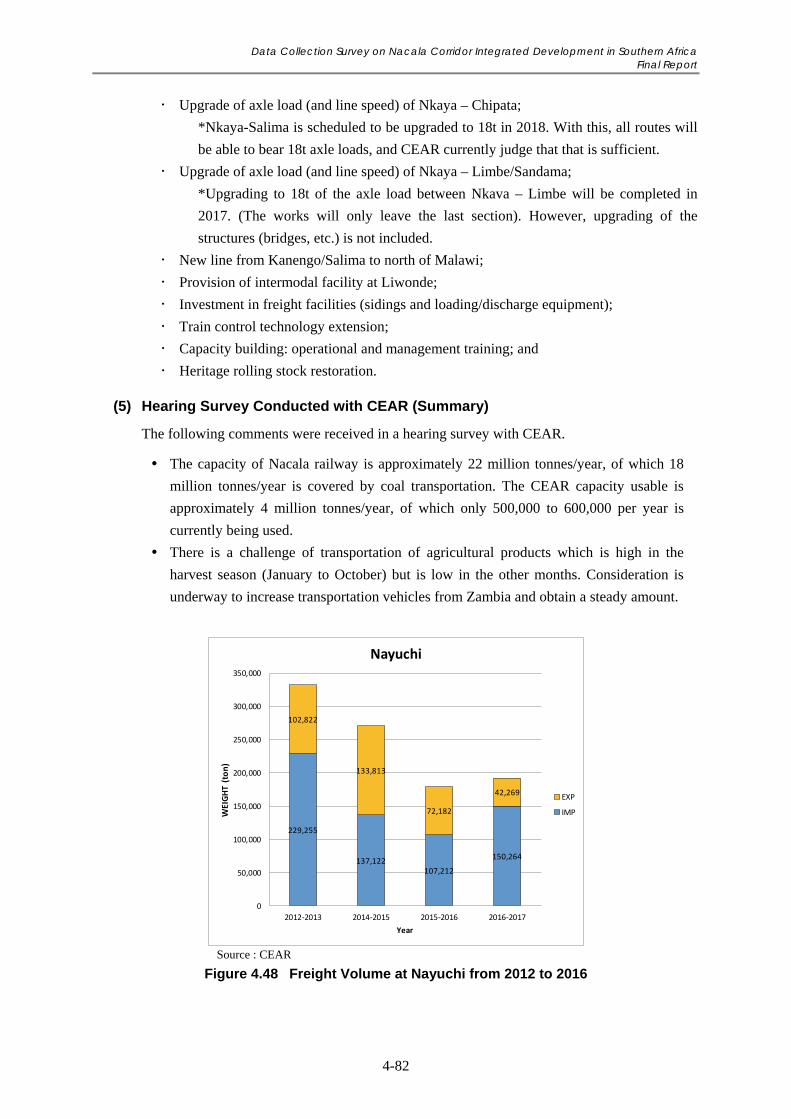
Data Collection Survey on Nacala Corridor Integrated Development in Southern Africa Final Report
4-82
Upgrade of axle load (and line speed) of Nkaya – Chipata;
*Nkaya-Salima is scheduled to be upgraded to 18t in 2018. With this, all routes will
be able to bear 18t axle loads, and CEAR currently judge that that is sufficient.
Upgrade of axle load (and line speed) of Nkaya – Limbe/Sandama;
*Upgrading to 18t of the axle load between Nkava – Limbe will be completed in
2017. (The works will only leave the last section). However, upgrading of the
structures (bridges, etc.) is not included.
New line from Kanengo/Salima to north of Malawi;
Provision of intermodal facility at Liwonde;
Investment in freight facilities (sidings and loading/discharge equipment);
Train control technology extension;
Capacity building: operational and management training; and
Heritage rolling stock restoration.
(5) Hearing Survey Conducted with CEAR (Summary)
The following comments were received in a hearing survey with CEAR.
The capacity of Nacala railway is approximately 22 million tonnes/year, of which 18
million tonnes/year is covered by coal transportation. The CEAR capacity usable is
approximately 4 million tonnes/year, of which only 500,000 to 600,000 per year is
currently being used.
There is a challenge of transportation of agricultural products which is high in the
harvest season (January to October) but is low in the other months. Consideration is
underway to increase transportation vehicles from Zambia and obtain a steady amount.
Source : CEAR
Figure 4.48 Freight Volume at Nayuchi from 2012 to 2016
229,255
137,122107,212
150,264
102,822
133,813
72,182
42,269
0
50,000
100,000
150,000
200,000
250,000
300,000
350,000
2012‐2013 2014‐2015 2015‐2016 2016‐2017
WEIGHT (ton)
Year
Nayuchi
EXP
IMP
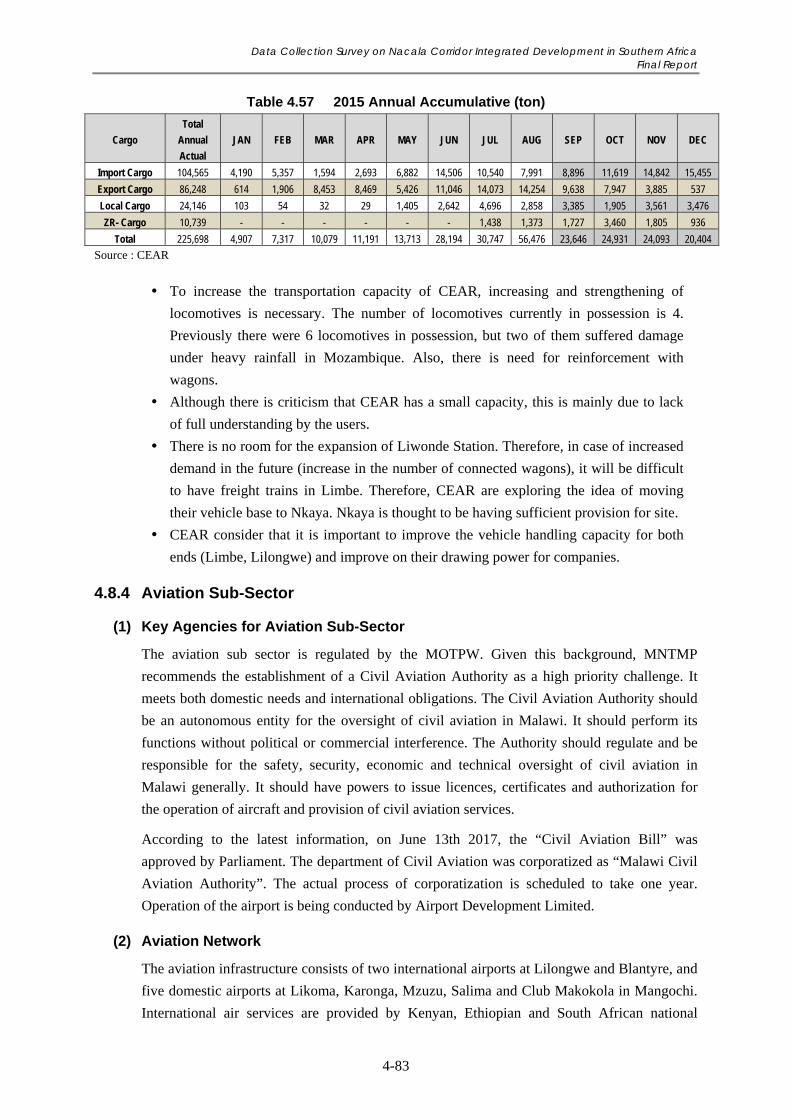
Data Collection Survey on Nacala Corridor Integrated Development in Southern Africa Final Report
4-83
Table 4.57 2015 Annual Accumulative (ton)
Cargo
Total
Annual
Actual
JAN FEB MAR APR MAY JUN JUL AUG SEP OCT NOV DEC
Import Cargo 104,565 4,190 5,357 1,594 2,693 6,882 14,506 10,540 7,991 8,896 11,619 14,842 15,455
Export Cargo 86,248 614 1,906 8,453 8,469 5,426 11,046 14,073 14,254 9,638 7,947 3,885 537
Local Cargo 24,146 103 54 32 29 1,405 2,642 4,696 2,858 3,385 1,905 3,561 3,476
ZR- Cargo 10,739 - - - - - - 1,438 1,373 1,727 3,460 1,805 936
Total 225,698 4,907 7,317 10,079 11,191 13,713 28,194 30,747 56,476 23,646 24,931 24,093 20,404
Source : CEAR
To increase the transportation capacity of CEAR, increasing and strengthening of
locomotives is necessary. The number of locomotives currently in possession is 4.
Previously there were 6 locomotives in possession, but two of them suffered damage
under heavy rainfall in Mozambique. Also, there is need for reinforcement with
wagons.
Although there is criticism that CEAR has a small capacity, this is mainly due to lack
of full understanding by the users.
There is no room for the expansion of Liwonde Station. Therefore, in case of increased
demand in the future (increase in the number of connected wagons), it will be difficult
to have freight trains in Limbe. Therefore, CEAR are exploring the idea of moving
their vehicle base to Nkaya. Nkaya is thought to be having sufficient provision for site.
CEAR consider that it is important to improve the vehicle handling capacity for both
ends (Limbe, Lilongwe) and improve on their drawing power for companies.
4.8.4 Aviation Sub-Sector
(1) Key Agencies for Aviation Sub-Sector
The aviation sub sector is regulated by the MOTPW. Given this background, MNTMP
recommends the establishment of a Civil Aviation Authority as a high priority challenge. It
meets both domestic needs and international obligations. The Civil Aviation Authority should
be an autonomous entity for the oversight of civil aviation in Malawi. It should perform its
functions without political or commercial interference. The Authority should regulate and be
responsible for the safety, security, economic and technical oversight of civil aviation in
Malawi generally. It should have powers to issue licences, certificates and authorization for
the operation of aircraft and provision of civil aviation services.
According to the latest information, on June 13th 2017, the “Civil Aviation Bill” was
approved by Parliament. The department of Civil Aviation was corporatized as “Malawi Civil
Aviation Authority”. The actual process of corporatization is scheduled to take one year.
Operation of the airport is being conducted by Airport Development Limited.
(2) Aviation Network
The aviation infrastructure consists of two international airports at Lilongwe and Blantyre, and
five domestic airports at Likoma, Karonga, Mzuzu, Salima and Club Makokola in Mangochi.
International air services are provided by Kenyan, Ethiopian and South African national
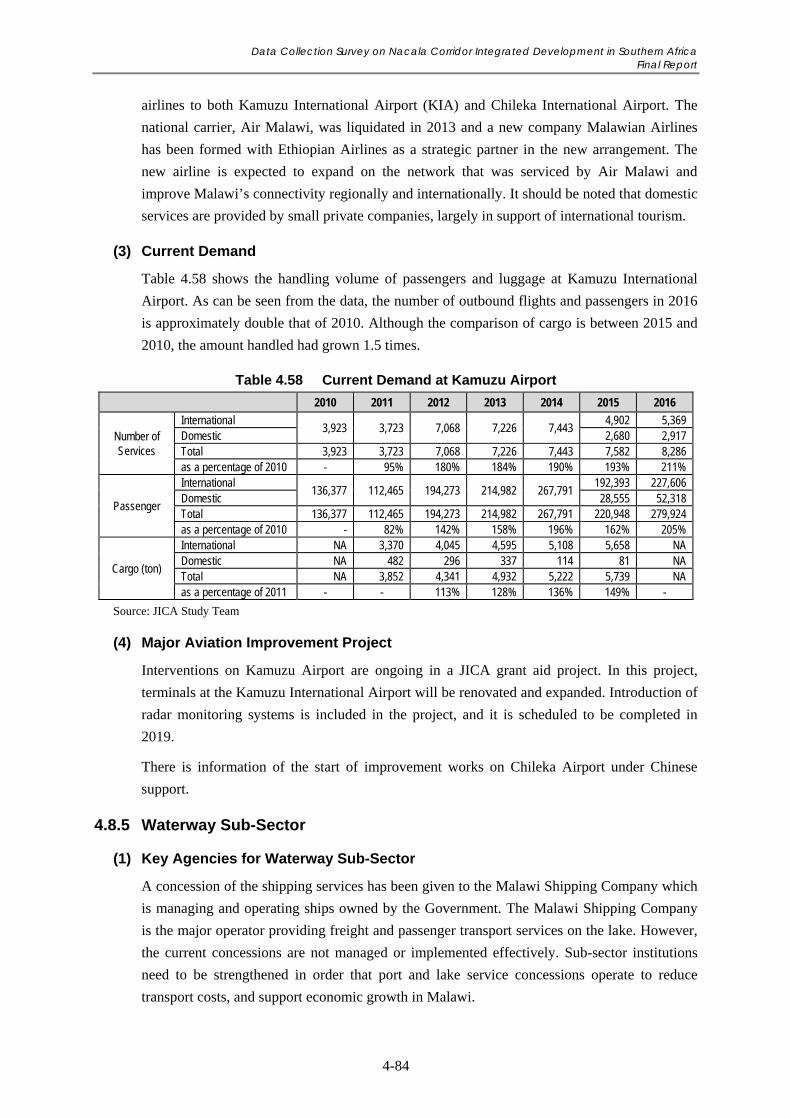
Data Collection Survey on Nacala Corridor Integrated Development in Southern Africa Final Report
4-84
airlines to both Kamuzu International Airport (KIA) and Chileka International Airport. The
national carrier, Air Malawi, was liquidated in 2013 and a new company Malawian Airlines
has been formed with Ethiopian Airlines as a strategic partner in the new arrangement. The
new airline is expected to expand on the network that was serviced by Air Malawi and
improve Malawi’s connectivity regionally and internationally. It should be noted that domestic
services are provided by small private companies, largely in support of international tourism.
(3) Current Demand
Table 4.58 shows the handling volume of passengers and luggage at Kamuzu International
Airport. As can be seen from the data, the number of outbound flights and passengers in 2016
is approximately double that of 2010. Although the comparison of cargo is between 2015 and
2010, the amount handled had grown 1.5 times.
Table 4.58 Current Demand at Kamuzu Airport
2010 2011 2012 2013 2014 2015 2016
Number of Services
International 3,923 3,723 7,068 7,226 7,443
4,902 5,369 Domestic 2,680 2,917 Total 3,923 3,723 7,068 7,226 7,443 7,582 8,286 as a percentage of 2010 - 95% 180% 184% 190% 193% 211%
Passenger
International 136,377 112,465 194,273 214,982 267,791
192,393 227,606 Domestic 28,555 52,318 Total 136,377 112,465 194,273 214,982 267,791 220,948 279,924 as a percentage of 2010 - 82% 142% 158% 196% 162% 205%
Cargo (ton)
International NA 3,370 4,045 4,595 5,108 5,658 NA Domestic NA 482 296 337 114 81 NA Total NA 3,852 4,341 4,932 5,222 5,739 NA as a percentage of 2011 - - 113% 128% 136% 149% -
Source: JICA Study Team
(4) Major Aviation Improvement Project
Interventions on Kamuzu Airport are ongoing in a JICA grant aid project. In this project,
terminals at the Kamuzu International Airport will be renovated and expanded. Introduction of
radar monitoring systems is included in the project, and it is scheduled to be completed in
2019.
There is information of the start of improvement works on Chileka Airport under Chinese
support.
4.8.5 Waterway Sub-Sector
(1) Key Agencies for Waterway Sub-Sector
A concession of the shipping services has been given to the Malawi Shipping Company which
is managing and operating ships owned by the Government. The Malawi Shipping Company
is the major operator providing freight and passenger transport services on the lake. However,
the current concessions are not managed or implemented effectively. Sub-sector institutions
need to be strengthened in order that port and lake service concessions operate to reduce
transport costs, and support economic growth in Malawi.
Data Collection Survey on Nacala Corridor Integrated Development in Southern Africa Final Report
4-85
(2) Waterway Network
Malawi’s inland water transport system comprises of Lake Malawi, Lake Chirwa and the
Shire-Zambezi inland water corridor. Lake Malawi has four ports as designated under the
Inland Waters Shipping Act and some landing points along the shores. The country’s water
transport system is not fully developed and faces a number of challenges including dilapidated
port infrastructure, and capacity problems.
(3) Major Waterway Improvement Project
Water transport is relatively cheaper than any other mode of transport. It provides a better and
cheaper alternative for transporting bulky and heavy goods domestically and internationally.
Malawi has an advantage in water transport as it is endowed with lakes and navigable rivers.
However, the country’s water transport system is not fully developed and faces a number of
challenges including dilapidated port infrastructure; ageing fleet of vessels; and capacity
problems. Given the current transport constraints, this mode of transport has been prioritized
to compliment other transport modes. The Government of Malawi focus on the development
of Nsanje world inland port and Shire-Zambezi Waterway, construction and rehabilitation of
ports along Lake Malawi and acquisition of vessels. The goal is to promote the inland water
transport system and improve access to the sea, which is a goal that has also been indicated in
MNTMP. The medium term expected outcomes are:
• Improved inland water transportation system;
• Improved interface with rail; and road transport; and
• Reduced transport costs.
(4) Key Strategies
Also in the MNTMP, the following strategies have been identified to wards as “the
development of efficient and productive waterway transport systems”
• Developing an efficient and productive maritime transport system;
• Improving port infrastructure;
• Opening up navigable rivers;
• Promoting affordable and safe water transport system; and
• Promoting Public Private Partnerships in the industry.
Data Collection Survey on Nacala Corridor Integrated Development in Southern Africa Final Report
5-1
Chapter 5 Overall Issues and Impact Analysis of Nacala Corridor Development
This chapter mainly focuses on the analysis of overall issues and impact analysis of Nacala
Corridor Development. In order to grasp Nacala Corridor Development in the contexts of
national development and region economic integration, the existing policies and plans on
national development and of regional organisations are reviewed at first, followed by an
examination of currently on-going projects and plans on the ground that would be driving
forces for Nacala Corridor Development. Based on the two analyses, the overall issues of
Nacala Corridor Development are identified and discussed from the perspectives of
development of corridor transport infrastructure and economic sectors, and regional economic
integration. The impact which could be brought by Nacala Corridor Development is analysed
in the end of the chapter.
5.1 Evaluation of Relevance of Nacala Corridor Development to Existing Policies and Plans
The relevance of Nacala Corridor Development is evaluated in relation with the development
plans of Zambia and Malawi as well as the regional economic integration policy owned by the
regional organisations in this section. At first, the consistency and contribution of Nacala
Corridor Development to the goals of national development as well as the transport policy in
the two countries are reviewed, followed by the examination of its relevance from a broad
perspective of regional market integration and trade facilitation specifically.
5.1.1 Zambia’s National Development Plan and Nacala Corridor
The 7NDP is prepared to materialise the Vision 2030 that envisages becoming “a strong and
dynamic, middle income industrial nation,” following the previous national development
plans1. Aiming at the Vision 2030, the macroeconomic targets are also defined and some of
them are listed in Table 5.1. There are several indicators which are also set, in addition to the
targets, such as 25% formal employment ratio, working poverty ratio of 32%, and 10% youth
employment rate in 2021.
1 Ministry of National Development Planning. 2017. Seventh National Development Plan 2017-2021. P. 51.
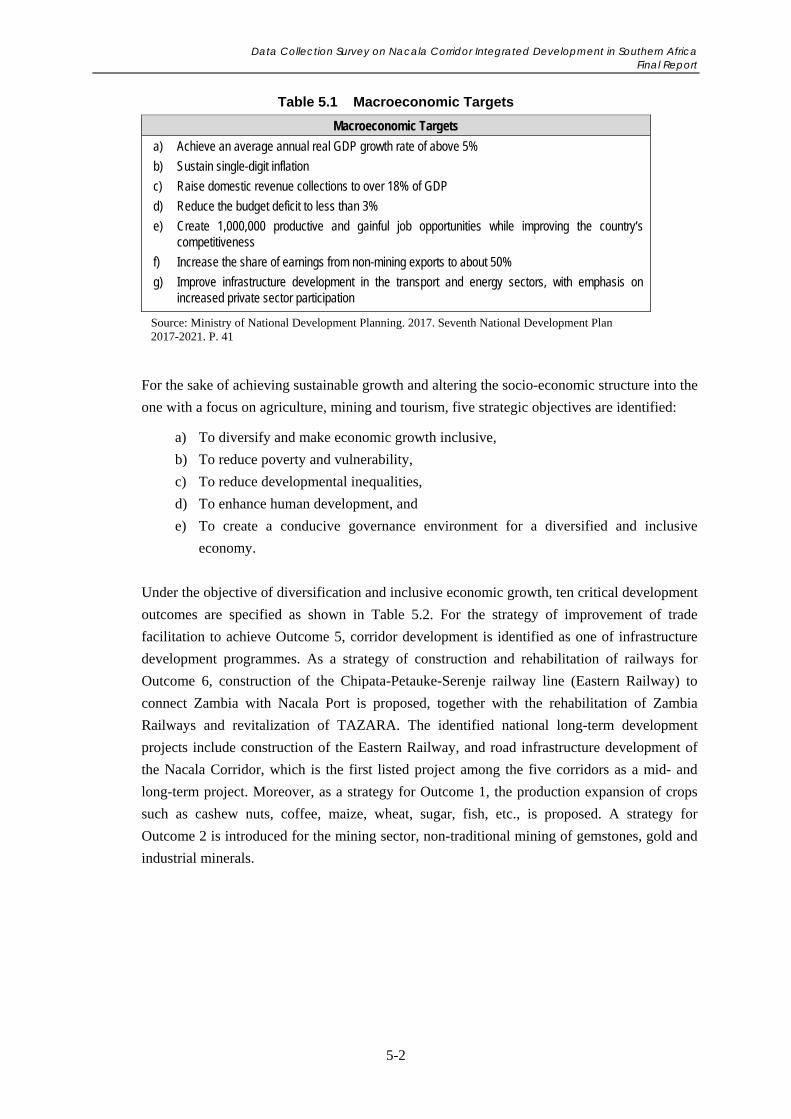
Data Collection Survey on Nacala Corridor Integrated Development in Southern Africa Final Report
5-2
Table 5.1 Macroeconomic Targets
Macroeconomic Targets
a) Achieve an average annual real GDP growth rate of above 5%
b) Sustain single-digit inflation
c) Raise domestic revenue collections to over 18% of GDP
d) Reduce the budget deficit to less than 3%
e) Create 1,000,000 productive and gainful job opportunities while improving the country‘s competitiveness
f) Increase the share of earnings from non-mining exports to about 50%
g) Improve infrastructure development in the transport and energy sectors, with emphasis on increased private sector participation
Source: Ministry of National Development Planning. 2017. Seventh National Development Plan 2017-2021. P. 41
For the sake of achieving sustainable growth and altering the socio-economic structure into the
one with a focus on agriculture, mining and tourism, five strategic objectives are identified:
a) To diversify and make economic growth inclusive,
b) To reduce poverty and vulnerability,
c) To reduce developmental inequalities,
d) To enhance human development, and
e) To create a conducive governance environment for a diversified and inclusive
economy.
Under the objective of diversification and inclusive economic growth, ten critical development
outcomes are specified as shown in Table 5.2. For the strategy of improvement of trade
facilitation to achieve Outcome 5, corridor development is identified as one of infrastructure
development programmes. As a strategy of construction and rehabilitation of railways for
Outcome 6, construction of the Chipata-Petauke-Serenje railway line (Eastern Railway) to
connect Zambia with Nacala Port is proposed, together with the rehabilitation of Zambia
Railways and revitalization of TAZARA. The identified national long-term development
projects include construction of the Eastern Railway, and road infrastructure development of
the Nacala Corridor, which is the first listed project among the five corridors as a mid- and
long-term project. Moreover, as a strategy for Outcome 1, the production expansion of crops
such as cashew nuts, coffee, maize, wheat, sugar, fish, etc., is proposed. A strategy for
Outcome 2 is introduced for the mining sector, non-traditional mining of gemstones, gold and
industrial minerals.
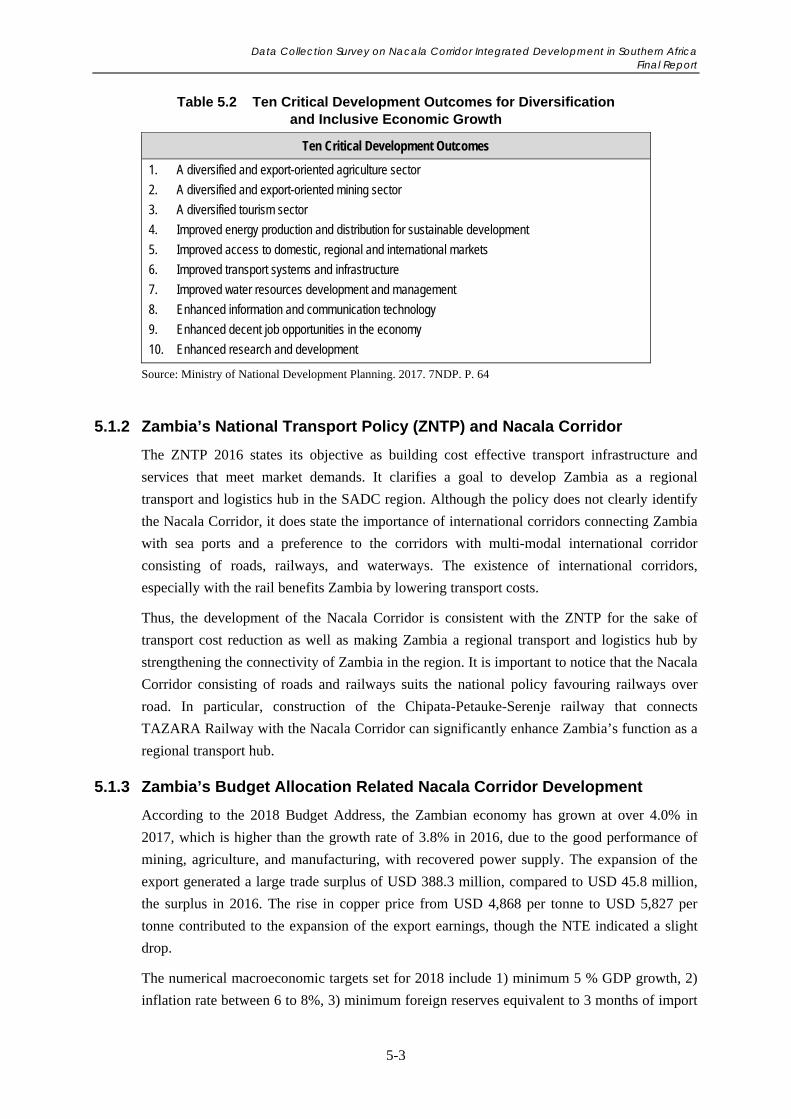
Data Collection Survey on Nacala Corridor Integrated Development in Southern Africa Final Report
5-3
Table 5.2 Ten Critical Development Outcomes for Diversification and Inclusive Economic Growth
Ten Critical Development Outcomes
1. A diversified and export-oriented agriculture sector
2. A diversified and export-oriented mining sector
3. A diversified tourism sector
4. Improved energy production and distribution for sustainable development
5. Improved access to domestic, regional and international markets
6. Improved transport systems and infrastructure
7. Improved water resources development and management
8. Enhanced information and communication technology
9. Enhanced decent job opportunities in the economy
10. Enhanced research and development
Source: Ministry of National Development Planning. 2017. 7NDP. P. 64
5.1.2 Zambia’s National Transport Policy (ZNTP) and Nacala Corridor
The ZNTP 2016 states its objective as building cost effective transport infrastructure and
services that meet market demands. It clarifies a goal to develop Zambia as a regional
transport and logistics hub in the SADC region. Although the policy does not clearly identify
the Nacala Corridor, it does state the importance of international corridors connecting Zambia
with sea ports and a preference to the corridors with multi-modal international corridor
consisting of roads, railways, and waterways. The existence of international corridors,
especially with the rail benefits Zambia by lowering transport costs.
Thus, the development of the Nacala Corridor is consistent with the ZNTP for the sake of
transport cost reduction as well as making Zambia a regional transport and logistics hub by
strengthening the connectivity of Zambia in the region. It is important to notice that the Nacala
Corridor consisting of roads and railways suits the national policy favouring railways over
road. In particular, construction of the Chipata-Petauke-Serenje railway that connects
TAZARA Railway with the Nacala Corridor can significantly enhance Zambia’s function as a
regional transport hub.
5.1.3 Zambia’s Budget Allocation Related Nacala Corridor Development
According to the 2018 Budget Address, the Zambian economy has grown at over 4.0% in
2017, which is higher than the growth rate of 3.8% in 2016, due to the good performance of
mining, agriculture, and manufacturing, with recovered power supply. The expansion of the
export generated a large trade surplus of USD 388.3 million, compared to USD 45.8 million,
the surplus in 2016. The rise in copper price from USD 4,868 per tonne to USD 5,827 per
tonne contributed to the expansion of the export earnings, though the NTE indicated a slight
drop.
The numerical macroeconomic targets set for 2018 include 1) minimum 5 % GDP growth, 2)
inflation rate between 6 to 8%, 3) minimum foreign reserves equivalent to 3 months of import
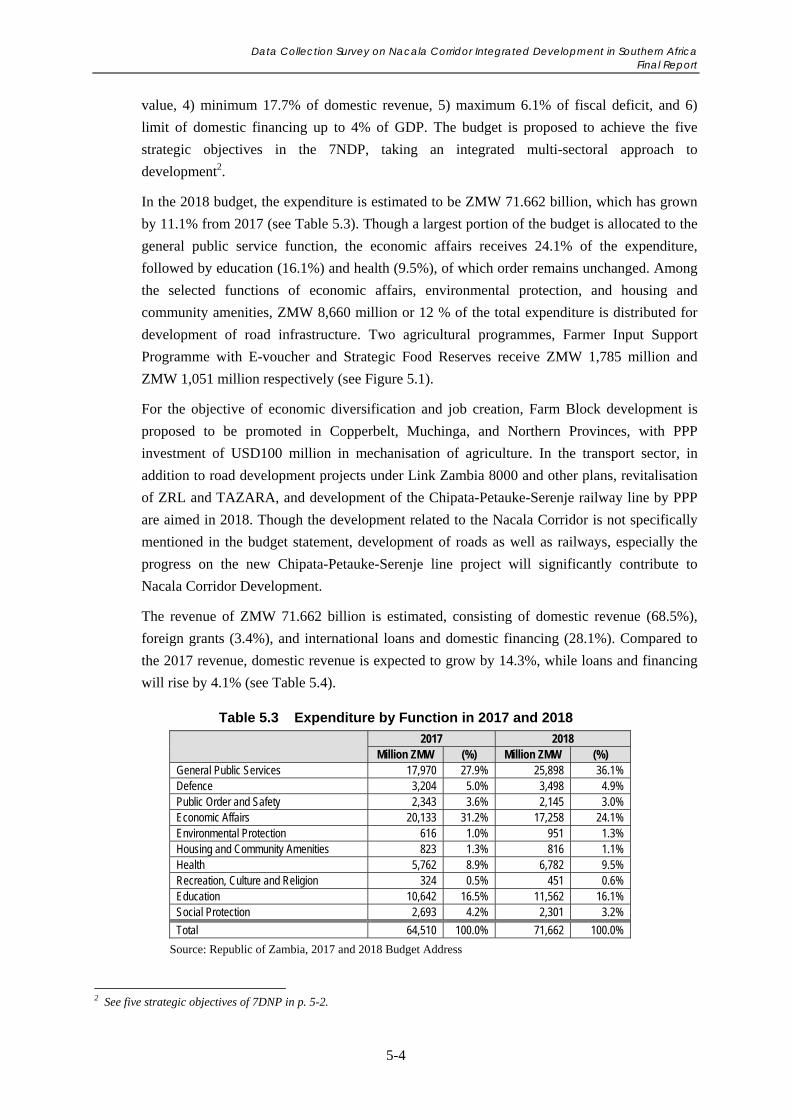
Data Collection Survey on Nacala Corridor Integrated Development in Southern Africa Final Report
5-4
value, 4) minimum 17.7% of domestic revenue, 5) maximum 6.1% of fiscal deficit, and 6)
limit of domestic financing up to 4% of GDP. The budget is proposed to achieve the five
strategic objectives in the 7NDP, taking an integrated multi-sectoral approach to
development2.
In the 2018 budget, the expenditure is estimated to be ZMW 71.662 billion, which has grown
by 11.1% from 2017 (see Table 5.3). Though a largest portion of the budget is allocated to the
general public service function, the economic affairs receives 24.1% of the expenditure,
followed by education (16.1%) and health (9.5%), of which order remains unchanged. Among
the selected functions of economic affairs, environmental protection, and housing and
community amenities, ZMW 8,660 million or 12 % of the total expenditure is distributed for
development of road infrastructure. Two agricultural programmes, Farmer Input Support
Programme with E-voucher and Strategic Food Reserves receive ZMW 1,785 million and
ZMW 1,051 million respectively (see Figure 5.1).
For the objective of economic diversification and job creation, Farm Block development is
proposed to be promoted in Copperbelt, Muchinga, and Northern Provinces, with PPP
investment of USD100 million in mechanisation of agriculture. In the transport sector, in
addition to road development projects under Link Zambia 8000 and other plans, revitalisation
of ZRL and TAZARA, and development of the Chipata-Petauke-Serenje railway line by PPP
are aimed in 2018. Though the development related to the Nacala Corridor is not specifically
mentioned in the budget statement, development of roads as well as railways, especially the
progress on the new Chipata-Petauke-Serenje line project will significantly contribute to
Nacala Corridor Development.
The revenue of ZMW 71.662 billion is estimated, consisting of domestic revenue (68.5%),
foreign grants (3.4%), and international loans and domestic financing (28.1%). Compared to
the 2017 revenue, domestic revenue is expected to grow by 14.3%, while loans and financing
will rise by 4.1% (see Table 5.4).
Table 5.3 Expenditure by Function in 2017 and 2018
2017 2018
Million ZMW (%) Million ZMW (%) General Public Services 17,970 27.9% 25,898 36.1% Defence 3,204 5.0% 3,498 4.9% Public Order and Safety 2,343 3.6% 2,145 3.0% Economic Affairs 20,133 31.2% 17,258 24.1% Environmental Protection 616 1.0% 951 1.3% Housing and Community Amenities 823 1.3% 816 1.1% Health 5,762 8.9% 6,782 9.5% Recreation, Culture and Religion 324 0.5% 451 0.6% Education 10,642 16.5% 11,562 16.1% Social Protection 2,693 4.2% 2,301 3.2%
Total 64,510 100.0% 71,662 100.0%
Source: Republic of Zambia, 2017 and 2018 Budget Address
2 See five strategic objectives of 7DNP in p. 5-2.
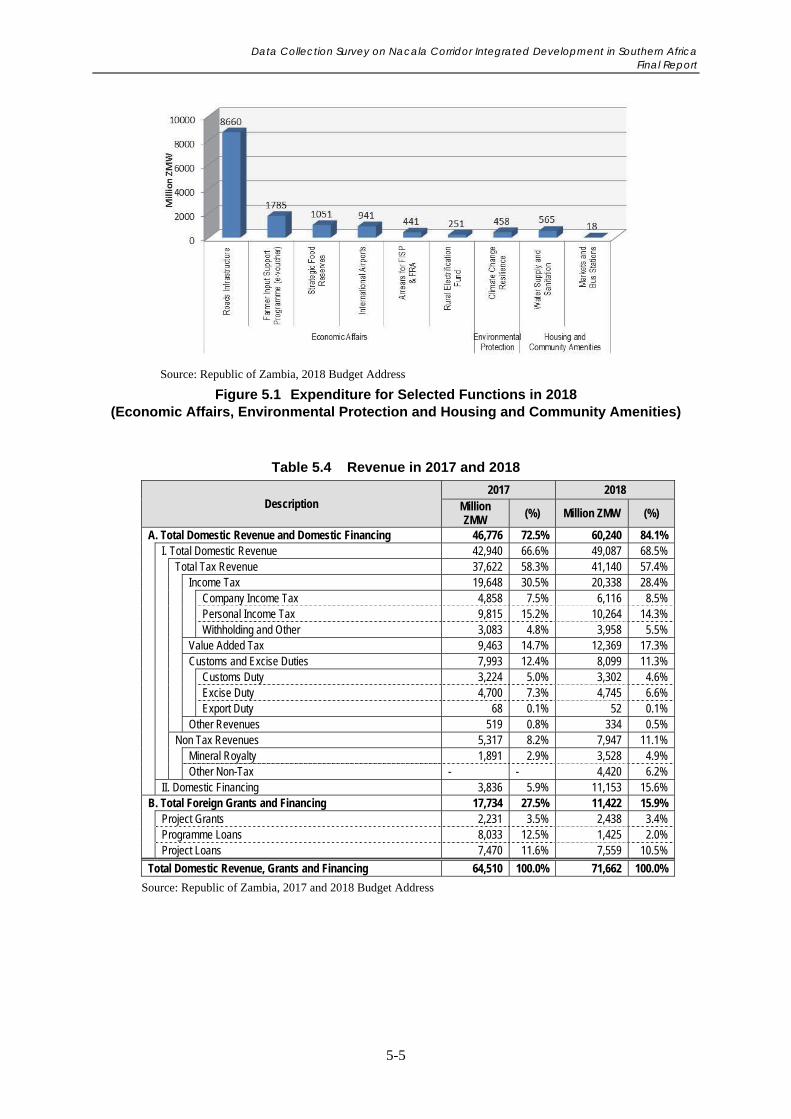
Data Collection Survey on Nacala Corridor Integrated Development in Southern Africa Final Report
5-5
Source: Republic of Zambia, 2018 Budget Address
Figure 5.1 Expenditure for Selected Functions in 2018 (Economic Affairs, Environmental Protection and Housing and Community Amenities)
Table 5.4 Revenue in 2017 and 2018
Description 2017 2018
Million ZMW
(%) Million ZMW (%)
A. Total Domestic Revenue and Domestic Financing 46,776 72.5% 60,240 84.1% I. Total Domestic Revenue 42,940 66.6% 49,087 68.5% Total Tax Revenue 37,622 58.3% 41,140 57.4% Income Tax 19,648 30.5% 20,338 28.4% Company Income Tax 4,858 7.5% 6,116 8.5% Personal Income Tax 9,815 15.2% 10,264 14.3% Withholding and Other 3,083 4.8% 3,958 5.5% Value Added Tax 9,463 14.7% 12,369 17.3% Customs and Excise Duties 7,993 12.4% 8,099 11.3% Customs Duty 3,224 5.0% 3,302 4.6% Excise Duty 4,700 7.3% 4,745 6.6% Export Duty 68 0.1% 52 0.1% Other Revenues 519 0.8% 334 0.5% Non Tax Revenues 5,317 8.2% 7,947 11.1% Mineral Royalty 1,891 2.9% 3,528 4.9% Other Non-Tax - - 4,420 6.2% II. Domestic Financing 3,836 5.9% 11,153 15.6% B. Total Foreign Grants and Financing 17,734 27.5% 11,422 15.9% Project Grants 2,231 3.5% 2,438 3.4% Programme Loans 8,033 12.5% 1,425 2.0% Project Loans 7,470 11.6% 7,559 10.5%
Total Domestic Revenue, Grants and Financing 64,510 100.0% 71,662 100.0%
Source: Republic of Zambia, 2017 and 2018 Budget Address
Data Collection Survey on Nacala Corridor Integrated Development in Southern Africa Final Report
5-6
5.1.4 Malawi Growth and Development Strategy (MGDS) III and Nacala Corridor
The MGDS III has been prepared, following the MGDS I and II, guided by the Vision 20203.
With the expected GDP growth of 6.2% from 2017 to 2022, the MGDS III focuses on five
KPAs: Agriculture and Climate Change Management; Education and Skills Development;
Energy, Industry and Tourism Development; Transport and ICT infrastructure; and Health and
Population Management.
Development of the transport corridors is specified as a strategy to improve the
competitiveness of Malawian goods and services in regional and international markets, under
the Outcome of Enhanced Access to the Local and International Markets in the KPA of
Transport and ICT Infrastructure. For that purpose, the identified action proposed is to ensure
maintenance and rehabilitation of infrastructure along the major corridors for improved access
to ports.
Recognising the efficiency and effectiveness of rail transport for transport cost reduction, the
MGDS III directs transport development toward multi-modal transport consisting of road, rail,
air, and water transport. The improvement of the Nacala Corridor by the private sector is
expected, to achieve the Outcome of Increased Private Sector Investment in the Operation and
Management of Rail Transport Infrastructure in the KPA of Rail Transport. The reduction of
travel time and transport cost between Blantyre and Nacala Port is adopted as key performance
indicators to measure the progress in achieving the outcome toward MGDS Goal 4,
“development of a safe, affordable, reliable, equitable and sustainable transport system and
ICT infrastructure, and to manage and promote a vibrant tourism industry.” The indicators are
presented in Table 5.5 below.
Table 5.5 Improvement of Nacala Corridor (Rail) as Indicators in MGDS III
MGDS Goal 4: Development of a safe, affordable, reliable, equitable and sustainable transport system and ICT infrastructure, and to manage and promote a vibrant tourism industry.
MGDS III KPA
Expected Outcomes
Key Performance Indicator
Base Year (2016/17)
Targets Respon- sible 2018 2019 2020 2021 2022
4.1.3 Rail Transport
Increased private sector investment in the operation and management of rail transport infrastructure
Average travel time by rail between Blantyre and Nacala. (days)
2.3 2.3 2 2 1.6 1.6 MOTPW
Average transport cost by rail: Blantyre – Nacala (USD/t)
68 65 61 58 54 51 MOTPW
Source: Malawi Growth and Development Strategy (MGDS) III. July 2017.
3 Vision 2020 aims to achieve that “by the year 2020 Malawi as a God fearing nation, will be secure, democratically mature, environmentally sustainable, self-reliant with equal opportunities for and active participation by all, having social services, vibrant cultural and religious values and a technologically driven middle-income economy.
Data Collection Survey on Nacala Corridor Integrated Development in Southern Africa Final Report
5-7
5.1.5 Malawi’s National Transport Policy and Nacala Corridor
Directed by the MGDS II and the Economic Recovery Plan as well as the Vision 2020, the
National Transport Policy formulated in 2015 offers the policy direction of the transport sector.
The sector is one of the key priority areas in the Vision 2020 aiming to be a middle income
economy by 2020 and its impact goes beyond the performance of the sector itself into
development of the economy, especially the priority sectors in the MGDS II, tourism, mining
and agriculture. The MNTP identifies high transport cost as the major challenge to the sector
and its supporting role to the economic sectors, and adopts the goal, which is “to ensure the
development of a coordinated and efficient transport infrastructure that fosters the safe and
competitive operation of viable, affordable, equitable and sustainable transport services”4.
In the MNTP, as one of the main policy objectives, development of transport corridors is
proposed to enhance the competitiveness of Malawian products and reduce import costs. The
theme of international transport corridors is selected among eight priority areas5. The MNTP
points out needs for, firstly coordination with corridor countries for consensus building on
corridor development and in investments in the corridor areas and border points, and secondly,
establishment of a Shipper’s Council for protection of their interests.
The policy for international transport corridors aims to:
1) Promote the establishment of inland dry ports
2) Ensure the establishment of one stop border posts where viable
3) Ensure the existence and operation of Malawi Shipper’s Council
4) Ensure that infrastructure along the major corridors is maintained and rehabilitated to
improve access to ports
5) Promote efficiency in the operations of Malawi Cargo Centre Limited
6) Develop a database of statistics on corridor operations
7) Remove barriers within the transport sector to facilitate domestic and cross-border
trade and travel, and ensure provision of efficient transport services
8) Integrate safeguards into corridor development and operations to prevent adverse
impacts such as environmental degradation, social disruption and HIV and AIDS
The development of the Nacala Corridor is currently implemented in such a way to fulfil the
policy on international transport corridors stated above. The projects related to the
development of the Nacala Corridor such as transport infrastructure improvement and OSBP
development will address or contribute to the mitigation of some of the causes of high
transport costs, such as cumbersome border documentation and procedures, and high fuel
prices, described in the policy. It will also promote improvement of the railway system and
private sector participation, which are also among the eight priority areas.
4 P. 8 in the National Transport Policy. 5 Eight priority areas include: 1) transport infrastructure, 2) transport service provision, 3) non-motorised transport, 4) international transport corridors, 5) private sector participation, 6) good governance, 7) institutional framework, and 8) cross cutting issues.
Data Collection Survey on Nacala Corridor Integrated Development in Southern Africa Final Report
5-8
5.1.6 Malawi’s National Transport Master Plan (MNTMP) and Nacala Corridor
The MNTMP targeted the year of 2036 and developed three strategic objectives aiming to
achieve the vision envisaged in the MNTP6 and to address the challenge of high transport
costs: 1) Reduce transport costs and prices across all modes; 2) Improve the safety of transport
infrastructure and services; and 3) Enhanced and sustainable passenger and freight transport
systems. A modal shift from road to rail transport, intermodal integration, and development of
transport system for the sectors of agriculture and mining are identified among others as
operational objectives under the three strategic objectives.
In the MNTMP, the Nacala Corridor is recognised as one of the important backbones
supporting the transport network in Malawi. The corridor consists of the sole railway line
operational in the country currently, with roads; however, it is underutilised partly due to the
limited number of shipping lines visiting Nacala Port, and for Malawi, Beira is the most
preferred port that is only connected by road. Thus, the MNTMP proposes a strategy on
railways to expand the railway network from Beira and other ports, for increased choices and
competition among them, in addition to the improvement of operation and the existing
network of CEAR. Among the three scenarios, the integrated transport network suggested by
the MNTMP is presented in Figure 5.2, which is composed of the two railways of
Beira-Limbe and Chilumba-Mbeya and two inland water transport links of Chilumba-Nkhata
Bay-Salima-Liwonde and Nkhata Bay-Mbamba Bay. The MNTMP assumes that the
Chipata-Petauke-Serenje Railway would not be connected in the planning period. Yet, a large
volume of traffic demand will be induced by the construction of a dry port in Chipata in the
short-term.
By 2036, the port volumes at Nacala to/from Malawi are forecasted to expand from 174,300
tonnes at the present to from 364,000 to 478,500 tonnes with the rail interventions or between
459,300 to 480,500 tonnes with the inland water transport interventions, depending on the
choice of interventions.
6 The vision of the National Transport Policy is ‘the development of a coordinated and efficient transport infrastructure that fosters the safe and competitive operation of viable, affordable, equitable and sustainable transport services.’
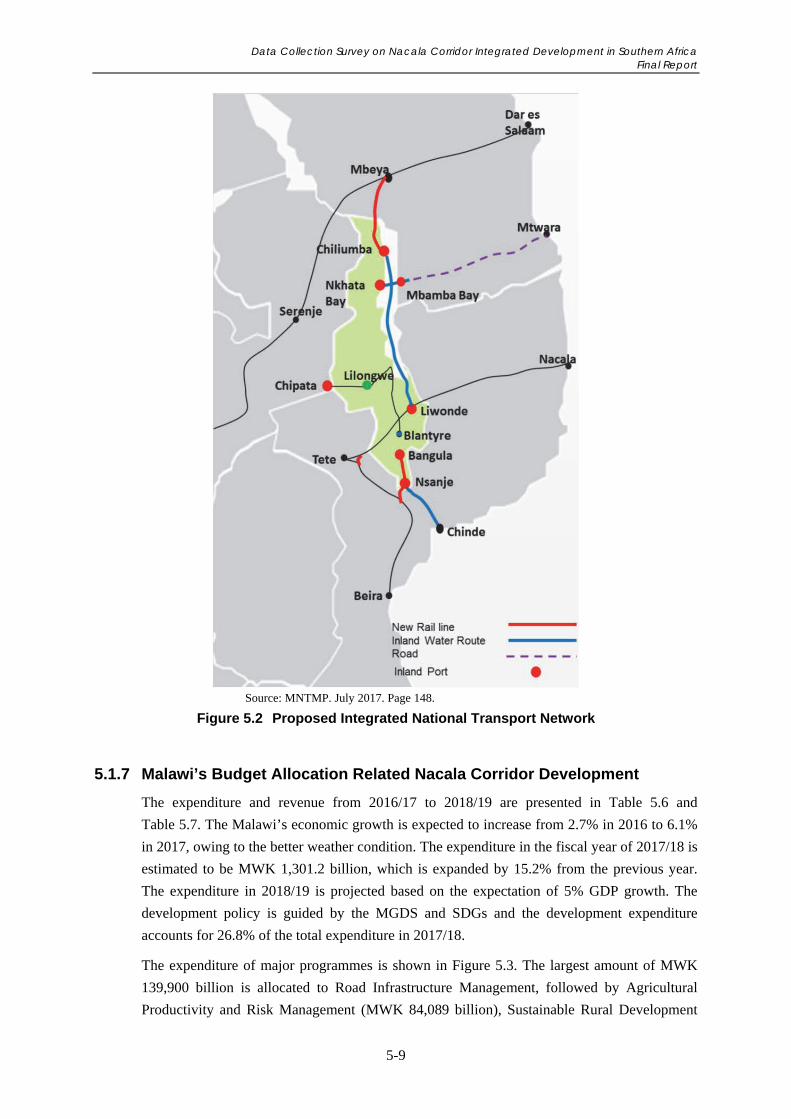
Data Collection Survey on Nacala Corridor Integrated Development in Southern Africa Final Report
5-9
Source: MNTMP. July 2017. Page 148.
Figure 5.2 Proposed Integrated National Transport Network
5.1.7 Malawi’s Budget Allocation Related Nacala Corridor Development
The expenditure and revenue from 2016/17 to 2018/19 are presented in Table 5.6 and
Table 5.7. The Malawi’s economic growth is expected to increase from 2.7% in 2016 to 6.1%
in 2017, owing to the better weather condition. The expenditure in the fiscal year of 2017/18 is
estimated to be MWK 1,301.2 billion, which is expanded by 15.2% from the previous year.
The expenditure in 2018/19 is projected based on the expectation of 5% GDP growth. The
development policy is guided by the MGDS and SDGs and the development expenditure
accounts for 26.8% of the total expenditure in 2017/18.
The expenditure of major programmes is shown in Figure 5.3. The largest amount of MWK
139,900 billion is allocated to Road Infrastructure Management, followed by Agricultural
Productivity and Risk Management (MWK 84,089 billion), Sustainable Rural Development
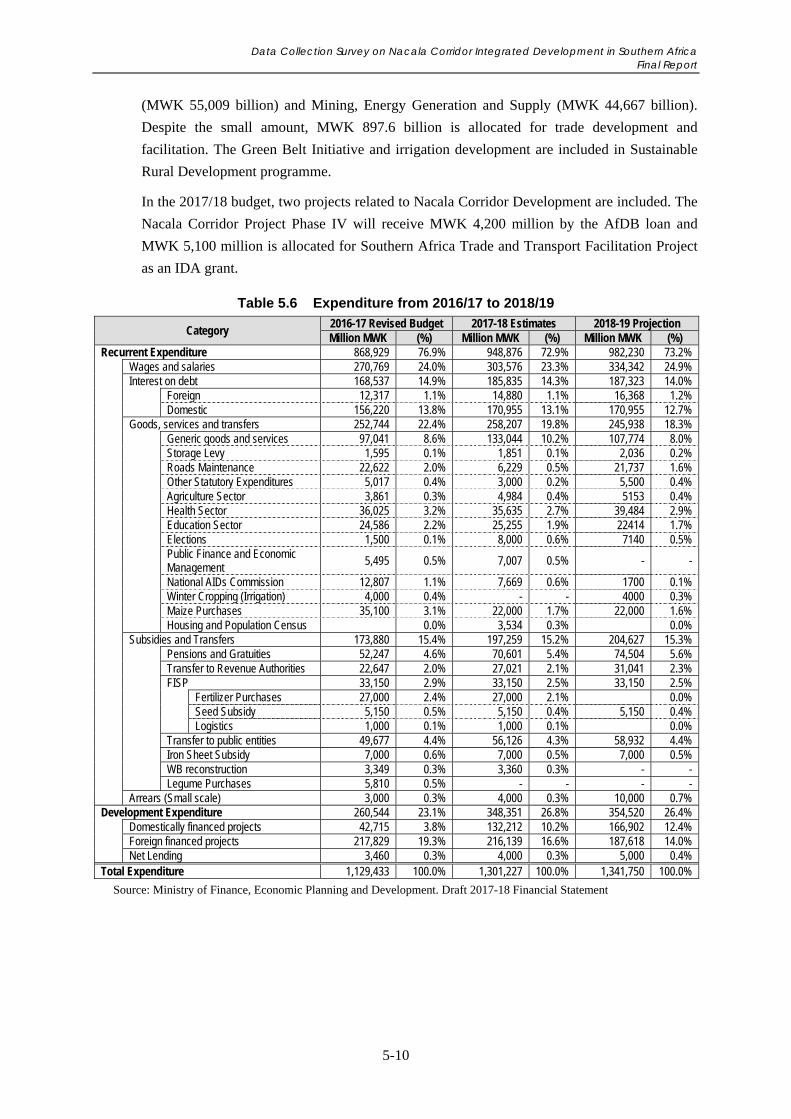
Data Collection Survey on Nacala Corridor Integrated Development in Southern Africa Final Report
5-10
(MWK 55,009 billion) and Mining, Energy Generation and Supply (MWK 44,667 billion).
Despite the small amount, MWK 897.6 billion is allocated for trade development and
facilitation. The Green Belt Initiative and irrigation development are included in Sustainable
Rural Development programme.
In the 2017/18 budget, two projects related to Nacala Corridor Development are included. The
Nacala Corridor Project Phase IV will receive MWK 4,200 million by the AfDB loan and
MWK 5,100 million is allocated for Southern Africa Trade and Transport Facilitation Project
as an IDA grant.
Table 5.6 Expenditure from 2016/17 to 2018/19
Category 2016-17 Revised Budget 2017-18 Estimates 2018-19 Projection Million MWK (%) Million MWK (%) Million MWK (%)
Recurrent Expenditure 868,929 76.9% 948,876 72.9% 982,230 73.2% Wages and salaries 270,769 24.0% 303,576 23.3% 334,342 24.9% Interest on debt 168,537 14.9% 185,835 14.3% 187,323 14.0% Foreign 12,317 1.1% 14,880 1.1% 16,368 1.2% Domestic 156,220 13.8% 170,955 13.1% 170,955 12.7% Goods, services and transfers 252,744 22.4% 258,207 19.8% 245,938 18.3% Generic goods and services 97,041 8.6% 133,044 10.2% 107,774 8.0% Storage Levy 1,595 0.1% 1,851 0.1% 2,036 0.2% Roads Maintenance 22,622 2.0% 6,229 0.5% 21,737 1.6% Other Statutory Expenditures 5,017 0.4% 3,000 0.2% 5,500 0.4% Agriculture Sector 3,861 0.3% 4,984 0.4% 5153 0.4% Health Sector 36,025 3.2% 35,635 2.7% 39,484 2.9% Education Sector 24,586 2.2% 25,255 1.9% 22414 1.7% Elections 1,500 0.1% 8,000 0.6% 7140 0.5%
Public Finance and Economic Management
5,495 0.5% 7,007 0.5% - -
National AIDs Commission 12,807 1.1% 7,669 0.6% 1700 0.1% Winter Cropping (Irrigation) 4,000 0.4% - - 4000 0.3% Maize Purchases 35,100 3.1% 22,000 1.7% 22,000 1.6%
Housing and Population Census 0.0% 3,534 0.3% 0.0% Subsidies and Transfers 173,880 15.4% 197,259 15.2% 204,627 15.3%
Pensions and Gratuities 52,247 4.6% 70,601 5.4% 74,504 5.6% Transfer to Revenue Authorities 22,647 2.0% 27,021 2.1% 31,041 2.3% FISP 33,150 2.9% 33,150 2.5% 33,150 2.5%
Fertilizer Purchases 27,000 2.4% 27,000 2.1% 0.0%
Seed Subsidy 5,150 0.5% 5,150 0.4% 5,150 0.4% Logistics 1,000 0.1% 1,000 0.1% 0.0% Transfer to public entities 49,677 4.4% 56,126 4.3% 58,932 4.4% Iron Sheet Subsidy 7,000 0.6% 7,000 0.5% 7,000 0.5% WB reconstruction 3,349 0.3% 3,360 0.3% - - Legume Purchases 5,810 0.5% - - - - Arrears (Small scale) 3,000 0.3% 4,000 0.3% 10,000 0.7% Development Expenditure 260,544 23.1% 348,351 26.8% 354,520 26.4% Domestically financed projects 42,715 3.8% 132,212 10.2% 166,902 12.4% Foreign financed projects 217,829 19.3% 216,139 16.6% 187,618 14.0% Net Lending 3,460 0.3% 4,000 0.3% 5,000 0.4% Total Expenditure 1,129,433 100.0% 1,301,227 100.0% 1,341,750 100.0%
Source: Ministry of Finance, Economic Planning and Development. Draft 2017-18 Financial Statement
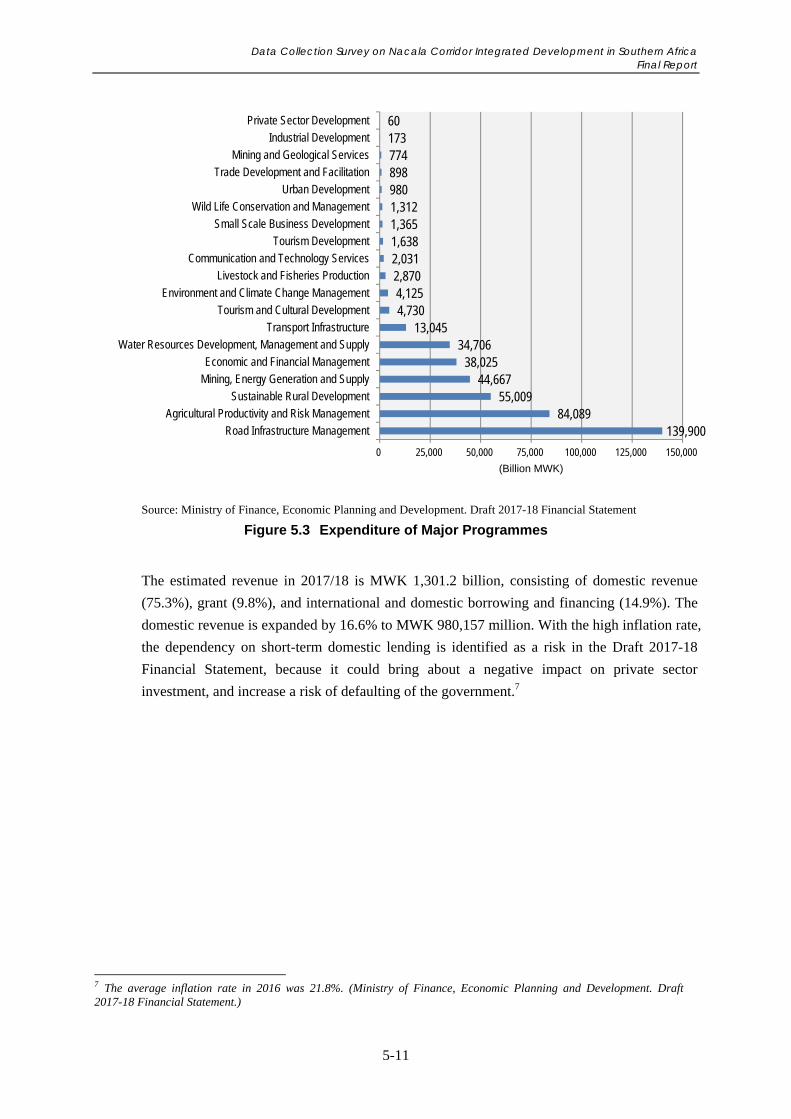
Data Collection Survey on Nacala Corridor Integrated Development in Southern Africa Final Report
5-11
Source: Ministry of Finance, Economic Planning and Development. Draft 2017-18 Financial Statement
Figure 5.3 Expenditure of Major Programmes
The estimated revenue in 2017/18 is MWK 1,301.2 billion, consisting of domestic revenue
(75.3%), grant (9.8%), and international and domestic borrowing and financing (14.9%). The
domestic revenue is expanded by 16.6% to MWK 980,157 million. With the high inflation rate,
the dependency on short-term domestic lending is identified as a risk in the Draft 2017-18
Financial Statement, because it could bring about a negative impact on private sector
investment, and increase a risk of defaulting of the government.7
7 The average inflation rate in 2016 was 21.8%. (Ministry of Finance, Economic Planning and Development. Draft 2017-18 Financial Statement.)
139,900 84,089
55,009 44,667
38,025 34,706
13,045 4,730 4,125 2,870 2,031 1,638 1,365 1,312 980 898 774 173 60
0 25,000 50,000 75,000 100,000 125,000 150,000
Road Infrastructure Management
Agricultural Productivity and Risk Management
Sustainable Rural Development
Mining, Energy Generation and Supply
Economic and Financial Management
Water Resources Development, Management and Supply
Transport Infrastructure
Tourism and Cultural Development
Environment and Climate Change Management
Livestock and Fisheries Production
Communication and Technology Services
Tourism Development
Small Scale Business Development
Wild Life Conservation and Management
Urban Development
Trade Development and Facilitation
Mining and Geological Services
Industrial Development
Private Sector Development
(Billion MWK)
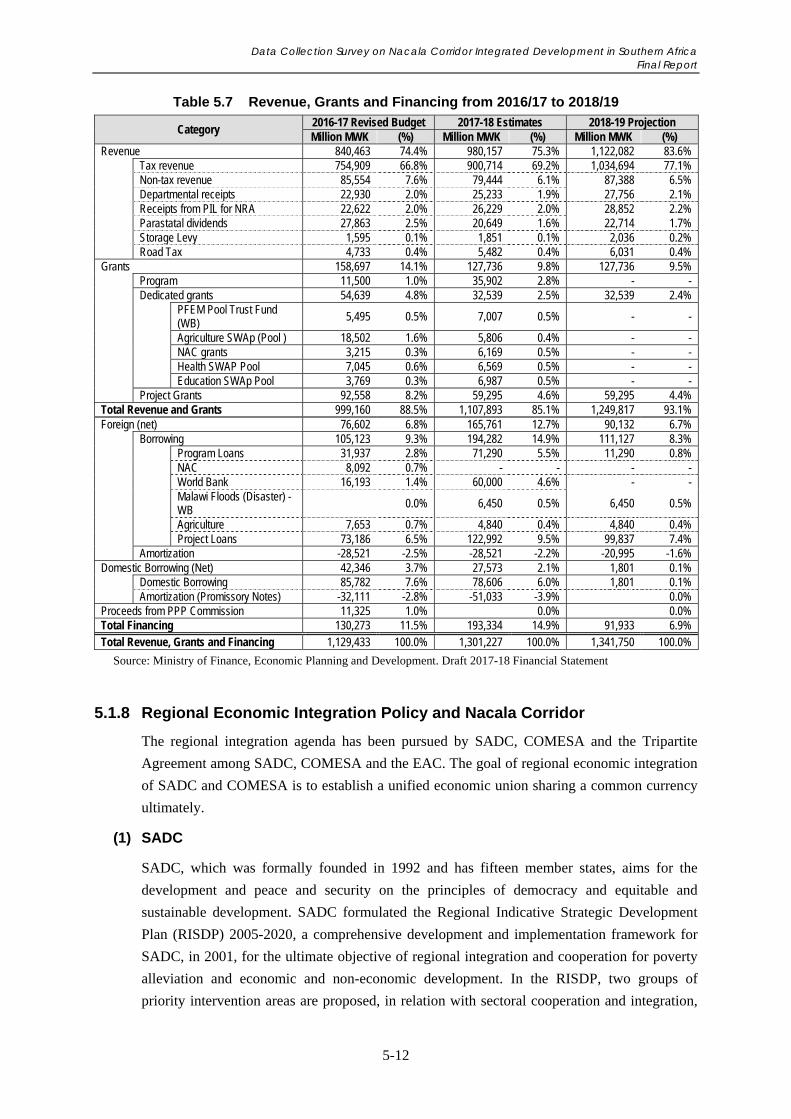
Data Collection Survey on Nacala Corridor Integrated Development in Southern Africa Final Report
5-12
Table 5.7 Revenue, Grants and Financing from 2016/17 to 2018/19
Category 2016-17 Revised Budget 2017-18 Estimates 2018-19 Projection Million MWK (%) Million MWK (%) Million MWK (%)
Revenue 840,463 74.4% 980,157 75.3% 1,122,082 83.6% Tax revenue 754,909 66.8% 900,714 69.2% 1,034,694 77.1% Non-tax revenue 85,554 7.6% 79,444 6.1% 87,388 6.5% Departmental receipts 22,930 2.0% 25,233 1.9% 27,756 2.1% Receipts from PIL for NRA 22,622 2.0% 26,229 2.0% 28,852 2.2% Parastatal dividends 27,863 2.5% 20,649 1.6% 22,714 1.7% Storage Levy 1,595 0.1% 1,851 0.1% 2,036 0.2% Road Tax 4,733 0.4% 5,482 0.4% 6,031 0.4% Grants 158,697 14.1% 127,736 9.8% 127,736 9.5% Program 11,500 1.0% 35,902 2.8% - - Dedicated grants 54,639 4.8% 32,539 2.5% 32,539 2.4%
PFEM Pool Trust Fund (WB) 5,495 0.5% 7,007 0.5% - -
Agriculture SWAp (Pool ) 18,502 1.6% 5,806 0.4% - - NAC grants 3,215 0.3% 6,169 0.5% - - Health SWAP Pool 7,045 0.6% 6,569 0.5% - - Education SWAp Pool 3,769 0.3% 6,987 0.5% - - Project Grants 92,558 8.2% 59,295 4.6% 59,295 4.4% Total Revenue and Grants 999,160 88.5% 1,107,893 85.1% 1,249,817 93.1% Foreign (net) 76,602 6.8% 165,761 12.7% 90,132 6.7% Borrowing 105,123 9.3% 194,282 14.9% 111,127 8.3% Program Loans 31,937 2.8% 71,290 5.5% 11,290 0.8% NAC 8,092 0.7% - - - - World Bank 16,193 1.4% 60,000 4.6% - -
Malawi Floods (Disaster) - WB 0.0% 6,450 0.5% 6,450 0.5%
Agriculture 7,653 0.7% 4,840 0.4% 4,840 0.4% Project Loans 73,186 6.5% 122,992 9.5% 99,837 7.4% Amortization -28,521 -2.5% -28,521 -2.2% -20,995 -1.6% Domestic Borrowing (Net) 42,346 3.7% 27,573 2.1% 1,801 0.1% Domestic Borrowing 85,782 7.6% 78,606 6.0% 1,801 0.1% Amortization (Promissory Notes) -32,111 -2.8% -51,033 -3.9% 0.0% Proceeds from PPP Commission 11,325 1.0% 0.0% 0.0% Total Financing 130,273 11.5% 193,334 14.9% 91,933 6.9% Total Revenue, Grants and Financing 1,129,433 100.0% 1,301,227 100.0% 1,341,750 100.0%
Source: Ministry of Finance, Economic Planning and Development. Draft 2017-18 Financial Statement
5.1.8 Regional Economic Integration Policy and Nacala Corridor
The regional integration agenda has been pursued by SADC, COMESA and the Tripartite
Agreement among SADC, COMESA and the EAC. The goal of regional economic integration
of SADC and COMESA is to establish a unified economic union sharing a common currency
ultimately.
(1) SADC
SADC, which was formally founded in 1992 and has fifteen member states, aims for the
development and peace and security on the principles of democracy and equitable and
sustainable development. SADC formulated the Regional Indicative Strategic Development
Plan (RISDP) 2005-2020, a comprehensive development and implementation framework for
SADC, in 2001, for the ultimate objective of regional integration and cooperation for poverty
alleviation and economic and non-economic development. In the RISDP, two groups of
priority intervention areas are proposed, in relation with sectoral cooperation and integration,
Data Collection Survey on Nacala Corridor Integrated Development in Southern Africa Final Report
5-13
and cross-sectoral interventions. The development of transport corridors is recognised in the
interventions for infrastructure support for regional integration and poverty eradication in the
sectoral cooperation and integration. It expects to contribute to building an efficient,
cost-effective, safe and fully-integrated transport system that promotes investments through
strengthened competitiveness and activated trade, improves production, and provides the
market access to rural communities in the Region. The RISDP adopts the spatial development
initiative, namely development corridors, growth triangles, growth centres and transfrontier
conservation areas, as one of the implementation principles.
(2) COMESA
COMESA was organised to replace the former Preferential Trade Area (PTA) in 1994,
primarily for economic cooperation and integration of member states. Currently, with the
largest 21 member states in the African regional markets, it approaches to regional integration,
through the three pillars of market integration, industrialisation and infrastructure development.
As a priority and strategic area, infrastructure development enhancing connectivity and
infrastructure integration is proposed for cost reduction and improved competitiveness. The
2016-2020 medium-term strategic plan proposed eight strategic objectives including
strengthening market integration; attracting increased investments; strengthening the blue
economy; harnessing the benefits of strategic co-operation; strengthening the development of
economic infrastructure (energy, transport and ICT); industrialisation; fostering gender
equality and social development; and ensuring regional and Secretariat readiness. The strategic
objective of market integration suggests the improvement of border management on the
priority regional corridors. The strategic objective of economic infrastructure development is
facilitated by the corridor approach entailing three components of development of priority
regional physical infrastructure, policy and regulatory harmonisation and facilitation.
(3) COMESA-EAC-SADC Tripartite Agreement
The Tripartite Agreement among COMESA, EAC and SADC was signed in June, 2011 for the
establishment of COMESA-EAC-SADC Free Trade Area (FTA) for a market covering 600
million population in 26 countries and producing the GDP of USD 1 trillion. Through the
Agreement, the three regional organisations aim to coordinate policies and activities in trade,
customs and infrastructure development for economic integration of Southern and Eastern
Africa.
The Tripartite Strategy composed of three intervention areas of market integration,
infrastructure development, and industrial development is proposed to achieve economic
development by removing trade barriers including both tariff and non-tariff ones. The
programmes and actions will be implemented, mainly focusing on:
Harmonisation and improvement of functionality of regional trading arrangements and
programmes, including establishing a Tripartite FTA;
Enhancement of trade facilitation to improve the flow of goods along regional transport
corridors by lowering transit times and the cost of trading; and
Data Collection Survey on Nacala Corridor Integrated Development in Southern Africa Final Report
5-14
Joint planning and implementation of infrastructure programmes, which mainly
comprises surface (road, rail, border posts, seaports) and air transport, ICT, and energy8.
In addition to the field of trade facilitation, corridor development is identified as one of the
priority areas of regional infrastructure in the Agreement.
(4) Regional Economic Integration Policy and Nacala Corridor
In short, SADC, COMESA and the COMESA-EAC-SADC Tripartite Agreement integrate
corridor development into their regional integration policy as a strategy for infrastructure
development. Corridor development is recognised as an effective measure to facilitate trade in
the concerned regions, by lowering transport cost and improving connectivity among the areas
which will otherwise be isolated. Eventually, the production, competitiveness, and
attractiveness of investments in the regions connected by a transport corridor are expected to
be improved with reduced trade barriers through interventions on border management, in
addition to the physical infrastructure development. It is noteworthy that these organisations
perceive corridor development as an approach not only for infrastructure development, but
also for industry promotion and spatial development.
Nacala Corridor Development with prospective projects such as development of dry ports and
OSBP is consistent to the regional economic integration policy proposed by the three
organisations. The Nacala Corridor is one of the few corridors equipped with both rail and
roads that may bring about a significant impact on the regional development and trade. Due to
its locational advantage, it provides Zambia and Malawi with access to the Tripartite Region
not only via land transport but also via maritime transport. Therefore, the Nacala Corridor has
the potential to contribute to the regional economic integration among Zambia, Malawi and
Mozambique. The expected impacts of the Nacala Corridor including trade facilitation and
industry promotion are examined in detail in the following section.
5.2 Possible Driving Forces for Nacala Corridor Development
This section aims to assess development activities and opportunities that could affect the
potential of the Nacala Corridor Region. A number of on-going and planned projects and plans
of various activities identified in the field survey, which can be driving forces for development
of the Nacala Corridor Region are reviewed, with discussion on development opportunities
that have been appearing in the regions of Zambia and Malawi.
5.2.1 Zambia
In the Nacala Corridor Region of Zambia, significant projects for infrastructure development
are on-going or planned, including most notably, transport and logistics infrastructure projects
related to the Nacala Corridor, such as development of the Great East Road, a new rail line, an
OSBP and a dry port. In addition, agricultural and industrial development initiatives are found
8 http://www.sadc.int/about-sadc/continental-interregional-integration/tripartite-cooperation/#Coordination
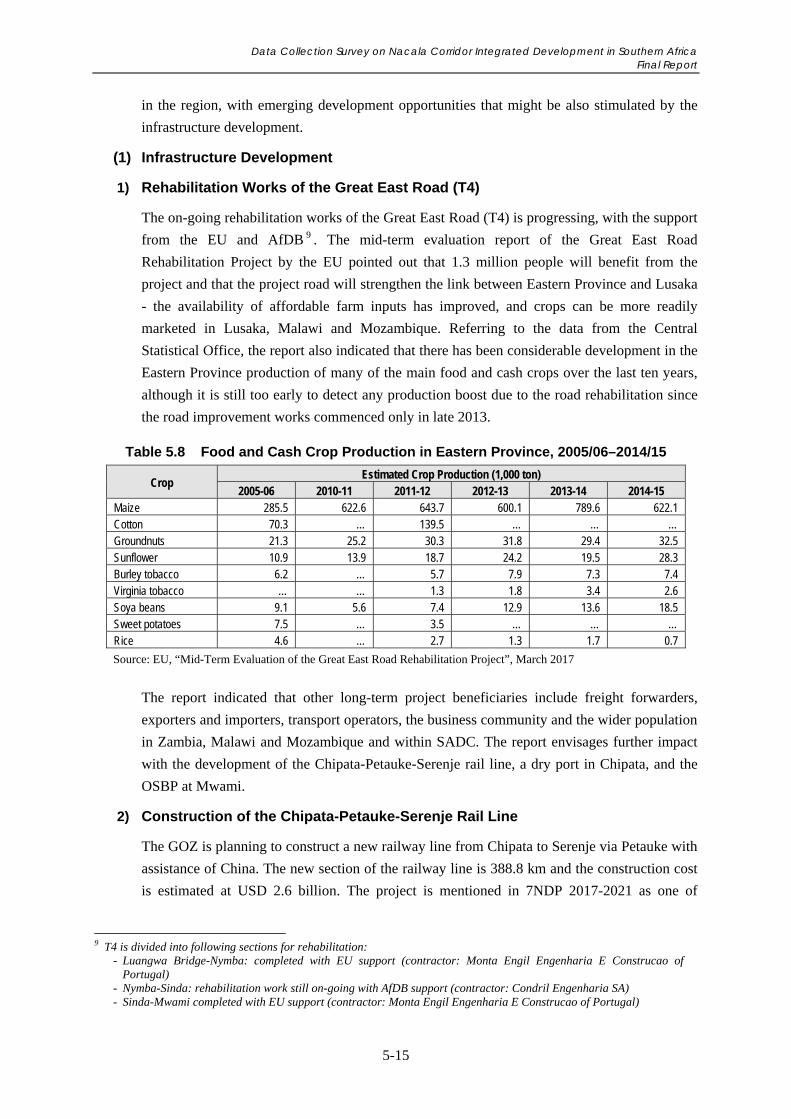
Data Collection Survey on Nacala Corridor Integrated Development in Southern Africa Final Report
5-15
in the region, with emerging development opportunities that might be also stimulated by the
infrastructure development.
(1) Infrastructure Development
1) Rehabilitation Works of the Great East Road (T4)
The on-going rehabilitation works of the Great East Road (T4) is progressing, with the support
from the EU and AfDB 9 . The mid-term evaluation report of the Great East Road
Rehabilitation Project by the EU pointed out that 1.3 million people will benefit from the
project and that the project road will strengthen the link between Eastern Province and Lusaka
- the availability of affordable farm inputs has improved, and crops can be more readily
marketed in Lusaka, Malawi and Mozambique. Referring to the data from the Central
Statistical Office, the report also indicated that there has been considerable development in the
Eastern Province production of many of the main food and cash crops over the last ten years,
although it is still too early to detect any production boost due to the road rehabilitation since
the road improvement works commenced only in late 2013.
Table 5.8 Food and Cash Crop Production in Eastern Province, 2005/06–2014/15
Crop Estimated Crop Production (1,000 ton)
2005-06 2010-11 2011-12 2012-13 2013-14 2014-15 Maize 285.5 622.6 643.7 600.1 789.6 622.1 Cotton 70.3 … 139.5 … … … Groundnuts 21.3 25.2 30.3 31.8 29.4 32.5 Sunflower 10.9 13.9 18.7 24.2 19.5 28.3 Burley tobacco 6.2 … 5.7 7.9 7.3 7.4 Virginia tobacco … … 1.3 1.8 3.4 2.6 Soya beans 9.1 5.6 7.4 12.9 13.6 18.5 Sweet potatoes 7.5 … 3.5 … … … Rice 4.6 … 2.7 1.3 1.7 0.7
Source: EU, “Mid-Term Evaluation of the Great East Road Rehabilitation Project”, March 2017
The report indicated that other long-term project beneficiaries include freight forwarders,
exporters and importers, transport operators, the business community and the wider population
in Zambia, Malawi and Mozambique and within SADC. The report envisages further impact
with the development of the Chipata-Petauke-Serenje rail line, a dry port in Chipata, and the
OSBP at Mwami.
2) Construction of the Chipata-Petauke-Serenje Rail Line
The GOZ is planning to construct a new railway line from Chipata to Serenje via Petauke with
assistance of China. The new section of the railway line is 388.8 km and the construction cost
is estimated at USD 2.6 billion. The project is mentioned in 7NDP 2017-2021 as one of
9 T4 is divided into following sections for rehabilitation:
- Luangwa Bridge-Nymba: completed with EU support (contractor: Monta Engil Engenharia E Construcao of Portugal)
- Nymba-Sinda: rehabilitation work still on-going with AfDB support (contractor: Condril Engenharia SA) - Sinda-Mwami completed with EU support (contractor: Monta Engil Engenharia E Construcao of Portugal)
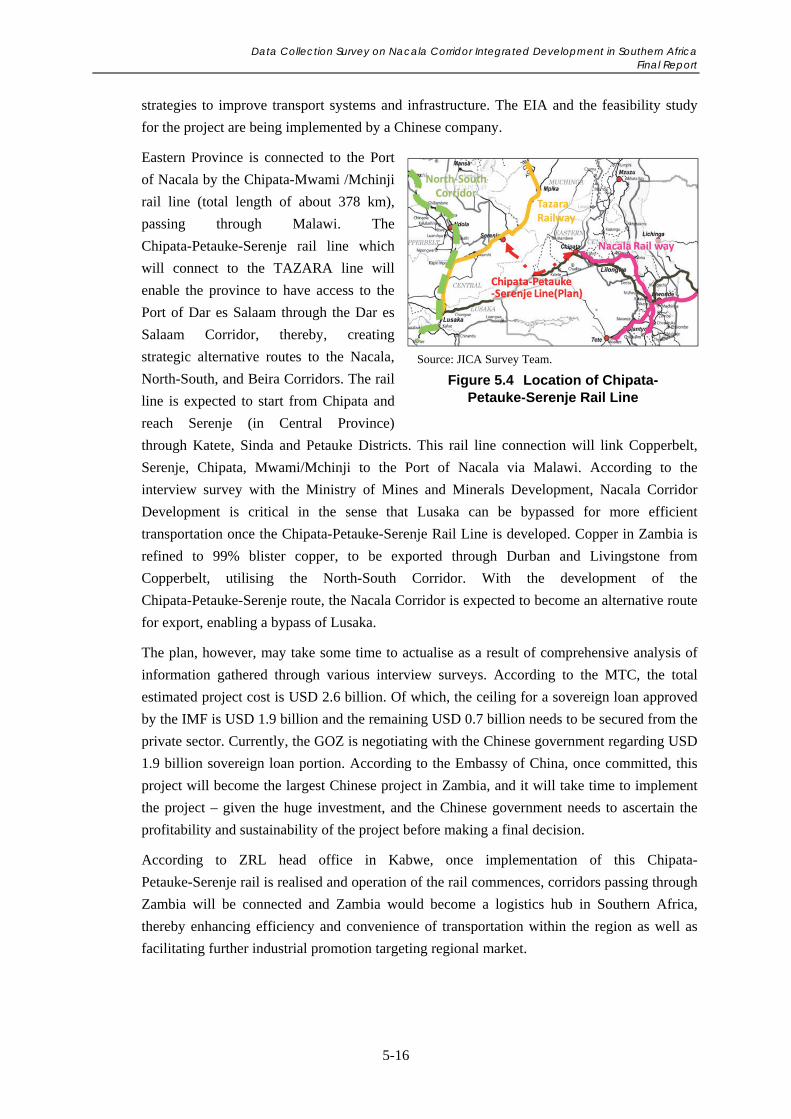
Data Collection Survey on Nacala Corridor Integrated Development in Southern Africa Final Report
5-16
strategies to improve transport systems and infrastructure. The EIA and the feasibility study
for the project are being implemented by a Chinese company.
Eastern Province is connected to the Port
of Nacala by the Chipata-Mwami /Mchinji
rail line (total length of about 378 km),
passing through Malawi. The
Chipata-Petauke-Serenje rail line which
will connect to the TAZARA line will
enable the province to have access to the
Port of Dar es Salaam through the Dar es
Salaam Corridor, thereby, creating
strategic alternative routes to the Nacala,
North-South, and Beira Corridors. The rail
line is expected to start from Chipata and
reach Serenje (in Central Province)
through Katete, Sinda and Petauke Districts. This rail line connection will link Copperbelt,
Serenje, Chipata, Mwami/Mchinji to the Port of Nacala via Malawi. According to the
interview survey with the Ministry of Mines and Minerals Development, Nacala Corridor
Development is critical in the sense that Lusaka can be bypassed for more efficient
transportation once the Chipata-Petauke-Serenje Rail Line is developed. Copper in Zambia is
refined to 99% blister copper, to be exported through Durban and Livingstone from
Copperbelt, utilising the North-South Corridor. With the development of the
Chipata-Petauke-Serenje route, the Nacala Corridor is expected to become an alternative route
for export, enabling a bypass of Lusaka.
The plan, however, may take some time to actualise as a result of comprehensive analysis of
information gathered through various interview surveys. According to the MTC, the total
estimated project cost is USD 2.6 billion. Of which, the ceiling for a sovereign loan approved
by the IMF is USD 1.9 billion and the remaining USD 0.7 billion needs to be secured from the
private sector. Currently, the GOZ is negotiating with the Chinese government regarding USD
1.9 billion sovereign loan portion. According to the Embassy of China, once committed, this
project will become the largest Chinese project in Zambia, and it will take time to implement
the project – given the huge investment, and the Chinese government needs to ascertain the
profitability and sustainability of the project before making a final decision.
According to ZRL head office in Kabwe, once implementation of this Chipata-
Petauke-Serenje rail is realised and operation of the rail commences, corridors passing through
Zambia will be connected and Zambia would become a logistics hub in Southern Africa,
thereby enhancing efficiency and convenience of transportation within the region as well as
facilitating further industrial promotion targeting regional market.
Source: JICA Survey Team.
Figure 5.4 Location of Chipata- Petauke-Serenje Rail Line
Data Collection Survey on Nacala Corridor Integrated Development in Southern Africa Final Report
5-17
3) Dry Port in Chipata
Currently Eastern Province has no operational dry port facilities but there is a plan to construct
a dry port at Chipata Railway Station. According to the MTC, a feasibility study for dry port
development in Chipata has been conducted; however, an EIA as well as operation and
maintenance strategy have not been undertaken yet. As regards the necessary financing, an EU
group is showing interest to provide support10. A dry port will benefit freight forwarders,
exporters and importers, transport operators, the business community and the wider population
and facilitate utilisation of the Nacala Corridor in the long-run.
4) OSBP and Inter-Country Trade Centre (ICTC) at Mwami Border Post
Regarding the development of OSBP at the Mwami Border Post, a feasibility study has been
undertaken and the designs are being reviewed. The MTC expects that finalizing the OSBP
should have a positive effect on the traffic levels of the Nacala Corridor as a viable alternative
to other routes. According to the interview survey with the MOCTI, there is a plan to develop
a Trade Centre in Mwami for the purpose of formalising and facilitating inter country trade
between Zambia and Malawi.
5) Development of Coal Fired Power Plant in Chipata
According to the Department of Planning, Eastern Province, as well as the Ministry of Energy
(MOE), there is a plan to develop a coal fired power plant (350 MW class) in Chipata by
utilising coal in Tete, Mozambique. The coal would be imported from Tete via the Nacala
Corridor. The development will be undertaken by IPP – Black Rhino Group of South African
capital, according to the company’s website11 . The company has already concluded a
Memorandum of Understanding (MOU) with the government and a feasibility study is now
being conducted (expected project cost is about USD 900 million). Black Rhino Group will
start negotiation with ZESCO regarding off-take agreement. Given that Eastern Province has
not had any power plants thus far, according to the Department of Planning, Eastern Province,
the new power plant will surely contribute to increased and stable power supply in the
province, which would serve as a critical boost to the business development of the area. Also
the project might create an opportunity to improve the Nacala Railway of the Malawi section
between Liwonde to Mchinji.
6) Gas Pipeline and Transmission Line Development
According to the interview survey with the MOE, there is a plan to put up a gas pipeline into
Chipata from Mozambique. Moreover, with the vast coal plants Mozambique has, Zambia
plans to construct a transmission line through the Nacala Corridor to Tete for a power
connection.
10 According to interview survey with EU, the dry port design and preparation of tender documents have been conducted with EU support. European Investment Bank (EIB) is considering financial support on physical infrastructure development. EIB has a financial instrument to provide loans to private sector, since the dry port is a private facility. 11 http://blackrhinogroup.com/#Aboutus
Data Collection Survey on Nacala Corridor Integrated Development in Southern Africa Final Report
5-18
(2) Economic Sector Development
1) Development of an Industrial Park and Multi Facility Economical Zone (MFEZ) in
Chipata
In Chipata, an Industrial Park and MFEZ are planned for development by the private sector
and the government, respectively. According to the interview survey with the MOCTI, the
proposed Chipata Industrial Park is situated along Chadidza Road on a 100 hectare piece of
land. The Industrial Park is being promoted by an indigenous Zambian enterprise who is a
majority shareholder. The developers of the Industrial Park have already invested USD 8
million in rehabilitating infrastructure and have so far attracted three enterprises engaged in
manufacturing and processing activities. It is estimated that more than twenty companies will
be located in the Industrial Park with projected employment levels estimated at 4,000
employees. On the other hand, according to the Department of Planning, Eastern Province,
MFEZ is planned by the government, however, there is no prospect for a financial source at
the moment, and the plan is still at the concept phase.
2) Movement Toward Export Oriented Agriculture and Agribusiness Development
The GOZ has been implementing Farm Block Development Programme since 2002. If
commercial farm production is carried out on the scale of 100,000 ha in the areas close to the
Nacala Corridors, export oriented agricultural production and agribusiness will also be
activated. In addition, it is expected that the transportation of fertiliser and the export of
products will be increased by using the Nacala Corridor. On the other hand, it is necessary to
pay attention to the protection of rights of small scale farmers and rural communities in the
implementation of large scale agricultural development.
Especially in the area near the Nacala Corridor, according to the Department of Planning,
Eastern Province, the government has already identified 100,000 ha of land in Lundazi which
is high potential area for cotton production, and agro-processing development (including
cotton and livestock) is expected with Out-grower Scheme to affiliate with small scale
farmers.
Moreover, the private company, which is planning to develop the Chipata-Petauke-Serenje
Railway, indicates an intention to develop a Farm Block in Petauke and the GOZ is examining
the plan12. Additionally, the investors are identified for Manshya in Muchinga Province and
Luswish in Copperbelt Province. Farm Block development is planned around Ndola in
Copperbelt Province and Chongwe in Lusaka Province. After these developments progress,
agricultural commodities and processed agricultural products will be distributed to the
domestic and foreign markets via the rehabilitated Great East Road (T4), planned Chipata -
Petauke - Serenje railway, and a dry port in and Chipata. As a result, the development of both
the regional economy and the corridor infrastructure would be boosted.
12 Interview with Department of Agriculture, MOA
Data Collection Survey on Nacala Corridor Integrated Development in Southern Africa Final Report
5-19
Meanwhile, capacity building and market access improvement for small-scale farmers are also
being implemented for promotion of export oriented agriculture in Zambia (See 3.1.6). In
collaboration with agribusiness companies such as NWK Agri-Services and Cargill,
enhancement of small scale farmers’ production of not only the company’s main business
crops but also other crops is also developing steadily. For example, the demand of soya beans
and related products like oil, soy powder, soy cake etc. is high. Thus, if the farmers in the
region, mainly small scale farmers, increase these productions, the diversification of
agriculture and agribusiness will be promoted (see 3.1.7 (2)). As for livestock products, the
government is trying to increase the production to export one million goats and sheep a year to
Saudi Arabia (see 3.1.7 (1)).
(3) Expansion of Development Opportunities
1) Rapid Growth of Chipata Urban Centre
The major urban centres existing along the Nacala Corridor in Zambia and Malawi are Lusaka,
Chipata, Lilongwe and Blantyre. Populations of the urban centres are 1,747,152 (2015),
146,088 (2015), 1,098,200 (2016) and 920,200 (2016) respectively13. Chipata is growing
rapidly in recent years and was declared as city in February 2017, which is the capital of
Eastern Province, and the centre of trading of agricultural products such as maize, soya beans,
cotton, tobacco and sunflowers, a gateway to the Nacala Port via the Mwami border post, and
a tourist service town for the tourism around the Luangwa National Park. Chipata has the
potential to function as an important urban centre to support and contribute to economic
development of the Nacala Corridor Region, in combination with strengthening of the
transport function of the Nacala Corridor.
2) Competition among the Rail Corridors
While the development potential of the Nacala Railway Corridor is expected to expand by the
railway extension from Chipata to Serenje, construction and improvement of other railways
are also under study or planned by the public and private sectors. Those include the
construction of the Chingola-Solwezi-Jimbe Railway (600 km) to link North-Western
Province of Zambia to the Port of Lobito, construction of the Livingstone-Kazungula-Sesheke
Railway to link Zambia to Walvis Bay in Namibia (200 km), the Solwezi-Kaoma-Sesheke
Railway to link North-Western Province of Zambia to Walvis Bay, and upgrading of the
North-South Rail Corridor. In addition, the revitalisation of existing railways, Zambia Railway
and TAZARA, is planned by the government with support of the World Bank, EU and China.
If the railways of those corridors are developed and improved, competition among the
different rail corridors could emerge and the Nacala Corridor has to make efforts to compete
with the others. This competitive environment will improve transport services and costs and
can promote the utilisation of the Nacala Corridor in the future.
13 Thomas Brinkhoff: City Population, http://www.citypopulation.de
Data Collection Survey on Nacala Corridor Integrated Development in Southern Africa Final Report
5-20
5.2.2 Malawi
Similar to the case of Zambia, there are several on-going projects and plans for infrastructure
development and economic sector development that could affect development of the Nacala
Corridor Region in Malawi. In the infrastructure sector, logistics and energy infrastructure
development projects are identified, while large scale mining projects, and agriculture and
industry sector related projects and initiatives are discussed in the economic sectors.
(1) Infrastructure Development
1) Dry Ports in Lilongwe and Blantyre and a Wet Port in Liwonde
The above mentioned MNTMP recommends the development of dry ports in Lilongwe and
Blantyre, in addition to the proposed dry port construction in Salima. The MNTMP also
suggests the construction of a wet port in Liwonde at the crossing point of the railway and
Shire River water transportation route with the aim to enhance the utilisation of both railway
and water transportation from Lake Malawi to the Shire River. These initiatives will enhance
the usability of the Nacala Corridor, leading to further activation of the transportation of goods
and services.
In fact, Vale and its partner Mitsui Corporation have shown an interest in a railway
rehabilitation programme for the Nkaya-Mchinji route, and negotiation with the GOM is in the
final stages14. As pointed out by the officials of the Malawi government, this initiative will
help to complete the movement of goods from Nacala Port in Mozambique to Chitapa, Zambia
through Lilongwe and Mchinji. Given this new initiative, Nkaya, which has enough land for
development, may have a potential to be developed as rail yard or clearance point of rail
transport.
2) Power Sector Development
According to the interview survey with the Ministry of Finance, Department of Economic
Planning and Development, and AfDB, there is a plan to develop power generation facilities in
Neno District, supported by the Chinese government (the contractor is China’s Gezhouba
Group Corporation (CGGC)). The plan is to construct a 300 MW class coal-fired power plant
in the Mwanza area (fist stage), utilising coal produced in Tete in Mozambique, and to be
transported to Mwanza from Moatize. The plan is to eventually expand the generation capacity
up to 1,000 MW. The partial operation is planned by 2019 and the plant will be fully
operational by 2021. As part of a medium to long term transmission plan, a north-south
backbone 400 kV system development is expected and would be connected to neighbouring
utilities – Phombeya near Blantyre to be connected to Mozambique (Matambo and/or
Ncondezi in Tete Province). In addition, there is another plan to develop a coal fired power
plant of 80 MW class capacities in northern Malawi through IPP. Once the power plants have
become operational, power supply problems, especially in the key load centres of the country
14 https://www.nyasatimes.com/vale-mitsui-plan-nkaya-mchinji-railway-line/
Data Collection Survey on Nacala Corridor Integrated Development in Southern Africa Final Report
5-21
– Blantyre and Lilongwe – will be alleviated and then industrial development (including
manufacturing) and investment will be facilitated. (See 4.6.3 Table 4.47)
(2) Economic Sector Development
1) Development of Special Economic Zone (SEZ)
According to the interview survey with the MOITT, there is a plan to develop SEZ in the
country15. The Ministry expects to prepare a feasibility study with support from development
partners. The feasibility study will identify candidate location(s) and come up with operation
strategies of SEZ, as well as come up with measures to improve production, expand
employment, generate foreign currency, etc. According to the interview survey with the MITC,
several candidate locations are under consideration – Lilongwe (with 350 ha of land in the
vicinity of the airport), Blantyre (with 38 ha of land), Liwonde, Shire Valley, North Karonga,
Salima, etc. The GOM expects the private sector to undertake the development and marketing
of SEZ. Legal and institutional frameworks regarding SEZ development and operation, as well
as selection criteria and various incentive structures for SEZ developers and operators have
not been decided yet. Concrete tax incentives will be decided in coordination with pertinent
authorities including the Ministry of Finance and Economic Development, MOITT, MRA, and
MITC to facilitate private sector participation. According to the MITC, a private company in
the USA (Water Wheels International) has proposed to develop a private SEZ, apart from the
SEZ development mentioned above. The company plans to construct a 2MW power plant
(through IPP) near Nkhata Bay to secure necessary power in the SEZ. The remaining power
will be sold to ESCOM, and negotiation between the company and ESCOM is on-going. As
such, facilitating development of power generation through promotion of IPP may be one of
options to mitigate power supply problems for SEZ development.
2) Development of Irrigation Scheme
Large-scale irrigated farmland has been developed in Malawi through assistance from
development partners and private business operators. Among 78,100 ha of agricultural land
planned to be development of irrigation system, financial sources were identified for 35,170
ha of land. The irrigation scheme of 21,500 ha will be developed in Shire Valley Irrigation
Project (see 4.1.6). Since the rain-fed agriculture is mostly practised in the country, the
decrease or stagnant of the productivity and production due to unstable rainfalls and droughts
are main challenges in the agriculture sector. If the irrigation can be implemented in
appropriate time, increase of the productivity and production can be expected. Although the
GOM (as well as the GOZ) has anticipated that the agricultural programmes promoting market
oriented agriculture adversely affect national food security, the food surplus has been
increasingly observed due to the recent growth of agricultural production. Therefore, if the
15 According to the MITC, the project was originally proposed as an EIF (Enhanced Integrated Framework, a multi-donor financed financial and technical support programme under the auspices of the WTO) in 2014, as a three year programme, costing around 3 million dollars. Three prioritized export-oriented clusters were identified for diversification – oil seed products, sugar cane projects and manufactured products. However, the proposal was rejected and the MITC is now discussing with the World Bank on how to revise the plan including candidate sites for SEZ, a policy for operation, related legislations and organisations of SEZ.
Data Collection Survey on Nacala Corridor Integrated Development in Southern Africa Final Report
5-22
agricultural production by small scale farmers is increased and stabilised by the development
of irrigation infrastructure, it may be possible to promote development of market oriented
agriculture targeting the neighbouring countries while achieving the food security.
3) Functional Enhancement of Farmers Organizations and the Private Sector
As mentioned in 4.1.5 and 4.1.7, farmers’ organisations such as FUM and NASFAM, taking a
role of agricultural extension workers, have been working on improving agricultural
production though supporting agricultural inputs and providing technology assistance for
small-scale farmers. Furthermore, they serve as an intermediary between small-scale farmers
and distributors to optimise their commercial transactions, and also started exporting
agricultural products.
Besides, private commodity exchangers such as ACE and AHCX are trying to improve
farmers’ market access by establishing collection warehouses in local cities and by creating
market information dissemination and credits systems for small-scale farmers. If the activities
and functions of these organisations and operators are expanded and enriched in the future,
both agricultural production and its sales by small-scale farmers are expected to be
strengthened.
4) Mining Sector Development
According to the interview survey with the AfDB, major investment projects in Malawi’s
mining sector are: (i) Songwe Hill Rare Earth Project, owned by Mkango Resources Ltd.,
which is listed on Canada’s TSX Venture Exchange and the AIM Market of the London Stock
Exchange, and (ii) Kanyika Niobium Project in Mzimba and Chiziro Graphite Project in
northeast of Lilongwe, run by the Australian-listed, metals and rare earths company called
Globe Metals & Mining Ltd.
As regards (i) Songwe Hill Rare Earth Project, it features broad zones of outcropping rare
earth elements mineralisation on the northern slopes of a steep sided hill in Phalombe, which
is located about 2 km from the Mozambique border. Mkango completed a Pre-Feasibility
Study for the Project in September 2014, which was subsequently updated in November
201516. EIA has not been conducted yet. According to the interview survey with Mkango
Resources, a refining plant (sulphuric acid plant and flotation plant) will be constructed at the
project site, and inputs necessary for the production including sulphur will be imported
utilising the Nacala Railway. In regards to rare earth outputs produced from the plant, Mkango
Resources is considering transporting the products to Liwonde by truck and then loading them
on the Nacala Railway for exporting to Europe. Currently, the rare earth market is dominated
by China – 98% of supply comes from China. Although the expected share of this project
output is very small, it will create an alternative supply source other than China.
16 http://www.mkango.ca/s/songwe.asp
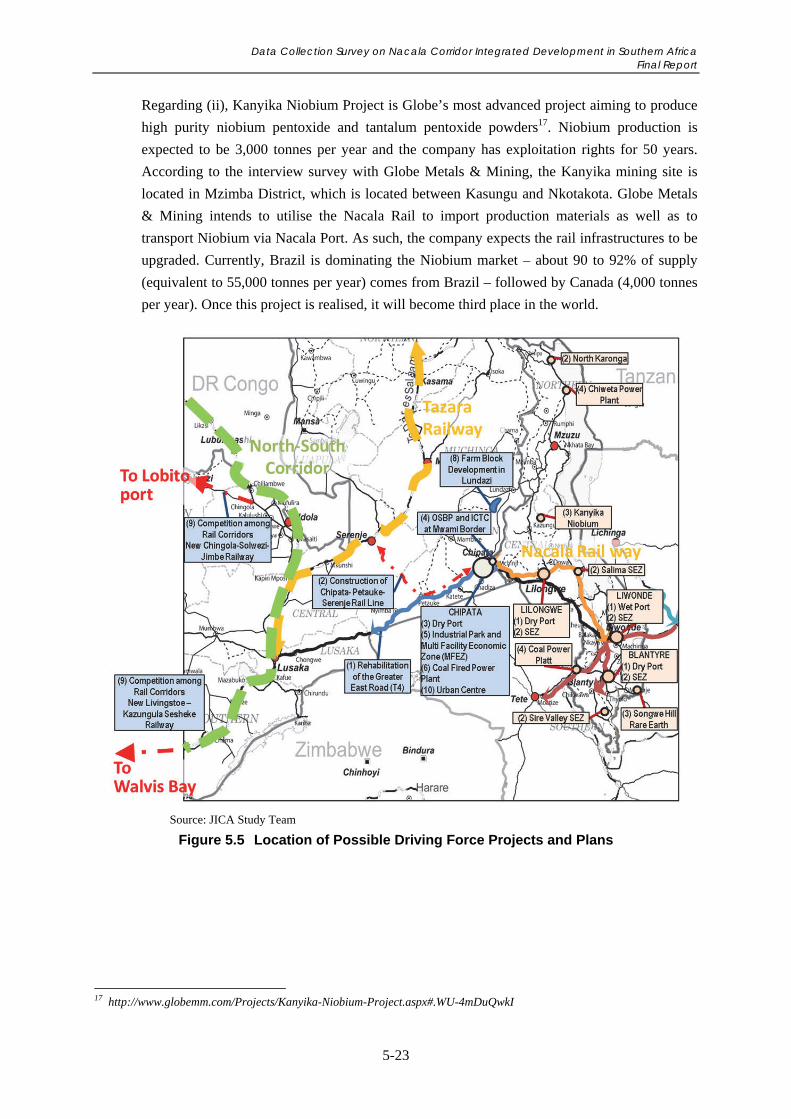
Data Collection Survey on Nacala Corridor Integrated Development in Southern Africa Final Report
5-23
Regarding (ii), Kanyika Niobium Project is Globe’s most advanced project aiming to produce
high purity niobium pentoxide and tantalum pentoxide powders17. Niobium production is
expected to be 3,000 tonnes per year and the company has exploitation rights for 50 years.
According to the interview survey with Globe Metals & Mining, the Kanyika mining site is
located in Mzimba District, which is located between Kasungu and Nkotakota. Globe Metals
& Mining intends to utilise the Nacala Rail to import production materials as well as to
transport Niobium via Nacala Port. As such, the company expects the rail infrastructures to be
upgraded. Currently, Brazil is dominating the Niobium market – about 90 to 92% of supply
(equivalent to 55,000 tonnes per year) comes from Brazil – followed by Canada (4,000 tonnes
per year). Once this project is realised, it will become third place in the world.
Source: JICA Study Team
Figure 5.5 Location of Possible Driving Force Projects and Plans
17 http://www.globemm.com/Projects/Kanyika-Niobium-Project.aspx#.WU-4mDuQwkI
Data Collection Survey on Nacala Corridor Integrated Development in Southern Africa Final Report
5-24
5.3 Overall Issues on Nacala Corridor Development
With the understandings of Nacala Corridor Development in the national plans and regional
integration policies as well as the current initiatives for development on the ground of the
Nacala Corridor Region discussed, a set of overall issues for promoting development in the
Nacala Corridor Region is identified and discussed in this section. In particular, the issues are
examined from three perspectives of development of corridor transport infrastructure,
promotion of economic sectors, and regional economic integration.
5.3.1 Issues on the Nacala Corridor Transport
(1) Incomplete Corridor Infrastructure Development
Nacala Corridor is considered as one of the most important corridors for Zambia and Malawi.
Landlocked countries such as Zambia and Malawi have to rely on international corridors for
their international and regional trade, and how to reduce transport costs for both export and
import is the key issue for economic development of the countries. The Nacala Corridor is
considered as a potential corridor to provide an alternative route of transport for Malawi and
Zambia, and to reduce the cost of transport for export and import by utilising the railway.
The development of transport infrastructure of the Nacala Corridor has been progressing in
these recent years by certain fundamental projects including the road construction projects
between the Luangwa Bridge and Mwami border funded by EU/EIB and AfDB, construction
and upgrading of the Nacala Railway between Moatize and Nacala Port via Malawi by Vale,
and the rehabilitation of Nacala Port.
In spite of the expectations from the stakeholders and the progress of the infrastructure
development, the actual use of the Nacala Corridor is not significantly increasing in both
countries, and the share of the corridor in freight transport is still low. In Malawi, the share of
freight transport of the Nacala Corridor for export and import is only around 10-20%, while
the Beira and Durban Corridors account for around 50-60% and 20-30% respectively. In
Zambia, the share of the Nacala Corridor in freight transport is only 5% in export and 2% in
import. It can be said that the Nacala Corridor is not fully utilised as expected at present.
This is because the Nacala Corridor’s transport infrastructure is still incomplete and has not
reached the level to function as an international corridor at present, although various
infrastructure projects have been implemented for Nacala Corridor Development in recent
years in the three countries. The railway between Chipata (Zambia) and Mchinji (Malawi) was
constructed in 2010 and started its operation in 2014. In addition, the railway for coal transport
from Moatize in Mozambique to Nacala Port via Malawi was constructed and upgraded by
Vale and commenced the operation in the beginning of 2016. However, the railway section
between Nkaya and Mchinji is still not in good condition and is frequently damaged by
flooding around Salima. Due to the condition, the railway in the section is not reliable for
freight transport and the speed of the trains is very slow (10-15 km/hour). The axle load of the
railway between Chipata (Zambia) and Limbe (Malawi) is 18 tonnes, except for the section
between Salima and Nkaya of which the axle load is 15 tonnes, while the axle load in the
Data Collection Survey on Nacala Corridor Integrated Development in Southern Africa Final Report
5-25
section from Nkaya to Nayuchi, which was constructed by Vale, is 20.5 tonnes. Currently, the
freight transport through the Nacala Rail Corridor is functioning only between Blantyre and
Nacala Port by the upgraded railway for the coal transport. The railway section between
Nkaya and Mchinji in Malawi is the bottleneck in completion of the functioning the Nacala
Rail Corridor. Recently, however, it was revealed that a rehabilitation plan is prepared for the
Nkaya-Mchinji section by Vale and Mitsui Corporation and is to be implemented once a
contractor is selected this year.
Similar to the railway, because the Nacala Road Corridor also has bottlenecks in completion
of the functioning road corridor, the traffic volume passing through the Nacala Corridor
between Malawi and Mozambique is limited. These bottlenecks include the steep uphill road
sections in mountainous areas in Malawi around the border with Mozambique, unpaved trunk
roads between Chiponde and Cuamba and also between Cuamba and Malema in Mozambique
and a lack of OSBP at the borders between Zambia and Malawi, and Malawi and Mozambique.
Meanwhile, the sections of Cuamba-Nampula (348 km) and Madimba-Cuamba (160 km) have
been improved under co-financing of JICA, AfDB and South Korea so that the road condition
will be upgraded shortly.
Lastly, Nacala Port was rehabilitated under the Japanese grant aid and a project to upgrade its
cargo handling capacity is currently underway by the Japanese ODA loan. Hence, after the
completion of the project three years later, the handling capacity of the Port will be expanded
to make the most of its potential.
(2) Improvement of Rail Freight Transport Services to Attract the Private Sector to
Utilise the Nacala Corridor
The Nacala Corridor’s advantage to other corridors is the existence of a reliable railway from
Moatize to Nacala Port, which will be maintained in good condition for the coal transport until
the closure of the coal projects. An expected advantage of using railways for freight transport
is the lower cost compared with the cost of truck transport. It is also the advantage that
railways can haul heavy and bulky freight as well as a large volume of freight at a time.
At present, none of corridors in Zambia and Malawi are successful in taking full advantage of
railways’ merit, although there are corridors which consist of both railway and road, namely
the Dar es Salaam Corridor and the North-South Corridor. The price of rail transport is about
the same or higher in some cases compared with truck transport. Customers do not prefer
railway in consideration of cost, time, availability and security. The share of railway in the
heavy bulky freight market in Zambia is only 9%. Under the concession agreement, the quota
of the cargo volume of 4 million tonnes per year is granted to CEAR; however, the current
volume reaches only about 500,000 tonnes, equivalent to 8% of the quota. On average, 47
wagons were carried by a train per one way, though CEAR is allowed to operate a rail
carrying up to 120 wagons per one way.
There are other factors beside the infrastructure to explain the underutilised Nacala Railway.
There are only a handful of ship lines calling at Nacala Port compared with other ports, and
not many logistics firms have opened branch offices in Nacala. Moreover, a dry port that
Data Collection Survey on Nacala Corridor Integrated Development in Southern Africa Final Report
5-26
offers an effective connection between the rail and road has not been developed yet, so that the
advantage of multimodal transport of the Nacala Corridor is unexploited. A lack of
locomotives and wagons owned by CEAR is another constraint to expand the operation. It is
also necessary to enhance the management, operation and maintenance capacity of CEAR for
improved handing capacity. The publicity of the Nacala Railway is also identified in
interviews with the stakeholders. Because the opening ceremony of the Nkaya-Moatize line
was only held in May 2017, one year after the commencement of the coal transport in 2016,
not many people have recognised the potential of the Nacala Corridor Railway for freight
transport.
The critical issue for the promotion of the Nacala Corridor is how to provide good rail freight
transport services in terms of time, security and availability and how to lower the transport
costs. Efforts should be made not only by improving the transport infrastructure, but also by
developing supporting facilities, improving the railway operation and making good
coordination among the railway operating companies in Zambia, Malawi and Mozambique.
5.3.2 Issues on Economic Sectors
(1) Basic Understanding on Impacts of Transport Corridor Development on
Economic Sectors
The basic understanding on the relationship between transport corridor development and
economic sector development is that there is no straightforward positive association between
them. Even if the railway and roads of the Nacala Corridor are developed or upgraded from
Nacala Port up to Malawi, a potential of economic sectors would not emerge instantly nor be
cultivated to export commodities via Nacala Port without any interventions. Likewise, in
Zambia, the road development of the Nacala Corridor does not lead to a sudden surge of
development potential of an industrial sector and automatic expansion of export oriented
production and trade. In other words, improvement of the railway or roads on the corridor
offers only a new opportunity for economic sectors through the reduction of transport costs or
improvement of market access. An action for change must be initiated to cultivate the
development potential of economic sectors, taking advantage of opportunities for trade or in
newly connected markets by the improvement of the transport corridor. Therefore, there
should be initiatives or interventions to promote the development of economic sectors, which
are described as follows.
(2) Reinforcement of Export Oriented Agriculture
A primary economic sector in the Nacala Corridor Region in Malawi and Zambia is
agriculture and the key issue is how to develop the agriculture sector and how to promote
agribusiness for the development of the Region while protecting the rights of small scale
farmers and rural communities.
As above mentioned, the use of the Nacala Corridor is still low in total freight transport;
however, the corridor started being used to no small extent for the transport of agricultural
inputs and materials, as well as agriculture products including processing ones. Therefore, the
Data Collection Survey on Nacala Corridor Integrated Development in Southern Africa Final Report
5-27
agriculture and agribusiness sectors first benefit from the development of the railways and
roads on the Nacala Corridor among others, by the reduction of transport cost added to the
price of commodities. Specifically, an opportunity for expansion of regional trade with
neighbouring countries is expected to emerge by newly established market access through the
corridor development.
In Zambia, a cluster composed of agricultural production and processing has been under
formulation. In particular, maize, soya beans, its edible oil and by-products are exported to
regional markets. As described in 3.1.7, various products can be produced in Zambia because
of the favourable agro-ecological condition, the demand of the products is high in the regional
markets, and thus the export of agriculture products is one of the important income sources of
foreign currency. The NAIP certainly mentioned that the export oriented agriculture is to be
promoted. However, the current detailed strategies, initiatives and regime (system) for export
oriented agriculture are less developed, hindering the promotion of export oriented agriculture
development. The strategies and implementation mechanism should be modified so as to be
based on the current situation that small scale farmers are dominant in the region, to consider a
balance between food security and product export, and to be implementable on the ground of
each of the potential crops.
In Malawi, the export of primary products such as tobacco and cotton is predominant for
international markets. The export oriented agriculture has been promoted based on the NES
formulated in 2012, which clarified the promotion strategy and the implementation mechanism
by cluster. According to the interview with MITC, however, the implementation has not been
progressed as expected, despite some attempts for export by cluster.
Among those which have not been performed well, there is a slump in the export of
groundnuts. The significant amount of groundnuts after tobacco had been exported until the
late 1990's; however, due to the aflatoxin problem, these are no longer exported to Europe and
the United States, which used to be large markets for groundnuts. For that reason, academic
scientific research and field studies on aflatoxin control are being conducted by many projects
and programmes, but comprehensive countermeasures at the production site have not been
implemented (see 4.1.6, 4.1.7).
(3) Development of Large Scale Agriculture and Agricultural Industries in the
Nacala Corridor Region
As mentioned above, the agriculture products in Zambia and Malawi are exported to the
regions and overseas counties. However, the transport cost is high and the competitiveness is
low in international markets due to their location as inland countries. Thus, to promote the
export of agricultural products with competitiveness enhancement from macro-aspect, it is
important to attract more investment from the private sector in the large scale agriculture and
agro-processing industry that can reduce the production cost by taking advantage of economy
of scale, while paying attention to the rights of small scale farmers and rural communities.
In Zambia, a policy or programmes toward export-oriented production should be introduced,
since until now large-scale farmers are often oriented to a domestic market, of which the scale
Data Collection Survey on Nacala Corridor Integrated Development in Southern Africa Final Report
5-28
is rather limited. At present, the government is promoting the development of large-scale
commercial farming as Farm Block Development Programme and has identified 100,000 ha as
Farm Block in each province.
Although the government tries to carry out the programme, Farm Block development has not
progressed as planned. As shown in Table 3.5, core investors have been determined for some
Farm Blocks, but the most Farm Block development is not going well due to the delay of
infrastructure development by the government. Moreover, the Farm Blocks had been set in
each province by the programme, apart from the blocks shown in Table 3.5, and there are
Farm Blocks that have not been developed such as Mwase-Mphangwe (Lundazi District) in
Eastern Province, Chongwe (Chongwe District) in Lusaka Province, Solwezi in
North-Western Province and Simango in Southern Province, etc. Furthermore, the
consideration for local small scale farmers should be taken into account in Farm Black
development. Therefore, it is necessary to examine the reasons of this stagnancy by
conducting detail studies on the current situation and to propose concrete measures to make
the Farm Blocks successful.
The GBI is conducted for promotion of large scale commercial farming and agricultural
processing as agribusiness development in Malawi. According to the GBI, business
development in three areas was planned, but only Malawi Mango and Salima Sugar in Salima
are currently operating (4.1.6 (2) -2) reference).
(4) Special Consideration to Small Scale Farmers
The majority of farmers in the Nacala Corridor Region as well as in the two countries in
general are small scale farmers. The important issues include how to link small scale farmers
to markets, access to which may be improved by Nacala Corridor Development, and how to
involve them in the regional development.
Also, the development requires continual awareness that small-scale farmers in the region
should not suffer a disadvantage due to the promotion of the large-scale commercial
agriculture or other development activities. Therefore, while promoting the large scale
commercial farming mentioned above, various measures should be taken for the small scale
farmers to improve agricultural production and market access (marketing). For instance,
introduction of Out-grower scheme, and Citizens Economic Empowerment Commission
(CEEC)’s cluster based loan programme for small scale investment are good examples of the
interventions for small scale farmers to link with markets. However, these measures should be
implemented with respect to the will of small scale farmers. Upon making such decisions, it is
necessary to take sufficient measures to ensuring fairness and transparency, for example by
providing information in appropriate methods with the serious consideration on the
environment of small scale farmers where access to information is limited. Thus, the effective,
existing interventions should be reviewed and evaluated before introducing new initiatives for
small scale farmers.
Data Collection Survey on Nacala Corridor Integrated Development in Southern Africa Final Report
5-29
5.3.3 Issues on the Relationship Between Corridor Transport and Economic Sectors
(1) Creation of Demand of Transport for the Sustainability of Nacala Corridor by
Making it Business Friendly
The most important issue to promote Nacala Corridor Development is the creation of enough
demand of transport to sustain the transport functions of the Nacala Corridor. At present,
agricultural products such as sugar, pigeon peas, tea, tobacco and macadamia nuts are
exported from Malawi through the Nacala Corridor to the Nacala Port, and soap noodles,
wheat, fertilizer, spare parts, bicycles, etc. are imported through the Nacala Corridor to
Malawi. For Zambia, international trade through the Nacala Corridor is very limited. 70% of
the freight for export and 78% of the freight for import at Mwami border with Malawi are for
the trade between Zambia and Malawi. Cotton, cement, clinker, maize and tobacco are
exported to Malawi. Because only about one year has passed since the commencement of the
operation of the Nacala Corridor Railway and Nacala Port, activities for the publicity and
advertisement of the Nacala Corridor have been rarely conducted to spur a demand for freight
transport. In fact, as a result of that, the current traffic volume accounts for more or less 10%
of the transport quota (two around trips per day and 120 wagons per one way) given to Malawi
under the concession. Moreover, Nacala Port and transit points lack necessary equipment,
handling facilities for transhipment, and warehouses. Only a handful of major logistics firms
opened their branch offices in the port, such as Bolloré.
To utilise the transport functions of the Nacala Corridor for regional development, it is
necessary to increase the demand of transport to the level that the infrastructure and transport
services are maintained in the long term, in addition to the coal transport from Moatize to
Nacala Port. It is not easy to increase the demand of transport in the short term in
consideration of the current conditions of infrastructure and economic activities along the
Nacala Corridor. Yet, a first step should be taken to develop support facilities and to install
necessary equipment in order to make the Nacala Corridor and Port more business friendly
and to induce the traffic demand from the economic sectors. Dry port development is one of
those projects that bring about the benefits of the multimodal transport of the Nacala Corridor
to the private sector. Meanwhile, it must be mentioned that the traffic demand to support the
Nacala Corridor is not necessarily international freight toward Nacala Port. As discussed,
intra-regional trade should be activated in the initial stage, not international trade. The Nacala
Corridor, the rail in particular, could be sustained, should intra-regional trade generate
sufficient traffic demands.
(2) Insufficient Use of the Nacala Corridor by Economic Sectors
In Malawi, the Nacala Corridor Railway started to be used from Blantyre, for export of
tobacco, sugar, tea, etc., using the bay-line connected to the factories or warehouses. Fuels and
fertiliser are already imported via the Nacala Corridor, though the traffic demand from the
economic sectors is not sufficiently large. The transport cost of the Nacala Railway is
relatively cheaper compared with truck transport, but a difference in the cost of the two modes
Data Collection Survey on Nacala Corridor Integrated Development in Southern Africa Final Report
5-30
of transport is not so significant as logistics firms and customers have started considering the
shifting from truck to rail transport. In Zambia, the use of the railway and road of the Nacala
Corridor is not very active due to the inefficiency, unreliable operation, and security reasons.
5.3.4 Issues on Regional Economic Integration
(1) Regional Coordination for Promotion of Nacala Corridor Development
Promotion of Nacala Corridor Development can be achieved by the stakeholders of all sectors
throughout the Nacala Corridor Region. To promote and sustain the Nacala Corridor in the
long term, it is essential to accommodate transport demand in wider areas of the Nacala
Corridor Region in Zambia, Malawi and Mozambique through the utilisation of the Nacala
Corridor. Necessary infrastructure development should be realised along the corridor, in order
to complete the transport corridor and improve the transport/logistics functions. Economic
development in the Nacala Corridor Region should be promoted by integrating the region and
making links between different industrial and commercial centres. At present, there is no
mechanism of regional coordination among Zambia, Malawi and Mozambique to promote
Nacala Corridor Development, and it is an urgent issue to be considered.
(2) The Nacala Corridor for Regional Economic Integration
The ratification process of the COMESA-EAC-SADC Tripartite Free Trade Area that was
brought into effect in June 2015 has been making slow progress in each of the member states.
In the past, the efforts for regional economic integration by SADC and COMESA in the
Southern African region were not successful18 so that the member states might be reluctant to
take actions for the regional integration, unlike the countries in the West African region, under
West African Economic and Monetary Union (UEMOA) or Economic Community of West
African States (ECOWAS), or in Eastern Africa as members of EAC.
The trade barriers to export, such as a ban on export of certain commodities are found on the
agricultural commodities with a potential to export via the Nacala Corridor. These trade
barriers including both tariff and non-tariff should be removed to encourage the export of
potential agricultural commodities. In Zambia, the 7NDP adopted a policy to promote
export-oriented agriculture. Thus, the agricultural policy of the two countries should be
redirected in line with the export strategies as well as the regional integration policy and trade
agreements. The export oriented agriculture proposed in the 7NDP should be developed by
offering incentives to the potential farmers for the expansion of commodity production for
export, by archiving balanced development that brings about benefits to small scale farmers
18 SADC delayed the target years to achieve the goal of complete trade liberalization and foundation of a custom union. As the issues in achieving the goals of SADC, Mapuva and Muyengwe-Mapuva (2014) pointed out “over ambitious targets set by the SADC as a roadmap to economic regional integration; multiple and concurrent memberships of different regional economic communities (RECs); the heterogeneous nature of the SADC economies which has provided an uneven economic environment; duplication emanating from the activities of the SACU and the SADC; the intricacies of rules of origin; different levels of economic development within SADC member states; as well as the failure of the SADC Tribunal to provide recourse to justice and act as a unifying platform for member states” (25-26). Mapuva, Jephias and Loveness Muyengwa-Mapuva. (2014). “The SADC Regional Bloc: What Challenges and Prospects for Regional Integration? Law, Democracy & Development 18 (2014): 22-36.
Data Collection Survey on Nacala Corridor Integrated Development in Southern Africa Final Report
5-31
dominant in this area, and at the same time by preventing negative impacts on vulnerable
farmers.
5.4 Impact Analysis
5.4.1 Perspectives on Nacala Corridor Development
In coming up with a development scenario, the following two perspectives were taken up for
both Zambia and Malawi: (i) approaching the Nacala Corridor from the entire country
perspective (i.e. from the macro perspective) and (ii) focusing on potentials of the Nacala
Corridor itself (i.e. from the micro perspective).
(1) Zambia
Zambia is already connected with neighbouring countries as well as sea ports through various
corridors which pass through the country. Each corridor has competitive relationships in terms
of transport/logistics, regional development, industrial promotion and so on. When viewing
from traffic volume/freight, the Nacala Corridor is the sixth corridor after the North-South,
Beira, Lobito, Dar es Salaam and Walvis Bay.
The benefits of Nacala Corridor Development for Zambia are: (i) it connects to a sea port with
the second shortest distance compared after the Beira Corridor, (ii) the Port of Nacala is the
deep sea port which enables to handle giant container vessels and (iii) it can secure an
alternative route from the country’s security-related point of view. On the other hand, the
following issues have been pointed out: (i) the rail system is inefficient and not reliable mainly
due to problems of ZRL on operation and maintenance and (ii) insufficient development of
infrastructures including dry port and container handling facilities. Because of these issues, the
Nacala Corridor has not been fully utilised – these bottlenecks need to be tackled with in order
to improve the utilisation of the Nacala Corridor.
Looking from a regional perspective, Eastern Province in Zambia, especially the provincial
capital Chipata, will benefit as the physical connection point through the road and rail network
to Malawi.
The following figures summarise the industry share to the total GDP at current prices, 2015
for each province along major corridors passing through Zambia.
Nacala Corridor: Eastern Province, Lusaka Province
North-South Corridor: Lusaka Province, Central Province, Southern Province
Dar es Salaam Corridor: Central Province, Muchinga Province, Northern Province
Lobito Corridor: Central Province, Copperbelt Province
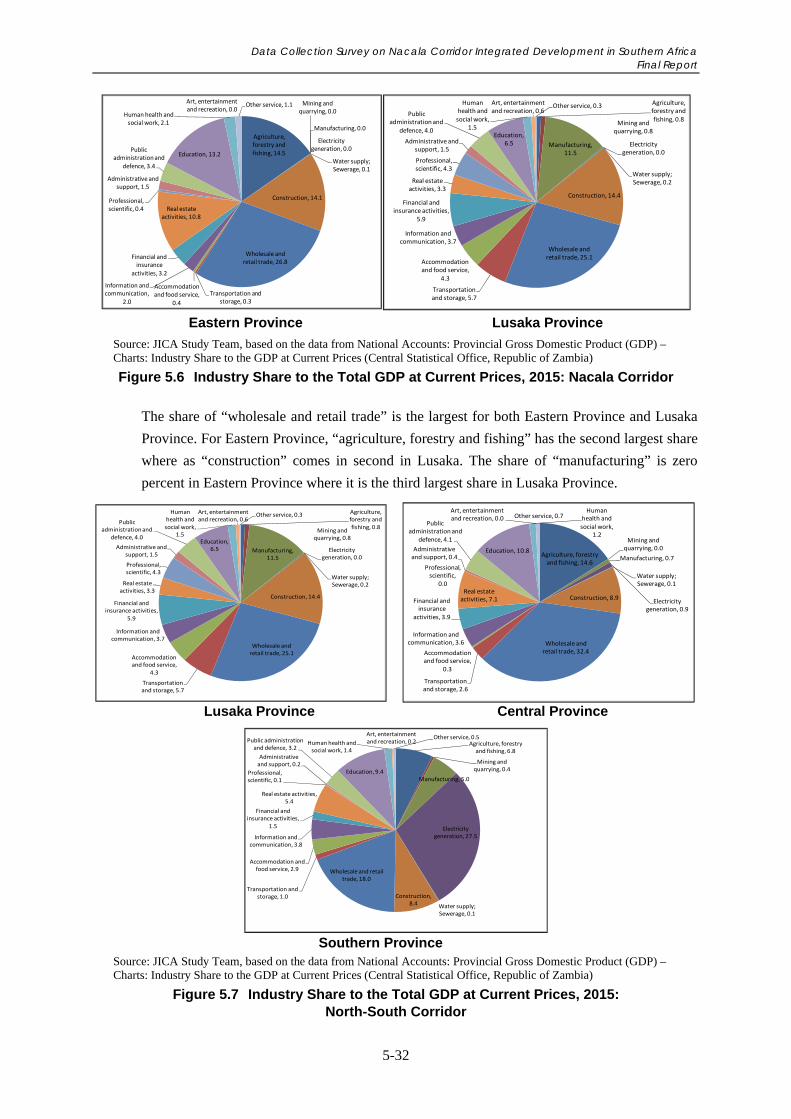
Data Collection Survey on Nacala Corridor Integrated Development in Southern Africa Final Report
5-32
Eastern Province Lusaka Province
Source: JICA Study Team, based on the data from National Accounts: Provincial Gross Domestic Product (GDP) –Charts: Industry Share to the GDP at Current Prices (Central Statistical Office, Republic of Zambia)
Figure 5.6 Industry Share to the Total GDP at Current Prices, 2015: Nacala Corridor
The share of “wholesale and retail trade” is the largest for both Eastern Province and Lusaka
Province. For Eastern Province, “agriculture, forestry and fishing” has the second largest share
where as “construction” comes in second in Lusaka. The share of “manufacturing” is zero
percent in Eastern Province where it is the third largest share in Lusaka Province.
Lusaka Province Central Province
Southern Province
Source: JICA Study Team, based on the data from National Accounts: Provincial Gross Domestic Product (GDP) –Charts: Industry Share to the GDP at Current Prices (Central Statistical Office, Republic of Zambia)
Figure 5.7 Industry Share to the Total GDP at Current Prices, 2015: North-South Corridor
Agriculture, forestry and fishing, 14.5
Mining and quarrying, 0.0
Manufacturing, 0.0
Electricity generation, 0.0
Water supply; Sewerage, 0.1
Construction, 14.1
Wholesale and retail trade, 26.8
Transportation and storage, 0.3
Accommodation and food service,
0.4
Information and communication,
2.0
Financial and insurance
activities, 3.2
Real estate activities, 10.8
Professional, scientific, 0.4
Administrative and support, 1.5
Public administration and
defence, 3.4
Education, 13.2
Human health and social work, 2.1
Art, entertainment and recreation, 0.0
Other service, 1.1 Agriculture, forestry and fishing, 0.8
Mining and quarrying, 0.8
Manufacturing, 11.5
Electricity generation, 0.0
Water supply; Sewerage, 0.2
Construction, 14.4
Wholesale and retail trade, 25.1
Transportation and storage, 5.7
Accommodation and food service,
4.3
Information and communication, 3.7
Financial and insurance activities,
5.9
Real estate activities, 3.3
Professional, scientific, 4.3
Administrative and support, 1.5
Public administration and
defence, 4.0Education,
6.5
Human health and social work,
1.5
Art, entertainment and recreation, 0.6
Other service, 0.3
Agriculture, forestry and fishing, 0.8
Mining and quarrying, 0.8
Manufacturing, 11.5
Electricity generation, 0.0
Water supply; Sewerage, 0.2
Construction, 14.4
Wholesale and retail trade, 25.1
Transportation and storage, 5.7
Accommodation and food service,
4.3
Information and communication, 3.7
Financial and insurance activities,
5.9
Real estate activities, 3.3
Professional, scientific, 4.3
Administrative and support, 1.5
Public administration and
defence, 4.0Education,
6.5
Human health and social work,
1.5
Art, entertainment and recreation, 0.6
Other service, 0.3
Agriculture, forestry and fishing, 14.6
Mining and quarrying, 0.0
Manufacturing, 0.7
Electricity generation, 0.9
Water supply; Sewerage, 0.1
Construction, 8.9
Wholesale and retail trade, 32.4
Transportation and storage, 2.6
Accommodation and food service,
0.3
Information and communication, 3.6
Financial and insurance
activities, 3.9
Real estate activities, 7.1
Professional, scientific,
0.0
Administrative and support, 0.4
Public administration and
defence, 4.1
Education, 10.8
Human health and social work,
1.2
Art, entertainment and recreation, 0.0 Other service, 0.7
Agriculture, forestry and fishing, 6.8
Mining and quarrying, 0.4
Manufacturing, 5.0
Electricity generation, 27.5
Water supply; Sewerage, 0.1
Construction, 8.4
Wholesale and retail trade, 18.0
Transportation and storage, 1.0
Accommodation and food service, 2.9
Information and communication, 3.8
Financial and insurance activities,
1.5
Real estate activities, 5.4
Professional, scientific, 0.1
Administrative and support, 0.2
Public administration and defence, 3.2
Education, 9.4
Human health and social work, 1.4
Art, entertainment and recreation, 0.2
Other service, 0.5
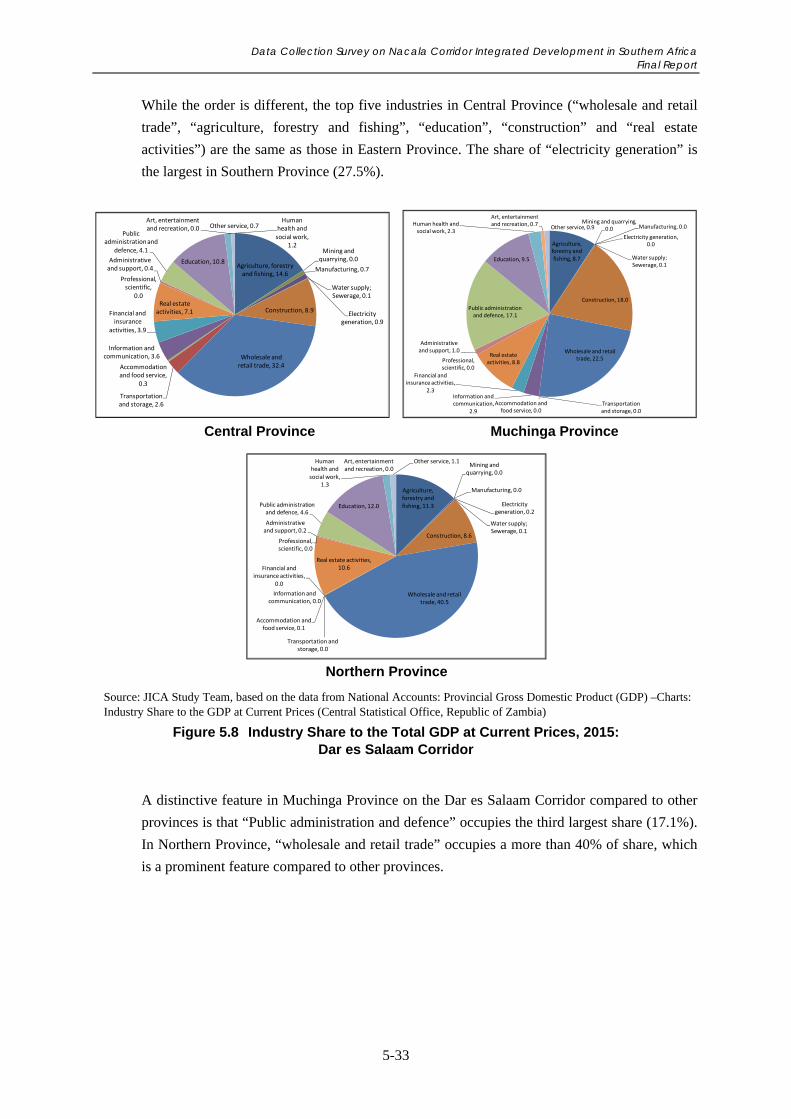
Data Collection Survey on Nacala Corridor Integrated Development in Southern Africa Final Report
5-33
While the order is different, the top five industries in Central Province (“wholesale and retail
trade”, “agriculture, forestry and fishing”, “education”, “construction” and “real estate
activities”) are the same as those in Eastern Province. The share of “electricity generation” is
the largest in Southern Province (27.5%).
Central Province Muchinga Province
Northern Province
Source: JICA Study Team, based on the data from National Accounts: Provincial Gross Domestic Product (GDP) –Charts: Industry Share to the GDP at Current Prices (Central Statistical Office, Republic of Zambia)
Figure 5.8 Industry Share to the Total GDP at Current Prices, 2015: Dar es Salaam Corridor
A distinctive feature in Muchinga Province on the Dar es Salaam Corridor compared to other
provinces is that “Public administration and defence” occupies the third largest share (17.1%).
In Northern Province, “wholesale and retail trade” occupies a more than 40% of share, which
is a prominent feature compared to other provinces.
Agriculture, forestry and fishing, 14.6
Mining and quarrying, 0.0
Manufacturing, 0.7
Electricity generation, 0.9
Water supply; Sewerage, 0.1
Construction, 8.9
Wholesale and retail trade, 32.4
Transportation and storage, 2.6
Accommodation and food service,
0.3
Information and communication, 3.6
Financial and insurance
activities, 3.9
Real estate activities, 7.1
Professional, scientific,
0.0
Administrative and support, 0.4
Public administration and
defence, 4.1
Education, 10.8
Human health and social work,
1.2
Art, entertainment and recreation, 0.0 Other service, 0.7
Agriculture, forestry and fishing, 8.7
Mining and quarrying, 0.0 Manufacturing, 0.0
Electricity generation, 0.0
Water supply; Sewerage, 0.1
Construction, 18.0
Wholesale and retail trade, 22.5
Transportation and storage, 0.0
Accommodation and food service, 0.0
Information and communication,
2.9
Financial and insurance activities,
2.3
Real estate activities, 8.8Professional,
scientific, 0.0
Administrative and support, 1.0
Public administration and defence, 17.1
Education, 9.5
Human health and social work, 2.3
Art, entertainment and recreation, 0.7
Other service, 0.9
Agriculture, forestry and fishing, 11.3
Mining and quarrying, 0.0
Manufacturing, 0.0
Electricity generation, 0.2
Water supply; Sewerage, 0.1
Construction, 8.6
Wholesale and retail trade, 40.5
Transportation and storage, 0.0
Accommodation and food service, 0.1
Information and communication, 0.0
Financial and insurance activities,
0.0
Real estate activities, 10.6
Professional, scientific, 0.0
Administrative and support, 0.2
Public administration and defence, 4.6
Education, 12.0
Human health and social work,
1.3
Art, entertainment and recreation, 0.0
Other service, 1.1
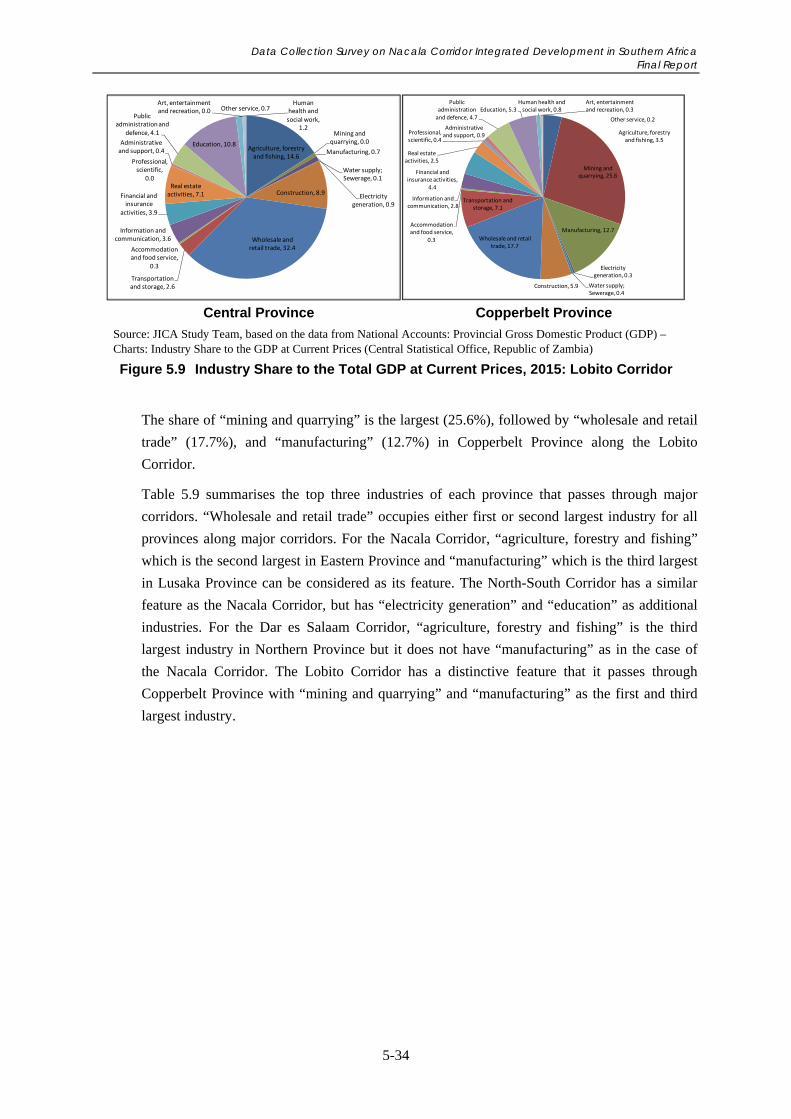
Data Collection Survey on Nacala Corridor Integrated Development in Southern Africa Final Report
5-34
Central Province Copperbelt Province
Source: JICA Study Team, based on the data from National Accounts: Provincial Gross Domestic Product (GDP) –Charts: Industry Share to the GDP at Current Prices (Central Statistical Office, Republic of Zambia)
Figure 5.9 Industry Share to the Total GDP at Current Prices, 2015: Lobito Corridor
The share of “mining and quarrying” is the largest (25.6%), followed by “wholesale and retail
trade” (17.7%), and “manufacturing” (12.7%) in Copperbelt Province along the Lobito
Corridor.
Table 5.9 summarises the top three industries of each province that passes through major
corridors. “Wholesale and retail trade” occupies either first or second largest industry for all
provinces along major corridors. For the Nacala Corridor, “agriculture, forestry and fishing”
which is the second largest in Eastern Province and “manufacturing” which is the third largest
in Lusaka Province can be considered as its feature. The North-South Corridor has a similar
feature as the Nacala Corridor, but has “electricity generation” and “education” as additional
industries. For the Dar es Salaam Corridor, “agriculture, forestry and fishing” is the third
largest industry in Northern Province but it does not have “manufacturing” as in the case of
the Nacala Corridor. The Lobito Corridor has a distinctive feature that it passes through
Copperbelt Province with “mining and quarrying” and “manufacturing” as the first and third
largest industry.
Agriculture, forestry and fishing, 14.6
Mining and quarrying, 0.0
Manufacturing, 0.7
Electricity generation, 0.9
Water supply; Sewerage, 0.1
Construction, 8.9
Wholesale and retail trade, 32.4
Transportation and storage, 2.6
Accommodation and food service,
0.3
Information and communication, 3.6
Financial and insurance
activities, 3.9
Real estate activities, 7.1
Professional, scientific,
0.0
Administrative and support, 0.4
Public administration and
defence, 4.1
Education, 10.8
Human health and social work,
1.2
Art, entertainment and recreation, 0.0 Other service, 0.7
Agriculture, forestry and fishing, 3.5
Mining and quarrying, 25.6
Manufacturing, 12.7
Electricity generation, 0.3
Water supply; Sewerage, 0.4
Construction, 5.9
Wholesale and retail trade, 17.7
Transportation and storage, 7.1
Accommodation and food service,
0.3
Information and communication, 2.8
Financial and insurance activities,
4.4
Real estate activities, 2.5
Professional, scientific, 0.4
Administrative and support, 0.9
Public administration and defence, 4.7
Education, 5.3Human health and social work, 0.8
Art, entertainment and recreation, 0.3
Other service, 0.2
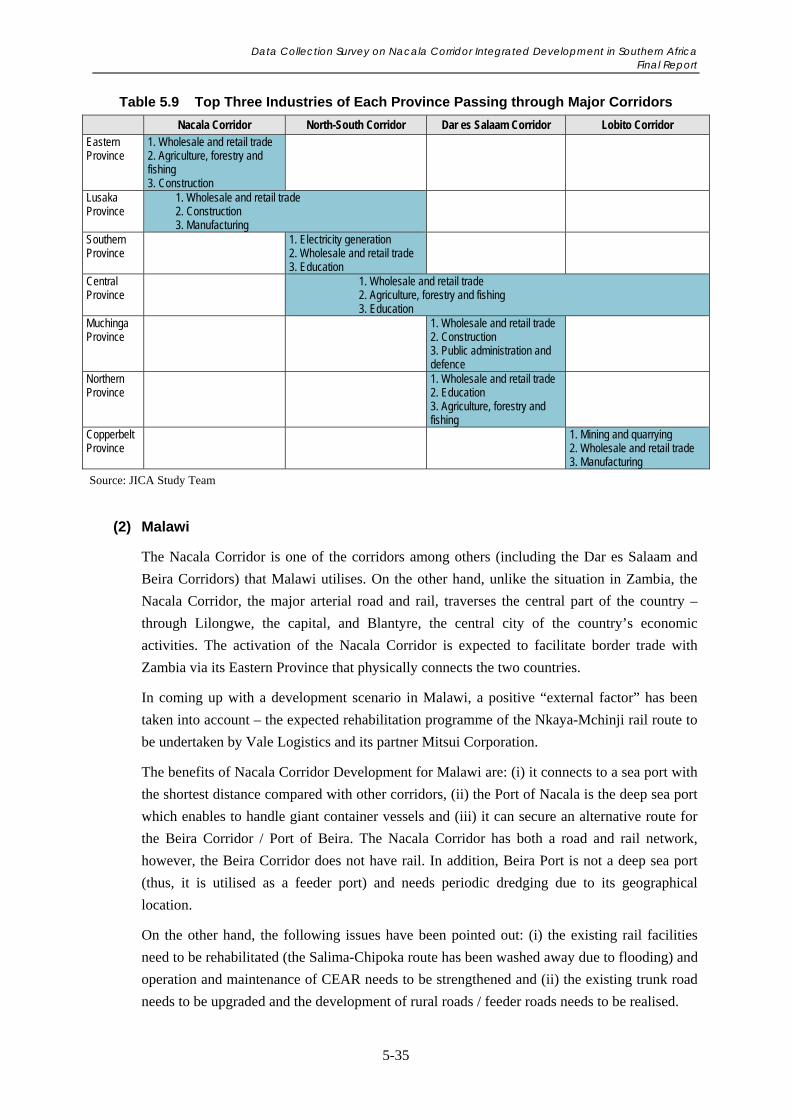
Data Collection Survey on Nacala Corridor Integrated Development in Southern Africa Final Report
5-35
Table 5.9 Top Three Industries of Each Province Passing through Major Corridors
Nacala Corridor North-South Corridor Dar es Salaam Corridor Lobito Corridor Eastern Province
1. Wholesale and retail trade 2. Agriculture, forestry and fishing 3. Construction
Lusaka Province
1. Wholesale and retail trade 2. Construction 3. Manufacturing
Southern Province
1. Electricity generation 2. Wholesale and retail trade 3. Education
Central Province
1. Wholesale and retail trade 2. Agriculture, forestry and fishing 3. Education
Muchinga Province
1. Wholesale and retail trade 2. Construction 3. Public administration and defence
Northern Province
1. Wholesale and retail trade 2. Education 3. Agriculture, forestry and fishing
Copperbelt Province
1. Mining and quarrying 2. Wholesale and retail trade 3. Manufacturing
Source: JICA Study Team
(2) Malawi
The Nacala Corridor is one of the corridors among others (including the Dar es Salaam and
Beira Corridors) that Malawi utilises. On the other hand, unlike the situation in Zambia, the
Nacala Corridor, the major arterial road and rail, traverses the central part of the country –
through Lilongwe, the capital, and Blantyre, the central city of the country’s economic
activities. The activation of the Nacala Corridor is expected to facilitate border trade with
Zambia via its Eastern Province that physically connects the two countries.
In coming up with a development scenario in Malawi, a positive “external factor” has been
taken into account – the expected rehabilitation programme of the Nkaya-Mchinji rail route to
be undertaken by Vale Logistics and its partner Mitsui Corporation.
The benefits of Nacala Corridor Development for Malawi are: (i) it connects to a sea port with
the shortest distance compared with other corridors, (ii) the Port of Nacala is the deep sea port
which enables to handle giant container vessels and (iii) it can secure an alternative route for
the Beira Corridor / Port of Beira. The Nacala Corridor has both a road and rail network,
however, the Beira Corridor does not have rail. In addition, Beira Port is not a deep sea port
(thus, it is utilised as a feeder port) and needs periodic dredging due to its geographical
location.
On the other hand, the following issues have been pointed out: (i) the existing rail facilities
need to be rehabilitated (the Salima-Chipoka route has been washed away due to flooding) and
operation and maintenance of CEAR needs to be strengthened and (ii) the existing trunk road
needs to be upgraded and the development of rural roads / feeder roads needs to be realised.
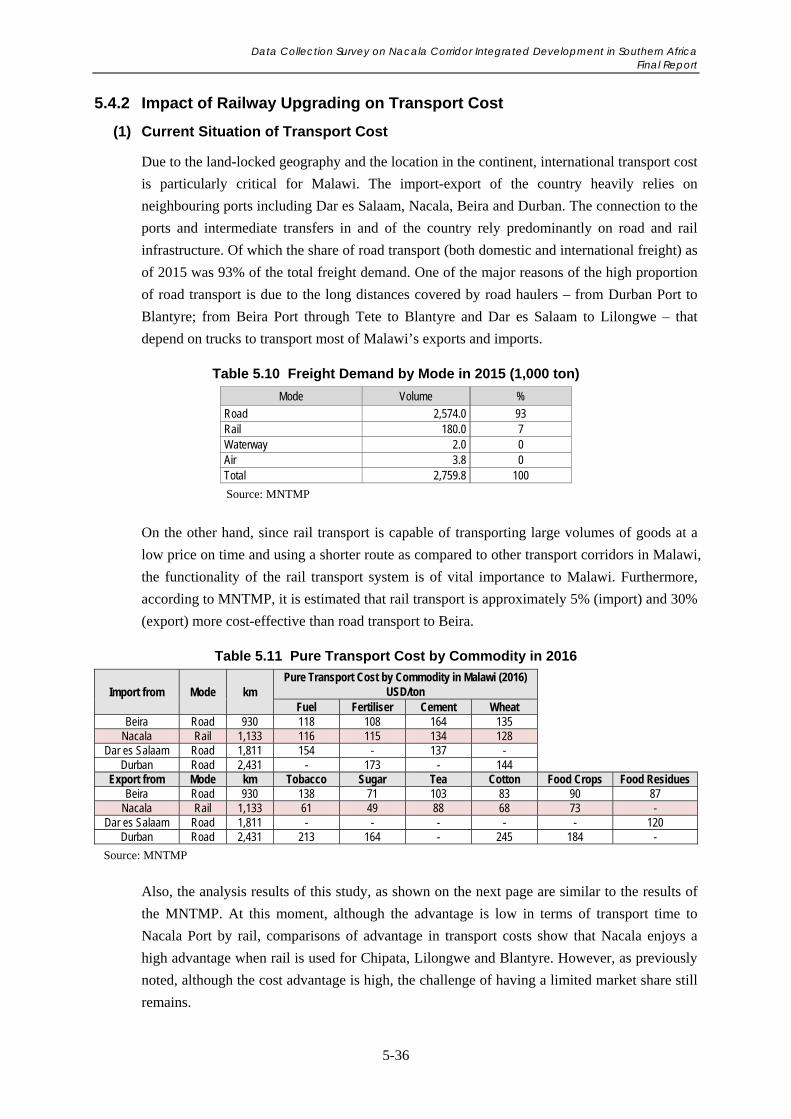
Data Collection Survey on Nacala Corridor Integrated Development in Southern Africa Final Report
5-36
5.4.2 Impact of Railway Upgrading on Transport Cost
(1) Current Situation of Transport Cost
Due to the land-locked geography and the location in the continent, international transport cost
is particularly critical for Malawi. The import-export of the country heavily relies on
neighbouring ports including Dar es Salaam, Nacala, Beira and Durban. The connection to the
ports and intermediate transfers in and of the country rely predominantly on road and rail
infrastructure. Of which the share of road transport (both domestic and international freight) as
of 2015 was 93% of the total freight demand. One of the major reasons of the high proportion
of road transport is due to the long distances covered by road haulers – from Durban Port to
Blantyre; from Beira Port through Tete to Blantyre and Dar es Salaam to Lilongwe – that
depend on trucks to transport most of Malawi’s exports and imports.
Table 5.10 Freight Demand by Mode in 2015 (1,000 ton)
Mode Volume %
Road 2,574.0 93 Rail 180.0 7 Waterway 2.0 0 Air 3.8 0 Total 2,759.8 100
Source: MNTMP
On the other hand, since rail transport is capable of transporting large volumes of goods at a
low price on time and using a shorter route as compared to other transport corridors in Malawi,
the functionality of the rail transport system is of vital importance to Malawi. Furthermore,
according to MNTMP, it is estimated that rail transport is approximately 5% (import) and 30%
(export) more cost-effective than road transport to Beira.
Table 5.11 Pure Transport Cost by Commodity in 2016
Import from Mode km Pure Transport Cost by Commodity in Malawi (2016)
USD/ton
Fuel Fertiliser Cement Wheat Beira Road 930 118 108 164 135
Nacala Rail 1,133 116 115 134 128 Dar es Salaam Road 1,811 154 - 137 -
Durban Road 2,431 - 173 - 144 Export from Mode km Tobacco Sugar Tea Cotton Food Crops Food Residues
Beira Road 930 138 71 103 83 90 87 Nacala Rail 1,133 61 49 88 68 73 -
Dar es Salaam Road 1,811 - - - - - 120 Durban Road 2,431 213 164 - 245 184 -
Source: MNTMP
Also, the analysis results of this study, as shown on the next page are similar to the results of
the MNTMP. At this moment, although the advantage is low in terms of transport time to
Nacala Port by rail, comparisons of advantage in transport costs show that Nacala enjoys a
high advantage when rail is used for Chipata, Lilongwe and Blantyre. However, as previously
noted, although the cost advantage is high, the challenge of having a limited market share still
remains.
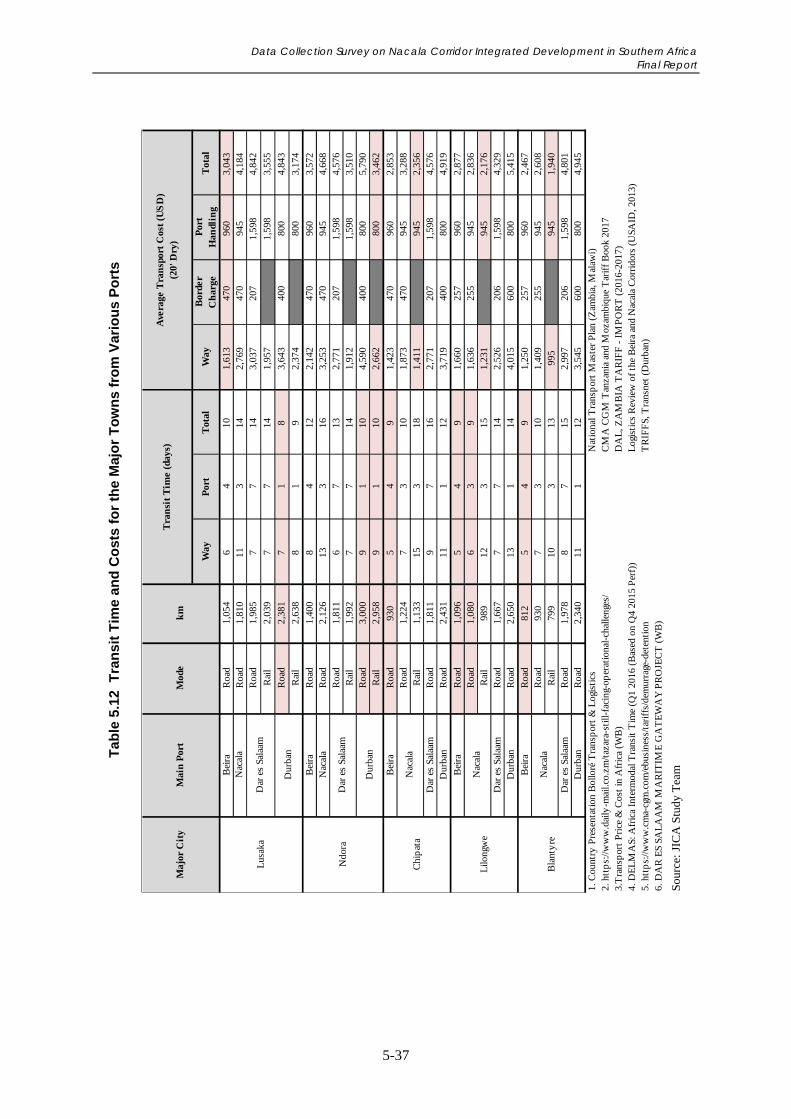
Data Collection Survey on Nacala Corridor Integrated Development in Southern Africa Final Report
5-37
Way
Por
tT
otal
Way
Bor
der
Ch
arge
Por
tH
andl
ing
Tot
al
Bei
raR
oad
1,05
46
410
1,61
347
096
03,
043
Roa
d1,
810
113
142,
769
470
945
4,18
4R
oad
1,98
57
714
3,03
720
71,
598
4,84
2
Rai
l2,
039
77
141,
957
1,59
83,
555
Roa
d2,
381
71
83,
643
400
800
4,84
3
Rai
l2,
638
81
92,
374
800
3,17
4
Bei
raR
oad
1,40
08
412
2,14
247
096
03,
572
Nac
ala
Roa
d2,
126
133
163,
253
470
945
4,66
8R
oad
1,81
16
713
2,77
120
71,
598
4,57
6R
ail
1,99
27
714
1,91
21,
598
3,51
0R
oad
3,00
09
110
4,59
040
080
05,
790
Rai
l2,
958
91
102,
662
800
3,46
2
Bei
raR
oad
930
54
91,
423
470
960
2,85
3R
oad
1,22
47
310
1,87
347
094
53,
288
Rai
l1,
133
153
181,
411
945
2,35
6D
ar e
s Sa
laam
Roa
d1,
811
97
162,
771
207
1,59
84,
576
Dur
ban
Roa
d2,
431
111
123,
719
400
800
4,91
9
Bei
raR
oad
1,09
65
49
1,66
025
796
02,
877
Roa
d1,
080
63
91,
636
255
945
2,83
6R
ail
989
123
151,
231
945
2,17
6D
ar e
s Sa
laam
Roa
d1,
667
77
142,
526
206
1,59
84,
329
Dur
ban
Roa
d2,
650
131
144,
015
600
800
5,41
5
Bei
raR
oad
812
54
91,
250
257
960
2,46
7R
oad
930
73
101,
409
255
945
2,60
8R
ail
799
103
1399
594
51,
940
Dar
es
Sala
amR
oad
1,97
88
715
2,99
720
61,
598
4,80
1D
urba
nR
oad
2,34
011
112
3,54
560
080
04,
945
1.
Cou
ntry
Pre
sent
atio
n B
ollo
ré T
rans
por
t &
Log
isti
csN
atio
nal T
rans
por
t M
aste
r P
lan
(Zam
bia,
Mal
awi)
2. h
ttp
s://w
ww
.dai
ly-m
ail.c
o.zm
/taz
ara-
still
-fac
ing-
oper
atio
nal-
chal
leng
es/
CM
A C
GM
Tan
zani
a an
d M
ozam
biqu
e T
arif
f B
ook
2017
3.T
rans
por
t P
rice
& C
ost
in A
fric
a (W
B)
DA
L, Z
AM
BIA
TA
RIF
F -
IM
PO
RT
(20
16-2
017)
4. D
EL
MA
S: A
fric
a In
term
odal
Tra
nsit
Tim
e (Q
1 20
16 (
Bas
ed o
n Q
4 20
15 P
erf)
)L
ogis
tics
Rev
iew
of
the
Bei
ra a
nd N
acal
a C
orri
dors
(U
SAID
, 201
3)5.
htt
ps:
//ww
w.c
ma-
cgm
.com
/ebu
sine
ss/t
arif
fs/d
emur
rage
-det
enti
onT
RIF
FS,
Tra
nsne
t (D
urba
n)6.
DA
R E
S SA
LA
AM
MA
RIT
IME
GA
TE
WA
Y P
RO
JEC
T (
WB
)
Bla
nty
reN
acal
a
Ndo
raD
ar e
s Sa
laam
Dur
ban
Chi
pat
aN
acal
a
Lilo
ngw
eN
acal
a
Tra
nsi
t T
ime
(day
s)A
vera
ge T
ran
spor
t C
ost
(US
D)
(20'
Dry
)
Lus
aka
Nac
ala
Dar
es
Sala
am
Dur
ban
Maj
or C
ity
Mai
n P
ort
Mod
ek
m
Sou
rce:
JIC
A S
tudy
Tea
m
Tab
le 5
.12
Tra
nsi
t T
ime
and
Co
sts
fo
r th
e M
ajo
r T
ow
ns
fro
m V
ario
us
Po
rts
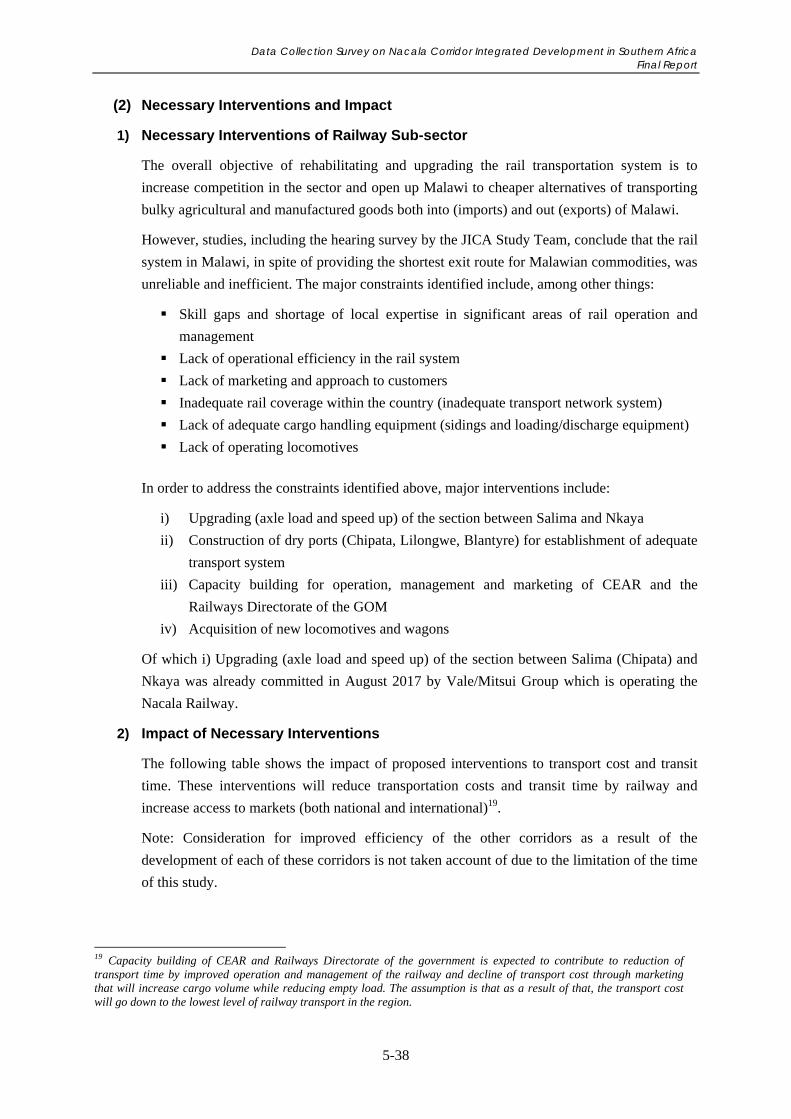
Data Collection Survey on Nacala Corridor Integrated Development in Southern Africa Final Report
5-38
(2) Necessary Interventions and Impact
1) Necessary Interventions of Railway Sub-sector
The overall objective of rehabilitating and upgrading the rail transportation system is to
increase competition in the sector and open up Malawi to cheaper alternatives of transporting
bulky agricultural and manufactured goods both into (imports) and out (exports) of Malawi.
However, studies, including the hearing survey by the JICA Study Team, conclude that the rail
system in Malawi, in spite of providing the shortest exit route for Malawian commodities, was
unreliable and inefficient. The major constraints identified include, among other things:
Skill gaps and shortage of local expertise in significant areas of rail operation and
management
Lack of operational efficiency in the rail system
Lack of marketing and approach to customers
Inadequate rail coverage within the country (inadequate transport network system)
Lack of adequate cargo handling equipment (sidings and loading/discharge equipment)
Lack of operating locomotives
In order to address the constraints identified above, major interventions include:
i) Upgrading (axle load and speed up) of the section between Salima and Nkaya
ii) Construction of dry ports (Chipata, Lilongwe, Blantyre) for establishment of adequate
transport system
iii) Capacity building for operation, management and marketing of CEAR and the
Railways Directorate of the GOM
iv) Acquisition of new locomotives and wagons
Of which i) Upgrading (axle load and speed up) of the section between Salima (Chipata) and
Nkaya was already committed in August 2017 by Vale/Mitsui Group which is operating the
Nacala Railway.
2) Impact of Necessary Interventions
The following table shows the impact of proposed interventions to transport cost and transit
time. These interventions will reduce transportation costs and transit time by railway and
increase access to markets (both national and international)19.
Note: Consideration for improved efficiency of the other corridors as a result of the
development of each of these corridors is not taken account of due to the limitation of the time
of this study.
19 Capacity building of CEAR and Railways Directorate of the government is expected to contribute to reduction of transport time by improved operation and management of the railway and decline of transport cost through marketing that will increase cargo volume while reducing empty load. The assumption is that as a result of that, the transport cost will go down to the lowest level of railway transport in the region.
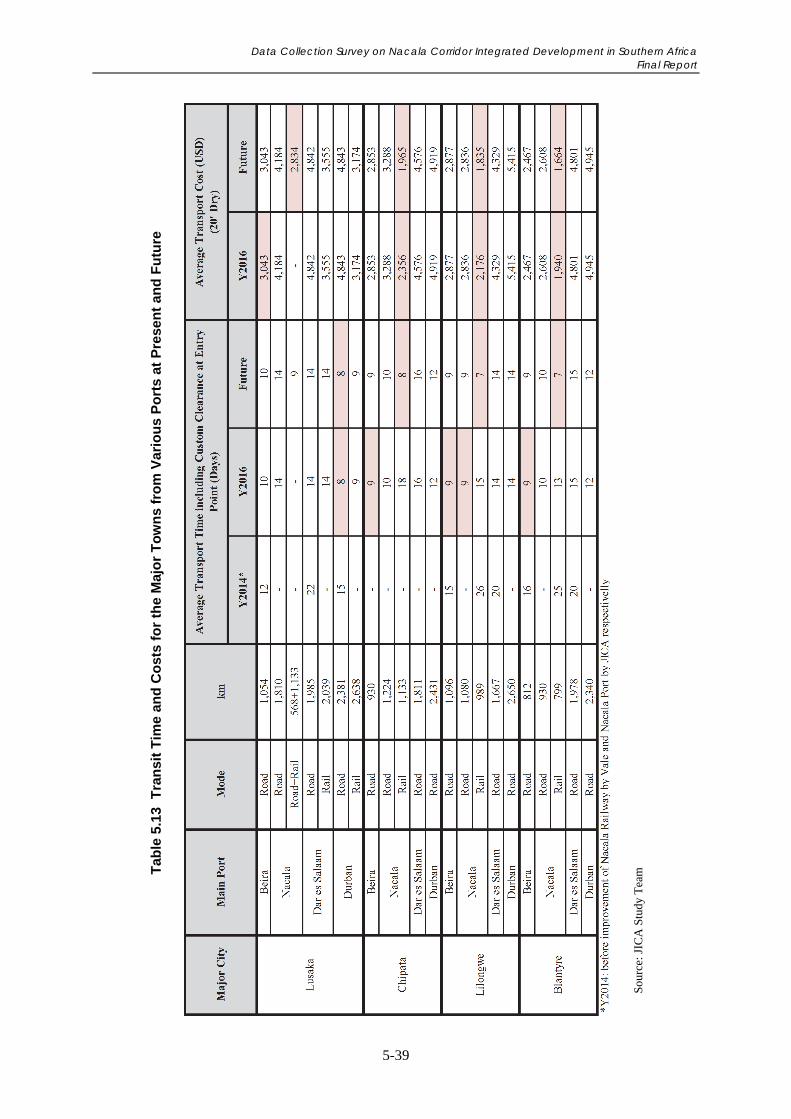
Data Collection Survey on Nacala Corridor Integrated Development in Southern Africa Final Report
5-39
Sou
rce:
JIC
A S
tudy
Tea
m Tab
le 5
.13
Tra
nsi
t T
ime
and
Co
sts
fo
r th
e M
ajo
r T
ow
ns
fro
m V
ario
us
Po
rts
at P
rese
nt
and
Fu
ture
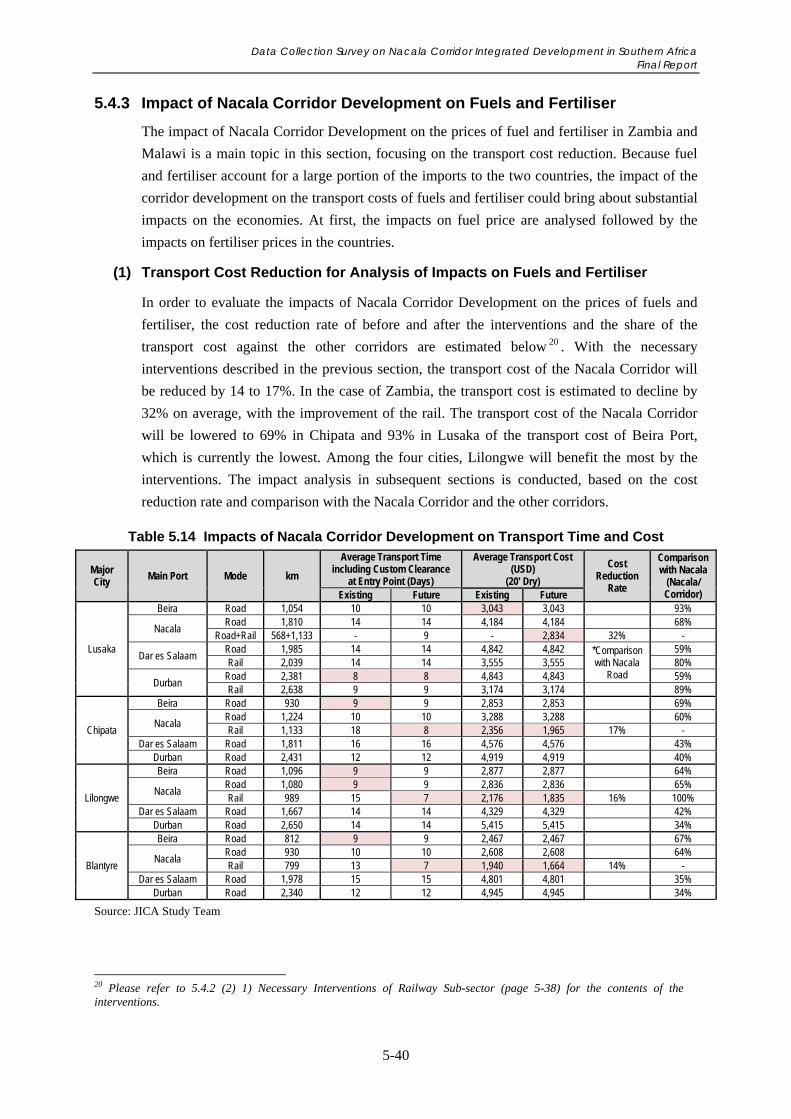
Data Collection Survey on Nacala Corridor Integrated Development in Southern Africa Final Report
5-40
5.4.3 Impact of Nacala Corridor Development on Fuels and Fertiliser
The impact of Nacala Corridor Development on the prices of fuel and fertiliser in Zambia and
Malawi is a main topic in this section, focusing on the transport cost reduction. Because fuel
and fertiliser account for a large portion of the imports to the two countries, the impact of the
corridor development on the transport costs of fuels and fertiliser could bring about substantial
impacts on the economies. At first, the impacts on fuel price are analysed followed by the
impacts on fertiliser prices in the countries.
(1) Transport Cost Reduction for Analysis of Impacts on Fuels and Fertiliser
In order to evaluate the impacts of Nacala Corridor Development on the prices of fuels and
fertiliser, the cost reduction rate of before and after the interventions and the share of the
transport cost against the other corridors are estimated below 20 . With the necessary
interventions described in the previous section, the transport cost of the Nacala Corridor will
be reduced by 14 to 17%. In the case of Zambia, the transport cost is estimated to decline by
32% on average, with the improvement of the rail. The transport cost of the Nacala Corridor
will be lowered to 69% in Chipata and 93% in Lusaka of the transport cost of Beira Port,
which is currently the lowest. Among the four cities, Lilongwe will benefit the most by the
interventions. The impact analysis in subsequent sections is conducted, based on the cost
reduction rate and comparison with the Nacala Corridor and the other corridors.
Table 5.14 Impacts of Nacala Corridor Development on Transport Time and Cost
Major City Main Port Mode km
Average Transport Time including Custom Clearance
at Entry Point (Days)
Average Transport Cost (USD)
(20' Dry)
Cost Reduction
Rate
Comparison with Nacala
(Nacala/ Corridor) Existing Future Existing Future
Lusaka
Beira Road 1,054 10 10 3,043 3,043 93%
Nacala Road 1,810 14 14 4,184 4,184 68%
Road+Rail 568+1,133 - 9 - 2,834 32% -
Dar es Salaam Road 1,985 14 14 4,842 4,842 *Comparison
with Nacala Road
59% Rail 2,039 14 14 3,555 3,555 80%
Durban Road 2,381 8 8 4,843 4,843 59% Rail 2,638 9 9 3,174 3,174 89%
Chipata
Beira Road 930 9 9 2,853 2,853 69%
Nacala Road 1,224 10 10 3,288 3,288 60% Rail 1,133 18 8 2,356 1,965 17% -
Dar es Salaam Road 1,811 16 16 4,576 4,576 43% Durban Road 2,431 12 12 4,919 4,919 40%
Lilongwe
Beira Road 1,096 9 9 2,877 2,877 64%
Nacala Road 1,080 9 9 2,836 2,836 65% Rail 989 15 7 2,176 1,835 16% 100%
Dar es Salaam Road 1,667 14 14 4,329 4,329 42% Durban Road 2,650 14 14 5,415 5,415 34%
Blantyre
Beira Road 812 9 9 2,467 2,467 67%
Nacala Road 930 10 10 2,608 2,608 64% Rail 799 13 7 1,940 1,664 14% -
Dar es Salaam Road 1,978 15 15 4,801 4,801 35% Durban Road 2,340 12 12 4,945 4,945 34%
Source: JICA Study Team
20 Please refer to 5.4.2 (2) 1) Necessary Interventions of Railway Sub-sector (page 5-38) for the contents of the interventions.
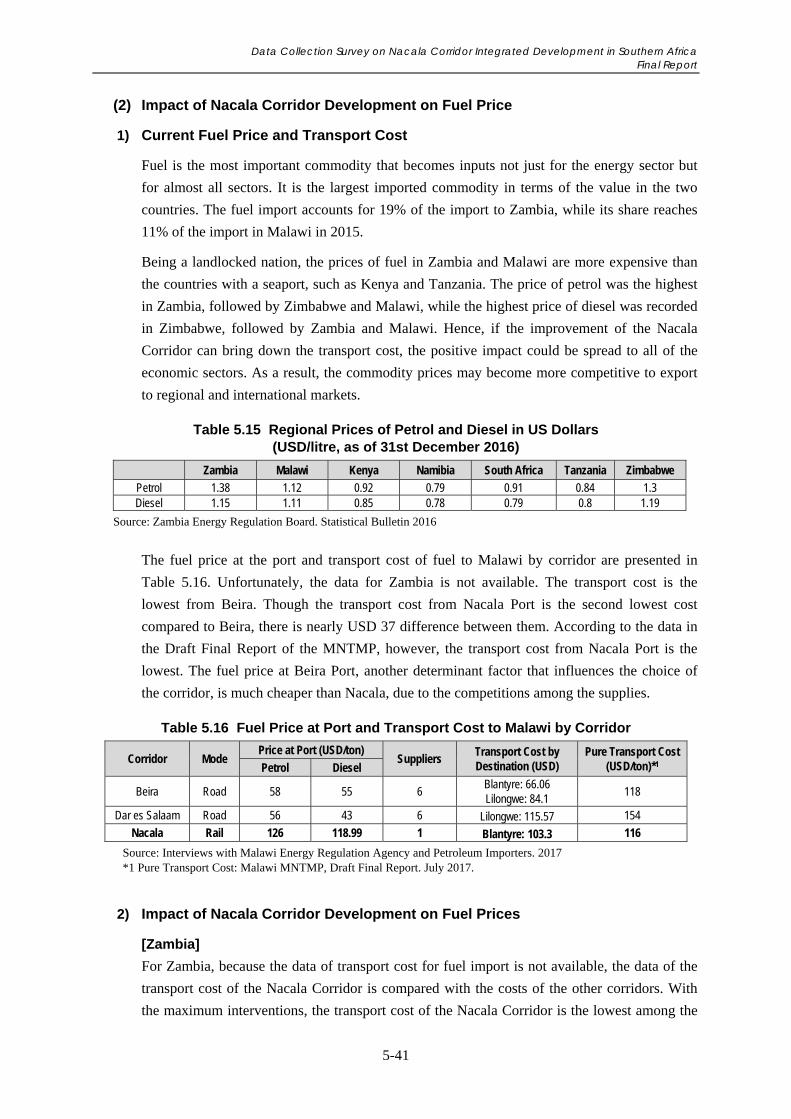
Data Collection Survey on Nacala Corridor Integrated Development in Southern Africa Final Report
5-41
(2) Impact of Nacala Corridor Development on Fuel Price
1) Current Fuel Price and Transport Cost
Fuel is the most important commodity that becomes inputs not just for the energy sector but
for almost all sectors. It is the largest imported commodity in terms of the value in the two
countries. The fuel import accounts for 19% of the import to Zambia, while its share reaches
11% of the import in Malawi in 2015.
Being a landlocked nation, the prices of fuel in Zambia and Malawi are more expensive than
the countries with a seaport, such as Kenya and Tanzania. The price of petrol was the highest
in Zambia, followed by Zimbabwe and Malawi, while the highest price of diesel was recorded
in Zimbabwe, followed by Zambia and Malawi. Hence, if the improvement of the Nacala
Corridor can bring down the transport cost, the positive impact could be spread to all of the
economic sectors. As a result, the commodity prices may become more competitive to export
to regional and international markets.
Table 5.15 Regional Prices of Petrol and Diesel in US Dollars (USD/litre, as of 31st December 2016)
Zambia Malawi Kenya Namibia South Africa Tanzania Zimbabwe
Petrol 1.38 1.12 0.92 0.79 0.91 0.84 1.3 Diesel 1.15 1.11 0.85 0.78 0.79 0.8 1.19
Source: Zambia Energy Regulation Board. Statistical Bulletin 2016
The fuel price at the port and transport cost of fuel to Malawi by corridor are presented in
Table 5.16. Unfortunately, the data for Zambia is not available. The transport cost is the
lowest from Beira. Though the transport cost from Nacala Port is the second lowest cost
compared to Beira, there is nearly USD 37 difference between them. According to the data in
the Draft Final Report of the MNTMP, however, the transport cost from Nacala Port is the
lowest. The fuel price at Beira Port, another determinant factor that influences the choice of
the corridor, is much cheaper than Nacala, due to the competitions among the supplies.
Table 5.16 Fuel Price at Port and Transport Cost to Malawi by Corridor
Corridor Mode Price at Port (USD/ton)
Suppliers Transport Cost by Destination (USD)
Pure Transport Cost (USD/ton)*1 Petrol Diesel
Beira Road 58 55 6 Blantyre: 66.06 Lilongwe: 84.1
118
Dar es Salaam Road 56 43 6 Lilongwe: 115.57 154
Nacala Rail 126 118.99 1 Blantyre: 103.3 116
Source: Interviews with Malawi Energy Regulation Agency and Petroleum Importers. 2017 *1 Pure Transport Cost: Malawi MNTMP, Draft Final Report. July 2017.
2) Impact of Nacala Corridor Development on Fuel Prices
[Zambia]
For Zambia, because the data of transport cost for fuel import is not available, the data of the
transport cost of the Nacala Corridor is compared with the costs of the other corridors. With
the maximum interventions, the transport cost of the Nacala Corridor is the lowest among the
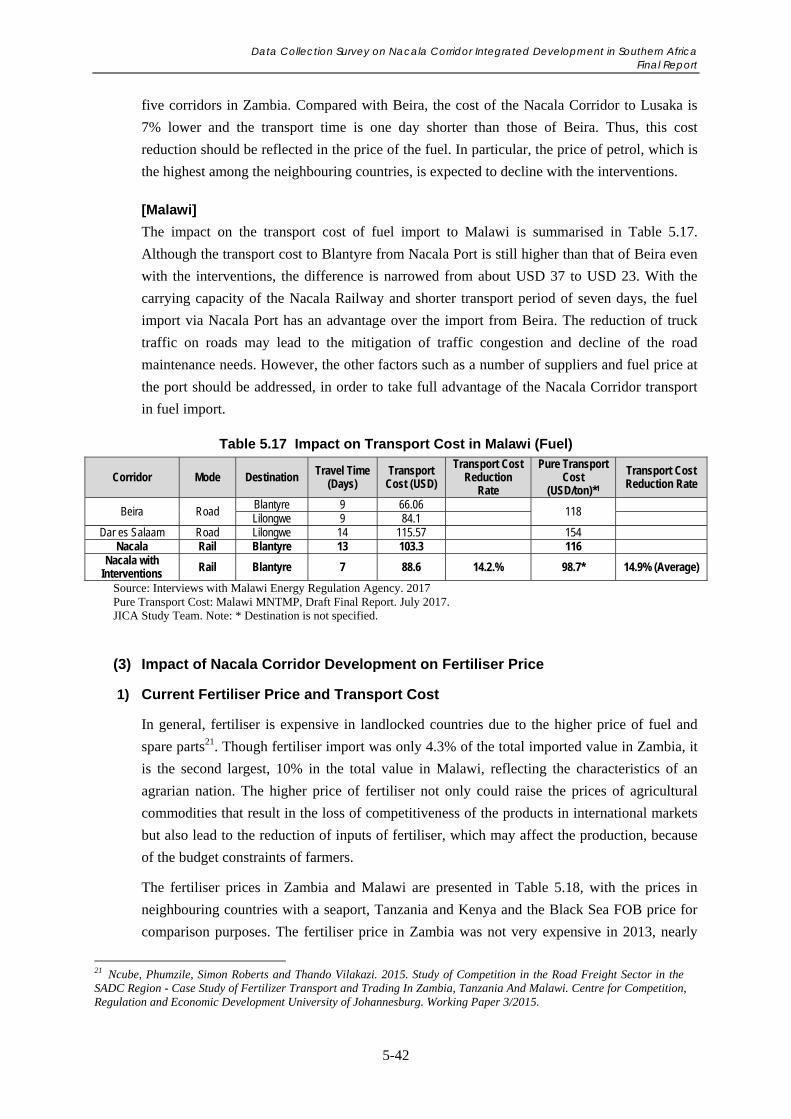
Data Collection Survey on Nacala Corridor Integrated Development in Southern Africa Final Report
5-42
five corridors in Zambia. Compared with Beira, the cost of the Nacala Corridor to Lusaka is
7% lower and the transport time is one day shorter than those of Beira. Thus, this cost
reduction should be reflected in the price of the fuel. In particular, the price of petrol, which is
the highest among the neighbouring countries, is expected to decline with the interventions.
[Malawi]
The impact on the transport cost of fuel import to Malawi is summarised in Table 5.17.
Although the transport cost to Blantyre from Nacala Port is still higher than that of Beira even
with the interventions, the difference is narrowed from about USD 37 to USD 23. With the
carrying capacity of the Nacala Railway and shorter transport period of seven days, the fuel
import via Nacala Port has an advantage over the import from Beira. The reduction of truck
traffic on roads may lead to the mitigation of traffic congestion and decline of the road
maintenance needs. However, the other factors such as a number of suppliers and fuel price at
the port should be addressed, in order to take full advantage of the Nacala Corridor transport
in fuel import.
Table 5.17 Impact on Transport Cost in Malawi (Fuel)
Corridor Mode Destination Travel Time (Days)
Transport Cost (USD)
Transport Cost Reduction
Rate
Pure Transport Cost
(USD/ton)*1
Transport Cost Reduction Rate
Beira Road Blantyre 9 66.06
118
Lilongwe 9 84.1 Dar es Salaam Road Lilongwe 14 115.57 154
Nacala Rail Blantyre 13 103.3 116 Nacala with
Interventions Rail Blantyre 7 88.6 14.2.% 98.7* 14.9% (Average)
Source: Interviews with Malawi Energy Regulation Agency. 2017 Pure Transport Cost: Malawi MNTMP, Draft Final Report. July 2017. JICA Study Team. Note: * Destination is not specified.
(3) Impact of Nacala Corridor Development on Fertiliser Price
1) Current Fertiliser Price and Transport Cost
In general, fertiliser is expensive in landlocked countries due to the higher price of fuel and
spare parts21. Though fertiliser import was only 4.3% of the total imported value in Zambia, it
is the second largest, 10% in the total value in Malawi, reflecting the characteristics of an
agrarian nation. The higher price of fertiliser not only could raise the prices of agricultural
commodities that result in the loss of competitiveness of the products in international markets
but also lead to the reduction of inputs of fertiliser, which may affect the production, because
of the budget constraints of farmers.
The fertiliser prices in Zambia and Malawi are presented in Table 5.18, with the prices in
neighbouring countries with a seaport, Tanzania and Kenya and the Black Sea FOB price for
comparison purposes. The fertiliser price in Zambia was not very expensive in 2013, nearly
21 Ncube, Phumzile, Simon Roberts and Thando Vilakazi. 2015. Study of Competition in the Road Freight Sector in the SADC Region - Case Study of Fertilizer Transport and Trading In Zambia, Tanzania And Malawi. Centre for Competition, Regulation and Economic Development University of Johannesburg. Working Paper 3/2015.
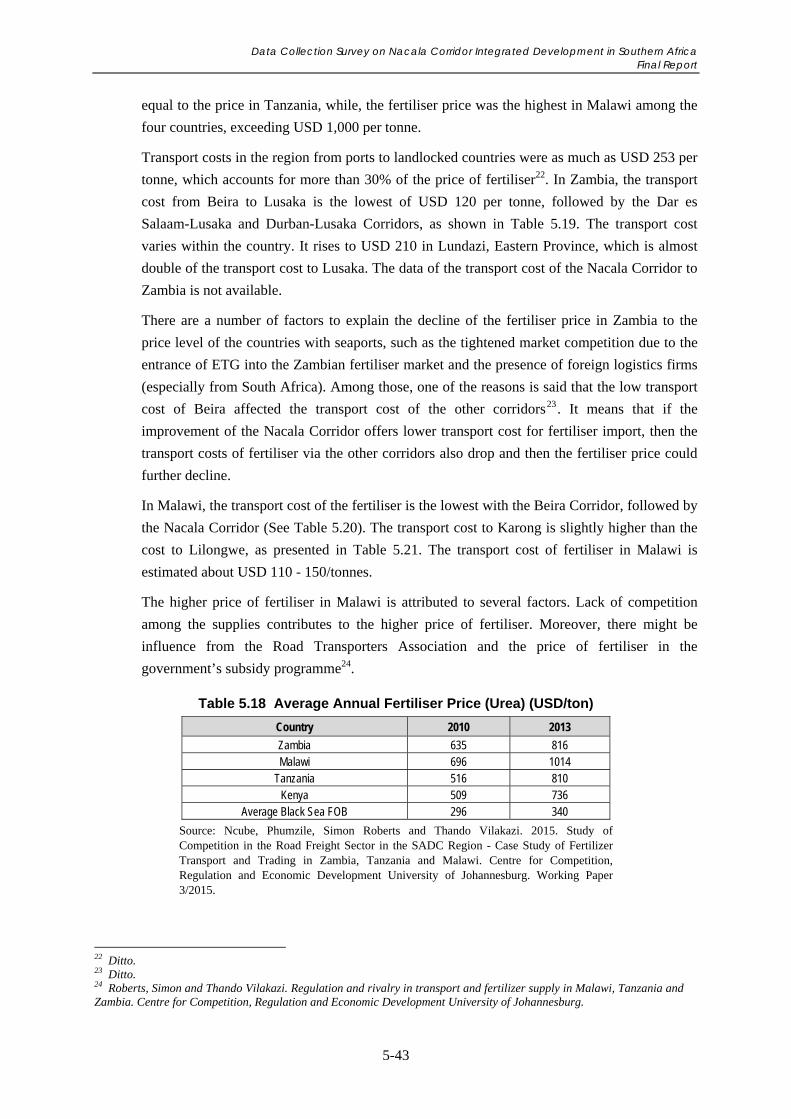
Data Collection Survey on Nacala Corridor Integrated Development in Southern Africa Final Report
5-43
equal to the price in Tanzania, while, the fertiliser price was the highest in Malawi among the
four countries, exceeding USD 1,000 per tonne.
Transport costs in the region from ports to landlocked countries were as much as USD 253 per
tonne, which accounts for more than 30% of the price of fertiliser22. In Zambia, the transport
cost from Beira to Lusaka is the lowest of USD 120 per tonne, followed by the Dar es
Salaam-Lusaka and Durban-Lusaka Corridors, as shown in Table 5.19. The transport cost
varies within the country. It rises to USD 210 in Lundazi, Eastern Province, which is almost
double of the transport cost to Lusaka. The data of the transport cost of the Nacala Corridor to
Zambia is not available.
There are a number of factors to explain the decline of the fertiliser price in Zambia to the
price level of the countries with seaports, such as the tightened market competition due to the
entrance of ETG into the Zambian fertiliser market and the presence of foreign logistics firms
(especially from South Africa). Among those, one of the reasons is said that the low transport
cost of Beira affected the transport cost of the other corridors23. It means that if the
improvement of the Nacala Corridor offers lower transport cost for fertiliser import, then the
transport costs of fertiliser via the other corridors also drop and then the fertiliser price could
further decline.
In Malawi, the transport cost of the fertiliser is the lowest with the Beira Corridor, followed by
the Nacala Corridor (See Table 5.20). The transport cost to Karong is slightly higher than the
cost to Lilongwe, as presented in Table 5.21. The transport cost of fertiliser in Malawi is
estimated about USD 110 - 150/tonnes.
The higher price of fertiliser in Malawi is attributed to several factors. Lack of competition
among the supplies contributes to the higher price of fertiliser. Moreover, there might be
influence from the Road Transporters Association and the price of fertiliser in the
government’s subsidy programme24.
Table 5.18 Average Annual Fertiliser Price (Urea) (USD/ton)
Country 2010 2013
Zambia 635 816 Malawi 696 1014
Tanzania 516 810 Kenya 509 736
Average Black Sea FOB 296 340
Source: Ncube, Phumzile, Simon Roberts and Thando Vilakazi. 2015. Study of Competition in the Road Freight Sector in the SADC Region - Case Study of Fertilizer Transport and Trading in Zambia, Tanzania and Malawi. Centre for Competition, Regulation and Economic Development University of Johannesburg. Working Paper 3/2015.
22 Ditto. 23 Ditto. 24 Roberts, Simon and Thando Vilakazi. Regulation and rivalry in transport and fertilizer supply in Malawi, Tanzania and Zambia. Centre for Competition, Regulation and Economic Development University of Johannesburg.
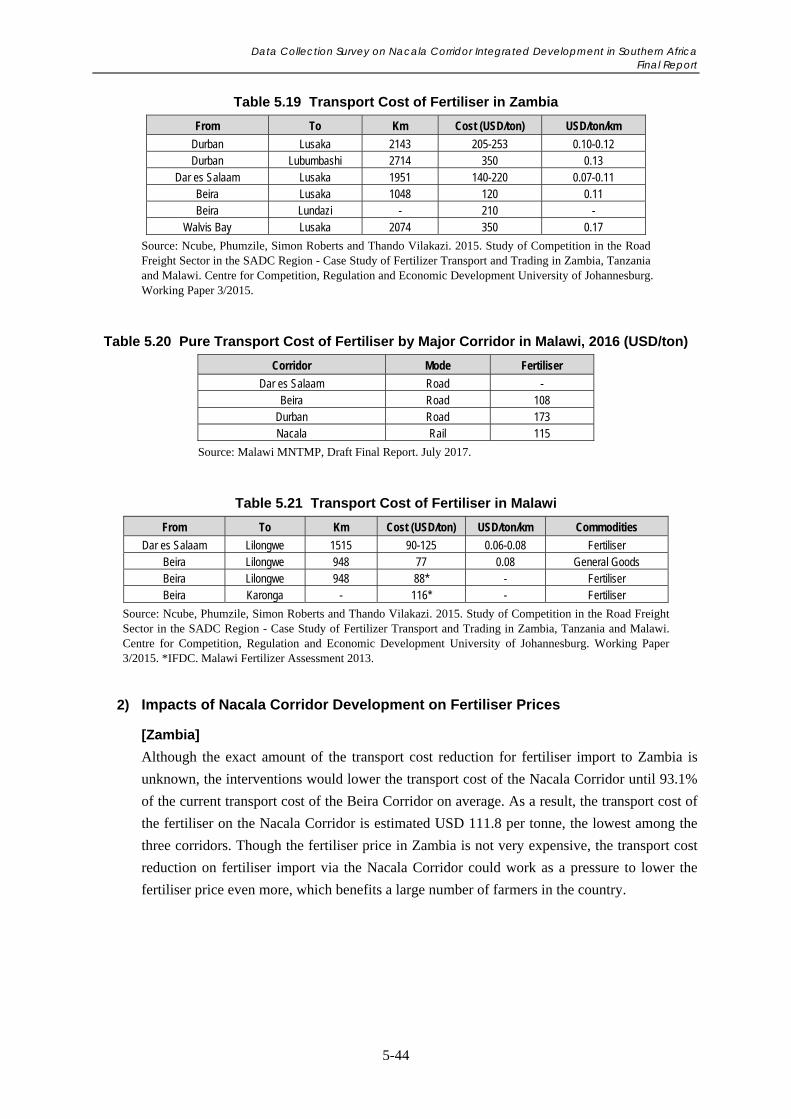
Data Collection Survey on Nacala Corridor Integrated Development in Southern Africa Final Report
5-44
Table 5.19 Transport Cost of Fertiliser in Zambia
From To Km Cost (USD/ton) USD/ton/km
Durban Lusaka 2143 205-253 0.10-0.12 Durban Lubumbashi 2714 350 0.13
Dar es Salaam Lusaka 1951 140-220 0.07-0.11 Beira Lusaka 1048 120 0.11 Beira Lundazi - 210 -
Walvis Bay Lusaka 2074 350 0.17
Source: Ncube, Phumzile, Simon Roberts and Thando Vilakazi. 2015. Study of Competition in the Road Freight Sector in the SADC Region - Case Study of Fertilizer Transport and Trading in Zambia, Tanzania and Malawi. Centre for Competition, Regulation and Economic Development University of Johannesburg. Working Paper 3/2015.
Table 5.20 Pure Transport Cost of Fertiliser by Major Corridor in Malawi, 2016 (USD/ton)
Corridor Mode Fertiliser
Dar es Salaam Road - Beira Road 108
Durban Road 173 Nacala Rail 115
Source: Malawi MNTMP, Draft Final Report. July 2017.
Table 5.21 Transport Cost of Fertiliser in Malawi
From To Km Cost (USD/ton) USD/ton/km Commodities
Dar es Salaam Lilongwe 1515 90-125 0.06-0.08 Fertiliser Beira Lilongwe 948 77 0.08 General Goods Beira Lilongwe 948 88* - Fertiliser Beira Karonga - 116* - Fertiliser
Source: Ncube, Phumzile, Simon Roberts and Thando Vilakazi. 2015. Study of Competition in the Road Freight Sector in the SADC Region - Case Study of Fertilizer Transport and Trading in Zambia, Tanzania and Malawi. Centre for Competition, Regulation and Economic Development University of Johannesburg. Working Paper 3/2015. *IFDC. Malawi Fertilizer Assessment 2013.
2) Impacts of Nacala Corridor Development on Fertiliser Prices
[Zambia]
Although the exact amount of the transport cost reduction for fertiliser import to Zambia is
unknown, the interventions would lower the transport cost of the Nacala Corridor until 93.1%
of the current transport cost of the Beira Corridor on average. As a result, the transport cost of
the fertiliser on the Nacala Corridor is estimated USD 111.8 per tonne, the lowest among the
three corridors. Though the fertiliser price in Zambia is not very expensive, the transport cost
reduction on fertiliser import via the Nacala Corridor could work as a pressure to lower the
fertiliser price even more, which benefits a large number of farmers in the country.
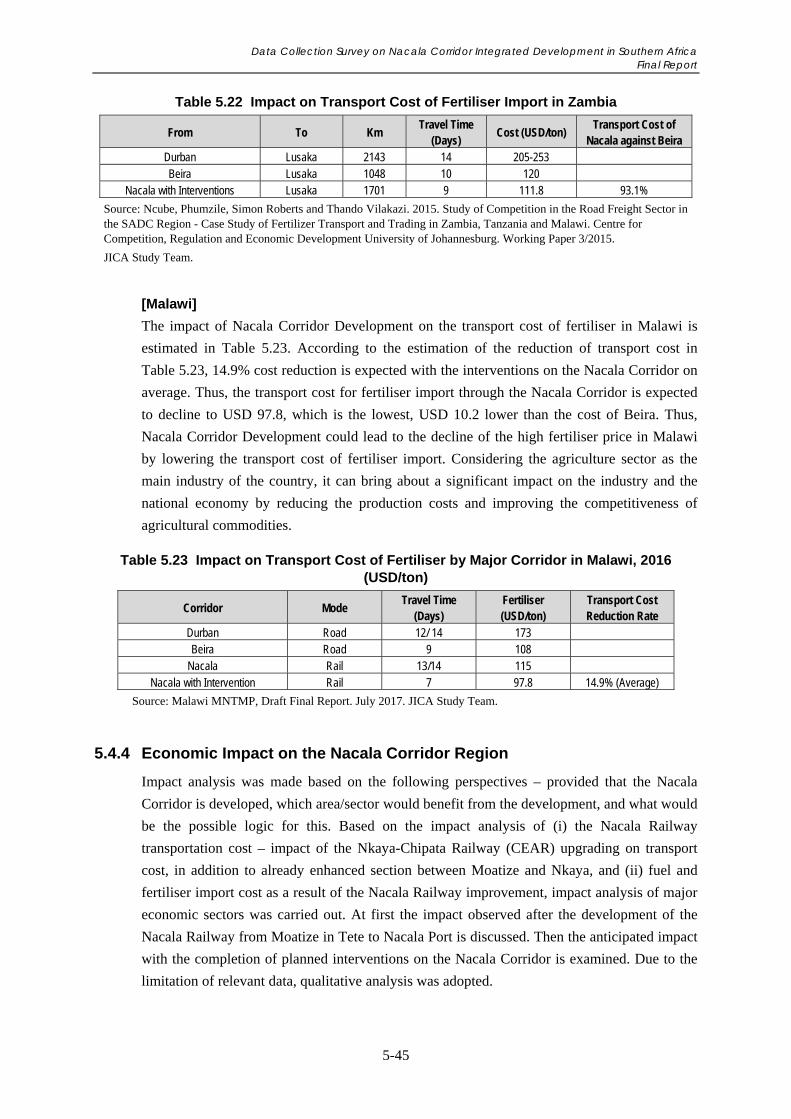
Data Collection Survey on Nacala Corridor Integrated Development in Southern Africa Final Report
5-45
Table 5.22 Impact on Transport Cost of Fertiliser Import in Zambia
From To Km Travel Time
(Days) Cost (USD/ton)
Transport Cost of Nacala against Beira
Durban Lusaka 2143 14 205-253 Beira Lusaka 1048 10 120
Nacala with Interventions Lusaka 1701 9 111.8 93.1%
Source: Ncube, Phumzile, Simon Roberts and Thando Vilakazi. 2015. Study of Competition in the Road Freight Sector in the SADC Region - Case Study of Fertilizer Transport and Trading in Zambia, Tanzania and Malawi. Centre for Competition, Regulation and Economic Development University of Johannesburg. Working Paper 3/2015.
JICA Study Team.
[Malawi]
The impact of Nacala Corridor Development on the transport cost of fertiliser in Malawi is
estimated in Table 5.23. According to the estimation of the reduction of transport cost in
Table 5.23, 14.9% cost reduction is expected with the interventions on the Nacala Corridor on
average. Thus, the transport cost for fertiliser import through the Nacala Corridor is expected
to decline to USD 97.8, which is the lowest, USD 10.2 lower than the cost of Beira. Thus,
Nacala Corridor Development could lead to the decline of the high fertiliser price in Malawi
by lowering the transport cost of fertiliser import. Considering the agriculture sector as the
main industry of the country, it can bring about a significant impact on the industry and the
national economy by reducing the production costs and improving the competitiveness of
agricultural commodities.
Table 5.23 Impact on Transport Cost of Fertiliser by Major Corridor in Malawi, 2016 (USD/ton)
Corridor Mode Travel Time
(Days) Fertiliser (USD/ton)
Transport Cost Reduction Rate
Durban Road 12/ 14 173 Beira Road 9 108
Nacala Rail 13/14 115 Nacala with Intervention Rail 7 97.8 14.9% (Average)
Source: Malawi MNTMP, Draft Final Report. July 2017. JICA Study Team.
5.4.4 Economic Impact on the Nacala Corridor Region
Impact analysis was made based on the following perspectives – provided that the Nacala
Corridor is developed, which area/sector would benefit from the development, and what would
be the possible logic for this. Based on the impact analysis of (i) the Nacala Railway
transportation cost – impact of the Nkaya-Chipata Railway (CEAR) upgrading on transport
cost, in addition to already enhanced section between Moatize and Nkaya, and (ii) fuel and
fertiliser import cost as a result of the Nacala Railway improvement, impact analysis of major
economic sectors was carried out. At first the impact observed after the development of the
Nacala Railway from Moatize in Tete to Nacala Port is discussed. Then the anticipated impact
with the completion of planned interventions on the Nacala Corridor is examined. Due to the
limitation of relevant data, qualitative analysis was adopted.
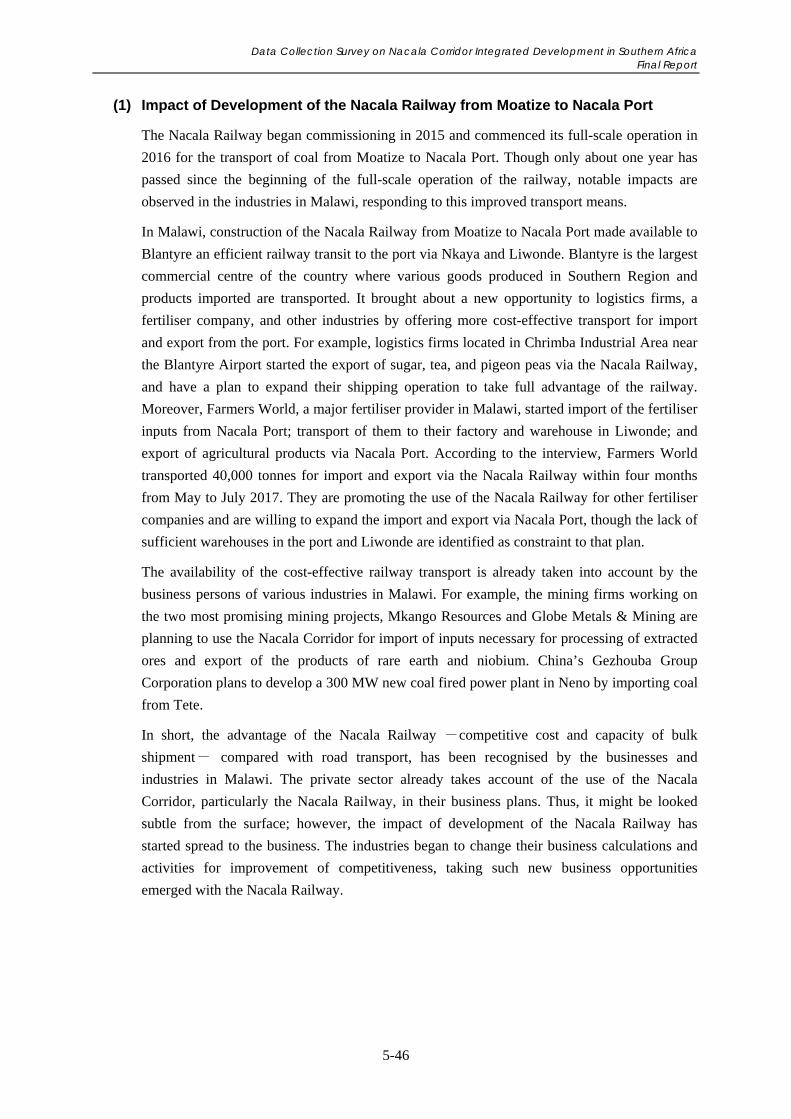
Data Collection Survey on Nacala Corridor Integrated Development in Southern Africa Final Report
5-46
(1) Impact of Development of the Nacala Railway from Moatize to Nacala Port
The Nacala Railway began commissioning in 2015 and commenced its full-scale operation in
2016 for the transport of coal from Moatize to Nacala Port. Though only about one year has
passed since the beginning of the full-scale operation of the railway, notable impacts are
observed in the industries in Malawi, responding to this improved transport means.
In Malawi, construction of the Nacala Railway from Moatize to Nacala Port made available to
Blantyre an efficient railway transit to the port via Nkaya and Liwonde. Blantyre is the largest
commercial centre of the country where various goods produced in Southern Region and
products imported are transported. It brought about a new opportunity to logistics firms, a
fertiliser company, and other industries by offering more cost-effective transport for import
and export from the port. For example, logistics firms located in Chrimba Industrial Area near
the Blantyre Airport started the export of sugar, tea, and pigeon peas via the Nacala Railway,
and have a plan to expand their shipping operation to take full advantage of the railway.
Moreover, Farmers World, a major fertiliser provider in Malawi, started import of the fertiliser
inputs from Nacala Port; transport of them to their factory and warehouse in Liwonde; and
export of agricultural products via Nacala Port. According to the interview, Farmers World
transported 40,000 tonnes for import and export via the Nacala Railway within four months
from May to July 2017. They are promoting the use of the Nacala Railway for other fertiliser
companies and are willing to expand the import and export via Nacala Port, though the lack of
sufficient warehouses in the port and Liwonde are identified as constraint to that plan.
The availability of the cost-effective railway transport is already taken into account by the
business persons of various industries in Malawi. For example, the mining firms working on
the two most promising mining projects, Mkango Resources and Globe Metals & Mining are
planning to use the Nacala Corridor for import of inputs necessary for processing of extracted
ores and export of the products of rare earth and niobium. China’s Gezhouba Group
Corporation plans to develop a 300 MW new coal fired power plant in Neno by importing coal
from Tete.
In short, the advantage of the Nacala Railway -competitive cost and capacity of bulk
shipment- compared with road transport, has been recognised by the businesses and
industries in Malawi. The private sector already takes account of the use of the Nacala
Corridor, particularly the Nacala Railway, in their business plans. Thus, it might be looked
subtle from the surface; however, the impact of development of the Nacala Railway has
started spread to the business. The industries began to change their business calculations and
activities for improvement of competitiveness, taking such new business opportunities
emerged with the Nacala Railway.
Data Collection Survey on Nacala Corridor Integrated Development in Southern Africa Final Report
5-47
(2) Zambia
1) Agriculture and Agri-business
Reduction of Production Cost
Reduced cost of fertiliser and fuel as a result of the railway upgrading (Nkaya-Chipata section)
will increase the availability of more affordable inputs for agricultural production as well as
improve productive efficiency. In Zambia, Eastern Province is the largest maize producing
province and has favourable soil and climate conditions for cotton, oil seed crops (soya,
sunflower and groundnut), and livestock (cattle, goats and sheep). Small-scale farmers are
mostly involved in the production and the outputs are largely sold in domestic markets. With
reduced fertiliser cost, they would be able to afford buying more agricultural inputs, which
will contribute to their increased productivity. Large private firms in Eastern Province/Chipata
include China Africa Cotton dealing with cotton, NWK Agri-Services and Cargill dealing with
maize and soya beans. They export raw materials to China, South Africa and USA,
respectively, for processing. These companies are likely to expand production as a result of
improved production efficiency.
According to local interview survey, there is an expectation of importing fertilisers and fuel
via Nacala, Chipata, Lusaka, and Mpika at a lower cost25. If this route turns out to be efficient,
there is a good chance that agricultural productivity in Northern Province will also improve.
Improvement of Market Access
Positive impacts on market access, including regional and external markets can be expected as
a result of reduced transportation cost and time. Reduction of risk of delay in delivery and
increased reliability can be expected as well. Maize, mainly produced by small scale farmers,
was previously transported to Lusaka for government purchase and storage; however, with a
lift of a maize export ban, it can be exported to Lilongwe and Nampula directly via Chipata
(without going through Lusaka), utilising the Nacala Railway. Currently, utilisation of
processing facilities are highly limited in Eastern Province and therefore, a large portion of
agricultural outputs including oil seed crops would be transported to Lusaka using the Great
East Road by truck to be processed and sold to domestic markets or to be exported. With
increased productivity and expected fall in the price of agricultural crops/products as a result
of reduced cost of fertiliser and fuel, domestic markets will be activated and opportunities for
exporting to regional and external markets will increase. For example, soya and processed
soya bean meal can be exported to Kenya and Ethiopia via Mozambique, utilising the Nacala
Railway.
Increase of investment
Nacala Corridor Development will contribute to increased investment in Zambia in the
medium to longer term. So far, investment in Eastern Province, both in terms of amount and
number is very limited (less than or around 1% of the entire country). Large private companies
such as above mentioned China Africa Cotton, NWK Agri-Services and Cargill export raw
25 Interview with AFGRI Corporation Ltd., Lusaka, Zambia on July 12, 2017.
Data Collection Survey on Nacala Corridor Integrated Development in Southern Africa Final Report
5-48
materials to external markets for processing which leaves very little room for value addition in
the province (cotton operation is up to ginnery, and further processing is undertaken abroad).
However, with increased productivity and market access, positive impacts on investment will
gradually come out. These trends also conform with the government’s policy to promote
diversification and enhancement of value addition in agriculture and agri-business. In fact,
signs for future investment can be seen. For example, Saudi Arabia has recently shown interest
to investing in the livestock industry in Zambia – breeding sheep and goats and to export them
alive to the country. Although the plan is still under the conceptual phase, a MOU has been
concluded between the two countries and a taskforce was established in Zambia. There is a
plan to develop MFEZ in Chipata as well. Financial sources need to be secured before
concretising the plan; however, such an initiative symbolises Zambian government’s
willingness to attract investment to realise its development policy.
2) Mining
Limestone and Limestone Products (Quicklime, Hydrated Lime etc.)
The Nacala Railway upgrading (Nkaya-Chipata section) will contribute to improved market
access of limestone manufacturers. Demand of limestone and limestone products has been
increasing with the activation of construction industry, copper refining and processing of sugar.
Quick lime is utilised for copper refinery and a major demand centre is Copperbelt Province.
Hydrated lime is utilised for sugar processing, and the majority of hydrated lime is exported to
Malawi (major client is Illovo Sugar Ltd.), followed by Zimbabwe. According to a limestone
processing company in Ndola, hydrated lime is transported to Illovo via Kapiri Mposhi,
Lusaka, Chipata and Blantyre by truck. The company is eager to utilise the Nacala Railway
once the Nkaya-Chipata section has been upgraded and realises efficient transportation.
Furthermore, in the future, the company may consider utilising the railway in Zambia if
construction of the Chipata-Petauke-Serenje railway is realised and turns out to be a reliable
and efficient transportation means.
Copper
Impacts on copper and the copper industry may be expected in the long run provided that the
Chipata-Petauke-Serenje railway is realised and turns out to be reliable and efficient
transportation. While Copperbelt Province is the “hub” of the copper industry, a large portion
of copper ore is extracted in DRC. Processing has been carried out in Copperbelt Province
(Chingola, Ndola etc.) and exported via Dar es Salaam Port (by TAZARA Railway), Beira
Port or Durban Port by truck. If the Chipata-Petauke-Serenje railway is developed in the long
run, processed copper may be transported to Malawi via Ndola, Kapiri Mposhi, Serenje,
Petauke and Chipata, which would open up new markets and provide alternative routes for
export in addition to the Dar es Salaam and Beira Corridors. In addition, currently, a large
portion of necessary inputs (such as sulphur) for copper refining is imported from South
Africa; however, alternative import routes may be created (via the Nacala Corridor) if the
Chipata-Petauke-Serenje railway turns out to be usable.
Data Collection Survey on Nacala Corridor Integrated Development in Southern Africa Final Report
5-49
(3) Malawi
1) Agriculture and Agri-business
Reduction of Production Cost
Reduced cost of fertiliser and fuel as a result of railway upgrading will increase the
availability of more affordable inputs for agricultural production to the farmers in the region,
who are mostly small scale farmers, and improve their production efficiency. In Malawi, oil
seed crops (sunflower, groundnut, and soya), cotton, rice and legumes (pigeon pea, cowpea
and chickpea) are mostly produced by small-scale farmers. With reduced fertiliser cost, they
would be able to afford buying more agricultural inputs, which will contribute to their
increased productivity. Sugar and sugar cane products, almost a monopolized market except
for a few small scale companies, are likely to expand production as a result of improved
production efficiency.
The planned and on-going initiatives including the SVIP, AGCOM and development of
Agro-Processing Special Economic Zone will also generate synergy effects with Nacala
Corridor Development. The ultimate goal of these initiatives is to diversify and deepen the
production base, and to transform the economy for further economic growth. In this regard,
the realisation of an increased production scale, while suppressing production cost as a result
of reduced fertiliser and fuel cost is highly critical in Malawi.
Improvement of Market Access
Positive impacts on market access, including regional and external markets can be expected as
a result of reduced transportation cost and time. Reduction of risk of delay in delivery and
increased reliability can be expected as well. Currently, traditional cash crops (including
tobacco, tea, sugar and cotton) which require mass transportation are mainly using the Beira
Corridor or the Dar es Salaam Corridor for export (to EU, USA, China, Egypt, Zimbabwe,
Kenya etc.). Taking into account the expected reduction of transportation cost/time as a result
of railway upgrading, some cargos have already shifted the transportation route and started
utilising the Nacala Corridor. The result of local interview surveys has also indicated that
exporters are willing to use the Nacala Corridor if transportation cost/time is lower/ shorter
and efficient compared to other corridors. With the increased utilisation of the Nacala Corridor,
other agriculture products (including oil seed products, rice and legumes) may also start
utilising the Nacala Corridor for export, targeting regional markets (to Zimbabwe, Botswana,
Zambia, South Africa etc.).
Increase of investment
Nacala Corridor Development will contribute to increase investment in Malawi. There is a
plan to develop Agro-Processing SEZ which prioritises three export-oriented clusters in line
with the NES – oil seed products (cooking oil, soaps, lubricants, fertiliser, snacks,
confectionery, etc.), sugar cane products (sugar, high value sugar through branding and sugar
confectionery), and manufacturers (beverages, dairy, processed maize, wheat, horticulture and
Data Collection Survey on Nacala Corridor Integrated Development in Southern Africa Final Report
5-50
pulse, plastics and packaging, assembly). Feasibility Studies to be carried out will identify
candidate location(s)26 and come up with operation strategies of SEZ (incentive framework,
regulatory framework, institutional framework, and physical development and management
structures). Synergy effect is expected with Nacala Corridor Development provided that close
coordination takes place, and conditions and incentive structures of SEZ are attractive for
private investors.
2) Mining
Reduction of Production Cost
The mining sector is expected to have a positive impact from the reduced cost of inputs as a
result of the railway upgrading. Major investment projects under preparation are: (i) Songwe
Hill Rare Earth Project, owned by Mkango Resources Ltd., which is listed on Canada’s TSX
Venture Exchange and the AIM Market of the London Stock Exchange, and (ii) Kanyika
Niobium Project and Chiziro Graphite Project are run by the Australian-listed, metals and rare
earths company called Globe Metals & Mining Ltd. Songwe Hill Rare Earth Project is located
in Phalombe, which is about 2 km from the Mozambique border. Mkango Resources Ltd.
intends to utilise the Nacala Railway to import necessary inputs including sulphur. Kanyika
Niobium Project is located in Mzimba and Chiziro Graphite Project is implemented in
northeast of Lilongwe. Globe Metals & Mining also intends to utilise Nacala railway to import
production materials. As such, investors ardently expect the rail infrastructure to be upgraded
and efficiency to be improved, since the convenience and value of railway services will
directly affect production cost. To this end, Mkango Resources Ltd. considers the construction
of dry ports highly useful. Globe Metals & Mining Ltd. wishes to have a small-scale rail line
from Lilongwe to the project site.
Improvement of Market Access
By the same token, usability of the Nacala Railway will also have a significant impact on
market access of the mining sector in Malawi. As regards the Songwe Hill Rare Earth Project,
Mkango Resources is considering transporting rare earth outputs to Liwonde by truck and then
loading them on the Nacala Railway for exporting to Europe. Currently, the rare earth market
is dominated by China – 98% of world supply comes from China, however, this project will
create an alternative supply source other than China. Regarding the Kanyika Niobium Project,
Globe Metals & Mining also intends to utilise the Nacala Rail to transport Niobium via Nacala
Port. Currently, Brazil is dominating the Niobium market – about 90 to 92% of supply
(equivalent to 55,000 tonnes per year) comes from Brazil, followed by Canada (4,000 tonnes
per year). Once this project is realised, it will become third place in the world. To this end,
upgrading the rail infrastructure and efficiency is highly critical.
26 Several candidate locations are under consideration: Lilongwe (with 350ha of land in the vicinity of airport), Blantyre (with 38ha of land), Liwonde, Shire Valley, North Karonga, Salima etc.
Data Collection Survey on Nacala Corridor Integrated Development in Southern Africa Final Report
6-1
Chapter 6 Proposed Growth Scenarios of Zambia and Malawi Related to Nacala Corridor Development
6.1 Introduction
This chapter describes the proposed growth scenarios of Zambia and Malawi related to Nacala
Corridor Development. A growth scenario is proposed for Zambia and another growth
scenario is proposed for Malawi. These growth scenarios are formulated by considering the
following points:
How to promote development of economic sectors of Zambia and Malawi by utilising
the Nacala Corridor, which is composed of a sea port, railways and trunk roads,
connecting northern Mozambique, Malawi and Eastern Zambia
How to strengthen the Nacala Corridor so that economic sectors of Malawi and Zambia
could efficiently and effectively utilise the Nacala Corridor
This way of consideration for formulating growth scenarios is based on the following basic
understanding of the relationship between transport corridors and economic sector
development:
Since the development and maintenance of corridor infrastructure and services for
long-distant cargo transport are very costly, it is necessary to fully utilise existing and
prospective corridor infrastructure and services for promoting the development of
economic sectors.
It is necessary for transport corridor infrastructure and services to make a serious effort
at attracting traffic demand for developing and maintaining the infrastructure and
sustaining services. Otherwise, such infrastructure and services would not be further
developed and sustainable, leading to the decline of economic sectors.
It is necessary for economic sectors to make an effort at utilising transport corridor
infrastructure and services in order to sustain such infrastructure and services.
Otherwise, such infrastructure and services would not be sustainable, resulting in a
decline in the economic sectors.
Data Collection Survey on Nacala Corridor Integrated Development in Southern Africa Final Report
6-2
6.2 Advantages of the Nacala Corridor over Other Transport Corridors of Zambia and Malawi
6.2.1 Emergence of Nacala Corridor as an Important Alternative Transport Route
(1) Upgraded Railway Between Nacala and Moatize Through Malawi with the Nacala Corridor Railway
In the middle of 2016, a full-scale railway operation for coal transport started on the Nacala
Corridor, whose railway tracks are well rehabilitated and railway operation is strengthened.
On the other hand, since that time, general cargo, containers and other forms of cargo have
been transported between Nacala Port and Malawi’s Blantyre (Limbe and Chirimba Industrial
Park) and Lilongwe (Kanengo).
A railway line (not rehabilitated yet) connects between Nkaya and Mchinji by CEAR and
another short rail section connects between Mchinji and Chipata by ZRL. The railway is able
to operate cargo trains between Chipata and Nacala through Lilongwe, Nkaya and Liwonde. In
actuality, cargo security is not so good. Even under this situation, a certain impact on the
improvement is an advantage for the Nacala Corridor. This point is discussed in Section 6.2.2.
(2) Planned Upgrading of Railway Connection to Lilongwe and Chipata from Nacala
A private group composed of Vale (Brazil) and Mitsui (Japan) announced an upgrade plan of
the railway section between Nkaya and Mchinji of CEAR in order to connect this section with
the upgraded Nacala Corridor Railway (Moatize-Nkaya-Liwonde-Cuamba-Nampula-Nacala).
This planned upgrading of the railway section could bring a continually upgraded railway
between Chipata and Nacala through Lilongwe, Nkaya, Liwonde, Cuamba, and Nampula. The
planned upgrading could bring a significant improvement of rail transport up to Chipata in
Eastern Province, Zambia. Section 6.2.2 analyses the advantage of the Nacala Corridor.
(3) Additional Needs for Improvement for Upgraded Nacala Corridor Railway Infrastructure and Services
In order to improve the efficiency of cargo handling (to reduce monetary cost and time cost for
transport) and cargo security during transport (to reduce risks of losing cargo), the following
additional measures are required:
To establish multi-modal dry ports consisting of cargo railway stations, cargo handling
machines, container yards, warehouses and truck parking lots, as well as customs
offices and private forwarder offices
To mechanise the handling of cargo at railway stations, especially by establishing
multi-modal dry ports in inland countries and inland areas
To equip weigh bridges for the loading and off-loading cargos, especially at
multi-modal dry ports in inland countries and inland areas
To establish and operate “cargo tracking systems” during rail transport
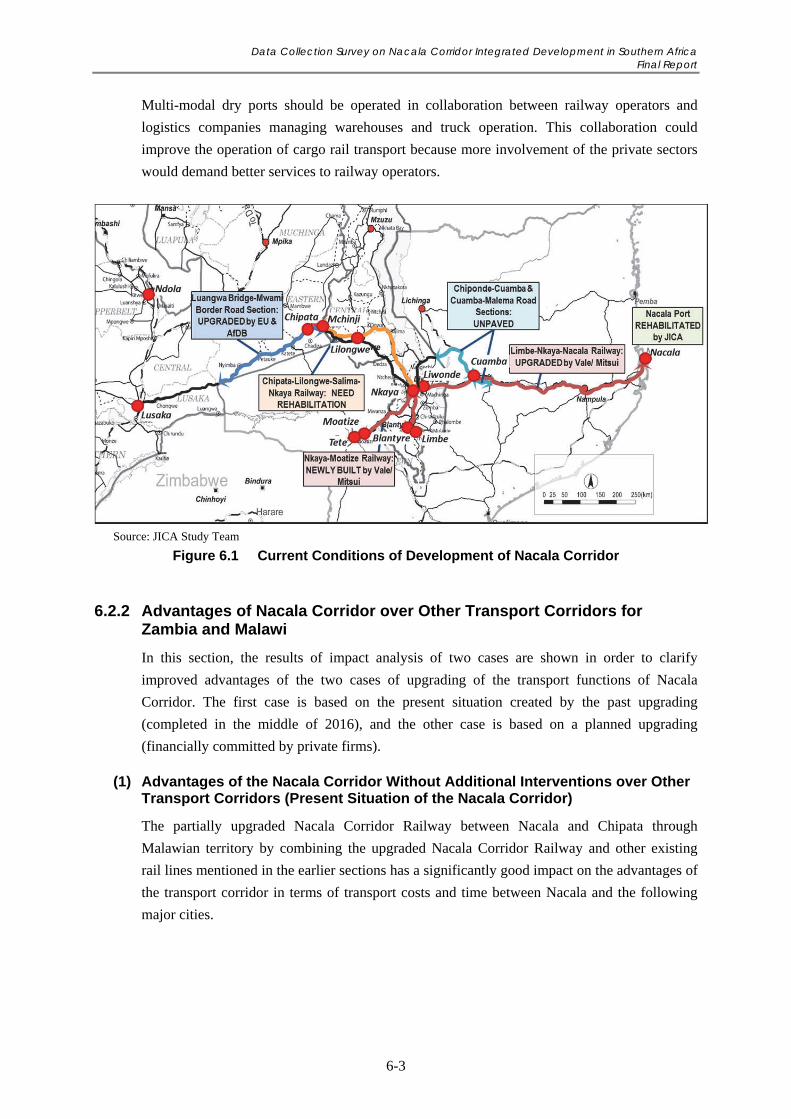
Data Collection Survey on Nacala Corridor Integrated Development in Southern Africa Final Report
6-3
Multi-modal dry ports should be operated in collaboration between railway operators and
logistics companies managing warehouses and truck operation. This collaboration could
improve the operation of cargo rail transport because more involvement of the private sectors
would demand better services to railway operators.
Source: JICA Study Team
Figure 6.1 Current Conditions of Development of Nacala Corridor
6.2.2 Advantages of Nacala Corridor over Other Transport Corridors for Zambia and Malawi
In this section, the results of impact analysis of two cases are shown in order to clarify
improved advantages of the two cases of upgrading of the transport functions of Nacala
Corridor. The first case is based on the present situation created by the past upgrading
(completed in the middle of 2016), and the other case is based on a planned upgrading
(financially committed by private firms).
(1) Advantages of the Nacala Corridor Without Additional Interventions over Other Transport Corridors (Present Situation of the Nacala Corridor)
The partially upgraded Nacala Corridor Railway between Nacala and Chipata through
Malawian territory by combining the upgraded Nacala Corridor Railway and other existing
rail lines mentioned in the earlier sections has a significantly good impact on the advantages of
the transport corridor in terms of transport costs and time between Nacala and the following
major cities.
Data Collection Survey on Nacala Corridor Integrated Development in Southern Africa Final Report
6-4
Corridor Comparison for Lusaka (Present Situation)
At present, no effective rail transport service together with truck transport services are
available in Lusaka. The transport cost and time of the Lusaka-Nacala Road Corridor (1,810
km) account for the following (see Table 5.12 for detailed comparison data):
138% of the transport cost of the Lusaka-Beira Port Road Corridor (1,054km)
4 days slower than the Lusaka-Beira Port Road Corridor (1,054km)
86% of the transport cost of the Lusaka-Dar es Salaam Port Road Corridor (1,985km)
As same days as the Lusaka- Dar es Salaam Port Road Corridor (1,985km)
118% of the transport cost of the Lusaka-Dar es Salaam Port Railway Corridor
(2,039km)
As same days as the Lusaka-Dar es Salaam Port Railway Corridor (2,039km)
86% of the transport cost of the Lusaka-Durban Port Road Corridor (2,381km)
6 days slower than the Lusaka-Durban Port Road Corridor (2,381km)
132% of the transport cost of the Lusaka-Durban Port Rail Corridor (2,638km)
5 days slower than the Lusaka-Durban Port Rail Corridor (2,638km)
In terms of transport cost, the Lusaka-Beira Road Corridor is very much advantageous over
other transport corridors. The transport cost of the Lusaka-Beira Road Corridor accounts for
63% of that of the Lusaka-Durban Road Corridor and 86% of the Lusaka-Dar es Salaam Rail
Corridor.
On the other hand, in terms of transport time, the Lusaka-Durban Road Corridor is very
much advantageous over other transport corridors. The transport time of the Lusaka-Durban
Road Corridor is two days faster than that of the Lusaka-Beira Road Corridor.
Corridor Comparison for Chipata (Present Situation)
The transport cost and time of the Chipata-Nacala Rail Corridor (1,133 km) account for the
following (see Table 5.12 for detailed comparison data):
83% of the transport cost of the Chipata-Beira Port Road Corridor (930 km)
9 days slower than the Chipata-Beira Port Road Corridor (930 km)
51% of the transport cost of the Chipata-Dar es Salaam Port Road Corridor (1,811 km)
2 days slower than the Chipata- Dar es Salaam Port Road Corridor (1,811 km)
48% of the transport cost of the Chipata-Durban Port Road Corridor (2,381 km)
6 days slower than the Chipata-Durban Port Road Corridor (2,381 km)
The Nacala Corridor is the only international corridor going through Chipata among the four
corridors. In terms of transport cost, the Chipata-Nacala Rail Corridor (the present situation)
is significantly advantageous over other transport corridors. However, in terms of transport
Data Collection Survey on Nacala Corridor Integrated Development in Southern Africa Final Report
6-5
time, the Chipata-Nacala Rail Corridor (the present situation) is very much disadvantageous
over other transport corridors.
Corridor Comparison for Lilongwe (Present Situation)
The transport cost and time of the Lilongwe-Nacala Rail Corridor (989 km) account for the
following (see Table 5.12 for detailed comparison data):
76% of the transport cost of the Lilongwe-Beira Port Road Corridor (1,096 km)
6 days slower than the Lilongwe-Beira Port Road Corridor (1,096 km)
50% of the transport cost of the Lilongwe-Dar es Salaam Port Road Corridor (1,667
km)
1 day slower than the Lilongwe-Dar es Salaam Port Road Corridor (1,667 km)
40% of the transport cost of the Lilongwe-Durban Port Road Corridor (2,650 km)
1 day slower than the Lilongwe-Durban Port Road Corridor (2,650 km)
In terms of transport cost, the Lilongwe-Nacala Rail Corridor is significantly advantageous
over other transport corridors. However, in terms of transport time, the Lilongwe-Nacala
Rail Corridor (the present situation) is disadvantageous over the Lilongwe-Beira Road
Corridor.
Corridor Comparison for Blantyre (Present Situation)
The transport cost and time of the Blantyre-Nacala Rail Corridor (799 km) account for the
following (see Table 5.12 for detailed comparison data):
79% of the transport cost of the Blantyre-Beira Port Road Corridor (812 km)
4 days slower than the Blantyre-Beira Port Road Corridor (812 km)
40% of the transport cost of the Blantyre-Dar es Salaam Port Road Corridor (1,978 km)
2 days faster than the Blantyre-Dar es Salaam Port Road Corridor (1,978 km)
39% of the transport cost of the Blantyre-Durban Port Road Corridor (2,340 km)
1 day slower than the Blantyre-Durban Port Road Corridor (2,340 km)
In terms of transport cost, the Blantyre-Nacala Rail Corridor is significantly advantageous
over other transport corridors. However, in terms of transport time, the Blantyre-Nacala Rail
Corridor (the present situation) is disadvantageous over the Blantyre-Beira Road Corridor.
(2) Advantages of the Nacala Corridor with Planned Interventions over Other Transport Corridors (to be Implemented by the Private Sector in Five to Seven Years)
Different transport corridors between major cities and various sea ports are compared in terms
of transport costs and time. In this section, the transport time and cost of the Nacala Corridor
Data Collection Survey on Nacala Corridor Integrated Development in Southern Africa Final Report
6-6
after implementation of the planned interventions are compared with those of the other
corridors1. As a result, general advantages of Nacala Corridor have been found.
Corridor Comparison for Lusaka (with Planned Interventions)
The transport cost and time of the Lusaka-Nacala Corridor (Combined Rail and Track
Transport, 1,701 km) account for the following (see Table 5.13 for detailed comparison data):
93% of the transport cost of the Lusaka-Beira Port Road Corridor (1,054 km)
1 day faster than the Lusaka-Beira Port Road Corridor (1,054 km)
59% of the transport cost of the Lusaka-Dar es Salaam Port Road Corridor (1,985 km)
5 days faster than the Lusaka-Dar es Salaam Port Road Corridor (1,985 km)
80% of the transport cost of the Lusaka-Dar es Salaam Port Railway Corridor (2,039
km)
5 days faster than the Lusaka-Dar es Salaam Port Railway Corridor (2,039 km)
59% of the transport cost of the Lusaka-Durban Port Road Corridor (2,381 km)
1 day slower than the Lusaka-Durban Port Road Corridor (2,381 km)
89% of the transport cost of the Lusaka-Durban Port Rail Corridor (2,638 km)
As same days as the Lusaka-Durban Port Rail Corridor (2,638 km)
Different transport corridors between Lusaka and various sea ports are compared, resulting in
a significant advantage of the Nacala Corridor (Combined Rail and Truck Transport) over the
Lusaka-Dar es Salaam Road Corridor, the Lusaka-Dar es Salaam Rail Corridor and the
Lusaka-Durban Road Corridor. The Nacala Corridor (Combined Rail and Truck Transport) is
advantageous over the Lusaka-Durban Port Rail Corridor in terms of cost. Regarding the
required time for the transportation from Lusaka to each port, the Lusaka-Durban Port Road
Corridor is more advantageous than the Lusaka-Nacala Port Railway-Road Corridor.
Corridor Comparison for Chipata (with Planned Interventions)
The transport cost and time of the Chipata-Nacala Corridor (Rail Transport, 1,133 km)
account for the following (see Table 5.13 for detailed comparison data):
69% of the transport cost of the Chipata-Beira Port Road Corridor (930 km)
1 day faster than the Chipata-Beira Port Road Corridor (930 km)
43% of the transport cost of the Chipata-Dar es Salaam Port Road Corridor (1,811 km)
8 days faster than the Chipata-Dar es Salaam Port Road Corridor (1,811 km)
40% of the transport cost of the Chipata-Durban Port Road Corridor (2,431 km)
4 days faster than the Chipata-Durban Port Road Corridor (2,431 km)
1 Planned interventions are listed in 5.4.2 (2), which include: i) Upgrading (axle load and speed up) of the section between Salima and Nkaya; ii) Construction of dry ports (Chipata, Lilongwe, Blantyre) for establishment of adequate transport system; iii) Capacity building for operational, management and marketing of CEAR and the Railways Directorate of the Government of Malawi; and iv) Acquisition of new locomotives and wagons.
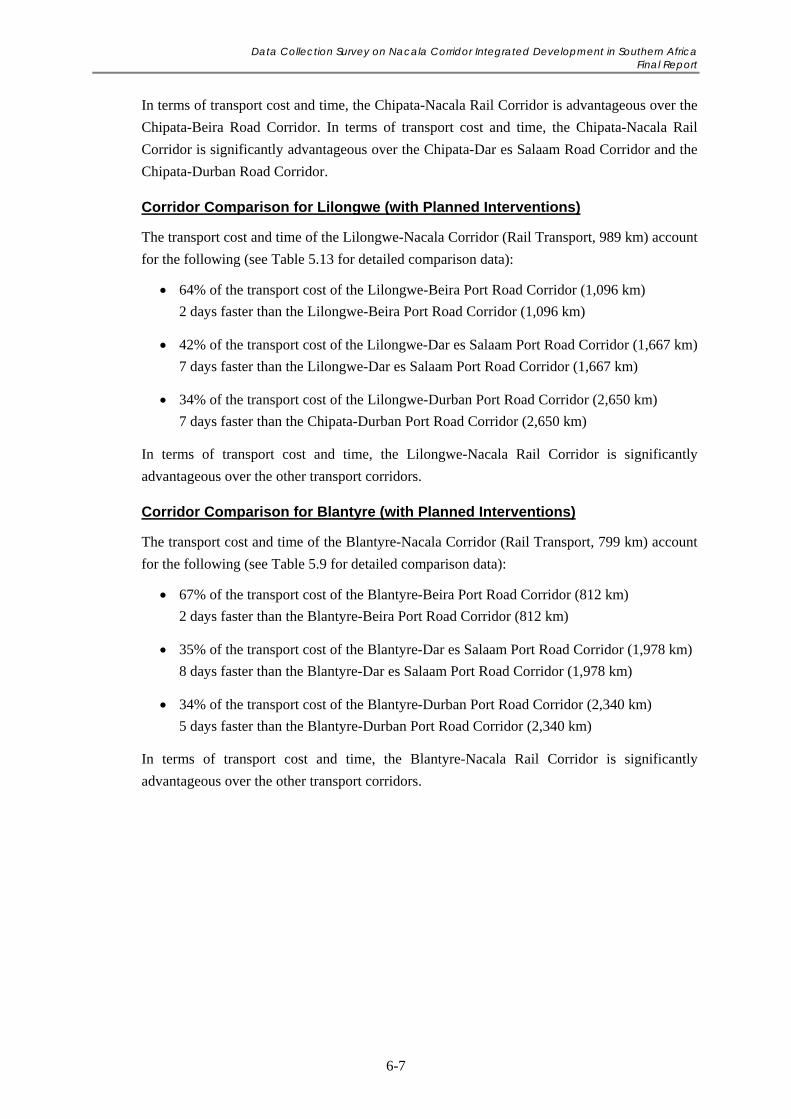
Data Collection Survey on Nacala Corridor Integrated Development in Southern Africa Final Report
6-7
In terms of transport cost and time, the Chipata-Nacala Rail Corridor is advantageous over the
Chipata-Beira Road Corridor. In terms of transport cost and time, the Chipata-Nacala Rail
Corridor is significantly advantageous over the Chipata-Dar es Salaam Road Corridor and the
Chipata-Durban Road Corridor.
Corridor Comparison for Lilongwe (with Planned Interventions)
The transport cost and time of the Lilongwe-Nacala Corridor (Rail Transport, 989 km) account
for the following (see Table 5.13 for detailed comparison data):
64% of the transport cost of the Lilongwe-Beira Port Road Corridor (1,096 km)
2 days faster than the Lilongwe-Beira Port Road Corridor (1,096 km)
42% of the transport cost of the Lilongwe-Dar es Salaam Port Road Corridor (1,667 km)
7 days faster than the Lilongwe-Dar es Salaam Port Road Corridor (1,667 km)
34% of the transport cost of the Lilongwe-Durban Port Road Corridor (2,650 km)
7 days faster than the Chipata-Durban Port Road Corridor (2,650 km)
In terms of transport cost and time, the Lilongwe-Nacala Rail Corridor is significantly
advantageous over the other transport corridors.
Corridor Comparison for Blantyre (with Planned Interventions)
The transport cost and time of the Blantyre-Nacala Corridor (Rail Transport, 799 km) account
for the following (see Table 5.9 for detailed comparison data):
67% of the transport cost of the Blantyre-Beira Port Road Corridor (812 km)
2 days faster than the Blantyre-Beira Port Road Corridor (812 km)
35% of the transport cost of the Blantyre-Dar es Salaam Port Road Corridor (1,978 km)
8 days faster than the Blantyre-Dar es Salaam Port Road Corridor (1,978 km)
34% of the transport cost of the Blantyre-Durban Port Road Corridor (2,340 km)
5 days faster than the Blantyre-Durban Port Road Corridor (2,340 km)
In terms of transport cost and time, the Blantyre-Nacala Rail Corridor is significantly
advantageous over the other transport corridors.
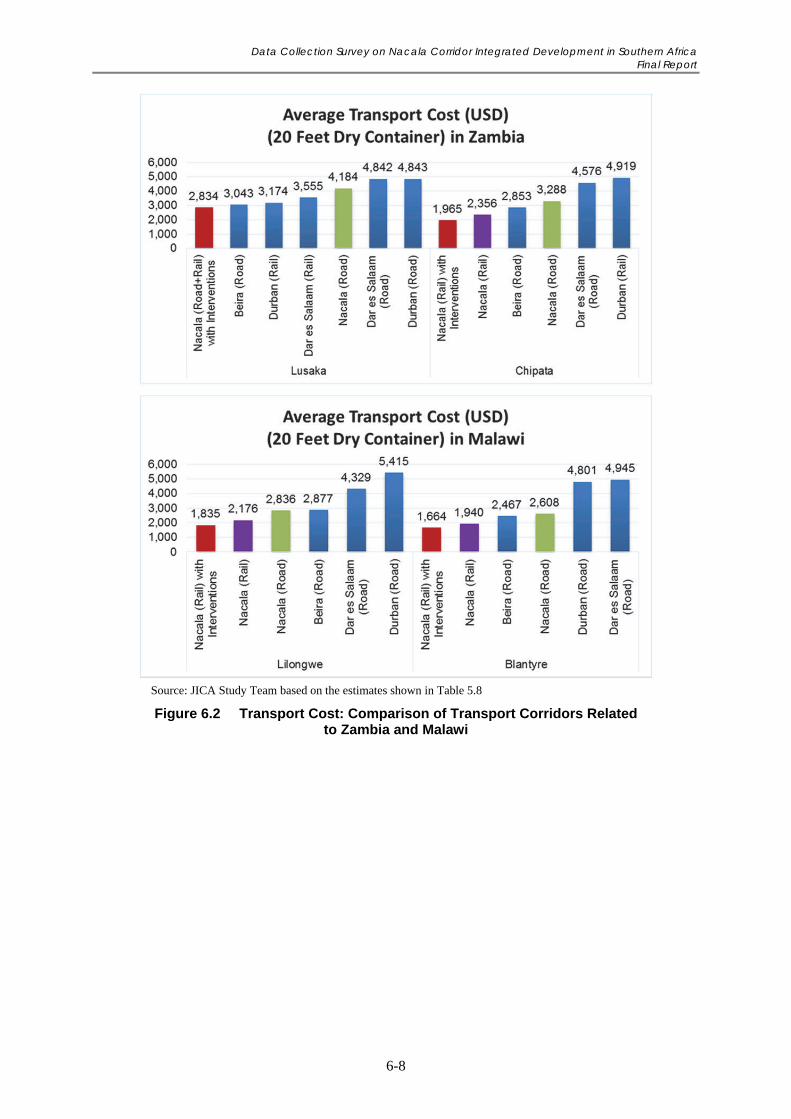
Data Collection Survey on Nacala Corridor Integrated Development in Southern Africa Final Report
6-8
Source: JICA Study Team based on the estimates shown in Table 5.8
Figure 6.2 Transport Cost: Comparison of Transport Corridors Related to Zambia and Malawi
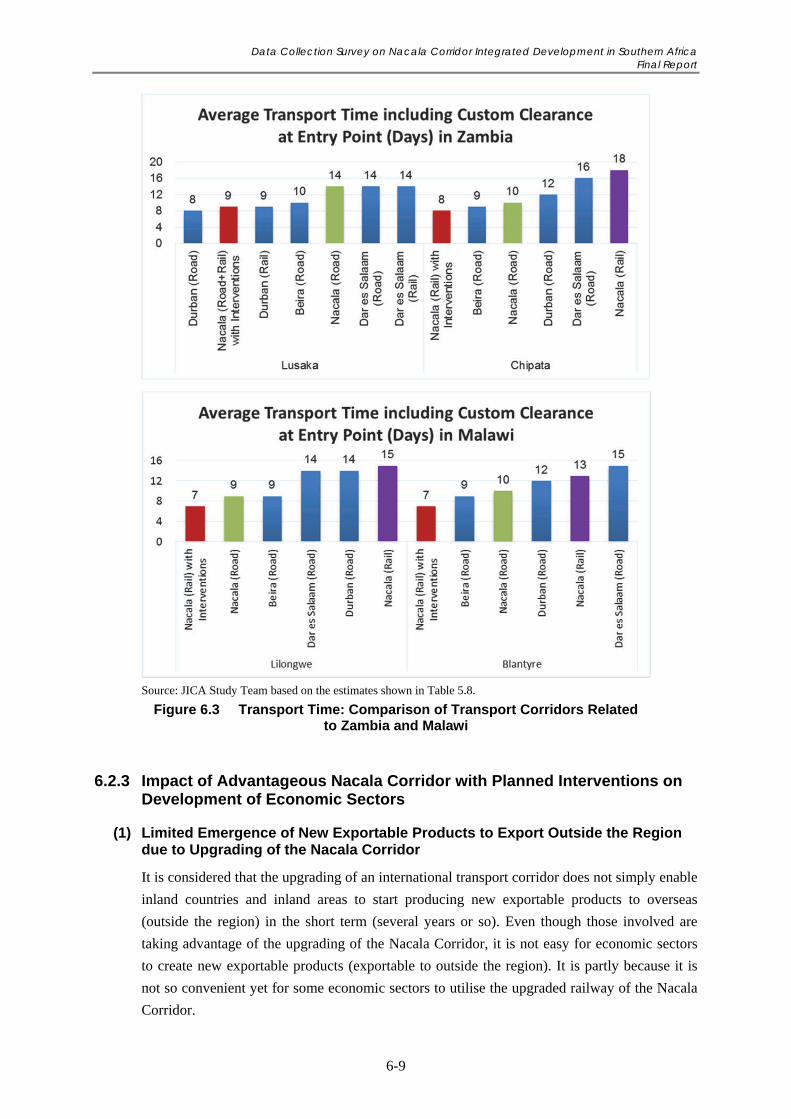
Data Collection Survey on Nacala Corridor Integrated Development in Southern Africa Final Report
6-9
Source: JICA Study Team based on the estimates shown in Table 5.8.
Figure 6.3 Transport Time: Comparison of Transport Corridors Related to Zambia and Malawi
6.2.3 Impact of Advantageous Nacala Corridor with Planned Interventions on Development of Economic Sectors
(1) Limited Emergence of New Exportable Products to Export Outside the Region due to Upgrading of the Nacala Corridor
It is considered that the upgrading of an international transport corridor does not simply enable
inland countries and inland areas to start producing new exportable products to overseas
(outside the region) in the short term (several years or so). Even though those involved are
taking advantage of the upgrading of the Nacala Corridor, it is not easy for economic sectors
to create new exportable products (exportable to outside the region). It is partly because it is
not so convenient yet for some economic sectors to utilise the upgraded railway of the Nacala
Corridor.
Data Collection Survey on Nacala Corridor Integrated Development in Southern Africa Final Report
6-10
(2) Emergence of the Users of the Railway of the Upgraded Nacala Corridor
Although it is difficult for the upgraded international transport corridor to help economic
sectors create new exportable products, the upgrading of such an international transport
corridor would enable inland countries to shift their export routes to regional and overseas
(outside the region) markets to the upgraded international transport corridor. In the case of
Malawi, the export of sugar, tobacco and tea started to utilise the upgraded Nacala Corridor
Railway from Blantyre to Nacala Port. It is partly because the export of sugar, tobacco and tea
is more sensitive to transport costs for export than other economic sectors. Moreover, newly
developing economic sectors, such as mineral exploitation of rare earth and rare metal in
Malawi, are eager to utilise the upgraded railway, in order to reduce their transport costs for
exporting extracted minerals and importing machinery and chemicals.
Additionally, in Malawi, importers of fertilisers and fuels have also responded to the
upgrading of the railway of Nacala Corridor, considering the utilisation of the corridor.
6.3 Proposed Vision for Nacala Corridor Development
6.3.1 Proposed Vision on Nacala Corridor Development for Zambia, Malawi and Mozambique
The Nacala Corridor runs through three countries namely, Mozambique, Malawi and Zambia,
from Nacala Port to Lusaka. Not only for developing the Nacala Corridor for the three
countries, but also for development of economic sectors related the Nacala Corridor, it is
necessary for the three countries to share a common vision for promoting Nacala Corridor
Development. The JICA Study Team proposes the following statement to express the common
vision:
As members of a region sharing one international transport corridor, the Nacala
Corridor, Zambia, Malawi and Mozambique are to mutually cooperate in development
and maintenance of transport corridor infrastructure (railways and roads), their
economic sectors are to compete each other targeting regional markets, and the three
countries are to maintain peace and order and socio-economically thrive and prosper
in the region.
6.3.2 Nacala Corridor Development Concept and Guiding Principles
(1) Nacala Corridor Development Concept
In order to achieve the proposed vision of Nacala Corridor Development, a concept of corridor
development is proposed as follows. Corridor development is composed of the development of
corridor transport infrastructure/services and development of economic sectors along the
transport corridor and in wider areas related to the corridor. The development of corridor
transport infrastructure and services would support the development of economic sectors. On
the other hand, the development of economic sectors would generate transport demand for the
transport corridor so that the transport corridor infrastructure and services could be developed
further and sustained. This kind of interactive relationship is critical to initiate and sustain
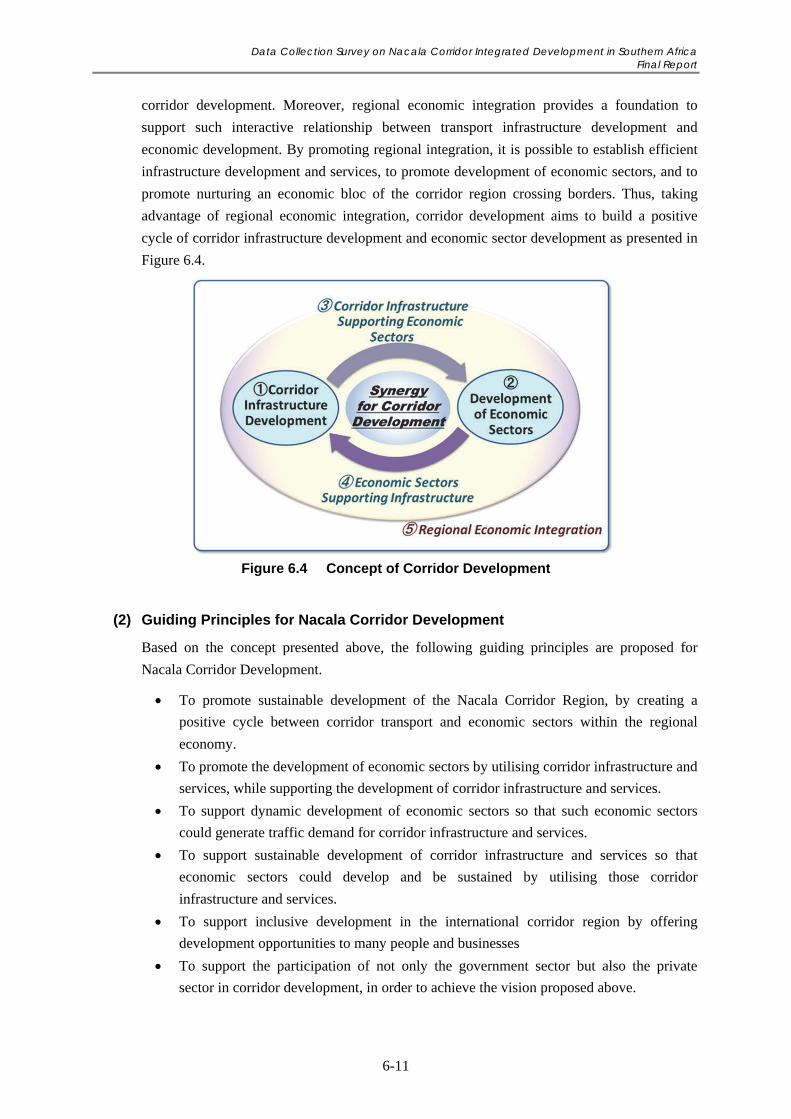
Data Collection Survey on Nacala Corridor Integrated Development in Southern Africa Final Report
6-11
corridor development. Moreover, regional economic integration provides a foundation to
support such interactive relationship between transport infrastructure development and
economic development. By promoting regional integration, it is possible to establish efficient
infrastructure development and services, to promote development of economic sectors, and to
promote nurturing an economic bloc of the corridor region crossing borders. Thus, taking
advantage of regional economic integration, corridor development aims to build a positive
cycle of corridor infrastructure development and economic sector development as presented in
Figure 6.4.
Figure 6.4 Concept of Corridor Development
(2) Guiding Principles for Nacala Corridor Development
Based on the concept presented above, the following guiding principles are proposed for
Nacala Corridor Development.
To promote sustainable development of the Nacala Corridor Region, by creating a
positive cycle between corridor transport and economic sectors within the regional
economy.
To promote the development of economic sectors by utilising corridor infrastructure and
services, while supporting the development of corridor infrastructure and services.
To support dynamic development of economic sectors so that such economic sectors
could generate traffic demand for corridor infrastructure and services.
To support sustainable development of corridor infrastructure and services so that
economic sectors could develop and be sustained by utilising those corridor
infrastructure and services.
To support inclusive development in the international corridor region by offering
development opportunities to many people and businesses
To support the participation of not only the government sector but also the private
sector in corridor development, in order to achieve the vision proposed above.
Data Collection Survey on Nacala Corridor Integrated Development in Southern Africa Final Report
6-12
To assist the transformation of the international corridor region to be a competitive,
physically and economically integrated region in Africa.
In line with the vision, the concept and guiding principles for Nacala Corridor Development,
the basic policies and strategies for development of the transport functions of Nacala Corridor
and economic sectors are discussed in the subsequent sections.
6.4 Basic Policies on the Utilisation of Nacala Corridor and Development of Nacala Corridor Transport Infrastructure and Services
6.4.1 Basic Policies on the Utilisation of Nacala Corridor
The Nacala Corridor is composed of railway and trunk roads, as well as a sea port. It depends
on the cargo types whether trunk roads, railways or both are utilised in the Nacala Corridor.
(1) Roles of Railways and Trucks in Freight Transport
In order to maximise efficiency in terms of transport costs and time, the principles described
below are followed:
The railway is more advantageous for long-distance freight transport more than 500 km.
The railway will be used as much as possible for long-distance freight transport more
than 500 km.
In the short and medium term, a multi-modal dry port is developed at the node between
road and railway, and a road is developed to access to the dry port. The operation of the
existing railway is improved and infrastructure development is implemented in the
medium term. A new railway line is developed to mutually connect the existing railway
corridors in the long term.
For freight transport less than 500 km, trucks are used as much as possible. The
environment of road transport crossing borders is improved, such as bypass roads to
ease traffic going through urban areas, road widening to facilitate passing urban and
settlement areas smoothly, and claiming lanes at the section of steep slopes, etc.
The Nacala Corridor can support importing of goods, in particular, the cost reduction of
importing of fuels and fertiliser. The impact on fuel import is significant since it affects all
sectors. The reduction on fertiliser price influences crop production, agro-processing and
livestock, the main industry in Zambia and Malawi. Thus, efforts should be made to increase
the import of fuels and fertiliser via the Nacala Corridor Railway. Malawi started the
importing of fuels and fertiliser, utilising Nacala Corridor Railway. Currently they are
transported to Blantyre. In the future, it is necessary to improve the railway operation of the
Nkaya-Lilongwe section, and to develop rolling stock and infrastructure.
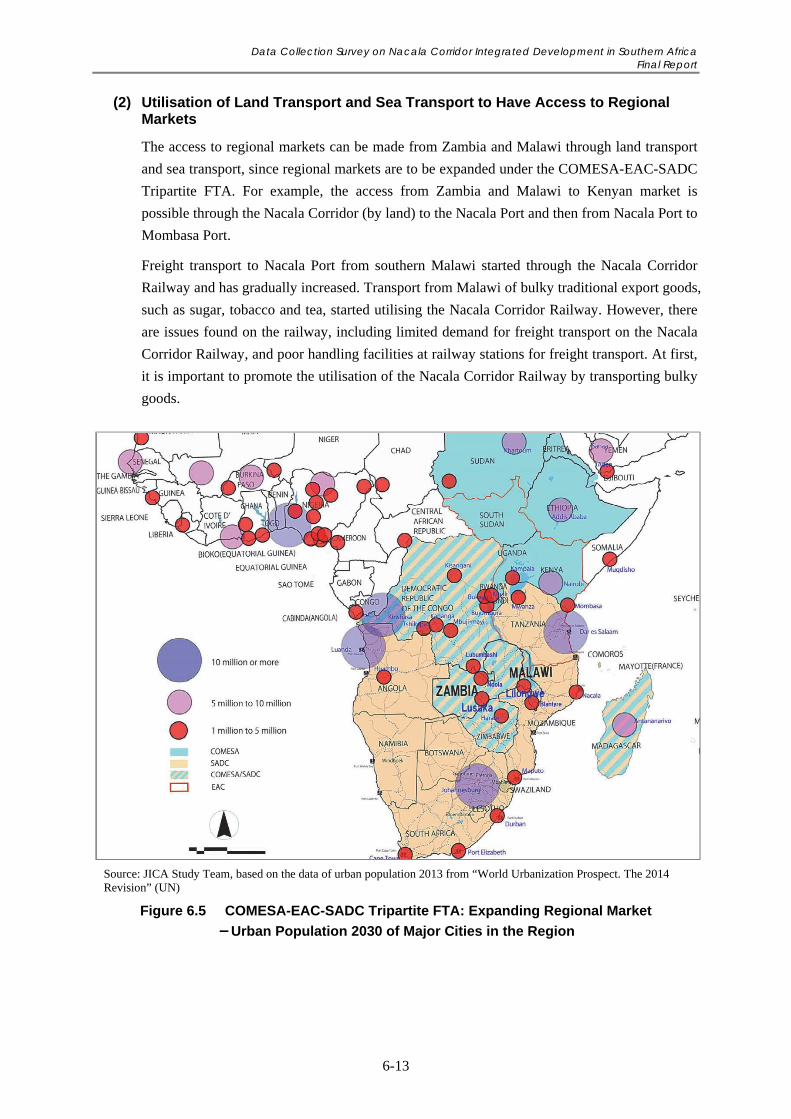
Data Collection Survey on Nacala Corridor Integrated Development in Southern Africa Final Report
6-13
(2) Utilisation of Land Transport and Sea Transport to Have Access to Regional Markets
The access to regional markets can be made from Zambia and Malawi through land transport
and sea transport, since regional markets are to be expanded under the COMESA-EAC-SADC
Tripartite FTA. For example, the access from Zambia and Malawi to Kenyan market is
possible through the Nacala Corridor (by land) to the Nacala Port and then from Nacala Port to
Mombasa Port.
Freight transport to Nacala Port from southern Malawi started through the Nacala Corridor
Railway and has gradually increased. Transport from Malawi of bulky traditional export goods,
such as sugar, tobacco and tea, started utilising the Nacala Corridor Railway. However, there
are issues found on the railway, including limited demand for freight transport on the Nacala
Corridor Railway, and poor handling facilities at railway stations for freight transport. At first,
it is important to promote the utilisation of the Nacala Corridor Railway by transporting bulky
goods.
Source: JICA Study Team, based on the data of urban population 2013 from “World Urbanization Prospect. The 2014 Revision” (UN)
Figure 6.5 COMESA-EAC-SADC Tripartite FTA: Expanding Regional Market
-Urban Population 2030 of Major Cities in the Region
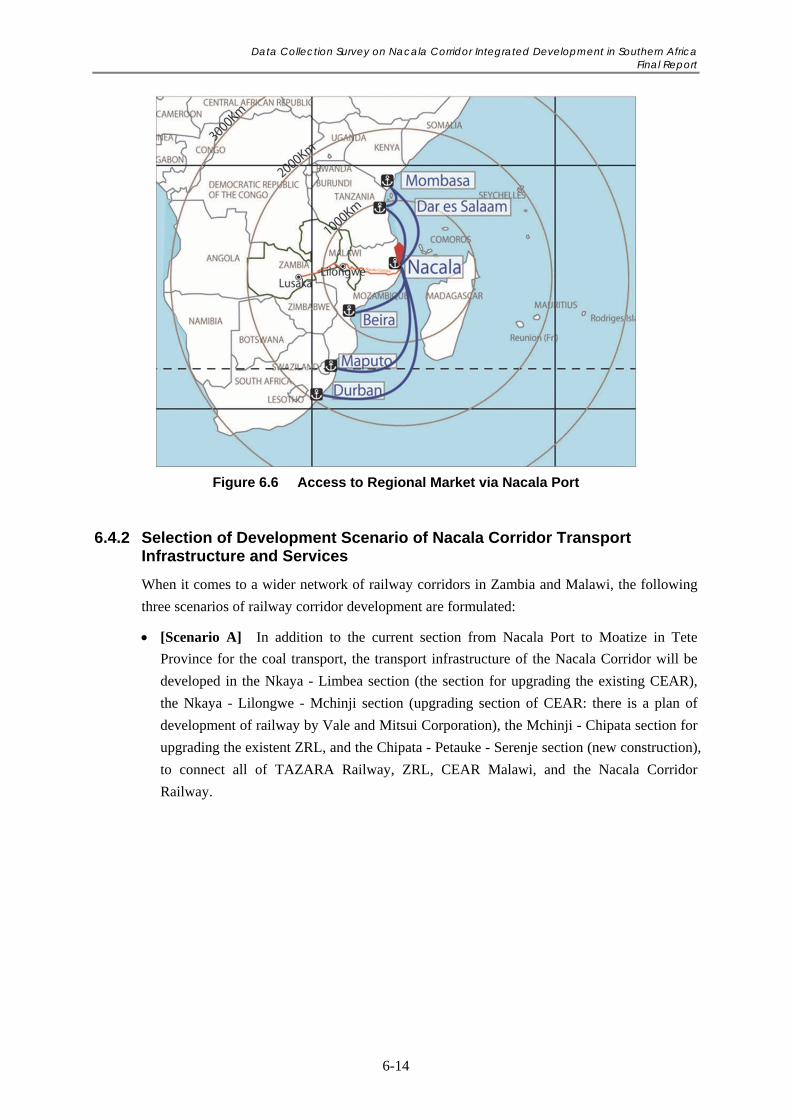
Data Collection Survey on Nacala Corridor Integrated Development in Southern Africa Final Report
6-14
Figure 6.6 Access to Regional Market via Nacala Port
6.4.2 Selection of Development Scenario of Nacala Corridor Transport Infrastructure and Services
When it comes to a wider network of railway corridors in Zambia and Malawi, the following
three scenarios of railway corridor development are formulated:
[Scenario A] In addition to the current section from Nacala Port to Moatize in Tete
Province for the coal transport, the transport infrastructure of the Nacala Corridor will be
developed in the Nkaya - Limbea section (the section for upgrading the existing CEAR),
the Nkaya - Lilongwe - Mchinji section (upgrading section of CEAR: there is a plan of
development of railway by Vale and Mitsui Corporation), the Mchinji - Chipata section for
upgrading the existent ZRL, and the Chipata - Petauke - Serenje section (new construction),
to connect all of TAZARA Railway, ZRL, CEAR Malawi, and the Nacala Corridor
Railway.
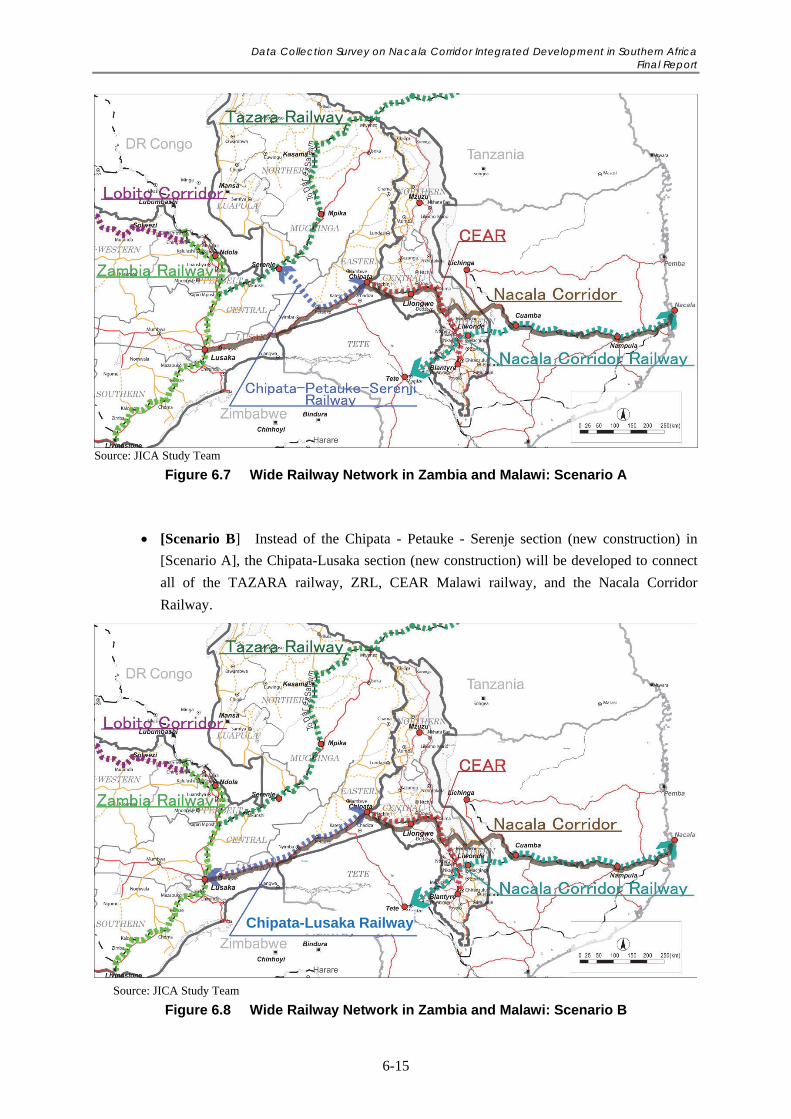
Data Collection Survey on Nacala Corridor Integrated Development in Southern Africa Final Report
6-15
Source: JICA Study Team
Figure 6.7 Wide Railway Network in Zambia and Malawi: Scenario A
[Scenario B] Instead of the Chipata - Petauke - Serenje section (new construction) in
[Scenario A], the Chipata-Lusaka section (new construction) will be developed to connect
all of the TAZARA railway, ZRL, CEAR Malawi railway, and the Nacala Corridor
Railway.
Source: JICA Study Team
Figure 6.8 Wide Railway Network in Zambia and Malawi: Scenario B
Chipata-Lusaka Railway
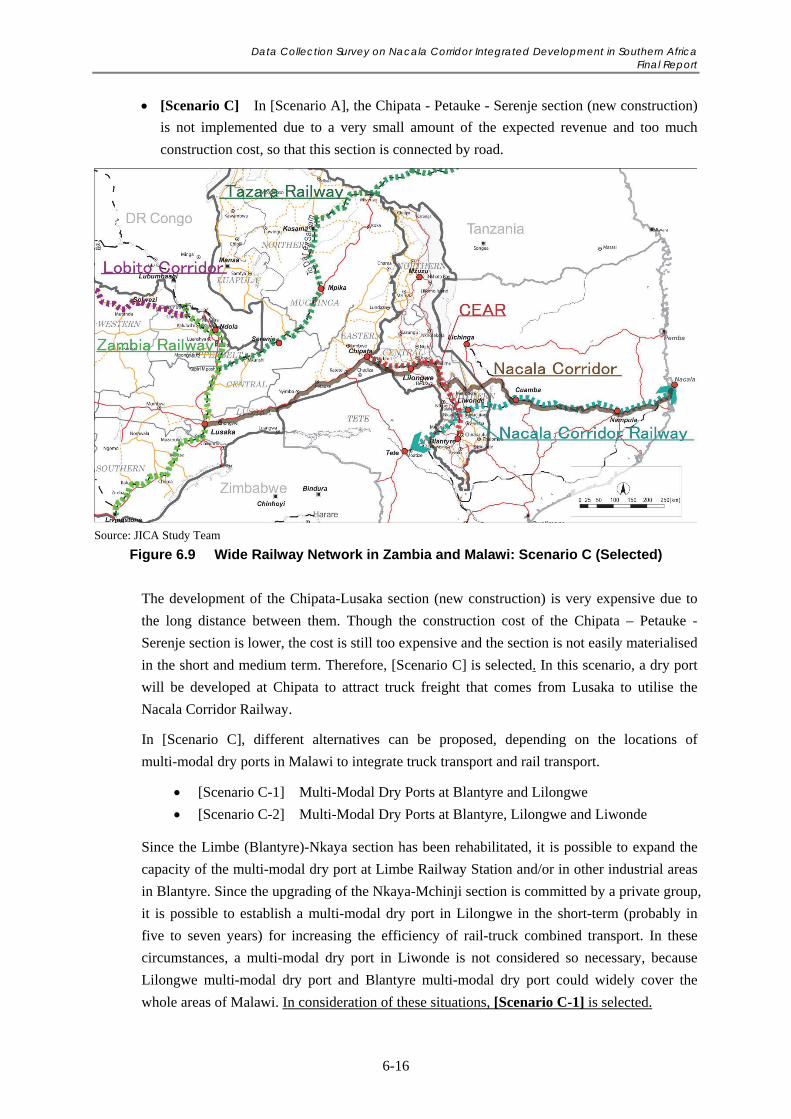
Data Collection Survey on Nacala Corridor Integrated Development in Southern Africa Final Report
6-16
[Scenario C] In [Scenario A], the Chipata - Petauke - Serenje section (new construction)
is not implemented due to a very small amount of the expected revenue and too much
construction cost, so that this section is connected by road.
Source: JICA Study Team
Figure 6.9 Wide Railway Network in Zambia and Malawi: Scenario C (Selected)
The development of the Chipata-Lusaka section (new construction) is very expensive due to
the long distance between them. Though the construction cost of the Chipata – Petauke -
Serenje section is lower, the cost is still too expensive and the section is not easily materialised
in the short and medium term. Therefore, [Scenario C] is selected. In this scenario, a dry port
will be developed at Chipata to attract truck freight that comes from Lusaka to utilise the
Nacala Corridor Railway.
In [Scenario C], different alternatives can be proposed, depending on the locations of
multi-modal dry ports in Malawi to integrate truck transport and rail transport.
[Scenario C-1] Multi-Modal Dry Ports at Blantyre and Lilongwe
[Scenario C-2] Multi-Modal Dry Ports at Blantyre, Lilongwe and Liwonde
Since the Limbe (Blantyre)-Nkaya section has been rehabilitated, it is possible to expand the
capacity of the multi-modal dry port at Limbe Railway Station and/or in other industrial areas
in Blantyre. Since the upgrading of the Nkaya-Mchinji section is committed by a private group,
it is possible to establish a multi-modal dry port in Lilongwe in the short-term (probably in
five to seven years) for increasing the efficiency of rail-truck combined transport. In these
circumstances, a multi-modal dry port in Liwonde is not considered so necessary, because
Lilongwe multi-modal dry port and Blantyre multi-modal dry port could widely cover the
whole areas of Malawi. In consideration of these situations, [Scenario C-1] is selected.
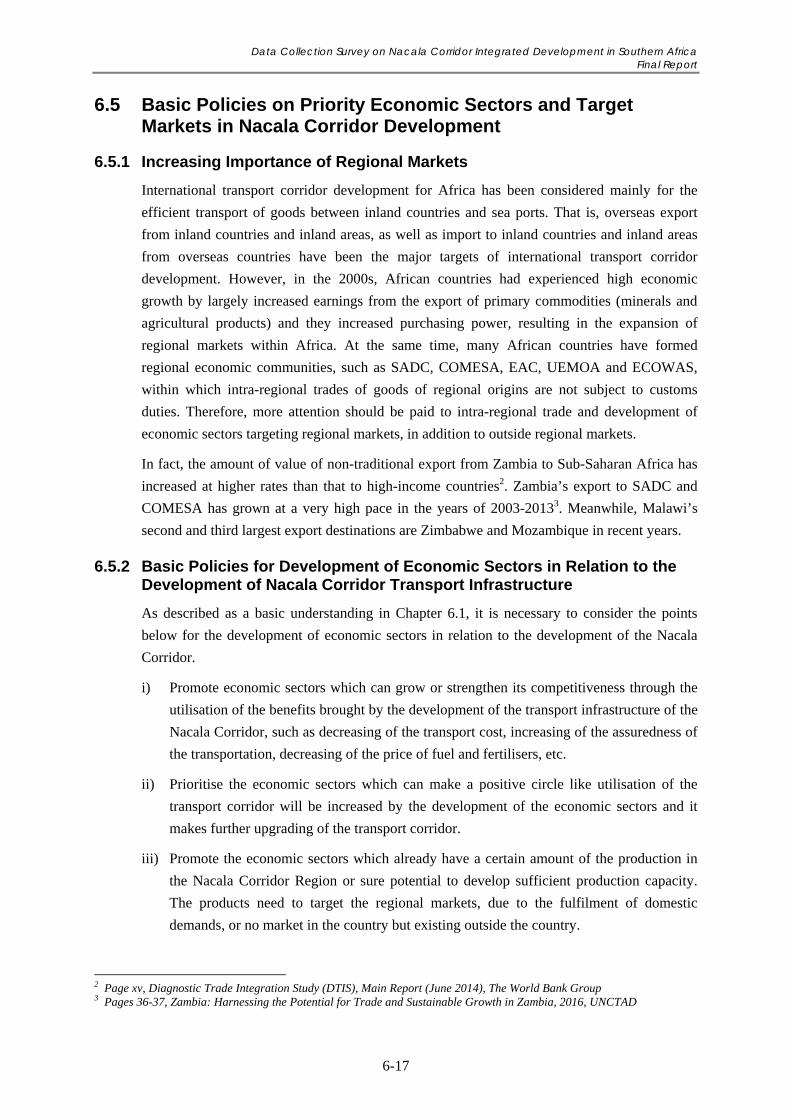
Data Collection Survey on Nacala Corridor Integrated Development in Southern Africa Final Report
6-17
6.5 Basic Policies on Priority Economic Sectors and Target Markets in Nacala Corridor Development
6.5.1 Increasing Importance of Regional Markets
International transport corridor development for Africa has been considered mainly for the
efficient transport of goods between inland countries and sea ports. That is, overseas export
from inland countries and inland areas, as well as import to inland countries and inland areas
from overseas countries have been the major targets of international transport corridor
development. However, in the 2000s, African countries had experienced high economic
growth by largely increased earnings from the export of primary commodities (minerals and
agricultural products) and they increased purchasing power, resulting in the expansion of
regional markets within Africa. At the same time, many African countries have formed
regional economic communities, such as SADC, COMESA, EAC, UEMOA and ECOWAS,
within which intra-regional trades of goods of regional origins are not subject to customs
duties. Therefore, more attention should be paid to intra-regional trade and development of
economic sectors targeting regional markets, in addition to outside regional markets.
In fact, the amount of value of non-traditional export from Zambia to Sub-Saharan Africa has
increased at higher rates than that to high-income countries2. Zambia’s export to SADC and
COMESA has grown at a very high pace in the years of 2003-20133. Meanwhile, Malawi’s
second and third largest export destinations are Zimbabwe and Mozambique in recent years.
6.5.2 Basic Policies for Development of Economic Sectors in Relation to the Development of Nacala Corridor Transport Infrastructure
As described as a basic understanding in Chapter 6.1, it is necessary to consider the points
below for the development of economic sectors in relation to the development of the Nacala
Corridor.
i) Promote economic sectors which can grow or strengthen its competitiveness through the
utilisation of the benefits brought by the development of the transport infrastructure of the
Nacala Corridor, such as decreasing of the transport cost, increasing of the assuredness of
the transportation, decreasing of the price of fuel and fertilisers, etc.
ii) Prioritise the economic sectors which can make a positive circle like utilisation of the
transport corridor will be increased by the development of the economic sectors and it
makes further upgrading of the transport corridor.
iii) Promote the economic sectors which already have a certain amount of the production in
the Nacala Corridor Region or sure potential to develop sufficient production capacity.
The products need to target the regional markets, due to the fulfilment of domestic
demands, or no market in the country but existing outside the country.
2 Page xv, Diagnostic Trade Integration Study (DTIS), Main Report (June 2014), The World Bank Group 3 Pages 36-37, Zambia: Harnessing the Potential for Trade and Sustainable Growth in Zambia, 2016, UNCTAD
Data Collection Survey on Nacala Corridor Integrated Development in Southern Africa Final Report
6-18
Therefore, at first, it is necessary to promote the development of not only economic sectors
exporting to overseas markets (outside regional markets) but also economic sectors for
regional markets as mentioned above, by making full use of the potential and strengths of each
country. To that end, it is important to strengthen the implementation of regional economic
integration. It is also necessary to coordinate policies for export promotion of agricultural
products in each country. At the later stages, it might be possible to create exportable products
to international markets out of the products targeted regional markets.
In Malawi and Zambia, expansion of the transport demand for the Nacala Corridor (rail and
road) is indispensable for economic sector development. Therefore, measures considering the
supply chain are needed to increase the production of these economic products as well as to
construct collection and export systems of the products.
6.5.3 Priority Economic Sectors to be Promoted in Relation to Nacala Corridor Transport Infrastructure Development
Priority economic sectors identified in Zambia and Malawi targeting regional markets include
agriculture including livestock, and agricultural processing. In addition, Zambia has potential
economic sub-sectors, such as the production of clinker/cement and synthetic detergent, while
Malawi will be able to produce certain rare earth and rare metal. Coal from Mozambique and
Zambia are directed for export to regional markets.
Therefore, the target sectors to be prioritised for Nacala Corridor Development in Zambia and
Malawi from the analyses in previous Chapters are as follows:
Crop production,
Livestock production,
Agro-processing,
Manufacturing (Clinker/cement and synthetic detergent), and
Mining (Rare earth and rare metal).
The selected sectors are oriented toward export mainly to regional markets using the transport
infrastructure and facilities of the Nacala Corridor. Interventions for the development of the
priority sectors are required to improve the access to markets and finance, the availability of
inputs, provision of information and business services, and capacity building.
Particularly, since the agricultural production in Zambia and Malawi is mainly carried out by
small scale farmers, it is necessary to take proactive measures for the increase of transport
demand, such as organising small scale farmers for aggregating their agricultural products and
shipping collectively. Until now, a variety of efforts and projects for organising farmers’
associations and cooperatives have been attempted in the government programmes and
assistance projects of development partners. However, it cannot be said that they are very
successful. In this timing when the development of transport infrastructure (railway and road)
of the Nacala Corridor has progressed, further efforts are to be made at export targeting
regional markets of neighbouring countries.
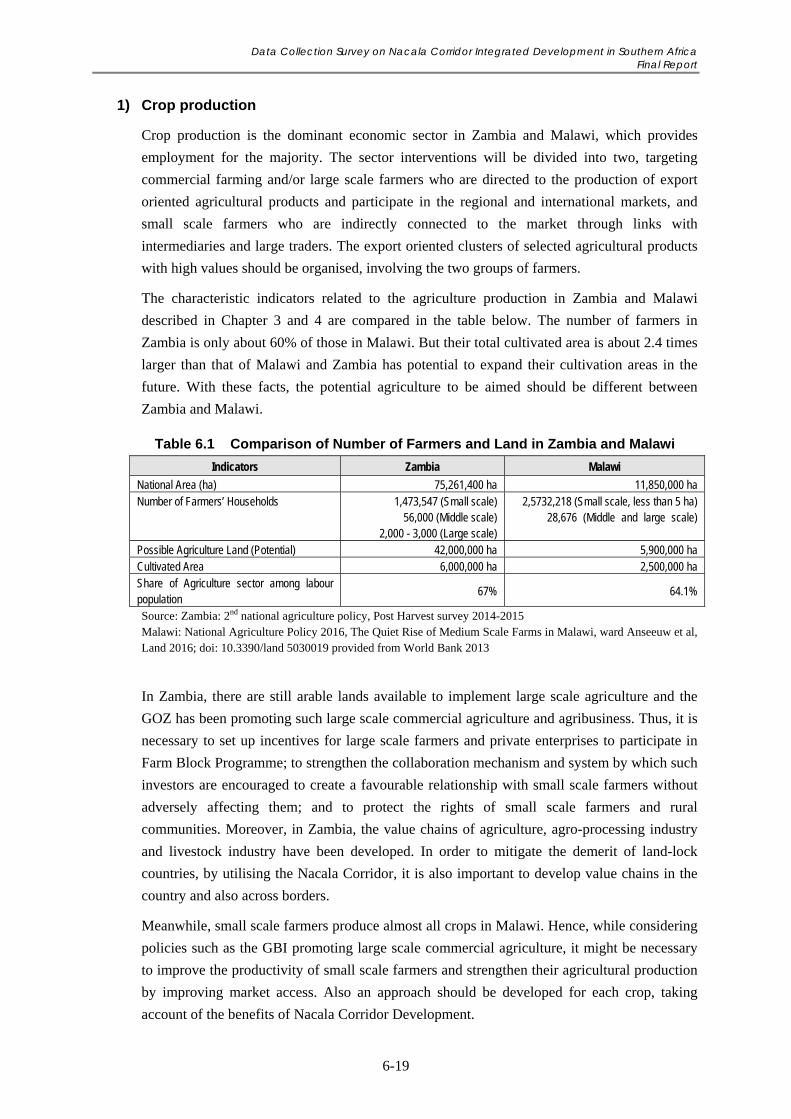
Data Collection Survey on Nacala Corridor Integrated Development in Southern Africa Final Report
6-19
1) Crop production
Crop production is the dominant economic sector in Zambia and Malawi, which provides
employment for the majority. The sector interventions will be divided into two, targeting
commercial farming and/or large scale farmers who are directed to the production of export
oriented agricultural products and participate in the regional and international markets, and
small scale farmers who are indirectly connected to the market through links with
intermediaries and large traders. The export oriented clusters of selected agricultural products
with high values should be organised, involving the two groups of farmers.
The characteristic indicators related to the agriculture production in Zambia and Malawi
described in Chapter 3 and 4 are compared in the table below. The number of farmers in
Zambia is only about 60% of those in Malawi. But their total cultivated area is about 2.4 times
larger than that of Malawi and Zambia has potential to expand their cultivation areas in the
future. With these facts, the potential agriculture to be aimed should be different between
Zambia and Malawi.
Table 6.1 Comparison of Number of Farmers and Land in Zambia and Malawi
Indicators Zambia Malawi
National Area (ha) 75,261,400 ha 11,850,000 ha Number of Farmers’ Households 1,473,547 (Small scale)
56,000 (Middle scale) 2,000 - 3,000 (Large scale)
2,5732,218 (Small scale, less than 5 ha) 28,676 (Middle and large scale)
Possible Agriculture Land (Potential) 42,000,000 ha 5,900,000 ha Cultivated Area 6,000,000 ha 2,500,000 ha Share of Agriculture sector among labour population
67% 64.1%
Source: Zambia: 2nd national agriculture policy, Post Harvest survey 2014-2015 Malawi: National Agriculture Policy 2016, The Quiet Rise of Medium Scale Farms in Malawi, ward Anseeuw et al, Land 2016; doi: 10.3390/land 5030019 provided from World Bank 2013
In Zambia, there are still arable lands available to implement large scale agriculture and the
GOZ has been promoting such large scale commercial agriculture and agribusiness. Thus, it is
necessary to set up incentives for large scale farmers and private enterprises to participate in
Farm Block Programme; to strengthen the collaboration mechanism and system by which such
investors are encouraged to create a favourable relationship with small scale farmers without
adversely affecting them; and to protect the rights of small scale farmers and rural
communities. Moreover, in Zambia, the value chains of agriculture, agro-processing industry
and livestock industry have been developed. In order to mitigate the demerit of land-lock
countries, by utilising the Nacala Corridor, it is also important to develop value chains in the
country and also across borders.
Meanwhile, small scale farmers produce almost all crops in Malawi. Hence, while considering
policies such as the GBI promoting large scale commercial agriculture, it might be necessary
to improve the productivity of small scale farmers and strengthen their agricultural production
by improving market access. Also an approach should be developed for each crop, taking
account of the benefits of Nacala Corridor Development.
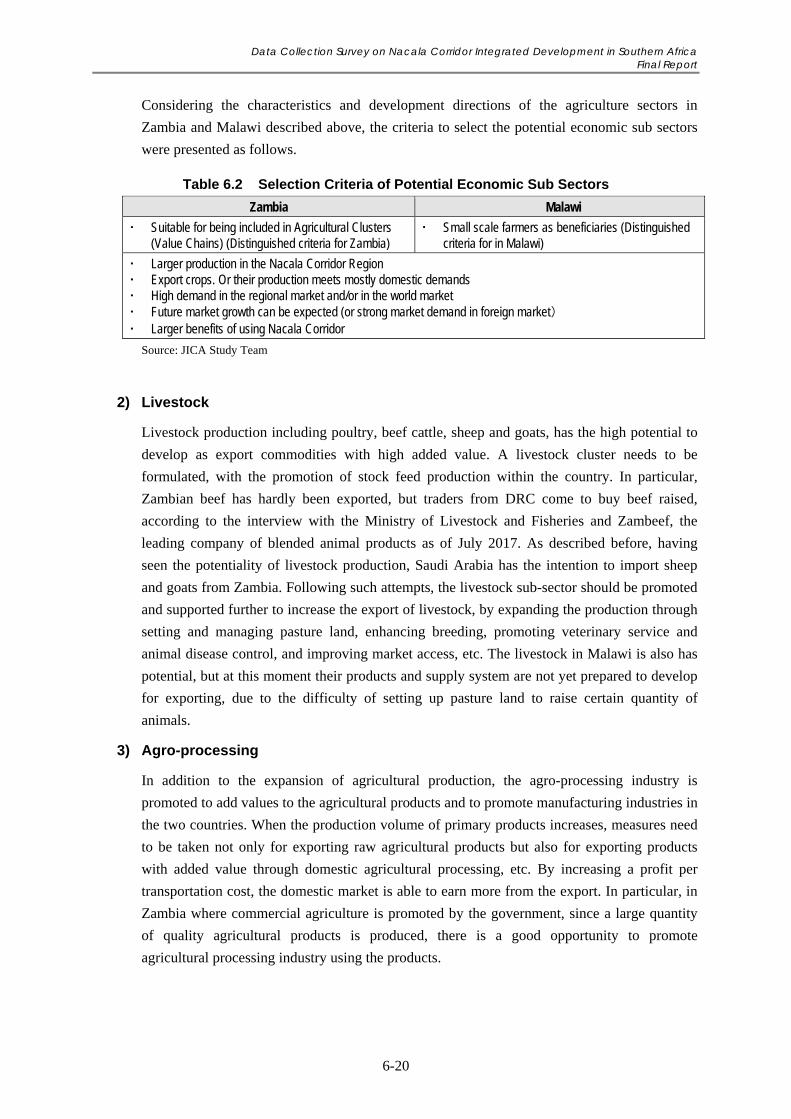
Data Collection Survey on Nacala Corridor Integrated Development in Southern Africa Final Report
6-20
Considering the characteristics and development directions of the agriculture sectors in
Zambia and Malawi described above, the criteria to select the potential economic sub sectors
were presented as follows.
Table 6.2 Selection Criteria of Potential Economic Sub Sectors
Zambia Malawi
Suitable for being included in Agricultural Clusters (Value Chains) (Distinguished criteria for Zambia)
Small scale farmers as beneficiaries (Distinguished criteria for in Malawi)
Larger production in the Nacala Corridor Region Export crops. Or their production meets mostly domestic demands High demand in the regional market and/or in the world market Future market growth can be expected (or strong market demand in foreign market) Larger benefits of using Nacala Corridor
Source: JICA Study Team
2) Livestock
Livestock production including poultry, beef cattle, sheep and goats, has the high potential to
develop as export commodities with high added value. A livestock cluster needs to be
formulated, with the promotion of stock feed production within the country. In particular,
Zambian beef has hardly been exported, but traders from DRC come to buy beef raised,
according to the interview with the Ministry of Livestock and Fisheries and Zambeef, the
leading company of blended animal products as of July 2017. As described before, having
seen the potentiality of livestock production, Saudi Arabia has the intention to import sheep
and goats from Zambia. Following such attempts, the livestock sub-sector should be promoted
and supported further to increase the export of livestock, by expanding the production through
setting and managing pasture land, enhancing breeding, promoting veterinary service and
animal disease control, and improving market access, etc. The livestock in Malawi is also has
potential, but at this moment their products and supply system are not yet prepared to develop
for exporting, due to the difficulty of setting up pasture land to raise certain quantity of
animals.
3) Agro-processing
In addition to the expansion of agricultural production, the agro-processing industry is
promoted to add values to the agricultural products and to promote manufacturing industries in
the two countries. When the production volume of primary products increases, measures need
to be taken not only for exporting raw agricultural products but also for exporting products
with added value through domestic agricultural processing, etc. By increasing a profit per
transportation cost, the domestic market is able to earn more from the export. In particular, in
Zambia where commercial agriculture is promoted by the government, since a large quantity
of quality agricultural products is produced, there is a good opportunity to promote
agricultural processing industry using the products.
Data Collection Survey on Nacala Corridor Integrated Development in Southern Africa Final Report
6-21
6.6 Strategies and Four Stages for Development of Nacala Corridor Transport Infrastructure and Services
6.6.1 1st Stage (Present Situation) and 2nd Stage of Development of Nacala Corridor Transport Infrastructure and Services
The 1st Stage of development of the transport infrastructure of the Nacala Corridor is the
present situation. The 2nd Stage of development of the transport infrastructure of the corridor is
planned with a commitment of the private sector, Vale and Mitsui, which announced an
upgrading plan of the railway line in August 2017.
1st Stage (Present Situation) Development of the Nacala Corridor: Upgraded Railway
between Nacala and Moatize, together with Rehabilitated Railway Section between Limbe and
Nkaya, and Not Rehabilitated Railway Section between Nkaya and Chipata through Mchinji
2nd Stage Development of the Nacala Corridor: Upgraded Railway between Nacala and
Chipata, Combining of Upgraded Railway between Nacala and Moatize, Rehabilitated
Railway Section between Limbe and Nkaya, and Upgraded Railway Section between Nkaya
and Chipata through Mchinji
Because of this upgrading of the rail infrastructure and locomotives, as well as improved
operation, the Nacala Corridor would become significantly advantageous over the other
transport corridors for Chipata, Lilongwe and Blantyre in terms of transport cost and time. In
the case of Lusaka, the Nacala Corridor is not so advantageous over the Lusaka-Beira Road
Corridor because a multi-modal dry port has not been established yet at this stage of
development.
6.6.2 3rd Stage and 4th Stage of Development of Nacala Corridor Transport Infrastructure and Services
3rd Stage Development of the Nacala Corridor: Combined Rail Transport and Truck
Transport between Nacala and Lusaka through Chipata, based on Upgraded Railway between
Nacala and Chipata together with Establishment of Multi-Modal Dry Ports in Blantyre,
Lilongwe and Chipata, Combining of Truck Transport between Lusaka and Chipata, Upgraded
Railway between Nacala and Moatize, Rehabilitated Railway Section between Limbe and
Nkaya, and Upgraded Railway Section between Nkaya and Chipata through Mchinji
In order to achieve an efficient combined rail transport and truck transport between Lusaka
and Nacala on the Nacala Corridor, it is necessary to establish a multi-modal dry port at
Chipata Railway Station. The multi-modal dry port has the following facilities to integrate rail
transport and truck transport:
Cargo railway station Machine to handle cargo for loading and off-loading to cargo trains Warehouses Truck parking lots Customs office Freight forwarders offices
Data Collection Survey on Nacala Corridor Integrated Development in Southern Africa Final Report
6-22
By establishing and operating the multi-modal dry port, the combined rail and truck transport
on the Nacala Corridor could reduce the transport costs so that the Nacala Corridor could
compete with the Lusaka-Beira Road Corridor. It is estimated the transport cost for the
Lusaka-Nacala Rail Corridor is 91% of that for the Lusaka-Beira Road Corridor. This
competition between the Lusaka-Nacala Corridor combining rail and truck transport and the
Lusaka-Beira Road Corridor could reduce the transport costs for importing fuel and chemical
fertiliser.
For the purpose of securing the road connection between Lusaka and Chipata on the Nacala
Corridor, it is necessary to replace the Luangwa Bridge with a new bridge.
In addition, the establishment of a multi-modal dry port in Lusaka is also very effective to
improve the efficiency of integrating truck transport and rail transport.
4th Stage Development of the Nacala Corridor and Other Transport Corridors:
Revitalized Railway Utilization of Other Corridors, due to Emerging Competition with
Combined Railway Transport and Truck Transport between Nacala and Lusaka
It is considered that the use of the railway would be activated in other transport corridors
related to Zambia as a result of the competition among the corridors including the Nacala
Corridor (combined rail and truck transport). As a result, railways would be available in
several transport corridors in the medium to long terms. Furthermore, corridor transport cost
will be reduced for Zambia.
These activated rail corridors would bring benefits to the entire Zambian economy and
agricultural sector in the form of the reduction in import prices of fuel and chemical fertiliser.
Until now various products in Zambia are considered less competitive in export markets
except copper. However, it seems possible that Zambian economic sectors would have a
competitive edge in the export market (especially in the regional markets) due to the reduced
prices of fuel and chemical fertiliser.
Regarding exports from Zambia to regional markets, it is not always necessary to use railway
corridors since the truck transport is more efficient when the freight transport distance is less
than 500 km. Therefore, the Nacala Corridor and other railway corridors do not directly boost
the development of economic sectors. This impact is an indirect boost to the development of
economic sectors. On the other hand, within the regional market, the Lusaka-Dar es Salaam
Port Rail Corridor and the Lusaka-Durban Railway Corridor, which will be activated by the
development of the Lusaka-Nacala Rail-Truck combined transport corridor, would also
contribute to coastal countries and coastal areas that can be accessed via Nacala Port or Beira
Port.
Data Collection Survey on Nacala Corridor Integrated Development in Southern Africa Final Report
6-23
6.7 Zambia’s Strategies for Promoting Development of Potential Economic Sectors in Relation to Nacala Corridor Development
6.7.1 Zambia’s Strategies for Promoting Development of Potential Economic Sectors by Taking Advantage of Upgraded Nacala Corridor
In accordance with the different development stages of transport infrastructure of the Nacala
Corridor, different strategies are proposed for promoting the development of potential
economic sectors in Zambia as follows:
1st Stage (Present Situation) of the Development of Nacala Corridor: Upgraded Railway
between Nacala and Moatize, together with Rehabilitated Railway Section between Limbe and
Nkaya, and Not Rehabilitated Railway Section between Nkaya and Chipata through Mchinji.
At this stage, the Nacala Corridor (combined rail and truck transport) between Lusaka and
Nacala is not advantageous at all in comparison with the Lusaka-Beira Road Corridor. The
Lusaka-Durban Road Corridor is very advantageous over the Lusaka-Nacala Road-Rail
Corridor in terms of transport time. Therefore, the present situation of the Nacala Corridor
cannot provide any significant impact on the Lusaka Area.
On the other hand, at this stage, the Chipata-Nacala Rail Corridor is advantageous over the
Chipata-Beira Road Corridor in terms of transport cost. However, in terms of transport time
and cargo security, the Chipata-Nacala Rail Corridor is not advantageous over the
Chipata-Beira Road Corridor at all. Therefore, it is not considered that the Chipata-Nacala
Rail Corridor have a good impact on Eastern Province’s economy.
Although the advantages of Nacala Corridor could not be enjoyed in Lusaka and Chipata in
this stage, it is important to initiate activities for economic sector development which will
serve as a stepping stone to development in the next stage. Those initiatives could include the
preparation of policies on trade and large scale commercial agricultural development with
special consideration for small scale farmers as well as actions for trade facilitation.
2nd Stage of the Development of Nacala Corridor: Upgraded Railway between Nacala and
Chipata, Combining Upgraded Railway between Nacala and Moatize, Rehabilitated Railway
Section between Limbe and Nkaya, and Upgraded Railway Section between Nkaya and
Chipata through Mchinji.
Since a group of private firms (Vale and Mitsui) is to upgrade the Nkaya-Mchinji rail section,
the train operation and security management of cargoes is expected to be largelyimproved.
This upgrading of rail sections and improvement of cargo train on the Nacala Corridor
between Chipata and Nacala could create advantages for the Nacala Corridor. As a result, it is
possible for the economic sectors in Eastern Province to utilise the Nacala Rail Corridor
between Chipata and Nacala for importing chemical fertiliser and fuel. At the same time, it is
possible for economic sectors to utilise the Nacala Corridor Railway between Chipata and
Nacala in order to export their products not only to neighbouring countries, but also to Kenya
and Ethiopia through Nacala Port.
Data Collection Survey on Nacala Corridor Integrated Development in Southern Africa Final Report
6-24
However, at the moment, Eastern Province’s agricultural production tends to be mostly
conducted by small scale farmers and it is not so oriented to export to regional markets.
Therefore, necessary support should be provided to small scale farmers who are oriented
toward export for the expansion of their agricultural production.
3rd Stage of the Development of Nacala Corridor: Combined Rail Transport and Truck
Transport between Nacala and Lusaka through Chipata, based on the Upgraded Railway
between Nacala and Chipata together with Establishment of Multi-Modal Dry Ports in
Blantyre, Lilongwe and Chipata, Integrating Truck Transport between Lusaka and Chipata,
Upgraded Railway between Nacala and Moatize, Rehabilitated Railway Section between
Limbe and Nkaya, and Upgraded Railway Section between Nkaya and Chipata through
Mchinji.
At this stage, a multi-modal dry port is established in Chipata in order to improve the
efficiency of connecting rail transport and truck transport. The combined rail-truck transport
between Lusaka and Nacala would create some advantages for the Nacala Corridor over the
Lusaka-Beira Road Corridor. Because of this competitive relationship between the Nacala
Corridor (rail-truck combined transport) and the Beira Road Corridor, corridor transport cost
would be reduced for Lusaka and Chipata.
Because of the upgraded rail-truck combined transport, transport costs of importing of fuel and
chemical fertiliser would be reduced. This could have a good impact on the economy of
Eastern Province and Lusaka Area.
In Lusaka and its surrounding areas, and Eastern Province, it is important to strengthen export
oriented agriculture production system mainly focusing on small scale farmers in the region
and to attract more private investments, in order to expand the agriculture production for
exporting to regional markets, while paying attention to the protection of the rights of small
scale farmers and rural community.
On the other hand, at this stage, the Chipata-Nacala Rail Corridor is slightly advantageous
over the Chipata-Beira Road Corridor and other corridors. This situation could create a
positive impact on the development of economic sectors for exporting their products to
neighbouring countries and other regional markets. Because of the reduced prices of imported
fuel and chemical fertiliser and reduced cost for corridor rail transport, it is necessary to
support the small scale farmers of Eastern Province in making an effort at expanding their
production and their export to regional markets.
4th Stage of the Development of Nacala Corridor and Other Transport Corridors:
Revitalised Railway Utilisation of Other Corridors due to the Emerging Competition between
Combined Railway Transport and Truck Transport between Nacala and Lusaka and other
corridors.
At this stage, it is expected to increase the utilisation of railways in transport corridors. As a
result of this revitalised railway situation of transport corridors, corridor transport costs would
be reduced not only for the Nacala Corridor Railway, but also for the other rail corridors. This
Data Collection Survey on Nacala Corridor Integrated Development in Southern Africa Final Report
6-25
situation could create a positive impact on the whole economy of Zambia and the agriculture
sector in particular.
Because of the positive impact on the Zambian economy and agricultural sector, it is possible
and easier for the economic sectors to make an effort at expanding their production and export
to regional markets. The potential products or economic sub-sectors identified in the latter
sections should be targeted for export promotion to regional markets.
6.7.2 Zambia’s Potential Economic Sectors Related to Nacala Corridor Development
Based on the expected improvement of the situation of transport corridors in the medium to
long term, it is necessary to foster and promote the growth of economic sectors for the
regional markets from now on. The potential economic sub-sectors mentioned in 6.5.3 were
selected considering following points:
It has growth potential due to their targeting the growing regional markets.
The growth of those potential economic sub-sectors would be accelerated by prospective
price reduction of fuels and chemical fertilisers due to the impact of Nacala Corridor
Development.
They have already been produced in Zambia, the domestic market is almost satisfied, and
the products of which production was expanded have competitiveness in regional
markets.
The competitiveness of the products would be sustained in future by expansion of the
production, because of the growth of regional markets and the "free trade areas or
customs union within the region" towards implementation (difference tariff rate between
outside region and within the region is about 20%).
As described in Section 6.5.3, the potential economic sectors are crop production,
agro-processing, livestock and others in Zambia. Considering the characteristics of Zambia’s
agriculture also written in the same section, the potential economic sub-sectors in Zambia
were carefully selected from the aforementioned potential economic sectors in accordance
with the following criteria.
Table 6.3 Selection Criteria of Potential Economic Sub Sectors in Zambia
Suitable for being included in Agricultural Clusters (Value Chains) (Distinguished criterion for Zambia)
Larger production in the Nacala Corridor Region Export crops. Or their production meets domestic demands High demand in the regional market Future market growth can be expected (or strong market demand in foreign market) Larger benefits of using the Nacala Corridor
Source: JICA Study Team
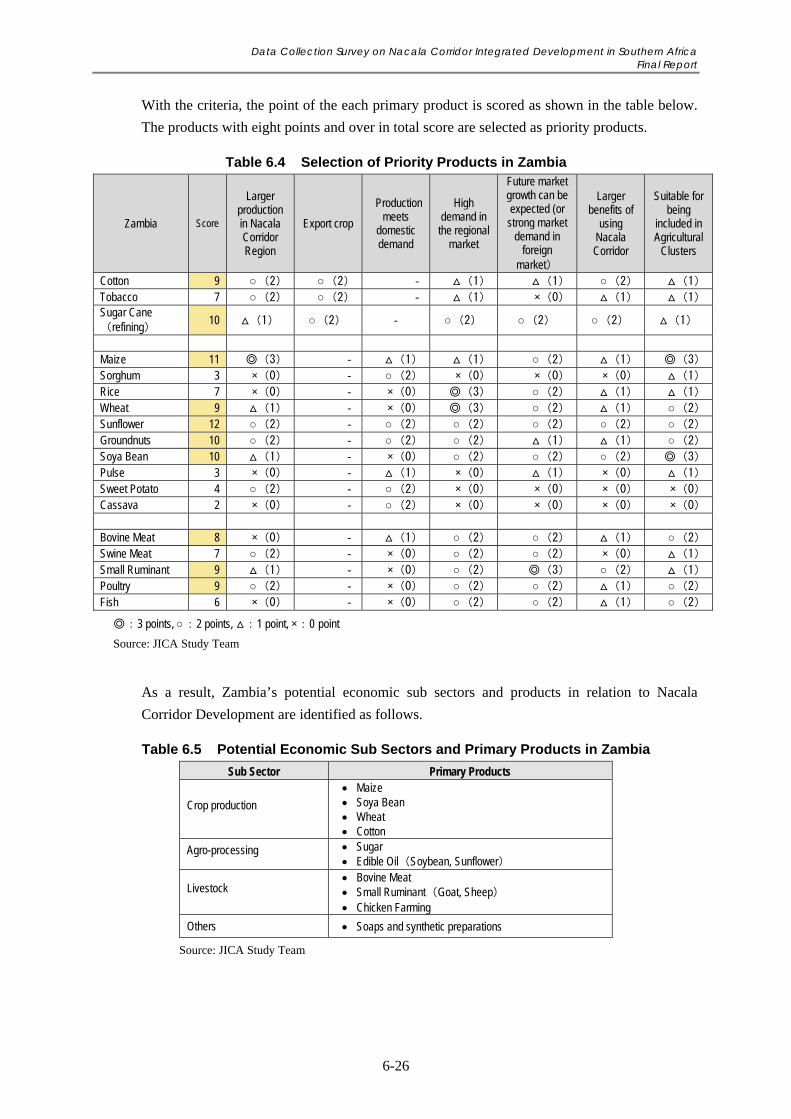
Data Collection Survey on Nacala Corridor Integrated Development in Southern Africa Final Report
6-26
With the criteria, the point of the each primary product is scored as shown in the table below.
The products with eight points and over in total score are selected as priority products.
Table 6.4 Selection of Priority Products in Zambia
Zambia Score
Larger production in Nacala Corridor Region
Export crop
Production meets
domestic demand
High demand in the regional
market
Future market growth can be expected (or strong market
demand in foreign
market)
Larger benefits of
using Nacala Corridor
Suitable for being
included in Agricultural
Clusters
Cotton 9 ○(2) ○(2) ‐ (1) (1) ○(2) (1)
Tobacco 7 ○(2) ○(2) ‐ (1) ×(0) (1) (1)
Sugar Cane(refining)
10 (1) ○(2) ‐ ○(2) ○(2) ○(2) (1)
Maize 11 ◎(3) ‐ (1) (1) ○(2) (1) ◎(3)
Sorghum 3 ×(0) ‐ ○(2) ×(0) ×(0) ×(0) (1)
Rice 7 ×(0) ‐ ×(0) ◎(3) ○(2) (1) (1)
Wheat 9 (1) ‐ ×(0) ◎(3) ○(2) (1) ○(2)
Sunflower 12 ○(2) ‐ ○(2) ○(2) ○(2) ○(2) ○(2)
Groundnuts 10 ○(2) ‐ ○(2) ○(2) (1) (1) ○(2)
Soya Bean 10 (1) ‐ ×(0) ○(2) ○(2) ○(2) ◎(3)
Pulse 3 ×(0) ‐ (1) ×(0) (1) ×(0) (1)
Sweet Potato 4 ○(2) ‐ ○(2) ×(0) ×(0) ×(0) ×(0)
Cassava 2 ×(0) ‐ ○(2) ×(0) ×(0) ×(0) ×(0)
Bovine Meat 8 ×(0) ‐ (1) ○(2) ○(2) (1) ○(2)
Swine Meat 7 ○(2) ‐ ×(0) ○(2) ○(2) ×(0) (1)
Small Ruminant 9 (1) ‐ ×(0) ○(2) ◎(3) ○(2) (1)
Poultry 9 ○(2) ‐ ×(0) ○(2) ○(2) (1) ○(2)
Fish 6 ×(0) ‐ ×(0) ○(2) ○(2) (1) ○(2)
◎:3 points, ○:2 points, :1 point, ×:0 point
Source: JICA Study Team
As a result, Zambia’s potential economic sub sectors and products in relation to Nacala
Corridor Development are identified as follows.
Table 6.5 Potential Economic Sub Sectors and Primary Products in Zambia
Sub Sector Primary Products
Crop production
Maize Soya Bean Wheat Cotton
Agro-processing Sugar Edible Oil(Soybean, Sunflower)
Livestock Bovine Meat Small Ruminant(Goat, Sheep) Chicken Farming
Others Soaps and synthetic preparations
Source: JICA Study Team
Data Collection Survey on Nacala Corridor Integrated Development in Southern Africa Final Report
6-27
6.7.3 Description of Potential Economic Sectors of Zambia and Key Points for Promoting Development of Potential Economic Sectors of Zambia
(1) Maize
Zambia produces enough volume of maize to export after fulfilling domestic demands (annual
production was about 2.5 to 3.4 million tonnes between 2011 and 2014), if it is not a drought
year. Additionally it is expected that the production will expand and the export will be
stabilised in the future. The market of the products exists within the region. South Africa and
Zimbabwe, neighbouring countries of Zambia, and Libya import more than 500,000 tonnes of
maize annually and the quantities is expanding year by year. There are also some countries
who import several hundred thousand tonnes annually like Kenya, Botswana, Namibia, and
Mauritius, and the quantities of the export to these countries are also increasing, so that large
markets will exist in the region in the future.
The purchase price of maize might become lower than the current price, after an increase of
the production. Then, it seems that large scale farmers will shift their production from maize
to other highly profitable crops like soya beans or wheat more than ever. Therefore, the
government needs to promote the improvement of the production by small scale farmers in
order to expand the production of maize in the country.
In order to expand the production of small scale farmers, it is effective to improve the access
to inputs such as seeds and fertilisers. For that, it requires the improvement and strengthening
of the FISP’s system currently under review. It is also desirable to improve access to certified
seeds in rural areas and to accelerate organising farmers for strengthening the sales at the same
time.
Maize is the most informally traded crop in Southern African Region. It is exported informally
from Zambia to DRC, and also to Tanzania and Mozambique. In this context, it is necessary to
increase not only production but also formal sales channels of maize.
From the above, the government needs to take measures for simplification of the export
procedures, improvement of input access including FISP, and optimisation and extension of
the agriculture techniques and practices.
(2) Soya Bean
In Zambia, soya bean production was 120,000 tonnes in 2011. Then it showed a remarkable
growth to reach 260,000 tonnes and 210,000 tonnes in 2013 and 2014 respectively, which
makes it possible to export tens of thousands of tonnes of soya beans. Meanwhile, its demands
in the domestic market are still high as soya bean oil crude is still imported. Also, there are
markets in the regions, as Egypt imports an incomparable volume of soya beans, about 1.0 to
1.9 million tonnes annually and the neighbouring countries of Zambia, such as South Africa
and Zimbabwe, are expanding import. Moreover, Kenya, Botswana and Burundi also import it.
Even now, Zambia is expanding the export as a major soya bean producer in the region, and
increasing the production is expected in the future, targeting both domestic and regional
markets.
Data Collection Survey on Nacala Corridor Integrated Development in Southern Africa Final Report
6-28
Both large scale and small scale farmers produce soya beans (in Zambia, 210,000 tonnes of
soya beans was produced in 2010, of which 37,000 tonnes was produced by small scale
farmers.) In order to expand the production of soya bean by large scale farmers, it would be
effective to involve large scale producers in development of Farm Blocks which the
government is currently promoting. To that end, the government should develop infrastructure
in Farm Blocks to increase the participation of the operators in the programme. Meanwhile, at
the existing Farm Blocks, the expansion of agricultural production by irrigation requires
additional water resource development. In order to supply irrigation water to the Farm Blocks,
it is necessary to develop a method for water resource development by the government and
large scale farmers with a PPP-like arrangement.
For the increase of the production by small scale farmers, Out-Grower Scheme might be
applicable. Therefore, more studies on the introduction of Out-Grower Schemes involving
small scale farmers by private companies are necessary, in order to find the bottlenecks from
the current status of the Farm Block being promoted in the country and Out-Grower Schemes,
and to establish a win-win coordination framework and system including necessary measures
such as capacity building of small scale farmers4.
From the above, the government needs to reform and strengthen the collaboration mechanism
and the system between large scale commercial farms/private entities and small scale farmers,
to promote the simplification of export procedures, to support water resource development in
the existing Farm Blocks, to improve farming techniques to be more appropriate and suitable
for the local environment, and to conduct the training of seed multiplication farmers.
(3) Wheat
At present, wheat is the third most produced crop domestically after maize and soya beans
(from 2011 to 2014, annual production volume was from 200,000 to 270,000 tonnes).
However, the domestic demand has not been met yet so that the GOZ imported it in the low
production years. In order to protect the domestic wheat producers, the GOZ has implemented
measures to ban the import of wheat from 2015 during the domestic wheat harvesting season.
At present, wheat is produced with irrigation by large scale farmers. Issues of wheat export
from Zambia are price together with expansion of production volume. The expansion of
production and price reduction are important toward the export by applying soya bean-wheat
rotation mechanised agriculture by large scale farmers.
Demand for wheat in the regional markets is high and many countries import it. However, in
order to ensure that Zambian wheat has price competitiveness against the imported wheat from
outside the region, it is necessary to increase the number of middle and large scale commercial
farmers producing wheat through the promotion of the Farm Block Programme, etc., the 4 In general, a large scale farmer produces agricultural products with hired labourers, and their relationship with the surrounding small scale farmers is weak. For example, large scale farmers producing soya beans by irrigation might have little advantage in managing the Out-Grower Schemes involving small scale farmers who produce soya bean in rain-fed production, from the perspectives of shipment time and quality. Therefore, it is considered difficult to expect that the existing large scale farmers will make efforts to develop the Out-Grower Schemes. The Scheme should be designed with the assumption on the implementation in cooperation between private enterprises and small scale farmers.
Data Collection Survey on Nacala Corridor Integrated Development in Southern Africa Final Report
6-29
development of the agricultural cluster or value chain with consideration on the utilisation of
wheat bran, etc., and also the improvement of variety. Moreover, development of transport
infrastructure is also required to decrease both the production expenses and transportation
cost.
(4) Cotton
Cotton is produced by small scale farmers, and most of them cultivate under Out-Grower
schemes in which farmers use seeds and loans provided by private companies. Thus, the
amount of the cotton production is determined by the private enterprises. Cotton production in
Zambia has been relatively stable in recent years, around 40,000 tonnes. It is exported to South
Africa and Asian countries such as Singapore. The cotton markets in the region include South
Africa and Egypt, though they are not so large. Hence, it may be possible to expand
production toward the Asian market outside the region by using the Nacala Corridor. For that,
it is necessary to expand production by private companies or to attract new private investors
by the government.
(5) Edible Oil Production
Soya bean oil is produced domestically (1,400 to 3,600 tonnes annually from 2011 to 2014).
However, most of the oil is imported (10,000 to 26,000 tonnes annually from 2011 to 2014)
and it is rarely exported. In the region, Egypt imports tens of thousands of tonnes, and there
are other countries which have demands such as Angola, Zimbabwe, Mozambique, Mauritius
and Madagascar. However, edible oil produced in Zambia shall meet domestic demands first.
Sunflower oil is produced domestically (1,300 to 7,000 tonnes annually from 2011 to 2014)
and despite annual fluctuations of the production, a similar amount is exported every year (300
to 93,000 tonnes annually from 2011 to 2014). Meanwhile, its imports are steadily increasing
(increased from 800 to 2,000 tonnes annually from 2011 to 2014). Currently, most of the
export is to DRC, and there are other relatively large markets such as South Africa, Zimbabwe
and Botswana in the region. Egypt, the largest importer in the region, and Namibia are
potential markets for the export from Zambia. In addition, Mozambique, DRC and Tanzania
import the sunflower oil, even though in a limited and unstable volume. However, as the
demand for edible-oils expands with the growth of the economy in general, the demand will
expand in the region according to development of the neighbouring countries.
In order to increase the edible oil production for both the domestic and the regional markets
and to expand its export, it requires the promotion of investment in the manufacturing industry
of soya bean oil and sunflower oil. also in soya bean production. Therefore, the government
needs to promote investment in edible oil production and new Farm Block development.
(6) Sugar
The production of sugar cane and raw sugar is increasing steadily (sugar cane: from 380,000
to 460,000 tonnes annually from 2011 to 2014 and raw sugar: from 210,000 to 260,000 tonnes
annually). The raw sugar is exported mainly to the countries in the region such as Mauritius,
Data Collection Survey on Nacala Corridor Integrated Development in Southern Africa Final Report
6-30
DRC, South Africa, Kenya, Burundi, Rwanda, etc. On the other hand, refined sugar was
produced about 120,000 to 130,000 tonnes annually, and is exported mostly to DRC.
Currently, foreign direct investment has been coming into this sector. Refined sugar has high
demand in neighbouring countries such as South Africa, Tanzania and Zimbabwe and also
Kenya and Uganda, where its market is expanding. Thus, there is a chance for Zambia to
expand sugar production as well as its export to the markets.
The government also needs to attract investments to resolve the current oligopoly situation of
raw sugar production and encourage sound competition. Bagasse generated by processing
sugar cane can be used as a feed by mixing with oil cake that comes out after aforementioned
edible oil extraction. Hence, sugar cane production and raw sugar production can also be
promoted in combination with livestock production.
The government needs to promote investment to establish sugar cane plantations and sugar
mills and also to support the improvement of basic infrastructure (water, electricity, etc.) for
promoting investment in sugar factories.
(7) Bovine Meat Production
The number of cattle heads is increasing year by year (from 2.5 million to 4.0 million heads
annually from 2011 to 2014), and meat production is also increasing (from 150,000 to 230,000
tonnes annually from 2011 to 2014). Due to the large domestic demand for bovine meat, it is
hardly exported except to DRC. However, there are large markets in the region such as South
Africa or Angola, and then Egypt and Libya also import the large volumes. In addition,
Mozambique and Mauritius are expanding the import of meat even in small quantities. Due to
the demand for meats which expands with economic growth, the market will continue to
expand in the region.
Value addition to agricultural products is indispensable in Zambia as a land locked country.
The government has and should take an opportunity to promote agriculture-livestock industry
clusters by increasing the production of maize and soya bean, processing them domestically,
and utilising the residuals as feed for promoting domestic livestock production. Currently,
meat companies purchase two or three years aged feeder calf from small scale farmers and sell
the meat after fattening them. Reproduction and breeding of calves until being sold to the
company is carried out by small scale farmers 5 . Because of the weak animal health
management in the extensive breeding by small scale farmers, it is difficult to expand the meat
production. Therefore, it is necessary to foster the large scale breeding farmers, to strengthen
animal health management and to improve animal quarantine system.
Therefore, as government’s intervention, it is required to conduct setting and management of
pasture land, to foster the large scale breeding farmers through capacity building, to establish
an animal quarantine system, to expand the animal health management, and to increase the
number of extension workers.
5 Calf breeding after reproduction requires labour costs due to labour-intensive and time-consuming work, so purchasing them from small scale farmers is more cost-effective.
Data Collection Survey on Nacala Corridor Integrated Development in Southern Africa Final Report
6-31
(8) Small Ruminants Production (Goat and Sheep)
The population of goats is very large (from 2.3 million to 2.6 million heads annually from
2011 to 2014), but the number of sheep is limited in Zambia (from 230,000 to 240,000 heads
annually from 2011 to 2014). The production is not enough to fulfil the domestic demand.
Goats are imported alive and sheep are imported both as meat and as living livestock.
Regarding the demands in the region markets, while imports are decreasing in South Africa,
the largest importer, other countries like Mauritius and Egypt have a demand, and the import
is growing in Angola, DRC and Tanzania, as same as other meats. Therefore, if Zambia has
surplus production, there is an opportunity to sell it to the regional market6.
Since these small ruminants are bred mainly by small scale farmers, for increasing the
production, it is necessary to strengthen the animal quarantine system and to expand sales
channels through establishing public slaughterhouses. Moreover, adding premier on the sales
price might be expected if a special slaughterhouse with Halal certification and cold chain can
be established in future for export to the Islamic regions like the Middle East through the
Nacala Corridor.
Therefore, as the government’s interventions, setting and management of pasture land,
development of the large scale breeding farmers, establishing an animal quarantine system,
dissemination of animal health management, and increase the number of extension workers
are required.
(9) Poultry
The number of poultry has increased year by year (from 36 million to 38 million heads
annually from 2011 to 2014), and meat production too (from 43,000 to 48,470 tonnes annually
from 2011 to 2014). A small volume of meat of poultry has been exported to DRC over the
years, and also some of live poultry has been exported to Zimbabwe, Botswana, Malawi and
Mozambique, etc. However, the domestic demand is not fulfilled and the imported volume
exceeds the exported amount (with regards the total of meat and live of the poultry, 4,489
tonnes was imported and only 30 tonnes were exported in 2014). Due to this situation, the
domestic market will be prioritised, and then it will be exported to the surrounding countries
such as Tanzania, Mozambique and Zimbabwe where the import of chicken is increasing. The
increase in meat demand accompanying economic growth begins with chicken meat.
Therefore, the demand will increase continuously for a while in these countries even though
they will also increase domestic production in the future.
In Zambia, the materials for poultry feed are relatively abundant such as wheat bran, maize
husk and oil cakes, etc. Their amounts available in the country will be increased if the
production of cereal crops with soya beans is increased and its value chain is developed.
Therefore, there is an opportunity that the poultry industry is actively utilising these resources
to increase the productivity as they expand their production, targeting the neighbouring
6 Indeed, it is expected to promote the production of goats since Saudi Arabia and Zambia have agreed on the export of goats in recent years.
Data Collection Survey on Nacala Corridor Integrated Development in Southern Africa Final Report
6-32
countries’ markets. There are several poultry companies and chicken supply groups in the
country. It is important to foster such companies as well as to establish a cold chain network
and to improve the efficiency of customs clearance on land transportation for the
transportation of the frozen meat.
Therefore, as necessary government interventions, it is required to extend techniques and
facilities for feed production, to increase the number of extension workers and their capacity,
to strengthen sanitation management in rural areas by establishing extension offices in the
areas, and to spread vaccines and strengthen animal quarantine (Avian influenza can occur
anywhere. It is impossible to export it for two years if affected).
(10) Soap and Detergents
Soap and detergent exports from Zambia are expanding year by year to Zimbabwe, DRC,
Malawi, Mozambique, etc. (from 13,000 to 28,000 tonnes annually from 2011 to 2014).
Among the neighbouring countries, Tanzania, Ethiopia and Botswana are expanding their
imports, and they should be considered as the markets in the future.
In order to support this trend, the government needs to strengthen the implementation of a
regional customs union.
6.8 Malawi’s Strategies for Promoting Development of Potential Economic Sectors in Relation to Nacala Corridor Transport Development
6.8.1 Malawi’s Strategies for Promoting Development of Potential Economic Sectors in Relation to Nacala Corridor Transport Development
In accordance with different development stages of the transport infrastructure of the Nacala
Corridor, different strategies are proposed for promoting the development of potential
economic sectors in Malawi as follows:
1st Stage of the Development of Nacala Corridor: Upgraded Railway between Nacala and
Moatize, together with Rehabilitated Railway Section between Limbe and Nkaya, and Not
Rehabilitated Railway Section between Nkaya and Chipata through Mchinji.
At this stage, the transport cost of the Lilongwe-Nacala Rail Corridor is 77% of that of the
Lilongwe-Beira Road Corridor. The transport time of the Lilongwe-Nacala Rail Corridor is
the same as that of the Lilongwe-Beira Road Corridor.
On the other hand, the transport cost of the Blantyre-Nacala Rail Corridor is 75% of that of the
Blantyre-Beira Road. The transport time of the Blantyre-Nacala Rail Corridor is four days
more than that of the Blantyre-Beira Road.
As seen in these comparisons between the Nacala Rail Corridor and the Beira Road Corridor,
development of the Nacala Corridor has a substantial impact on the economy of Malawi as a
whole, especially on southern Malawi and in terms of the transport cost. In fact, materials for
chemical fertiliser are imported by using the Nacala Rail Corridor. Sugar, tobacco and tea are
Data Collection Survey on Nacala Corridor Integrated Development in Southern Africa Final Report
6-33
exported by using the Nacala Rail Corridor. In this way, bulky cargo has started to use the
Nacala Rail Corridor. Meanwhile, it is necessary to encourage small scale farmers to expand
their production and export to neighbouring markets.
At the same time, since the cargo demand for the railway is still limited, it is necessary to
promote the utilisation of the Nacala Rail Corridor, as well as Nacala Port by conducting sales
activities to the private sector in Malawi.
2nd Stage of the Development of Nacala Corridor: Upgraded Railway between Nacala and
Chipata, Combining Upgraded Railway between Nacala and Moatize, Rehabilitated Railway
Section between Limbe and Nkaya, and Upgraded Railway Section between Nkaya and
Chipata through Mchinji.
With the upgraded railway between Nkaya and Mchinji, large areas of Malawi are to be
covered by the cargo railway services of the Nacala Corridor. Such wide service areas of the
railway become possible with the establishment of multi-modal dry ports in Lilongwe and
Blantyre. This combined rail and truck transport systems could increase growth opportunities
for potential economic sectors targeting regional markets, as well as outside regional markets.
Thus, it is necessary to support small scale farmers in order to improve productivity, branding
for marketing and gaining access to better prices in the domestic and regional markets.
3rd Stage of the Development of Nacala Corridor: Combined Rail Transport and Truck
Transport between Nacala and Lusaka through Chipata, based on the Upgraded Railway
between Nacala and Chipata together with the Establishment of Multi-Modal Dry Ports in
Blantyre, Lilongwe and Chipata, Combining Truck Transport between Lusaka and Chipata,
Upgraded Railway between Nacala and Moatize, Rehabilitated Railway Section between
Limbe and Nkaya, and Upgraded Railway Section between Nkaya and Chipata through
Mchinji.
At this stage, the combined rail and truck transport of the Nacala Corridor between Lusaka and
Nacala through Chipata could help Malawi open up its trade routes to Zambia and further to
DRC. It is necessary for Malawi to promote the development of economic sectors targeting
regional markets.
6.8.2 Malawi’s Potential Economic Sectors Related to Nacala Corridor Development
As in Zambia, the potential economic sectors in Malawi are crop production, agro processing,
livestock and others. Considering the characteristics of agriculture in Malawi written in
Section 6.5.3, the potential economic sub sectors in Malawi were selected based on the
following criteria.
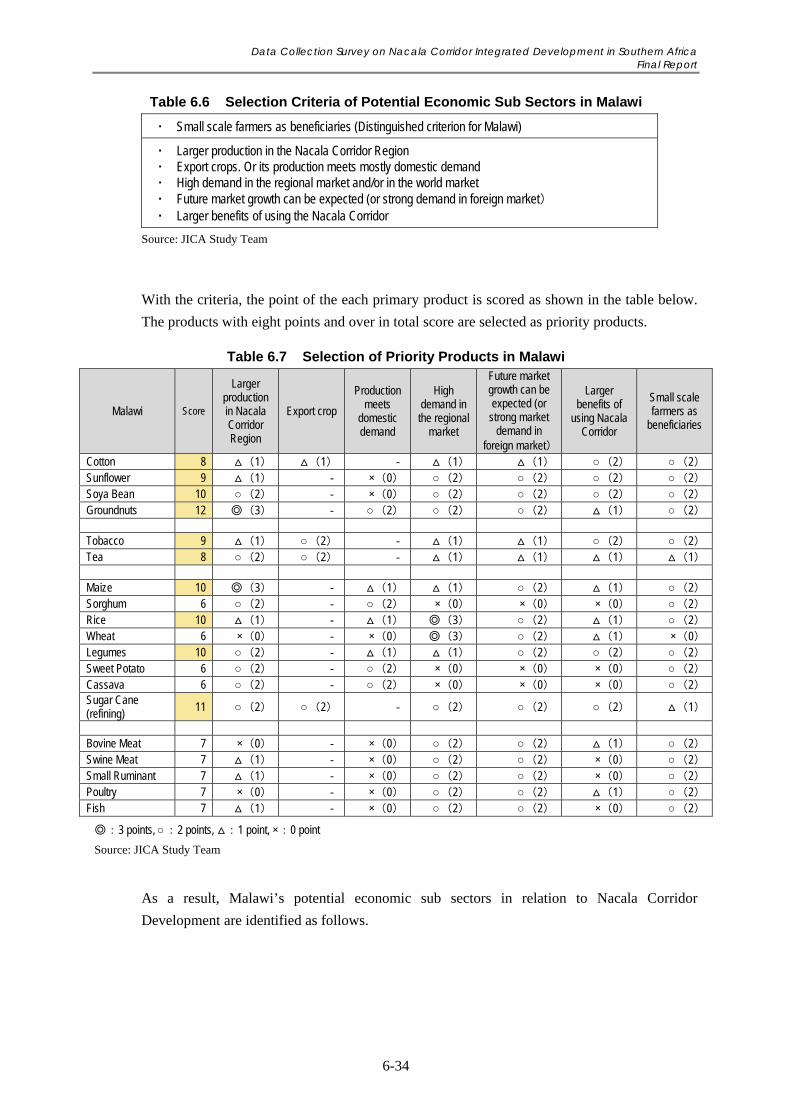
Data Collection Survey on Nacala Corridor Integrated Development in Southern Africa Final Report
6-34
Table 6.6 Selection Criteria of Potential Economic Sub Sectors in Malawi
Small scale farmers as beneficiaries (Distinguished criterion for Malawi)
Larger production in the Nacala Corridor Region Export crops. Or its production meets mostly domestic demand High demand in the regional market and/or in the world market Future market growth can be expected (or strong demand in foreign market) Larger benefits of using the Nacala Corridor
Source: JICA Study Team
With the criteria, the point of the each primary product is scored as shown in the table below.
The products with eight points and over in total score are selected as priority products.
Table 6.7 Selection of Priority Products in Malawi
Malawi Score
Larger production in Nacala Corridor Region
Export crop
Production meets
domestic demand
High demand in the regional
market
Future market growth can be expected (or strong market
demand in foreign market)
Larger benefits of
using Nacala Corridor
Small scale farmers as
beneficiaries
Cotton 8 (1) (1) ‐ (1) (1) ○(2) ○(2) Sunflower 9 (1) ‐ ×(0) ○(2) ○(2) ○(2) ○(2) Soya Bean 10 ○(2) ‐ ×(0) ○(2) ○(2) ○(2) ○(2) Groundnuts 12 ◎(3) ‐ ○(2) ○(2) ○(2) (1) ○(2)
Tobacco 9 (1) ○(2) ‐ (1) (1) ○(2) ○(2) Tea 8 ○(2) ○(2) ‐ (1) (1) (1) (1)
Maize 10 ◎(3) ‐ (1) (1) ○(2) (1) ○(2) Sorghum 6 ○(2) ‐ ○(2) ×(0) ×(0) ×(0) ○(2) Rice 10 (1) ‐ (1) ◎(3) ○(2) (1) ○(2) Wheat 6 ×(0) ‐ ×(0) ◎(3) ○(2) (1) ×(0) Legumes 10 ○(2) ‐ (1) (1) ○(2) ○(2) ○(2) Sweet Potato 6 ○(2) ‐ ○(2) ×(0) ×(0) ×(0) ○(2) Cassava 6 ○(2) ‐ ○(2) ×(0) ×(0) ×(0) ○(2) Sugar Cane (refining)
11 ○(2) ○(2) ‐ ○(2) ○(2) ○(2) (1)
Bovine Meat 7 ×(0) ‐ ×(0) ○(2) ○(2) (1) ○(2) Swine Meat 7 (1) ‐ ×(0) ○(2) ○(2) ×(0) ○(2) Small Ruminant 7 (1) ‐ ×(0) ○(2) ○(2) ×(0) ○(2) Poultry 7 ×(0) ‐ ×(0) ○(2) ○(2) (1) ○(2) Fish 7 (1) ‐ ×(0) ○(2) ○(2) ×(0) ○(2)
◎:3 points, ○:2 points, :1 point, ×:0 point
Source: JICA Study Team
As a result, Malawi’s potential economic sub sectors in relation to Nacala Corridor
Development are identified as follows.
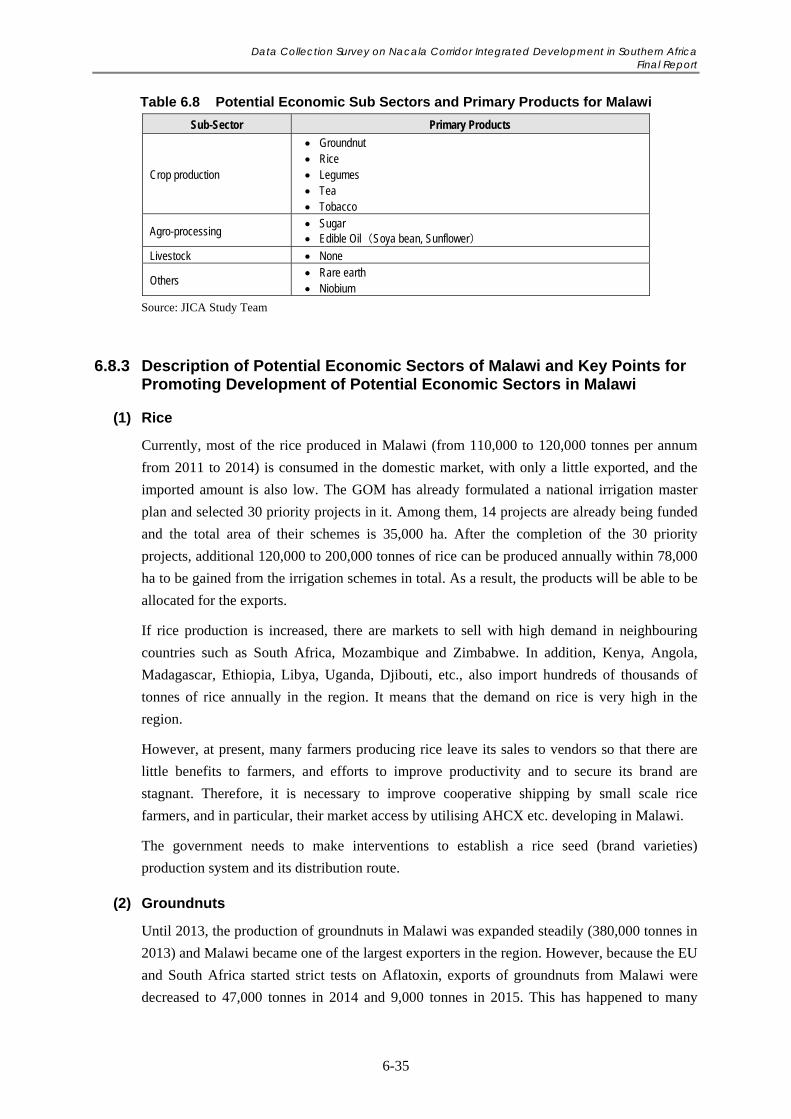
Data Collection Survey on Nacala Corridor Integrated Development in Southern Africa Final Report
6-35
Table 6.8 Potential Economic Sub Sectors and Primary Products for Malawi
Sub-Sector Primary Products
Crop production
Groundnut Rice Legumes Tea Tobacco
Agro-processing Sugar Edible Oil(Soya bean, Sunflower)
Livestock None
Others Rare earth Niobium
Source: JICA Study Team
6.8.3 Description of Potential Economic Sectors of Malawi and Key Points for Promoting Development of Potential Economic Sectors in Malawi
(1) Rice
Currently, most of the rice produced in Malawi (from 110,000 to 120,000 tonnes per annum
from 2011 to 2014) is consumed in the domestic market, with only a little exported, and the
imported amount is also low. The GOM has already formulated a national irrigation master
plan and selected 30 priority projects in it. Among them, 14 projects are already being funded
and the total area of their schemes is 35,000 ha. After the completion of the 30 priority
projects, additional 120,000 to 200,000 tonnes of rice can be produced annually within 78,000
ha to be gained from the irrigation schemes in total. As a result, the products will be able to be
allocated for the exports.
If rice production is increased, there are markets to sell with high demand in neighbouring
countries such as South Africa, Mozambique and Zimbabwe. In addition, Kenya, Angola,
Madagascar, Ethiopia, Libya, Uganda, Djibouti, etc., also import hundreds of thousands of
tonnes of rice annually in the region. It means that the demand on rice is very high in the
region.
However, at present, many farmers producing rice leave its sales to vendors so that there are
little benefits to farmers, and efforts to improve productivity and to secure its brand are
stagnant. Therefore, it is necessary to improve cooperative shipping by small scale rice
farmers, and in particular, their market access by utilising AHCX etc. developing in Malawi.
The government needs to make interventions to establish a rice seed (brand varieties)
production system and its distribution route.
(2) Groundnuts
Until 2013, the production of groundnuts in Malawi was expanded steadily (380,000 tonnes in
2013) and Malawi became one of the largest exporters in the region. However, because the EU
and South Africa started strict tests on Aflatoxin, exports of groundnuts from Malawi were
decreased to 47,000 tonnes in 2014 and 9,000 tonnes in 2015. This has happened to many
Data Collection Survey on Nacala Corridor Integrated Development in Southern Africa Final Report
6-36
African groundnuts exporters. Nevertheless, there is a demand for groundnuts in the region, so
that the groundnuts in Malawi are currently exported to countries where restrictions on
Aflatoxin are not strict, such as Kenya, Tanzania, DRC, Zimbabwe and so on.
Since the export cost is reduced by the development of the Nacala Corridor, it is a large loss
for Malawi if they cannot use the potential of the groundnuts export. Therefore, the
government should take countermeasures against Aflatoxin through various donor supports、as
described in 4.1.6, as soon as possible, such as the improvement of the production
environment, development of post-harvest processing, technology development for
conservatorship, improvement of extension service (capacity enhancement and increase in the
number of extension workers), distribution facilities, market development, etc. These
measures against Aflatoxin are urgently necessary because Aflatoxin can occur on maize and
feeds, and influences animal husbandry and human health.
(3) Legumes
Chickpea, pigeon pea and other legumes produced in Malawi (chickpea: 70,000 tonnes per
annum from 2011 to 2014 and pigeon pea: 210,000 to 340,000 tonnes per annum from 2011 to
2014) are sold in the domestic market and also are exported to India and the UAE where
50,000 tonnes were exported in 2015. The demand for chickpeas is high in Egypt. Angola also
had a high demand for that, but the demand has declined in recent years. Kenya and
Zimbabwe import the pigeon pea but it is small quantity. Therefore, India and the Middle East
will continue to be major export destinations in the future. In the region, Tanzania exports a lot
of peas. Because pigeon peas are produced mainly by small scale farmers, it is necessary to
strengthen the extension service for increasing the production. Moreover, the market for
pigeon pea other than domestic consumption is India; therefore, the Government should strive
to conclude an MOU with the Indian government urgently in order to eliminate 10% import
duties (The Government of Tanzania has already concluded a MOU with the Government of
India).
Moreover, the government needs to consider the measures for improvement and dissemination
of the pigeon pea breed, cultivation technology improvement, etc. (There is a possibility of an
increase in yield due to the current extensive cultivation practices).
(4) Cotton
As in the same situation as Zambia, cotton is produced by small scale farmers under
Out-Grower Scheme using seeds and loans provided by private companies. Hence, the
increase of the production will depend on the private companies. The cotton production in
Malawi had been steadily maintained below 20,000 tonnes per annum until 2009, but in recent
years the production has doubled to nearly 50,000 tonnes per annum. On the other hand,
exports have remained unchanged at around 10,000 tonnes per annum, and export destinations
fluctuate from year to year. As for a cotton market, there are South Africa and Egypt in the
region. However, it is possible to expand production toward the Asian market outside the
region by taking advantage of the transportation cost reduction by the development of the
Data Collection Survey on Nacala Corridor Integrated Development in Southern Africa Final Report
6-37
Nacala Corridor. Thus, an export regime is required to be established in parallel with increase
of the production.
(5) Tea
The tea production in Malawi has been stable in recent years from 42,000 to 47,000 tonnes per
annum from 2011 to 2014. The majority of the products are exported to South Africa and the
UK. On average from 2011 to 2015, about 15,000 tonnes and 11,000 tonnes were exported to
South Africa and UK respectively. In the region, the trend of import in each country is
decreasing in general, but only Kenya, a large exporter in the region, is increasing. If the
transportation cost to Kenya is reduced due to the development of the Nacala Corridor, Kenya
might be considered as a market other than the current export destinations. Though the import
is also on a downward trend, Egypt still import about 100,000 tonnes annually, three times
larger than the import volume of South Africa. Other countries such as Libya, Angola,
Botswana, Namibia, etc. also import a certain amount of tea. Therefore, these countries can be
considered as the markets for Malawian tea in the future.
Because the reduction of transportation costs for export by utilising the Nacala Corridor is
expected, the government should support improvement of the productivity through the
“Malawi Tea 2020 program” currently being developed by an industry association (Tea
Association of Malawi) and donors in combination with improvement of varieties of tea trees,
introducing quality varieties, improving processing technology, and determining quality
standards.
(6) Tobacco
Because tobacco production in Malawi is on a downward trend, it is a bit difficult to say that
tobacco is a growth industry. But it is an industry that can use the advantage of the cost
reduction by the development of the Nacala Corridor.
Tobacco is an export product. The production in Malawi is gathered with a part of the
products of Zambia and Mozambique, and exported mainly to Europe. Tobacco production in
Malawi has declined from 200,000 tonnes at the peak in 2009 to 126,000 tonnes in 2014. But
its export is expected to be maintained steadily (USD 571 million in 2011, USD 496 million in
2015). If the transport infrastructure (combined transportation of railway and truck) of the
Nacala Corridor is further developed and then the transport cost for export is reduced, the
export volume to Asia may increase in addition to the current destinations in Europe. In the
region, Egypt is expanding imports of tobacco, and Kenya, Tanzania, Ethiopia and others
import it stably even though in a small volume. Thus, there is a possibility to expand the
exports to these countries.
(7) Sugar
In Malawi, the production of sugar cane and raw sugar has been gradually increasing in recent
years (from 2011 to 2014, the production of sugar cane and raw sugar increased from 2.5
million tonnes to 2.8 million tonnes and from 290,000 to 300,000 tonnes respectively). The
Data Collection Survey on Nacala Corridor Integrated Development in Southern Africa Final Report
6-38
productivity of sugar cane in Malawi is high. The raw sugar is exported mainly to European
countries. Since the EU’s quota was abolished in October 2017, its main markets in the future
will be neighbouring countries including Zambia. Export of refined sugar is still very low, and
the domestic market is the main target for a while. However, there is a high demand for sugar
in Kenya and Uganda including neighbouring countries such as South Africa, Tanzania and
Zimbabwe, etc. Therefore, the production for export to the regional markets will be able to be
expanded.
(8) Edible Oil
Although soya bean production has increased in recent years (from 76,000 tonnes to 120,000
tonnes from 2011 to 2014), soya bean is exported as agricultural products and domestic oil
though crushing has not been produced. Although domestic production of sunflower oil has
been growing in recent years (from 1,700 tonnes to 3,000 tonnes in 2011 to 2014), a similar
amount of the oil is still imported. Therefore, even if the production of sunflower oil is
increased, its main market will be the domestic one for a while. However, relatively large
markets are also in the neighbouring countries such as South Africa, Zimbabwe and Botswana.
Moreover, Egypt and Namibia, which are the largest edible oil importing countries in the
region. Besides, Mozambique, DRC and Tanzania import it even though the volume is still
small and not yet stable. Since the market for edible oil will expand with the GDP growth, the
demand will grow in the future in line with the development of these neighbouring countries.
Thus, it can be said that edible oil has a large market in the region.
Currently, sunflower is mainly produced by small scale producers; therefore, the government
shall strengthen the extension service by using donor’s support, etc., and also promote
investments through the GBI or others to organise vertical development of sunflower oil
industry from production of sunflower to extraction of its essential oil.
(9) Rare Earth
A rare earth project has been implemented by a Canadian mining firm, to outcrop rare earth
elements mineralisation from the northern slope of Songwe Hill, Phalombe District, which is
located about 2 km from the Mozambique border. The mine is expected to produce
approximately 2,840 tonnes of REO by processing 500,000 tonnes per year of ore over
eighteen years7. The total mine deposit is estimated 32 million tonnes8.
The rare earth ore will be refined in an integrated processing plant to be constructed on the
project site, and the product is planned to be transported to Liwonde by truck and then to
Nacala Port by the Nacala Corridor Railway for exporting to Europe. Inputs necessary for
processing such as sulphur will be imported via the Nacala Corridor Railway.
The rare earth demand is assumed to grow with the expansion of demand for batteries for the
world-wide trend to shift to electric vehicles. Currently, China dominates the rare earth market, 7 http://www.mkango.ca/s/songwe.asp 8 Mkang Resources. Raw Materials and Technology for the CleanTech Revolution. Rare Earth Future Innovation. July 2017.
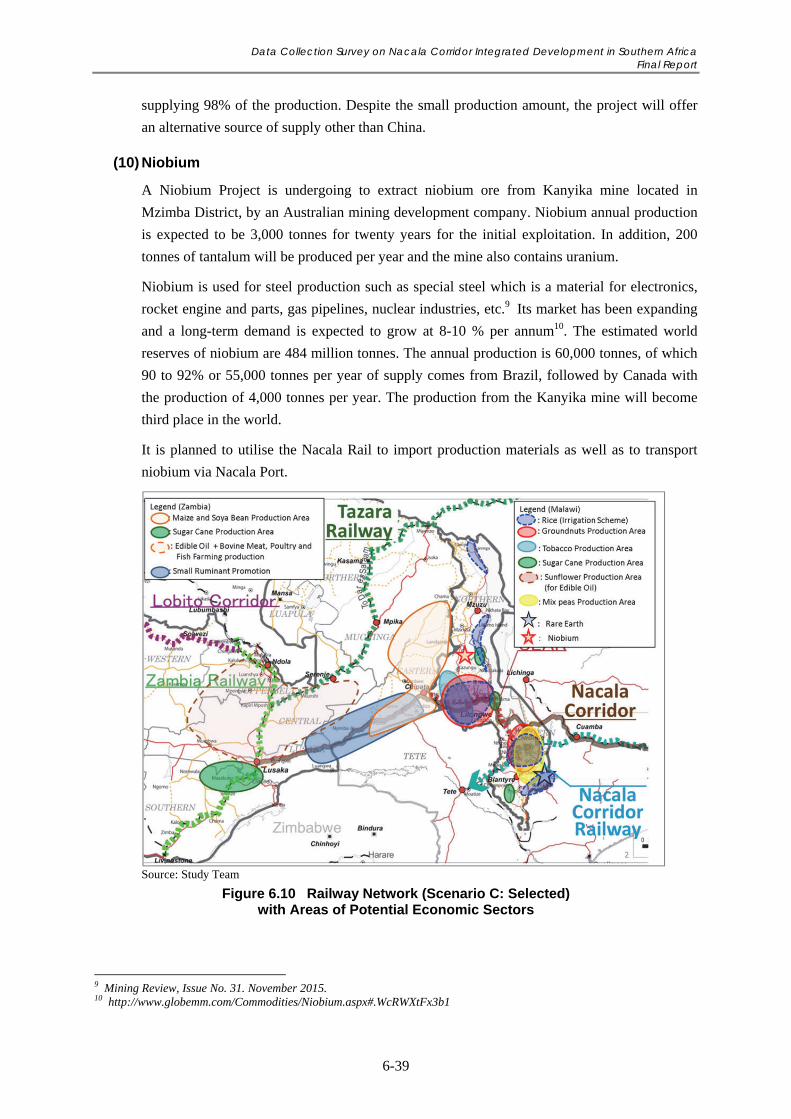
Data Collection Survey on Nacala Corridor Integrated Development in Southern Africa Final Report
6-39
supplying 98% of the production. Despite the small production amount, the project will offer
an alternative source of supply other than China.
(10) Niobium
A Niobium Project is undergoing to extract niobium ore from Kanyika mine located in
Mzimba District, by an Australian mining development company. Niobium annual production
is expected to be 3,000 tonnes for twenty years for the initial exploitation. In addition, 200
tonnes of tantalum will be produced per year and the mine also contains uranium.
Niobium is used for steel production such as special steel which is a material for electronics,
rocket engine and parts, gas pipelines, nuclear industries, etc.9 Its market has been expanding
and a long-term demand is expected to grow at 8-10 % per annum10. The estimated world
reserves of niobium are 484 million tonnes. The annual production is 60,000 tonnes, of which
90 to 92% or 55,000 tonnes per year of supply comes from Brazil, followed by Canada with
the production of 4,000 tonnes per year. The production from the Kanyika mine will become
third place in the world.
It is planned to utilise the Nacala Rail to import production materials as well as to transport
niobium via Nacala Port.
Source: Study Team
Figure 6.10 Railway Network (Scenario C: Selected) with Areas of Potential Economic Sectors
9 Mining Review, Issue No. 31. November 2015. 10 http://www.globemm.com/Commodities/Niobium.aspx#.WcRWXtFx3b1
Data Collection Survey on Nacala Corridor Integrated Development in Southern Africa Final Report
7-1
Chapter 7 Priority Projects Proposed for Promoting Nacala Corridor Development
7.1 A Long List of Projects
A variety of development projects are identified by the Study Team, in relation to the
development of the Nacala Corridor (development of both transport infrastructure and
economic sectors) by considering the following aspects:
Necessity: Projects which are essential for promoting development of the Nacala
Corridor Region
Urgency: Projects which should be implemented urgently to solve existing/emerging
problems in the region or to promote the development of Nacala Corridor
Contribution to regional development: Projects which are important for the
development of the Nacala Corridor Region by utilising the opportunities created by
development of the transport functions of the Nacala Corridor
Over 100 projects are identified and shown in Table 7.1. Some of these projects are selected
from projects recommended by existing master plans of the governments, and some projects
are newly proposed by the Study Team. These projects in the long list have a wider range of
project features than those projects which are to be designed and implemented to directly
promote the selected scenario.
Adequate timing of implementation of the projects is important to archive the selected
scenario and to create synergies among the projects. For this purpose, preferable
implementation periods of each of the projects are considered. The periods are set according to
the stages of the scenario described in Chapter 6 as the figure below.
- 1st Period (2017-2019): The period from now till the 2nd stage means by the completion
of the upgrading of the railway between Nkaya and Chipata through Mchinji.
- 2nd Period (2020-2022): The period between the 2nd stage to the 3rd stage means before
the construction of multi-modal dry ports in Blantyre, Lilongwe and Chipata.
- 3rd Period (2023-2029): The period between the 3rd and 4th stages, which is in simple
words, after the completion of transport infrastructure of the Nacala Corridor. The
projects in the period are targeting to boost the utilisation of the corridor.
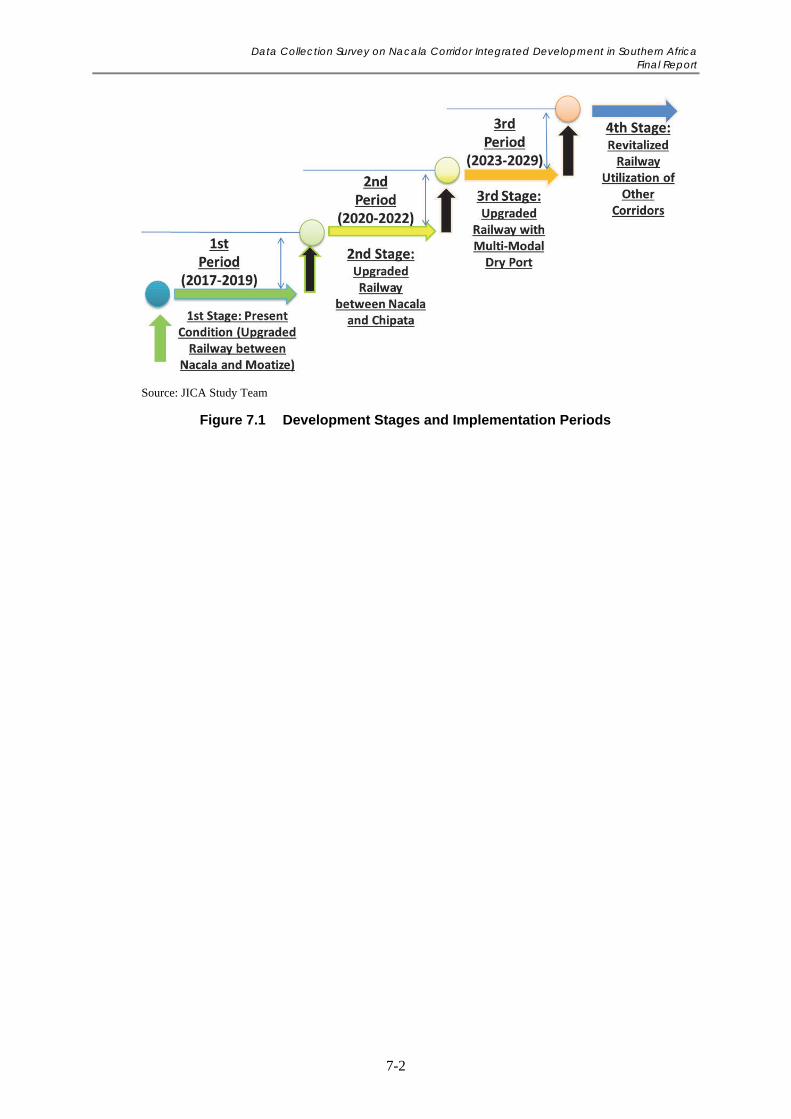
Data Collection Survey on Nacala Corridor Integrated Development in Southern Africa Final Report
7-2
Source: JICA Study Team
Figure 7.1 Development Stages and Implementation Periods
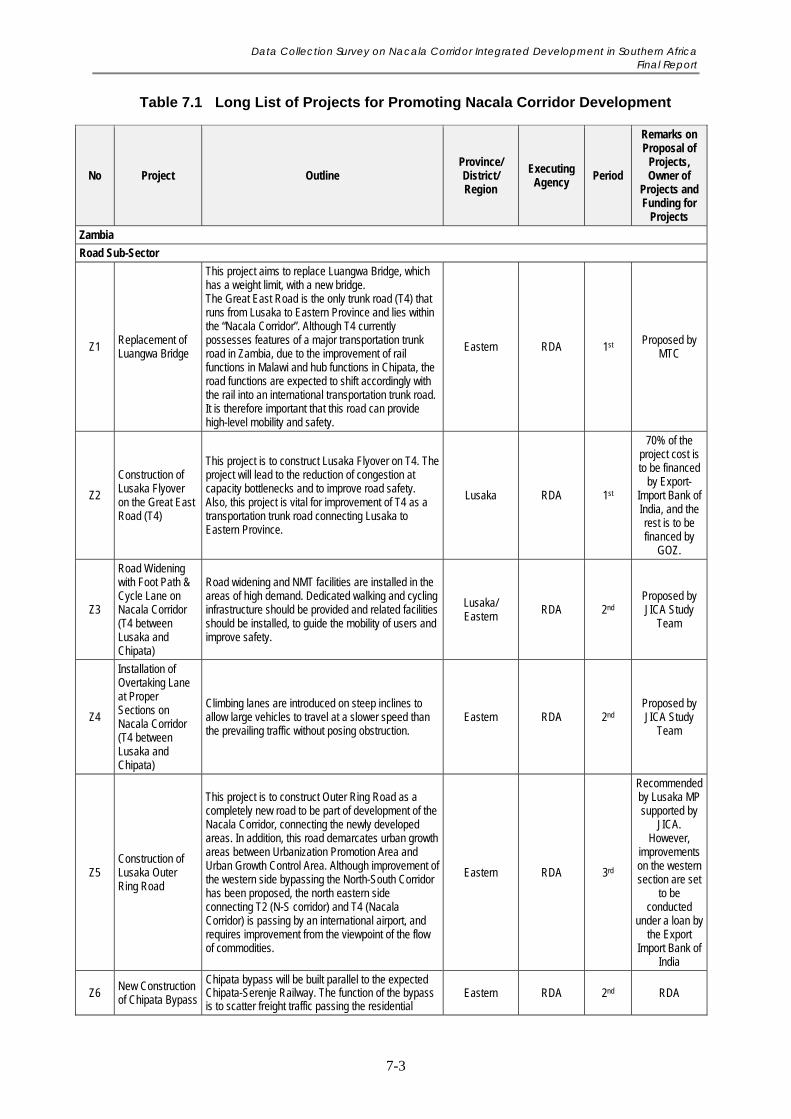
Data Collection Survey on Nacala Corridor Integrated Development in Southern Africa Final Report
7-3
Table 7.1 Long List of Projects for Promoting Nacala Corridor Development
No Project Outline Province/ District/ Region
Executing Agency
Period
Remarks on Proposal of
Projects, Owner of
Projects and Funding for
Projects
Zambia
Road Sub-Sector
Z1 Replacement of Luangwa Bridge
This project aims to replace Luangwa Bridge, which has a weight limit, with a new bridge. The Great East Road is the only trunk road (T4) that runs from Lusaka to Eastern Province and lies within the “Nacala Corridor”. Although T4 currently possesses features of a major transportation trunk road in Zambia, due to the improvement of rail functions in Malawi and hub functions in Chipata, the road functions are expected to shift accordingly with the rail into an international transportation trunk road. It is therefore important that this road can provide high-level mobility and safety.
Eastern RDA 1st Proposed by MTC
Z2
Construction of Lusaka Flyover on the Great East Road (T4)
This project is to construct Lusaka Flyover on T4. The project will lead to the reduction of congestion at capacity bottlenecks and to improve road safety. Also, this project is vital for improvement of T4 as a transportation trunk road connecting Lusaka to Eastern Province.
Lusaka RDA 1st
70% of the project cost is to be financed
by Export- Import Bank of India, and the rest is to be financed by
GOZ.
Z3
Road Widening with Foot Path & Cycle Lane on Nacala Corridor (T4 between Lusaka and Chipata)
Road widening and NMT facilities are installed in the areas of high demand. Dedicated walking and cycling infrastructure should be provided and related facilities should be installed, to guide the mobility of users and improve safety.
Lusaka/ Eastern RDA 2nd
Proposed by JICA Study
Team
Z4
Installation of Overtaking Lane at Proper Sections on Nacala Corridor (T4 between Lusaka and Chipata)
Climbing lanes are introduced on steep inclines to allow large vehicles to travel at a slower speed than the prevailing traffic without posing obstruction.
Eastern RDA 2nd Proposed by JICA Study
Team
Z5 Construction of Lusaka Outer Ring Road
This project is to construct Outer Ring Road as a completely new road to be part of development of the Nacala Corridor, connecting the newly developed areas. In addition, this road demarcates urban growth areas between Urbanization Promotion Area and Urban Growth Control Area. Although improvement of the western side bypassing the North-South Corridor has been proposed, the north eastern side connecting T2 (N-S corridor) and T4 (Nacala Corridor) is passing by an international airport, and requires improvement from the viewpoint of the flow of commodities.
Eastern RDA 3rd
Recommended by Lusaka MP supported by
JICA. However,
improvements on the western section are set
to be conducted
under a loan by the Export
Import Bank of India
Z6 New Construction of Chipata Bypass
Chipata bypass will be built parallel to the expected Chipata-Serenje Railway. The function of the bypass is to scatter freight traffic passing the residential
Eastern RDA 2nd RDA
Data Collection Survey on Nacala Corridor Integrated Development in Southern Africa Final Report
7-4
No Project Outline Province/ District/ Region
Executing Agency
Period
Remarks on Proposal of
Projects, Owner of
Projects and Funding for
Projects
areas and the city centre. In addition, in Chipata, as there is a plan or Dry Port development near the Chipata station, connection to this dry port is also important. With the dry ports, Chipata can function as a logistics base integrating road and the rail.
Z7 Rehabilitation of Katete-Chanida Road (T6)
This project intends to rehabilitateT6, one of the access roads from Nacala Corridor to Mozambique. Although the area along T6 has a great agricultural potential, the existing road is in poor condition and should therefore be rehabilitated.
Eastern RDA 3rd Proposed by JICA Study
Team
Z8 Rehabilitation of T4-Petauke Road
The access road to T4 in Petauke will be rehabilitated. Petauke has a high potential for agriculture and mining. In addition, after completion of the Chipata-Serenje Railway, Petauke will be a transport hub. However the existing road connecting T4 and Petauke is in poor condition.
Eastern RDA 3rd Proposed by JICA Study
Team
Z9
Upgrading of Provincial Tourism Access Roads
The project will upgrade8 tourism roads in Eastern Province whose improvement has been proposed in ZNTMP.(Nsefu- Lundazi via Mwanya, Mambwe – Petauke via Malama, Masumba – Katete Via Msoro, Mambwe – Chipata Via Nyokatoli, Nyimba – Mwape, Nyimba – Mnyamadzi, Nyimba – Kazumba, Nyimba – Mbizi)
Eastern MTA 3rd Recommended by ZNTMP
Z10 Establishment of High-Tech Weigh Bridge System
Truck overloading, by axle or combinations of axles, is rampant. Installation of this system will lead to a decrease in road maintenance costs.
Whole Country RDA 2nd RDA
Z11
Toll Gate Construction on Nacala Corridor (T4 between Lusaka and Chipata)
Related laws, guidelines, etc. have already been established. The toll gate will contribute to securing gross revenue from road tolls for rural road improvement.
Eastern ZNRF 2nd Requested by ZNRF
Rail Sub-Sector
Z12
Construction of Serenje-Chipata Greenfield Railway
This railway line links the Chipata–Mchinji line through Petauke District to the Port of Nacala in Mozambique. This project has also been identified as key in Zambia’s NTMP.
Central/ Eastern MOCTI 3rd
Recommended by ZNTMP. Finance is
under negotiation
between MOCTI and
China
Z13
Greenfield Freight Railway Construction (Expansion of Copper Transportation)
Kafue – Lion’s Den Extension Extension of main line to border at Chirundu (104 km) Chingola – Jimba Phase I: Chingola - Solwezi (178 km) This project has been identified as essential in Zambia’s NTMP.
Copperbelt /North-Western
ZRL 3rd Recommended by ZNTMP
Z14 Development of Mainline Signalling
This project is to develop mainline safety systems such as crossing gates and lights. Phase I is currently underway although the time frame for improvement of the other 60 units is uncertain.
Whole Country ZRL 1st to 3rd ZRL’s on-going project
Z15
Capacity Building: Operational and Management Training for ZRL and ZRA
Because there are some skills gaps and significant areas where there is shortage of local expertise, ZRL relies heavily on expert support from outside of Zambia. It is, therefore, recommended that senior skills training programmes be instituted to enhance
Whole Country ZRL 1st Proposed by JICA Study
Team
Data Collection Survey on Nacala Corridor Integrated Development in Southern Africa Final Report
7-5
No Project Outline Province/ District/ Region
Executing Agency
Period
Remarks on Proposal of
Projects, Owner of
Projects and Funding for
Projects
the technical capacity of both organisations. To reduce costs and to increase cooperative working, it is recommended that this programme be instituted jointly. Also, strengthening of ZRA after the planned separation of the organization is necessary.
Logistics Sector
Z16
Construction of Chipata Multi-Modal Dry Port
Dry ports can work as extensions of seaports or inland hubs to facilitate the movement of cargo between seaports and the hinterland. Chipata has the potential to become a logistical hub on the Zambian side after the rail functions have been improved on the Malawian side. Therefore, the construction of a Dry Port in Chipata is important for efficiency improvement of the transportation network on the Zambian side. This importance will be even greater also, when the Chipata – Serenje Railway is realised. However, this is not included in the Intermodal Hubs proposed by ZNTMP.
Eastern ZRA/ MOCTI 2nd
ZRL conducted a pre-FS.
EU is considering assisting the
implementation of this project.
Z17
Construction of Intermodal Hub in Lusaka (Lusaka Dry Port)
A dry port will be constructed in the Lusaka South Multi-Facility Economic Zone (LS-MFEZ). It is included in the Intermodal Hubs proposed in the ZNTMP.
Lusaka MOCTI/ Private
3rd Recommended
by ZNTMP Ongoing (PPP)
Z18 Improvement of OSBP (Mwami/ Mchinji)
The project will construct the OSBP facilities at Mwami/Mchinji Eastern RDA/MOCTI 1st
AfDB’s support is ongoing.
Construction project is under
preparation.
Z19
Capacity building of OSBP Operation at Mwami/Mchinji
The project includes components of installation of computer hardware and software etc. and various activities (supervision, technical assistance, training, financial and technical audit etc.)
Eastern ZRA/MOCTI 1st Proposed by JICA Study
Team
Z20 Improvement of OSBP (Chanida Border)
This project aims to construct an OSBP at Chanida border Eastern RDA/MOCTI 2nd
Proposed by JICA Study
Team
Z21
Capacity Building of OSBP Operation at Chanida Border
The project includes components of installation of computer hardware and software, etc. and various activities (supervision, technical assistance, training, financial and technical audit etc.)
Eastern ZRA/MOCTI 2nd Proposed by JICA Study
Team
Z22 Trade Policy Reform and Implementation
This project is to conduct review of the Control of Goods Act and capacity building for the competition and consumer protection tribunal.
Whole Country ZRA/MOCTI 1st Requested by
MOCTI
Z23
Improvement of ICT Connectivity to Enhance Interface at OSBP
This project aims to improve ICT connectivity for enhancement of interface and to support Monitoring and Evaluation Activities on the establishment of OSBP.
Whole Country ZRA/MOCTI 2nd
Requested by MOCTI
(Partially under way with
support by the WB)
Z24
Development of OSBPs of Transport Corridors from Zambia (ICT (National Single Window), Physical Facilities,
In order to promote regional trade facilitation, it is important to establish and operate OSBPs on various road corridors related to Zambia. It is necessary to promote both physical development of OSBP facilities and capacity development of OSBP personnel. While waiting for the completion of physical facility development for OSBP, it is necessary to start training of personnel directly operating OSBPs.
Zambia ZRA/RDA/
MOCTI 1st Proposed by JICA Study
Team
Data Collection Survey on Nacala Corridor Integrated Development in Southern Africa Final Report
7-6
No Project Outline Province/ District/ Region
Executing Agency
Period
Remarks on Proposal of
Projects, Owner of
Projects and Funding for
Projects
Capacity Development and Institutional Building)
Those OSBPs not listed in this long list include those on the following borders: Tunduma/Nakonde (Tanzania/ Zambia) of Dar es
Salaam Corridor (TradeMark East Africa are providing support).
Kasumbalesa (Zambia/ DRC) (Negotiation with WB is on-going)
Z25
Installation of Luangwa Stopover (Rest Area Development Programme)
Distance from Lusaka to Malawi border is approximately 600km. Drivers are forced to endure long-distance driving because of no stopovers. It is therefore essential that rest spaces for drivers are provided for road safety. Luangwa River crossing on the Nacala Corridor is located at 250km from Lusaka. Although location has not yet been identified, installation of rest facilities has been proposed also in the ZNTMP from the viewpoint of safety.
Eastern RDA/Private 2nd Proposed by JICA Study
Team
Z26
Study on Development of Zambia as a Transport and Logistics Hub in Southern Africa
This is to conduct a study to develop Zambia as a transport and logistics hub in Southern Africa by clarifying functions and development strategies of the international transport corridors in Zambia
Whole Country MOCTI 2nd Proposed by JICA Study
Team
Agriculture Sector
Z27
Function Strengthening on Logistics and Management of Agricultural Commodities Value Chain
This project aims to strengthen logistic infrastructures such as rural tracks, warehouses, facilities for loading, packing and processing in adequate locations to the Nacala Corridor, and to conduct. capacity building for all parties, such as agricultural producers, cooperatives and farmers’ group, and rural traders and logistics operators.
Lusaka/ Eastern
(Petauke)
MTC/MOA and private 2nd
MOAi and IFAD support SME for value
chain development
Z28
Development of Animal Feed Production and Distribution
The project is to construct and operate feed processing factories and distribute the end products to the livestock zone by utilising crops residues from farms and industrial factories as cotton oil cake, bagasse of sugar cane etc., in order to encourage domestic animal production and export. Main market of the products can be Central, Southern and Eastern Provinces.
Lusaka/ Nyimba/, Petauke/ Chipata
MFL and private 3rd
Proposed by JICA Study
Team
Z29
Agricultural Productivity Enhancement Project through Technical Support for R&D
In the project, support will be provided to develop higher yielding seeds and production techniques appropriate for the Zambian climate: Target: Maize Soybeans and Sunflower
Whole Country MOA 1st
Proposed by JICA Study Team based
on NAP
Z30
Promotion of Large & Medium Scale Agribusiness Cluster Development
The project aims to promote large-medium scale agricultural cluster development by attracting the private sector operators for export-oriented agriculture, collaborating with other projects; Target will be: Maize, Soybeans, Sunflower and Sugar cane, Cooking oil and Sugar, Cattel, Goat and Sheep, Animal and Fish feed, etc. At the same time, it is necessary to pay attention to the protection of rights of small scale farmers and rural communities.
Whole Country ZDA/MOA/
MOCTI 3rd
Proposed by JICA Study
Team
Z31
Programme on Export-Oriented Agriculture Promotion and
The objective is to improve crop production by small scale farmers in Eastern Province for export, to strengthen cooperation among those farmers, markets, trade and agro-processing industry
Eastern MOA 2nd Proposed by JICA Study
Team
Data Collection Survey on Nacala Corridor Integrated Development in Southern Africa Final Report
7-7
No Project Outline Province/ District/ Region
Executing Agency
Period
Remarks on Proposal of
Projects, Owner of
Projects and Funding for
Projects
Livestock Development targeting Small Scale Farmers in Eastern Province
operators, and to promote the development of agribusiness in this region. The necessary capacity building of the relevant public agencies shall be carried out.
Z32
Study on Farm Block Development Models with Consideration for Small Scale Farmers
This aims to clarify measures to promote the Farm Block development through the study on current challenges to the Farm Block Program that is slow in implementation due to delayed infrastructure development, and impact on small scale farmers. At the same time, the development model will be improved by paying attention to small scale farmers and developing a collaborative production method. A master plan on specific Farm Block will be prepared.
Whole Country ZDA/MOA 1st Proposed by JICA Study
Team
Z33
Study on Nacala Agricultural Growth Corridor (Zambia)
A study will be conducted on agricultural growth corridor development utilising the Nacala Corridor in Zambia to export agricultural products to DRC and Zimbabwe
Central/ Lusaka/ Eastern
MOA 1st Proposed by JICA Study
Team
Z34
Development of Market Oriented Livestock Production
Animal production, such as cattle, goat and sheep will be promoted through introduction of disease control and fattening for regional markets at the present and for overseas in the futures.
Whole Country, esp. Eastern
MFL 2nd
Proposed by JICA Study
Team aligned with Livestock Policy and
Eastern Province Dev.
Plan
Z35 Out Grower Scheme Improvement
This project is to promote collaboration between small scale farmers and large-medium scale farmer/firms and necessary institutional measures to produce development synergy both for rural and national economic growth.
Whole Country, esp. Eastern
(pilot site) MOA 3rd
Eastern Province Dev.
Plan
Z36
Capacity Development of Small-scale Farmers
Capacity building of small scale farmers in agriculture production and farm management will be conducted, which is required for them to become partners of large and medium scale farmers or agribusiness entities
Whole Country, esp. Eastern
(pilot site) MOA 3rd
National Agricultural
Policy, Livestock
policy, and Eastern
Province Dev. Plan
Investment Promotion
Z37 District Industrial Centre Development
This project aims to provide technical and financial assistance for construction and enhancement industrial yards in districts.
Eastern/ Central/ Lusaka/
Copperbelt/ Muchinga
CEEC/ MOCTI 2nd
Proposed by JICA Study
Team
Z38 Entrepreneurship Development Project
Financing access and training opportunities (including preparation of business plans and financial statements) will be provided to companies owned by entrepreneurs in major cities.
Major cities in the country MOCTI 3rd
Proposed by JICA Study
Team
Trade Sector
Z39 Export Strategy Formulation Study for Zambia
Country wide export strategies for promotion of export will be formulated. Zambia MOCTI 1st
Proposed by JICA Study
Team
Z40 Development of Inter-Country
This is to develop an inter-country trade centre as ’Michi-no-Eki ’at the Chipata-Mchinji border Eastern MOCTI 3rd Proposed by
JICA Study
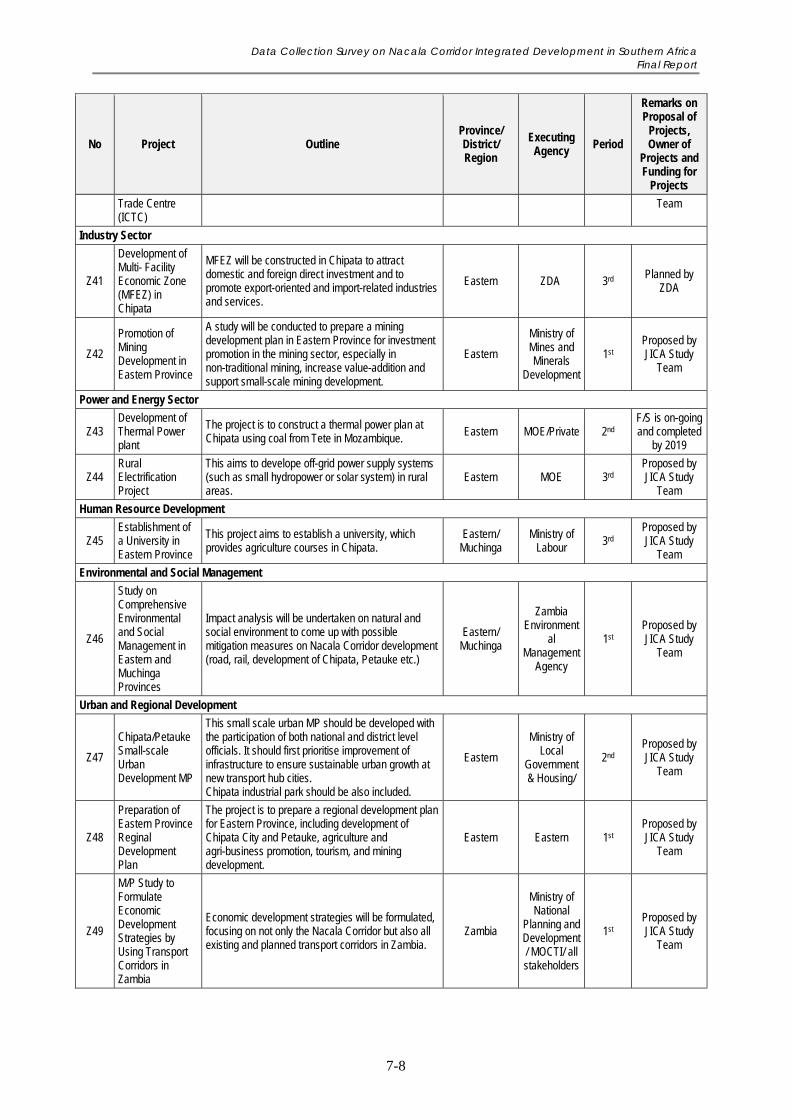
Data Collection Survey on Nacala Corridor Integrated Development in Southern Africa Final Report
7-8
No Project Outline Province/ District/ Region
Executing Agency
Period
Remarks on Proposal of
Projects, Owner of
Projects and Funding for
Projects
Trade Centre (ICTC)
Team
Industry Sector
Z41
Development of Multi- Facility Economic Zone (MFEZ) in Chipata
MFEZ will be constructed in Chipata to attract domestic and foreign direct investment and to promote export-oriented and import-related industries and services.
Eastern ZDA 3rd Planned by ZDA
Z42
Promotion of Mining Development in Eastern Province
A study will be conducted to prepare a mining development plan in Eastern Province for investment promotion in the mining sector, especially in non-traditional mining, increase value-addition and support small-scale mining development.
Eastern
Ministry of Mines and Minerals
Development
1st Proposed by JICA Study
Team
Power and Energy Sector
Z43 Development of Thermal Power plant
The project is to construct a thermal power plan at Chipata using coal from Tete in Mozambique. Eastern MOE/Private 2nd
F/S is on-going and completed
by 2019
Z44 Rural Electrification Project
This aims to develope off-grid power supply systems (such as small hydropower or solar system) in rural areas.
Eastern MOE 3rd Proposed by JICA Study
Team
Human Resource Development
Z45 Establishment of a University in Eastern Province
This project aims to establish a university, which provides agriculture courses in Chipata.
Eastern/ Muchinga
Ministry of Labour 3rd
Proposed by JICA Study
Team
Environmental and Social Management
Z46
Study on Comprehensive Environmental and Social Management in Eastern and Muchinga Provinces
Impact analysis will be undertaken on natural and social environment to come up with possible mitigation measures on Nacala Corridor development (road, rail, development of Chipata, Petauke etc.)
Eastern/ Muchinga
Zambia Environment
al Management
Agency
1st Proposed by JICA Study
Team
Urban and Regional Development
Z47
Chipata/Petauke Small-scale Urban Development MP
This small scale urban MP should be developed with the participation of both national and district level officials. It should first prioritise improvement of infrastructure to ensure sustainable urban growth at new transport hub cities. Chipata industrial park should be also included.
Eastern
Ministry of Local
Government & Housing/
2nd Proposed by JICA Study
Team
Z48
Preparation of Eastern Province Reginal Development Plan
The project is to prepare a regional development plan for Eastern Province, including development of Chipata City and Petauke, agriculture and agri-business promotion, tourism, and mining development.
Eastern Eastern 1st Proposed by JICA Study
Team
Z49
M/P Study to Formulate Economic Development Strategies by Using Transport Corridors in Zambia
Economic development strategies will be formulated, focusing on not only the Nacala Corridor but also all existing and planned transport corridors in Zambia.
Zambia
Ministry of National
Planning and Development/ MOCTI/ all stakeholders
1st Proposed by JICA Study
Team
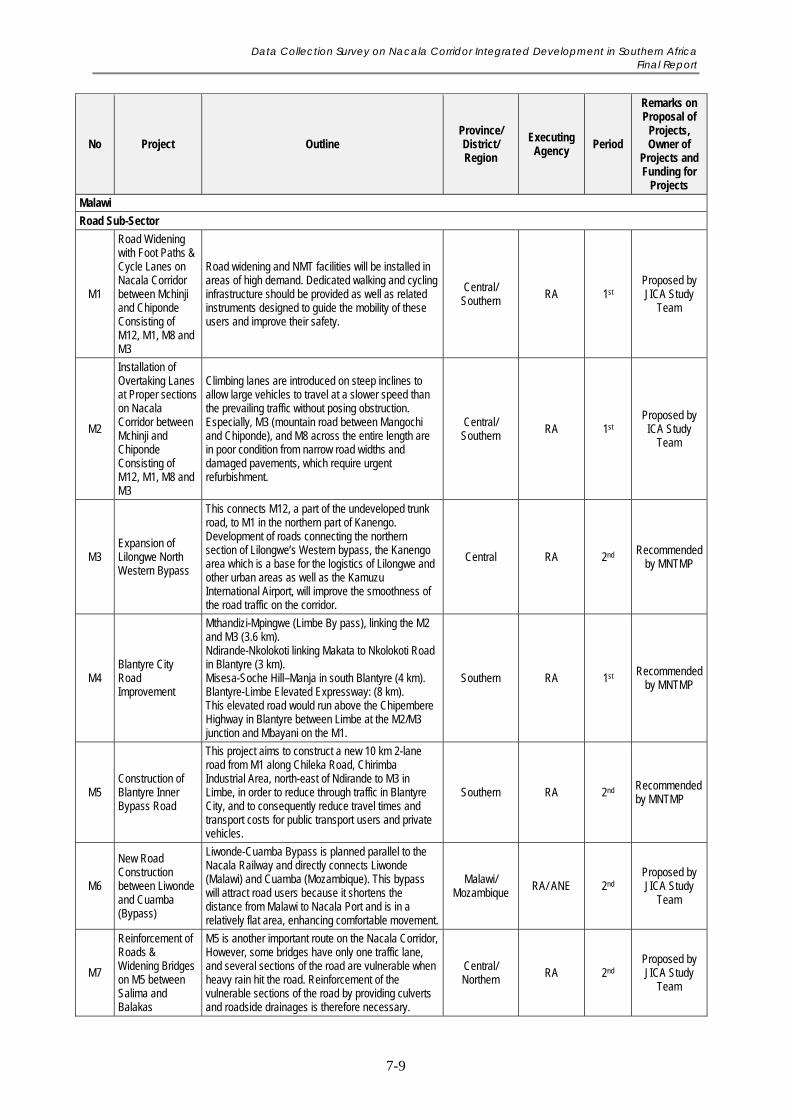
Data Collection Survey on Nacala Corridor Integrated Development in Southern Africa Final Report
7-9
No Project Outline Province/ District/ Region
Executing Agency
Period
Remarks on Proposal of
Projects, Owner of
Projects and Funding for
Projects
Malawi
Road Sub-Sector
M1
Road Widening with Foot Paths & Cycle Lanes on Nacala Corridor between Mchinji and Chiponde Consisting of M12, M1, M8 and M3
Road widening and NMT facilities will be installed in areas of high demand. Dedicated walking and cycling infrastructure should be provided as well as related instruments designed to guide the mobility of these users and improve their safety.
Central/ Southern RA 1st
Proposed by JICA Study
Team
M2
Installation of Overtaking Lanes at Proper sections on Nacala Corridor between Mchinji and Chiponde Consisting of M12, M1, M8 and M3
Climbing lanes are introduced on steep inclines to allow large vehicles to travel at a slower speed than the prevailing traffic without posing obstruction. Especially, M3 (mountain road between Mangochi and Chiponde), and M8 across the entire length are in poor condition from narrow road widths and damaged pavements, which require urgent refurbishment.
Central/ Southern RA 1st
Proposed by ICA Study
Team
M3 Expansion of Lilongwe North Western Bypass
This connects M12, a part of the undeveloped trunk road, to M1 in the northern part of Kanengo. Development of roads connecting the northern section of Lilongwe’s Western bypass, the Kanengo area which is a base for the logistics of Lilongwe and other urban areas as well as the Kamuzu International Airport, will improve the smoothness of the road traffic on the corridor.
Central RA 2nd Recommended by MNTMP
M4 Blantyre City Road Improvement
Mthandizi-Mpingwe (Limbe By pass), linking the M2 and M3 (3.6 km). Ndirande-Nkolokoti linking Makata to Nkolokoti Road in Blantyre (3 km). Misesa-Soche Hill–Manja in south Blantyre (4 km). Blantyre-Limbe Elevated Expressway: (8 km). This elevated road would run above the Chipembere Highway in Blantyre between Limbe at the M2/M3 junction and Mbayani on the M1.
Southern RA 1st Recommended by MNTMP
M5 Construction of Blantyre Inner Bypass Road
This project aims to construct a new 10 km 2-lane road from M1 along Chileka Road, Chirimba Industrial Area, north-east of Ndirande to M3 in Limbe, in order to reduce through traffic in Blantyre City, and to consequently reduce travel times and transport costs for public transport users and private vehicles.
Southern RA 2nd Recommended by MNTMP
M6
New Road Construction between Liwonde and Cuamba (Bypass)
Liwonde-Cuamba Bypass is planned parallel to the Nacala Railway and directly connects Liwonde (Malawi) and Cuamba (Mozambique). This bypass will attract road users because it shortens the distance from Malawi to Nacala Port and is in a relatively flat area, enhancing comfortable movement.
Malawi/ Mozambique
RA/ ANE 2nd Proposed by JICA Study
Team
M7
Reinforcement of Roads & Widening Bridges on M5 between Salima and Balakas
M5 is another important route on the Nacala Corridor, However, some bridges have only one traffic lane, and several sections of the road are vulnerable when heavy rain hit the road. Reinforcement of the vulnerable sections of the road by providing culverts and roadside drainages is therefore necessary.
Central/ Northern RA 2nd
Proposed by JICA Study
Team
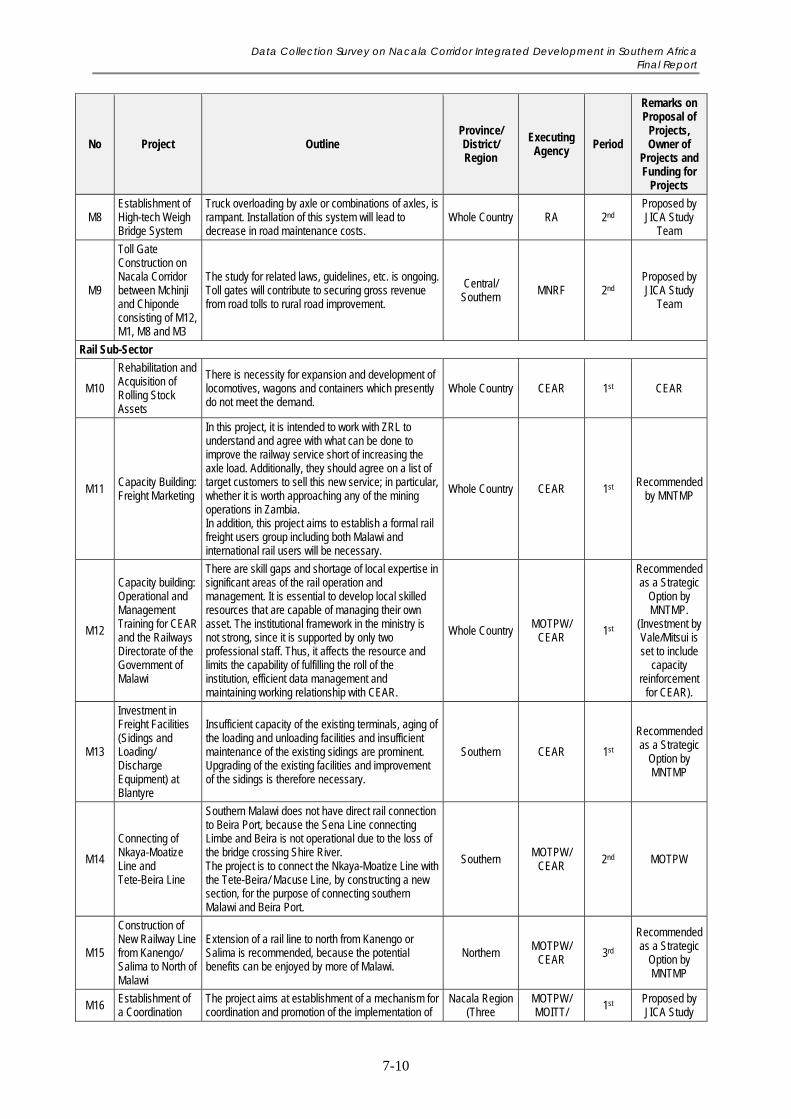
Data Collection Survey on Nacala Corridor Integrated Development in Southern Africa Final Report
7-10
No Project Outline Province/ District/ Region
Executing Agency
Period
Remarks on Proposal of
Projects, Owner of
Projects and Funding for
Projects
M8 Establishment of High-tech Weigh Bridge System
Truck overloading by axle or combinations of axles, is rampant. Installation of this system will lead to decrease in road maintenance costs.
Whole Country RA 2nd Proposed by JICA Study
Team
M9
Toll Gate Construction on Nacala Corridor between Mchinji and Chiponde consisting of M12, M1, M8 and M3
The study for related laws, guidelines, etc. is ongoing. Toll gates will contribute to securing gross revenue from road tolls to rural road improvement.
Central/ Southern MNRF 2nd
Proposed by JICA Study
Team
Rail Sub-Sector
M10
Rehabilitation and Acquisition of Rolling Stock Assets
There is necessity for expansion and development of locomotives, wagons and containers which presently do not meet the demand.
Whole Country CEAR 1st CEAR
M11 Capacity Building: Freight Marketing
In this project, it is intended to work with ZRL to understand and agree with what can be done to improve the railway service short of increasing the axle load. Additionally, they should agree on a list of target customers to sell this new service; in particular, whether it is worth approaching any of the mining operations in Zambia. In addition, this project aims to establish a formal rail freight users group including both Malawi and international rail users will be necessary.
Whole Country CEAR 1st Recommended by MNTMP
M12
Capacity building: Operational and Management Training for CEAR and the Railways Directorate of the Government of Malawi
There are skill gaps and shortage of local expertise in significant areas of the rail operation and management. It is essential to develop local skilled resources that are capable of managing their own asset. The institutional framework in the ministry is not strong, since it is supported by only two professional staff. Thus, it affects the resource and limits the capability of fulfilling the roll of the institution, efficient data management and maintaining working relationship with CEAR.
Whole Country MOTPW/
CEAR 1st
Recommended as a Strategic
Option by MNTMP.
(Investment by Vale/Mitsui is set to include
capacity reinforcement
for CEAR).
M13
Investment in Freight Facilities (Sidings and Loading/ Discharge Equipment) at Blantyre
Insufficient capacity of the existing terminals, aging of the loading and unloading facilities and insufficient maintenance of the existing sidings are prominent. Upgrading of the existing facilities and improvement of the sidings is therefore necessary.
Southern CEAR 1st
Recommended as a Strategic
Option by MNTMP
M14
Connecting of Nkaya-Moatize Line and Tete-Beira Line
Southern Malawi does not have direct rail connection to Beira Port, because the Sena Line connecting Limbe and Beira is not operational due to the loss of the bridge crossing Shire River. The project is to connect the Nkaya-Moatize Line with the Tete-Beira/ Macuse Line, by constructing a new section, for the purpose of connecting southern Malawi and Beira Port.
Southern MOTPW/
CEAR 2nd MOTPW
M15
Construction of New Railway Line from Kanengo/ Salima to North of Malawi
Extension of a rail line to north from Kanengo or Salima is recommended, because the potential benefits can be enjoyed by more of Malawi.
Northern MOTPW/
CEAR 3rd
Recommended as a Strategic
Option by MNTMP
M16 Establishment of a Coordination
The project aims at establishment of a mechanism for coordination and promotion of the implementation of
Nacala Region (Three
MOTPW/ MOITT/ 1st Proposed by
JICA Study
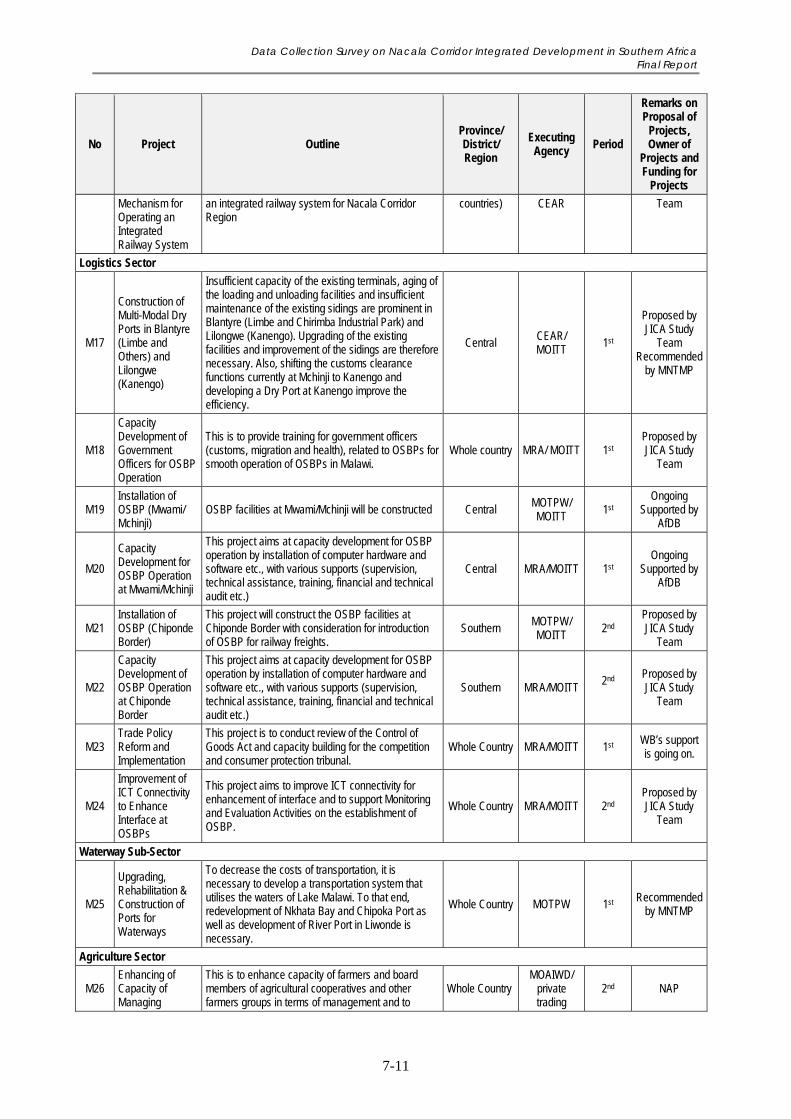
Data Collection Survey on Nacala Corridor Integrated Development in Southern Africa Final Report
7-11
No Project Outline Province/ District/ Region
Executing Agency
Period
Remarks on Proposal of
Projects, Owner of
Projects and Funding for
Projects
Mechanism for Operating an Integrated Railway System
an integrated railway system for Nacala Corridor Region
countries) CEAR Team
Logistics Sector
M17
Construction of Multi-Modal Dry Ports in Blantyre (Limbe and Others) and Lilongwe (Kanengo)
Insufficient capacity of the existing terminals, aging of the loading and unloading facilities and insufficient maintenance of the existing sidings are prominent in Blantyre (Limbe and Chirimba Industrial Park) and Lilongwe (Kanengo). Upgrading of the existing facilities and improvement of the sidings are therefore necessary. Also, shifting the customs clearance functions currently at Mchinji to Kanengo and developing a Dry Port at Kanengo improve the efficiency.
Central CEAR/ MOITT 1st
Proposed by JICA Study
Team Recommended
by MNTMP
M18
Capacity Development of Government Officers for OSBP Operation
This is to provide training for government officers (customs, migration and health), related to OSBPs for smooth operation of OSBPs in Malawi.
Whole country MRA/ MOITT 1st Proposed by JICA Study
Team
M19 Installation of OSBP (Mwami/ Mchinji)
OSBP facilities at Mwami/Mchinji will be constructed Central MOTPW/ MOITT 1st
Ongoing Supported by
AfDB
M20
Capacity Development for OSBP Operation at Mwami/Mchinji
This project aims at capacity development for OSBP operation by installation of computer hardware and software etc., with various supports (supervision, technical assistance, training, financial and technical audit etc.)
Central MRA/MOITT 1st Ongoing
Supported by AfDB
M21 Installation of OSBP (Chiponde Border)
This project will construct the OSBP facilities at Chiponde Border with consideration for introduction of OSBP for railway freights.
Southern MOTPW/ MOITT 2nd
Proposed by JICA Study
Team
M22
Capacity Development of OSBP Operation at Chiponde Border
This project aims at capacity development for OSBP operation by installation of computer hardware and software etc., with various supports (supervision, technical assistance, training, financial and technical audit etc.)
Southern MRA/MOITT 2nd
Proposed by JICA Study
Team
M23 Trade Policy Reform and Implementation
This project is to conduct review of the Control of Goods Act and capacity building for the competition and consumer protection tribunal.
Whole Country MRA/MOITT 1st WB’s support is going on.
M24
Improvement of ICT Connectivity to Enhance Interface at OSBPs
This project aims to improve ICT connectivity for enhancement of interface and to support Monitoring and Evaluation Activities on the establishment of OSBP.
Whole Country MRA/MOITT 2nd Proposed by JICA Study
Team
Waterway Sub-Sector
M25
Upgrading, Rehabilitation & Construction of Ports for Waterways
To decrease the costs of transportation, it is necessary to develop a transportation system that utilises the waters of Lake Malawi. To that end, redevelopment of Nkhata Bay and Chipoka Port as well as development of River Port in Liwonde is necessary.
Whole Country MOTPW 1st Recommended
by MNTMP
Agriculture Sector
M26 Enhancing of Capacity of Managing
This is to enhance capacity of farmers and board members of agricultural cooperatives and other farmers groups in terms of management and to
Whole Country MOAIWD/
private trading
2nd NAP
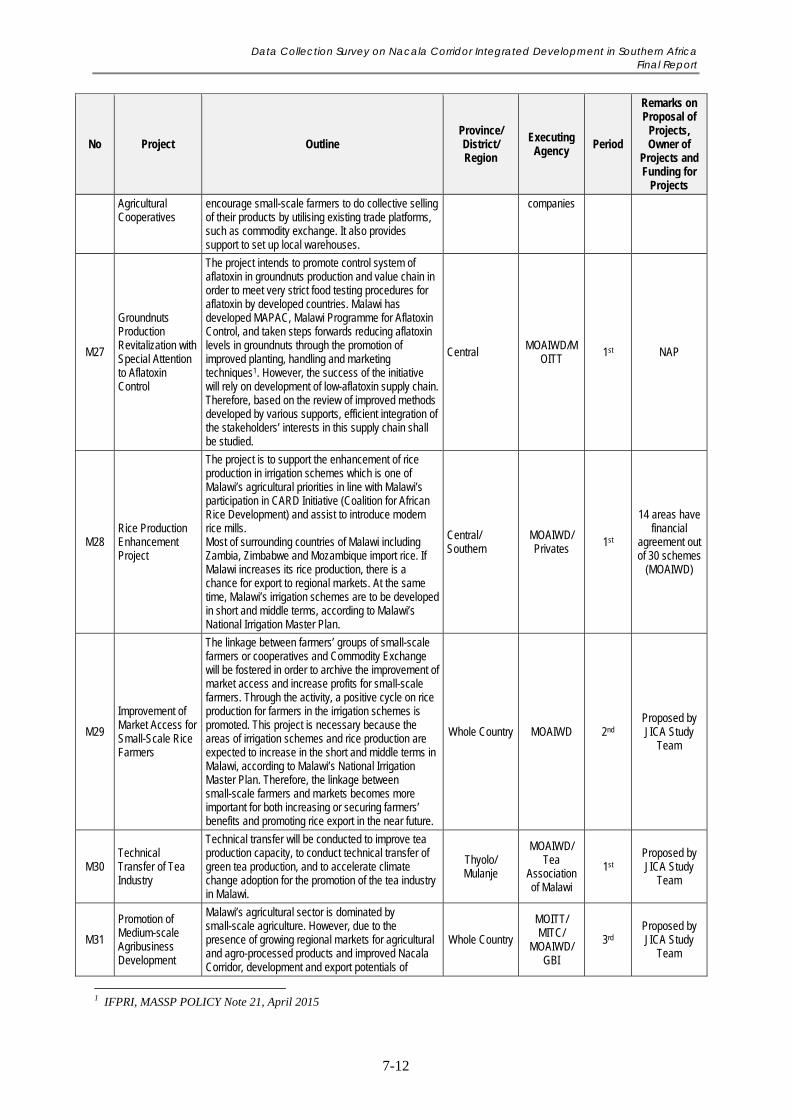
Data Collection Survey on Nacala Corridor Integrated Development in Southern Africa Final Report
7-12
No Project Outline Province/ District/ Region
Executing Agency
Period
Remarks on Proposal of
Projects, Owner of
Projects and Funding for
Projects
Agricultural Cooperatives
encourage small-scale farmers to do collective selling of their products by utilising existing trade platforms, such as commodity exchange. It also provides support to set up local warehouses.
companies
M27
Groundnuts Production Revitalization with Special Attention to Aflatoxin Control
The project intends to promote control system of aflatoxin in groundnuts production and value chain in order to meet very strict food testing procedures for aflatoxin by developed countries. Malawi has developed MAPAC, Malawi Programme for Aflatoxin Control, and taken steps forwards reducing aflatoxin levels in groundnuts through the promotion of improved planting, handling and marketing techniques1. However, the success of the initiative will rely on development of low-aflatoxin supply chain. Therefore, based on the review of improved methods developed by various supports, efficient integration of the stakeholders’ interests in this supply chain shall be studied.
Central MOAIWD/MOITT 1st NAP
M28 Rice Production Enhancement Project
The project is to support the enhancement of rice production in irrigation schemes which is one of Malawi’s agricultural priorities in line with Malawi’s participation in CARD Initiative (Coalition for African Rice Development) and assist to introduce modern rice mills. Most of surrounding countries of Malawi including Zambia, Zimbabwe and Mozambique import rice. If Malawi increases its rice production, there is a chance for export to regional markets. At the same time, Malawi’s irrigation schemes are to be developed in short and middle terms, according to Malawi’s National Irrigation Master Plan.
Central/ Southern
MOAIWD/ Privates 1st
14 areas have financial
agreement out of 30 schemes
(MOAIWD)
M29
Improvement of Market Access for Small-Scale Rice Farmers
The linkage between farmers’ groups of small-scale farmers or cooperatives and Commodity Exchange will be fostered in order to archive the improvement of market access and increase profits for small-scale farmers. Through the activity, a positive cycle on rice production for farmers in the irrigation schemes is promoted. This project is necessary because the areas of irrigation schemes and rice production are expected to increase in the short and middle terms in Malawi, according to Malawi’s National Irrigation Master Plan. Therefore, the linkage between small-scale farmers and markets becomes more important for both increasing or securing farmers’ benefits and promoting rice export in the near future.
Whole Country MOAIWD 2nd Proposed by JICA Study
Team
M30 Technical Transfer of Tea Industry
Technical transfer will be conducted to improve tea production capacity, to conduct technical transfer of green tea production, and to accelerate climate change adoption for the promotion of the tea industry in Malawi.
Thyolo/ Mulanje
MOAIWD/ Tea
Association of Malawi
1st Proposed by JICA Study
Team
M31
Promotion of Medium-scale Agribusiness Development
Malawi’s agricultural sector is dominated by small-scale agriculture. However, due to the presence of growing regional markets for agricultural and agro-processed products and improved Nacala Corridor, development and export potentials of
Whole Country
MOITT/ MITC/
MOAIWD/ GBI
3rd Proposed by JICA Study
Team
1 IFPRI, MASSP POLICY Note 21, April 2015
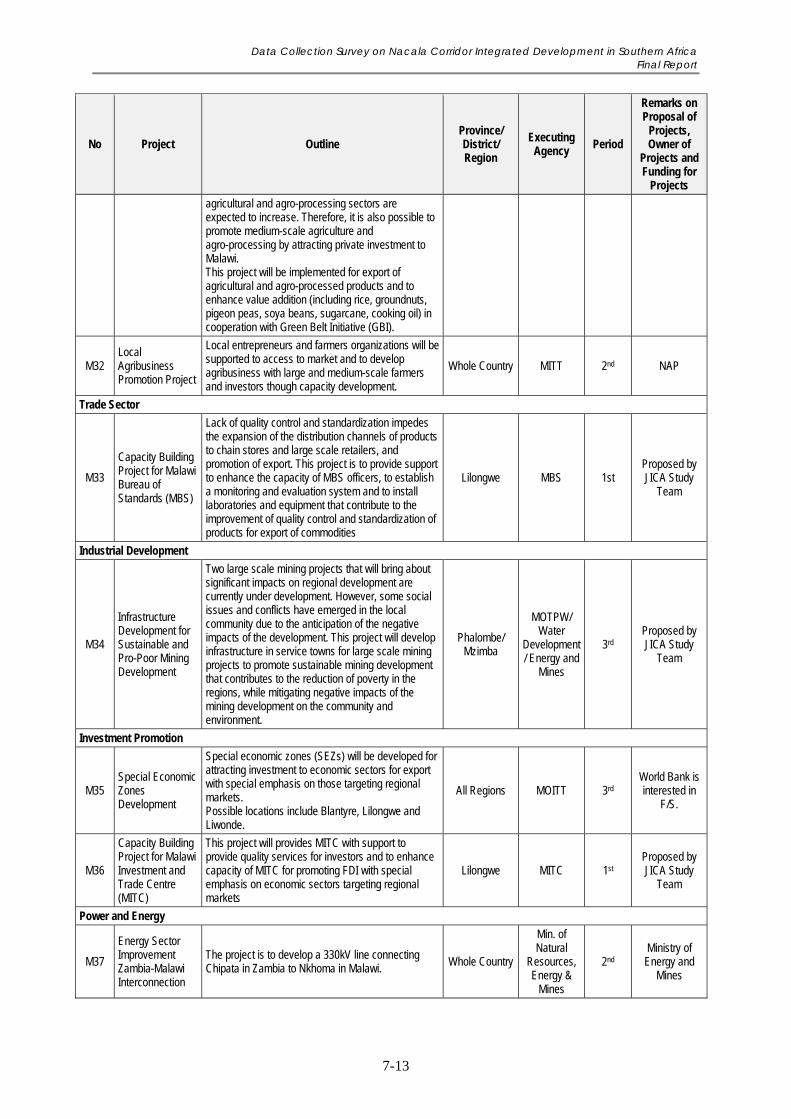
Data Collection Survey on Nacala Corridor Integrated Development in Southern Africa Final Report
7-13
No Project Outline Province/ District/ Region
Executing Agency
Period
Remarks on Proposal of
Projects, Owner of
Projects and Funding for
Projects
agricultural and agro-processing sectors are expected to increase. Therefore, it is also possible to promote medium-scale agriculture and agro-processing by attracting private investment to Malawi. This project will be implemented for export of agricultural and agro-processed products and to enhance value addition (including rice, groundnuts, pigeon peas, soya beans, sugarcane, cooking oil) in cooperation with Green Belt Initiative (GBI).
M32 Local Agribusiness Promotion Project
Local entrepreneurs and farmers organizations will be supported to access to market and to develop agribusiness with large and medium-scale farmers and investors though capacity development.
Whole Country MITT 2nd NAP
Trade Sector
M33
Capacity Building Project for Malawi Bureau of Standards (MBS)
Lack of quality control and standardization impedes the expansion of the distribution channels of products to chain stores and large scale retailers, and promotion of export. This project is to provide support to enhance the capacity of MBS officers, to establish a monitoring and evaluation system and to install laboratories and equipment that contribute to the improvement of quality control and standardization of products for export of commodities
Lilongwe MBS 1st Proposed by JICA Study
Team
Industrial Development
M34
Infrastructure Development for Sustainable and Pro-Poor Mining Development
Two large scale mining projects that will bring about significant impacts on regional development are currently under development. However, some social issues and conflicts have emerged in the local community due to the anticipation of the negative impacts of the development. This project will develop infrastructure in service towns for large scale mining projects to promote sustainable mining development that contributes to the reduction of poverty in the regions, while mitigating negative impacts of the mining development on the community and environment.
Phalombe/ Mzimba
MOTPW/ Water
Development/ Energy and
Mines
3rd Proposed by JICA Study
Team
Investment Promotion
M35 Special Economic Zones Development
Special economic zones (SEZs) will be developed for attracting investment to economic sectors for export with special emphasis on those targeting regional markets. Possible locations include Blantyre, Lilongwe and Liwonde.
All Regions MOITT 3rd World Bank is interested in
F/S.
M36
Capacity Building Project for Malawi Investment and Trade Centre (MITC)
This project will provides MITC with support to provide quality services for investors and to enhance capacity of MITC for promoting FDI with special emphasis on economic sectors targeting regional markets
Lilongwe MITC 1st Proposed by JICA Study
Team
Power and Energy
M37
Energy Sector Improvement Zambia-Malawi Interconnection
The project is to develop a 330kV line connecting Chipata in Zambia to Nkhoma in Malawi. Whole Country
Min. of Natural
Resources, Energy &
Mines
2nd Ministry of Energy and
Mines
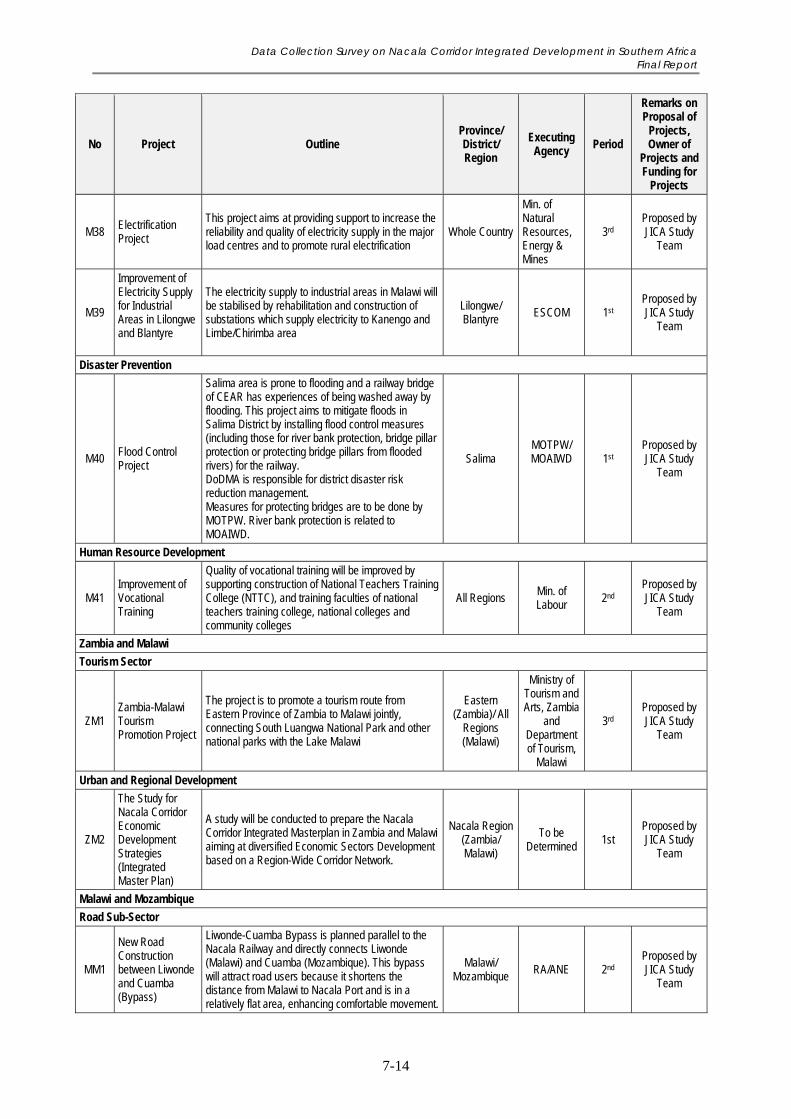
Data Collection Survey on Nacala Corridor Integrated Development in Southern Africa Final Report
7-14
No Project Outline Province/ District/ Region
Executing Agency
Period
Remarks on Proposal of
Projects, Owner of
Projects and Funding for
Projects
M38 Electrification Project
This project aims at providing support to increase the reliability and quality of electricity supply in the major load centres and to promote rural electrification
Whole Country
Min. of Natural Resources, Energy & Mines
3rd Proposed by JICA Study
Team
M39
Improvement of Electricity Supply for Industrial Areas in Lilongwe and Blantyre
The electricity supply to industrial areas in Malawi will be stabilised by rehabilitation and construction of substations which supply electricity to Kanengo and Limbe/Chirimba area
Lilongwe/ Blantyre ESCOM 1st
Proposed by JICA Study
Team
Disaster Prevention
M40 Flood Control Project
Salima area is prone to flooding and a railway bridge of CEAR has experiences of being washed away by flooding. This project aims to mitigate floods in Salima District by installing flood control measures (including those for river bank protection, bridge pillar protection or protecting bridge pillars from flooded rivers) for the railway. DoDMA is responsible for district disaster risk reduction management. Measures for protecting bridges are to be done by MOTPW. River bank protection is related to MOAIWD.
Salima MOTPW/ MOAIWD
1st
Proposed by JICA Study
Team
Human Resource Development
M41 Improvement of Vocational Training
Quality of vocational training will be improved by supporting construction of National Teachers Training College (NTTC), and training faculties of national teachers training college, national colleges and community colleges
All Regions Min. of Labour 2nd
Proposed by JICA Study
Team
Zambia and Malawi
Tourism Sector
ZM1 Zambia-Malawi Tourism Promotion Project
The project is to promote a tourism route from Eastern Province of Zambia to Malawi jointly, connecting South Luangwa National Park and other national parks with the Lake Malawi
Eastern (Zambia)/ All
Regions (Malawi)
Ministry of Tourism and Arts, Zambia
and Department of Tourism,
Malawi
3rd Proposed by JICA Study
Team
Urban and Regional Development
ZM2
The Study for Nacala Corridor Economic Development Strategies (Integrated Master Plan)
A study will be conducted to prepare the Nacala Corridor Integrated Masterplan in Zambia and Malawi aiming at diversified Economic Sectors Development based on a Region-Wide Corridor Network.
Nacala Region (Zambia/ Malawi)
To be Determined
1st Proposed by JICA Study
Team
Malawi and Mozambique
Road Sub-Sector
MM1
New Road Construction between Liwonde and Cuamba (Bypass)
Liwonde-Cuamba Bypass is planned parallel to the Nacala Railway and directly connects Liwonde (Malawi) and Cuamba (Mozambique). This bypass will attract road users because it shortens the distance from Malawi to Nacala Port and is in a relatively flat area, enhancing comfortable movement.
Malawi/ Mozambique
RA/ANE 2nd Proposed by JICA Study
Team
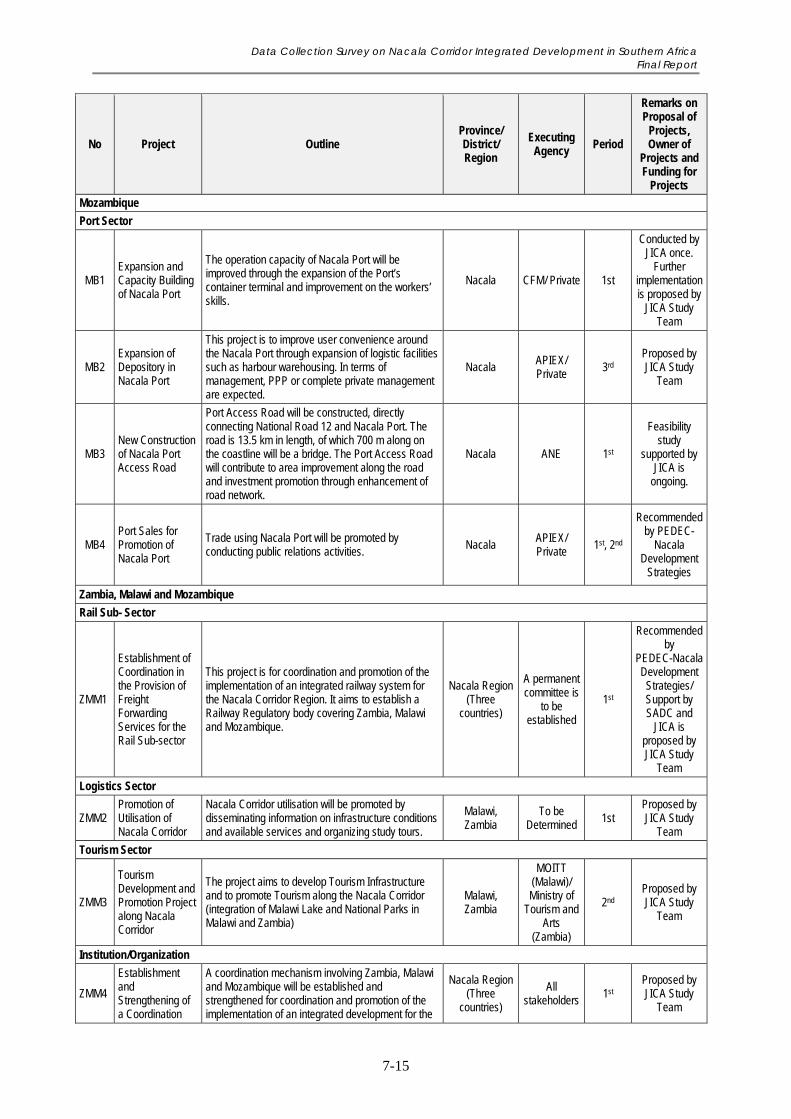
Data Collection Survey on Nacala Corridor Integrated Development in Southern Africa Final Report
7-15
No Project Outline Province/ District/ Region
Executing Agency
Period
Remarks on Proposal of
Projects, Owner of
Projects and Funding for
Projects
Mozambique
Port Sector
MB1 Expansion and Capacity Building of Nacala Port
The operation capacity of Nacala Port will be improved through the expansion of the Port’s container terminal and improvement on the workers’ skills.
Nacala CFM/ Private 1st
Conducted by JICA once.
Further implementation is proposed by
JICA Study Team
MB2 Expansion of Depository in Nacala Port
This project is to improve user convenience around the Nacala Port through expansion of logistic facilities such as harbour warehousing. In terms of management, PPP or complete private management are expected.
Nacala APIEX/ Private 3rd
Proposed by JICA Study
Team
MB3 New Construction of Nacala Port Access Road
Port Access Road will be constructed, directly connecting National Road 12 and Nacala Port. The road is 13.5 km in length, of which 700 m along on the coastline will be a bridge. The Port Access Road will contribute to area improvement along the road and investment promotion through enhancement of road network.
Nacala ANE 1st
Feasibility study
supported by JICA is
ongoing.
MB4 Port Sales for Promotion of Nacala Port
Trade using Nacala Port will be promoted by conducting public relations activities. Nacala
APIEX/ Private 1st, 2nd
Recommended by PEDEC-
Nacala Development
Strategies
Zambia, Malawi and Mozambique
Rail Sub- Sector
ZMM1
Establishment of Coordination in the Provision of Freight Forwarding Services for the Rail Sub-sector
This project is for coordination and promotion of the implementation of an integrated railway system for the Nacala Corridor Region. It aims to establish a Railway Regulatory body covering Zambia, Malawi and Mozambique.
Nacala Region (Three
countries)
A permanent committee is
to be established
1st
Recommended by
PEDEC-Nacala Development Strategies/ Support by SADC and
JICA is proposed by JICA Study
Team
Logistics Sector
ZMM2 Promotion of Utilisation of Nacala Corridor
Nacala Corridor utilisation will be promoted by disseminating information on infrastructure conditions and available services and organizing study tours.
Malawi, Zambia
To be Determined 1st
Proposed by JICA Study
Team
Tourism Sector
ZMM3
Tourism Development and Promotion Project along Nacala Corridor
The project aims to develop Tourism Infrastructure and to promote Tourism along the Nacala Corridor (integration of Malawi Lake and National Parks in Malawi and Zambia)
Malawi, Zambia
MOITT (Malawi)/ Ministry of
Tourism and Arts
(Zambia)
2nd Proposed by JICA Study
Team
Institution/Organization
ZMM4
Establishment and Strengthening of a Coordination
A coordination mechanism involving Zambia, Malawi and Mozambique will be established and strengthened for coordination and promotion of the implementation of an integrated development for the
Nacala Region (Three
countries)
All stakeholders
1st Proposed by JICA Study
Team
Data Collection Survey on Nacala Corridor Integrated Development in Southern Africa Final Report
7-16
No Project Outline Province/ District/ Region
Executing Agency
Period
Remarks on Proposal of
Projects, Owner of
Projects and Funding for
Projects
Mechanism for Nacala Corridor Development involving the Three Countries
Nacala Corridor Region.
COMESA/ SADC
Trade Sector
CS1
Programme for Intra-Regional Trade Facilitation of Zambia, Malawi and Mozambique through Nacala Corridor
This programme aims to promote intra-regional trade and to dispatch JICA experts to COMESA for supporting regional economic integration
Nacala Region COMESA/
SADC 1st Proposed by JICA Study
Team
CS2
Establishment and Operation of International Railway Coordinating Committee for Nacala Corridor Railway
An international railway coordinating committee will be established for the provision of safe, efficient, effective integrated railway operation and capacity development for the coordinating committee.
Nacala Region
Special Committee
for Implementati
on to be Established
1st
Originally the necessity for this project is recommended
by PEDEC-Nacala Development Strategies/ the involvement of
SADC and JICA is
proposed by JICA Study
Team.
7.2 List of Priority Projects Recommended for Promoting Nacala Corridor Development
In order to initiate and achieve the proposed growth scenario described in Chapter 6, the basic
policy to select the priority projects is proposed below.
Table 7.2 Basic Policy on the Selection of the Priority Projects
Development of Transport Infrastructure of Nacala Corridor
The projects to improve infrastructure in order to effectively utilise the Nacala Railway being renovated by a private group and to efficiently demonstrate and maximise the transport functions of the Nacala Corridor in the short term.
Promotion of Economic Sectors along Nacala Corridor
The projects that can contribute to promotion of the economic sectors of which development potential is already recognised in the existing plans and/or actual performance in the past, or support the expansion of export to regional markets
Source: JICA Study Team
As a result, the following fourteen projects are identified and recommended for
implementation by the JICA Study Team.
Data Collection Survey on Nacala Corridor Integrated Development in Southern Africa Final Report
7-17
Table 7.3 shows a list of the priority projects recommended for promoting Nacala Corridor
Development.
Table 7.3 Priority Projects Recommended for Promoting Nacala Corridor Development
Project Sector Period
Development of Transport Infrastructure of Nacala Corridor
Zambia
Z1 Replacement of Luangwa Bridge Road 1st
Z24 Development of OSBP of Transport Corridors from Zambia (ICT (National Single Window), Physical Facilities, Capacity Development and Institutional Building)
Road 1st
Z6 New Construction of Chipata Bypass Road 2nd
Z16 Construction of Chipata Multi-Modal Dry Port Logistics 2nd
Malawi
M3 Expansion of Lilongwe North Western Bypass Road 2nd
M4 Blantyre City Road Improvement Road 1st
M5 Construction of Blantyre Inner Relief Road Road 2nd
M17 Construction of Multi-Modal Dry Ports in Blantyre (Limbe or Others) and Lilongwe (Kanengo) Logistics 1st
M18 Capacity Development of Government Officers for OSBP Operation Logistics 1st
M39 Improvement of Electricity Supply to Industrial Areas in Lilongwe and Blantyre Energy 1st
Promotion of Economic Sectors along Nacala Corridor
Zambia
Z31 Promotion of Export-Oriented Agriculture and Livestock Development Targeting Small Scale Farmers in Eastern Province
Agriculture 2nd
Z32 Study on Farm Block Development Models with Special Consideration for Small Scale Farmers
Agriculture 1st
Z39 Export Strategy Formulation Study for Zambia Trade 1st
Malawi
M27 Groundnuts Production Revitalization with special attention to Aflatoxin Control Agriculture 2nd
M29 Improvement of Market Access for Small-Scale Rice Farmers Agriculture 2nd
Source: JICA Study Team
7.3 Brief Profiles of Priority Projects Recommended for Promoting Nacala Corridor Development
This section provides brief profiles of the priority projects recommended for promoting Nacala
Corridor Development.
7.3.1 Development of Transport Infrastructure of Nacala Corridor
The proposed scenario has two major development strategies. The one is to strengthen
transport infrastructure of the Nacala Corridor so that economic sectors could more actively
utilise the upgraded rail and road functions and services of the Nacala Corridor. The other is
related to development of economic sectors taking advantage of the enhanced transport
infrastructure and services of the Nacala Corridor so that economic sectors could generate
more traffic demand for the Nacala Corridor.
Data Collection Survey on Nacala Corridor Integrated Development in Southern Africa Final Report
7-18
The priority projects explained in this section are those of the first categories mentioned above.
Those priority projects are selected because they are effective for the following aspects:
Promoting regional trade facilitation by physical development and capacity
development for OSBPs on road corridors
Expanding the service areas of the combined rail and truck transport of the Nacala
Corridor by physical development of multi-modal dry ports to combine rail transport
and truck transport
Improvement of the accessibility to multi-modal dry ports by road development
(1) Zambia
1) Z1: Replacement of Luangwa Bridge
(a) Background of the Project
The Great East Road (T4) is the only trunk road that runs from Lusaka to Eastern Province
and lies within the “Nacala Corridor”. Although T4 currently possesses the features of a major
transportation trunk road in Zambia, due to the improvement of rail functions in Malawi and
hub functions in Chipata, the road functions are expected to shift accordingly with the rail into
an international transportation trunk road.
(b) Objectives of the Project
For access to Chipata, it is important that T4 can provide high mobility and safety. However,
the Luangwa Bridge located at 250 km from Lusaka towards Chipata has been in use for
decades and is severely deteriorated. Limitation for vehicle weight is currently in place and
passage is only allowed for one vehicle at a time. Therefore, during heavy traffic, long lines of
vehicles awaiting passage are formed at both sides of this bridge, creating a bottleneck on the
T4 Road.
Therefore, replacement with a new bridge is planned in order to secure high mobility and
safety for the Nacala Corridor.
(c) Description of the Project
In addition to the current bridge, a new bridge is to be built nearby and, from the viewpoint of
safety, improvement of the road alignment in the surrounding mountain roads is to be
conducted at the same time.
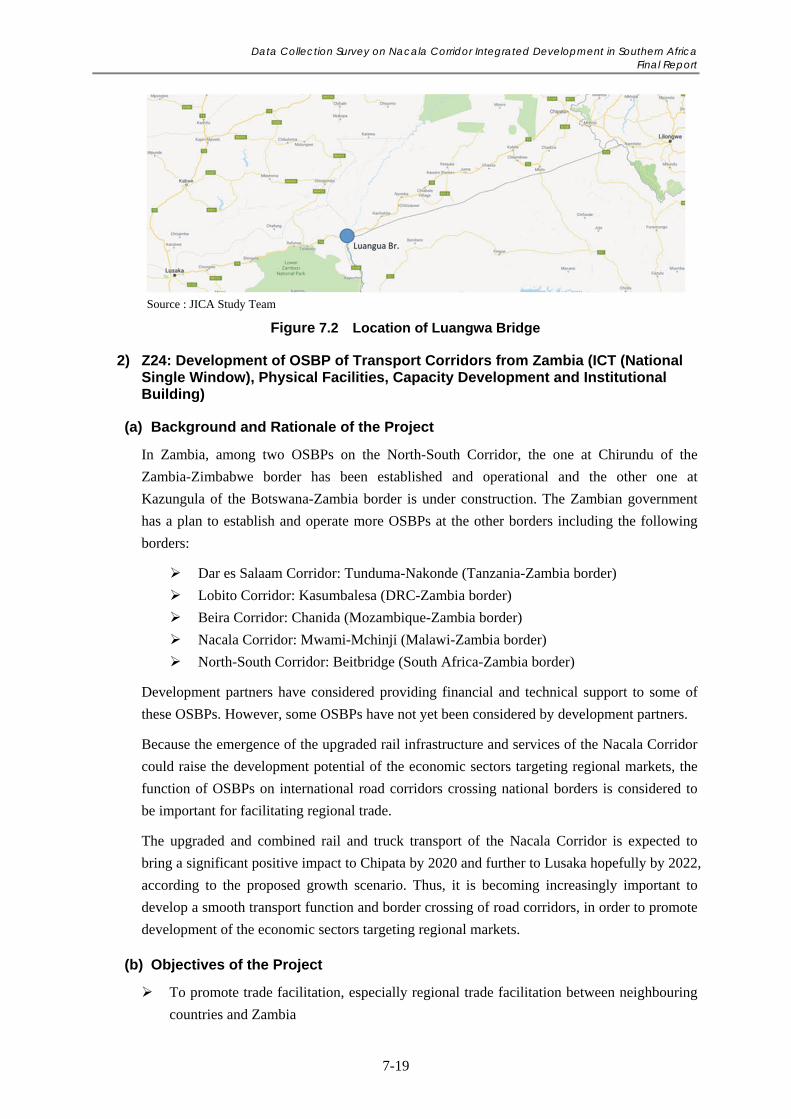
Data Collection Survey on Nacala Corridor Integrated Development in Southern Africa Final Report
7-19
Source : JICA Study Team
Figure 7.2 Location of Luangwa Bridge
2) Z24: Development of OSBP of Transport Corridors from Zambia (ICT (National Single Window), Physical Facilities, Capacity Development and Institutional Building)
(a) Background and Rationale of the Project
In Zambia, among two OSBPs on the North-South Corridor, the one at Chirundu of the
Zambia-Zimbabwe border has been established and operational and the other one at
Kazungula of the Botswana-Zambia border is under construction. The Zambian government
has a plan to establish and operate more OSBPs at the other borders including the following
borders:
Dar es Salaam Corridor: Tunduma-Nakonde (Tanzania-Zambia border)
Lobito Corridor: Kasumbalesa (DRC-Zambia border)
Beira Corridor: Chanida (Mozambique-Zambia border)
Nacala Corridor: Mwami-Mchinji (Malawi-Zambia border)
North-South Corridor: Beitbridge (South Africa-Zambia border)
Development partners have considered providing financial and technical support to some of
these OSBPs. However, some OSBPs have not yet been considered by development partners.
Because the emergence of the upgraded rail infrastructure and services of the Nacala Corridor
could raise the development potential of the economic sectors targeting regional markets, the
function of OSBPs on international road corridors crossing national borders is considered to
be important for facilitating regional trade.
The upgraded and combined rail and truck transport of the Nacala Corridor is expected to
bring a significant positive impact to Chipata by 2020 and further to Lusaka hopefully by 2022,
according to the proposed growth scenario. Thus, it is becoming increasingly important to
develop a smooth transport function and border crossing of road corridors, in order to promote
development of the economic sectors targeting regional markets.
(b) Objectives of the Project
To promote trade facilitation, especially regional trade facilitation between neighbouring
countries and Zambia
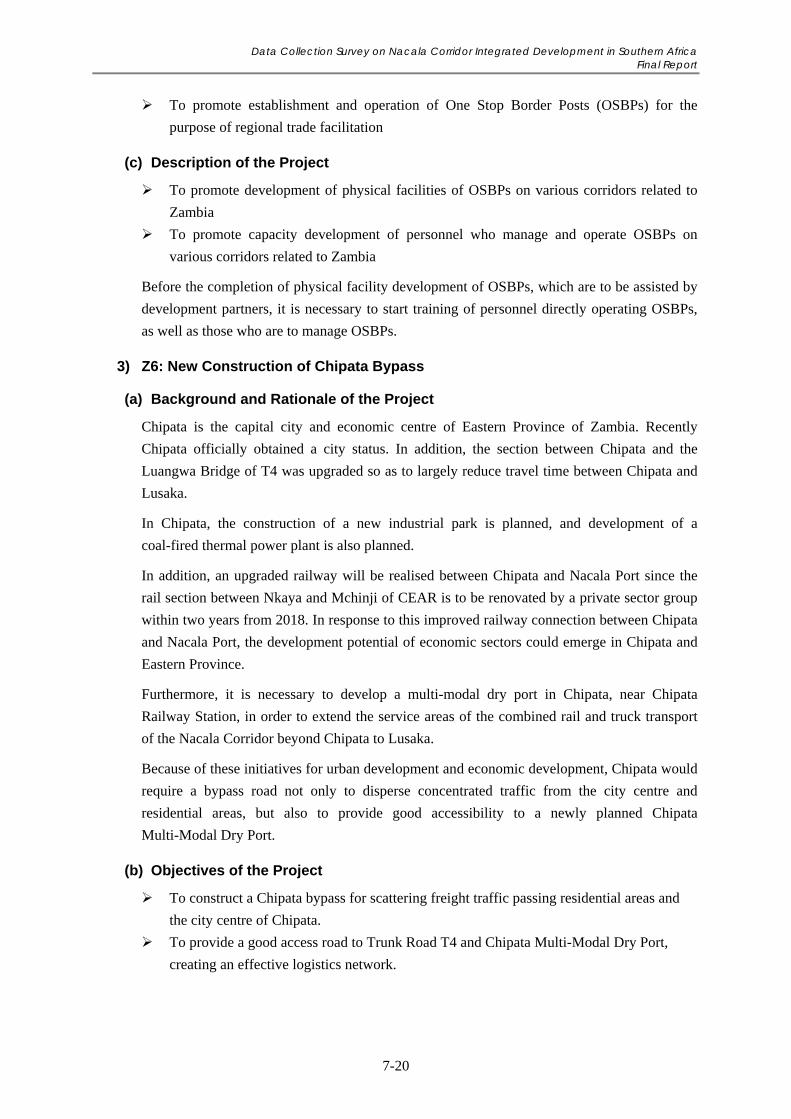
Data Collection Survey on Nacala Corridor Integrated Development in Southern Africa Final Report
7-20
To promote establishment and operation of One Stop Border Posts (OSBPs) for the
purpose of regional trade facilitation
(c) Description of the Project
To promote development of physical facilities of OSBPs on various corridors related to
Zambia
To promote capacity development of personnel who manage and operate OSBPs on
various corridors related to Zambia
Before the completion of physical facility development of OSBPs, which are to be assisted by
development partners, it is necessary to start training of personnel directly operating OSBPs,
as well as those who are to manage OSBPs.
3) Z6: New Construction of Chipata Bypass
(a) Background and Rationale of the Project
Chipata is the capital city and economic centre of Eastern Province of Zambia. Recently
Chipata officially obtained a city status. In addition, the section between Chipata and the
Luangwa Bridge of T4 was upgraded so as to largely reduce travel time between Chipata and
Lusaka.
In Chipata, the construction of a new industrial park is planned, and development of a
coal-fired thermal power plant is also planned.
In addition, an upgraded railway will be realised between Chipata and Nacala Port since the
rail section between Nkaya and Mchinji of CEAR is to be renovated by a private sector group
within two years from 2018. In response to this improved railway connection between Chipata
and Nacala Port, the development potential of economic sectors could emerge in Chipata and
Eastern Province.
Furthermore, it is necessary to develop a multi-modal dry port in Chipata, near Chipata
Railway Station, in order to extend the service areas of the combined rail and truck transport
of the Nacala Corridor beyond Chipata to Lusaka.
Because of these initiatives for urban development and economic development, Chipata would
require a bypass road not only to disperse concentrated traffic from the city centre and
residential areas, but also to provide good accessibility to a newly planned Chipata
Multi-Modal Dry Port.
(b) Objectives of the Project
To construct a Chipata bypass for scattering freight traffic passing residential areas and
the city centre of Chipata.
To provide a good access road to Trunk Road T4 and Chipata Multi-Modal Dry Port,
creating an effective logistics network.
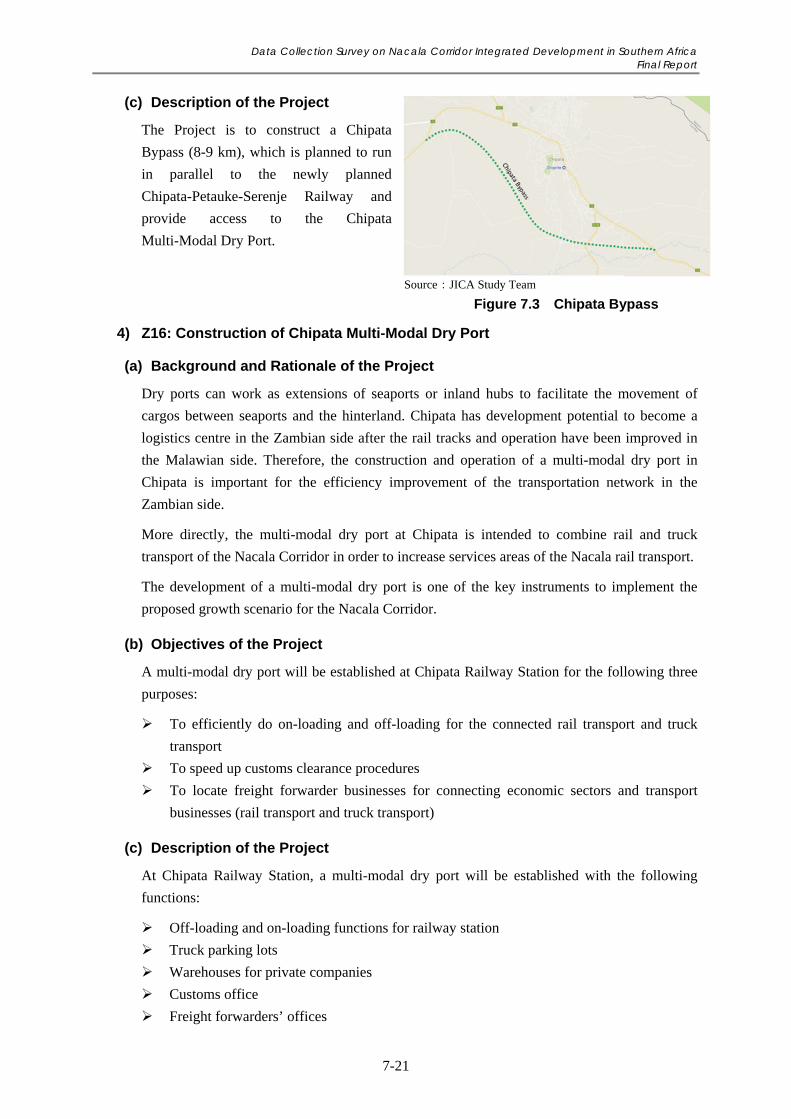
Data Collection Survey on Nacala Corridor Integrated Development in Southern Africa Final Report
7-21
(c) Description of the Project
The Project is to construct a Chipata
Bypass (8-9 km), which is planned to run
in parallel to the newly planned
Chipata-Petauke-Serenje Railway and
provide access to the Chipata
Multi-Modal Dry Port.
4) Z16: Construction of Chipata Multi-Modal Dry Port
(a) Background and Rationale of the Project
Dry ports can work as extensions of seaports or inland hubs to facilitate the movement of
cargos between seaports and the hinterland. Chipata has development potential to become a
logistics centre in the Zambian side after the rail tracks and operation have been improved in
the Malawian side. Therefore, the construction and operation of a multi-modal dry port in
Chipata is important for the efficiency improvement of the transportation network in the
Zambian side.
More directly, the multi-modal dry port at Chipata is intended to combine rail and truck
transport of the Nacala Corridor in order to increase services areas of the Nacala rail transport.
The development of a multi-modal dry port is one of the key instruments to implement the
proposed growth scenario for the Nacala Corridor.
(b) Objectives of the Project
A multi-modal dry port will be established at Chipata Railway Station for the following three
purposes:
To efficiently do on-loading and off-loading for the connected rail transport and truck
transport
To speed up customs clearance procedures
To locate freight forwarder businesses for connecting economic sectors and transport
businesses (rail transport and truck transport)
(c) Description of the Project
At Chipata Railway Station, a multi-modal dry port will be established with the following
functions:
Off-loading and on-loading functions for railway station
Truck parking lots
Warehouses for private companies
Customs office
Freight forwarders’ offices
Source:JICA Study Team
Figure 7.3 Chipata Bypass
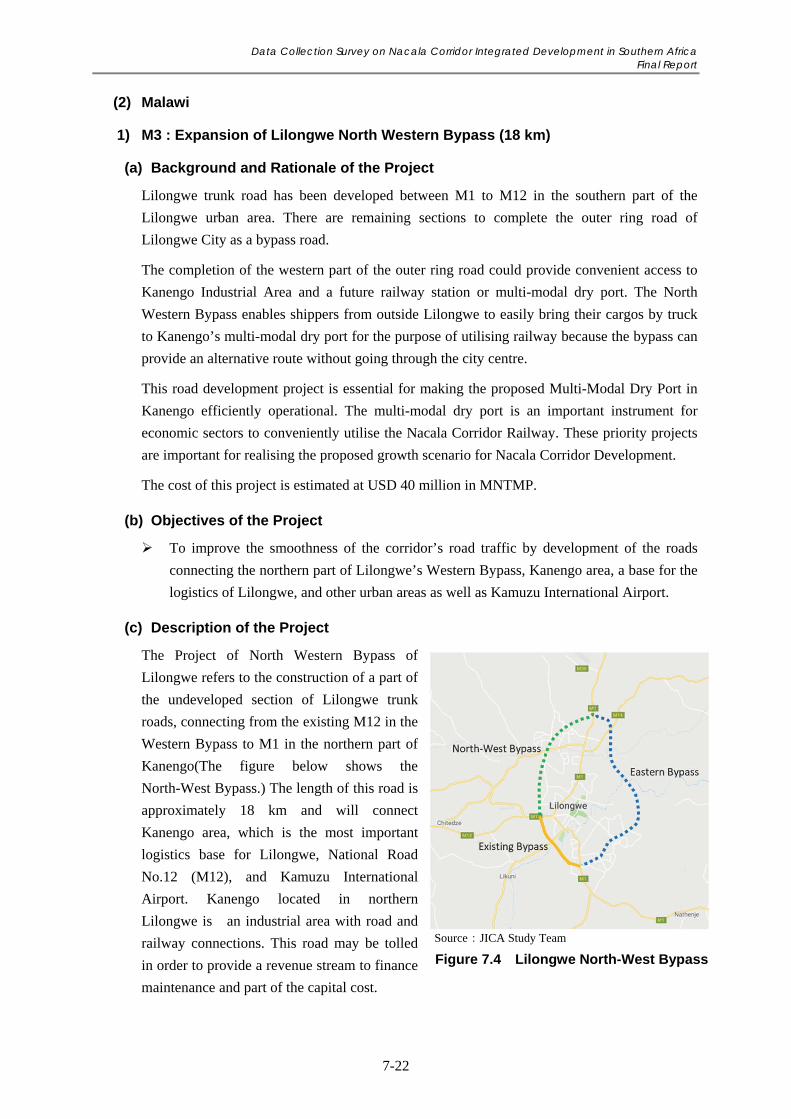
Data Collection Survey on Nacala Corridor Integrated Development in Southern Africa Final Report
7-22
(2) Malawi
1) M3 : Expansion of Lilongwe North Western Bypass (18 km)
(a) Background and Rationale of the Project
Lilongwe trunk road has been developed between M1 to M12 in the southern part of the
Lilongwe urban area. There are remaining sections to complete the outer ring road of
Lilongwe City as a bypass road.
The completion of the western part of the outer ring road could provide convenient access to
Kanengo Industrial Area and a future railway station or multi-modal dry port. The North
Western Bypass enables shippers from outside Lilongwe to easily bring their cargos by truck
to Kanengo’s multi-modal dry port for the purpose of utilising railway because the bypass can
provide an alternative route without going through the city centre.
This road development project is essential for making the proposed Multi-Modal Dry Port in
Kanengo efficiently operational. The multi-modal dry port is an important instrument for
economic sectors to conveniently utilise the Nacala Corridor Railway. These priority projects
are important for realising the proposed growth scenario for Nacala Corridor Development.
The cost of this project is estimated at USD 40 million in MNTMP.
(b) Objectives of the Project
To improve the smoothness of the corridor’s road traffic by development of the roads
connecting the northern part of Lilongwe’s Western Bypass, Kanengo area, a base for the
logistics of Lilongwe, and other urban areas as well as Kamuzu International Airport.
(c) Description of the Project
The Project of North Western Bypass of
Lilongwe refers to the construction of a part of
the undeveloped section of Lilongwe trunk
roads, connecting from the existing M12 in the
Western Bypass to M1 in the northern part of
Kanengo(The figure below shows the
North-West Bypass.) The length of this road is
approximately 18 km and will connect
Kanengo area, which is the most important
logistics base for Lilongwe, National Road
No.12 (M12), and Kamuzu International
Airport. Kanengo located in northern
Lilongwe is an industrial area with road and
railway connections. This road may be tolled
in order to provide a revenue stream to finance
maintenance and part of the capital cost.
Source:JICA Study Team
Figure 7.4 Lilongwe North-West Bypass
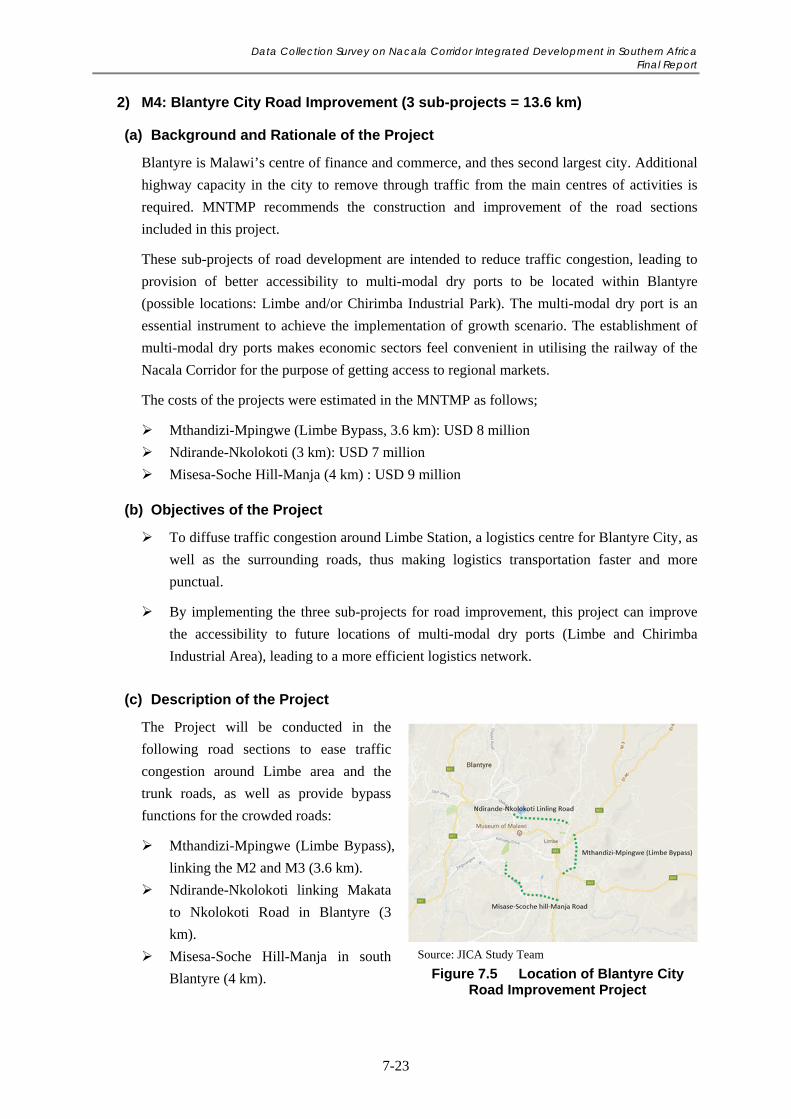
Data Collection Survey on Nacala Corridor Integrated Development in Southern Africa Final Report
7-23
2) M4: Blantyre City Road Improvement (3 sub-projects = 13.6 km)
(a) Background and Rationale of the Project
Blantyre is Malawi’s centre of finance and commerce, and thes second largest city. Additional
highway capacity in the city to remove through traffic from the main centres of activities is
required. MNTMP recommends the construction and improvement of the road sections
included in this project.
These sub-projects of road development are intended to reduce traffic congestion, leading to
provision of better accessibility to multi-modal dry ports to be located within Blantyre
(possible locations: Limbe and/or Chirimba Industrial Park). The multi-modal dry port is an
essential instrument to achieve the implementation of growth scenario. The establishment of
multi-modal dry ports makes economic sectors feel convenient in utilising the railway of the
Nacala Corridor for the purpose of getting access to regional markets.
The costs of the projects were estimated in the MNTMP as follows;
Mthandizi-Mpingwe (Limbe Bypass, 3.6 km): USD 8 million
Ndirande-Nkolokoti (3 km): USD 7 million
Misesa-Soche Hill-Manja (4 km) : USD 9 million
(b) Objectives of the Project
To diffuse traffic congestion around Limbe Station, a logistics centre for Blantyre City, as
well as the surrounding roads, thus making logistics transportation faster and more
punctual.
By implementing the three sub-projects for road improvement, this project can improve
the accessibility to future locations of multi-modal dry ports (Limbe and Chirimba
Industrial Area), leading to a more efficient logistics network.
(c) Description of the Project
The Project will be conducted in the
following road sections to ease traffic
congestion around Limbe area and the
trunk roads, as well as provide bypass
functions for the crowded roads:
Mthandizi-Mpingwe (Limbe Bypass),
linking the M2 and M3 (3.6 km).
Ndirande-Nkolokoti linking Makata
to Nkolokoti Road in Blantyre (3
km).
Misesa-Soche Hill-Manja in south
Blantyre (4 km).
Source: JICA Study Team
Figure 7.5 Location of Blantyre City Road Improvement Project
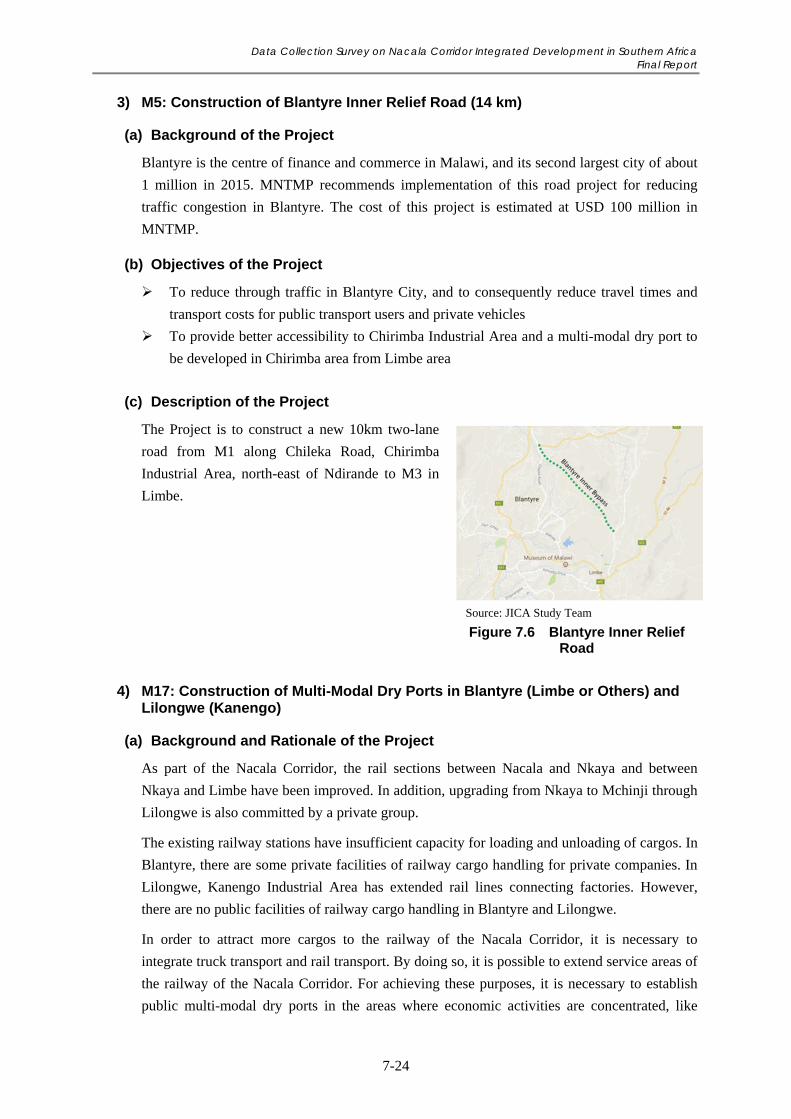
Data Collection Survey on Nacala Corridor Integrated Development in Southern Africa Final Report
7-24
3) M5: Construction of Blantyre Inner Relief Road (14 km)
(a) Background of the Project
Blantyre is the centre of finance and commerce in Malawi, and its second largest city of about
1 million in 2015. MNTMP recommends implementation of this road project for reducing
traffic congestion in Blantyre. The cost of this project is estimated at USD 100 million in
MNTMP.
(b) Objectives of the Project
To reduce through traffic in Blantyre City, and to consequently reduce travel times and
transport costs for public transport users and private vehicles
To provide better accessibility to Chirimba Industrial Area and a multi-modal dry port to
be developed in Chirimba area from Limbe area
(c) Description of the Project
The Project is to construct a new 10km two-lane
road from M1 along Chileka Road, Chirimba
Industrial Area, north-east of Ndirande to M3 in
Limbe.
4) M17: Construction of Multi-Modal Dry Ports in Blantyre (Limbe or Others) and Lilongwe (Kanengo)
(a) Background and Rationale of the Project
As part of the Nacala Corridor, the rail sections between Nacala and Nkaya and between
Nkaya and Limbe have been improved. In addition, upgrading from Nkaya to Mchinji through
Lilongwe is also committed by a private group.
The existing railway stations have insufficient capacity for loading and unloading of cargos. In
Blantyre, there are some private facilities of railway cargo handling for private companies. In
Lilongwe, Kanengo Industrial Area has extended rail lines connecting factories. However,
there are no public facilities of railway cargo handling in Blantyre and Lilongwe.
In order to attract more cargos to the railway of the Nacala Corridor, it is necessary to
integrate truck transport and rail transport. By doing so, it is possible to extend service areas of
the railway of the Nacala Corridor. For achieving these purposes, it is necessary to establish
public multi-modal dry ports in the areas where economic activities are concentrated, like
Source: JICA Study Team
Figure 7.6 Blantyre Inner Relief Road
Data Collection Survey on Nacala Corridor Integrated Development in Southern Africa Final Report
7-25
Blantyre, the economic centre of Southern Region and Lilongwe, the national capital and
economic centre of Central Region. Also in response to increasing traffic demand for the
Nacala Corridor Railway, it is necessary for Blantyre and Lilongwe to establish multi-modal
dry ports for combining rail transport and truck transport.
Establishment and operation of multi-modal dry ports are one of key elements for
implementing the proposed growth scenario for promoting Nacala Corridor Development. It
enables more economic sectors to conveniently utilise rail transport services in Malawi in
relatively lower transport costs than road transport. As a result, Malawi’s economic sectors
would generate more traffic demand for the combined rail and truck transport so as to sustain
the operation of the long-distance rail transport of the Nacala Corridor.
(b) Objectives of the Project
Multi-modal dry ports will be established and operated for the following three purposes:
To efficiently do on-loading and off-loading for connecting rail transport and truck
transport
To speed up customs clearance procedures
To locate freight forwarder businesses for connecting economic sectors and transport
businesses (rail transport and truck transport)
(c) Description of the Project
In Blantyre and Lilongwe, the Project is to establish multi-modal dry ports with the following
functions:
Off-loading and on-loading functions for railway stations
Truck parking lots
Warehouses for private companies
Customs office
Freight forwarders’ offices
5) M18: Capacity Development of Government Officers for OSBP Operation
(a) Background and Rationale of the Project
At present, there are no OSBPs operating in Malawi, while Zambia has already experienced
development and operation of OSBPs with Zimbabwe and Botswana. The establishment of
OSBPs is planned at several national borders in Malawi in cooperation with development
partners, such as WB and AfDB. These existing projects for establishment of OSBPs include
physical development and preparation of regulatory and institutional frameworks in which
OSBPs are operational.
To operate the OSBPs, coordination among authorities in two countries is required. It is also
necessary to train custom officers for the smooth operation of OSBPs.
The establishment and operation of OSBPs on road corridors is required for trade facilitation,
especially regional trade facilitation in the proposed growth scenario for promoting Nacala
Data Collection Survey on Nacala Corridor Integrated Development in Southern Africa Final Report
7-26
Corridor Development. Although rail transport of the Nacala Corridor is very effective in
promoting the development of the economic sectors targeting regional markets, truck transport
on road corridors is also very important to get access to regional markets less than 500 km
away.
(b) Objectives of the Project
To conduct capacity development for government officers (customs, immigration and
quarantine) related to OSBPs for smooth establishment and operation of OSBPs in
Malawi
(c) Description of the Project
Capacity development will be conducted for related institutions (customs, immigration and
health) to install the OSBPs as follows:
To enhance capacity of customs officers including the basic understanding of objectives
of developing and operation of OSBPs, by emphasising the importance of the operation
of a customs union
To enhance capacity of immigration officers and health officers for the efficiency of the
border crossing of goods and people
The Project is to train a wide range of government officers related to OSBPs, not only from
operating officers but also managers and directors. The Project is to also emphasise the
changes of mind set of government officers related to OSBPs by visiting operational OSBPs in
Zambia.
6) M42: Improvement of Electricity Supply for Industrial Areas in Lilongwe and Blantyre
(a) Background and Rationale of the Project
The upgraded railway and roads of the Nacala Corridor will create a better business
environment not only to agricultural sector but also to agro-processing industries, due to
reduced long-distance transport costs and time, as well as to reduced prices of fertiliser and
fuel. According to the proposed growth scenario for promoting Nacala Corridor Development,
this enhanced business environment would create development potential for the economic
sectors targeting regional markets.
In order to take advantage of this enhanced business environment, it is necessary to improve
other economic infrastructures rather than transport infrastructures. One of the priority
economic infrastructures is electricity supply in urban areas, especially for industrial areas.
This effort at economic sector development would, in turn, generate traffic demand to sustain
the upgraded transport infrastructure of Nacala Corridor.
(b) Objectives of the Project
To stabilise electricity supply to industrial areas in Malawi by rehabilitation and
construction of substations
Data Collection Survey on Nacala Corridor Integrated Development in Southern Africa Final Report
7-27
(c) Description of the Project
In order to improve the electricity supply in Lilongwe and Blantyre, construction of new
substations and rehabilitation of existing substations in the industrial areas of Lilongwe and
Blantyre are to be implemented.
To conduct rehabilitation and upgrading the existing substations which supply electricity
to Kanengo in Lilongwe
To construct new substations, and to rehabilitate and upgrade the existing substations
which supply electricity to Limbe/Chirimba areas in Blantyre
7.3.2 Promotion of Economic Sectors Along Nacala Corridor
(1) Zambia
1) Z31 : Promotion of Export Oriented Agriculture and Livestock Development Targeting Small Scale Farmers in Eastern Province
(a) Background and Rationale of the Project
By improvement of the Nacala Corridor (combined railway and road), the price of fertiliser is
expected to be lower than now. There is also a possibility to reduce transportation costs to
Malawi, Mozambique, and other countries in the regional markets such as Kenya and Ethiopia
through Nacala Port.
Eastern Province holds the largest number of small-scale farmers in the country. This province
is an agricultural production area. But its growth is stagnant due to the decrease of the tobacco
industry, etc. Therefore, development of the Nacala Corridor is an opportunity to redevelop
agriculture in this region.
(b) Objectives of the Project
To improve the crop production for export by small scale farmers who are the majority in
Eastern Province, to strengthen cooperation among those agricultural producers, markets,
traders and processing industry operators, and to promote agribusiness development
targeting small scale farmers in this region. The necessary capacity building of the
relevant public agencies shall be carried out.
(c) Description of the Project
In order to expand the production and marketing of maize and soya bean by small farmers,
the following three measures are examined.
‐ Introduce the Zambia Commodity Exchange (ZAMACE) to small scale farmers’
cooperatives in order to strengthen the organisations through co-marketing with
them.
‐ Collaborate with existing cotton and tobacco companies, in order to establish
assembling systems of maize and soya bean produced by the out-growers. The
products will be purchased by the companies, other market platforms such as
ZAMACE and milling/processing plants.
Data Collection Survey on Nacala Corridor Integrated Development in Southern Africa Final Report
7-28
‐ Cooperate with the support activities for small scale farmer by COMACO and CEEC
for example. It aims to promote improvement of production by their activities and to
make a co-shipment system of agricultural products through this network. It also
promotes collaboration with market platforms such as ZAMACE or processing
companies.
To promote collaboration between agricultural producers/cooperatives and oil companies
located in Eastern Province or Lusaka, poultry producers, and warehouse traders through
interventions of the public institutions.
To promote the raising of poultry or small ruminants as self-savings of farmers who find
it difficult to access finances, and to formulate their market in Eastern Province through
the introduction of qualified varieties and guidance of a breeding regime.
2) Z32: Study on Farm Block Development Models with Special Consideration for Small Scale Farmers
(a) Background and Rationale of Project
The GOZ has a policy and programme for setting up Farm Blocks all over the country to
archive economic diversification and growth, national food security and poverty reduction
through promoting commercial agriculture production by the private sector. However, its
implementation has not progressed as planned at this moment, as a result of delayed
infrastructure development by the government. In particular, Farm Blocks in remote areas
have not been developed because they are less attractive for private operators to invest and
have no incentive to proceed infrastructure development.
The development of Farm Blocks should bring benefits not only to the core investors and
migrants from outside who will work in the Farm Blocks, but also the small scale farmers who
live in and around Farm Blocks. Moreover, it must prevent the occurrence of any negative
impacts on the local communities and inhabitants by the investment and operation of the
business. Necessary actions to maintain such principals for the investment should be included
in the programme of Farm Block development.
The existing Farm Block plans have accommodated operators and large-scale farmers whose
large-scale farming operations are expected to have a good impact on local economies and
agriculture. However, in many cases, such large scale farmers have weak linkage with the
surrounding small-scale farmers in commodity trading and procurement of chemical inputs, as
well as in out-grower relationships. In addition, the out-grower model implemented by various
kinds of agribusiness company with small scale farmers is currently still under development.
Therefore, an appropriate working model for collaboration between operators and small scale
farmers in the out-grower scheme or other relationships is required for sound development of
Farm Blocks.
The proposed growth scenario for promoting Nacala Corridor Development emphasised the
possibility and importance of exporting agricultural products to regional markets by taking
advantage of the upgraded transport infrastructure of the Nacala Corridor and also by
revitalising the railway utilisation of other corridors. In this sense, in Zambia, it needs to
Data Collection Survey on Nacala Corridor Integrated Development in Southern Africa Final Report
7-29
expand the production for export targeting regional markets. The expansion of the production
and export through the promotion of large-scale agriculture would depend on the progress of
Farm Blocks. Therefore, it is important to improve the model of Farm Block development
which pays attention to the small scale farmers in the region, and processes by involving them
in the production activities.
(b) Objectives of the Project
To improve the Farm Block development model by conducting a study covering various
issues faced by the Farm Block Programme that is slow in implementation because of
delayed infrastructure development, and by attracting private investment for promoting
export to regional markets
To improve the Farm Block development model by clarifying necessary considerations
for small scale farmers and collaboration with them in production activities.
To prepare a Master Plan on a specific Farm Block, including the division of roles among
the government, operators and other stakeholders related to the Farm Block
(c) Description of the Project
To achieve the first objective mentioned above, the project will conduct a study on the
improvement of Farm Block development covering the following points.
Clarification of role sharing between the government and private sector in infrastructure
development, and review of the feasibility of the project
Examination of the relationship between the private sectors’ burden and incentive to
promote the investment
Examination of implementation principles and guidelines including required
environmental and social considerations and explanation to local small scale farmers for
example, which are necessary during the implementation of the programme
Consideration on a potential managing structure to implement the principles and
guidelines above
Study on a cooperation method between large scale farms and small scale farmers, which
can be incorporated into Farm Block development
Consideration of market access of the crops produced by large-scale farms located in the
Farm Block and by surrounding small-scale farmers (survey on convenience of export
procedures),
Proposition of a new model (improved model) of Farm Block development from a
comprehensive point of view
Examination of methods for revitalising existing Farm Blocks
To achieve the second objective, based on the improved model of Farm Block development, a
master plan for Farm Block development in a particular area will be formulated for a pilot
project. However, if a core operator is not yet decided on the specific Farm Block, it is
difficult to decide cultivated crops and the Master Plan would become at the outline design
level.
Data Collection Survey on Nacala Corridor Integrated Development in Southern Africa Final Report
7-30
3) Z39: Export Strategy Formulation Study for Zambia
(a) Background and Rationale of the Project
The 7NDP emphasised the importance of export-oriented industries, such as export-oriented
agriculture and mining. However, there is no clear strategy or direction to promote export.
There are conflicting policies and practices that work as barriers to export promotion such as
restrictive policies on the export of maize, wheat, sugar, cement, etc.
Zambia is a member of SADC, COMESA, and COMESA-EAC-SADC Tripartite Agreement
which aim to promote regional trade for regional economic integration. The majority of
non-traditional exports from Zambia, such as non-copper mining products, and maize and
other agricultural products, are destined to the member states of SADC and COMESA.
Promoting trade with the member states of SADC and COMESA will contribute to
diversification of the economy by expanding non-traditional export. Thus, this project aims to
formulate a country-wide export strategy for export promotion paying attention to both of
regional markets and outside regional markets (overseas markets).
The proposed growth scenario for Zambia identified the following potential products and
economic sectors which could target regional market:
Maize
Soya bean
Wheat
Cotton
Edible oil
Sugar
Bovine Meat
Small Ruminants (Goat/ Sheep)
Poultry
Soaps and synthetic preparations
The upgrading of combined rail and truck transport of the Nacala Corridor can encourage
Zambia’s economic sectors to make an important shift to the expansion of production and
export targeting regional markets (both inland neighbouring countries and coastal countries).
The upgraded transport functions of the Nacala Corridor could reduce the prices of fertiliser
and fuel in Zambia, so that Zambia’s economic sectors could receive benefits from the
development of the Nacala Corridor for expanding the production and export.
(b) Objectives of the Project
The objective of the Project is to formulate an export strategy for Zambia for the following
purposes:
To identify export-oriented commodities and products,
To develop country-wide export strategies,
To remove various export barriers, and
To establish consistent and integrated institutional frameworks for promotion of export.
Data Collection Survey on Nacala Corridor Integrated Development in Southern Africa Final Report
7-31
(c) Description of the Project
The Project is to conduct a study covering the following four points:
To identify and develop export-oriented products and commodities
‐ To identify potential export-oriented products and commodities in agricultural,
agri-business, mining, and manufacturing sectors with targeted markets of each of
the commodities and products, by examining the competitiveness of those goods and
advantages in proximity and transport cost, and other factors. The export-oriented
products and commodities include both currently available and unavailable goods in
Zambia, but with a potential to be produced in the country. The targeted markets of
the goods could be different in the short-term and long-term.
‐ To review restrictive tariff and non-tariff barriers working against exports such as
export bans and licensing requirements for export, measures to protect domestic
markets that result in the distortion of prices, border management, customs procedure,
etc., in Zambia and export targeted countries. Especially, several restrictive measures
taken on export of agriculture and agri-processing products from the perspective of
national food security are reviewed and an alternative mechanism will be examined.
To develop country-wide export strategies for promotion of export
‐ To develop export strategies for export promotion of the identified products in the
short-term and long-term.
To develop an action plan to be taken to implement the export strategies, including
projects and programmes
‐ To develop an action plan consisting of projects and programmes to be implemented.
The projects and programmes may cover standardisation and quality control,
improvement of business and investment environment, border management and
export procedures, infrastructure development, capacity building, law and legal
framework, etc.
To propose an integrated institutional framework for export promotion
‐ To propose a streamlined, integrated institutional framework for export promotion by
modifying conflicting and restrictive rules and regulations for the implementation of
the export strategies and action plan. This institutional framework should also work
for regional economic integration.
(2) Malawi
1) M27: Groundnut Production Revitalisation with Special Attention to Aflatoxin Control
(a) Background and Rationale of the Project
In 2012, the GOM conducted a study to understand the sanitary and phytosanitary (SPS)
issues which become causes of limiting export opportunities for the country, with support of
USAID. Improvement of aflatoxin mitigation, management and control for groundnuts was
Data Collection Survey on Nacala Corridor Integrated Development in Southern Africa Final Report
7-32
identified as one of the top four issues that the country needed to address for the export
growth2.
Malawi used to be one of the largest exporters of groundnuts in SADC and COMESA.
However, due to the aflatoxin contamination, Malawi is not allowed to export to strictly
regulated countries regarding aflatoxin, such as the EU and South Africa. At present,
groundnuts produced in Malawi are exported to countries with lax regulation on aflatoxin. Due
to the aflatoxin problems, low purchasing prices of groundnuts are prevalent, resulting in the
decrease of groundnut production.
Moreover, in Malawi, it is said that the 60% of groundnuts sold in shops and supermarkets
were found to have aflatoxin levels exceeding those considered safe for human consumption3.
In the future, along with growing consciousness of food quality and people’s health, it may be
highly probable that the strict regulation would be applied to both export and domestic
markets.
Although Malawi does not have an exact policy for aflatoxin control, in 2013, the MAPAC
was proposed for further consultations with relevant actors/stakeholders. The MAPAC
suggested the road map as follows.
i) Immediate Steps
Component 1 – Mainstreaming (Integration) good practices and technologies into
the key value chain
1.1 Assessment and Research
1.2 Strengthening supply-chain coordination for mainstreaming practices/
technologies
Component 2 – Testing, accreditation and policies
Component 3 – Public awareness, advocacy and consumer education
Based on the MAPAC, the government and development partners in Malawi are actively
engaging with groundnut farmers to reduce aflatoxin throughout the value chain. Interventions
has been carried out, including farmers’ training on soil management, planting, applying of
biological control4, post-harvest processing and consumer awareness campaigns to increase
the demand for low-aflatoxin groundnuts5.
At this moment, since transport infrastructure of the Nacala Corridor has been upgraded and
export opportunities are increasing, there would be a larger chance for the export expansion of
the crops with advantages in their production in Malawi. Groundnuts have a large potential to
be produced and exported if aflatoxin is properly controlled. Therefore, in order to establish
2 Malawi Programme for Aflatoxin Control (MAPAC), September 2013 3 IFPRI MASSP Policy Note 21, April 2015 4 https://www.times.mw/saving-malawis-maize-groundnuts-from-aflatoxins/ 5 IFPRI MASSP Policy Note 21, April 2015
Data Collection Survey on Nacala Corridor Integrated Development in Southern Africa Final Report
7-33
the supply-chain of groundnuts for export, a strategy should be prepared based on the facts
confirmed and technologies developed in the previous activities.
(b) Objectives of the Project
The strengthening of a supply chain for the production and export of groundnuts with aflatoxin
control is essential. The Project aims to propose a strategy to build the supply chain from
production, storage, distribution of groundnuts, until export. In order to establish the supply
chain and recover the production of groundnuts by small scale farmers, interests of all
stakeholders in the chain should be considered and also aligned.
(c) Description of the Project
The Project is to start with the formulation of a proper implementation structure as follows:
Conducting stakeholder analysis regards to the aflatoxin control and export promotion
with related ministries, research institutes, development partners, NGOs, business entities
and other stakeholders in accordance with its cross-cutting characteristics.
‐ Examine supply chain models for aflatoxin control for export of groundnuts
‐ Review improved practices for aflatoxin control in every stage of the supply chain,
such as production, storage in the field, distribution, storage in warehouse, testing
and shipping.
‐ Compare the practices from viewpoints of quality, confidence, cost-effective, risk
etc.
‐ Prepare a draft model to establish the supply chain with aflatoxin control and to be
tested in the next stage
Conducting trial shipping by applying the recommended practices
‐ Production of groundnuts
Organise farmers’ groups or cooperatives to participate in the trial for production
and collective shipping of groundnuts.
Disseminate the improved cultivation methods of groundnuts for aflatoxin
control.
Discuss and negotiate with traders how to handle the low-aflatoxin products
including negotiation about price premier.
‐ Distribution of groundnuts
Conduct the trial for the improved methods of collection and storage of
groundnuts with considering aflatoxin control and applying a traceable
mechanism for export
Discuss about the improved methods with the stakeholders in the trade and
distribution sector for groundnuts, including verification of the export promotion
incentives to expand the export to the countries with the strict regulations on
groundnut import.
‐ Enhancement of testing/accreditation for groundnuts
Compare the current testing and improved methods
Data Collection Survey on Nacala Corridor Integrated Development in Southern Africa Final Report
7-34
Diffuse the simple method developed in the Project
Preparing a guideline for export of groundnuts with consideration on aflatoxin control
Conducting awareness campaigns
Implementation of campaigns for consumers, producers, trader and distributors
2) M30: Improvement of Market Access for Small-Scale Rice Farmers
(a) Background and Rationale of the Project
As described in 6.8, rice has a high potential for Malawi as an export crop due to high
demands in the surrounding counties. Moreover, according to the National Irrigation Master
Plan in Malawi, new irrigation schemes are planned to develop about 40,000 - 70,000 ha, and
financial commitments on the irrigation schemes are progressing well. As a result, the rice
production in Malawi shall be increased.
At present, a license is required for rice export, which means the restriction on rice export by
the government. However, if the domestic rice production will increase, rice export can be
promoted, especially to regional markets by taking advantage of the upgraded transport
infrastructure of the Nacala Corridor.
On the other hand, a rice value chain is not yet established in Malawi. Currently, rice is
produced by small scale farmers, most of whom do not have access to potential viable markets.
Therefore, they rely on seasonal vendors. The farmers neither have the price bargaining power
nor storage capacity, and as a result, they have no choice but to sell it at a cheap price. Also,
such small-scale sales result in high cost of distribution, which in turn leads to decline of price
competitiveness of Malawi’s rice.
Therefore, it is extremely important as an activity towards export of rice in Malawi, to
establish a rice value chain and an efficient rice distribution system together with increase in
rice production in Malawi. In addition, it is also necessary to establish a production system of
brand rice with high market demand. By distributing more profits to the farmers through such
activities, incentives for improving productivity of small scale farmers should be created
together with rice export promotion.
(b) Objectives of the Project
Provide information to rice-producing farmers to improve market access in nationwide
irrigation schemes for rice production. Through strengthening linkages between farmers
and distribution systems, establishing a sustainable rice value chain will be encouraged.
Disseminate information and opportunities as fairly as possible to the groups participating
in all the irrigation schemes operating in Malawi and support the growth of the potential
organisations by using the private sector’s vitality.
(c) Description of the Project
The Project is to cover the following tasks:
Data Collection Survey on Nacala Corridor Integrated Development in Southern Africa Final Report
7-35
To improve access to markets for small-scale rice farmers (realise co-shipment)
To introduce the use of Commodity Exchange such as ACE or AHCX (also
introducing transportation services, production assistance and storage scheme
provided by AHCX in cooperation with NASFAM) as a possible measure for
co-shipment among cooperatives or small groups of farmers in existing or new
irrigation schemes for rice production.
As a pilot activity, under cooperation with private enterprises (principally a trading
or processing company), to conduct several training sessions for producers’
organizations, such as corporate training (basic capacity development such as
accounting, management, etc., especially for young people), lending and contract
system. This outcome is compiled in a manual.
To do branding for promotion of rice exports from Malawi
To strengthen the production system of brand seeds.
To disseminate the method on cultivation and storage at the field level for
establishing the brand.
To support creation of a value chain of the brand varieties through consultation with
vendors/distributors.
To improve the production of rice under the irrigation scheme as pilot activity
To introduce the improved practices for rice production in the scheme.
To rehabilitate irrigation scheme in order to increase the functionality of the scheme
for effective water management (or may develop a new scheme).
To prepare an extension kit for rice production and distribute it for irrigation scheme
managers and extension workers.
Data Collection Survey on Nacala Corridor Integrated Development in Southern Africa Final Report
7-36
Appendix for Chapter 7: Points to be Considered for Farming Plan
(1) Case 1- Export-Oriented Agriculture for Small Scale Farmers in Eastern Province,
Zambia
1) Location of Markets and Production Capacity
Maize, soya beans and poultry farming are recommended in this project due to the possibility of
expansion of regional markets. Thus, it is indispensable to estimate the capacity of production
thoroughly and decide the quantity and season to be shipped for each product.
2) Identification of Production/Processing Sites
Those recommended products can be grown in Eastern Province due to ecological conditions,
but it is necessary to check all natural conditions such as temperature, land form, water capacity
etc., specifically, and to choose suitable land and location for cultivation
3) Technical Aspects
According to the requirements of targeted markets, varieties of inputs, appropriate time and
techniques for production should be well examined and applied. Technical assistance regardless
from public or private organisations must be checked and utilised to improve productivity,
especially for small scale farmers.
4) Agricultural Support System on Agriculture Production and Agribusiness
It is possible to involve or collaborate with governmental support such as FISP, FARM BLOCK,
etc. and other extension services by a farmers’ union, NGOs or other projects.
5) Social- Environmental Issues
It is indispensable to consider environmental friendly development both of agriculture
production and agribusiness since Eastern Province has national parks, forest reserves and game
management areas where wild species are living. The conservation agriculture should be
practised near such reserves.
6) Protection of Rights of Small Scale Farmers and Rural Communities
In order to prevent the programme from adversely affecting small scale farmers, it is necessary
to develop and appropriately enforce a measure to protect the rights of small scale farmers and
rural communities, and to raise awareness of the farmers and enterprises on those rights.
7) Other Risks
Other risks such as climate change, bankruptcy of traders, processing companies and financial
institutions, vacancy of public extension officers which small scale farmers rely on should also
be considered.
Data Collection Survey on Nacala Corridor Integrated Development in Southern Africa Final Report
7-37
(2) Case 2- Rice Production in Irrigated Land in Malawi
1) Location of Markets and Production Capacity
It is indispensable to estimate the market capacity for rice thoroughly and decide the quantity of
the production and season to ship rice and other products which can be combined with rice. The
production season should be adjusted to marketability if water control can be done.
2) Identification of Production/Processing Sites
Rice is probably grown in the irrigation schemes due to the ecological condition, but it is
necessary to check all natural conditions such as temperature, land form, water capacity etc.
specifically, and to choose suitable land and location for production for selected seed varieties,
cropping season and techniques and technology to be applied (see below)
3) Technical Aspects
According to the requirements of targeted markets, varieties of inputs, appropriate time and
techniques for production should be well examined and applied. Technical assistance regardless
of public or private organisations must be checked and utilised to improve productivity
especially for small scale farmers.
4) Agricultural Supporting Systems on Agriculture Production and Agribusiness
It is possible to involve or to collaborate with governmental support such as FISP, extension
offices etc. and other extension services by FUN, NASFAM, NGOs or other projects.
5) Social-Environmental Issues
Social and environmental issues should be considered when irrigation schemes are developed.
After starting rice production in the developed schemes, these issues need to be kept under
consideration because new issues can emerge such as conflict between beneficiaries and
non-beneficiaries, degradation soil and effect to environment nearby etc.
6) Other Risks
Other risks such as climate change, bankruptcy of traders, processing companies, financial
institutions, vacancy of public extension officers which small scale farmers rely on should also
be considered.
ANNEX : Records of the Seminars
A-1
1. Summary of the Seminars
(1) Seminar in Johannesburg
Date and time : On 27 November 2017, PM 1 :00 to PM3:00
Place : Meeting room in JETRO Johannesburg
Number of Participants : 37 in total (mainly from Japanese Entities in Johannesburg)
Agenda:
① Opening remarks by JICA South Africa Office
② Presentation on Development Potential, Scenarios, and Necessary Actions for Development of
Nacala Corridor and Region
③ Questions and Answers
④ Wrap up
(2) Seminar in Lusaka
Date and time : 1st of December 2017, AM 9:00 to PM 4:00
Place : Southern Sun Ridgeway Hotel(Lusaka)
Number of Participants : 63 in total(mainly from Governmental Officials of Zambia and Malawi,
development partners)
Agenda ;
① Opening remarks by MOTC of Zambia
② Presentation on Development Potential, Scenarios, and Necessary Actions for Development of
Nacala Corridor and Region
③ Presentation of the APIEX of Mozambique
④ Questions and Answers
⑤ Group Discussion
i. Is the proposed growth scenario appropriate?
The advantage of the Nacala Corridor is the upgraded railway and its improved operation.
In the results, the economic sectors could benefit from the reduced costs of the transport,
and the reduced price of fertilizers and fuels.
ii. How can economic sectors utilize advantages or good impacts of Nacala Transport Corridor?
iii. Are the proposed priority projects for economic sectors and the same related to transport
enough?
iv. Are there any good ways to collaborate among three countries for the Nacala Corridor
Development?
⑥ Closing Remarks by MOTC of Zambia
⑦ Closing Remarks by Representative of MOTPW of Malawi
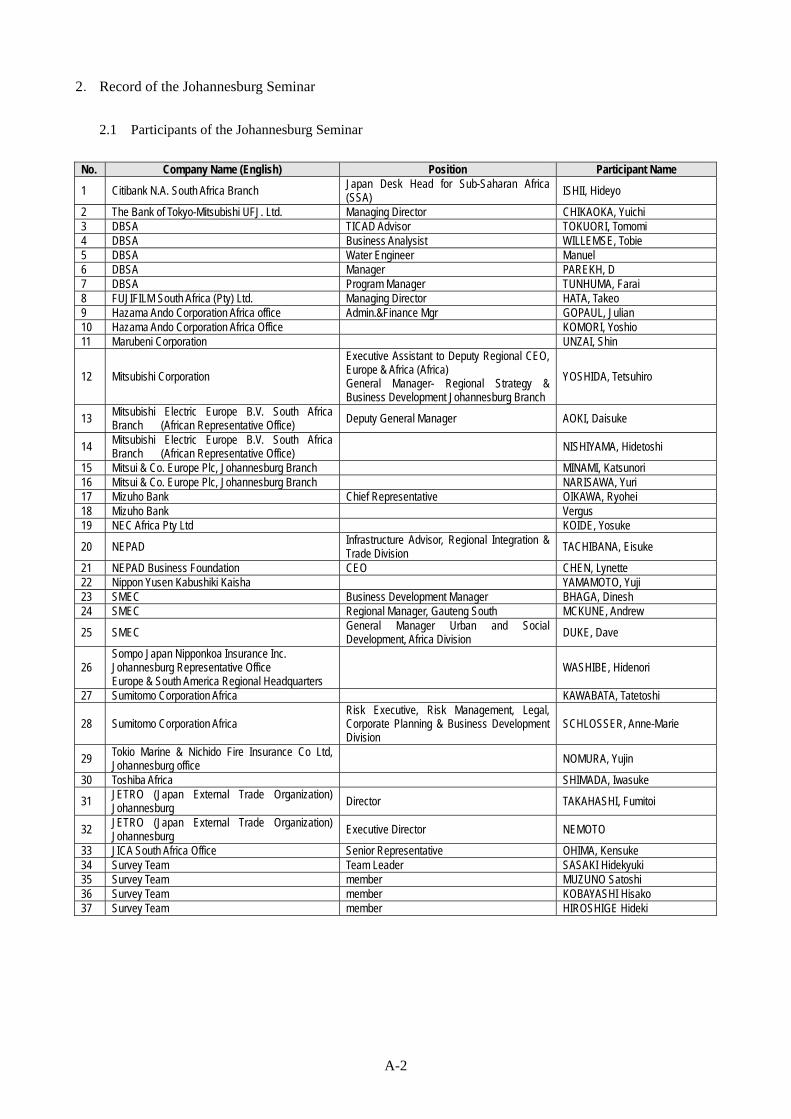
A-2
2. Record of the Johannesburg Seminar
2.1 Participants of the Johannesburg Seminar
No. Company Name (English) Position Participant Name
1 Citibank N.A. South Africa Branch Japan Desk Head for Sub-Saharan Africa (SSA) ISHII, Hideyo
2 The Bank of Tokyo-Mitsubishi UFJ. Ltd. Managing Director CHIKAOKA, Yuichi 3 DBSA TICAD Advisor TOKUORI, Tomomi 4 DBSA Business Analysist WILLEMSE, Tobie 5 DBSA Water Engineer Manuel 6 DBSA Manager PAREKH, D 7 DBSA Program Manager TUNHUMA, Farai 8 FUJIFILM South Africa (Pty) Ltd. Managing Director HATA, Takeo 9 Hazama Ando Corporation Africa office Admin.&Finance Mgr GOPAUL, Julian 10 Hazama Ando Corporation Africa Office KOMORI, Yoshio 11 Marubeni Corporation UNZAI, Shin
12 Mitsubishi Corporation
Executive Assistant to Deputy Regional CEO, Europe & Africa (Africa) General Manager- Regional Strategy & Business Development Johannesburg Branch
YOSHIDA, Tetsuhiro
13 Mitsubishi Electric Europe B.V. South Africa Branch (African Representative Office) Deputy General Manager AOKI, Daisuke
14 Mitsubishi Electric Europe B.V. South Africa Branch (African Representative Office) NISHIYAMA, Hidetoshi
15 Mitsui & Co. Europe Plc, Johannesburg Branch MINAMI, Katsunori 16 Mitsui & Co. Europe Plc, Johannesburg Branch NARISAWA, Yuri 17 Mizuho Bank Chief Representative OIKAWA, Ryohei 18 Mizuho Bank Vergus 19 NEC Africa Pty Ltd KOIDE, Yosuke
20 NEPAD Infrastructure Advisor, Regional Integration & Trade Division
TACHIBANA, Eisuke
21 NEPAD Business Foundation CEO CHEN, Lynette 22 Nippon Yusen Kabushiki Kaisha YAMAMOTO, Yuji 23 SMEC Business Development Manager BHAGA, Dinesh 24 SMEC Regional Manager, Gauteng South MCKUNE, Andrew
25 SMEC General Manager Urban and Social Development, Africa Division DUKE, Dave
26 Sompo Japan Nipponkoa Insurance Inc. Johannesburg Representative Office Europe & South America Regional Headquarters
WASHIBE, Hidenori
27 Sumitomo Corporation Africa KAWABATA, Tatetoshi
28 Sumitomo Corporation Africa Risk Executive, Risk Management, Legal, Corporate Planning & Business Development Division
SCHLOSSER, Anne-Marie
29 Tokio Marine & Nichido Fire Insurance Co Ltd, Johannesburg office NOMURA, Yujin
30 Toshiba Africa SHIMADA, Iwasuke
31 JETRO (Japan External Trade Organization) Johannesburg Director TAKAHASHI, Fumitoi
32 JETRO (Japan External Trade Organization) Johannesburg Executive Director NEMOTO
33 JICA South Africa Office Senior Representative OHIMA, Kensuke 34 Survey Team Team Leader SASAKI Hidekyuki 35 Survey Team member MUZUNO Satoshi 36 Survey Team member KOBAYASHI Hisako 37 Survey Team member HIROSHIGE Hideki
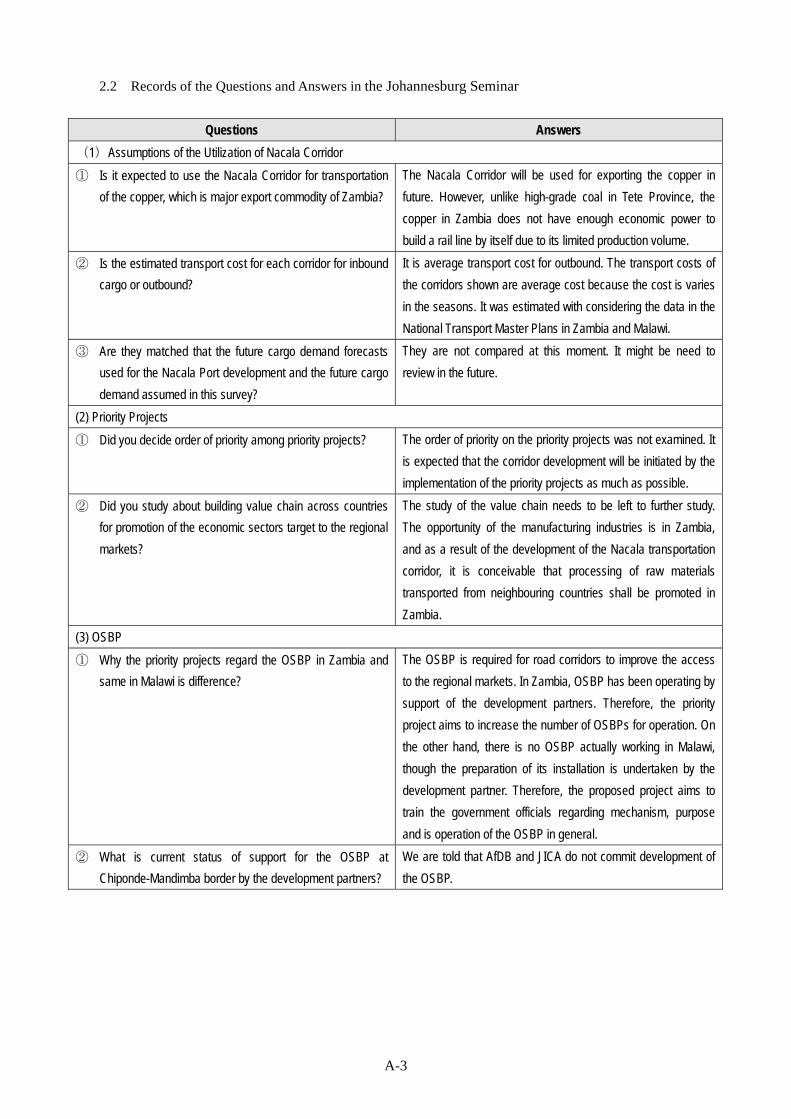
A-3
2.2 Records of the Questions and Answers in the Johannesburg Seminar
Questions Answers
(1)Assumptions of the Utilization of Nacala Corridor
① Is it expected to use the Nacala Corridor for transportation
of the copper, which is major export commodity of Zambia?
The Nacala Corridor will be used for exporting the copper in
future. However, unlike high-grade coal in Tete Province, the
copper in Zambia does not have enough economic power to
build a rail line by itself due to its limited production volume.
② Is the estimated transport cost for each corridor for inbound
cargo or outbound?
It is average transport cost for outbound. The transport costs of
the corridors shown are average cost because the cost is varies
in the seasons. It was estimated with considering the data in the
National Transport Master Plans in Zambia and Malawi.
③ Are they matched that the future cargo demand forecasts
used for the Nacala Port development and the future cargo
demand assumed in this survey?
They are not compared at this moment. It might be need to
review in the future.
(2) Priority Projects
① Did you decide order of priority among priority projects? The order of priority on the priority projects was not examined. It
is expected that the corridor development will be initiated by the
implementation of the priority projects as much as possible.
② Did you study about building value chain across countries
for promotion of the economic sectors target to the regional
markets?
The study of the value chain needs to be left to further study.
The opportunity of the manufacturing industries is in Zambia,
and as a result of the development of the Nacala transportation
corridor, it is conceivable that processing of raw materials
transported from neighbouring countries shall be promoted in
Zambia.
(3) OSBP
① Why the priority projects regard the OSBP in Zambia and
same in Malawi is difference?
The OSBP is required for road corridors to improve the access
to the regional markets. In Zambia, OSBP has been operating by
support of the development partners. Therefore, the priority
project aims to increase the number of OSBPs for operation. On
the other hand, there is no OSBP actually working in Malawi,
though the preparation of its installation is undertaken by the
development partner. Therefore, the proposed project aims to
train the government officials regarding mechanism, purpose
and is operation of the OSBP in general.
② What is current status of support for the OSBP at
Chiponde-Mandimba border by the development partners?
We are told that AfDB and JICA do not commit development of
the OSBP.
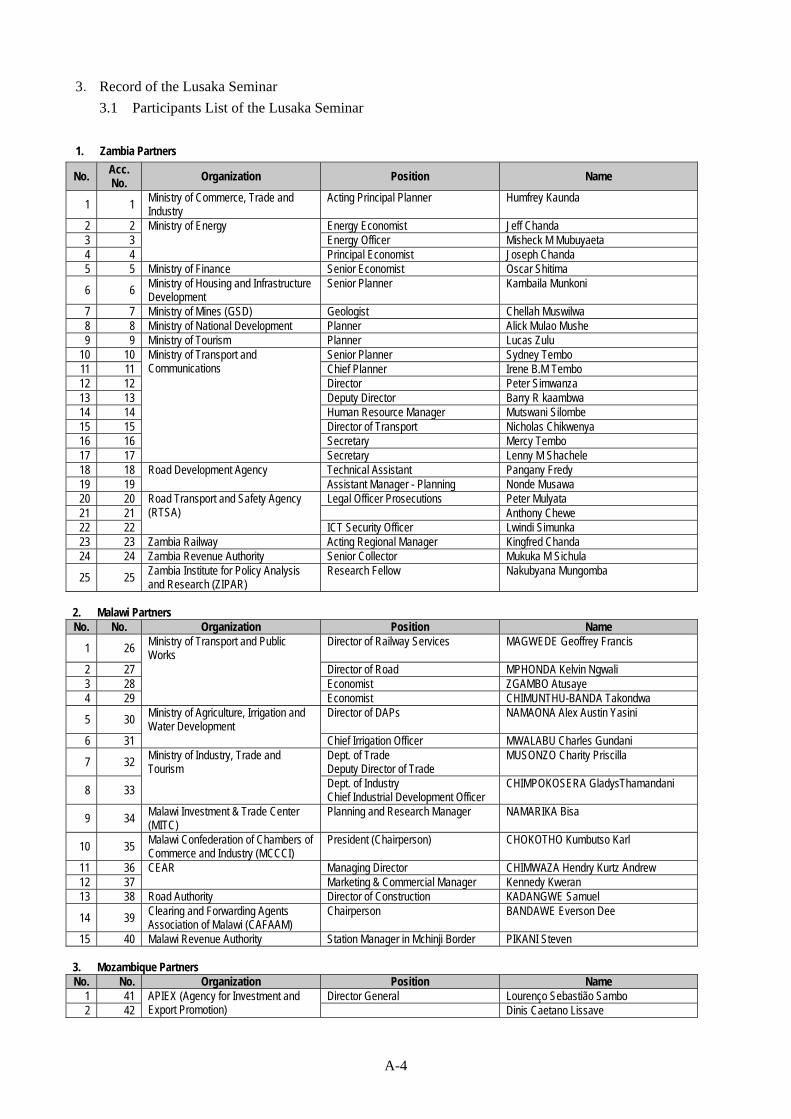
A-4
3. Record of the Lusaka Seminar
3.1 Participants List of the Lusaka Seminar
1. Zambia Partners
No. Acc. No.
Organization Position Name
1 1 Ministry of Commerce, Trade and Industry
Acting Principal Planner Humfrey Kaunda
2 2 Ministry of Energy Energy Economist Jeff Chanda 3 3 Energy Officer Misheck M Mubuyaeta 4 4 Principal Economist Joseph Chanda 5 5 Ministry of Finance Senior Economist Oscar Shitima
6 6 Ministry of Housing and Infrastructure Development
Senior Planner Kambaila Munkoni
7 7 Ministry of Mines (GSD) Geologist Chellah Muswilwa 8 8 Ministry of National Development Planner Alick Mulao Mushe 9 9 Ministry of Tourism Planner Lucas Zulu
10 10 Ministry of Transport and Communications
Senior Planner Sydney Tembo 11 11 Chief Planner Irene B.M Tembo 12 12 Director Peter Simwanza 13 13 Deputy Director Barry R kaambwa 14 14 Human Resource Manager Mutswani Silombe 15 15 Director of Transport Nicholas Chikwenya 16 16 Secretary Mercy Tembo 17 17 Secretary Lenny M Shachele 18 18 Road Development Agency Technical Assistant Pangany Fredy 19 19 Assistant Manager - Planning Nonde Musawa 20 20 Road Transport and Safety Agency
(RTSA) Legal Officer Prosecutions Peter Mulyata
21 21 Anthony Chewe 22 22 ICT Security Officer Lwindi Simunka 23 23 Zambia Railway Acting Regional Manager Kingfred Chanda 24 24 Zambia Revenue Authority Senior Collector Mukuka M Sichula
25 25 Zambia Institute for Policy Analysis and Research (ZIPAR)
Research Fellow Nakubyana Mungomba
2. Malawi Partners No. No. Organization Position Name
1 26 Ministry of Transport and Public Works
Director of Railway Services MAGWEDE Geoffrey Francis
2 27 Director of Road MPHONDA Kelvin Ngwali 3 28 Economist ZGAMBO Atusaye 4 29 Economist CHIMUNTHU-BANDA Takondwa
5 30 Ministry of Agriculture, Irrigation and Water Development
Director of DAPs NAMAONA Alex Austin Yasini
6 31 Chief Irrigation Officer MWALABU Charles Gundani
7 32 Ministry of Industry, Trade and Tourism
Dept. of Trade Deputy Director of Trade
MUSONZO Charity Priscilla
8 33 Dept. of Industry
Chief Industrial Development Officer CHIMPOKOSERA GladysThamandani
9 34 Malawi Investment & Trade Center (MITC)
Planning and Research Manager NAMARIKA Bisa
10 35 Malawi Confederation of Chambers of Commerce and Industry (MCCCI)
President (Chairperson) CHOKOTHO Kumbutso Karl
11 36 CEAR Managing Director CHIMWAZA Hendry Kurtz Andrew 12 37 Marketing & Commercial Manager Kennedy Kweran 13 38 Road Authority Director of Construction KADANGWE Samuel
14 39 Clearing and Forwarding Agents Association of Malawi (CAFAAM)
Chairperson BANDAWE Everson Dee
15 40 Malawi Revenue Authority Station Manager in Mchinji Border PIKANI Steven 3. Mozambique Partners No. No. Organization Position Name
1 41 APIEX (Agency for Investment and Export Promotion)
Director General Lourenço Sebastião Sambo 2 42 Dinis Caetano Lissave
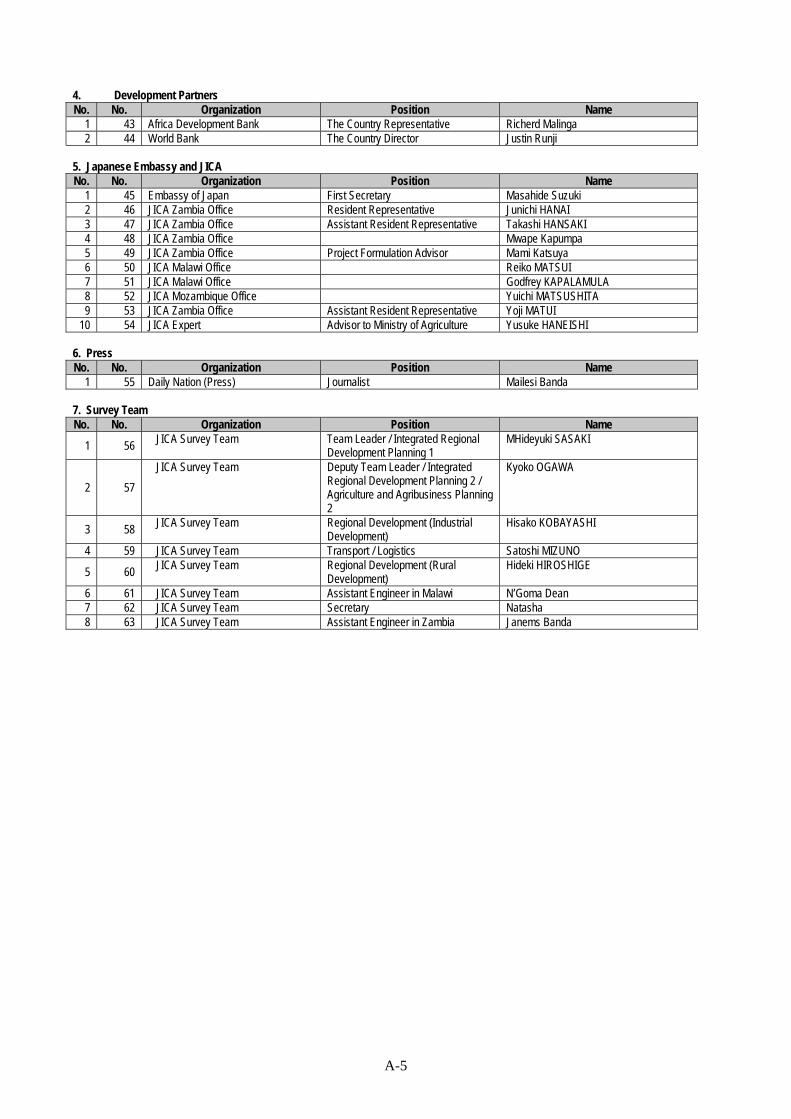
A-5
4. Development Partners No. No. Organization Position Name
1 43 Africa Development Bank The Country Representative Richerd Malinga 2 44 World Bank The Country Director Justin Runji
5. Japanese Embassy and JICA No. No. Organization Position Name
1 45 Embassy of Japan First Secretary Masahide Suzuki 2 46 JICA Zambia Office Resident Representative Junichi HANAI 3 47 JICA Zambia Office Assistant Resident Representative Takashi HANSAKI 4 48 JICA Zambia Office Mwape Kapumpa 5 49 JICA Zambia Office Project Formulation Advisor Mami Katsuya 6 50 JICA Malawi Office Reiko MATSUI 7 51 JICA Malawi Office Godfrey KAPALAMULA 8 52 JICA Mozambique Office Yuichi MATSUSHITA 9 53 JICA Zambia Office Assistant Resident Representative Yoji MATUI
10 54 JICA Expert Advisor to Ministry of Agriculture Yusuke HANEISHI 6. Press No. No. Organization Position Name
1 55 Daily Nation (Press) Journalist Mailesi Banda 7. Survey Team No. No. Organization Position Name
1 56 JICA Survey Team Team Leader / Integrated Regional Development Planning 1
MHideyuki SASAKI
2 57
JICA Survey Team Deputy Team Leader / Integrated Regional Development Planning 2 / Agriculture and Agribusiness Planning 2
Kyoko OGAWA
3 58 JICA Survey Team Regional Development (Industrial Development)
Hisako KOBAYASHI
4 59 JICA Survey Team Transport / Logistics Satoshi MIZUNO
5 60 JICA Survey Team Regional Development (Rural Development)
Hideki HIROSHIGE
6 61 JICA Survey Team Assistant Engineer in Malawi N’Goma Dean 7 62 JICA Survey Team Secretary Natasha 8 63 JICA Survey Team Assistant Engineer in Zambia Janems Banda
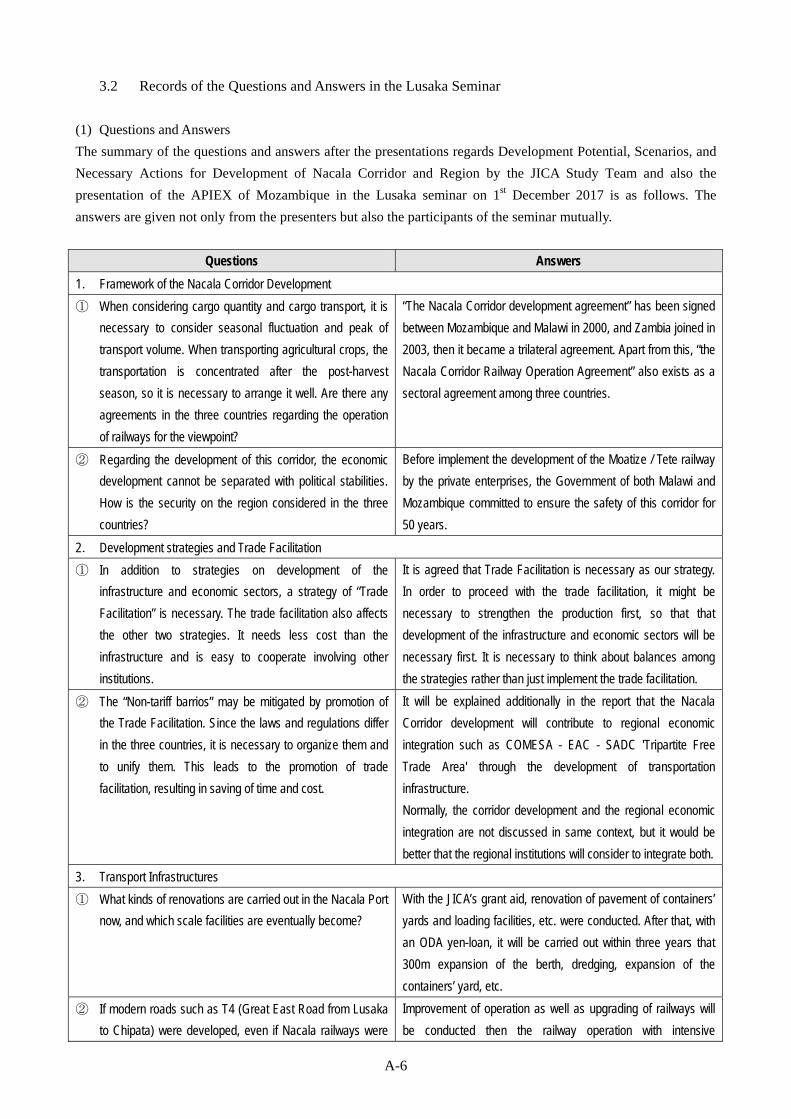
A-6
3.2 Records of the Questions and Answers in the Lusaka Seminar
(1) Questions and Answers
The summary of the questions and answers after the presentations regards Development Potential, Scenarios, and
Necessary Actions for Development of Nacala Corridor and Region by the JICA Study Team and also the
presentation of the APIEX of Mozambique in the Lusaka seminar on 1st December 2017 is as follows. The
answers are given not only from the presenters but also the participants of the seminar mutually.
Questions Answers
1. Framework of the Nacala Corridor Development
① When considering cargo quantity and cargo transport, it is
necessary to consider seasonal fluctuation and peak of
transport volume. When transporting agricultural crops, the
transportation is concentrated after the post-harvest
season, so it is necessary to arrange it well. Are there any
agreements in the three countries regarding the operation
of railways for the viewpoint?
“The Nacala Corridor development agreement” has been signed
between Mozambique and Malawi in 2000, and Zambia joined in
2003, then it became a trilateral agreement. Apart from this, “the
Nacala Corridor Railway Operation Agreement” also exists as a
sectoral agreement among three countries.
② Regarding the development of this corridor, the economic
development cannot be separated with political stabilities.
How is the security on the region considered in the three
countries?
Before implement the development of the Moatize / Tete railway
by the private enterprises, the Government of both Malawi and
Mozambique committed to ensure the safety of this corridor for
50 years.
2. Development strategies and Trade Facilitation
① In addition to strategies on development of the
infrastructure and economic sectors, a strategy of “Trade
Facilitation” is necessary. The trade facilitation also affects
the other two strategies. It needs less cost than the
infrastructure and is easy to cooperate involving other
institutions.
It is agreed that Trade Facilitation is necessary as our strategy.
In order to proceed with the trade facilitation, it might be
necessary to strengthen the production first, so that that
development of the infrastructure and economic sectors will be
necessary first. It is necessary to think about balances among
the strategies rather than just implement the trade facilitation.
② The “Non-tariff barrios” may be mitigated by promotion of
the Trade Facilitation. Since the laws and regulations differ
in the three countries, it is necessary to organize them and
to unify them. This leads to the promotion of trade
facilitation, resulting in saving of time and cost.
It will be explained additionally in the report that the Nacala
Corridor development will contribute to regional economic
integration such as COMESA - EAC - SADC 'Tripartite Free
Trade Area' through the development of transportation
infrastructure.
Normally, the corridor development and the regional economic
integration are not discussed in same context, but it would be
better that the regional institutions will consider to integrate both.
3. Transport Infrastructures
① What kinds of renovations are carried out in the Nacala Port
now, and which scale facilities are eventually become?
With the JICA’s grant aid, renovation of pavement of containers’
yards and loading facilities, etc. were conducted. After that, with
an ODA yen-loan, it will be carried out within three years that
300m expansion of the berth, dredging, expansion of the
containers’ yard, etc.
② If modern roads such as T4 (Great East Road from Lusaka
to Chipata) were developed, even if Nacala railways were
Improvement of operation as well as upgrading of railways will
be conducted then the railway operation with intensive
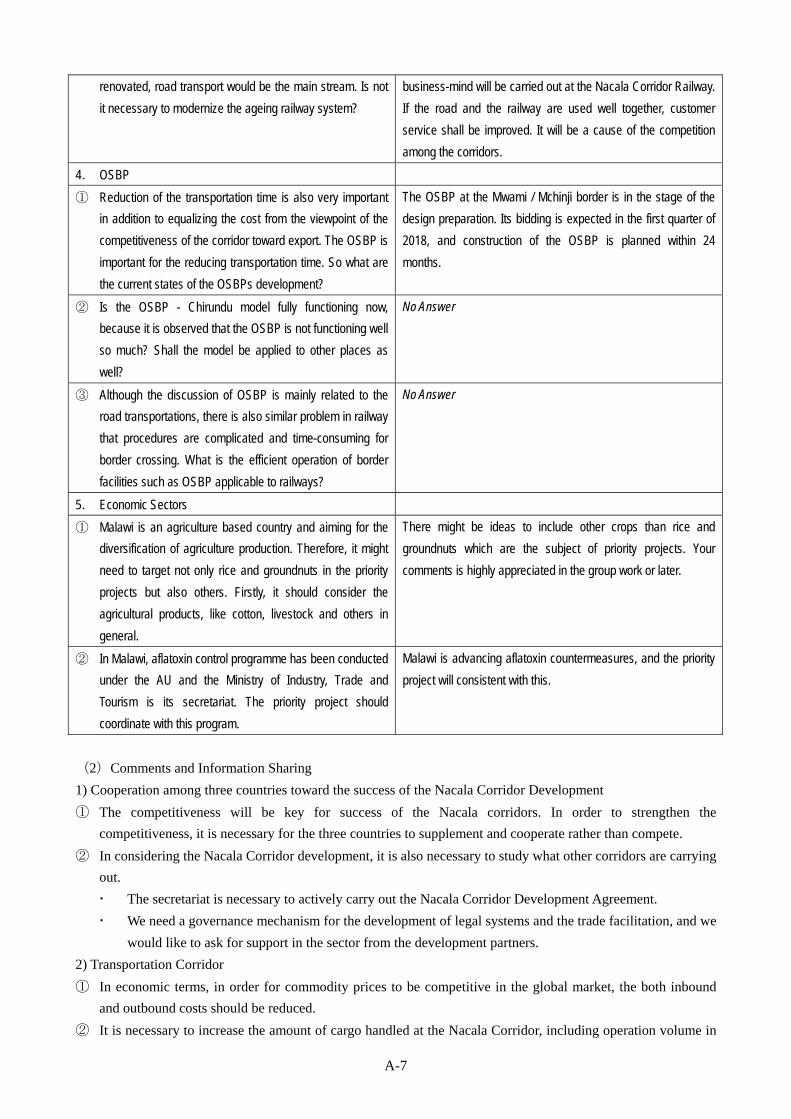
A-7
renovated, road transport would be the main stream. Is not
it necessary to modernize the ageing railway system?
business-mind will be carried out at the Nacala Corridor Railway.
If the road and the railway are used well together, customer
service shall be improved. It will be a cause of the competition
among the corridors.
4. OSBP
① Reduction of the transportation time is also very important
in addition to equalizing the cost from the viewpoint of the
competitiveness of the corridor toward export. The OSBP is
important for the reducing transportation time. So what are
the current states of the OSBPs development?
The OSBP at the Mwami / Mchinji border is in the stage of the
design preparation. Its bidding is expected in the first quarter of
2018, and construction of the OSBP is planned within 24
months.
② Is the OSBP - Chirundu model fully functioning now,
because it is observed that the OSBP is not functioning well
so much? Shall the model be applied to other places as
well?
No Answer
③ Although the discussion of OSBP is mainly related to the
road transportations, there is also similar problem in railway
that procedures are complicated and time-consuming for
border crossing. What is the efficient operation of border
facilities such as OSBP applicable to railways?
No Answer
5. Economic Sectors
① Malawi is an agriculture based country and aiming for the
diversification of agriculture production. Therefore, it might
need to target not only rice and groundnuts in the priority
projects but also others. Firstly, it should consider the
agricultural products, like cotton, livestock and others in
general.
There might be ideas to include other crops than rice and
groundnuts which are the subject of priority projects. Your
comments is highly appreciated in the group work or later.
② In Malawi, aflatoxin control programme has been conducted
under the AU and the Ministry of Industry, Trade and
Tourism is its secretariat. The priority project should
coordinate with this program.
Malawi is advancing aflatoxin countermeasures, and the priority
project will consistent with this.
(2)Comments and Information Sharing
1) Cooperation among three countries toward the success of the Nacala Corridor Development
① The competitiveness will be key for success of the Nacala corridors. In order to strengthen the
competitiveness, it is necessary for the three countries to supplement and cooperate rather than compete.
② In considering the Nacala Corridor development, it is also necessary to study what other corridors are carrying
out.
The secretariat is necessary to actively carry out the Nacala Corridor Development Agreement.
We need a governance mechanism for the development of legal systems and the trade facilitation, and we
would like to ask for support in the sector from the development partners.
2) Transportation Corridor
① In economic terms, in order for commodity prices to be competitive in the global market, the both inbound
and outbound costs should be reduced.
② It is necessary to increase the amount of cargo handled at the Nacala Corridor, including operation volume in
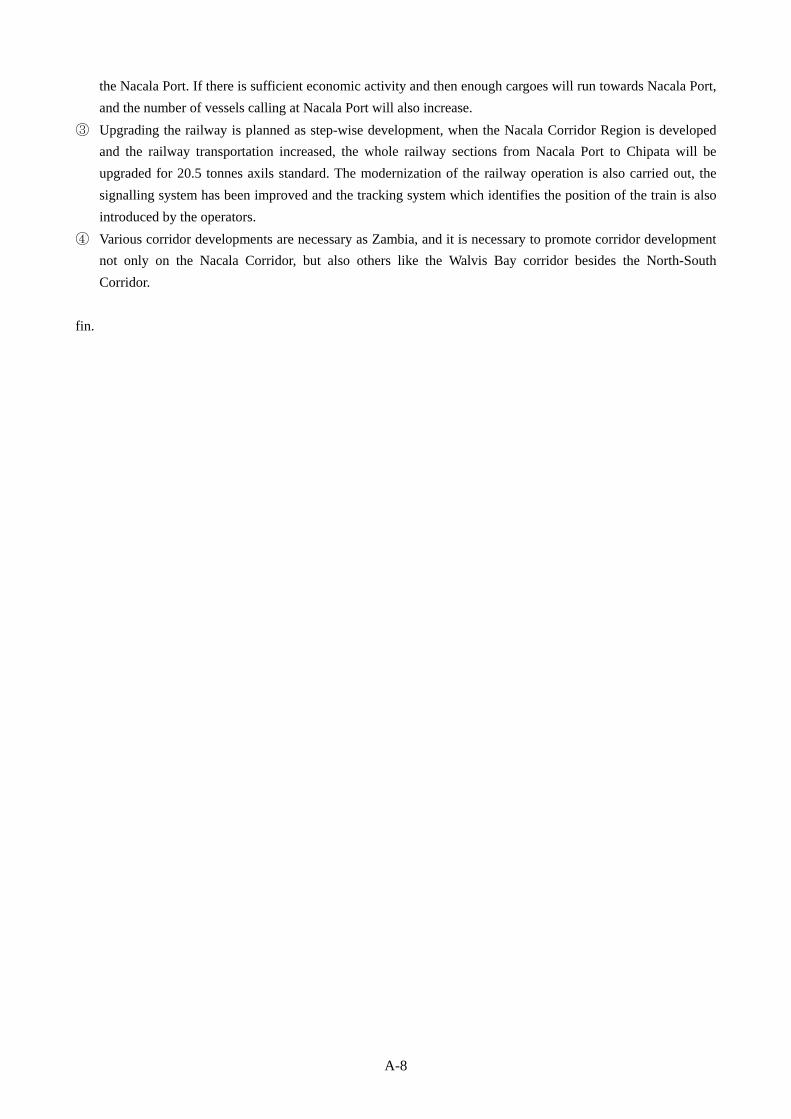
A-8
the Nacala Port. If there is sufficient economic activity and then enough cargoes will run towards Nacala Port,
and the number of vessels calling at Nacala Port will also increase.
③ Upgrading the railway is planned as step-wise development, when the Nacala Corridor Region is developed
and the railway transportation increased, the whole railway sections from Nacala Port to Chipata will be
upgraded for 20.5 tonnes axils standard. The modernization of the railway operation is also carried out, the
signalling system has been improved and the tracking system which identifies the position of the train is also
introduced by the operators.
④ Various corridor developments are necessary as Zambia, and it is necessary to promote corridor development
not only on the Nacala Corridor, but also others like the Walvis Bay corridor besides the North-South
Corridor.
fin.
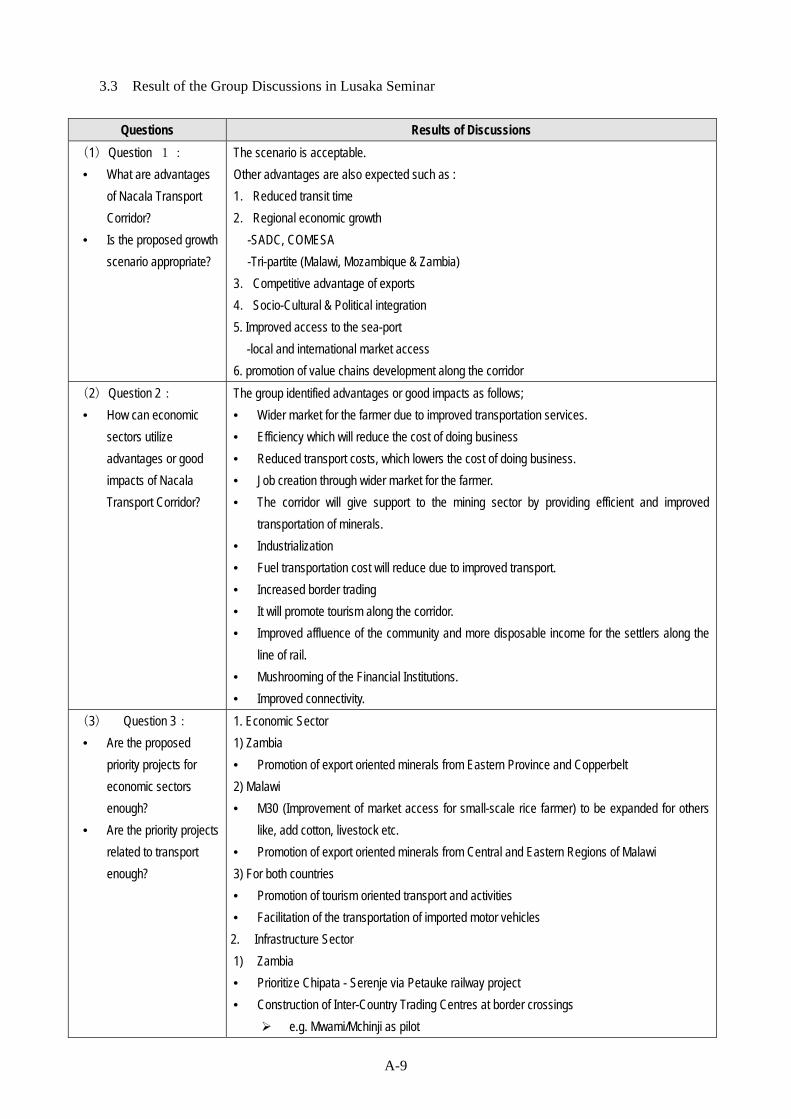
A-9
3.3 Result of the Group Discussions in Lusaka Seminar
Questions Results of Discussions
(1)Question 1:
• What are advantages
of Nacala Transport
Corridor?
• Is the proposed growth
scenario appropriate?
The scenario is acceptable.
Other advantages are also expected such as :
1.Reduced transit time
2.Regional economic growth
-SADC, COMESA
-Tri-partite (Malawi, Mozambique & Zambia)
3.Competitive advantage of exports
4.Socio-Cultural & Political integration
5. Improved access to the sea-port
-local and international market access
6. promotion of value chains development along the corridor
(2)Question 2:
• How can economic
sectors utilize
advantages or good
impacts of Nacala
Transport Corridor?
The group identified advantages or good impacts as follows;
• Wider market for the farmer due to improved transportation services.
• Efficiency which will reduce the cost of doing business
• Reduced transport costs, which lowers the cost of doing business.
• Job creation through wider market for the farmer.
• The corridor will give support to the mining sector by providing efficient and improved
transportation of minerals.
• Industrialization
• Fuel transportation cost will reduce due to improved transport.
• Increased border trading
• It will promote tourism along the corridor.
• Improved affluence of the community and more disposable income for the settlers along the
line of rail.
• Mushrooming of the Financial Institutions.
• Improved connectivity.
(3) Question 3:
• Are the proposed
priority projects for
economic sectors
enough?
• Are the priority projects
related to transport
enough?
1. Economic Sector
1) Zambia
• Promotion of export oriented minerals from Eastern Province and Copperbelt
2) Malawi
• M30 (Improvement of market access for small-scale rice farmer) to be expanded for others
like, add cotton, livestock etc.
• Promotion of export oriented minerals from Central and Eastern Regions of Malawi
3) For both countries
• Promotion of tourism oriented transport and activities
• Facilitation of the transportation of imported motor vehicles
2. Infrastructure Sector
1) Zambia
• Prioritize Chipata - Serenje via Petauke railway project
• Construction of Inter-Country Trading Centres at border crossings
e.g. Mwami/Mchinji as pilot
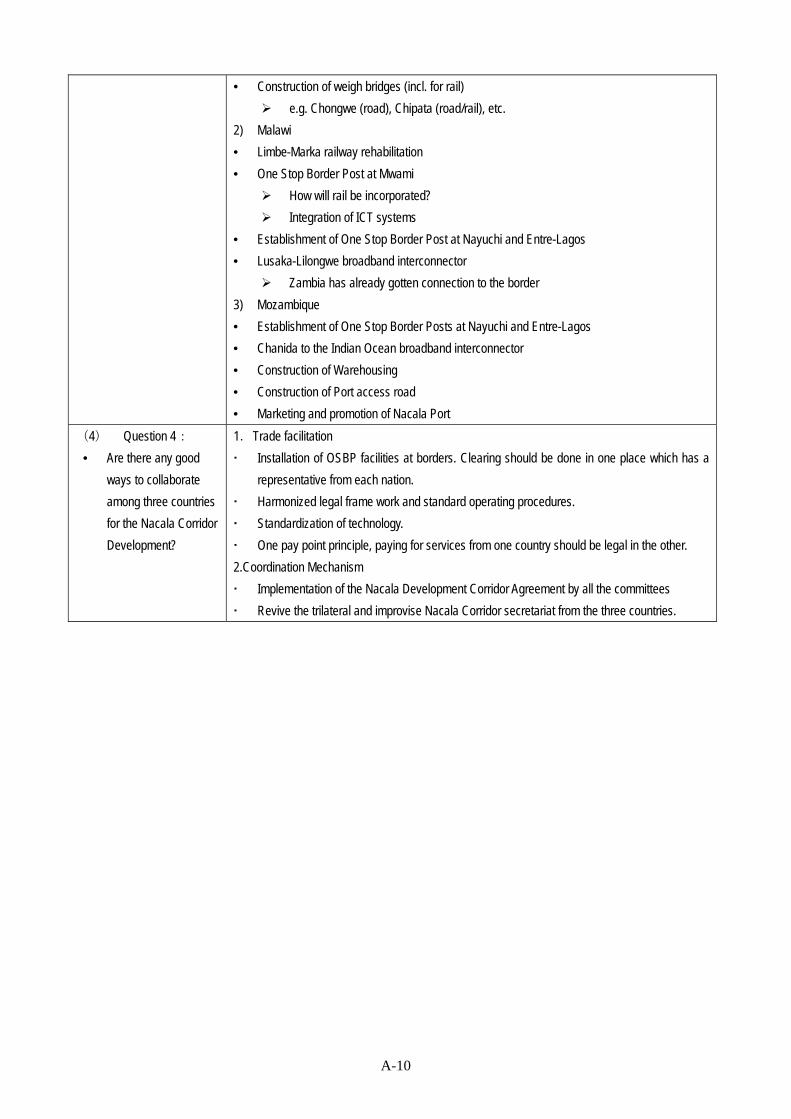
A-10
• Construction of weigh bridges (incl. for rail)
e.g. Chongwe (road), Chipata (road/rail), etc.
2) Malawi
• Limbe-Marka railway rehabilitation
• One Stop Border Post at Mwami
How will rail be incorporated?
Integration of ICT systems
• Establishment of One Stop Border Post at Nayuchi and Entre-Lagos
• Lusaka-Lilongwe broadband interconnector
Zambia has already gotten connection to the border
3) Mozambique
• Establishment of One Stop Border Posts at Nayuchi and Entre-Lagos
• Chanida to the Indian Ocean broadband interconnector
• Construction of Warehousing
• Construction of Port access road
• Marketing and promotion of Nacala Port
(4) Question 4:
• Are there any good
ways to collaborate
among three countries
for the Nacala Corridor
Development?
1.Trade facilitation
Installation of OSBP facilities at borders. Clearing should be done in one place which has a
representative from each nation.
Harmonized legal frame work and standard operating procedures.
Standardization of technology.
One pay point principle, paying for services from one country should be legal in the other.
2.Coordination Mechanism
Implementation of the Nacala Development Corridor Agreement by all the committees
Revive the trilateral and improvise Nacala Corridor secretariat from the three countries.
Related Documents