DATA COLLECTION & DATA PRESENTATION Ms. Nurazrin Jupri

Welcome message from author
This document is posted to help you gain knowledge. Please leave a comment to let me know what you think about it! Share it to your friends and learn new things together.
Transcript
DATA COLLECTION &
DATA PRESENTATION
Ms. Nurazrin Jupri
Sources of Data
• Primary data
• Specific information collected by the person
who is doing the research
• Secondary data
• Any material that has been collected from
published records
Ms. Nurazrin Jupri

Types of Data and Variables
Ms. Nurazrin Jupri
Data/
Variables
Quantitative
(Numerical)
Discrete
Qualitative
(Categorical)
Continuous
Examples:
• Colour
• Flavour
• Gender
(Defined categories)
Examples:
• Profits
• Weight
• Speed
(Measured characteristics)
Examples:
• Number of cars
• Defects per hour
• Accidents
(Counted items)
Scale of Data Measurement
• Data can be divided into numerical and categorical data.
• Numerical data contains numbers that we can manipulate
using ordinary arithmetical operations.
• Categorical data can be sorted into categories.
• Data is classified as nominal, ordinal, interval or ratio.
Ms. Nurazrin Jupri
Sampling
is the process of selecting a small number of
elements from a larger defined target group
(Population) of elements such that the information
gathered from the small group will allow judgments
to be made about the larger groups.
Ms. Nurazrin Jupri
Sampling
is the act, process, or technique of selecting a
suitable sample, or a representative part of a
population for the purpose of determining
parameters or characteristics of the whole
population
Ms. Nurazrin Jupri

Purpose Of Sampling
To draw conclusions about populations from samples,
which enables us to determine a population`s
characteristics by directly observing only a portion (or
sample) of the population.
We obtain a sample rather than a complete enumeration (a
census ) of the population for many reasons.
Ms. Nurazrin Jupri
Main Reasons for Sampling
● Economy
● Timeliness
● The large size of many populations
● Inaccessibility of some of the population
● Accuracy
Ms. Nurazrin Jupri
●Economy - taking a sample requires fewer resources than a census.
●Time factor -a sample may provide you with needed information quickly.
●The very large populations -many populations about which inferences must
be made are quite large
●The partly accessible populations- There are some populations that are
so difficult to get access to that only a sample can be used.
●Accuracy and sampling- A sample may be more accurate than a census. A
sloppily conducted census can provide less reliable information than a carefully obtained
sample.
Ms. Nurazrin Jupri
Important terminologies
●. Population
●. Element
●. Sample
●. Sampling Unit
●. Subject
Ms. Nurazrin Jupri

Population
The population refers to the entire group of people,
events or things of interest that the researcher wishes
to investigate.
Example: ● If an organizational consultant is interested in studying the effects of
a four-day work week on the white-coller workers in a telephone
company in Ireland. Then all white-coller workers in that company will
make up the population.
● If regulators wants to know how patients in nursing homes run by a
company in France?
● If however, the regulators are interested only in one particular nursing
home run by that company ?
Ms. Nurazrin Jupri
Population: All the patients in all the nursing
homes run by them.
then only the patients in that particular
nursing home will make the population.
Element
An element is the
single member of the population.
Example:
●If 1000 blue-coller workers in a particular organization are working and
an researcher is interested to know the satisfaction level of these
workers then each member (blue-coller) of the particular organization
will be considered as element.
●Census is a count of all elements in the human population.
Ms. Nurazrin Jupri
Sample
A sample is a subset of the population. It comprises some
members from it.
Example:
●. If 200 members are drawn/selected from a population of 1000 blue-coller workers to
study the desire outcome, then 200 members form the sample for the study.
●. If there are 145 patients in a hospital and 40 of them are to be surveyed by the hospital
administrator to assess there level of satisfaction with the treatment received. Number
of sample?
●A sample is thus a subgroup or subset of the population. By studying the sample, the
researcher should be able to draw conclusions that are generalizable to the population of
interest.
Ms. Nurazrin Jupri
40 members will be called the sample
Sampling Unit
The sample unit is the element or the set of elements
that is available for selection in some stage of the
sampling process.
Example of sampling units in a multi stage sample are city blocks,
house hold, and individuals with in the households.
Ms. Nurazrin Jupri
Subject
A subject is a single member of the sample just as
an element is a single member of the population.
Example:
●. If 200 members from the total population of 1000 blue-coller workers form the
sample for the study. Then each blue-coller worker in the sample is a subject.
●. If there are 145 patients in a hospital and 40 of them are to be surveyed by
the hospital administrator to assess there level of satisfaction with the
treatment received, then each member from sample of 40 will be called the
subject.
Ms. Nurazrin Jupri
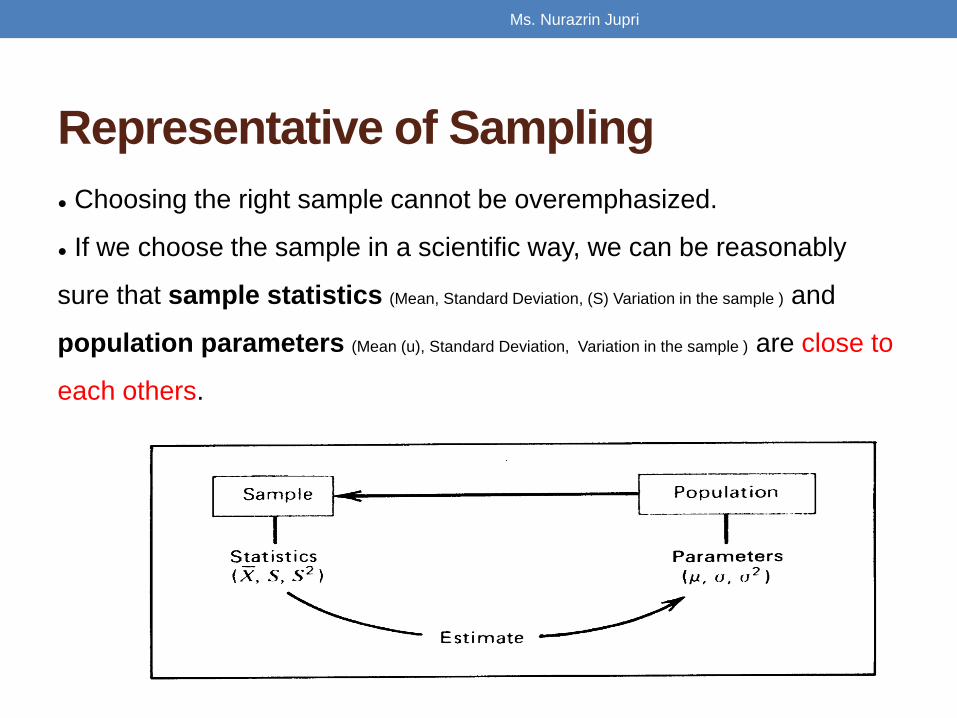
Representative of Sampling
● Choosing the right sample cannot be overemphasized.
● If we choose the sample in a scientific way, we can be reasonably
sure that sample statistics (Mean, Standard Deviation, (S) Variation in the sample ) and
population parameters (Mean (u), Standard Deviation, Variation in the sample ) are close to
each others.
Ms. Nurazrin Jupri
What is a Good Sample?
● Accurate: absence of bias
● Precise estimate: sampling error
Sampling error is any type of bias that is attributable to mistakes in either drawing a sample or determining the sample size.
Ms. Nurazrin Jupri
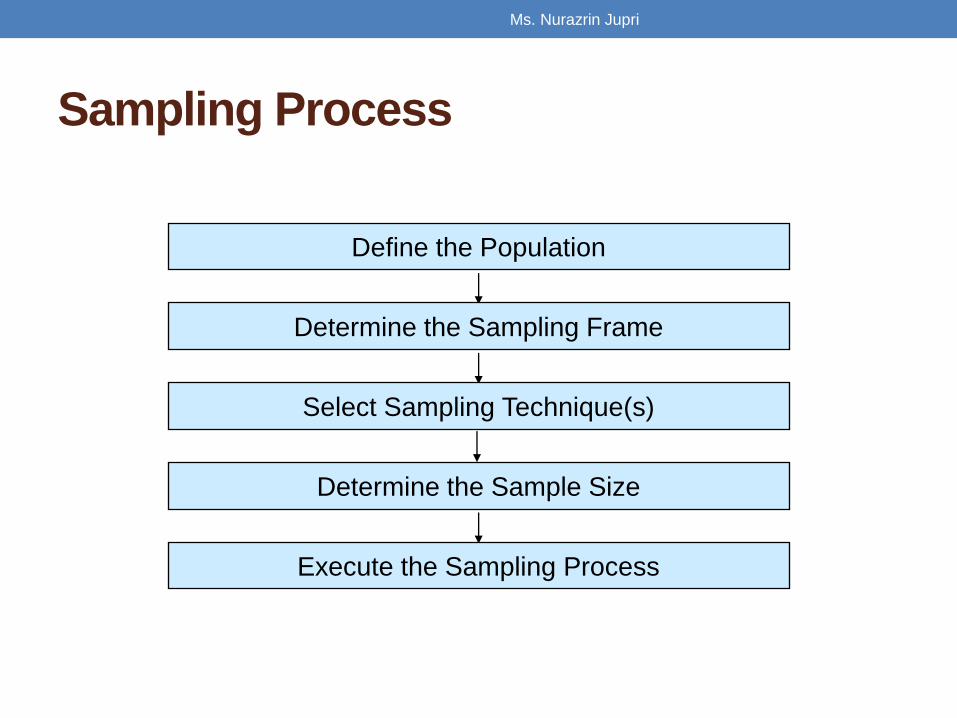
Sampling Process
Define the Population
Determine the Sampling Frame
Select Sampling Technique(s)
Determine the Sample Size
Execute the Sampling Process
Ms. Nurazrin Jupri
Defining Population of Interest
Population of interest is entirely dependent on
Management Problem, Research Problems, and
Research Design.
Some Bases for Defining Population:
● Geographic Area (Pakistan, Punjab, Banking sector, Our Institute etc.)
● Demographics (Gender, Age, Color, Height etc.)
● Usage/Lifestyle
● Awareness
Ms. Nurazrin Jupri
Sampling Frame
A list of population elements (people, companies, houses,
cities, etc.) from which units to be sampled can be selected.
●Difficult to get an accurate list.
●Sample frame error occurs when certain elements of the
population are accidentally omitted or not included on the
list.
Ms. Nurazrin Jupri

Sampling Methods/Techniques
Probability
Sampling
Nonprobability
Sampling
Ms. Nurazrin Jupri
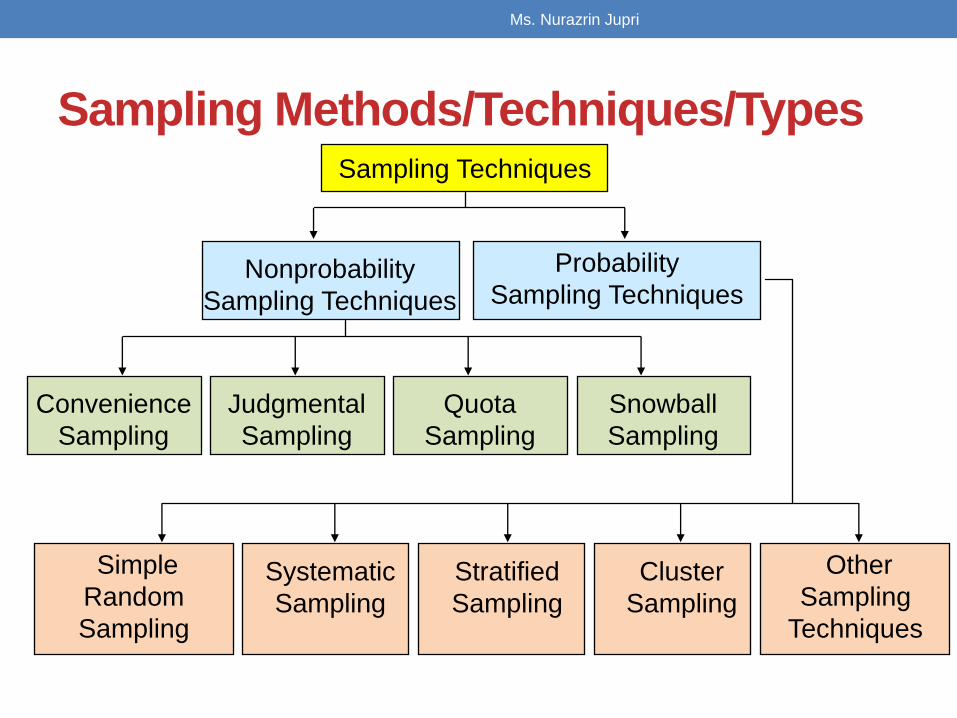
Sampling Methods/Techniques/Types
Sampling Techniques
Nonprobability
Sampling Techniques
Probability
Sampling Techniques
Convenience
Sampling
Judgmental
Sampling
Quota
Sampling
Snowball
Sampling
Systematic
Sampling
Stratified
Sampling
Cluster
Sampling
Other
Sampling
Techniques
Simple
Random
Sampling
Ms. Nurazrin Jupri
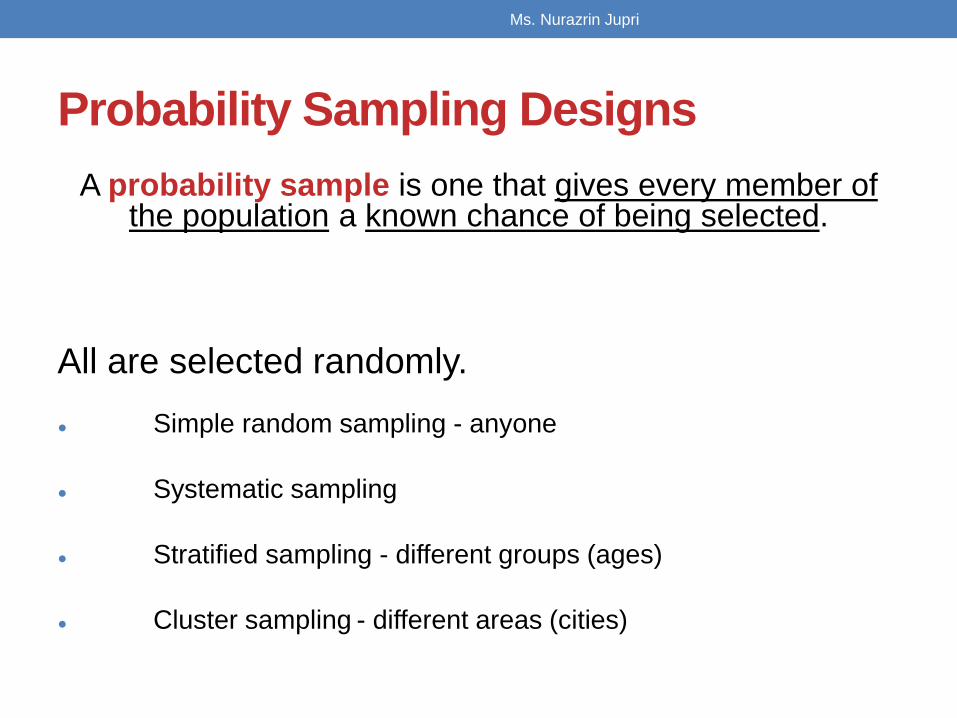
Probability Sampling Designs
A probability sample is one that gives every member of the population a known chance of being selected.
All are selected randomly.
● Simple random sampling - anyone
● Systematic sampling
● Stratified sampling - different groups (ages)
● Cluster sampling - different areas (cities)
Ms. Nurazrin Jupri

Nonprobability Sampling
Nonprobability sample is an arbitrary grouping
that limits the use of some statistical tests. It is not
selected randomly.
Classifications of Nonprobability Sampling
● Convenience Sampling
● Judgment Sampling
● Quota Sampling
● Snowball Sampling
Ms. Nurazrin Jupri
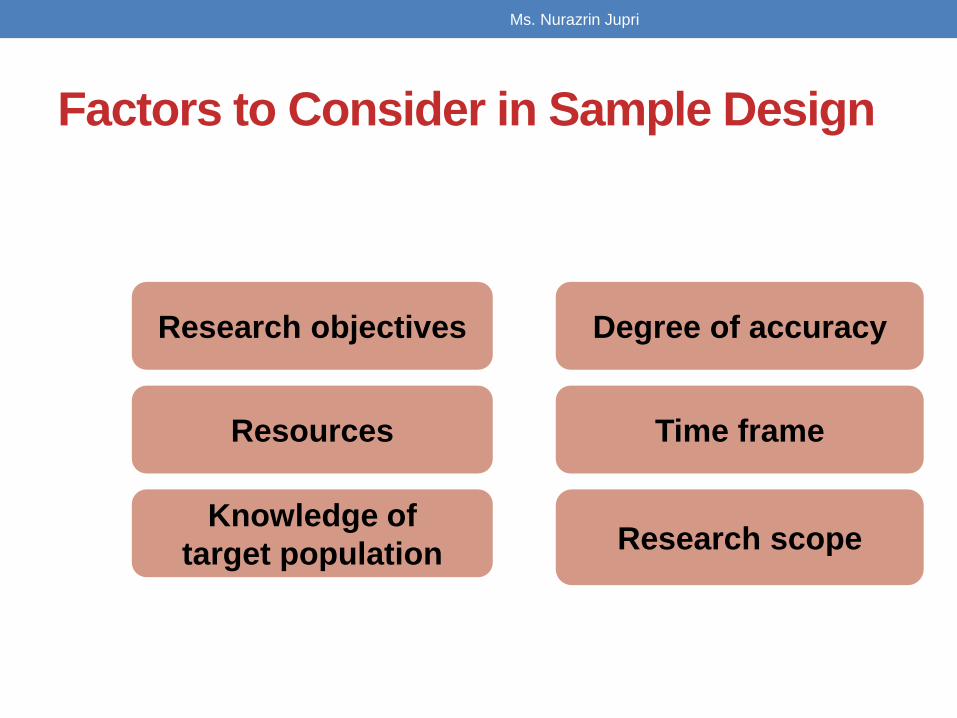
Factors to Consider in Sample Design
Research objectives Degree of accuracy
Resources Time frame
Knowledge of
target population Research scope
Ms. Nurazrin Jupri

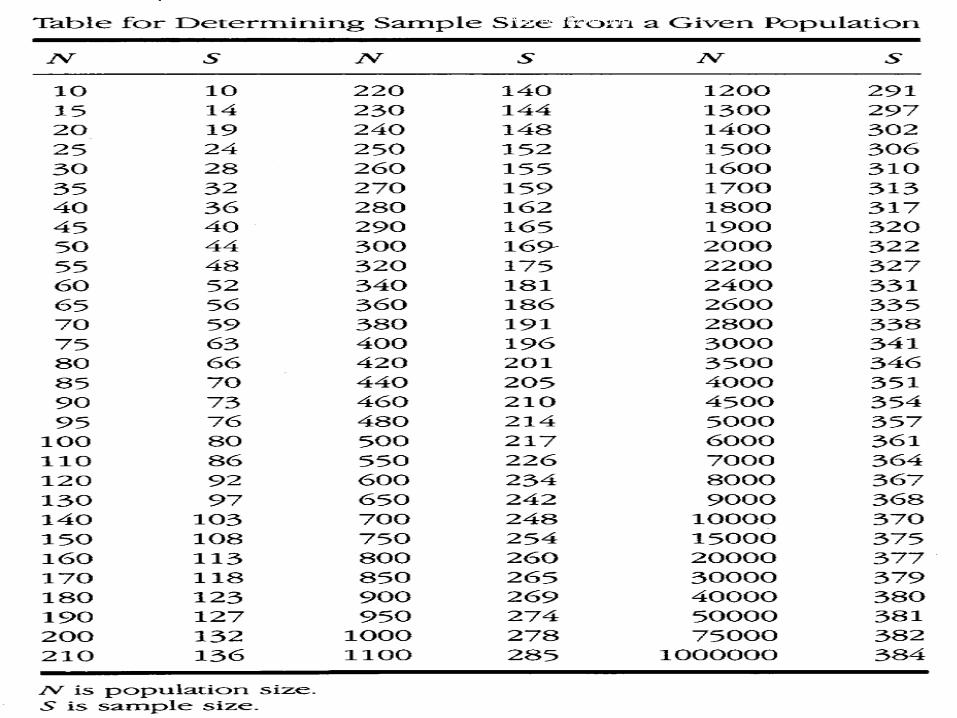
Determining Sample Size
●How many completed questionnaires do we need to have
a representative sample?
●Generally the larger the better, but that takes more time
and money.
●Answer depends on:
●How different or dispersed the population is.
●Desired level of confidence.
●Desired degree of accuracy.
Ms. Nurazrin Jupri
Acknowledgments to Uma Sekaran
Ms. Nurazrin Jupri
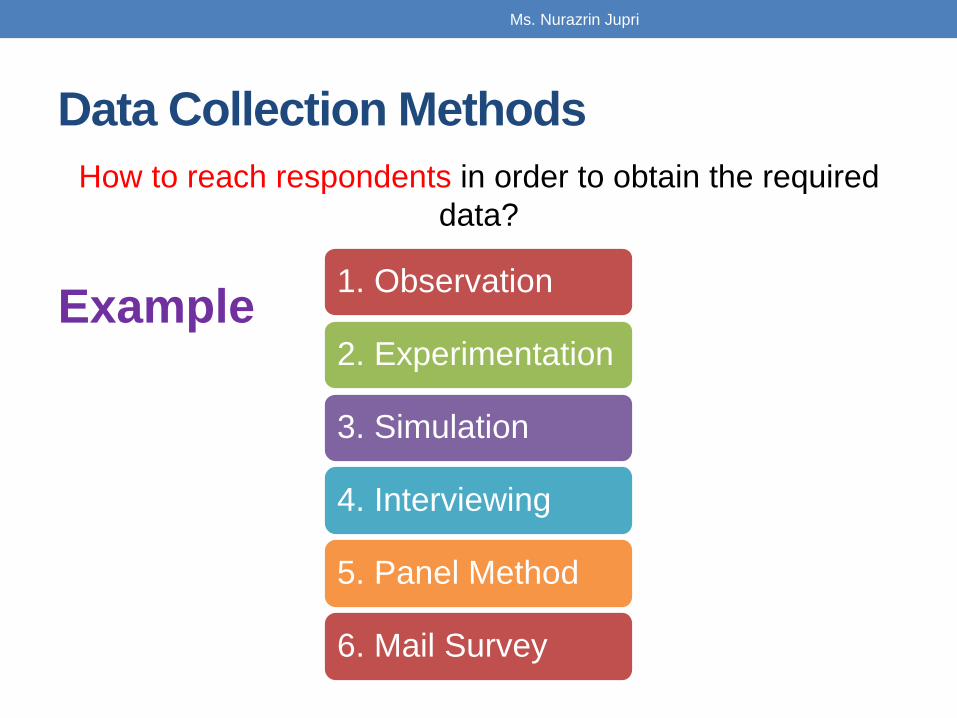
Data Collection Methods
How to reach respondents in order to obtain the required
data?
Ms. Nurazrin Jupri
1. Observation
2. Experimentation
3. Simulation
4. Interviewing
5. Panel Method
6. Mail Survey
Example

Data Collection Methods
• Types of Tools
Ms. Nurazrin Jupri
Observation schedule
Interview guide and schedule
Questionnaires
Checklists
Data sheet
Example
Data Presentation
• An essential step before further statistical analysis is
carried out
• Data are summarized and displayed enabling
researchers, managers and decision-makers to observe
important features of the data and provide insight into the
type of model and analysis that should be used.
Ms. Nurazrin Jupri
Data Presentation
• Frequency table
• Bar chart
• Pie chart
• Histogram
• Frequency curve
• Line graph
• Pictograph
• Stem-and-leaf display
• Box plot
• Ogive
Ms. Nurazrin Jupri
Related Documents