Welcome message from author
This document is posted to help you gain knowledge. Please leave a comment to let me know what you think about it! Share it to your friends and learn new things together.
Transcript

Acknowledgement to LBNL sponsorsAcknowledgement to LBNL sponsors
California Energy Commission – PIER programCalifornia Energy Commission – PIER program Pacific Gas and Electric CompanyPacific Gas and Electric Company New York State Energy and Development New York State Energy and Development
Agency (NYSERDA)Agency (NYSERDA) US - Environmental Protection AgencyUS - Environmental Protection Agency US – Department of EnergyUS – Department of Energy

Data Center research activitiesData Center research activities
Research RoadmapResearch Roadmap Benchmarking and 23 data center case studies Benchmarking and 23 data center case studies Self-benchmarking protocol Self-benchmarking protocol Power supply efficiency studyPower supply efficiency study UPS systems efficiency studyUPS systems efficiency study Standby generation lossesStandby generation losses Performance metrics – Computation/wattPerformance metrics – Computation/watt EPA report to CongressEPA report to Congress DOE Save Energy Now programDOE Save Energy Now program

LBNL data center demonstrationsLBNL data center demonstrations
““Air management” demonstrationAir management” demonstration
Outside air economizer demonstrationOutside air economizer demonstration
DC powering demonstrationsDC powering demonstrations
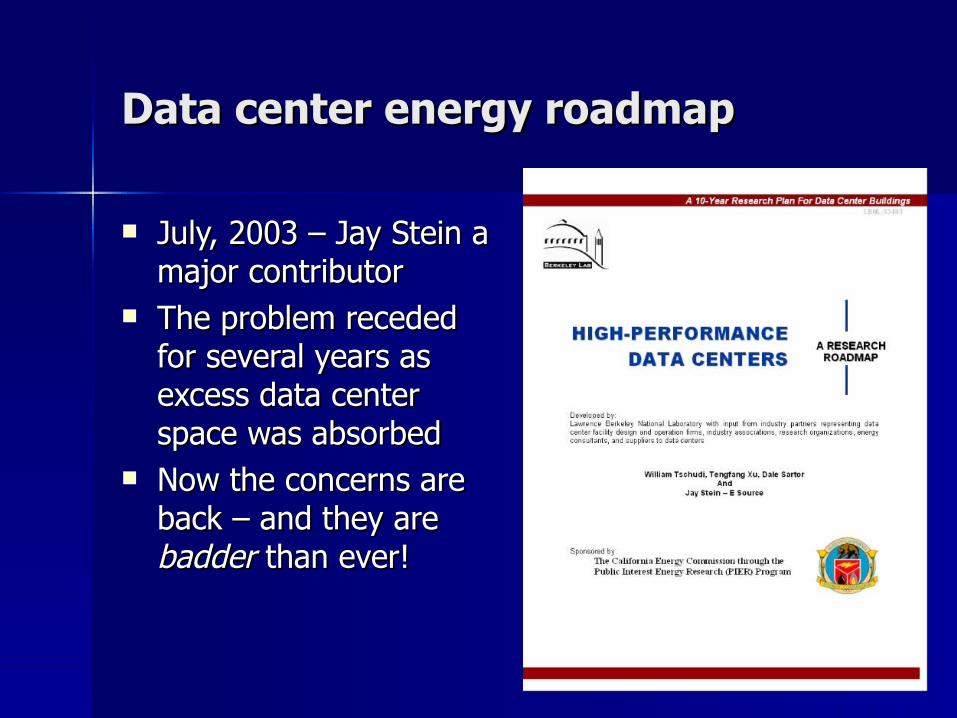
Data center energy roadmapData center energy roadmap
July, 2003 – Jay Stein a July, 2003 – Jay Stein a major contributormajor contributor
The problem receded The problem receded for several years as for several years as excess data center excess data center space was absorbedspace was absorbed
Now the concerns are Now the concerns are back – and they are back – and they are badderbadder than ever! than ever!

Performance varies
Data Center Server Load
51%
Data Center CRAC Units
25%
Cooling Tower Plant4%
Electrical Room Cooling
4%
Office Space Conditioning
1%
Lighting2%
Other13%
Computer Loads67%
HVAC - Air Movement
7%
Lighting2%
HVAC - Chiller and
Pumps24%
The relative percentages of the energy actually doing computing varies considerably.
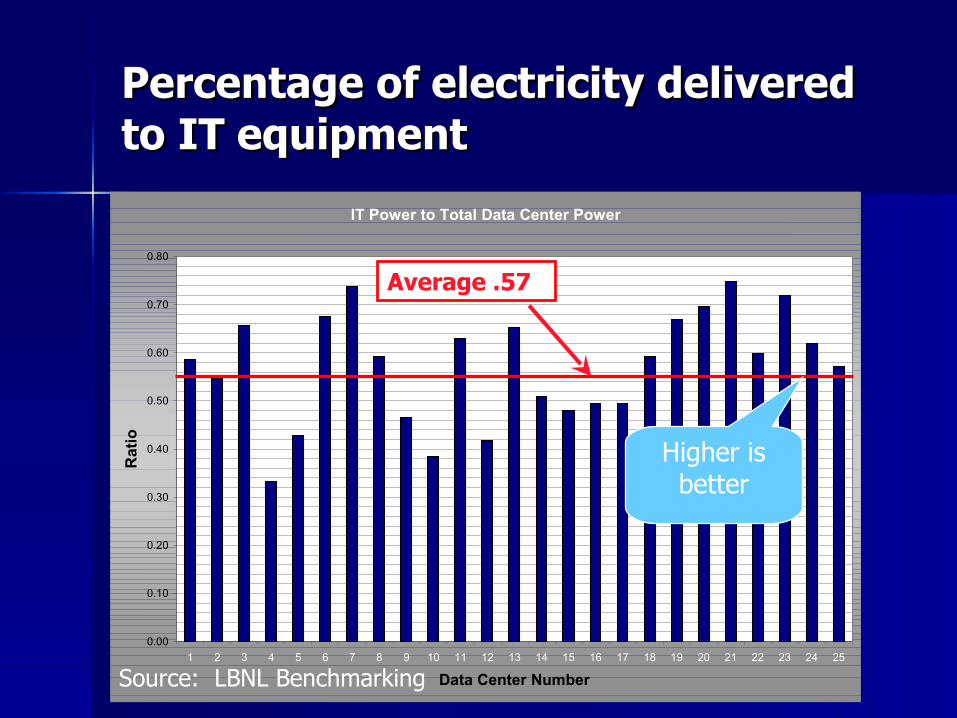
Percentage of electricity delivered Percentage of electricity delivered to IT equipmentto IT equipment
IT Power to Total Data Center Power
0.00
0.10
0.20
0.30
0.40
0.50
0.60
0.70
0.80
1 2 3 4 5 6 7 8 9 10 11 12 13 14 15 16 17 18 19 20 21 22 23 24 25
Data Center Number
Rat
io
Average .57
Higher is better
Source: LBNL Benchmarking

Benchmark results helped to find Benchmark results helped to find best practicesbest practices
The ratio of IT equipment power to the total The ratio of IT equipment power to the total is an indicator of relative overall efficiency. is an indicator of relative overall efficiency. Examination of individual systems and Examination of individual systems and components in the centers that performed components in the centers that performed well helped to identify best practices.well helped to identify best practices.
Lets talk about a few….Lets talk about a few….

Server Load/ComputingOperations
Cooling Equipment
Power Conversion & Distribution
AlternativePower
Generation
• High voltage distribution• Use of DC power• Highly efficient UPS systems• Efficient redundancy
strategies
• Load management• Server innovation
Energy efficiency opportunities are Energy efficiency opportunities are everywhereeverywhere
• Better air management• Move to liquid cooling• Optimized chilled-water plants• Use of free cooling
• On-site generation• Waste heat for cooling• Use of renewable energy/fuel cells
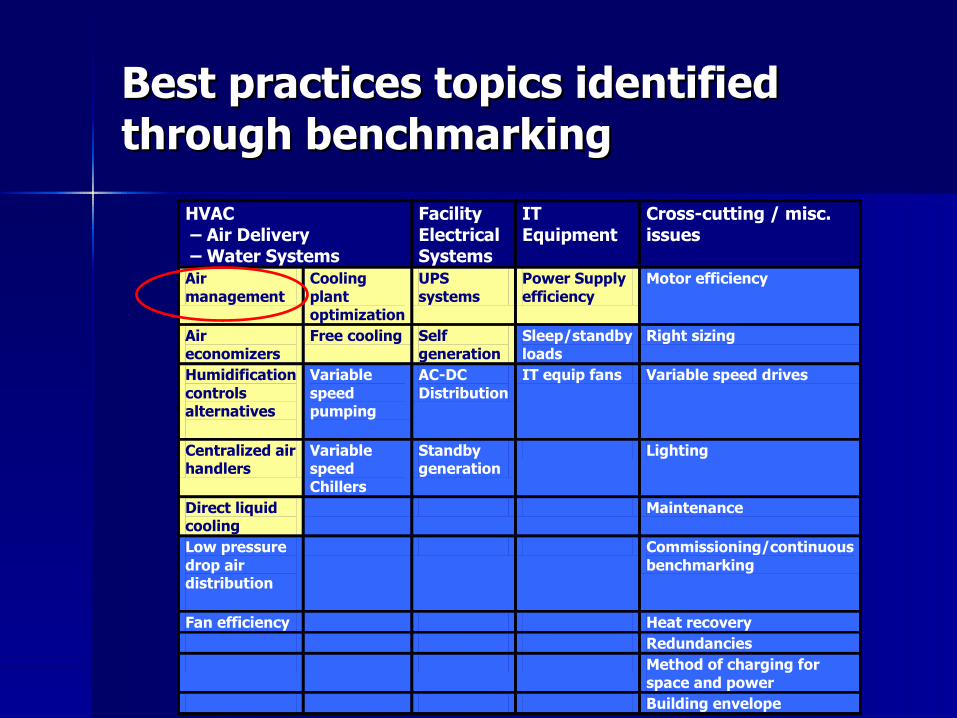
Best practices topics identified Best practices topics identified through benchmarkingthrough benchmarking
HVAC – Air Delivery – Water Systems
Facility Electrical Systems
IT Equipment
Cross-cutting / misc. issues
Air management
Cooling plant optimization
UPS systems
Power Supply efficiency
Motor efficiency
Air economizers
Free cooling Self generation
Sleep/standby loads
Right sizing
Humidification controls alternatives
Variable speed pumping
AC-DC Distribution
IT equip fans Variable speed drives
Centralized air handlers
Variable speed Chillers
Standby generation
Lighting
Direct liquid cooling
Maintenance
Low pressure drop air distribution
Commissioning/continuous benchmarking
Fan efficiency Heat recovery Redundancies Method of charging for
space and power Building envelope
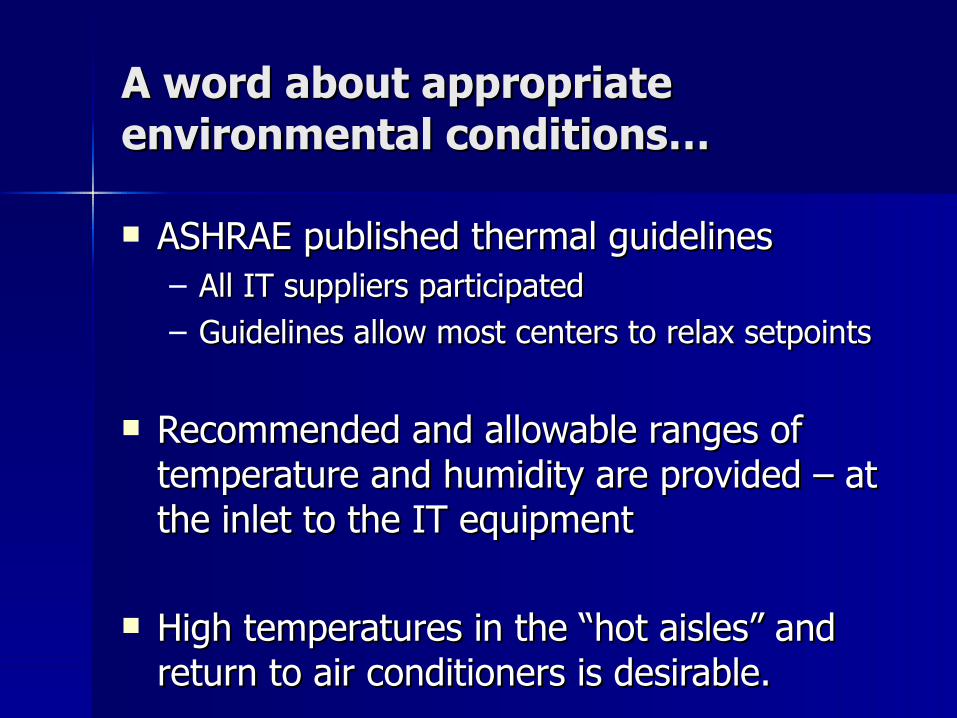
A word about appropriate A word about appropriate environmental conditions…environmental conditions…
ASHRAE published thermal guidelinesASHRAE published thermal guidelines– All IT suppliers participatedAll IT suppliers participated– Guidelines allow most centers to relax setpointsGuidelines allow most centers to relax setpoints
Recommended and allowable ranges of Recommended and allowable ranges of temperature and humidity are provided – at temperature and humidity are provided – at the inlet to the IT equipmentthe inlet to the IT equipment
High temperatures in the “hot aisles” and High temperatures in the “hot aisles” and return to air conditioners is desirable.return to air conditioners is desirable.
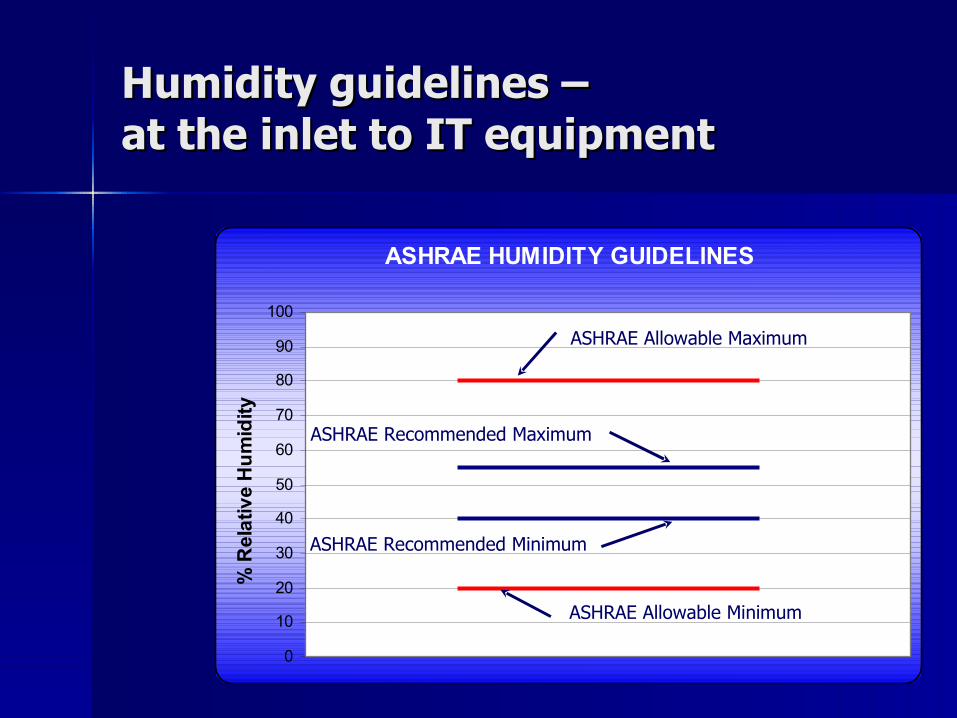
Humidity guidelines – Humidity guidelines – at the inlet to IT equipmentat the inlet to IT equipment
ASHRAE HUMIDITY GUIDELINES
0
10
20
30
40
50
60
70
80
90
100
% R
ela
tiv
e H
um
idit
y
ASHRAE Allowable Maximum
ASHRAE Allowable Minimum
ASHRAE Recommended Maximum
ASHRAE Recommended Minimum
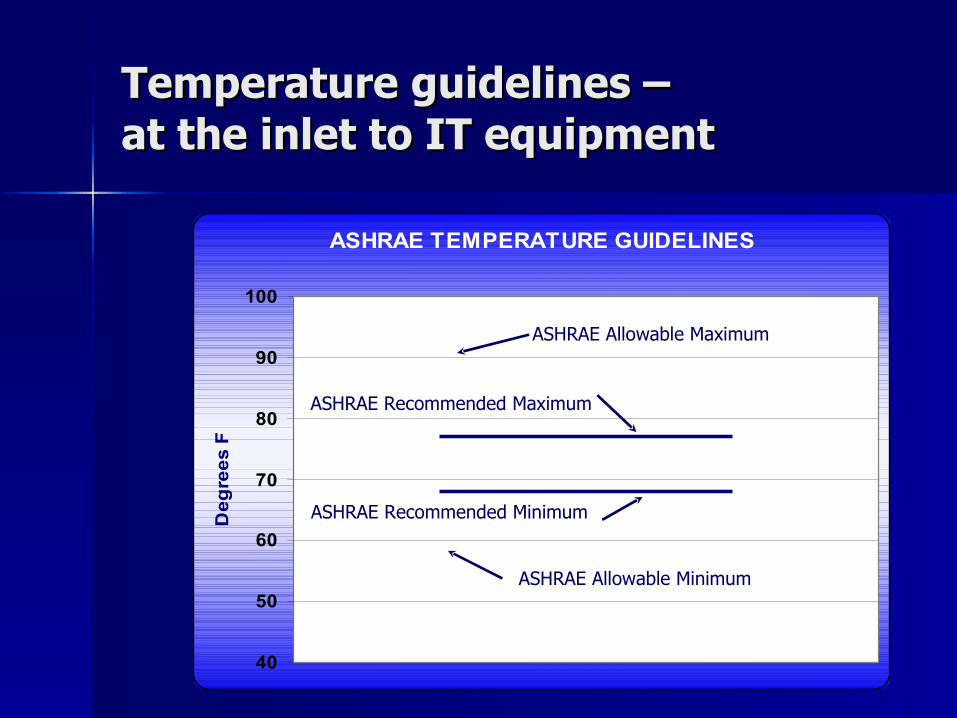
Temperature guidelines – Temperature guidelines – at the inlet to IT equipmentat the inlet to IT equipment
ASHRAE TEMPERATURE GUIDELINES
40
50
60
70
80
90
100
De
gre
es
F
ASHRAE Allowable Maximum
ASHRAE Allowable Minimum
ASHRAE Recommended Maximum
ASHRAE Recommended Minimum
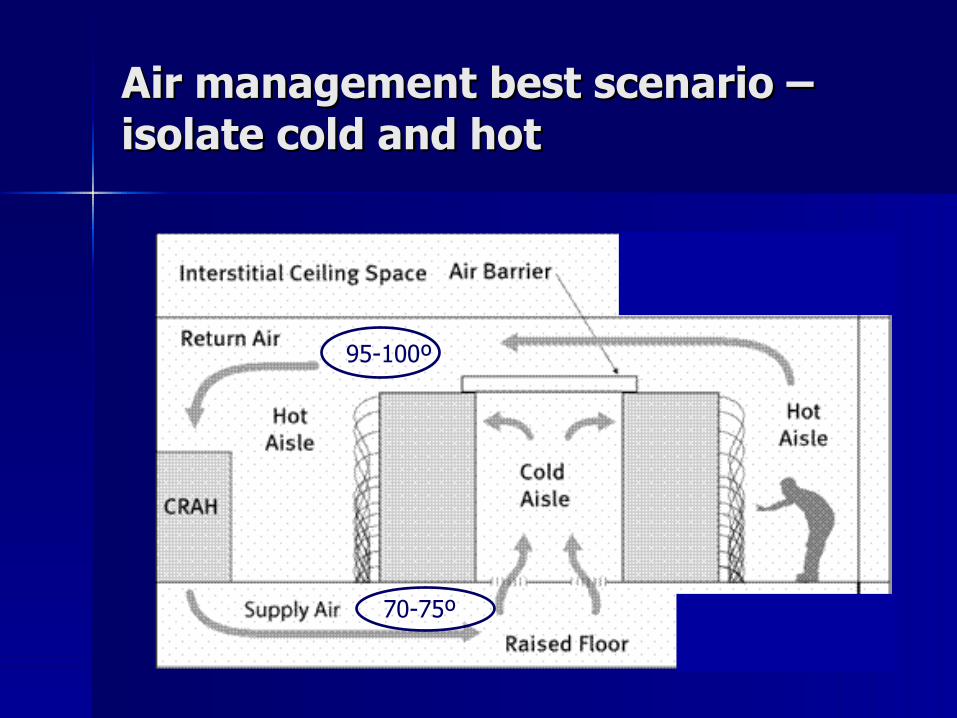
Air management best scenario – Air management best scenario – isolate cold and hotisolate cold and hot
70-75º
95-100º

Another isolation schemeAnother isolation scheme
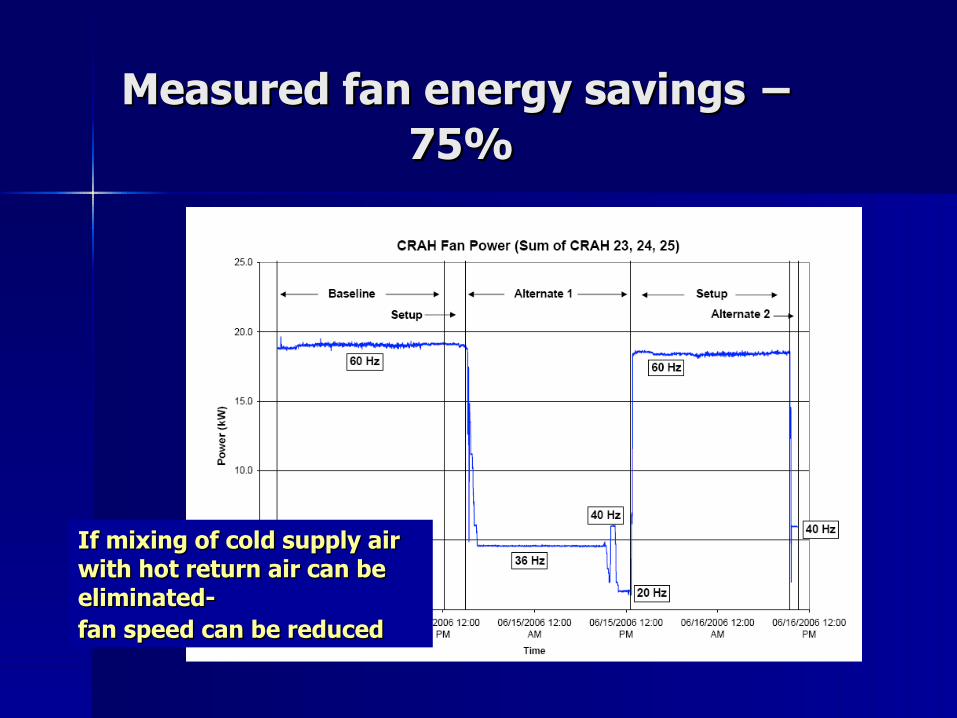
Measured fan energy savingsMeasured fan energy savings – – 75%75%
If mixing of cold supply air If mixing of cold supply air with hot return air can be with hot return air can be eliminated-eliminated-fan speed can be reducedfan speed can be reduced

Better temperature control can Better temperature control can allow raising the temperature in allow raising the temperature in the entire data center!the entire data center!
Cold Aisle NW - PGE12813
40
45
50
55
60
65
70
75
80
85
90
6/13/2006 12:00 6/14/2006 0:00 6/14/2006 12:00 6/15/2006 0:00 6/15/2006 12:00 6/16/2006 0:00 6/16/2006 12:00
Time
Tem
per
atu
re (
deg
F)
Low
Med
High
Baseline Alternate 1
Setup
Setup
Alternate 2
ASHRAE Recommended Range
Ranges during demonstration
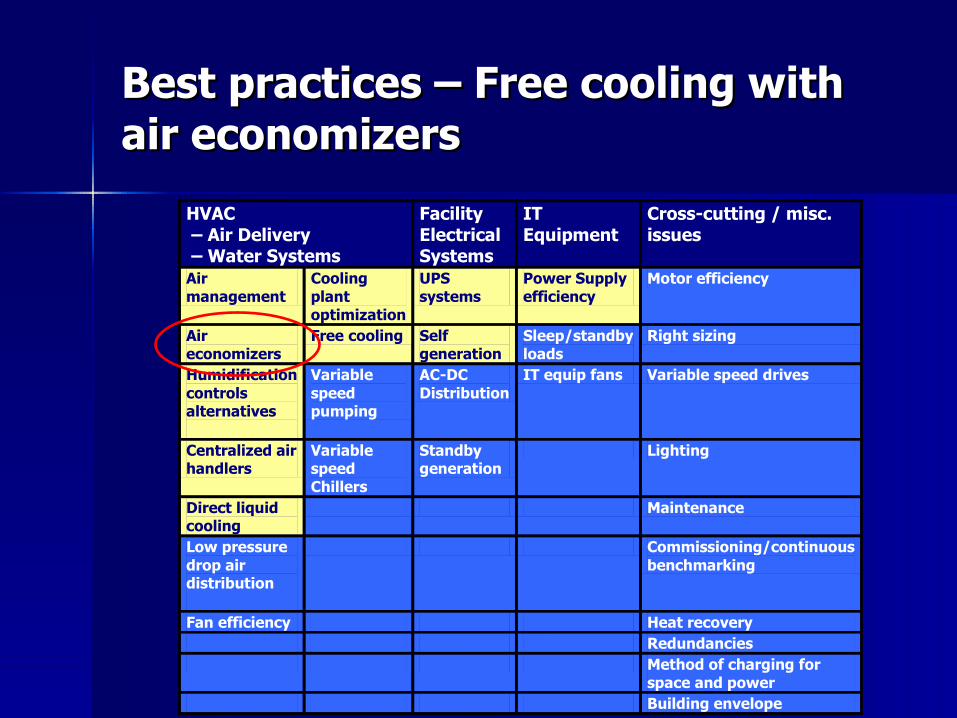
Best practices – Free cooling with Best practices – Free cooling with air economizersair economizers
HVAC – Air Delivery – Water Systems
Facility Electrical Systems
IT Equipment
Cross-cutting / misc. issues
Air management
Cooling plant optimization
UPS systems
Power Supply efficiency
Motor efficiency
Air economizers
Free cooling Self generation
Sleep/standby loads
Right sizing
Humidification controls alternatives
Variable speed pumping
AC-DC Distribution
IT equip fans Variable speed drives
Centralized air handlers
Variable speed Chillers
Standby generation
Lighting
Direct liquid cooling
Maintenance
Low pressure drop air distribution
Commissioning/continuous benchmarking
Fan efficiency Heat recovery Redundancies Method of charging for
space and power Building envelope

Encouraging outside air economizersEncouraging outside air economizers
Issue: Issue: – Many are reluctant to use air economizersMany are reluctant to use air economizers– Outdoor pollutants and humidity control considered Outdoor pollutants and humidity control considered
equipment riskequipment risk Goal: Goal:
– Encourage use of outside air economizers where Encourage use of outside air economizers where climate is appropriateclimate is appropriate
Strategy: Strategy: – Address concerns: contamination/humidity controlAddress concerns: contamination/humidity control– Quantify energy savings benefitsQuantify energy savings benefits

Outdoor MeasurmentsFine Particulate Matter
0
20
40
60
80
100
120
140
160
12:00PM
6:00PM
12:00AM
6:00AM
12:00PM
6:00PM
12:00AM
6:00AM
12:00PM
6:00PM
12:00AM
6:00AM
12:00PM
6:00PM
12:00AM
6:00AM
12:00PM
6:00PM
12:00AM
Par
ticl
e C
on
c. (
µg/m
3) LBNL
NERSC
Center 3
Center 4
Center 5
Center 6
Center 7
Center 8
Outdoor measurementsOutdoor measurements
IBM Standard
EPA Annual Health Standard
EPA 24-Hour Health Standard
and ASHRAE Standard

Indoor Measurments Fine Particulate Matter
0
20
40
60
80
100
120
140
160
12:00PM
6:00PM
12:00AM
6:00AM
12:00PM
6:00PM
12:00AM
6:00AM
12:00PM
6:00PM
12:00AM
6:00AM
12:00PM
6:00PM
12:00AM
6:00AM
12:00PM
6:00PM
12:00AM
Par
ticl
e C
on
c. (
µg/m
3) LBNL
NERSC
Center 3
Center 4
Center 5
Center 6
Center 7
Center 8
Measurements inside the centersMeasurements inside the centers
IBM Standard
EPA Annual Health Standard
EPA 24-Hour Health Standard
and ASHRAE Standard
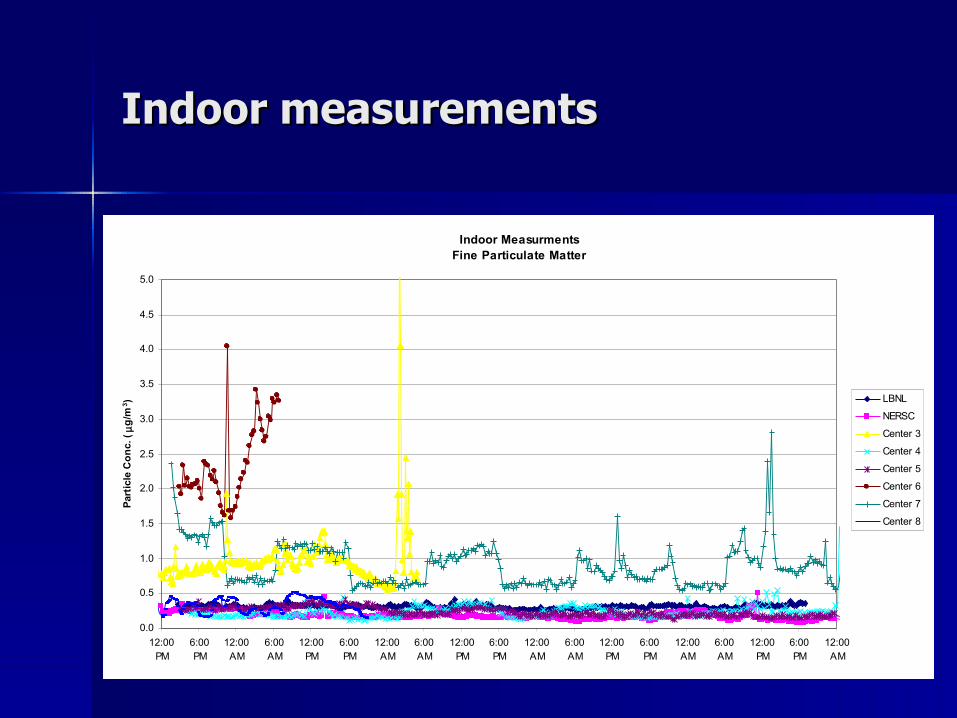
Indoor measurementsIndoor measurements
Indoor Measurments Fine Particulate Matter
0.0
0.5
1.0
1.5
2.0
2.5
3.0
3.5
4.0
4.5
5.0
12:00PM
6:00PM
12:00AM
6:00AM
12:00PM
6:00PM
12:00AM
6:00AM
12:00PM
6:00PM
12:00AM
6:00AM
12:00PM
6:00PM
12:00AM
6:00AM
12:00PM
6:00PM
12:00AM
Par
ticl
e C
on
c. (
µg/m
3) LBNL
NERSC
Center 3
Center 4
Center 5
Center 6
Center 7
Center 8

Data center w/economizerData center w/economizer
Center 8w/economizer
0.3-5 Particulate Matter
0
10
20
30
40
50
60
70
80
90
100
8/18/060:00
8/18/0612:00
8/19/060:00
8/19/0612:00
8/20/060:00
8/20/0612:00
8/21/060:00
8/21/0612:00
8/22/060:00
8/22/0612:00
8/23/060:00
8/23/0612:00
8/24/060:00
8/24/0612:00
8/25/060:00
8/25/0612:00
8/26/060:00
Part
icle
Co
nc
. ( µg
/m3)
Outside
Outside (PostFilter)
PreServer
RmAmb

Indoor Relative Humidity
10.0
20.0
30.0
40.0
50.0
60.0
70.0
80.0
90.0
12:00PM
6:00PM
12:00AM
6:00AM
12:00PM
6:00PM
12:00AM
6:00AM
12:00PM
6:00PM
12:00AM
6:00AM
12:00PM
6:00PM
12:00AM
6:00AM
12:00PM
6:00PM
12:00AM
RH
(%
)
Center 8
Center 7
Center 5
Humidity measurementsHumidity measurements
ASHRAE Recommended Upper Limit
ASHRAE Recommended Lower Limit
ASHRAE Allowable Lower Limit
ASHRAE Allowable Upper Limit

FindingsFindings
Water soluble salts in combination with high Water soluble salts in combination with high humidity can cause failureshumidity can cause failures
Static electricity can occur with very low humidityStatic electricity can occur with very low humidity New ASHRAE particle limits drastically lower than New ASHRAE particle limits drastically lower than
manufacturer standardmanufacturer standard Particle concentration typically (no economizer) an Particle concentration typically (no economizer) an
order of magnitude lower than new ASHRAE limitsorder of magnitude lower than new ASHRAE limits Economizers, without other mitigation, can cause Economizers, without other mitigation, can cause
particle concentration to approach new ASHRAE particle concentration to approach new ASHRAE limits but filtration can mitigate thislimits but filtration can mitigate this

Best practices – power conversionBest practices – power conversion
HVAC – Air Delivery – Water Systems
Facility Electrical Systems
IT Equipment
Cross-cutting / misc. issues
Air management
Cooling plant optimization
UPS systems
Power Supply efficiency
Motor efficiency
Air economizers
Free cooling Self generation
Sleep/standby loads
Right sizing
Humidification controls alternatives
Variable speed pumping
AC-DC Distribution
IT equip fans Variable speed drives
Centralized air handlers
Variable speed Chillers
Standby generation
Lighting
Direct liquid cooling
Maintenance
Low pressure drop air distribution
Commissioning/continuous benchmarking
Fan efficiency Heat recovery Redundancies Method of charging for
space and power Building envelope
Inverter
In Out
Bypass
Battery/ChargerRectifier
Internal Drive
External Drive
I/O
Memory Controller
µ Processor
SDRAM
Graphics Controller
DC/DCAC/DC
DC/DC
AC/DC Multi output PS
Voltage Regulator Modules
5V
12V
3.3V
12V 1.5/2.5V
1.1V-1.85V
3.3V
3.3V
12V
PWM/PFCSwitcher
Unregulated DCTo Multi Output Regulated DC
Voltages
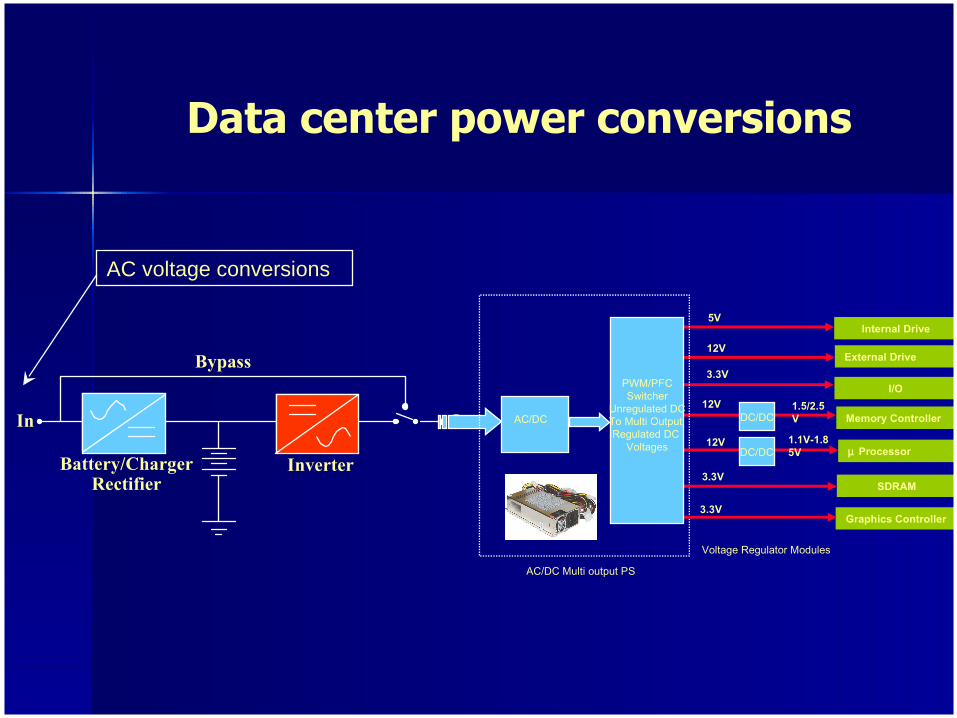
Data center power conversions
AC voltage conversions
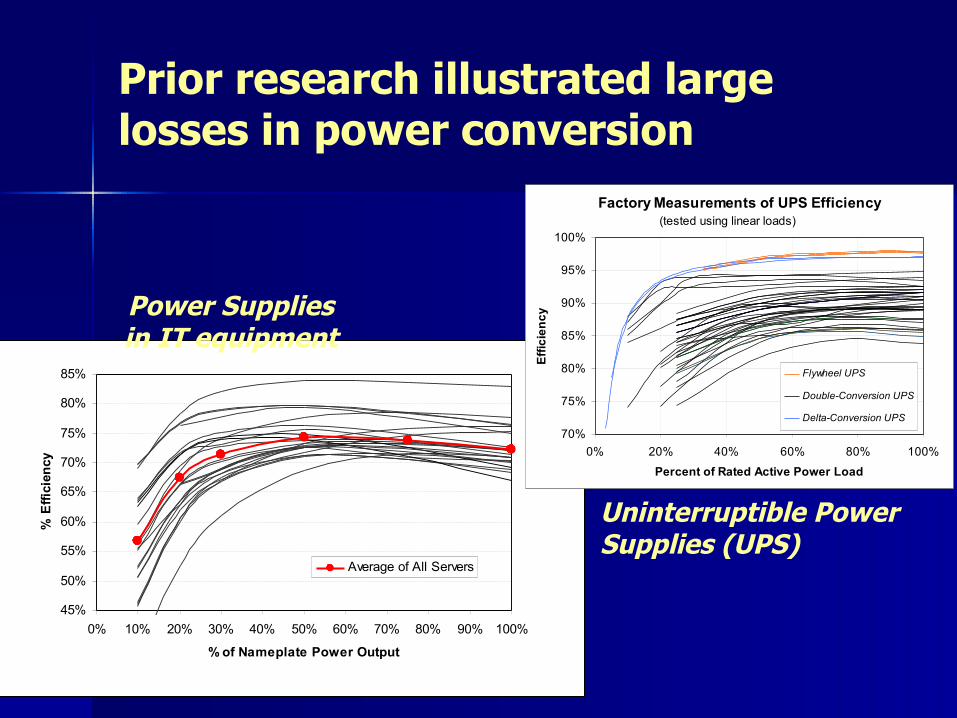
Prior research illustrated large losses in power conversion
45%
50%
55%
60%
65%
70%
75%
80%
85%
0% 10% 20% 30% 40% 50% 60% 70% 80% 90% 100%
% of Nameplate Power Output
% E
ffic
ien
cy
Average of All Servers
Uninterruptible Power Supplies (UPS)
Power Supplies in IT equipment
Factory Measurements of UPS Efficiency
70%
75%
80%
85%
90%
95%
100%
0% 20% 40% 60% 80% 100%
Percent of Rated Active Power Load
Eff
icie
nc
y
Flywheel UPS
Double-Conversion UPS
Delta-Conversion UPS
(tested using linear loads)

With over 25 industry partners direct DC powering of servers was demonstrated
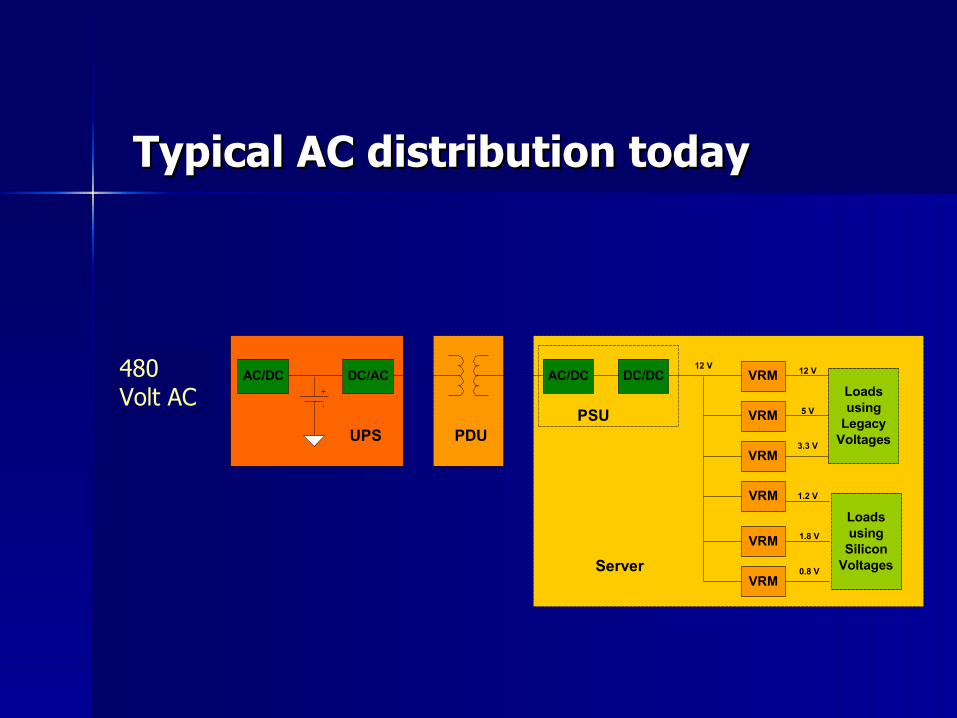
Typical AC distribution todayTypical AC distribution today
DC/ACAC/DC480 VACBulk Power
Supply
UPS PDU
AC/DC DC/DC VRM
VRM
VRM
VRM
VRM
VRM
12 V
Loadsusing
LegacyVoltages
Loadsusing
SiliconVoltages
12 V
5 V
3.3 V
1.2 V
1.8 V
0.8 VServer
PSU
480 Volt AC

Facility-level DC distributionFacility-level DC distribution
AC/DC480 VACBulk Power
SupplyDC UPS
orRectifier
DC/DC VRM
VRM
VRM
VRM
VRM
VRM
12 V
Loadsusing
LegacyVoltages
Loadsusing
SiliconVoltages
12 V
5 V
3.3 V
1.2 V
1.8 V
0.8 VServer
PSU
380 VDC380V.DC480 Volt AC
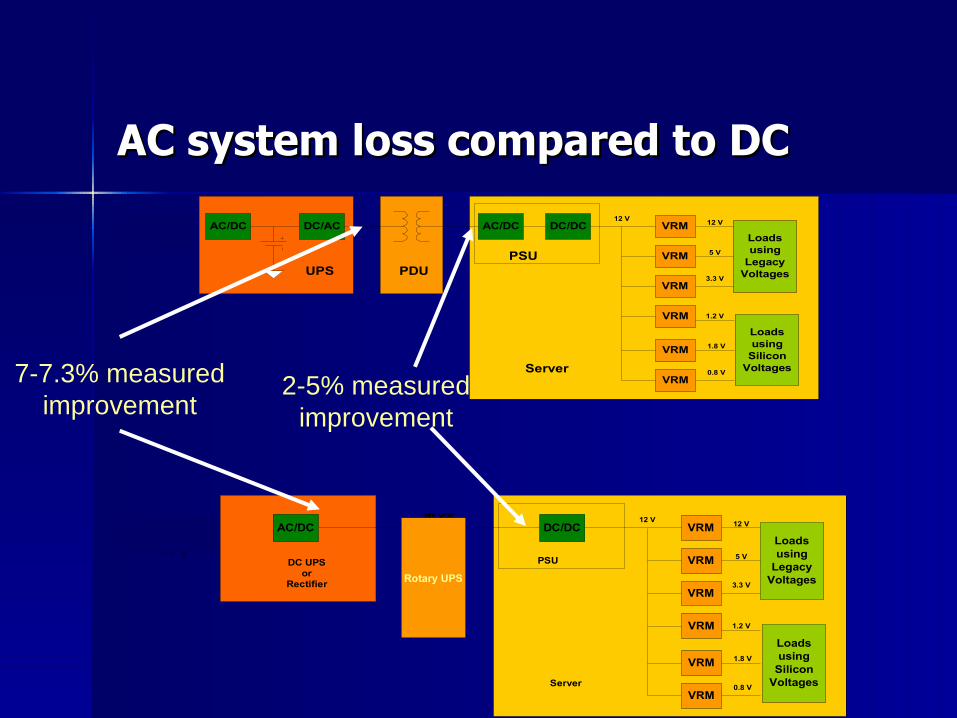
AC system loss compared to DCAC system loss compared to DC
DC/ACAC/DC480 VACBulk Power
Supply
UPS PDU
AC/DC DC/DC VRM
VRM
VRM
VRM
VRM
VRM
12 V
Loadsusing
LegacyVoltages
Loadsusing
SiliconVoltages
12 V
5 V
3.3 V
1.2 V
1.8 V
0.8 VServer
PSU
AC/DC480 VACBulk Power
SupplyDC UPS
orRectifier
DC/DC VRM
VRM
VRM
VRM
VRM
VRM
12 V
Loadsusing
LegacyVoltages
Loadsusing
SiliconVoltages
12 V
5 V
3.3 V
1.2 V
1.8 V
0.8 VServer
PSU
380 VDC
7-7.3% measured improvement
2-5% measured improvement
Rotary UPS

What’s newWhat’s new
Infrared thermography can be used as a visualization tool

websites: websites:
http://hightech.lbl.gov/datacenters/http://hightech.lbl.gov/datacenters/www.energystar.govwww.energystar.gov/datacenters/datacenters
www.eere.energy.gov/datacenters/www.eere.energy.gov/datacenters/

Discussion/Questions??Discussion/Questions??
Related Documents