International Journal "Information Theories & Applications" Vol.15 / 2008 76 [Reznik, et al., 1999] Reznik A., Kussul N., Sokolov A. “Identification of user activity using neural networks”, J. of Cybernetics and Computer Science, 1999, No. 123, pp. 70–79. (in Russian) [Ryan, et al., 1998] Ryan J., Lin M-J., Miikkulainen R. “Intrusion Detection with Neural Networks”, Advances in Neural Information Processing Systems, Cambridge, MA: MIT Press, 1998, pp. 943–949. [Shelestov, et al., 2006] Shelestov A.Yu., Kussul N.N., Skakun S.V. “Grid Technologies in Monitoring Systems Based on Satellite Data”, J. of Automation and Information Science, 2006, Vol. 38, Issue 3, pp. 69-80. [Skakun, et al., 2005] Skakun S.V., Kussul N.N., Lobunets A.G. “Implementation of the Neural Network Model of Users of Computer Systems on the Basis of Agent Technology”, J. of Automation and Information Sciences, 2005, Vol. 37, Issue 4, pp. 11-18. [Tulloch, 2003] Tulloch M. “Microsoft Encyclopedia of Security”, Redmond, Washington: Microsoft Press, 2003, 414 p. Authors' Information Andrii Yu. Shelestov – PhD, Senior Researcher, Department of Space Information Technologies and Systems, Space Research Institute of NASU-NSAU, Glushkov Ave 40, Kyiv-187, 03650 Ukraine, e-mail: [email protected] . Serhiy V. Skakun – PhD, Research Assistant, Department of Space Information Technologies and Systems, Space Research Institute of NASU-NSAU, Glushkov Ave 40, Kyiv-187, 03650 Ukraine, e-mail: [email protected] . Olga M. Kussul – BSc, Physics and Technology Institute, National Technical University “KPI”, Peremoga Ave 37, Kyiv-056, 03056 Ukraine, e-mail: [email protected] . DATA ASSIMILATION TECHNIQUE FOR FLOOD MONITORING AND PREDICTION Natalia Kussul, Andrii Shelestov, Serhiy Skakun, Oleksii Kravchenko Abstract. This paper focuses on the development of methods and cascade of models for flood monitoring and forecasting and its implementation in Grid environment. The processing of satellite data for flood extent mapping is done using neural networks. For flood forecasting we use cascade of models: regional numerical weather prediction (NWP) model, hydrological model and hydraulic model. Implementation of developed methods and models in the Grid infrastructure and related projects are discussed. Keywords: Grid computing, remote sensing, modeling, international Grid projects. Introduction Nowadays Grid represents a powerful technology for solution of complex large-scale problems arising in such areas as high-energy physics [1], gravitational-wave physics [2], astronomy [3], bioinformatics [4], Earth Observations (EO) [5, 6, 7], etc. To this end the efficiency of application of Grids in different domains was demonstrated in numerous projects: EGEE [8], GriPhyN [9], DataGrid [10], CrossGrid [11] etc. The advantages of Grids come from its ability to integrate heterogeneous computational and informational resources managed by different distributed organizations [12]. It is particularly important for EO domain where one needs to manage with large amounts of data acquired from different satellites in different spectral bands that need to be integrated with aerial and in-situ components and maps; complex workflows; distributed archives and so on [5, 7]. Today remote sensing data from space are widely used for natural hazards and environmental monitoring, land use management, agriculture, etc. Floods are among the most devastating natural hazards in the world, affecting more people and causing more property damage than any other natural phenomena [13]. The dramatic floods of Central and Eastern Europe in August 2002 and Spring 2001 and 2006 emphasize the extreme in climatic variations. Ukraine is also vulnerable to floods as, in particular in the Carpathian region where it occurs almost

Welcome message from author
This document is posted to help you gain knowledge. Please leave a comment to let me know what you think about it! Share it to your friends and learn new things together.
Transcript
International Journal "Information Theories & Applications" Vol.15 / 2008
76
[Reznik, et al., 1999] Reznik A., Kussul N., Sokolov A. “Identification of user activity using neural networks”, J. of Cybernetics and Computer Science, 1999, No. 123, pp. 70–79. (in Russian)
[Ryan, et al., 1998] Ryan J., Lin M-J., Miikkulainen R. “Intrusion Detection with Neural Networks”, Advances in Neural Information Processing Systems, Cambridge, MA: MIT Press, 1998, pp. 943–949.
[Shelestov, et al., 2006] Shelestov A.Yu., Kussul N.N., Skakun S.V. “Grid Technologies in Monitoring Systems Based on Satellite Data”, J. of Automation and Information Science, 2006, Vol. 38, Issue 3, pp. 69-80.
[Skakun, et al., 2005] Skakun S.V., Kussul N.N., Lobunets A.G. “Implementation of the Neural Network Model of Users of Computer Systems on the Basis of Agent Technology”, J. of Automation and Information Sciences, 2005, Vol. 37, Issue 4, pp. 11-18.
[Tulloch, 2003] Tulloch M. “Microsoft Encyclopedia of Security”, Redmond, Washington: Microsoft Press, 2003, 414 p.
Authors' Information Andrii Yu. Shelestov – PhD, Senior Researcher, Department of Space Information Technologies and Systems, Space Research Institute of NASU-NSAU, Glushkov Ave 40, Kyiv-187, 03650 Ukraine, e-mail: [email protected]. Serhiy V. Skakun – PhD, Research Assistant, Department of Space Information Technologies and Systems, Space Research Institute of NASU-NSAU, Glushkov Ave 40, Kyiv-187, 03650 Ukraine, e-mail: [email protected]. Olga M. Kussul – BSc, Physics and Technology Institute, National Technical University “KPI”, Peremoga Ave 37, Kyiv-056, 03056 Ukraine, e-mail: [email protected].
DATA ASSIMILATION TECHNIQUE FOR FLOOD MONITORING AND PREDICTION
Natalia Kussul, Andrii Shelestov, Serhiy Skakun, Oleksii Kravchenko
Abstract. This paper focuses on the development of methods and cascade of models for flood monitoring and forecasting and its implementation in Grid environment. The processing of satellite data for flood extent mapping is done using neural networks. For flood forecasting we use cascade of models: regional numerical weather prediction (NWP) model, hydrological model and hydraulic model. Implementation of developed methods and models in the Grid infrastructure and related projects are discussed.
Keywords: Grid computing, remote sensing, modeling, international Grid projects.
Introduction Nowadays Grid represents a powerful technology for solution of complex large-scale problems arising in such areas as high-energy physics [1], gravitational-wave physics [2], astronomy [3], bioinformatics [4], Earth Observations (EO) [5, 6, 7], etc. To this end the efficiency of application of Grids in different domains was demonstrated in numerous projects: EGEE [8], GriPhyN [9], DataGrid [10], CrossGrid [11] etc. The advantages of Grids come from its ability to integrate heterogeneous computational and informational resources managed by different distributed organizations [12]. It is particularly important for EO domain where one needs to manage with large amounts of data acquired from different satellites in different spectral bands that need to be integrated with aerial and in-situ components and maps; complex workflows; distributed archives and so on [5, 7]. Today remote sensing data from space are widely used for natural hazards and environmental monitoring, land use management, agriculture, etc. Floods are among the most devastating natural hazards in the world, affecting more people and causing more property damage than any other natural phenomena [13]. The dramatic floods of Central and Eastern Europe in August 2002 and Spring 2001 and 2006 emphasize the extreme in climatic variations. Ukraine is also vulnerable to floods as, in particular in the Carpathian region where it occurs almost
International Journal "Information Theories & Applications" Vol.15 / 2008
77
every year. During the floods in 2001, 9 people were killed and 12000 citizens were evacuated, more than 1500 buildings were destroyed, and more than 30000 buildings were flooded. That is why, flood monitoring and forecasting is a task of great importance. This task is also included as priority one to GEO 2007-2009 Work Plan in the framework of development of Global Earth Observation System of Systems (GEOSS) [14]. Efficient monitoring and prediction of floods and risk management is impossible without the use of EO data from space. Satellite observations enable acquisition of data for large and hard-to-reach territories, as well as continuous measurements. One of the important problems associated with flood monitoring is flood extent extraction, since it is impractical to acquire the flood area through field observations. Flood extent can be used for hydraulic models to reconstruct what happened during the flood and determine what caused the water to go where it did, for damage assessment and risk management, and can benefit to rescuers during flooding. In this paper a new neural network approach for flood extent extraction from space-borne Synthetic Aperture Radar (SAR) data is proposed. First, image segmentation is done by means of the self-organizing Kohonen maps. The further classification of the image is done by assigning each pixel of the image flood extent/not flood extent class using additional data from Landsat-7 ETM+ and Corine 2000 Land Cover. As to flood forecasting, we use cascade of models: regional numerical weather prediction (NWP) model implemented with the Weather Research and Forecast (WRF) model, hydrological model (in particular, Hydrological Simulation Program (HSPF) and Noah Land Surface Model (LSM)) and hydraulic model (in particular, FESWMS). We finish the paper with the description of implementation of our methods and models in Grid environment and related international projects.
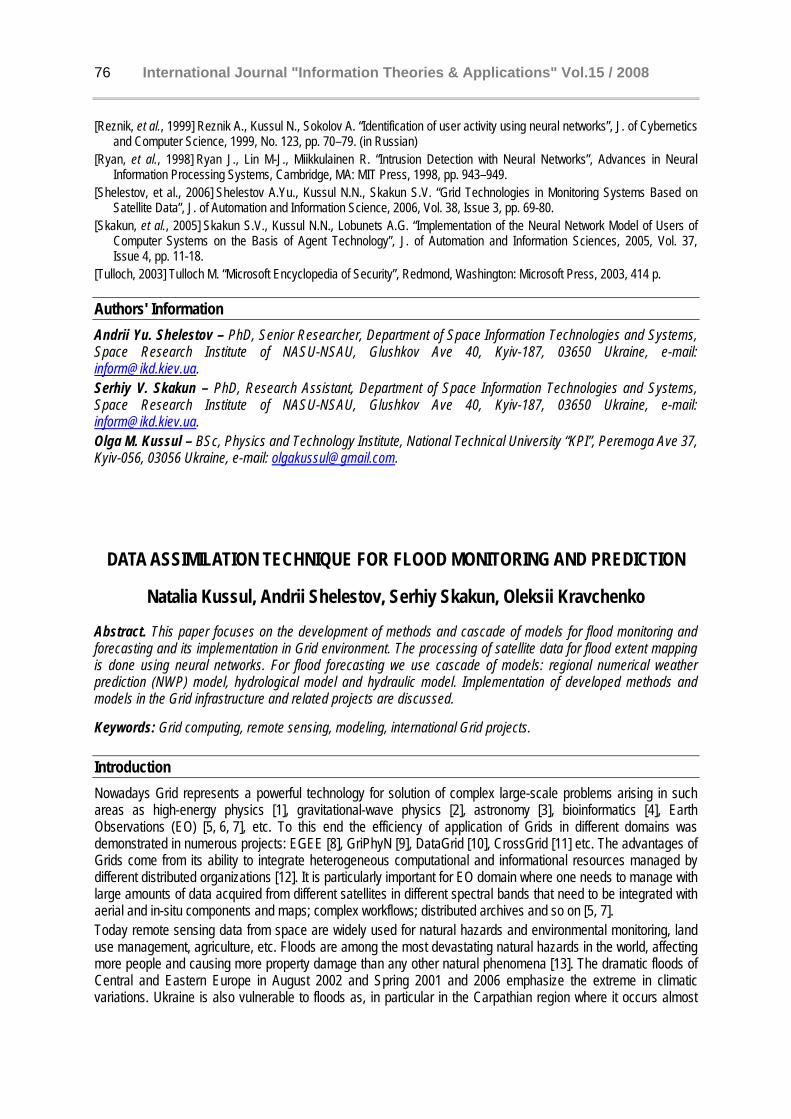
Application of SAR data from space for flood extent extraction SAR (synthetic aperture radar) measurements from space can provide valuable information to monitoring of flood events [15]. This is mainly due to the fact that SAR image acquisition is independent of daytime and weather conditions. The use of SAR data for flood extent mapping is motivated by the fact that smooth water surface provides no return to antenna in microwave spectrum and appears black in SAR imagery. Existing methods for flood extent mapping are primary based on the use of multitemporal technique (Fig. 1) [16], and pixel processing methods with threshold [17]. Though these methods are rather simple and quick, they posses some disadvantages: need of manual threshold selection and image segmentation, require expertise in visual interpretation of SAR images, require the use of complex models for speckle reduction, spatial connections between pixels not concerned.
Fig. 1. Multitemporal image composed of two ERS-2 images acquired during flooding on Tisza River (10 March,
2001) and after flooding (14 April, 2001). R, G: March, 10, 2001; B: April,14,2001. Blue areas indicate flood extent. © ESA 2007.
To overcome these difficulties intelligent approach for image segmentation using artificial neural networks (NN)— self-organizing Kohonen’s maps (SOMs) [18] — has been developed. This approach enables adaptive weights
International Journal "Information Theories & Applications" Vol.15 / 2008
78
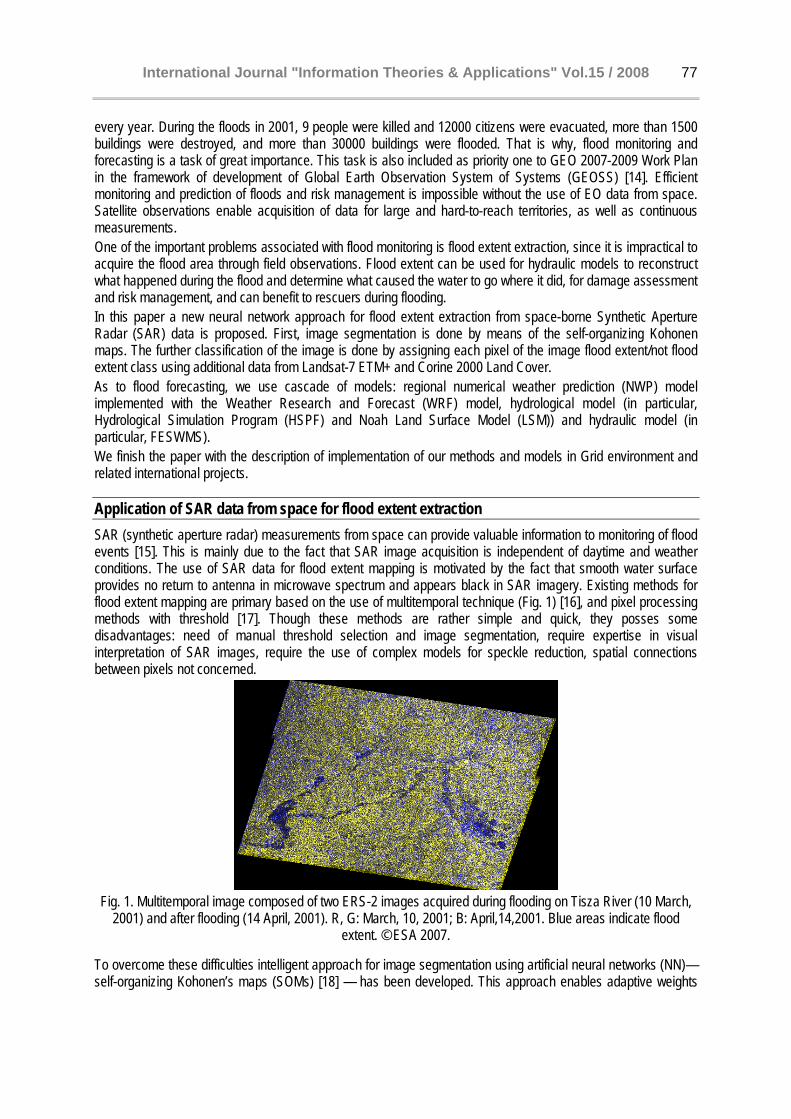
adjustment and considers spatial properties of pixels using sliding window. In turn, SOMs provide effective software tool for the visualization of high-dimensional data, automatically discover of statistically salient features of pattern vectors in data set, and can find clusters in training data pattern space which can be used to classify new patterns. The workflow for flood extent extraction based on SAR data consists of the following tasks: 1. Transformation of raw data to lat/long projection. 2. Image calibration. 3. Co-registration (to available Landsat-7 ETM+ data). 4. Image segmentation using SOMs. 5. Flood extent extraction: each neuron (cluster) is assigned flood extent/not flood extent class using additional data from Landsat-7 ETM+ and Corine 2000 Land Cover.
(a) (b) (c)
Fig. 2. Flood extent extraction process: (a) Raw ERS-2 image (b) Image segmentation using SOMs (c) Flood extent (marked with blue) © ESA 2007.
The results of application of the proposed approach to flood extent extraction using SOMs are depicted in Fig. 2. Figure 2(a) shows original ESA ERS-2 satellite image with flooded areas that absorb radar signal (these areas marked with black). Figure 2(b) shows results of image segmentation using SOMs which clearly reveals the existence of different clusters (marked with different colors). Landasat-7 ETM+ and Corine 2000 Land Cover were used to assign each neuron one of the classes: flood extent, not flood extent. The results of assignment are depicted in Fig. 2(c): blue color shows flooded areas or areas with strong presence of water, while non flooded area are marked with yellow color. Data for this work were provided by the European Space Agency (ESA) within Category-1 project “Wide Area Grid Testbed for Flood Monitoring using Spaceborne SAR and Optical Data” (no. 4181).
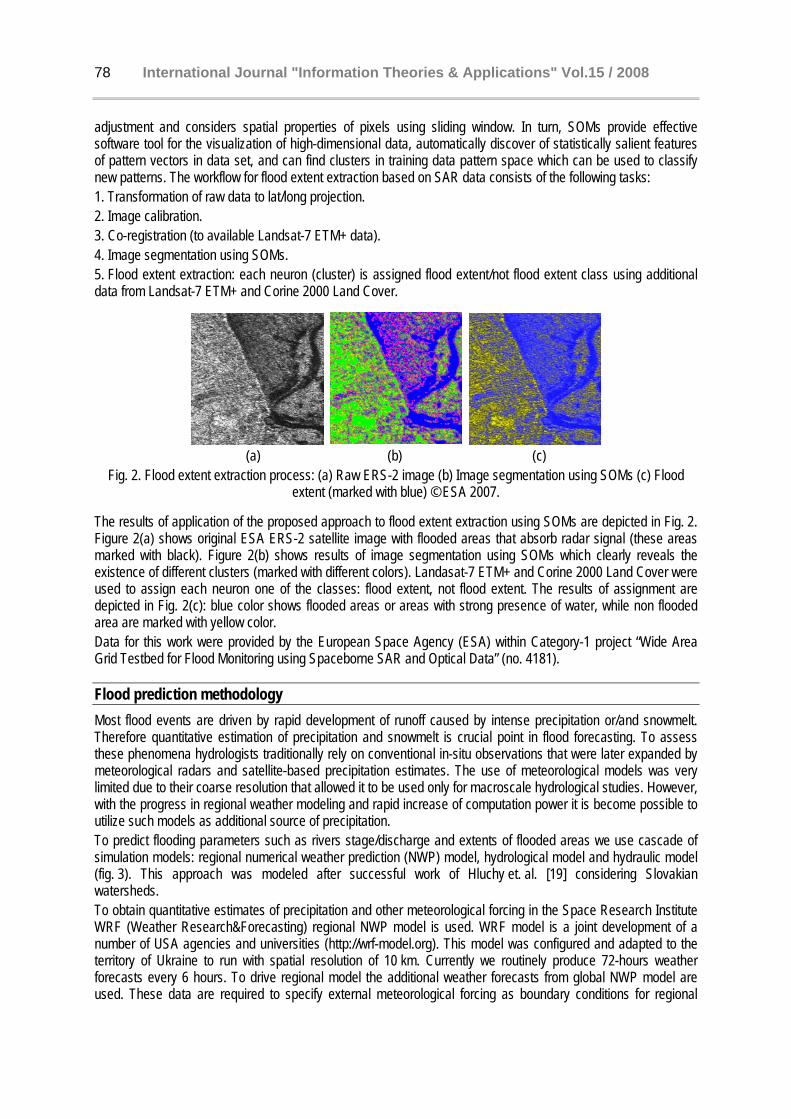
Flood prediction methodology Most flood events are driven by rapid development of runoff caused by intense precipitation or/and snowmelt. Therefore quantitative estimation of precipitation and snowmelt is crucial point in flood forecasting. To assess these phenomena hydrologists traditionally rely on conventional in-situ observations that were later expanded by meteorological radars and satellite-based precipitation estimates. The use of meteorological models was very limited due to their coarse resolution that allowed it to be used only for macroscale hydrological studies. However, with the progress in regional weather modeling and rapid increase of computation power it is become possible to utilize such models as additional source of precipitation. To predict flooding parameters such as rivers stage/discharge and extents of flooded areas we use cascade of simulation models: regional numerical weather prediction (NWP) model, hydrological model and hydraulic model (fig. 3). This approach was modeled after successful work of Hluchy et. al. [19] considering Slovakian watersheds. To obtain quantitative estimates of precipitation and other meteorological forcing in the Space Research Institute WRF (Weather Research&Forecasting) regional NWP model is used. WRF model is a joint development of a number of USA agencies and universities (http://wrf-model.org). This model was configured and adapted to the territory of Ukraine to run with spatial resolution of 10 km. Currently we routinely produce 72-hours weather forecasts every 6 hours. To drive regional model the additional weather forecasts from global NWP model are used. These data are required to specify external meteorological forcing as boundary conditions for regional
International Journal "Information Theories & Applications" Vol.15 / 2008
79
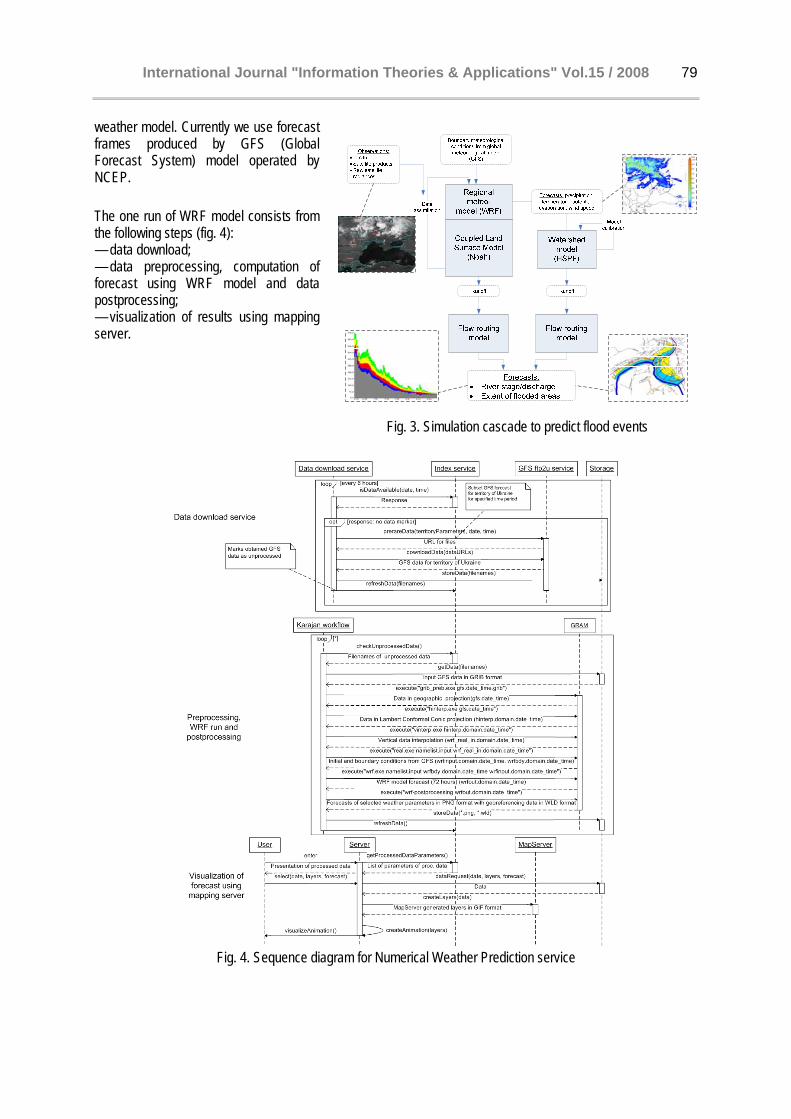
weather model. Currently we use forecast frames produced by GFS (Global Forecast System) model operated by NCEP. The one run of WRF model consists from the following steps (fig. 4): — data download; — data preprocessing, computation of forecast using WRF model and data postprocessing; — visualization of results using mapping server.
Fig. 4. Sequence diagram for Numerical Weather Prediction service
Fig. 3. Simulation cascade to predict flood events
International Journal "Information Theories & Applications" Vol.15 / 2008
80
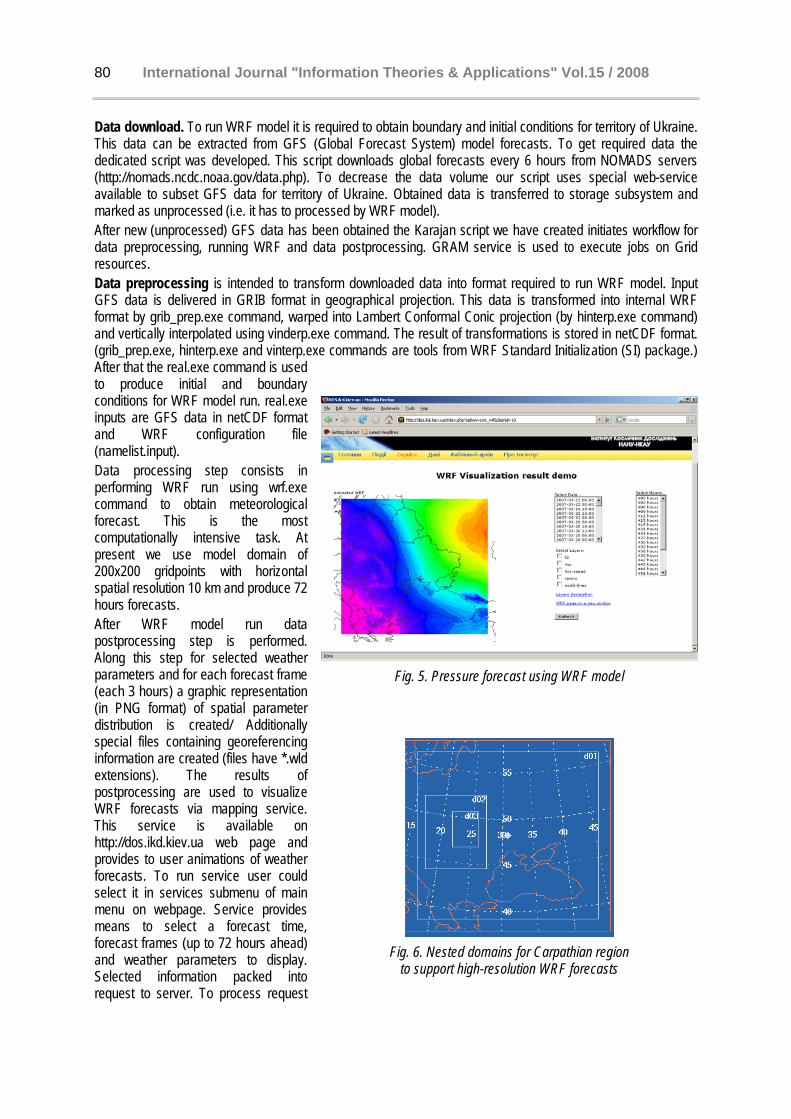
Data download. To run WRF model it is required to obtain boundary and initial conditions for territory of Ukraine. This data can be extracted from GFS (Global Forecast System) model forecasts. To get required data the dedicated script was developed. This script downloads global forecasts every 6 hours from NOMADS servers (http://nomads.ncdc.noaa.gov/data.php). To decrease the data volume our script uses special web-service available to subset GFS data for territory of Ukraine. Obtained data is transferred to storage subsystem and marked as unprocessed (i.e. it has to processed by WRF model). After new (unprocessed) GFS data has been obtained the Karajan script we have created initiates workflow for data preprocessing, running WRF and data postprocessing. GRAM service is used to execute jobs on Grid resources. Data preprocessing is intended to transform downloaded data into format required to run WRF model. Input GFS data is delivered in GRIB format in geographical projection. This data is transformed into internal WRF format by grib_prep.exe command, warped into Lambert Conformal Conic projection (by hinterp.exe command) and vertically interpolated using vinderp.exe command. The result of transformations is stored in netCDF format. (grib_prep.exe, hinterp.exe and vinterp.exe commands are tools from WRF Standard Initialization (SI) package.) After that the real.exe command is used to produce initial and boundary conditions for WRF model run. real.exe inputs are GFS data in netCDF format and WRF configuration file (namelist.input). Data processing step consists in performing WRF run using wrf.exe command to obtain meteorological forecast. This is the most computationally intensive task. At present we use model domain of 200x200 gridpoints with horizontal spatial resolution 10 km and produce 72 hours forecasts. After WRF model run data postprocessing step is performed. Along this step for selected weather parameters and for each forecast frame (each 3 hours) a graphic representation (in PNG format) of spatial parameter distribution is created/ Additionally special files containing georeferencing information are created (files have *.wld extensions). The results of postprocessing are used to visualize WRF forecasts via mapping service. This service is available on http://dos.ikd.kiev.ua web page and provides to user animations of weather forecasts. To run service user could select it in services submenu of main menu on webpage. Service provides means to select a forecast time, forecast frames (up to 72 hours ahead) and weather parameters to display. Selected information packed into request to server. To process request
Fig. 5. Pressure forecast using WRF model
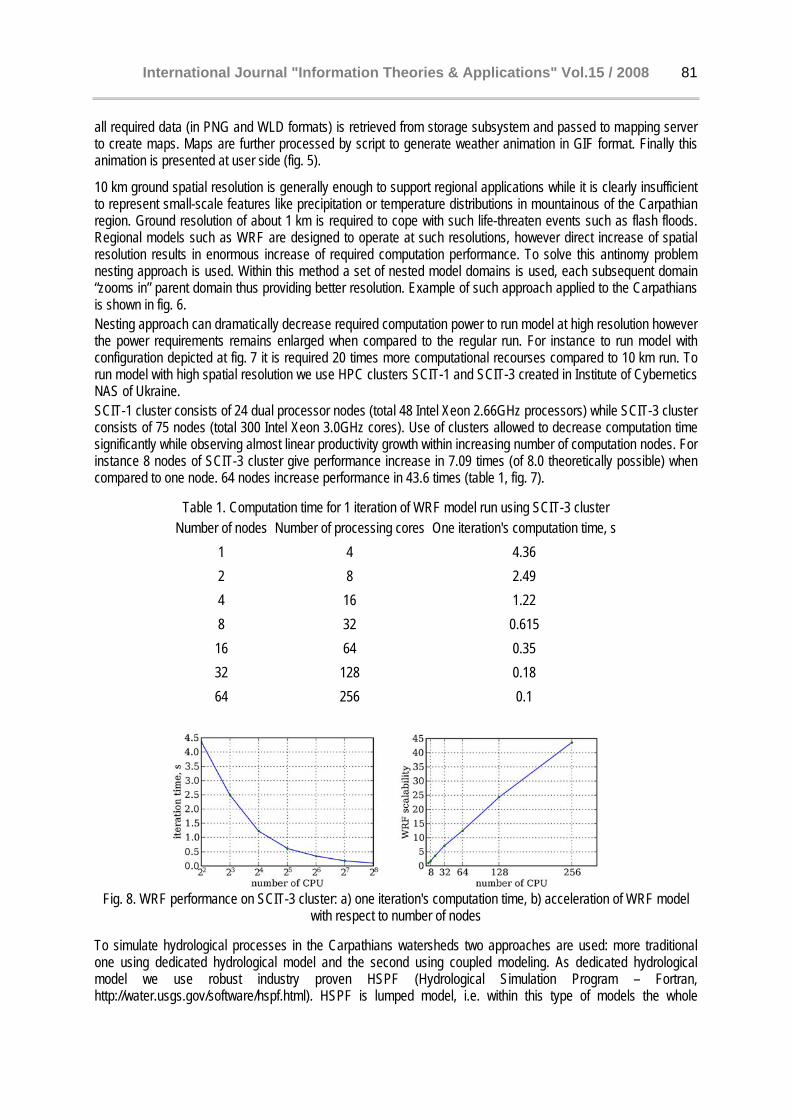
Fig. 6. Nested domains for Carpathian region
to support high-resolution WRF forecasts
International Journal "Information Theories & Applications" Vol.15 / 2008
81
all required data (in PNG and WLD formats) is retrieved from storage subsystem and passed to mapping server to create maps. Maps are further processed by script to generate weather animation in GIF format. Finally this animation is presented at user side (fig. 5).
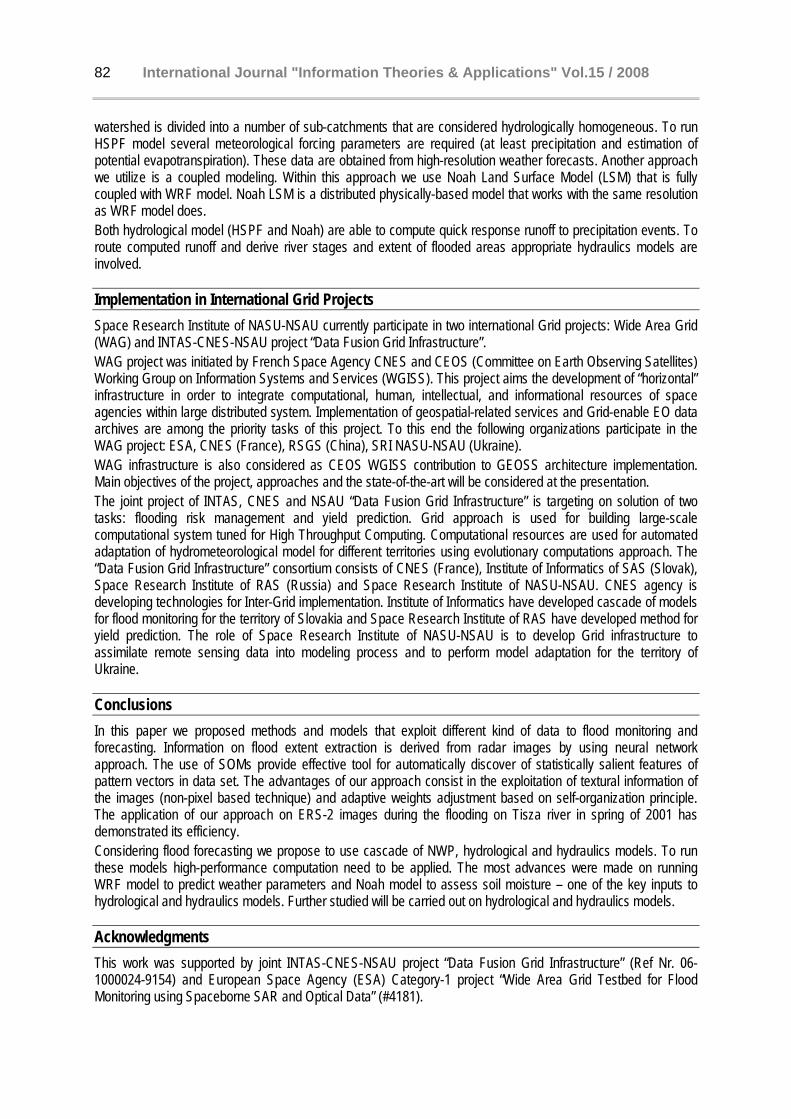
10 km ground spatial resolution is generally enough to support regional applications while it is clearly insufficient to represent small-scale features like precipitation or temperature distributions in mountainous of the Carpathian region. Ground resolution of about 1 km is required to cope with such life-threaten events such as flash floods. Regional models such as WRF are designed to operate at such resolutions, however direct increase of spatial resolution results in enormous increase of required computation performance. To solve this antinomy problem nesting approach is used. Within this method a set of nested model domains is used, each subsequent domain “zooms in” parent domain thus providing better resolution. Example of such approach applied to the Carpathians is shown in fig. 6. Nesting approach can dramatically decrease required computation power to run model at high resolution however the power requirements remains enlarged when compared to the regular run. For instance to run model with configuration depicted at fig. 7 it is required 20 times more computational recourses compared to 10 km run. To run model with high spatial resolution we use HPC clusters SCIT-1 and SCIT-3 created in Institute of Cybernetics NAS of Ukraine. SCIT-1 cluster consists of 24 dual processor nodes (total 48 Intel Xeon 2.66GHz processors) while SCIT-3 cluster consists of 75 nodes (total 300 Intel Xeon 3.0GHz cores). Use of clusters allowed to decrease computation time significantly while observing almost linear productivity growth within increasing number of computation nodes. For instance 8 nodes of SCIT-3 cluster give performance increase in 7.09 times (of 8.0 theoretically possible) when compared to one node. 64 nodes increase performance in 43.6 times (table 1, fig. 7).
Table 1. Computation time for 1 iteration of WRF model run using SCIT-3 cluster Number of nodes Number of processing cores One iteration's computation time, s
1 4 4.36 2 8 2.49 4 16 1.22 8 32 0.615 16 64 0.35 32 128 0.18 64 256 0.1
Fig. 8. WRF performance on SCIT-3 cluster: a) one iteration's computation time, b) acceleration of WRF model
with respect to number of nodes
To simulate hydrological processes in the Carpathians watersheds two approaches are used: more traditional one using dedicated hydrological model and the second using coupled modeling. As dedicated hydrological model we use robust industry proven HSPF (Hydrological Simulation Program – Fortran, http://water.usgs.gov/software/hspf.html). HSPF is lumped model, i.e. within this type of models the whole
International Journal "Information Theories & Applications" Vol.15 / 2008
82
watershed is divided into a number of sub-catchments that are considered hydrologically homogeneous. To run HSPF model several meteorological forcing parameters are required (at least precipitation and estimation of potential evapotranspiration). These data are obtained from high-resolution weather forecasts. Another approach we utilize is a coupled modeling. Within this approach we use Noah Land Surface Model (LSM) that is fully coupled with WRF model. Noah LSM is a distributed physically-based model that works with the same resolution as WRF model does. Both hydrological model (HSPF and Noah) are able to compute quick response runoff to precipitation events. To route computed runoff and derive river stages and extent of flooded areas appropriate hydraulics models are involved.
Implementation in International Grid Projects Space Research Institute of NASU-NSAU currently participate in two international Grid projects: Wide Area Grid (WAG) and INTAS-CNES-NSAU project “Data Fusion Grid Infrastructure”. WAG project was initiated by French Space Agency CNES and CEOS (Committee on Earth Observing Satellites) Working Group on Information Systems and Services (WGISS). This project aims the development of “horizontal” infrastructure in order to integrate computational, human, intellectual, and informational resources of space agencies within large distributed system. Implementation of geospatial-related services and Grid-enable EO data archives are among the priority tasks of this project. To this end the following organizations participate in the WAG project: ESA, CNES (France), RSGS (China), SRI NASU-NSAU (Ukraine). WAG infrastructure is also considered as CEOS WGISS contribution to GEOSS architecture implementation. Main objectives of the project, approaches and the state-of-the-art will be considered at the presentation. The joint project of INTAS, CNES and NSAU “Data Fusion Grid Infrastructure” is targeting on solution of two tasks: flooding risk management and yield prediction. Grid approach is used for building large-scale computational system tuned for High Throughput Computing. Computational resources are used for automated adaptation of hydrometeorological model for different territories using evolutionary computations approach. The “Data Fusion Grid Infrastructure” consortium consists of CNES (France), Institute of Informatics of SAS (Slovak), Space Research Institute of RAS (Russia) and Space Research Institute of NASU-NSAU. CNES agency is developing technologies for Inter-Grid implementation. Institute of Informatics have developed cascade of models for flood monitoring for the territory of Slovakia and Space Research Institute of RAS have developed method for yield prediction. The role of Space Research Institute of NASU-NSAU is to develop Grid infrastructure to assimilate remote sensing data into modeling process and to perform model adaptation for the territory of Ukraine.
Conclusions In this paper we proposed methods and models that exploit different kind of data to flood monitoring and forecasting. Information on flood extent extraction is derived from radar images by using neural network approach. The use of SOMs provide effective tool for automatically discover of statistically salient features of pattern vectors in data set. The advantages of our approach consist in the exploitation of textural information of the images (non-pixel based technique) and adaptive weights adjustment based on self-organization principle. The application of our approach on ERS-2 images during the flooding on Tisza river in spring of 2001 has demonstrated its efficiency. Considering flood forecasting we propose to use cascade of NWP, hydrological and hydraulics models. To run these models high-performance computation need to be applied. The most advances were made on running WRF model to predict weather parameters and Noah model to assess soil moisture – one of the key inputs to hydrological and hydraulics models. Further studied will be carried out on hydrological and hydraulics models.
Acknowledgments This work was supported by joint INTAS-CNES-NSAU project “Data Fusion Grid Infrastructure” (Ref Nr. 06-1000024-9154) and European Space Agency (ESA) Category-1 project “Wide Area Grid Testbed for Flood Monitoring using Spaceborne SAR and Optical Data” (#4181).
International Journal "Information Theories & Applications" Vol.15 / 2008
83
Bibliography 1. Holtman K.: CMS Requirements for the Grid. In: Proceedings of the International Conference on Computing in High
Energy and Nuclear Physics (CHEP2001) (2001). 2. Deelman E., Blackburn K., et al.: GriPhyN and LIGO, Building a Virtual Data Grid for Gravitational Wave Scientists.
Presented at 11th Intl. Symposium on High Performance Distributed Computing (2002). 3. Annis J., Y. Zhao et al. : Applying Chimera Virtual Data Concepts to Cluster Finding in the Sloan Sky Survey. Technical
Report GriPhyN-2002-05 (2002). 4. Peltier, S.T., et al.: The Telescience Portal for Advanced Tomography Applications. J. of Parallel and Distributed
Computing: Computational Grid, 63(5), 539-550 (2002). 5. Fusco L.: Earth Science GRID on Demand. Presented at CEOS WGISS-21 GRID Task Team Meeting, Budapest, May
(2006). 6. Fusco L., et al.: Putting Earth-Observation on the Grid. ESA Bulletin, 114, 86-91 (2003). 7. Shelestov A.Yu., Kussul N.N., Skakun S.V.: Grid Technologies in Monitoring Systems Based on Satellite Data. J. of
Automation and Information Science, Vol. 38, Issue 3, 69-80 (2006). 8. EGEE, http://www.eu-egee.org. 9. GriPhyN, http://www.griphyn.org. 10. DataGrid, http://eu-datagrid.web.cern.ch/eu-datagrid. 11. CrossGrid, http://www.crossgrid.org. 12. Foster, I., Kesselman, C., Tuecke, S.: The Anatomy of the Grid: Enabling Scalable Virtual Organizations. Int. J. of High
Performance Computing Applications, 15 (3). 200-222 (2001). 13. Committee on Earth Observation Satellites Disaster Management Support Group: The Use of Earth Observing Satellites
for Hazard Support: Assessments & Scenarios, Final Report; National Oceanic & Atmospheric Administration, Department of Commerce, USA (2001).
14. GEO Work Plan 2007-2009, “Toward Convergence”. 15. Solheim, I., Solbo, S., Indregard, M., Lauknes, I.: User Requirements and SAR-Solutions for Flood Mapping. In: 4th
International Symposium on Retrieval of Bio- and Geophysical Parameters from SAR Data for Land Applications, Innsbruck, Austria (2001).
16. ESA Earth Watch, http://earth.esa.int/ew/floods/. 17. Yang, C., Zhou, C., Wan, Q.: Deciding the Flood Extent with RADARSAT SAR Data and Image Fusion. In: 20th Asian
Conference on Remote Sensing (1999). 18. Haykin S.: Neural Networks: A Comprehensive Foundation. Upper Saddle River, New Jersey: Prentice Hall (1999). 19. Hluchy L., et al.: Collaborative environment for Grid-based flood prediction. Computing and Informatics, Vol. 24, 1001-
1022 (2005).
Authors' Information Natalia M. Kussul – Prof., Dr., Head of Department of Space Information Technologies and Systems, Space Research Institute of NASU-NSAU, Glushkov Ave 40, Kyiv-187, 03680 Ukraine, e-mail: [email protected]. Andrii Yu. Shelestov – PhD, Senior Researcher, Department of Space Information Technologies and Systems, Space Research Institute of NASU-NSAU, Glushkov Ave 40, Kyiv-187, 03680 Ukraine, e-mail: [email protected]. Serhiy V. Skakun – PhD, Research Assistant, Department of Space Information Technologies and Systems, Space Research Institute of NASU-NSAU, Glushkov Ave 40, Kyiv-187, 03680 Ukraine, e-mail: [email protected]. Oleksii M. Kravchenko – Junior Research Assistant, Department of Space Information Technologies and Systems, Space Research Institute of NASU-NSAU, Glushkov Ave 40, Kyiv-187, 03680 Ukraine, e-mail: [email protected].
Related Documents