Data Analytics Lens AWS Well-Architected Framework

Welcome message from author
This document is posted to help you gain knowledge. Please leave a comment to let me know what you think about it! Share it to your friends and learn new things together.
Transcript
Data Analytics LensAWS Well-Architected Framework
Data Analytics Lens AWS Well-Architected Framework
Data Analytics Lens: AWS Well-Architected FrameworkCopyright © Amazon Web Services, Inc. and/or its affiliates. All rights reserved.
Amazon's trademarks and trade dress may not be used in connection with any product or service that is notAmazon's, in any manner that is likely to cause confusion among customers, or in any manner that disparages ordiscredits Amazon. All other trademarks not owned by Amazon are the property of their respective owners, who mayor may not be affiliated with, connected to, or sponsored by Amazon.
Data Analytics Lens AWS Well-Architected Framework
Table of ContentsIntroduction .... . . . . . . . . . . . . . . . . . . . . . . . . . . . . . . . . . . . . . . . . . . . . . . . . . . . . . . . . . . . . . . . . . . . . . . . . . . . . . . . . . . . . . . . . . . . . . . . . . . . . . . . . . . . . . . . . . . . . . . . . . . . . . . . . . . 1
How to use the lens .... . . . . . . . . . . . . . . . . . . . . . . . . . . . . . . . . . . . . . . . . . . . . . . . . . . . . . . . . . . . . . . . . . . . . . . . . . . . . . . . . . . . . . . . . . . . . . . . . . . . . . . . . . . . . . . . 1Workload context checklist ... . . . . . . . . . . . . . . . . . . . . . . . . . . . . . . . . . . . . . . . . . . . . . . . . . . . . . . . . . . . . . . . . . . . . . . . . . . . . . . . . . . . . . . . . . . . . . . . . . . . . . . . . . . . . . . . 2Well-Architected design principles ... . . . . . . . . . . . . . . . . . . . . . . . . . . . . . . . . . . . . . . . . . . . . . . . . . . . . . . . . . . . . . . . . . . . . . . . . . . . . . . . . . . . . . . . . . . . . . . . . . . . . . 3
Operational excellence .... . . . . . . . . . . . . . . . . . . . . . . . . . . . . . . . . . . . . . . . . . . . . . . . . . . . . . . . . . . . . . . . . . . . . . . . . . . . . . . . . . . . . . . . . . . . . . . . . . . . . . . . . . . . . 31 - Monitor the health of the analytics pipelines .... . . . . . . . . . . . . . . . . . . . . . . . . . . . . . . . . . . . . . . . . . . . . . . . . . . . . . . . . . . . . . . . . 32 - Modernize deployment of the analytics jobs and applications .... . . . . . . . . . . . . . . . . . . . . . . . . . . . . . . . . . . . . . . . . . 53 – Build financial accountability models for data and workload usage .... . . . . . . . . . . . . . . . . . . . . . . . . . . . . . . . . . . 7
Security ... . . . . . . . . . . . . . . . . . . . . . . . . . . . . . . . . . . . . . . . . . . . . . . . . . . . . . . . . . . . . . . . . . . . . . . . . . . . . . . . . . . . . . . . . . . . . . . . . . . . . . . . . . . . . . . . . . . . . . . . . . . . . . . . . . 94 - Classify and protect data .... . . . . . . . . . . . . . . . . . . . . . . . . . . . . . . . . . . . . . . . . . . . . . . . . . . . . . . . . . . . . . . . . . . . . . . . . . . . . . . . . . . . . . . . . . . . 95 - Control the data access .... . . . . . . . . . . . . . . . . . . . . . . . . . . . . . . . . . . . . . . . . . . . . . . . . . . . . . . . . . . . . . . . . . . . . . . . . . . . . . . . . . . . . . . . . . . . . 136 – Control the access to workload infrastructure .... . . . . . . . . . . . . . . . . . . . . . . . . . . . . . . . . . . . . . . . . . . . . . . . . . . . . . . . . . . . . . 17
Reliability ... . . . . . . . . . . . . . . . . . . . . . . . . . . . . . . . . . . . . . . . . . . . . . . . . . . . . . . . . . . . . . . . . . . . . . . . . . . . . . . . . . . . . . . . . . . . . . . . . . . . . . . . . . . . . . . . . . . . . . . . . . . . . . 197 - Design resiliency for analytics workload .... . . . . . . . . . . . . . . . . . . . . . . . . . . . . . . . . . . . . . . . . . . . . . . . . . . . . . . . . . . . . . . . . . . . . . 198 - Govern data and metadata changes .... . . . . . . . . . . . . . . . . . . . . . . . . . . . . . . . . . . . . . . . . . . . . . . . . . . . . . . . . . . . . . . . . . . . . . . . . . . 23
Performance efficiency .... . . . . . . . . . . . . . . . . . . . . . . . . . . . . . . . . . . . . . . . . . . . . . . . . . . . . . . . . . . . . . . . . . . . . . . . . . . . . . . . . . . . . . . . . . . . . . . . . . . . . . . . . . . 249 - Choose the best-performing compute solution .... . . . . . . . . . . . . . . . . . . . . . . . . . . . . . . . . . . . . . . . . . . . . . . . . . . . . . . . . . . . . 2410 - Choose the best-performing storage solution .... . . . . . . . . . . . . . . . . . . . . . . . . . . . . . . . . . . . . . . . . . . . . . . . . . . . . . . . . . . . . 2711 - Choose the best-performing file format and partitioning .... . . . . . . . . . . . . . . . . . . . . . . . . . . . . . . . . . . . . . . . . . . . . 28
Cost optimization .... . . . . . . . . . . . . . . . . . . . . . . . . . . . . . . . . . . . . . . . . . . . . . . . . . . . . . . . . . . . . . . . . . . . . . . . . . . . . . . . . . . . . . . . . . . . . . . . . . . . . . . . . . . . . . . . . . 3012 - Choose cost-effective compute and storage solutions based on workload usage patterns .... . . 3113 - Manage cost over time .... . . . . . . . . . . . . . . . . . . . . . . . . . . . . . . . . . . . . . . . . . . . . . . . . . . . . . . . . . . . . . . . . . . . . . . . . . . . . . . . . . . . . . . . . . . . 3314 - Use optimal pricing models based on infrastructure usage patterns .... . . . . . . . . . . . . . . . . . . . . . . . . . . . . . . 36
Scenarios .... . . . . . . . . . . . . . . . . . . . . . . . . . . . . . . . . . . . . . . . . . . . . . . . . . . . . . . . . . . . . . . . . . . . . . . . . . . . . . . . . . . . . . . . . . . . . . . . . . . . . . . . . . . . . . . . . . . . . . . . . . . . . . . . . . . . . . 38Modern data architecture (formerly Lake House) ... . . . . . . . . . . . . . . . . . . . . . . . . . . . . . . . . . . . . . . . . . . . . . . . . . . . . . . . . . . . . . . . . . . . . . . . 38
Characteristics ... . . . . . . . . . . . . . . . . . . . . . . . . . . . . . . . . . . . . . . . . . . . . . . . . . . . . . . . . . . . . . . . . . . . . . . . . . . . . . . . . . . . . . . . . . . . . . . . . . . . . . . . . . . . . . . . 39Reference architecture .... . . . . . . . . . . . . . . . . . . . . . . . . . . . . . . . . . . . . . . . . . . . . . . . . . . . . . . . . . . . . . . . . . . . . . . . . . . . . . . . . . . . . . . . . . . . . . . . . . . 39Configuration notes .... . . . . . . . . . . . . . . . . . . . . . . . . . . . . . . . . . . . . . . . . . . . . . . . . . . . . . . . . . . . . . . . . . . . . . . . . . . . . . . . . . . . . . . . . . . . . . . . . . . . . . . 40
Data mesh .... . . . . . . . . . . . . . . . . . . . . . . . . . . . . . . . . . . . . . . . . . . . . . . . . . . . . . . . . . . . . . . . . . . . . . . . . . . . . . . . . . . . . . . . . . . . . . . . . . . . . . . . . . . . . . . . . . . . . . . . . . . . 41Characteristics ... . . . . . . . . . . . . . . . . . . . . . . . . . . . . . . . . . . . . . . . . . . . . . . . . . . . . . . . . . . . . . . . . . . . . . . . . . . . . . . . . . . . . . . . . . . . . . . . . . . . . . . . . . . . . . . . 41Reference architecture .... . . . . . . . . . . . . . . . . . . . . . . . . . . . . . . . . . . . . . . . . . . . . . . . . . . . . . . . . . . . . . . . . . . . . . . . . . . . . . . . . . . . . . . . . . . . . . . . . . . 43
Batch data processing .... . . . . . . . . . . . . . . . . . . . . . . . . . . . . . . . . . . . . . . . . . . . . . . . . . . . . . . . . . . . . . . . . . . . . . . . . . . . . . . . . . . . . . . . . . . . . . . . . . . . . . . . . . . . 48Characteristics ... . . . . . . . . . . . . . . . . . . . . . . . . . . . . . . . . . . . . . . . . . . . . . . . . . . . . . . . . . . . . . . . . . . . . . . . . . . . . . . . . . . . . . . . . . . . . . . . . . . . . . . . . . . . . . . . 49Reference architecture .... . . . . . . . . . . . . . . . . . . . . . . . . . . . . . . . . . . . . . . . . . . . . . . . . . . . . . . . . . . . . . . . . . . . . . . . . . . . . . . . . . . . . . . . . . . . . . . . . . . 49Configuration notes .... . . . . . . . . . . . . . . . . . . . . . . . . . . . . . . . . . . . . . . . . . . . . . . . . . . . . . . . . . . . . . . . . . . . . . . . . . . . . . . . . . . . . . . . . . . . . . . . . . . . . . . 51
Streaming ingest and stream processing .... . . . . . . . . . . . . . . . . . . . . . . . . . . . . . . . . . . . . . . . . . . . . . . . . . . . . . . . . . . . . . . . . . . . . . . . . . . . . . . . . . 52Characteristics ... . . . . . . . . . . . . . . . . . . . . . . . . . . . . . . . . . . . . . . . . . . . . . . . . . . . . . . . . . . . . . . . . . . . . . . . . . . . . . . . . . . . . . . . . . . . . . . . . . . . . . . . . . . . . . . . 52Reference architecture .... . . . . . . . . . . . . . . . . . . . . . . . . . . . . . . . . . . . . . . . . . . . . . . . . . . . . . . . . . . . . . . . . . . . . . . . . . . . . . . . . . . . . . . . . . . . . . . . . . . 53Configuration notes .... . . . . . . . . . . . . . . . . . . . . . . . . . . . . . . . . . . . . . . . . . . . . . . . . . . . . . . . . . . . . . . . . . . . . . . . . . . . . . . . . . . . . . . . . . . . . . . . . . . . . . . 55
Operational analytics ... . . . . . . . . . . . . . . . . . . . . . . . . . . . . . . . . . . . . . . . . . . . . . . . . . . . . . . . . . . . . . . . . . . . . . . . . . . . . . . . . . . . . . . . . . . . . . . . . . . . . . . . . . . . . . 57Characteristics ... . . . . . . . . . . . . . . . . . . . . . . . . . . . . . . . . . . . . . . . . . . . . . . . . . . . . . . . . . . . . . . . . . . . . . . . . . . . . . . . . . . . . . . . . . . . . . . . . . . . . . . . . . . . . . . . 57Reference architecture .... . . . . . . . . . . . . . . . . . . . . . . . . . . . . . . . . . . . . . . . . . . . . . . . . . . . . . . . . . . . . . . . . . . . . . . . . . . . . . . . . . . . . . . . . . . . . . . . . . . 58Configuration notes .... . . . . . . . . . . . . . . . . . . . . . . . . . . . . . . . . . . . . . . . . . . . . . . . . . . . . . . . . . . . . . . . . . . . . . . . . . . . . . . . . . . . . . . . . . . . . . . . . . . . . . . 59
Data visualization .... . . . . . . . . . . . . . . . . . . . . . . . . . . . . . . . . . . . . . . . . . . . . . . . . . . . . . . . . . . . . . . . . . . . . . . . . . . . . . . . . . . . . . . . . . . . . . . . . . . . . . . . . . . . . . . . . . 59Characteristics ... . . . . . . . . . . . . . . . . . . . . . . . . . . . . . . . . . . . . . . . . . . . . . . . . . . . . . . . . . . . . . . . . . . . . . . . . . . . . . . . . . . . . . . . . . . . . . . . . . . . . . . . . . . . . . . . 59Reference architecture .... . . . . . . . . . . . . . . . . . . . . . . . . . . . . . . . . . . . . . . . . . . . . . . . . . . . . . . . . . . . . . . . . . . . . . . . . . . . . . . . . . . . . . . . . . . . . . . . . . . 60Configuration notes .... . . . . . . . . . . . . . . . . . . . . . . . . . . . . . . . . . . . . . . . . . . . . . . . . . . . . . . . . . . . . . . . . . . . . . . . . . . . . . . . . . . . . . . . . . . . . . . . . . . . . . . 60
Conclusion .... . . . . . . . . . . . . . . . . . . . . . . . . . . . . . . . . . . . . . . . . . . . . . . . . . . . . . . . . . . . . . . . . . . . . . . . . . . . . . . . . . . . . . . . . . . . . . . . . . . . . . . . . . . . . . . . . . . . . . . . . . . . . . . . . . . . 62Contributors ... . . . . . . . . . . . . . . . . . . . . . . . . . . . . . . . . . . . . . . . . . . . . . . . . . . . . . . . . . . . . . . . . . . . . . . . . . . . . . . . . . . . . . . . . . . . . . . . . . . . . . . . . . . . . . . . . . . . . . . . . . . . . . . . . . 63Document history .... . . . . . . . . . . . . . . . . . . . . . . . . . . . . . . . . . . . . . . . . . . . . . . . . . . . . . . . . . . . . . . . . . . . . . . . . . . . . . . . . . . . . . . . . . . . . . . . . . . . . . . . . . . . . . . . . . . . . . . . . . 64Design principles by pillar ... . . . . . . . . . . . . . . . . . . . . . . . . . . . . . . . . . . . . . . . . . . . . . . . . . . . . . . . . . . . . . . . . . . . . . . . . . . . . . . . . . . . . . . . . . . . . . . . . . . . . . . . . . . . . . . 65
Operational excellence .... . . . . . . . . . . . . . . . . . . . . . . . . . . . . . . . . . . . . . . . . . . . . . . . . . . . . . . . . . . . . . . . . . . . . . . . . . . . . . . . . . . . . . . . . . . . . . . . . . . . . . . . . . . 65Security ... . . . . . . . . . . . . . . . . . . . . . . . . . . . . . . . . . . . . . . . . . . . . . . . . . . . . . . . . . . . . . . . . . . . . . . . . . . . . . . . . . . . . . . . . . . . . . . . . . . . . . . . . . . . . . . . . . . . . . . . . . . . . . . . . 65Reliability ... . . . . . . . . . . . . . . . . . . . . . . . . . . . . . . . . . . . . . . . . . . . . . . . . . . . . . . . . . . . . . . . . . . . . . . . . . . . . . . . . . . . . . . . . . . . . . . . . . . . . . . . . . . . . . . . . . . . . . . . . . . . . . 65
iii

Data Analytics Lens AWS Well-Architected Framework
Performance efficiency .... . . . . . . . . . . . . . . . . . . . . . . . . . . . . . . . . . . . . . . . . . . . . . . . . . . . . . . . . . . . . . . . . . . . . . . . . . . . . . . . . . . . . . . . . . . . . . . . . . . . . . . . . . . 65Cost optimization .... . . . . . . . . . . . . . . . . . . . . . . . . . . . . . . . . . . . . . . . . . . . . . . . . . . . . . . . . . . . . . . . . . . . . . . . . . . . . . . . . . . . . . . . . . . . . . . . . . . . . . . . . . . . . . . . . . 65
Notices .... . . . . . . . . . . . . . . . . . . . . . . . . . . . . . . . . . . . . . . . . . . . . . . . . . . . . . . . . . . . . . . . . . . . . . . . . . . . . . . . . . . . . . . . . . . . . . . . . . . . . . . . . . . . . . . . . . . . . . . . . . . . . . . . . . . . . . . . . 66AWS glossary .... . . . . . . . . . . . . . . . . . . . . . . . . . . . . . . . . . . . . . . . . . . . . . . . . . . . . . . . . . . . . . . . . . . . . . . . . . . . . . . . . . . . . . . . . . . . . . . . . . . . . . . . . . . . . . . . . . . . . . . . . . . . . . . . 67
iv
Data Analytics Lens AWS Well-Architected FrameworkHow to use the lens
IntroductionPublication date: October 29, 2021 (Document history (p. 64))
This document describes the AWS Well-Architected Data Analytics Lens, a collection of customer-proven best practices for designing well-architected analytics workloads. The Data Analytics Lenscontains insights that AWS has gathered from real-world case studies, and helps you learn the key designelements of well-architected analytics workloads along with recommendations for improvement. Thedocument is intended for IT architects, developers, and team members who build and operate analyticssystems.
How to use the lensThe AWS Well-Architected Framework helps you understand the pros and cons of decisions you makewhile building systems on AWS.
By using the framework, you learn architectural best practices for designing and operating reliable,secure, efficient, and cost-effective systems in the cloud. It provides a way for you to consistentlymeasure your architectures against best practices and identify areas for improvement. We believe thathaving well-architected systems greatly increases the likelihood of business success.
In this “Lens” we focus on how to design, deploy, and architect your analytics application workloads inthe AWS Cloud. For brevity, we have only covered details from the Well-Architected Framework that arespecific to analytics workloads. You should still consider best practices and questions that have not beenincluded in this document when designing your architecture. We recommend that you read the AWSWell-Architected Framework.
This document is intended for those in technology roles, such as chief technology officers (CTOs),architects, developers, and operations team members. After reading this document, you will understandAWS best practices and strategies to use when designing architectures for analytics applications andenvironment.
1
Data Analytics Lens AWS Well-Architected Framework
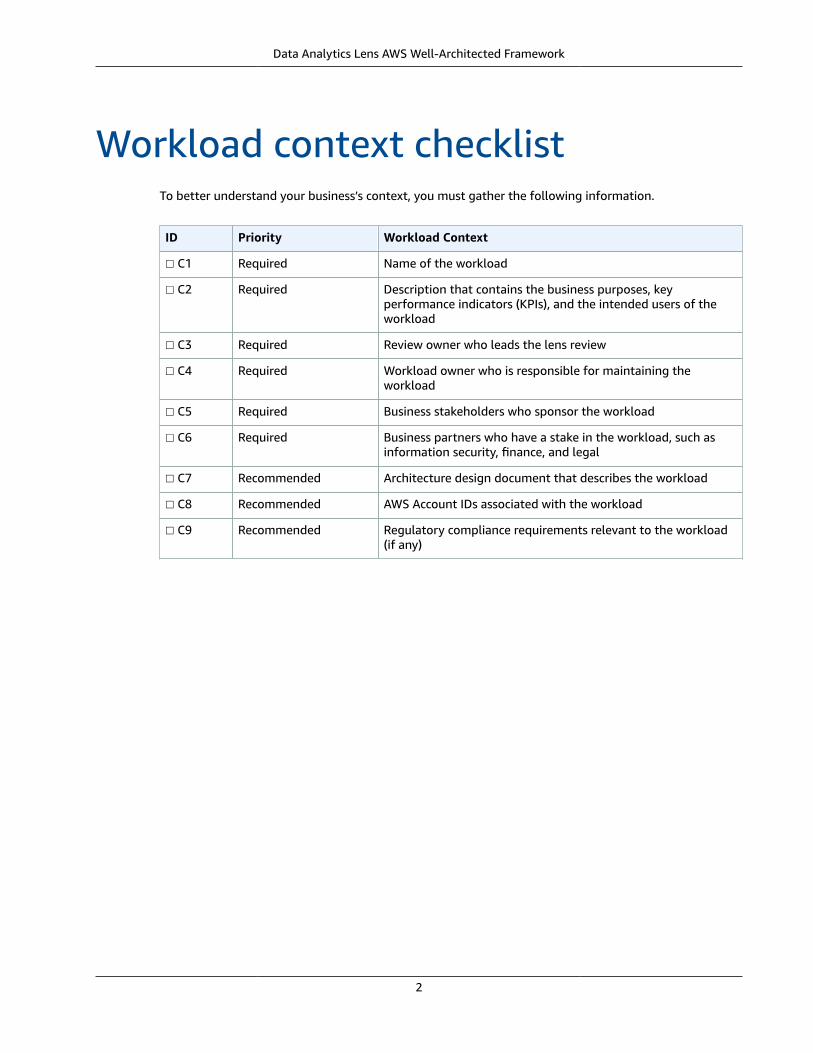
Workload context checklistTo better understand your business’s context, you must gather the following information.
ID Priority Workload Context
☐ C1 Required Name of the workload
☐ C2 Required Description that contains the business purposes, keyperformance indicators (KPIs), and the intended users of theworkload
☐ C3 Required Review owner who leads the lens review
☐ C4 Required Workload owner who is responsible for maintaining theworkload
☐ C5 Required Business stakeholders who sponsor the workload
☐ C6 Required Business partners who have a stake in the workload, such asinformation security, finance, and legal
☐ C7 Recommended Architecture design document that describes the workload
☐ C8 Recommended AWS Account IDs associated with the workload
☐ C9 Recommended Regulatory compliance requirements relevant to the workload(if any)
2
Data Analytics Lens AWS Well-Architected FrameworkOperational excellence
Well-Architected design principlesThis section describes the design principles, best practices, and improvement suggestions that arerelevant when designing your workload architecture. For brevity, only questions that are specificto analytics workloads are included in the Analytics Lens. We recommend you also read and applythe guidance found in each Well-Architected pillar, which includes foundational best practices foroperational excellence, security, performance efficiency, reliability, and cost optimization that arerelevant to all workloads.
Pillars
• Operational excellence (p. 3)
• Security (p. 9)
• Reliability (p. 19)
• Performance efficiency (p. 24)
• Cost optimization (p. 30)
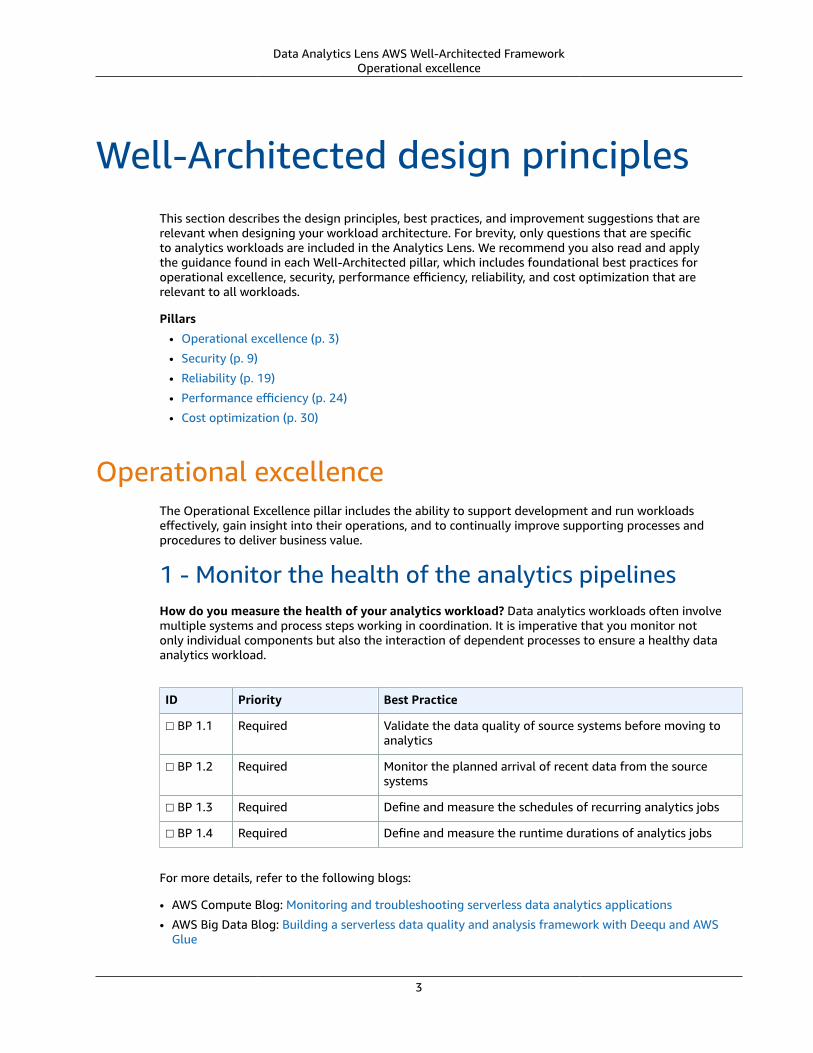
Operational excellenceThe Operational Excellence pillar includes the ability to support development and run workloadseffectively, gain insight into their operations, and to continually improve supporting processes andprocedures to deliver business value.
1 - Monitor the health of the analytics pipelinesHow do you measure the health of your analytics workload? Data analytics workloads often involvemultiple systems and process steps working in coordination. It is imperative that you monitor notonly individual components but also the interaction of dependent processes to ensure a healthy dataanalytics workload.
ID Priority Best Practice
☐ BP 1.1 Required Validate the data quality of source systems before moving toanalytics
☐ BP 1.2 Required Monitor the planned arrival of recent data from the sourcesystems
☐ BP 1.3 Required Define and measure the schedules of recurring analytics jobs
☐ BP 1.4 Required Define and measure the runtime durations of analytics jobs
For more details, refer to the following blogs:
• AWS Compute Blog: Monitoring and troubleshooting serverless data analytics applications
• AWS Big Data Blog: Building a serverless data quality and analysis framework with Deequ and AWSGlue
3
Data Analytics Lens AWS Well-Architected Framework1 - Monitor the health of the analytics pipelines
Best Practice 1.1 - Validate the data quality of source systemsbefore moving to analyticsData quality can have a drastic impact on the success or failure of data analytics output. To avoidcommitting significant resources to processing potentially poor-quality data, you should validate thesource data quality before starting the analytics work. Dataset validation can often be done quickly on asubset or the latest data range to look for obvious data defects, such as missing values, anomalous data,or wrong data types, that would fail the analytics job completion, or lead to completion of the job withinaccurate results.
Suggestion 1.1.1 - Implement data validation mechanisms
Validation mechanisms should check for the expected number of rows, for null values, and for wrongdata types before further processing an analytics dataset.
Suggestion 1.1.2 - Notify stakeholders and use business logic to determine how to remediate datathat is not valid
Determine how to address data that is not valid. In some cases, it’s more efficient to impute missingvalues, but in other cases it’s more efficient to block processing until the data quality issue can beaddressed.
Best Practice 1.2 - Monitor the planned arrival of recent datafrom the source systemsUnder normal operations, data analytics workloads may produce outputs periodically to meet businessdeadlines. A single component of a data processing pipeline might be healthy because it is running andavailable for work, but if no data arrives for processing, the business deadline could be missed.
Suggestion 1.2.1 - Monitor for the arrival or availability of new data, and notify if the expectedduration between data arrival is too long
When event-driven systems rely on incoming data to initiate an analytics processing job, the job will notbegin if new data does not arrive. Implement systems to track the time between new data alerts, andalarm if the analytics job does not start within the expected time window.
Best Practice 1.3 - Define and measure the schedules ofrecurring analytics jobsRecurring analytics jobs that run on a schedule (instead of being event-driven) will have a defined starttime. Emit metrics indicating when the job should have started and notify if the job has not startedwithin a predefined amount of time.
Suggestion 1.3.1 - Monitor the start time for recurring analytics processing jobs compared to theexpected start time
When the start of the job has exceeded a defined time window past the expected start time, emit analarm.
Best Practice 1.4 - Define and measure the runtime durations ofanalytics jobsConfigure data analytics jobs to emit metrics indicating when processing work has started andcompleted. Use these metrics to calculate runtime durations. Notify if a job has started but notcompleted within the expected threshold.
4
Data Analytics Lens AWS Well-Architected Framework2 - Modernize deployment of the
analytics jobs and applications
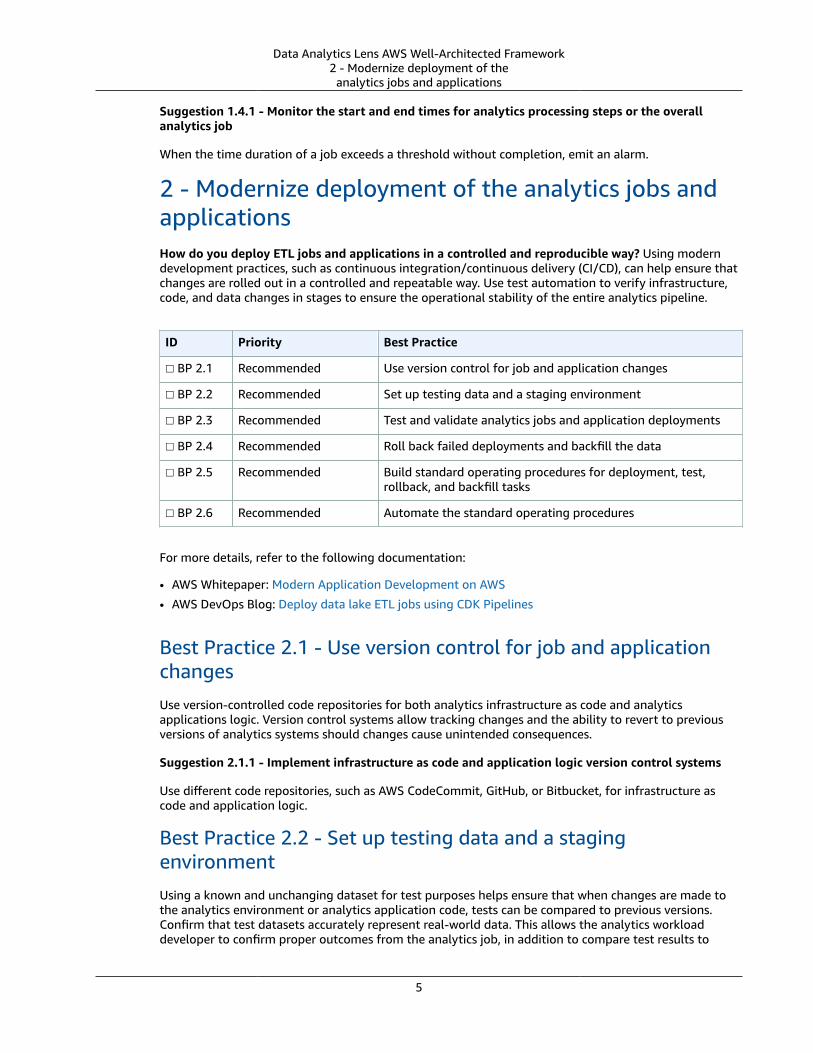
Suggestion 1.4.1 - Monitor the start and end times for analytics processing steps or the overallanalytics job
When the time duration of a job exceeds a threshold without completion, emit an alarm.
2 - Modernize deployment of the analytics jobs andapplicationsHow do you deploy ETL jobs and applications in a controlled and reproducible way? Using moderndevelopment practices, such as continuous integration/continuous delivery (CI/CD), can help ensure thatchanges are rolled out in a controlled and repeatable way. Use test automation to verify infrastructure,code, and data changes in stages to ensure the operational stability of the entire analytics pipeline.
ID Priority Best Practice
☐ BP 2.1 Recommended Use version control for job and application changes
☐ BP 2.2 Recommended Set up testing data and a staging environment
☐ BP 2.3 Recommended Test and validate analytics jobs and application deployments
☐ BP 2.4 Recommended Roll back failed deployments and backfill the data
☐ BP 2.5 Recommended Build standard operating procedures for deployment, test,rollback, and backfill tasks
☐ BP 2.6 Recommended Automate the standard operating procedures
For more details, refer to the following documentation:
• AWS Whitepaper: Modern Application Development on AWS
• AWS DevOps Blog: Deploy data lake ETL jobs using CDK Pipelines
Best Practice 2.1 - Use version control for job and applicationchangesUse version-controlled code repositories for both analytics infrastructure as code and analyticsapplications logic. Version control systems allow tracking changes and the ability to revert to previousversions of analytics systems should changes cause unintended consequences.
Suggestion 2.1.1 - Implement infrastructure as code and application logic version control systems
Use different code repositories, such as AWS CodeCommit, GitHub, or Bitbucket, for infrastructure ascode and application logic.
Best Practice 2.2 - Set up testing data and a stagingenvironmentUsing a known and unchanging dataset for test purposes helps ensure that when changes are made tothe analytics environment or analytics application code, tests can be compared to previous versions.Confirm that test datasets accurately represent real-world data. This allows the analytics workloaddeveloper to confirm proper outcomes from the analytics job, in addition to compare test results to
5
Data Analytics Lens AWS Well-Architected Framework2 - Modernize deployment of the
analytics jobs and applications
previous versions. It is very difficult to compare test job runs when the underlying dataset changesbetween tests. Use staging environments for tests so that you do not impact production.
Suggestion 2.2.1 - Use a curated dataset to test application logic and performance improvements,such that code changes can be comparatively analyzed for the desired outcomes
Analytics jobs under development should use the same curated, or known-good, dataset to compareresults between tests of different versions of your code. Using the same dataset for all tests allowsdemonstrating improvement over time, as well as making it easier to recognize regressions in your code.
Suggestion 2.2.2 - Use a random sample of recent data to validate application edge cases andregressions have not been introduced
Use a statistically valid random sample of recent data to confirm that the analytics solution continuesto perform under real-world conditions. Using a sample of recent data also allows you to more easilyrecognize if your dataset characteristics have shifted or if anomalous data has been recently introducedto your data.
Suggestion 2.2.3 - Establish separate staging environments to fully test changes before going live
Use separate environments, such as development, test, and production, to allow riskier featuredevelopment to be introduced without disrupting production systems. Test changes for accuracy andperformance before a business-critical deployment.
Best Practice 2.3 - Test and validate analytics jobs andapplication deploymentsBefore making changes in production environments, use standard and repeatable automated tests tovalidate performance and accuracy of results.
Suggestion 2.3.1 - Automate the deployment and testing of changes to infrastructure andapplications
Use services, such as AWS CodePipeline and AWS Step Functions, to programmatically test changes andvalidate performance results.
Best Practice 2.4 - Roll back failed deployments and backfill thedataDesign your deployment methods to catch failed deployments and automatically roll back to previousversions. If necessary, track downstream data changes that might have occurred from the faileddeployment and backfill the data to ensure data quality.
Suggestion 2.4.1 - Use infrastructure as code and version control systems so that a failed deploymentcan be rolled back to a previous good state
Follow software development best practices when building analytics systems. For example, deployresources using code templates, such as AWS CloudFormation or Hashicorp Terraform, so that alldeployments occur exactly as intended. Use version control systems (for example, code repositories suchas AWS CodeCommit or GitHub) to hold current and previous versions of your code templates so that if anew change results in unwanted outcomes, you can easily roll back to the previous code template.
Best Practice 2.5 - Build standard operating procedures fordeployment, test, rollback, and backfill tasksStandard operating procedures for deployment, test, rollback, and data backfill tasks allow fasterdeployments, reduce the number of errors that reach production, and make remediation easier if
6
Data Analytics Lens AWS Well-Architected Framework3 – Build financial accountability
models for data and workload usage
a deployment results in unintended consequences. The end result will be higher-quality analyticsoutcomes for the business.
Suggestion 2.5.1 - Document and use standard operating procedures for implementing changes inyour analytics workload
Standard operating procedures will allow teams to confidently make changes, thus avoiding repeatablemistakes and reduce the chance of human error.
Best Practice 2.6 - Automate the standard operating proceduresAutomating standard operating procedures for deployment, test, rollback, and data backfill tasks allowfaster deployments, less chance for errors to reach production, and easier remediation if deploymentsresult in unintended consequences. The end-result will be a faster time-to-value for the business and lessfrequent errors in operation.
Suggestion 2.6.1 - Use automation to perform changes to underlying analytics infrastructure orapplication logic
Automated tests can determine when changes have unintended consequences and can roll back withouthuman intervention.
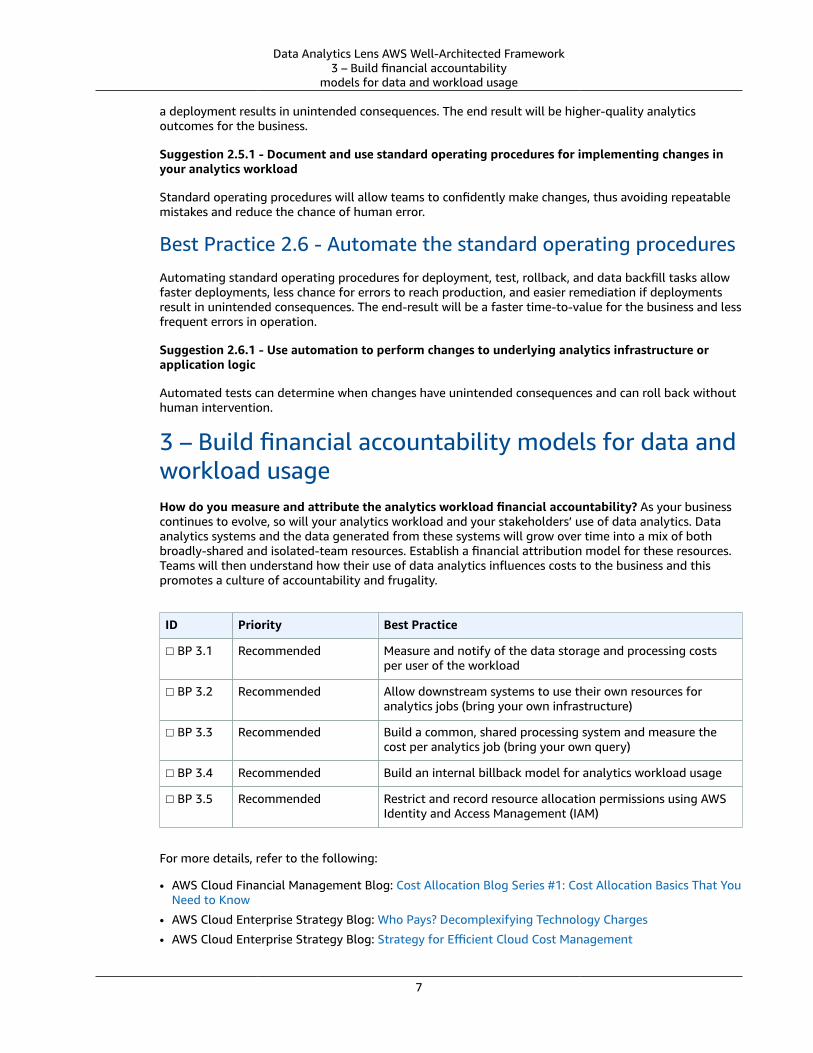
3 – Build financial accountability models for data andworkload usageHow do you measure and attribute the analytics workload financial accountability? As your businesscontinues to evolve, so will your analytics workload and your stakeholders’ use of data analytics. Dataanalytics systems and the data generated from these systems will grow over time into a mix of bothbroadly-shared and isolated-team resources. Establish a financial attribution model for these resources.Teams will then understand how their use of data analytics influences costs to the business and thispromotes a culture of accountability and frugality.
ID Priority Best Practice
☐ BP 3.1 Recommended Measure and notify of the data storage and processing costsper user of the workload
☐ BP 3.2 Recommended Allow downstream systems to use their own resources foranalytics jobs (bring your own infrastructure)
☐ BP 3.3 Recommended Build a common, shared processing system and measure thecost per analytics job (bring your own query)
☐ BP 3.4 Recommended Build an internal billback model for analytics workload usage
☐ BP 3.5 Recommended Restrict and record resource allocation permissions using AWSIdentity and Access Management (IAM)
For more details, refer to the following:
• AWS Cloud Financial Management Blog: Cost Allocation Blog Series #1: Cost Allocation Basics That YouNeed to Know
• AWS Cloud Enterprise Strategy Blog: Who Pays? Decomplexifying Technology Charges
• AWS Cloud Enterprise Strategy Blog: Strategy for Efficient Cloud Cost Management
7
Data Analytics Lens AWS Well-Architected Framework3 – Build financial accountability
models for data and workload usage
• AWS Cloud Financial Management Blog: Trends Dashboard with AWS Cost and Usage Reports, AmazonAthena and Amazon QuickSight
• AWS Well-Architected Labs: Cost Optimization
Best Practice 3.1 - Measure and notify of the data storage andprocessing costs per user of the workloadData analytics systems have both recurring stable costs and per-use costs, for example, a weeklyreporting job with relatively static data storage fees in addition to the periodic transient computation’sruntime duration fee. Establish a financial attribution mechanism so that when analytics systems arerun, data storage and usage data is captured such that a user (business unit, team, or individual) can benotified of their consumption at regular intervals.
Suggestion 3.1.1 - Use tagging or other attribution methods to identify data storage ownership
Aggregate costs by owner and update your financial tools with storage costs.
Best Practice 3.2 - Allow downstream systems to use their ownresources for analytics jobs (bring your own infrastructure)In some cases, teams will establish their own data analytics resources that depend on data feeds fromupstream systems. Determine when teams will benefit from building their own infrastructure, balancingrequired agility, team skillset, and provisioning the right resources for the job. In this case, individualteams will be responsible for the costs associated with the resources they control.
Suggestion 3.2.1 - Perform regular reviews of analytics operations to determine if the business willbenefit from teams managing their own infrastructure
In some cases, teams will want to maintain and manage their own infrastructure. Individual teamownership allows greater flexibility and agility when making system design choices with fewerdependencies on other users. Furthermore, individual team ownership provides clear cost visibility to theteam that owns it.
Suggestion 3.2.2 - Use infrastructure as code and governance tools, such as AWS Service Catalog, toallow teams to self-provision infrastructure within approved constraints
When teams can deploy their own infrastructure, often businesses want to apply governance andguardrails to maintain adherence to corporate policies. AWS Service Catalog allows teams to deploy setsof resources with a defined selection of parameters, thus ensuring only the resource types allowed by thegovernance team can be deployed.
Best Practice 3.3 - Build a common, shared processing systemand measure the cost per analytics job (bring your own query)In some cases, it will be more efficient to have a shared processing system where individual teamscan send requests for data analytics. In this case, measure the number of requests for processing byindividual teams, and the datasets generated by those requests, so that each teams’ consumption can beattributed for the shared resource.
Suggestion 3.3.1 - Perform regular reviews of analytics operations to determine if the business willbenefit from shared, centralized analytics infrastructure
In some cases, a centralized team will maintain and manage infrastructure for the benefit of multiplegroups to share. Shared infrastructure allows greater utilization of the resources deployed andconcentrated skillsets for infrastructure management.
8
Data Analytics Lens AWS Well-Architected FrameworkSecurity
Suggestion 3.3.2 - Implement a per-request tracking mechanism which allows utilization attributionto the different teams
With a shared resource, some businesses still want to maintain cost visibility to the teams using thoseresources. Implementing a per-request tracking mechanism will allow measuring the associated resourcebilling metrics during the job and attribute those portions to the requester. Those metrics and theassociated users will be aggregated into a cost visibility report.
Best Practice 3.4 - Build an internal billback model for analyticsworkload usage
After establishing the best practices of measuring and attributing teams’ use of individual and sharedresources, build an internal billback model to give those teams’ financial responsibility for their use ofdata analytics.
Suggestion 3.4.1 - Implement a cost-visibility and internal billback method to aggregate the team’sutilization of analytics resources
Notify teams of their analytics usage costs periodically, or build dashboards that allow teams to gainvisibility into how their work impacts costs to the business in a self-service way.
Best Practice 3.5 - Restrict and record resource allocationpermissions using AWS Identity and Access Management (IAM)
Create specific IAM roles to provide authorization to provision expensive resources. Remove authorizationfor individuals to provision those resources. Use the record of the identities assuming those roles toprovision expensive resources as part of your cost attribution model.
Suggestion 3.5.1 - Create a cost governance framework that uses specialized IAM roles, rather thanindividual IAM users, to provision costly infrastructure
Restrict the authorization to launch costly resources to specific IAM roles created for that purpose. Whena user assumes that role, log the actions and the user who has assumed that role.
Suggestion 3.5.2 - Use IAM logs to attribute users assuming these specialized IAM roles for costattribution
As part of your cost-allocation governance, automatically process the IAM logs so that cost allocation isproperly attributed.
SecurityThe security pillar encompasses the ability to protect data, systems, and assets to take advantage ofcloud technologies to improve your security.
4 - Classify and protect dataHow do you classify and protect data in analytics workload? Because analytics workloads ingest datafrom source systems, the owner of the source data should define the data classifications. As the analyticsworkload owner, you should honor the source data classifications and implement the correspondingdata protection policies of your organization. Share the data classifications with the downstream dataconsumers to permit them to honor the data classifications in their organizations and policies as well.
9
Data Analytics Lens AWS Well-Architected Framework4 - Classify and protect data
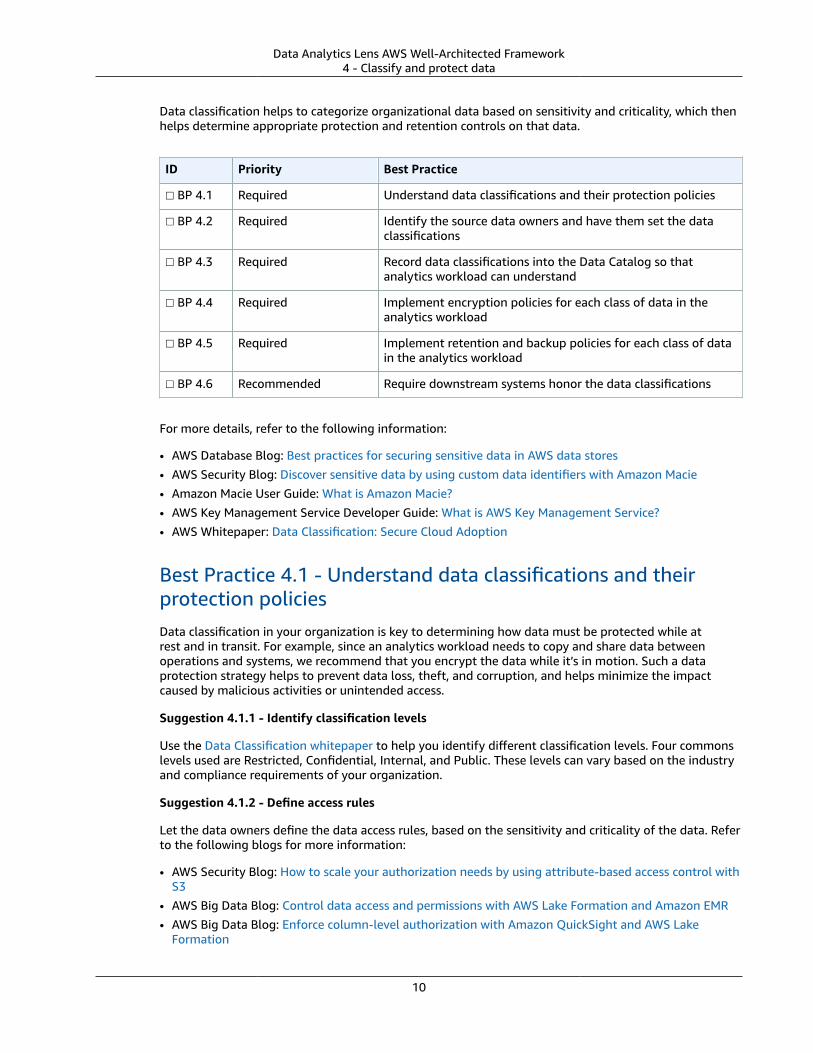
Data classification helps to categorize organizational data based on sensitivity and criticality, which thenhelps determine appropriate protection and retention controls on that data.
ID Priority Best Practice
☐ BP 4.1 Required Understand data classifications and their protection policies
☐ BP 4.2 Required Identify the source data owners and have them set the dataclassifications
☐ BP 4.3 Required Record data classifications into the Data Catalog so thatanalytics workload can understand
☐ BP 4.4 Required Implement encryption policies for each class of data in theanalytics workload
☐ BP 4.5 Required Implement retention and backup policies for each class of datain the analytics workload
☐ BP 4.6 Recommended Require downstream systems honor the data classifications
For more details, refer to the following information:
• AWS Database Blog: Best practices for securing sensitive data in AWS data stores• AWS Security Blog: Discover sensitive data by using custom data identifiers with Amazon Macie• Amazon Macie User Guide: What is Amazon Macie?• AWS Key Management Service Developer Guide: What is AWS Key Management Service?• AWS Whitepaper: Data Classification: Secure Cloud Adoption
Best Practice 4.1 - Understand data classifications and theirprotection policiesData classification in your organization is key to determining how data must be protected while atrest and in transit. For example, since an analytics workload needs to copy and share data betweenoperations and systems, we recommend that you encrypt the data while it’s in motion. Such a dataprotection strategy helps to prevent data loss, theft, and corruption, and helps minimize the impactcaused by malicious activities or unintended access.
Suggestion 4.1.1 - Identify classification levels
Use the Data Classification whitepaper to help you identify different classification levels. Four commonslevels used are Restricted, Confidential, Internal, and Public. These levels can vary based on the industryand compliance requirements of your organization.
Suggestion 4.1.2 - Define access rules
Let the data owners define the data access rules, based on the sensitivity and criticality of the data. Referto the following blogs for more information:
• AWS Security Blog: How to scale your authorization needs by using attribute-based access control withS3
• AWS Big Data Blog: Control data access and permissions with AWS Lake Formation and Amazon EMR• AWS Big Data Blog: Enforce column-level authorization with Amazon QuickSight and AWS Lake
Formation
10
Data Analytics Lens AWS Well-Architected Framework4 - Classify and protect data
Suggestion 4.1.3 - Identify security zone models to isolate data based on classification
Design the security zone models from AWS account levels down to AWS resource levels. For example,consider building AWS multi-account models to isolate different classes of data from AWS account level.Or, you can consider separating out dev/test resources from production ones from AWS account level orfrom resource levels. Refer to the following whitepapers for more information:
• AWS Whitepaper: An Overview of the AWS Cloud Adoption Framework
• AWS Whitepaper: Organizing Your AWS Environment Using Multiple Accounts
• AWS Whitepaper: Security Pillar - AWS Well-Architected Framework
Suggestion 4.1.4 - Identify sensitive information and define protection policies
Discover sensitive data by using custom data identifiers in Amazon Macie. Based on the sensitivityand criticality of the data, implement data protection policies to prevent unauthorized access. Dueto compliance requirements, data might be masked or deleted after processing in some cases. Werecommend that you apply data protection policies to data both at rest and in transit.
Best Practice 4.2 - Identify the source data owners and havethem set the data classificationsIdentify the owners of the source data, such as data lake administrators, business data owners, orIT storage administrators, and confirm what level of protection is required for the data within theanalytics workload. Data classifications follow the data as it moves throughout the analytics workflowto ensure that the data is protected, and to determine who or which systems are allowed to access thedata. By following the organization’s classification policies, the analytics workload should be able todifferentiate the data protection implementations for each class of data. Because each organizationhas different kinds of classification, the analytics workload should provide a strong logical boundarybetween processing data of different sensitivity levels.
Suggestion 4.2.1 - Assign owners per each dataset
A dataset, or a table in relational database technology, is a collection of data. A Data Catalog is acollection of metadata that helps centralize share, search, and manage permissions. The administrator ofthe analytics workload should know who are the owners for each dataset, and should assign the datasetownership into the Data Catalog.
Suggestion 4.2.2 - Define attestation scope and reviewer as additional scope for sensitive data
As the owner of the analytics workload, you should know the data owner for each dataset. For example,when a dataset has permission issues in the organization while it’s classified as highly sensitive, you mayneed to talk to the dataset owner and have him or her resolve the issues.
Suggestion 4.2.3 - Set expiry for data ownership and attestation, and have owners reconfirmperiodically
As businesses change, the data owners and the data classifications might change as well. Run campaignsperiodically, such as quarterly or yearly, to request each of the dataset owners to reconfirm that they arestill the right owners, and that the data classifications are still accurate.
Best Practice 4.3 - Record data classifications into the DataCatalog so that analytics workloads can understandAllow processes to update the Data Catalog so it can provide a reliable record of where the data islocated and its precise classification. To effectively protect the data, analytics systems should know the
11
Data Analytics Lens AWS Well-Architected Framework4 - Classify and protect data
classifications of the source data so that the systems can govern the data according to business needs.For example, if the business requires that confidential data be encrypted using team-owned privatekeys, such as from AWS Key Management Service (AWS KMS), the analytics workload should be able todetermine which data is classified as confidential by referencing its Data Catalog.
Suggestion 4.3.1 - Use tags to indicate the data classifications
Use tags to designate the classification of sensitive data in data stores. Tags allow discoverability of datasensitivity without directly exposing the underlying data. They also can be used to authorize access inattribute-based access control (ABAC) schemes.
• AWS Lake Formation Developer Guide: What Is AWS Lake Formation?
Suggestion 4.3.2 - Record lineage of data to track changes in the Data Catalog
Data lineage is a relation among data and the processing systems. For example, the data lineage tellswhere the source system of the data is, what data derived from it, and which downstream systemsare reading it. You should be able to discover, record, and visualize the data lineage from source todownstream systems. For example, you can use Apache Atlas on Amazon EMR to classify, track lineage,and discover metadata.
• AWS Big Data Blog: Metadata classification, lineage, and discovery using Apache Atlas on Amazon EMR
Best Practice 4.4 - Implement encryption policies for each classof data in the analytics workloadEnsure that the analytics workload encrypts the data in accordance with the classification policies. Forexample, if the business’s classification policy allows systems to encrypt public data using AWS managedkeys, the analytics systems should encrypt data in Amazon S3 using S3 server-side encryption. However,if the classification policy requires you to manage the encryption private keys as well as data, you shouldconsider using customer managed keys in AWS Key Management Service (AWS KMS) to manage yourown cryptographic keys for the storage encryption.
Suggestion 4.4.1 - Implement encryption policies for data at rest and in transit
Each analytics solution provides the encryption methods by its own way. Review the viable encryptionmethods of your solutions, and implement the encryptions. Refer to the encryption implementationguides, such as the following:
• AWS Key Management Service Best Practices Whitepaper: AWS-managed and Customer-managedCMKs
• AWS Big Data Blog: Best Practices for Securing Amazon EMR• AWS Big Data Blog: Encrypt Your Amazon Redshift Loads with Amazon S3 and AWS KMS• AWS Big Data Blog: Encrypt and Decrypt Amazon Kinesis Records Using AWS KMS• AWS Partner Network (APM) Blog: Data Tokenization with Amazon Redshift and Protegrity
Best Practice 4.5 - Implement data retention policies for eachclass of data in the analytics workloadThe business’s data classification policies determine how long the analytics workload should retainthe data and how long backups should be kept. These policies help ensure that every system followsthe data security rules and compliance requirements. The analytics workload should implementdata retention and backup policies according to these data classification policies. For example, if the
12
Data Analytics Lens AWS Well-Architected Framework5 - Control the data access
policy requires every system to retain the operational data for five years, the analytics systems shouldimplement rules to keep the in-scoped data for five years.
Suggestion 4.5.1 - Create backup requirements and policies based on data classifications
Data backup should be based on business requirements on tolerance in time related to data loss, such asrecovery point objective (RPO), recovery time objective (RTO), data classifications, and the complianceand audit requirements for specific datasets.
Suggestion 4.5.2 - Create data retention requirement policies based on the data classifications
Avoid creating blanket retention policies. Instead, policies should be tailored to individual data assetsbased on the retention requirements. Refer to the following implementation guides:
• AWS Big Data Blog: Building a cost efficient, petabyte-scale lake house with Amazon S3 lifecycle rulesand Amazon Redshift Spectrum: Part 1
• AWS Big Data Blog: Retaining data streams up to one year with Amazon Kinesis Data Streams• AWS Big Data Blog: Retain more for less with UltraWarm for Amazon OpenSearch Service
Best Practice 4.6 - Require downstream systems to honor thedata classificationsSince other data-consuming systems will access the data that the analytics workload shares, theworkload should require the downstream systems to implement the required data classification policies.For example, if the analytics workload shares the data that is required to encrypt using customer-managed private keys in AWS Key Management Service (KMS), the downstream systems should alsoacknowledge and implement such a data protection policy themselves. This helps to ensure that the datais protected throughout the data pipelines.
Suggestion 4.6.1 - Have a centralized, shareable catalog with cross-account access to ensure thatdata owners manage permissions for downstream systems
Downstream systems can run on their own AWS accounts other than the one of analytics workload.Meanwhile, the downstream systems should be able to discover the data, acknowledge the required dataprotection policies, and to access the data. To allow the downstream systems use the data from analyticsworkload, the analytics workload should provide cross-account access for each dataset. Refer to thefollowing blogs:
• AWS Big Data Blog: Cross-account AWS Glue Data Catalog access with Amazon Athena• AWS Big Data Blog: How JPMorgan Chase built a data mesh architecture to drive significant value to
enhance their enterprise data platform
Suggestion 4.6.2 – Monitor the downstream systems’ eligibility to access classified data from theanalytics workload
Monitor the downstream systems’ eligibility to handle sensitive data. For example, you do not wantdevelopment or test Amazon Redshift clusters to read sensitive data from the analytics workload. If yourorganization runs a program that certifies what systems are eligible to process which classes of data,periodically verify that each downstream system’s data processing eligibility levels and the list of datathat it accesses is appropriate.
5 - Control the data accessHow do you manage access to data within source, analytics, and downstream systems? An analyticsworkload is a centralized repository of data from source systems, and distributes the data to downstream
13
Data Analytics Lens AWS Well-Architected Framework5 - Control the data access
systems. The upstream and downstream systems, therefore, might be owned by different teams. Asthe analytics workload owner, you should honor the source systems’ access management policies whenconnecting to the source systems, secure the access of the data in the analytics workload, and securelyshare the data to downstream systems without violating the data classification policies of the sourcesystems.
ID Priority Best Practice
☐ BP 5.1 Required Allow data owners to determine who or which systems canaccess data in analytics and downstream workloads
☐ BP 5.2 Required Build user identity solutions that uniquely identify people andsystems
☐ BP 5.3 Required Implement the required data authorization models
☐ BP 5.4 Recommended Establish an emergency access process to the source, analytics,and downstream systems
For more details, refer to the following documentation:
• AWS Lake Formation Developer Guide: Lake Formation Access Control Overview• Amazon Athena User Guide: Identity and Access Management in Athena• Amazon Athena User Guide: Enabling Federated Access to the Athena API• Amazon Redshift Database Developer Guide: Managing database security• Amazon EMR Management Guide: AWS Identity and Access Management for Amazon EMR• Amazon EMR Management Guide: Use Kerberos authentication• Amazon EMR Management Guide: Use an Amazon EC2 key pair for SSH credentials
Best Practice 5.1 - Allow data owners to determine whichpeople or systems can access data in analytics and downstreamworkloadsData owners are the people that have direct responsibility for data protection. For instance, the dataowners want to determine which data is publicly accessible, or which data is restricted access to whomor what systems. The data owners should be able to provide data access rules, so that the analyticsworkload can implement the rules.
Suggestion 5.1.1 – Identify data owners and assign roles
Data stewardship is the management and oversight of an organization's data assets to help providebusiness users with high-quality data that is easily accessible in a consistent manner. Because theanalytics workload consolidates multiple datasets into a central place, each dataset is owned by differentteams or people. So, it is important for the analytics workload to identify which dataset is owned bywhom to have the owners control the data access permissions.
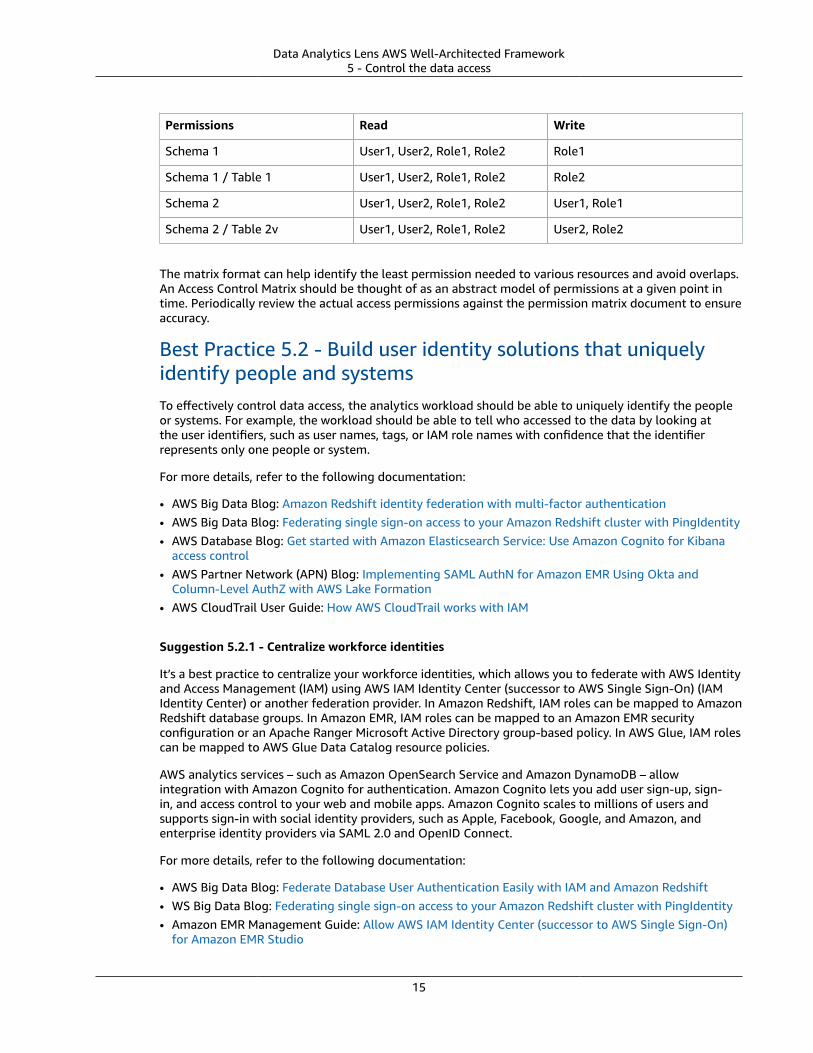
Suggestion 5.1.2 – Identify permission using permission matrix for users and roles based on actionsperformed on the data by users and downstream systems
To aid in identifying and communicating data-access permissions, an Access Control Matrix is a helpfulmethod to document which users, roles, or systems have access to which datasets and describe whatactions they can perform. Below is a sample matrix for two users, two roles for two schemas with a tablein them:
14
Data Analytics Lens AWS Well-Architected Framework5 - Control the data access
Permissions Read Write
Schema 1 User1, User2, Role1, Role2 Role1
Schema 1 / Table 1 User1, User2, Role1, Role2 Role2
Schema 2 User1, User2, Role1, Role2 User1, Role1
Schema 2 / Table 2v User1, User2, Role1, Role2 User2, Role2
The matrix format can help identify the least permission needed to various resources and avoid overlaps.An Access Control Matrix should be thought of as an abstract model of permissions at a given point intime. Periodically review the actual access permissions against the permission matrix document to ensureaccuracy.
Best Practice 5.2 - Build user identity solutions that uniquelyidentify people and systemsTo effectively control data access, the analytics workload should be able to uniquely identify the peopleor systems. For example, the workload should be able to tell who accessed to the data by looking atthe user identifiers, such as user names, tags, or IAM role names with confidence that the identifierrepresents only one people or system.
For more details, refer to the following documentation:
• AWS Big Data Blog: Amazon Redshift identity federation with multi-factor authentication• AWS Big Data Blog: Federating single sign-on access to your Amazon Redshift cluster with PingIdentity• AWS Database Blog: Get started with Amazon Elasticsearch Service: Use Amazon Cognito for Kibana
access control• AWS Partner Network (APN) Blog: Implementing SAML AuthN for Amazon EMR Using Okta and
Column-Level AuthZ with AWS Lake Formation• AWS CloudTrail User Guide: How AWS CloudTrail works with IAM
Suggestion 5.2.1 - Centralize workforce identities
It’s a best practice to centralize your workforce identities, which allows you to federate with AWS Identityand Access Management (IAM) using AWS IAM Identity Center (successor to AWS Single Sign-On) (IAMIdentity Center) or another federation provider. In Amazon Redshift, IAM roles can be mapped to AmazonRedshift database groups. In Amazon EMR, IAM roles can be mapped to an Amazon EMR securityconfiguration or an Apache Ranger Microsoft Active Directory group-based policy. In AWS Glue, IAM rolescan be mapped to AWS Glue Data Catalog resource policies.
AWS analytics services – such as Amazon OpenSearch Service and Amazon DynamoDB – allowintegration with Amazon Cognito for authentication. Amazon Cognito lets you add user sign-up, sign-in, and access control to your web and mobile apps. Amazon Cognito scales to millions of users andsupports sign-in with social identity providers, such as Apple, Facebook, Google, and Amazon, andenterprise identity providers via SAML 2.0 and OpenID Connect.
For more details, refer to the following documentation:
• AWS Big Data Blog: Federate Database User Authentication Easily with IAM and Amazon Redshift• WS Big Data Blog: Federating single sign-on access to your Amazon Redshift cluster with PingIdentity• Amazon EMR Management Guide: Allow AWS IAM Identity Center (successor to AWS Single Sign-On)
for Amazon EMR Studio
15
Data Analytics Lens AWS Well-Architected Framework5 - Control the data access
Best Practice 5.3 - Implement the required data accessauthorization models
User authorization determines what actions a user is permitted to take on the data or resource. The dataowners should be able to use the authorization methods to protect their data as needed. For example, ifthe data owners need to control which users are allowed to view certain columns of data, the analyticsworkload should provide column-wise data access authorization along with user group management foran effective control.
Suggestion 5.3.1 - Implement IAM policy-based data access controls
Limit access to sensitive data stores with IAM policies where possible. Provide systems and people withrotating short-term credentials via role-based access control (RBAC).
For more details, refer to the following blog:
• AWS Big Data Blog: Restrict access to your AWS Glue Data Catalog with resource-level IAM permissionsand resource-based policies
Suggestion 5.3.2 - Implement dataset-level data access controls
As dataset owners require independent rules of granting data access, you should build the analyticsworkloads to have the dataset owners control the data access per each dataset level. For example, if theanalytics workload hosts a shared Amazon Redshift cluster, the owners of the individual table should beable to authorize the table read and write independently.
For more details, refer to the following blog:
• AWS Big Data Blog: Validate, evolve, and control schemas in Amazon MSK and Amazon Kinesis DataStreams with AWS Glue Schema Registry
Suggestion 5.3.3 - Implement column-level data access controls
Care should be taken that end users of analytics applications are not exposed to sensitive data.Downstream consumers of data should only access the limited view of data necessary for that analyticspurpose. Enforce that sensitive data is not exposed using column-level restrictions, for example, maskthe sensitive columns to downstream systems so an accidental exposure is avoided.
For more details, refer to the following blog:
• AWS Big Data Blog: Allow fine-grained permissions for Amazon QuickSight authors in AWS LakeFormation
• AWS Partner Network (APN) Blog: Implementing SAML AuthN for Amazon EMR Using Okta andColumn-Level AuthZ with AWS Lake Formation
• AWS Big Data Blog: Implementing Authorization and Auditing using Apache Ranger on Amazon EMR
Best Practice 5.4 - Establish an emergency access process to thesource, analytics, and downstream systems
Emergency access allows expedited access to your workload in the unlikely event of an automatedprocess or pipeline issue. This will help you rely on least privilege access, but still provide users the rightlevel of access when they require it.
16
Data Analytics Lens AWS Well-Architected Framework6 – Control the access to workload infrastructure
Suggestion 5.4.1 - Ensure that risk analysis is done on your analytics workload by identifyingemergency situations and a procedure to allow emergency access
Identify the potential events that can happen from source systems, analytics workload, and downstreamsystems. Quantify the risk of each event such as likelihood (low / medium / high) and the size of businessimpact (small / medium / large). For example:
• Source system unavailability event would be rare, but it will impact every downstream system.
• Downstream system unavailability event might be often, but the business impact will be limited to theparticular downstream system owner.
Once you identified priority risks, discuss with the source and downstream system owners on how toallow analytics workload access to the source and downstream systems to continue the data processingbusiness.
6 – Control the access to workload infrastructureHow do you protect the infrastructure of the analytics workload? Analytics environments changebased on the evolving requirements of data processing and distribution. Ensure that the environment isaccessible with the least permissions necessary. Automate auditing of environment changes and alert incase of abnormal environment access.
ID Priority Best Practice
☐ BP 6.1 Required Prevent unintended access to the infrastructure
☐ BP 6.2 Required Implement least permissions policy for source and downstreamsystems
☐ BP 6.3 Required Monitor the infrastructure changes and the user activitiesagainst the infrastructure
☐ BP 6.4 Required Secure the audit logs that record every data or resource accessin analytics infrastructure
Best Practice 6.1 - Prevent unintended access to theinfrastructure
Grant least privilege access to infrastructure to help prevent inadvertent or unintended access tothe infrastructure. For example, you might want to make sure that anonymous users are not allowedto access to the systems, and that the systems are deployed into isolated network spaces. Networkboundaries isolate analytics resources and restrict network access. Network access control lists (NACLs)act as a firewall for controlling traffic in and out. Define the network boundaries of the analytics systemsand only allow intended access, to reduce the risk of inadvertent access.
Suggestion 6.1.1 – Ensure that resources in the infrastructure have boundaries
Use infrastructure boundaries for services, such as databases. Place services in their own VPC privatesubnets that are configured to allow connections only to needed analytics systems.
Use AWS Identity and Access Management (IAM) Access Analyzer for all AWS accounts that are centrallymanaged through AWS Organizations . This allows security teams and administrators to uncoverunintended access to resources from outside their AWS organization within minutes. You can proactively
17
Data Analytics Lens AWS Well-Architected Framework6 – Control the access to workload infrastructure
address whether any resource policies across any of your accounts violate your security and governancepractices by allowing unintended access.
Best Practice 6.2 - Implement least privilege policies for sourceand downstream systemsThe principle of least privilege works by giving only enough access for systems to do the job. Set anexpiry on temporary permissions to ensure that re-authentication occurs periodically. The system actionson the data should determine the permission and granting permissions to other systems should not bepermitted.
Suggestion 6.2.1 - Ensure permissions are least for the action performed by user/system
Identify the minimum privileges that each user/system requires, and only allow the permissions thatthey need. For example, if a downstream system needs to read an Amazon Redshift table from analyticsworkload, only give the read permission for the table using Amazon Redshift user privilege controls.
For more details, refer to the following documentation:
• AWS Security Blog: Techniques for writing least privilege IAM policies• Amazon Redshift Database Developer Guide: Managing database security• AWS Security Blog: IAM Access Analyzer makes it easier to implement least privilege permissions by
generating IAM policies based on access activity
Suggestion 6.2.2 - Implement the two-person rule to prevent accidental or malicious actions
Even if you implemented the least privilege policies, someone needs to have critical permissions for thebusiness such as deleting datasets from analytics workloads.
The two-person rule is a safety mechanism that requires the presence of two authorized personnel toperform tasks that are considered important. It has its origins in military protocol, but the IT securityspace has also widely adopted the practice.
By implementing the two-person rule, you can have additional prevention of accidental or maliciousactions of the people who have critical permissions.
Best Practice 6.3 - Monitor the infrastructure changes and theuser activities against the infrastructureAs the infrastructure changes over time, you should monitor what has been changed by whom. It is toensure such changes are deliberate and the infrastructure is still protected.
Suggestion 6.3.1 – Monitor the infrastructure changes
You want to know every infrastructure change and want to know that such changes are deliberate.Monitor the infrastructure changes using available methods on your team. For example, you canimplement an operation procedure to review the infrastructure configurations every quarter of the year.Or, you can use AWS services which assist you to monitor the infrastructure changes with less effort.
For more details, refer to the following documentation:
• AWS Config Developer Guide: What Is AWS Config?• Amazon Inspector User Guide: What is Amazon Inspector?• Amazon GuardDuty User Guide: Amazon S3 protection in Amazon GuardDuty
18
Data Analytics Lens AWS Well-Architected FrameworkReliability
Suggestion 6.3.2 - Monitor the user activities against the infrastructure
You want to know who change the infrastructure when, so that you can see if any given infrastructurechange is performed by an authorized person or system. To do so, as examples, you can implementan operation procedure to review the AWS CloudTrail audit logs every quarter of the year. Or you canimplement near-real time trend analysis using AWS services such as Amazon CloudWatch Logs Insights.
For more details, refer to the following documentation:
• AWS CloudTrail User Guide: Monitoring CloudTrail Log Files with Amazon CloudWatch Logs
• AWS Management & Governance Blog: Analyzing AWS CloudTrail in Amazon CloudWatch
Best Practice 6.4 - Secure the audit logs that record every dataor resource access in analytics infrastructureAudit logs are records that record events as they happened and should be immutable. These logs provideproof of actions and help in identifying misuse. The logs provide a baseline for analysis or for an auditwhen initiating an investigation. By using a fault-tolerant storage for these logs, it is possible to recoverthem when there is a failure in the auditing systems. Access permissions to these logs must be restrictedto privileged users. Also log audit log access to help in identifying unintended access to audit data.
Suggestion 6.4.1 - Ensure that auditing is active in analytics services and are delivered to fault-tolerant persistent storage
Review the available audit log features of your analytics solutions, and configure the solutions to storethe audit logs to a fault-tolerant persistent storage. It is to ensure that you have complete audit logs forsecurity and compliance purposes.
For more details, refer to the following documentation:
• AWS Management & Governance Blog: AWS CloudTrail Best Practices
• Amazon Redshift Cluster Management Guide: Database audit logging
• Amazon OpenSearch Service (successor to Amazon Elasticsearch Service) Developer Guide: Monitoringaudit logs in Amazon OpenSearch Service
• AWS Technical Guide - Build a Secure Enterprise Machine Learning Platform on AWS: Audit trailmanagement
• AWS Big Data Blog: Build, secure, and manage data lakes with AWS Lake Formation
ReliabilityThe reliability pillar includes the ability of a system to recover from infrastructure or service disruptions,dynamically acquire computing resources to meet demand, and mitigate disruptions such asmisconfiguration or transient network issues. It also includes the ability to understand the full travelpath and change history of the data and keep the data safe when storage failure occurs.
7 - Design resiliency for analytics workloadHow do you design analytics workloads to withstand failures? Every extract, transform, and load (ETL)job has corresponding business requirements, such as providing daily, weekly, or monthly sales flashreports. The analytics workload should meet the business SLAs by designing the ETL pipelines, datastorage and metadata catalog to be resilient from failure.
19
Data Analytics Lens AWS Well-Architected Framework7 - Design resiliency for analytics workload
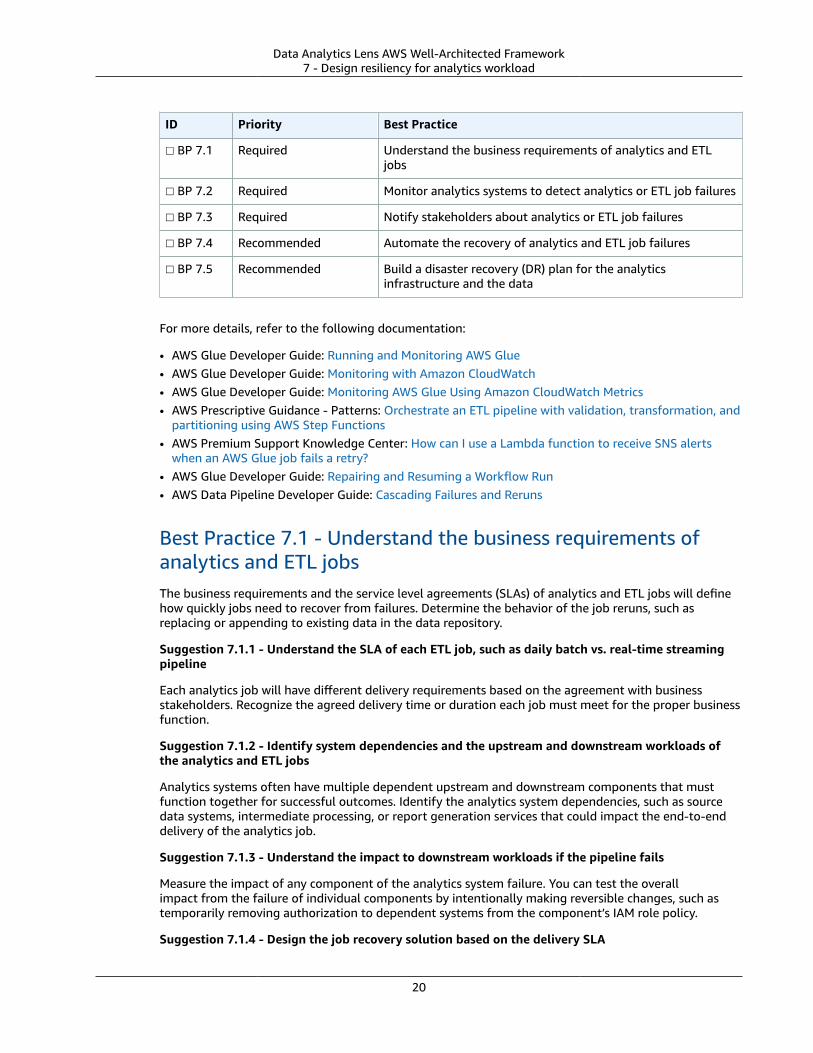
ID Priority Best Practice
☐ BP 7.1 Required Understand the business requirements of analytics and ETLjobs
☐ BP 7.2 Required Monitor analytics systems to detect analytics or ETL job failures
☐ BP 7.3 Required Notify stakeholders about analytics or ETL job failures
☐ BP 7.4 Recommended Automate the recovery of analytics and ETL job failures
☐ BP 7.5 Recommended Build a disaster recovery (DR) plan for the analyticsinfrastructure and the data
For more details, refer to the following documentation:
• AWS Glue Developer Guide: Running and Monitoring AWS Glue• AWS Glue Developer Guide: Monitoring with Amazon CloudWatch• AWS Glue Developer Guide: Monitoring AWS Glue Using Amazon CloudWatch Metrics• AWS Prescriptive Guidance - Patterns: Orchestrate an ETL pipeline with validation, transformation, and
partitioning using AWS Step Functions• AWS Premium Support Knowledge Center: How can I use a Lambda function to receive SNS alerts
when an AWS Glue job fails a retry?• AWS Glue Developer Guide: Repairing and Resuming a Workflow Run• AWS Data Pipeline Developer Guide: Cascading Failures and Reruns
Best Practice 7.1 - Understand the business requirements ofanalytics and ETL jobsThe business requirements and the service level agreements (SLAs) of analytics and ETL jobs will definehow quickly jobs need to recover from failures. Determine the behavior of the job reruns, such asreplacing or appending to existing data in the data repository.
Suggestion 7.1.1 - Understand the SLA of each ETL job, such as daily batch vs. real-time streamingpipeline
Each analytics job will have different delivery requirements based on the agreement with businessstakeholders. Recognize the agreed delivery time or duration each job must meet for the proper businessfunction.
Suggestion 7.1.2 - Identify system dependencies and the upstream and downstream workloads ofthe analytics and ETL jobs
Analytics systems often have multiple dependent upstream and downstream components that mustfunction together for successful outcomes. Identify the analytics system dependencies, such as sourcedata systems, intermediate processing, or report generation services that could impact the end-to-enddelivery of the analytics job.
Suggestion 7.1.3 - Understand the impact to downstream workloads if the pipeline fails
Measure the impact of any component of the analytics system failure. You can test the overallimpact from the failure of individual components by intentionally making reversible changes, such astemporarily removing authorization to dependent systems from the component’s IAM role policy.
Suggestion 7.1.4 - Design the job recovery solution based on the delivery SLA
20
Data Analytics Lens AWS Well-Architected Framework7 - Design resiliency for analytics workload
When practical, build systems that can meet SLA requirements even if jobs must be retried or manuallyrecovered. If it’s not practical to build systems that can recover within the SLA, ensure fail-back methodsprovide information that SLAs will not be met. For example, instead of a daily report arriving by email at6am, provide an email notice that the daily report will not be delivered that day.
Best Practice 7.2 - Monitor analytics systems to detect analyticsor ETL job failuresDetect job failures as soon as possible. Pinpointing where and how the error occurred is critical fornotifications and corrective actions.
Suggestion 7.2.1 - Monitor and track jobs error from different levels, including infrastructure, ETLworkflow, and ETL application code
Failures can occur at all levels of the analytics system. Each component in the analytics system shouldbe instrumented to provide metrics indicating the health of the component. Monitor the emitted metricsand alarm if any components fail.
Suggestion 7.2.2 - Establish end-to-end monitoring for the complete analytics and ETL pipeline
End-to-end monitoring allows tracking the flow of data as it passes through the analytics system. Inmany cases, data processing might be dependent on application logic, such as sampling a subset of datafrom a data stream to check accuracy. Properly identifying and monitoring the end-to-end flow of dataallows detecting at which step the analytics and ETL job fails.
Suggestions 7.2.3 - Determine what data was processed when the job failed
Failures in data processing systems can cause data integrity or data quality issues. Determine what datawas being processed at the time of failure and perform quality checks of both the input and output data.
Suggestions 7.2.4 - Classify the severity of the job failures based on the type of failure and thebusiness impact
Classifying the severity of different job failures will help you prioritize remediation and guide thenotification requirements to key stakeholders.
Best Practice 7.3 - Notify stakeholders about analytics or ETLjob failuresAnalytics and ETL job failures can impact the SLAs for delivering the data on time for downstreamanalytics workloads. Failures might cause data quality or data integrity issues as well. Notifying allstakeholders, such as IT operations, help desk, data source, analytics, and downstream workloads, aboutthe job failure as soon as possible is important for remediation actions needed.
Suggestions 7.3.1 - Establish automated notifications to predefined recipients
Use services such Amazon Simple Notification Service (Amazon SNS) to automatically send emails, phonealerts, or both in the event of failure.
Suggestions 7.3.2 – Do not include sensitive data in notifications
Automated alerts often include indicators of useful information for troubleshooting the failure. Ensuresensitive information, such as medical or financial information, is not shared in failure notifications.
Suggestions 7.3.3 - Integrate the analytics job failure notification solution with the enterpriseoperation management system
21
Data Analytics Lens AWS Well-Architected Framework7 - Design resiliency for analytics workload
Where possible, integrate automated notifications into existing operations management tools. Forexample, an operations support ticket can be automatically filed in the event of a failure, and that sameticket can automatically be resolved if the analytics system recovers on retry.
Suggestions 7.3.4 – Notify IT operations and help desk teams of any ETL job failures
Normally, the IT operations team should be the first contact for production workload failures. The IToperations team will troubleshoot and attempt to recover the failed job, if possible. It is also helpfulto notify the IT help desk for system failures that have end user impact, such as an issue with the datawarehouse used by the business intelligence (BI) analysts.
Best Practice 7.4 - Automate the recovery of analytics and ETLjob failuresMany factors can cause analytics and ETL job to fail. Some types of job failures can be recovered usingautomated recovery solutions. Designing and implementing an automated recovery solution will helpreduce the impact of the job failures and streamline IT operations.
Suggestions 7.4.1 - Determine what types of job failures can be recovered safely using an automatedrecovery solution
Some failures can be remediated by rerunning the job differently with understanding of the failuretype using application logic. Identify failure types, the root cause of each type of failure, and whetherautomation can be used to recover from failure.
Suggestions 7.4.2 - Design an automated recovery solution to handle different types of failures
For example:
• Configure automatic retries to handle intermittent network disruptions• Set up a load-based automatic scaling policy to scale the compute environment to handle failures
caused by throttling
Suggestions 7.4.3 - Limit the number of automatic reruns and create log entries for the automaticrecovery attempts and results
Track the number of reruns an automated recovery can attempt. Limit the number of reruns to avoidwasting time and resources. Log recovery attempts and outcomes to drive future improvements of theautomated recovery system.
Best Practice 7.5 - Build a disaster recovery (DR) plan for theanalytics infrastructure and the dataDiscuss with business stakeholders to confirm how fast the analytics systems should be recovered (theRecovery Time Objective or RTO) and what amount data loss is tolerable (the Recovery Point Objectiveor RPO) in a disaster recovery (DR) scenario. Depending on the business requirements, an analyticsworkload should be able to recover the systems and secure the data from AZ-wide or Region-widefailures.
Suggestion 7.5.1 – Confirm the business requirement of the disaster recovery (DR) plan
Speak to the business shareholders that the analytics workload serves, and identify their disasterrecovery (DR) requirements of the data, metadata catalog and ETL pipelines based on the businessrequirements, data classification, legal and compliance requirements. Define the RTO and RPO for yourdata, metadata, and ETL pipelines.
Suggestion 7.5.2 - Design the disaster recovery (DR) solution
22
Data Analytics Lens AWS Well-Architected Framework8 - Govern data and metadata changes
Review the architecture for your data and analytics pipeline and select the DR pattern that meets yourDR requirements.
Suggestion 7.5.3 - Implement and test your backup solution based on the RPO and RTO
Backup solutions must be implemented to meet the RPO and RTO requirements. Periodically test yourbackup and restore solution to ensure that your RPO and RTO can be met.
8 - Govern data and metadata changesHow do you govern data and metadata changes? Controlled changes are not only necessary forinfrastructure, but also required for data quality assurance. If the data changes are uncontrolled, itbecomes difficult to anticipate the impact of these changes. It even makes downstream systems harderto manage data quality issues of their own.
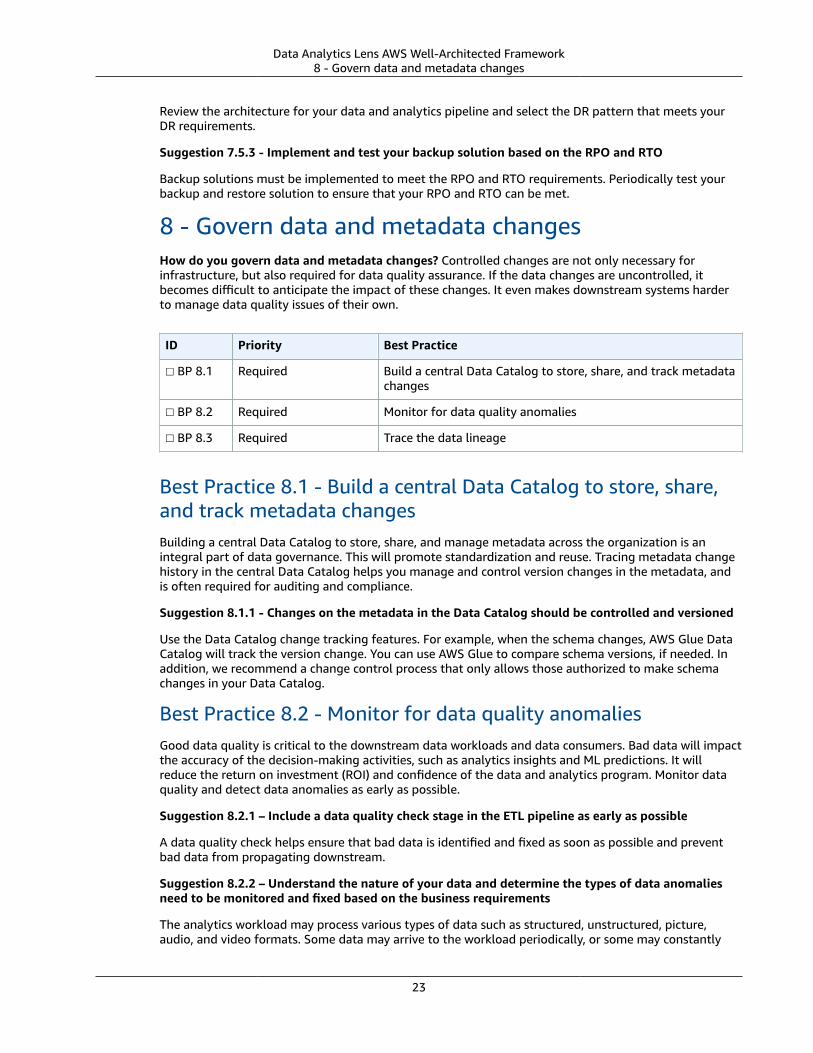
ID Priority Best Practice
☐ BP 8.1 Required Build a central Data Catalog to store, share, and track metadatachanges
☐ BP 8.2 Required Monitor for data quality anomalies
☐ BP 8.3 Required Trace the data lineage
Best Practice 8.1 - Build a central Data Catalog to store, share,and track metadata changesBuilding a central Data Catalog to store, share, and manage metadata across the organization is anintegral part of data governance. This will promote standardization and reuse. Tracing metadata changehistory in the central Data Catalog helps you manage and control version changes in the metadata, andis often required for auditing and compliance.
Suggestion 8.1.1 - Changes on the metadata in the Data Catalog should be controlled and versioned
Use the Data Catalog change tracking features. For example, when the schema changes, AWS Glue DataCatalog will track the version change. You can use AWS Glue to compare schema versions, if needed. Inaddition, we recommend a change control process that only allows those authorized to make schemachanges in your Data Catalog.
Best Practice 8.2 - Monitor for data quality anomaliesGood data quality is critical to the downstream data workloads and data consumers. Bad data will impactthe accuracy of the decision-making activities, such as analytics insights and ML predictions. It willreduce the return on investment (ROI) and confidence of the data and analytics program. Monitor dataquality and detect data anomalies as early as possible.
Suggestion 8.2.1 – Include a data quality check stage in the ETL pipeline as early as possible
A data quality check helps ensure that bad data is identified and fixed as soon as possible and preventbad data from propagating downstream.
Suggestion 8.2.2 – Understand the nature of your data and determine the types of data anomaliesneed to be monitored and fixed based on the business requirements
The analytics workload may process various types of data such as structured, unstructured, picture,audio, and video formats. Some data may arrive to the workload periodically, or some may constantly
23
Data Analytics Lens AWS Well-Architected FrameworkPerformance efficiency
arrive in real time. It is pragmatic to assume that data does not always arrive to the analytics workload inperfect shape. And only a portion – not the whole set – of data matters to your workload.
You may need to understand the characteristics of data, and determine what forms of data anomalyyou want to care. For example, if you expect the data always contain important attribute like customerID, you can define that a data is abnormal if it doesn’t contain customer_id attribute. Common dataanomalies include duplicate data, missing data, incomplete data, incorrect data format, and differentmeasurement units.
Suggestion 8.2.3 – Select an existing data quality solution or develop your own based on therequirements
For example, some data quality solutions can only detect single field data quality issues, while others canhandle complex stateful data quality issues related to multiple fields.
Best Practice 8.3 - Trace the data lineageFully understanding where the data comes from, where it has been, how it’s been transformed, who usesit, and how it’s used is critical to getting real business value from the data. To achieve this goal, datalineage should be tracked, managed, and visualized. Ensure that the data lineage is captured to createthis visibility, which can help simplify tracing errors back to the root cause in a data analytics process.
Suggestion 8.3.1 – Track and control data lineage information
Data lineage information includes where the data comes from, where it has been, how it’s beentransformed, and who uses it. Store the collected information in a persistent data store, such as AmazonS3, Amazon RDS, or Amazon DynamoDB.
Suggestion 8.3.2 – Implement steps in the ETL pipeline to check and validate record counts for eachdata movement and transformation
Perform basic validation of the records processed against expected output.
Suggestion 8.3.3 – Use visualization tools to investigate data lineage
Data lineage can become complicated when multiple systems are interacting with each another. Buildinga data lineage tool to visually investigate data lineage can drastically reduce troubleshooting time andhelp identify downstream impacts from bad data.
Suggestion 8.3.4 – Build a data lineage report to satisfy compliance and audit requirements
Build tools to generate data lineage reports as needed for compliance or audit purposes.
Performance efficiencyThe performance efficiency pillar focuses on the efficient use of computing resources to meetrequirements and the maintenance of that efficiency as demand changes and technologies evolve.Remember, performance optimization is not a one-time activity. It is an incremental and continualprocess of confirming business requirements, measuring the workload performance, identifying under-performing components, and tuning the components to meet your business needs.
9 - Choose the best-performing compute solutionHow do you select the best-performing compute options for your analytics workload? The definitionof best-performing will mean different things to different stakeholders, so gathering all stakeholders’input in the decision process is key. Define performance and cost goals by balancing business and
24
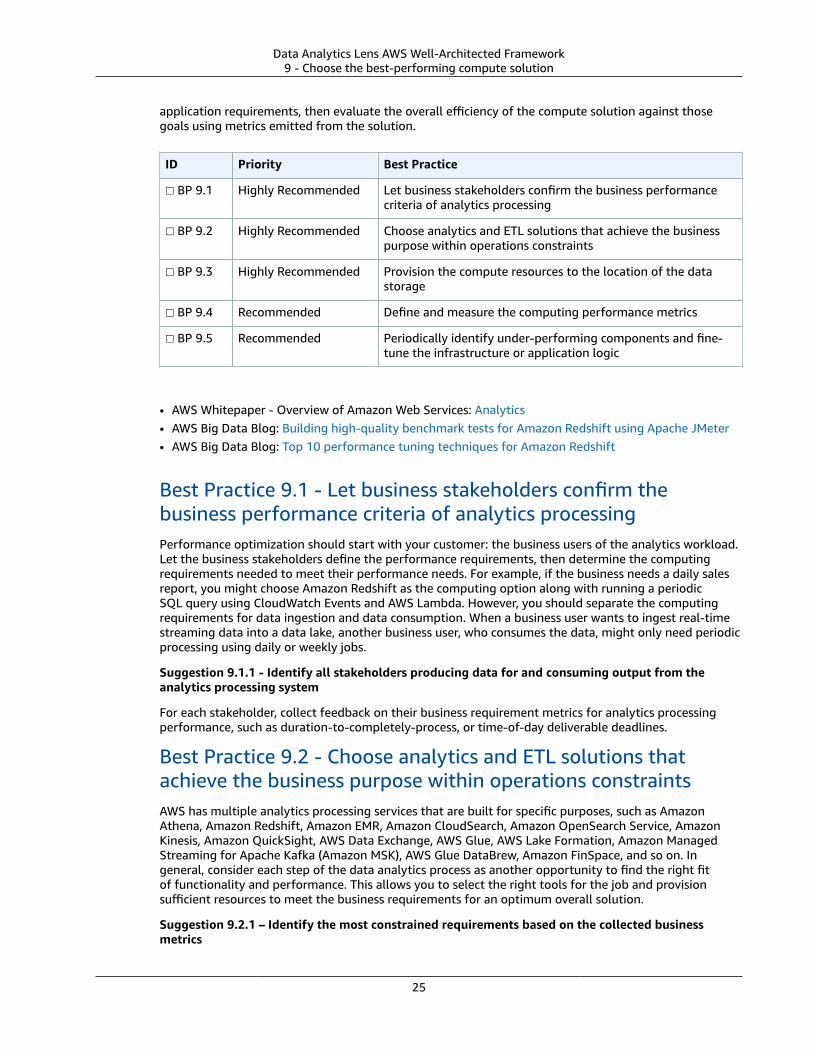
Data Analytics Lens AWS Well-Architected Framework9 - Choose the best-performing compute solution
application requirements, then evaluate the overall efficiency of the compute solution against thosegoals using metrics emitted from the solution.
ID Priority Best Practice
☐ BP 9.1 Highly Recommended Let business stakeholders confirm the business performancecriteria of analytics processing
☐ BP 9.2 Highly Recommended Choose analytics and ETL solutions that achieve the businesspurpose within operations constraints
☐ BP 9.3 Highly Recommended Provision the compute resources to the location of the datastorage
☐ BP 9.4 Recommended Define and measure the computing performance metrics
☐ BP 9.5 Recommended Periodically identify under-performing components and fine-tune the infrastructure or application logic
• AWS Whitepaper - Overview of Amazon Web Services: Analytics• AWS Big Data Blog: Building high-quality benchmark tests for Amazon Redshift using Apache JMeter• AWS Big Data Blog: Top 10 performance tuning techniques for Amazon Redshift
Best Practice 9.1 - Let business stakeholders confirm thebusiness performance criteria of analytics processingPerformance optimization should start with your customer: the business users of the analytics workload.Let the business stakeholders define the performance requirements, then determine the computingrequirements needed to meet their performance needs. For example, if the business needs a daily salesreport, you might choose Amazon Redshift as the computing option along with running a periodicSQL query using CloudWatch Events and AWS Lambda. However, you should separate the computingrequirements for data ingestion and data consumption. When a business user wants to ingest real-timestreaming data into a data lake, another business user, who consumes the data, might only need periodicprocessing using daily or weekly jobs.
Suggestion 9.1.1 - Identify all stakeholders producing data for and consuming output from theanalytics processing system
For each stakeholder, collect feedback on their business requirement metrics for analytics processingperformance, such as duration-to-completely-process, or time-of-day deliverable deadlines.
Best Practice 9.2 - Choose analytics and ETL solutions thatachieve the business purpose within operations constraintsAWS has multiple analytics processing services that are built for specific purposes, such as AmazonAthena, Amazon Redshift, Amazon EMR, Amazon CloudSearch, Amazon OpenSearch Service, AmazonKinesis, Amazon QuickSight, AWS Data Exchange, AWS Glue, AWS Lake Formation, Amazon ManagedStreaming for Apache Kafka (Amazon MSK), AWS Glue DataBrew, Amazon FinSpace, and so on. Ingeneral, consider each step of the data analytics process as another opportunity to find the right fitof functionality and performance. This allows you to select the right tools for the job and provisionsufficient resources to meet the business requirements for an optimum overall solution.
Suggestion 9.2.1 – Identify the most constrained requirements based on the collected businessmetrics
25
Data Analytics Lens AWS Well-Architected Framework9 - Choose the best-performing compute solution
Select services such that the most constrained requirements will be met. Where possible, selecthorizontally scalable architectures that allow the systems to respond to growing and shrinking demandwhile meeting processing requirements of the business.
Best Practice 9.3 - Provision the compute resources to thelocation of the data storageIn most cases, data analytics workloads require moving data through a pipeline, either for ingesting data,processing intermediate results, or producing curated datasets. It is easier and more efficient to selectthe location of data processing services near where the data is stored, rather than frequently copying orstreaming large amounts of data to the processing location. For example, if an Amazon Redshift clusterfrequently ingests data from a data lake, ensure that the Amazon Redshift cluster is in the same Regionas your data lake S3 buckets.
Suggestion 9.3.1 - Migrate or copy primary data stores from on-premises environments to AWS sothat cloud compute and storage are closely located
Avoid repeatedly transferring the same datasets from on-premises data stores to the cloud. Instead,create copies of your data near the analytics platform to avoid data transfer latency and improve overallperformance of the analytics solution. Similarly, if data resides in a different AWS Region from theanalytics systems, move either the analytics systems or the data to the same Region.
Suggestion 9.3.2 - Place data processing resources in the same AWS Region as the primary datastores
In some cases where data is stored within an AWS Region, you might also choose to locate the processingresources within the same AWS Region.
Best Practice 9.4 - Define and measure the computingperformance metricsDefine how you will measure performance of the analytics solutions for each step in the process. Forexample, if the computing solution is a transient Amazon EMR cluster, you can define the performance asthe Amazon EMR job runtime from the launch of the EMR cluster, processing the job, then shutting downthe cluster. As another example, if the computing solution is an Amazon Redshift cluster that is shared bya business unit, you would need to define the performance as the runtime duration for each SQL query.
Suggestion 9.4.1 - Define performance efficiency metrics
Collect and use metrics to scale the resources needed to meet business requirements. Informdownstream processes or stakeholders of data delays or errors.
Best Practice 9.5 - Periodically identify under-performingcomponents and fine-tune the infrastructure or applicationlogicAfter you have defined the performance measurement, you should identify which infrastructurecomponents or jobs are running below the performance criteria. The performance fine-tuning will varyper AWS service. For example, if it is an Amazon EMR cluster, you would need to change to a largercluster instance type, or increase the number of cluster nodes. However, for an Amazon Redshift cluster,you would either need to increase the number of cluster nodes to increase parallel computing capacity,or you would need to find-tune the SQL queries that are running below the performance criteria.
Suggestion 9.5.1 - Evaluate your metrics performance during regular operational reviews
Take actions to properly configure your resources to meet the business requirements.
26
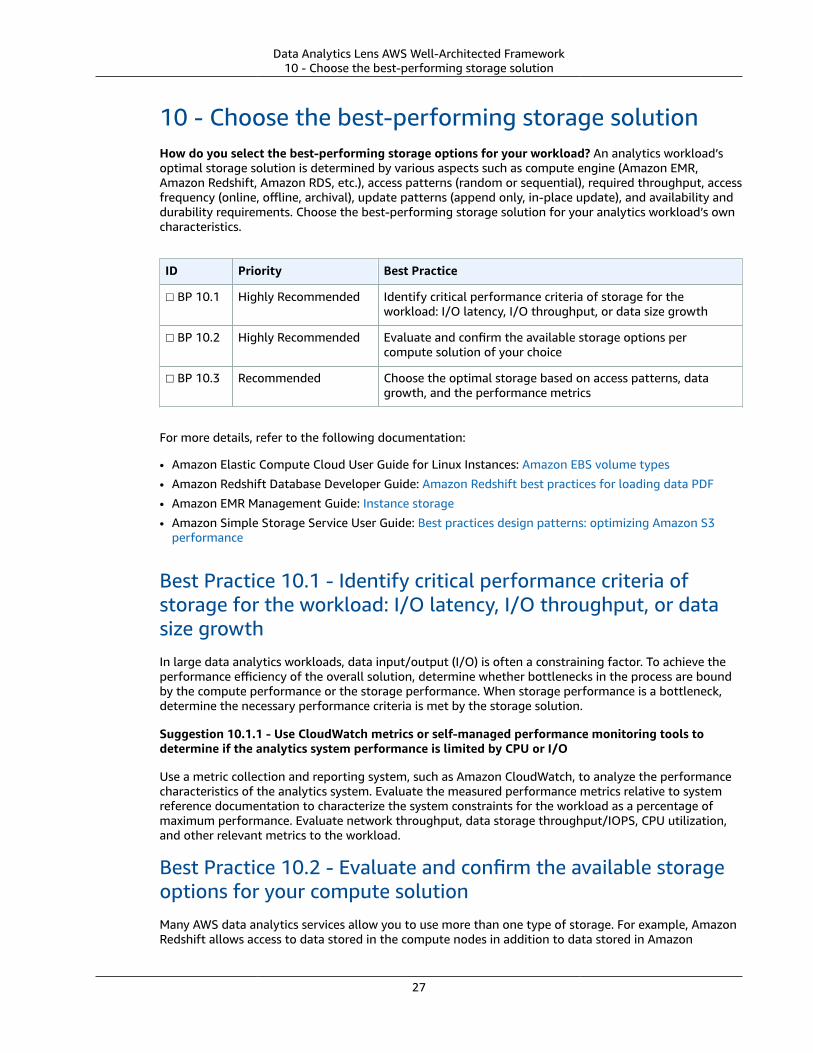
Data Analytics Lens AWS Well-Architected Framework10 - Choose the best-performing storage solution
10 - Choose the best-performing storage solutionHow do you select the best-performing storage options for your workload? An analytics workload’soptimal storage solution is determined by various aspects such as compute engine (Amazon EMR,Amazon Redshift, Amazon RDS, etc.), access patterns (random or sequential), required throughput, accessfrequency (online, offline, archival), update patterns (append only, in-place update), and availability anddurability requirements. Choose the best-performing storage solution for your analytics workload’s owncharacteristics.
ID Priority Best Practice
☐ BP 10.1 Highly Recommended Identify critical performance criteria of storage for theworkload: I/O latency, I/O throughput, or data size growth
☐ BP 10.2 Highly Recommended Evaluate and confirm the available storage options percompute solution of your choice
☐ BP 10.3 Recommended Choose the optimal storage based on access patterns, datagrowth, and the performance metrics
For more details, refer to the following documentation:
• Amazon Elastic Compute Cloud User Guide for Linux Instances: Amazon EBS volume types
• Amazon Redshift Database Developer Guide: Amazon Redshift best practices for loading data PDF
• Amazon EMR Management Guide: Instance storage
• Amazon Simple Storage Service User Guide: Best practices design patterns: optimizing Amazon S3performance
Best Practice 10.1 - Identify critical performance criteria ofstorage for the workload: I/O latency, I/O throughput, or datasize growthIn large data analytics workloads, data input/output (I/O) is often a constraining factor. To achieve theperformance efficiency of the overall solution, determine whether bottlenecks in the process are boundby the compute performance or the storage performance. When storage performance is a bottleneck,determine the necessary performance criteria is met by the storage solution.
Suggestion 10.1.1 - Use CloudWatch metrics or self-managed performance monitoring tools todetermine if the analytics system performance is limited by CPU or I/O
Use a metric collection and reporting system, such as Amazon CloudWatch, to analyze the performancecharacteristics of the analytics system. Evaluate the measured performance metrics relative to systemreference documentation to characterize the system constraints for the workload as a percentage ofmaximum performance. Evaluate network throughput, data storage throughput/IOPS, CPU utilization,and other relevant metrics to the workload.
Best Practice 10.2 - Evaluate and confirm the available storageoptions for your compute solutionMany AWS data analytics services allow you to use more than one type of storage. For example, AmazonRedshift allows access to data stored in the compute nodes in addition to data stored in Amazon
27
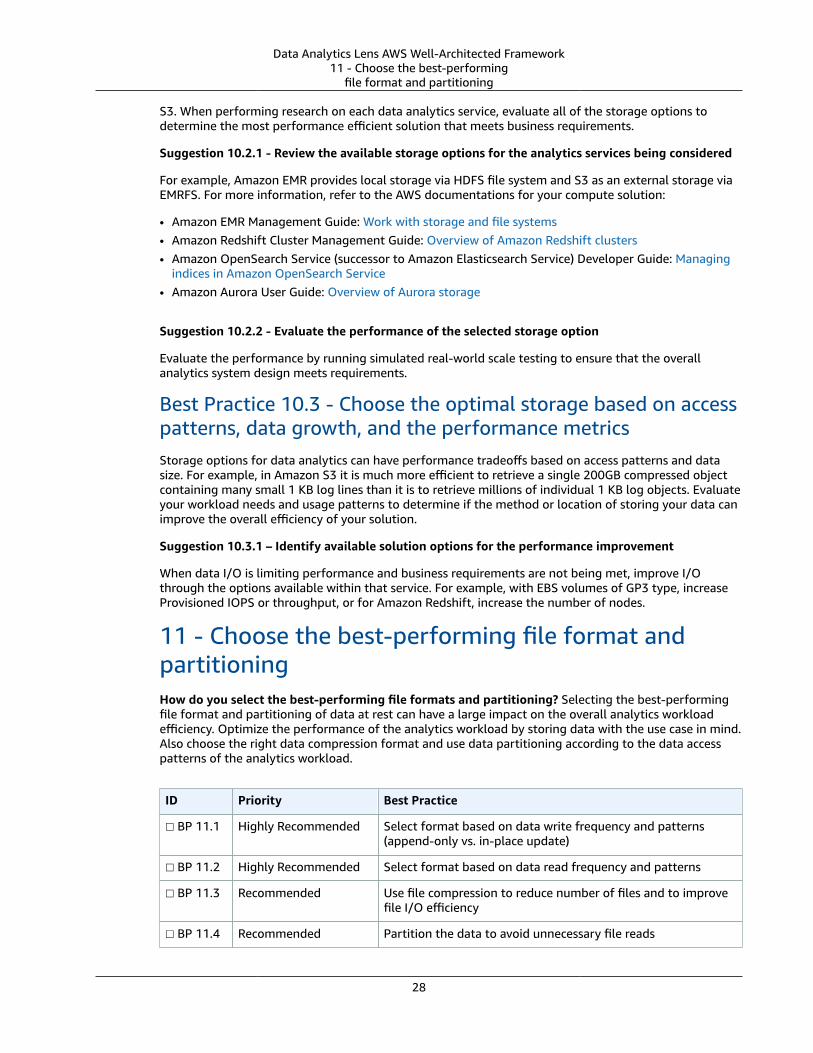
Data Analytics Lens AWS Well-Architected Framework11 - Choose the best-performing
file format and partitioning
S3. When performing research on each data analytics service, evaluate all of the storage options todetermine the most performance efficient solution that meets business requirements.
Suggestion 10.2.1 - Review the available storage options for the analytics services being considered
For example, Amazon EMR provides local storage via HDFS file system and S3 as an external storage viaEMRFS. For more information, refer to the AWS documentations for your compute solution:
• Amazon EMR Management Guide: Work with storage and file systems• Amazon Redshift Cluster Management Guide: Overview of Amazon Redshift clusters• Amazon OpenSearch Service (successor to Amazon Elasticsearch Service) Developer Guide: Managing
indices in Amazon OpenSearch Service• Amazon Aurora User Guide: Overview of Aurora storage
Suggestion 10.2.2 - Evaluate the performance of the selected storage option
Evaluate the performance by running simulated real-world scale testing to ensure that the overallanalytics system design meets requirements.
Best Practice 10.3 - Choose the optimal storage based on accesspatterns, data growth, and the performance metricsStorage options for data analytics can have performance tradeoffs based on access patterns and datasize. For example, in Amazon S3 it is much more efficient to retrieve a single 200GB compressed objectcontaining many small 1 KB log lines than it is to retrieve millions of individual 1 KB log objects. Evaluateyour workload needs and usage patterns to determine if the method or location of storing your data canimprove the overall efficiency of your solution.
Suggestion 10.3.1 – Identify available solution options for the performance improvement
When data I/O is limiting performance and business requirements are not being met, improve I/Othrough the options available within that service. For example, with EBS volumes of GP3 type, increaseProvisioned IOPS or throughput, or for Amazon Redshift, increase the number of nodes.
11 - Choose the best-performing file format andpartitioningHow do you select the best-performing file formats and partitioning? Selecting the best-performingfile format and partitioning of data at rest can have a large impact on the overall analytics workloadefficiency. Optimize the performance of the analytics workload by storing data with the use case in mind.Also choose the right data compression format and use data partitioning according to the data accesspatterns of the analytics workload.
ID Priority Best Practice
☐ BP 11.1 Highly Recommended Select format based on data write frequency and patterns(append-only vs. in-place update)
☐ BP 11.2 Highly Recommended Select format based on data read frequency and patterns
☐ BP 11.3 Recommended Use file compression to reduce number of files and to improvefile I/O efficiency
☐ BP 11.4 Recommended Partition the data to avoid unnecessary file reads
28
Data Analytics Lens AWS Well-Architected Framework11 - Choose the best-performing
file format and partitioning
For more details, refer to the following documentation:
• Amazon Redshift Database Developer Guide: Creating data files for queries in Amazon RedshiftSpectrum
• Amazon EMR Release Guide: Hudi• AWS Big Data Blog: Apply record level changes from relational databases to Amazon S3 data lake
using Apache Hudi on Amazon EMR and AWS Database Migration Service
Best Practice 11.1 - Select format based on data write frequencyand patterns (append-only vs. in-place update)Evaluate your data storage access patterns and performance requirements. For example, for a streamingdata ingestion case, instead of storing many small data files individually, periodically batch-process thesmall files into a single larger compressed file, which will be more performant upon retrieval.
Suggestion 11.1.1 - Understand your analytics workload data write characteristics
If storing data in Amazon S3, evaluate if an append-only method such as Apache Hudi is right for yourneeds. Where practical, use batched write updates.
Best Practice 11.2 - Select format based on data read frequencyand patternsEvaluate how frequently data is retrieved and move it to an appropriate tier based on performance.For example, you can find which data is access by looking at query patterns such as SELECT … FROM… WHERE … GROUP BY …. Or, offloading historical, infrequently-accessed data to Amazon S3 in acompressed file format allows querying with Amazon Redshift Spectrum while keeping frequentlyaccessed data in the data warehouse.
Suggestion 11.2.1 - Understand your analytics workload data read characteristics and patterns
Select the storage service that meets the performance requirements while maintaining SLAs.
Suggestion 11.2.2 - Be aware of API-driven data access pattern constraints, such as the amount ofdata retrieved per API request, which could impact overall performance due to API throttling
Refer to AWS documentation for API quotas per service.
Suggestion 11.2.3 - Use caching services to improve performance and reduce reads from the storagetier
Caching services can speed up the responses to common queries and reduce the load on the storage tier.Use Amazon ElastiCache, Amazon DynamoDB Accelerator (DAX), API Gateway caching, or other relevantcaching services.
Best Practice 11.3 - Use file compression to reduce number offiles and to improve file I/O efficiencyIf possible, store data in a compressed format to reduce I/O burden on the underlying storage host andnetwork. For example, for columnar data stored in Amazon S3, use a compatible compression algorithmthat supports parallel reads, such as bzip2.
Suggestion 11.3.1 - Understand the I/O constraints on the workload
Measure the I/O characteristics of the workload. Determine I/O constraints by evaluating all aspects ofthe workload, including data retrieval, decompression, data processing, compression, and data storage.
29
Data Analytics Lens AWS Well-Architected FrameworkCost optimization
Suggestion 11.3.2 – Compress data to reduce the transfer time
When storage read/write performance is a bottleneck, use compression to reduce data transfer time.Consider if the compute requirements to perform compression and decompression overcomes thestorage I/O bottleneck and improves overall performance efficiency.
Suggestion 11.3.3 – Evaluate the available compression options for each resource of the workload
For each service used in the workload, evaluate the compression options available.
Best Practice 11.4 - Partition the data to avoid unnecessary filereadsIf possible, store data in structured partitions, which allows the compute to identify the location of onlythose portions of the data relevant for the query. Determine the most frequent query parameters andstore the data appropriately for the data retrieval needs. For example, if an analytics workload regularlygenerates daily, weekly, and monthly reports, store data partitioned with year/month/day format.
Suggestion 11.4.1 - Store data partitioned based on column with incremental processing constraints
This partitioning scheme is most often used with data processing needed for different time windows,such as daily, weekly, or monthly reports.
Suggestion 11.4.2 - Store data partitioned based on reducing number of files or compaction
Store frequently-accessed data (‘hot’ data) and barely-accessed data (‘cold’ data) into separate partitions.For example, if you have to archive data for regulatory reasons, you can store the data into S3 bucketwith a prefix such as /archive, and you can configure a S3 life cycle policy to automatically move it intoAmazon S3 Glacier. Or, when you have too many small files to process, you can consolidate such smallfiles into a S3 bucket with a prefix such as /raw-data, and you can generate a pre-processed, big-size-but-less-number of files into a S3 bucket with /pre-processed prefix for faster analytical processing uponthe pre-processed files.
Suggestion 11.4.3 - Store data partitioned based on columns frequently used in queries for filtering
This partitioning scheme is most often used with data stored in many columns and retrieval of allcolumns is unnecessary.
Suggestion 11.4.4 - Store data partitioned based on time attributes with earlier data in infrequent-access tiers
Use the tiering capabilities of the storage service to put infrequently accessed data in the tierappropriate for the workload. For example, in the Amazon Redshift data warehouse, infrequentlyaccessed data can be stored in Amazon S3 and queried with Redshift Spectrum, while frequentlyaccessed data can be stored in local Amazon Redshift storage.
Cost optimizationThe cost optimization pillar includes the continual process of refinement and improvement of a systemover its entire lifecycle to optimize cost, from the initial design of your first proof of concept to theongoing operation of production workloads. It’s a years-long, continual process. Choose the rightsolution and pricing model. Build cost-aware systems that allow you to achieve business outcomesand minimize costs. To perform cost optimization over time, you need to identify data, infrastructureresources, and analytics jobs that can be removed or downsized.
Determine the analytics workflow costs at each individual data processing step or individual pipelinebranch. The benefit of understanding analytics workflow costs at this granular level will help you
30
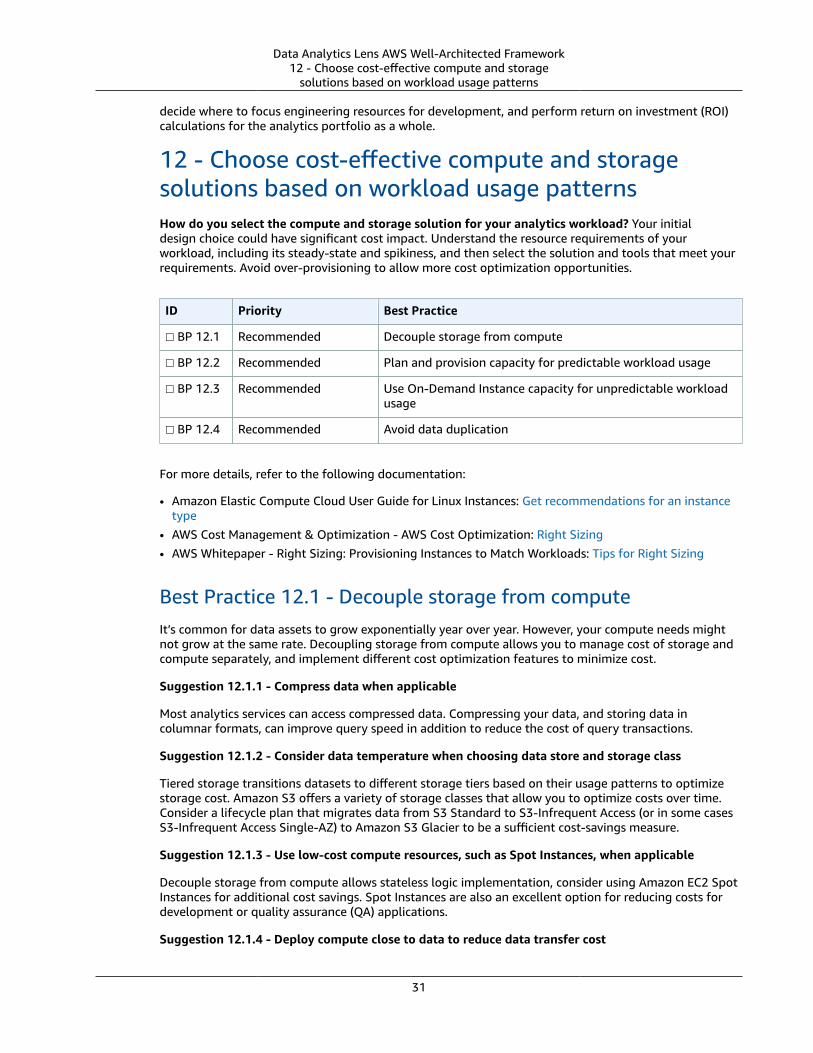
Data Analytics Lens AWS Well-Architected Framework12 - Choose cost-effective compute and storage
solutions based on workload usage patterns
decide where to focus engineering resources for development, and perform return on investment (ROI)calculations for the analytics portfolio as a whole.
12 - Choose cost-effective compute and storagesolutions based on workload usage patternsHow do you select the compute and storage solution for your analytics workload? Your initialdesign choice could have significant cost impact. Understand the resource requirements of yourworkload, including its steady-state and spikiness, and then select the solution and tools that meet yourrequirements. Avoid over-provisioning to allow more cost optimization opportunities.
ID Priority Best Practice
☐ BP 12.1 Recommended Decouple storage from compute
☐ BP 12.2 Recommended Plan and provision capacity for predictable workload usage
☐ BP 12.3 Recommended Use On-Demand Instance capacity for unpredictable workloadusage
☐ BP 12.4 Recommended Avoid data duplication
For more details, refer to the following documentation:
• Amazon Elastic Compute Cloud User Guide for Linux Instances: Get recommendations for an instancetype
• AWS Cost Management & Optimization - AWS Cost Optimization: Right Sizing• AWS Whitepaper - Right Sizing: Provisioning Instances to Match Workloads: Tips for Right Sizing
Best Practice 12.1 - Decouple storage from computeIt’s common for data assets to grow exponentially year over year. However, your compute needs mightnot grow at the same rate. Decoupling storage from compute allows you to manage cost of storage andcompute separately, and implement different cost optimization features to minimize cost.
Suggestion 12.1.1 - Compress data when applicable
Most analytics services can access compressed data. Compressing your data, and storing data incolumnar formats, can improve query speed in addition to reduce the cost of query transactions.
Suggestion 12.1.2 - Consider data temperature when choosing data store and storage class
Tiered storage transitions datasets to different storage tiers based on their usage patterns to optimizestorage cost. Amazon S3 offers a variety of storage classes that allow you to optimize costs over time.Consider a lifecycle plan that migrates data from S3 Standard to S3-Infrequent Access (or in some casesS3-Infrequent Access Single-AZ) to Amazon S3 Glacier to be a sufficient cost-savings measure.
Suggestion 12.1.3 - Use low-cost compute resources, such as Spot Instances, when applicable
Decouple storage from compute allows stateless logic implementation, consider using Amazon EC2 SpotInstances for additional cost savings. Spot Instances are also an excellent option for reducing costs fordevelopment or quality assurance (QA) applications.
Suggestion 12.1.4 - Deploy compute close to data to reduce data transfer cost
31
Data Analytics Lens AWS Well-Architected Framework12 - Choose cost-effective compute and storage
solutions based on workload usage patterns
In AWS, data transfer charges apply to data transferred out of AWS to the internet or over DirectConnect, data transferred between AWS Regions, and data transferred between Availability Zones. Datatransfer into AWS and data transfer within an AZ is at no cost.
Suggestion 12.1.5 - Use Amazon S3 Select and Amazon S3 Glacier Select to reduce data retrieval
Amazon S3 Select and Amazon S3 Glacier Select allow applications to retrieve only a subset of data froman object by using simple SQL expressions.
Best Practice 12.2 - Plan and provision capacity for predictableworkload usageFor well-defined workloads, planning capacity ahead based on average usage pattern helps improveresource utilization and avoid over provisioning. For a spiky workload, set up automatic scaling to meetuser and workload demand.
Suggestion 12.2.1 - Choose the right instance type based on workload pattern and growth ratio
Consider resource needs, such as CPU, memory, and networking, that meet the performancerequirements of your workload. Choose the right instance type and avoid over provisioning. Anoptimized EC2 instance runs your workloads with optimal performance and infrastructure cost. Forinstance, choose the smaller instance if your growth ratio is low as this allows more granular incrementalchange.
Suggestion 12.2.2 – Choose the right sizing based on average or medium workload usage
Right sizing is the process of matching instance types and sizes to your workload performance andcapacity requirements at the lowest possible cost. It’s also the process of looking at deployed instancesand identifying opportunities to downsize without compromising capacity or other requirements, whichwill result in lower costs.
Suggestion 12.2.3 - Use automatic scaling capability to meet the peak demand instead of overprovisioning
Many analytics system components can scale dynamically to meet demand. When possible, architectyour analytics system to use horizontal scaling instead of vertical scaling.
Best Practice 12.3 - Use On-Demand Instance capacity forunpredictable workload usageServerless solutions are either charged by the amount of data processed or the compute resourceused, but only when there is a workload actively running. Compare this approach to using long runninginfrastructure, but where you don’t need to pay for idle resources.
Suggestion 12.3.1 - Use Amazon Athena for ad hoc SQL workloads
Amazon Athena is a serverless query service that makes it easy to analyze data directly in Amazon S3using standard SQL. With Amazon Athena, you only pay for the queries that you run. You are chargedbased on the amount of data scanned per query.
Suggestion 12.3.2 - Use AWS Glue instead of Amazon EMR for infrequent ETL jobs
AWS Glue is a fully managed ETL (extract, transform, and load) service that makes it simple and cost-effective to categorize your data, clean it, enrich it, and move it reliably between various data storesand data streams. With AWS Glue jobs, you pay only for the resources used during the ETL process.In contrast, Amazon EMR is typically used for frequently running jobs requiring semi-persistent datastorage.
32
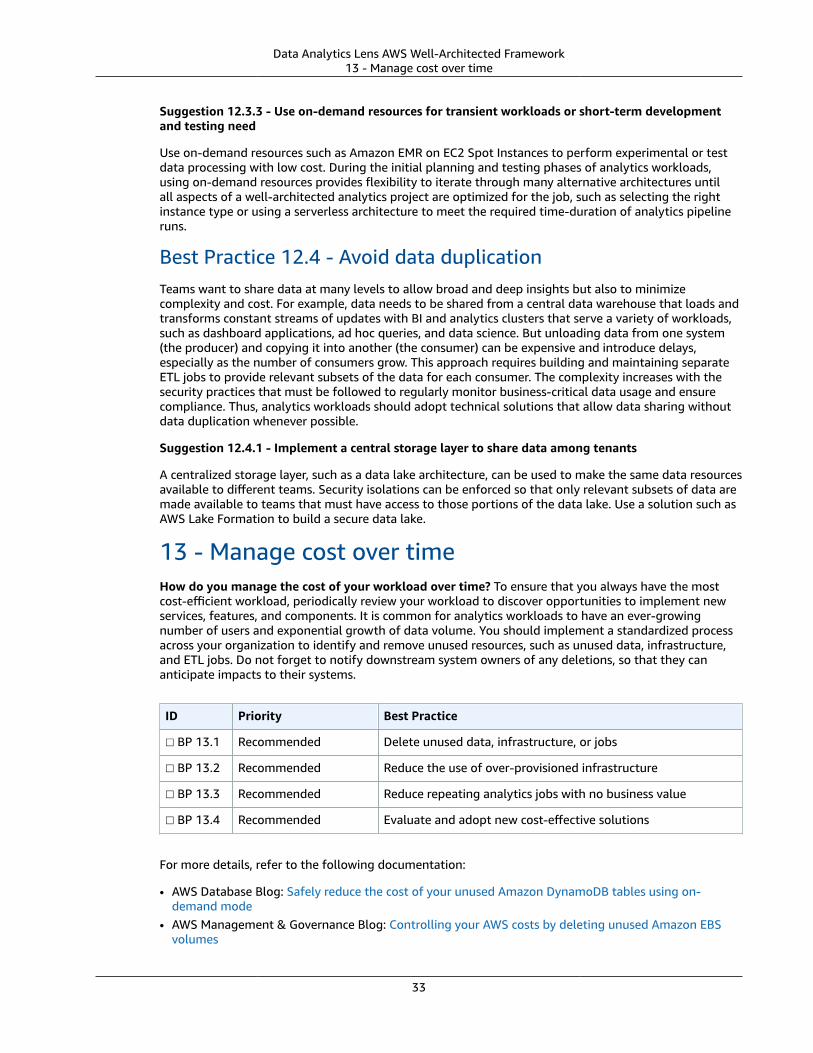
Data Analytics Lens AWS Well-Architected Framework13 - Manage cost over time
Suggestion 12.3.3 - Use on-demand resources for transient workloads or short-term developmentand testing need
Use on-demand resources such as Amazon EMR on EC2 Spot Instances to perform experimental or testdata processing with low cost. During the initial planning and testing phases of analytics workloads,using on-demand resources provides flexibility to iterate through many alternative architectures untilall aspects of a well-architected analytics project are optimized for the job, such as selecting the rightinstance type or using a serverless architecture to meet the required time-duration of analytics pipelineruns.
Best Practice 12.4 - Avoid data duplicationTeams want to share data at many levels to allow broad and deep insights but also to minimizecomplexity and cost. For example, data needs to be shared from a central data warehouse that loads andtransforms constant streams of updates with BI and analytics clusters that serve a variety of workloads,such as dashboard applications, ad hoc queries, and data science. But unloading data from one system(the producer) and copying it into another (the consumer) can be expensive and introduce delays,especially as the number of consumers grow. This approach requires building and maintaining separateETL jobs to provide relevant subsets of the data for each consumer. The complexity increases with thesecurity practices that must be followed to regularly monitor business-critical data usage and ensurecompliance. Thus, analytics workloads should adopt technical solutions that allow data sharing withoutdata duplication whenever possible.
Suggestion 12.4.1 - Implement a central storage layer to share data among tenants
A centralized storage layer, such as a data lake architecture, can be used to make the same data resourcesavailable to different teams. Security isolations can be enforced so that only relevant subsets of data aremade available to teams that must have access to those portions of the data lake. Use a solution such asAWS Lake Formation to build a secure data lake.
13 - Manage cost over timeHow do you manage the cost of your workload over time? To ensure that you always have the mostcost-efficient workload, periodically review your workload to discover opportunities to implement newservices, features, and components. It is common for analytics workloads to have an ever-growingnumber of users and exponential growth of data volume. You should implement a standardized processacross your organization to identify and remove unused resources, such as unused data, infrastructure,and ETL jobs. Do not forget to notify downstream system owners of any deletions, so that they cananticipate impacts to their systems.
ID Priority Best Practice
☐ BP 13.1 Recommended Delete unused data, infrastructure, or jobs
☐ BP 13.2 Recommended Reduce the use of over-provisioned infrastructure
☐ BP 13.3 Recommended Reduce repeating analytics jobs with no business value
☐ BP 13.4 Recommended Evaluate and adopt new cost-effective solutions
For more details, refer to the following documentation:
• AWS Database Blog: Safely reduce the cost of your unused Amazon DynamoDB tables using on-demand mode
• AWS Management & Governance Blog: Controlling your AWS costs by deleting unused Amazon EBSvolumes
33
Data Analytics Lens AWS Well-Architected Framework13 - Manage cost over time
• AWS Database Blog: Implementing DB Instance Stop and Start in Amazon RDS• AWS Big Data Blog: Lower your costs with the new pause and resume actions on Amazon Redshift• AWS Partner Network (APN) Blog: Scaling Laravel Jobs with AWS Batch and Amazon EventBridge• AWS Glue Developer Guide: Tracking Processed Data Using Job Bookmarks
Best Practice 13.1 - Delete unused data, infrastructure, or jobsDelete data that is out of its retention period, or not needed anymore. Delete intermediate-processeddata that can be removed without business impacts. If the output of analytics jobs is not used by anyone,consider removing such jobs so that you don't waste resources.
Suggestion 13.1.1 - Track data freshness
In many cases, maintaining a metadata repository for tracking data movement will be worthwhile, notonly to instill confidence in the quality of the data, but also to identify infrequently updated data, andunused data.
Suggestion 13.1.2 - Delete data that is out of its retention period
Data that is past its retention period should be deleted to reduce unnecessary storage costs. Identifydata through the metadata catalog that is outside its retention period. Automate the data removalprocess to reduce human effort. If data is stored in Amazon S3, use S3 lifecycle configurations toautomatically expire data.
Suggestion 13.1.3 - Delete intermediate-processed data that can be removed without businessimpacts
Many steps in analytics processes create intermediate or temporary datasets. Ensure intermediatedatasets are removed if they have no further business value.
Suggestion 13.1.4 - Delete unused analytics jobs that consume infrastructure resources but no oneuses the job results
Periodically review the ownership, source, and downstream consumers of all analytics infrastructureresources. If downstream consumers no longer need the analytics job, stop the job from running andremove unneeded resources.
Best Practice 13.2 - Reduce the use of over-provisionedinfrastructureWorkload resource utilization can change over time, especially after performance optimization. Youshould review resource usage patterns and determine if you still need the same infrastructure footprintto meet your business goals. Optimize your cost by removing the unneeded resources.
Suggestion 13.2.1 - Evaluate if compute resources can be downsized
Investigate your resource utilization by inspecting the metrics provided by Amazon CloudWatch. Evaluateif the resources can be downsized to one-level smaller within the same instance class, such as downsizingAmazon EMR cluster nodes from m5.16xlarge to m5.12xlarge .
Suggestion 13.2.2 - Move infrequently used data out of a data warehouse into a data lake
Data that is infrequently used can be moved from the data warehouse into the data lake to be queriedin place or joined with data in the warehouse. Use services such as Redshift Spectrum to query and joindata in the Amazon S3 data lake, or Amazon Athena to query data at rest in Amazon S3.
Suggestion 13.2.3 - Merge low utilization infrastructure resources
34
Data Analytics Lens AWS Well-Architected Framework13 - Manage cost over time
If you have several workloads that all have low-utilization resources, determine if you can combine thoseworkloads to run on shared infrastructure. In many cases, using a pooled resource model for analyticsworkloads will save on infrastructure costs.
Suggestion 13.2.4 - Move infrequently accessed data into low-cost storage tiers
When designing a data lake or data analytics project, considerations such as required access patterns,transaction concurrency, and acceptable transaction latency will influence where data is stored. It isequally important to consider how often previous data will be accessed, and to have a data lifecycleplan to migrate data tiers from hotter storage to colder, less-expensive storage, while still meeting allbusiness objectives.
Transitioning between storage tiers is achieved using Amazon S3 lifecycle policies, which automaticallytransitions objects into another tier with lower cost, or will even delete expired data. Amazon S3Intelligent-Tiering will analyze the data access patterns and automatically move objects between tiers.
Best practice 13.3 - Reduce repeating analytics jobs with nobusiness valueIt is a common human behavior to expect frequently refreshed data. However, the frequency of runninganalytics jobs should be considered in the context of its business value. There is no need to refresh datarepeatedly if the data is not used so frequently.
Suggestion 13.3.1 - Use the lowest acceptable frequency for data processing
Data processing requirements must be considered in the business context. There is no value in processingdata faster than it will be consumed or delivered. For example, in a sales analytics workload, it might notbe necessary to perform analytics on each transaction as it arrives when only hourly reports are neededby business management. In such a case, batch processing the transactions will be more efficient and canreduce unnecessary infrastructure costs between batch processing jobs.
Best Practice 13.4 - Evaluate and adopt new cost-effectivesolutionsAs AWS releases new services and features, it’s a best practice to review your existing architecturaldecisions to ensure that they remain cost effective. If a new or updated service can support the sameworkload but in a much cheaper way, consider implementing the change to reduce cost.
Suggestion 13.4.1 - Set service quotas to control resource usage
Some AWS services allow setting service quotas per account. Service quotas should be established toprevent runaway infrastructure deployment by accident. Ensure service quotas are set high enough tocover the expected peak usage.
Suggestion 13.4.2 – Pause and resume resources if the workload is not always required
Use automation to pause and resume resources when the resource is unneeded. For example, stopdevelopment and test Amazon RDS instances that are not used after working hours.
Suggestion 13.4.3 - Switch to a new service that is cheaper, for example, using Aurora Serverlessinstead of Amazon RDS
AWS is constantly adding new capabilities so you can leverage the latest technologies to experiment andinnovate more quickly. Review new service releases frequently to understand the price and performance,as well as the purpose the service when it was released.
• What's New with AWS?
35
Data Analytics Lens AWS Well-Architected Framework14 - Use optimal pricing models based
on infrastructure usage patterns
14 - Use optimal pricing models based oninfrastructure usage patternsHow do you choose the financially-optimal pricing models of the infrastructure? Consult with yourfinance team and choose optimal purchasing options. such as On-Demand Instances, Reserved Instances,or Spot Instances. Once you understand the infrastructure usage patterns of the analytics workload, youcan optimize the cost by purchasing reserved capacity with upfront payment, by using Spot Instances, orby paying Amazon EC2 usage via on-demand pricing models. Evaluate the available purchasing modelsof the analytics infrastructure of your choice and determine the optimal payment models.
ID Priority Best Practice
☐ BP 14.1 Recommended Evaluate the infrastructure usage patterns then choosepayment options accordingly
☐ BP 14.2 Recommended Consult with your finance team and determine optimalpayment models
For more details, refer to the following documentation:
• AWS Cloud Enterprise Strategy Blog: Managing Your Cost Savings with Amazon Reserved Instances• AWS Big Data Blog: How Goodreads offloads Amazon DynamoDB tables to Amazon S3 and queries
them using Amazon Athena• AWS Big Data Blog: Best practices for resizing and automatic scaling in Amazon EMR• AWS Big Data Blog: Work with partitioned data in AWS Glue• AWS Big Data Blog: Using Amazon Redshift Spectrum, Amazon Athena, and AWS Glue with Node.js in
Production• AWS Compute Blog: 10 things you can do today to reduce AWS costs• AWS Billing and Cost Management User Guide: Using Cost Allocation Tags• AWS Well-Architected Framework: Cost Optimization Pillar• AWS Whitepaper: Laying the Foundation: Setting Up Your Environment for Cost Optimization• AWS Whitepaper: Amazon EC2 Reserved Instances and Other AWS Reservation Models• AWS Whitepaper: Overview of Amazon EC2 Spot Instances• AWS Whitepaper: Right Sizing: Provisioning Instances to Match Workloads• AWS Whitepaper: AWS Storage Optimization
Best Practice 14.1 - Evaluate the infrastructure usage patterns,then choose your payment options accordinglyOn-demand resources provides immense flexibility with pay-as-you-go payment models across multiplescenarios and scales. On the other hand, Reserved Instances provide significant cost saving for workloadsthat have steady resource utilization. Perform regular workload resource usage analysis. Choose thebest pricing model to ensure that you don’t miss cost optimization opportunities and maximize yourdiscounts.
Suggestion 14.1.1 - Evaluate available payment options of the infrastructure resources of your choice
Review the pricing page for specific AWS services. Each service will list the billing metrics, such asruntime or gigabytes processed, as well as any discount options for dedicated usage. In addition, manyAWS analytics services offer discounted payment terms, Reserved Instances or Savings Plans, in exchange
36
Data Analytics Lens AWS Well-Architected Framework14 - Use optimal pricing models based
on infrastructure usage patterns
for a specific usage commitment. Almost all AWS services offer the payment for usage On-Demand,meaning you only pay for what you used.
Suggestion 14.1.2 - For steady, permanent workloads, obtain Reserved Instances or Savings Plansprice discounts instead of paying on-demand pricing
Reserved Instances give you the option to reserve some AWS resources for a one- or three-year term andin turn receive a significant discount compared to the On-Demand Instance pricing. Workloads that haveconsistent long-term usage are good candidates for the Reserved Instance payment option.
Suggestion 14.1.3 - Use on-demand resources during development and in pre-productionenvironments
Development and pre-production environments frequently change and often do not need to be alwaysavailable. In cases where utilization is unpredictable, frequently changed, or only used for portions of theday, on-demand resources are the best option.
Best Practice 14.2 - Consult with your finance team anddetermine optimal payment modelsIf you use reserved-capacity pricing options, you can reduce the infrastructure cost without modifyingyour workload architectures. Collaborate with your finance team on the planning and use of purchasediscounts. Make informed decisions regarding various factors, such as the amount of capacity to reserve,reserve term length, and the choice of upfront payments for their corresponding discount rates. Thefinance team should assist your team in determining the best long-term and reserved-capacity pricingoptions, because it affects your IT budget plans, such as which month is the right moment to pay anupfront charge.
Suggestion 14.2.1 - Consolidate the infrastructure usage to maximize the coverage of reservedcapacity price options
Reserved Instances and Savings Plans purchases apply automatically to the resources that will receive thelargest discount benefit. To maximize your discount utilization, consolidate resources in accounts withinan AWS Organization structure. Allow the purchase commitments to apply to other AWS accounts withinthe Organization if they are unused in the account in which they are purchased.
37
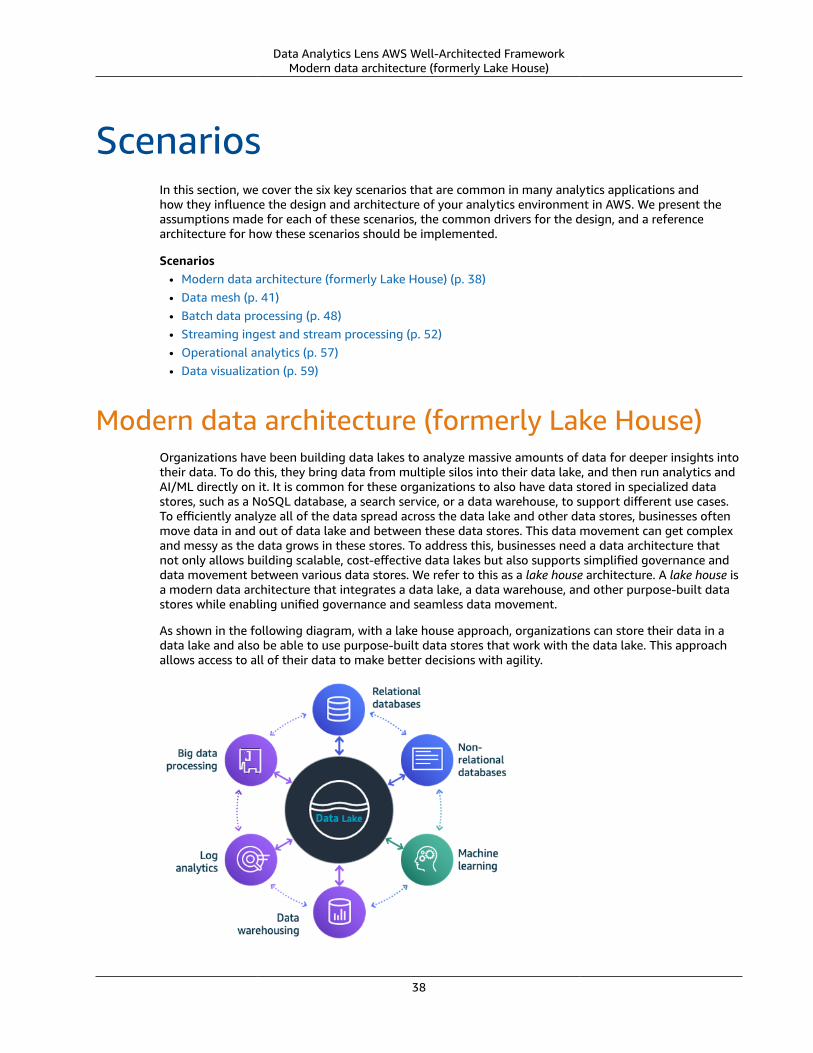
Data Analytics Lens AWS Well-Architected FrameworkModern data architecture (formerly Lake House)
ScenariosIn this section, we cover the six key scenarios that are common in many analytics applications andhow they influence the design and architecture of your analytics environment in AWS. We present theassumptions made for each of these scenarios, the common drivers for the design, and a referencearchitecture for how these scenarios should be implemented.
Scenarios• Modern data architecture (formerly Lake House) (p. 38)• Data mesh (p. 41)• Batch data processing (p. 48)• Streaming ingest and stream processing (p. 52)• Operational analytics (p. 57)• Data visualization (p. 59)
Modern data architecture (formerly Lake House)Organizations have been building data lakes to analyze massive amounts of data for deeper insights intotheir data. To do this, they bring data from multiple silos into their data lake, and then run analytics andAI/ML directly on it. It is common for these organizations to also have data stored in specialized datastores, such as a NoSQL database, a search service, or a data warehouse, to support different use cases.To efficiently analyze all of the data spread across the data lake and other data stores, businesses oftenmove data in and out of data lake and between these data stores. This data movement can get complexand messy as the data grows in these stores. To address this, businesses need a data architecture thatnot only allows building scalable, cost-effective data lakes but also supports simplified governance anddata movement between various data stores. We refer to this as a lake house architecture. A lake house isa modern data architecture that integrates a data lake, a data warehouse, and other purpose-built datastores while enabling unified governance and seamless data movement.
As shown in the following diagram, with a lake house approach, organizations can store their data in adata lake and also be able to use purpose-built data stores that work with the data lake. This approachallows access to all of their data to make better decisions with agility.
38
Data Analytics Lens AWS Well-Architected FrameworkCharacteristics
Modern data architecture
In a lake house design, there are three different patterns for data movement. They can be described asfollows:
Inside-out data movement: A subset of data in a data lake is sometimes moved to a data store, such asan Amazon OpenSearch Service cluster or an Amazon Neptune cluster, to support specialized analytics,such as search analytics, building knowledge graphs, or both. This pattern is what we consider an inside-out data movement. For example, enterprises send information from structured sources (relationaldatabases), unstructured sources (metadata, media, or spreadsheets) and other assets first to a data lakethat is moved to Amazon Neptune to build a knowledge graph.
Outside-in data movement: Organizations use data stores that best fit their applications and later movethat data into a data lake for analytics. For instance, to maintain game state, player data, session history,and leaderboards, a gaming company right chooses Amazon DynamoDB as the data store. This data canlater be exported to a data lake for additional analytics to improve the gaming experience for its players.We refer to this kind of data movement as outside-in.
Around the perimeter: In addition to the preceding two patterns, there are scenarios where the data ismoved from one specialized data store to another. For example, enterprises might copy customer profiledata from their relational database to a NoSQL database to support their reporting dashboards. Thisdata movement is often considered as around the perimeter.
CharacteristicsScalable data lake: A data lake is at the center of a well-architected lake house design. A data lakeshould be able to scale easily to petabytes and exabytes as data grows. Use a scalable, durable data storethat provides the fastest performance at the lowest cost, supports multiple ways to bring data in and hasa good partner ecosystem.
Data diversity: Applications generate data in many formats. A data lake should support diverse datatypes — structured, semi-structured, or unstructured.
Schema management: A lake house design should support schema on read for a data lake with nostrict source data requirement. The choice of storage structure, schema, ingestion frequency, and dataquality should be left to the data producer. A data lake should also be able to incorporate changesto the structure of the incoming data, which is referred to as schema evolution. In addition, schemaenforcement helps businesses ensure data quality by preventing writes that do not match the schema.
Metadata management: Data should be self-discoverable with the ability to track lineage as dataflows through tiers within the data lake. A comprehensive data catalog that captures the metadata andprovides a query-able interface for all data assets is recommended.
Unified governance: A lake house design should have a robust mechanism for centralized authorizationand auditing. Configuring access policies in the data lake and across all the data stores can be extremelycomplex and error prone. Having a centralized location to define the policies and enforce them is criticalto a secure lake house architecture.
Transactional semantics: In a data lake, data is often ingested nearly continuously from multiple sourcesand is queried concurrently by multiple analytic engines. Having atomic, consistent, isolated, and durable(ACID) transactions is pivotal to keeping data consistent.
Reference architecture
39
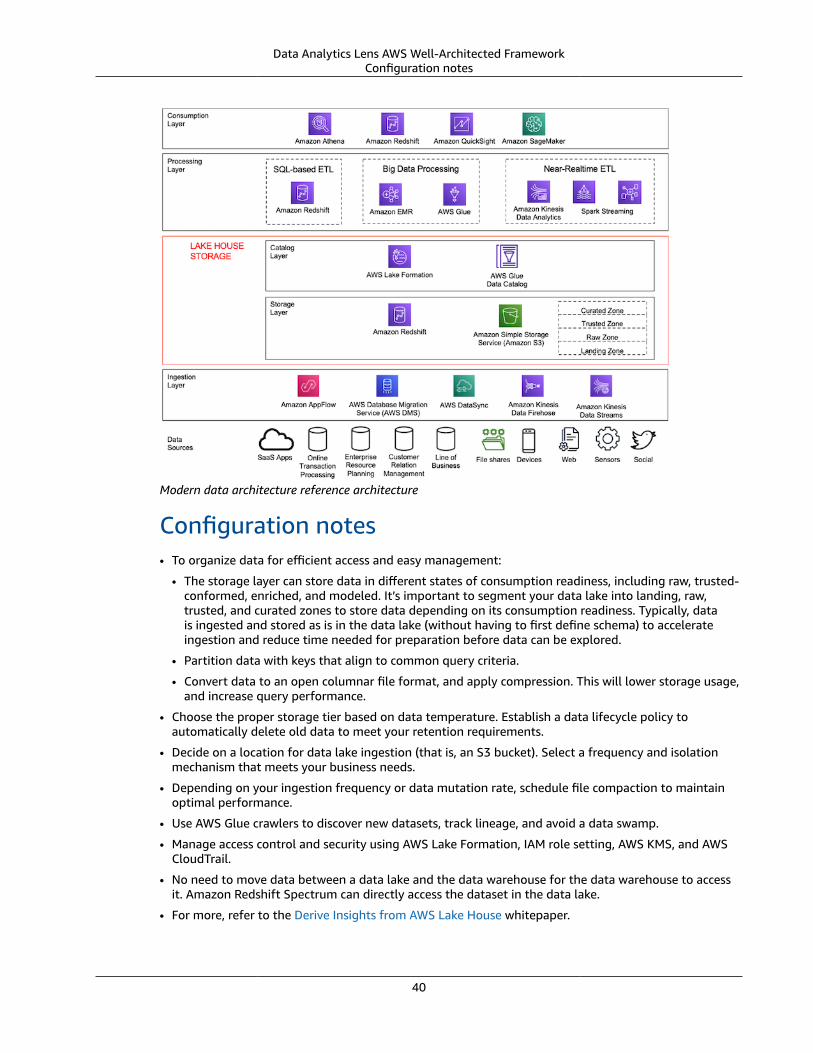
Data Analytics Lens AWS Well-Architected FrameworkConfiguration notes
Modern data architecture reference architecture
Configuration notes• To organize data for efficient access and easy management:
• The storage layer can store data in different states of consumption readiness, including raw, trusted-conformed, enriched, and modeled. It’s important to segment your data lake into landing, raw,trusted, and curated zones to store data depending on its consumption readiness. Typically, datais ingested and stored as is in the data lake (without having to first define schema) to accelerateingestion and reduce time needed for preparation before data can be explored.
• Partition data with keys that align to common query criteria.
• Convert data to an open columnar file format, and apply compression. This will lower storage usage,and increase query performance.
• Choose the proper storage tier based on data temperature. Establish a data lifecycle policy toautomatically delete old data to meet your retention requirements.
• Decide on a location for data lake ingestion (that is, an S3 bucket). Select a frequency and isolationmechanism that meets your business needs.
• Depending on your ingestion frequency or data mutation rate, schedule file compaction to maintainoptimal performance.
• Use AWS Glue crawlers to discover new datasets, track lineage, and avoid a data swamp.
• Manage access control and security using AWS Lake Formation, IAM role setting, AWS KMS, and AWSCloudTrail.
• No need to move data between a data lake and the data warehouse for the data warehouse to accessit. Amazon Redshift Spectrum can directly access the dataset in the data lake.
• For more, refer to the Derive Insights from AWS Lake House whitepaper.
40
Data Analytics Lens AWS Well-Architected FrameworkData mesh
Data meshOrganizations of all sizes have recognized that data is one of the key factors for increasing andsustaining innovation, and driving value for their customers and business units. They are modernizingtraditional data platforms with cloud-native technologies that are highly scalable, feature-rich, and cost-effective. As you look to make business decisions driven by data, you can be agile and productive byadopting a mindset that delivers data products from specialized teams, rather than through a centralizeddata management platform that provides generalized analytics.
A centralized model simplifies staffing and training by centralizing data and technical expertise in asingle place. This reduces technical debt since you are managing a single data platform, which reducesoperational costs. Data platform groups, often part of central IT, are divided into teams based on thetechnical functions they support. For instance, one team might own the ingestion technologies usedto collect data from numerous data sources managed by other teams and lines of business (LOBs). Adifferent team might own the data pipelines, the writing and debugging extract, transform, and load(ETL) code, and orchestrating job runs, while validating and fixing data quality issues and ensuringthat data processing meets business SLAs. However, managing data through a central data platformcan create scaling, ownership, and accountability challenges. Central teams might not understand thespecific needs of a data domain, due to data types and storage, security, data catalog requirements, orthe specific technologies needed for data processing.
You can often reduce these challenges by giving ownership and autonomy to the team who owns thedata. This allows them to focus on building data products, rather than being limited to a common centraldata platform. For example, make product teams responsible for ensuring that the product inventoryis updated regularly with new products and changes to existing ones. They’re the domain experts ofthe product inventory datasets, and if a discrepancy occurs, they’re the ones who know how to fix it.Therefore, they’re best able to implement and operate a technical solution to ingest, process, andproduce the product inventory dataset. They own everything leading up to the data being consumed:they choose the technology stack, operate in the mindset of data as a product, enforce security andauditing, and provide a mechanism to expose the data to the organization in an easy-to-consume way.This reduces overall friction for information flow in the organization, where the producer is responsiblefor the datasets they produce and is accountable to the consumer based on the advertised SLAs.
This data-as-a-product paradigm is similar to the operating model that Amazon uses for buildingservices. Service teams build their services, expose APIs with advertised SLAs, operate their services,and own the end-to-end customer experience. This is distinct from the model where one team buildsthe software, and a different team operates it. The end-to-end ownership model has allowed us toimplement faster, with higher efficiency, and to quickly scale to meet customers’ use cases. We aren’tlimited by centralized teams and their ability to scale to meet the demands of the business. Each servicewe build relies on other services that provide the building blocks. The analogy to this approach in thedata world would be the data producers owning the end-to-end implementation and serving of dataproducts, using the technologies they selected based on their unique needs. At AWS, we have beentalking about the data-driven organization model for years, which consists of data producers andconsumers. This model is similar to those used by some of our customers and has been described byZhamak Dehghani of Thoughtworks, who coined the term data mesh .
Characteristics• Data mesh is a pattern for defining how organizations can organize around data domains with a focus
on delivering data as a product. However, it might not be the right pattern for every customer.• A lake house approach and the data lake architecture provide technical guidance and solutions for
building a modern data platform on AWS.• The lake house approach with a foundational data lake serves as a repeatable blueprint for
implementing data domains and products in a scalable way.• The manner in which you use AWS analytics services in a data mesh pattern might change over time,
but remains consistent with the technological recommendations and best practices for each service.
41
Data Analytics Lens AWS Well-Architected FrameworkCharacteristics
The following are data mesh design goals:
• Data as a product – Each organizational domain owns their data end to end. They’re responsible forbuilding, operating, serving, and resolving any issues arising from the use of their data. Data accuracyand accountability lies with the data owner within the domain.
• Federated data governance – Data governance helps ensure that data is secure, accurate, and notmisused. The technical implementation of data governance, such as collecting lineage, validatingdata quality, encrypting data at rest and in transit, and enforcing appropriate access controls, can bemanaged by each of the data domains. However, central data discovery, reporting, and auditing isneeded to make it easy for users to find data, and for auditors to verify compliance.
• Common access – Data must be easily consumable by subject matter experts, such as data analystsand data scientists, and by purpose-built analytics and machine learning (ML) services, such as AmazonAthena, Amazon Redshift, and Amazon SageMaker. This requires data domains to expose a set ofinterfaces that make data consumable while enforcing appropriate access controls and audit tracking.
The following are user experience considerations:
• Data teams own their information lifecycle, from the application that creates the original data, to theanalytics systems that extract and create business reports and predictions. Through this lifecycle, theyown the data model, and determine which datasets are suitable for publication to consumers.
• Data domain producers expose datasets to the rest of the organization by registering them with acentral catalog. They can choose what to share, for how long, and how consumers can interact withthem. They’re also responsible for maintaining the data and making sure it’s accurate and current.
• Data domain consumers and individual users should be given access to data through a supportedinterface, such as a data API, that helps ensure consistent performance, tracking, and access controls.
• All data assets are easily discoverable from a single central data catalog. The data catalog contains thedatasets registered by data domain producers, including supporting metadata, such as lineage, dataquality metrics, ownership information, and business context.
• All actions taken with data, usage patterns, data transformations, and data classifications should beaccessible through a single, central place. Data owners, administrators, and auditors should be able toinspect an organization’s data compliance posture in a single place.
Let’s start with a high-level reference design that builds on top of the data mesh pattern. It furtherseparates consumers, producers, and central governance to highlight the key aspects discussedpreviously. However, note that a data domain, in a data mesh pattern, might represent a data consumer,a data producer, or both.
The AWS Lake House architecture relies on an AWS Glue and AWS Lake Formation Data Catalog for usersto access the objects as tables. The users are entitled to these tables using Lake Formation, which is oneper AWS account. Each Lake Formation account has its own Data Catalog, but storing the metadata onthe data objects on multiple accounts across various catalogs makes it hard for the consumers to selectthe table. A consumer has to log into individual accounts to see the objects, assuming that the consumerknows exactly where to look. A central catalog also makes it easy to feed into a central business catalogand allows easier auditing of grants or revokes (it just makes it easier; it does not provide a single storeof audits). Therefore, a central Data Catalog is recommended.
The metadata being on the central catalog does not make the tables in individual lakes accessible to allthe consumers automatically. The actual entitlement on tables is individually granted and revoked by theapplication owner.
This allows the data mesh objective of the data strategy where the data is stored in multiple individuallymanaged lakes, as opposed to a single central lake, while being accessible, provided properly entitled, toall the consumers. The role of the Data Catalog is of paramount importance here as the consumers canlocate the proper storage of the data, they are interested in.
42
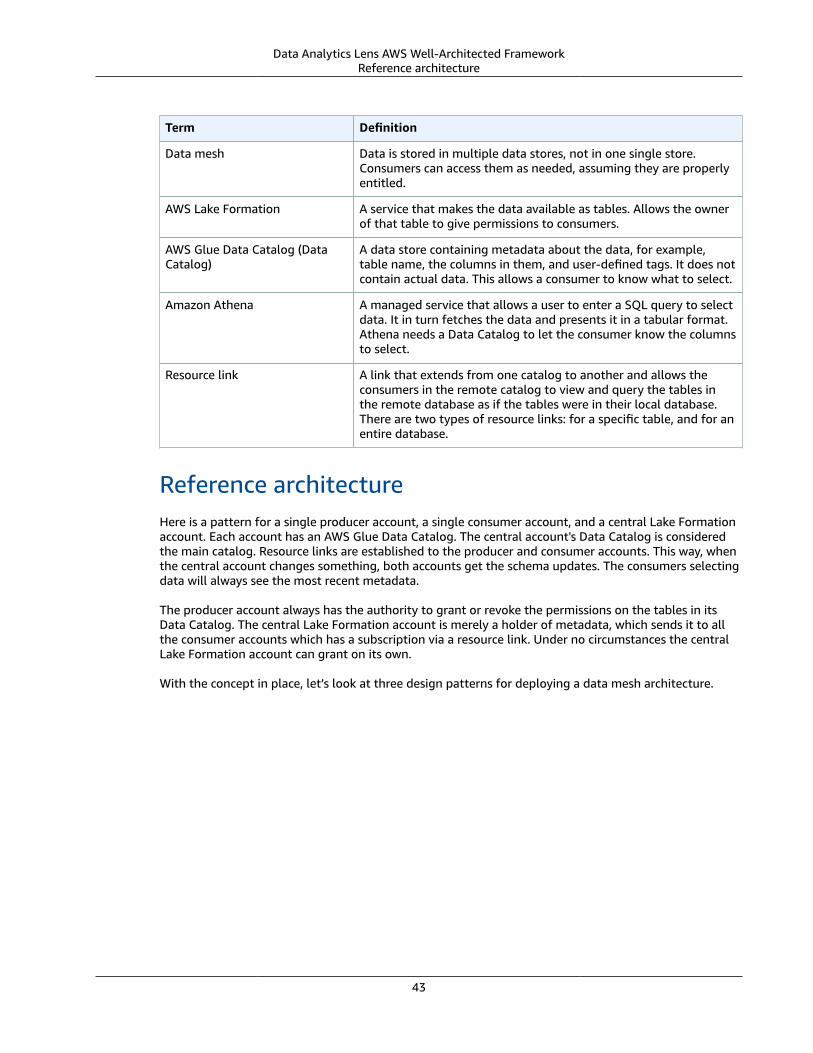
Data Analytics Lens AWS Well-Architected FrameworkReference architecture
Term Definition
Data mesh Data is stored in multiple data stores, not in one single store.Consumers can access them as needed, assuming they are properlyentitled.
AWS Lake Formation A service that makes the data available as tables. Allows the ownerof that table to give permissions to consumers.
AWS Glue Data Catalog (DataCatalog)
A data store containing metadata about the data, for example,table name, the columns in them, and user-defined tags. It does notcontain actual data. This allows a consumer to know what to select.
Amazon Athena A managed service that allows a user to enter a SQL query to selectdata. It in turn fetches the data and presents it in a tabular format.Athena needs a Data Catalog to let the consumer know the columnsto select.
Resource link A link that extends from one catalog to another and allows theconsumers in the remote catalog to view and query the tables inthe remote database as if the tables were in their local database.There are two types of resource links: for a specific table, and for anentire database.
Reference architectureHere is a pattern for a single producer account, a single consumer account, and a central Lake Formationaccount. Each account has an AWS Glue Data Catalog. The central account's Data Catalog is consideredthe main catalog. Resource links are established to the producer and consumer accounts. This way, whenthe central account changes something, both accounts get the schema updates. The consumers selectingdata will always see the most recent metadata.
The producer account always has the authority to grant or revoke the permissions on the tables in itsData Catalog. The central Lake Formation account is merely a holder of metadata, which sends it to allthe consumer accounts which has a subscription via a resource link. Under no circumstances the centralLake Formation account can grant on its own.
With the concept in place, let’s look at three design patterns for deploying a data mesh architecture.
43
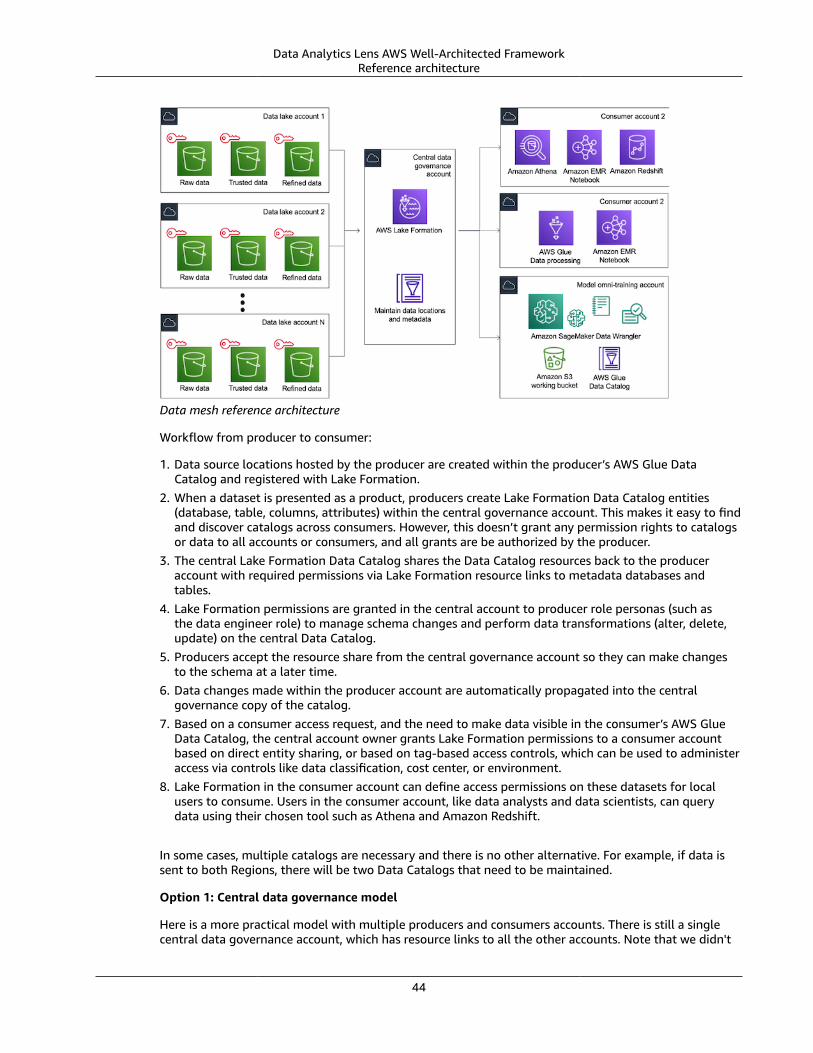
Data Analytics Lens AWS Well-Architected FrameworkReference architecture
Data mesh reference architecture
Workflow from producer to consumer:
1. Data source locations hosted by the producer are created within the producer’s AWS Glue DataCatalog and registered with Lake Formation.
2. When a dataset is presented as a product, producers create Lake Formation Data Catalog entities(database, table, columns, attributes) within the central governance account. This makes it easy to findand discover catalogs across consumers. However, this doesn’t grant any permission rights to catalogsor data to all accounts or consumers, and all grants are be authorized by the producer.
3. The central Lake Formation Data Catalog shares the Data Catalog resources back to the produceraccount with required permissions via Lake Formation resource links to metadata databases andtables.
4. Lake Formation permissions are granted in the central account to producer role personas (such asthe data engineer role) to manage schema changes and perform data transformations (alter, delete,update) on the central Data Catalog.
5. Producers accept the resource share from the central governance account so they can make changesto the schema at a later time.
6. Data changes made within the producer account are automatically propagated into the centralgovernance copy of the catalog.
7. Based on a consumer access request, and the need to make data visible in the consumer’s AWS GlueData Catalog, the central account owner grants Lake Formation permissions to a consumer accountbased on direct entity sharing, or based on tag-based access controls, which can be used to administeraccess via controls like data classification, cost center, or environment.
8. Lake Formation in the consumer account can define access permissions on these datasets for localusers to consume. Users in the consumer account, like data analysts and data scientists, can querydata using their chosen tool such as Athena and Amazon Redshift.
In some cases, multiple catalogs are necessary and there is no other alternative. For example, if data issent to both Regions, there will be two Data Catalogs that need to be maintained.
Option 1: Central data governance model
Here is a more practical model with multiple producers and consumers accounts. There is still a singlecentral data governance account, which has resource links to all the other accounts. Note that we didn't
44
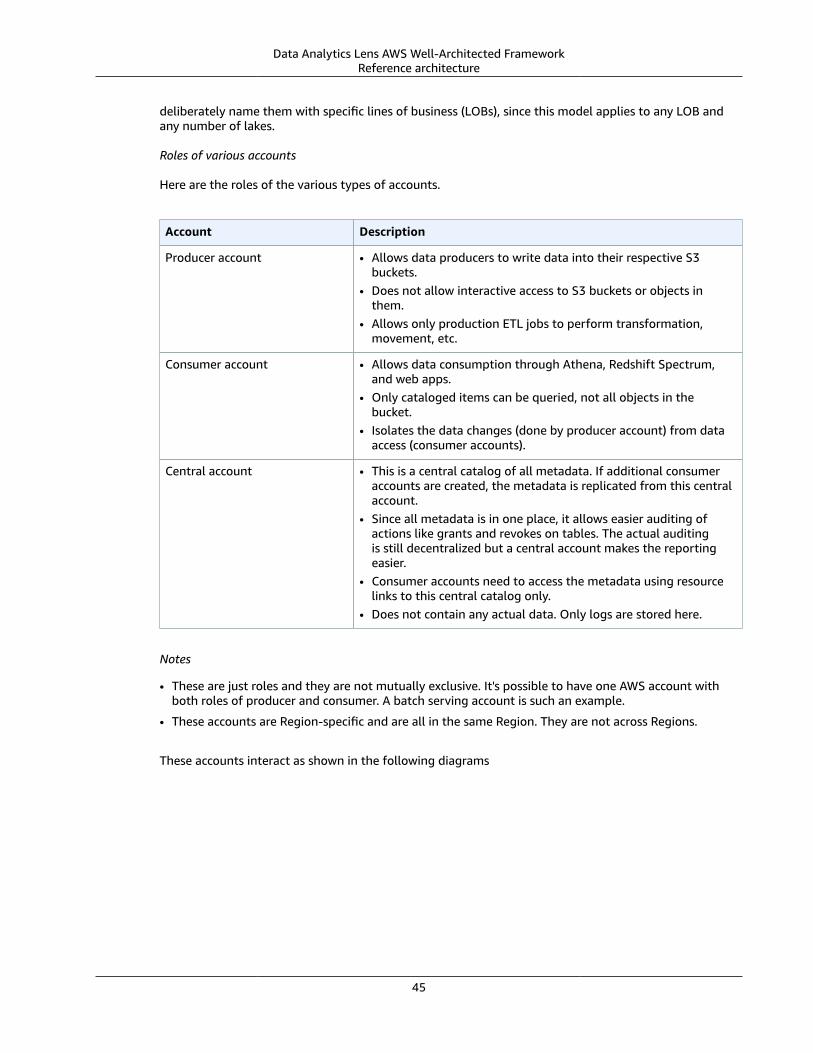
Data Analytics Lens AWS Well-Architected FrameworkReference architecture
deliberately name them with specific lines of business (LOBs), since this model applies to any LOB andany number of lakes.
Roles of various accounts
Here are the roles of the various types of accounts.
Account Description
Producer account • Allows data producers to write data into their respective S3buckets.
• Does not allow interactive access to S3 buckets or objects inthem.
• Allows only production ETL jobs to perform transformation,movement, etc.
Consumer account • Allows data consumption through Athena, Redshift Spectrum,and web apps.
• Only cataloged items can be queried, not all objects in thebucket.
• Isolates the data changes (done by producer account) from dataaccess (consumer accounts).
Central account • This is a central catalog of all metadata. If additional consumeraccounts are created, the metadata is replicated from this centralaccount.
• Since all metadata is in one place, it allows easier auditing ofactions like grants and revokes on tables. The actual auditingis still decentralized but a central account makes the reportingeasier.
• Consumer accounts need to access the metadata using resourcelinks to this central catalog only.
• Does not contain any actual data. Only logs are stored here.
Notes
• These are just roles and they are not mutually exclusive. It's possible to have one AWS account withboth roles of producer and consumer. A batch serving account is such an example.
• These accounts are Region-specific and are all in the same Region. They are not across Regions.
These accounts interact as shown in the following diagrams
45
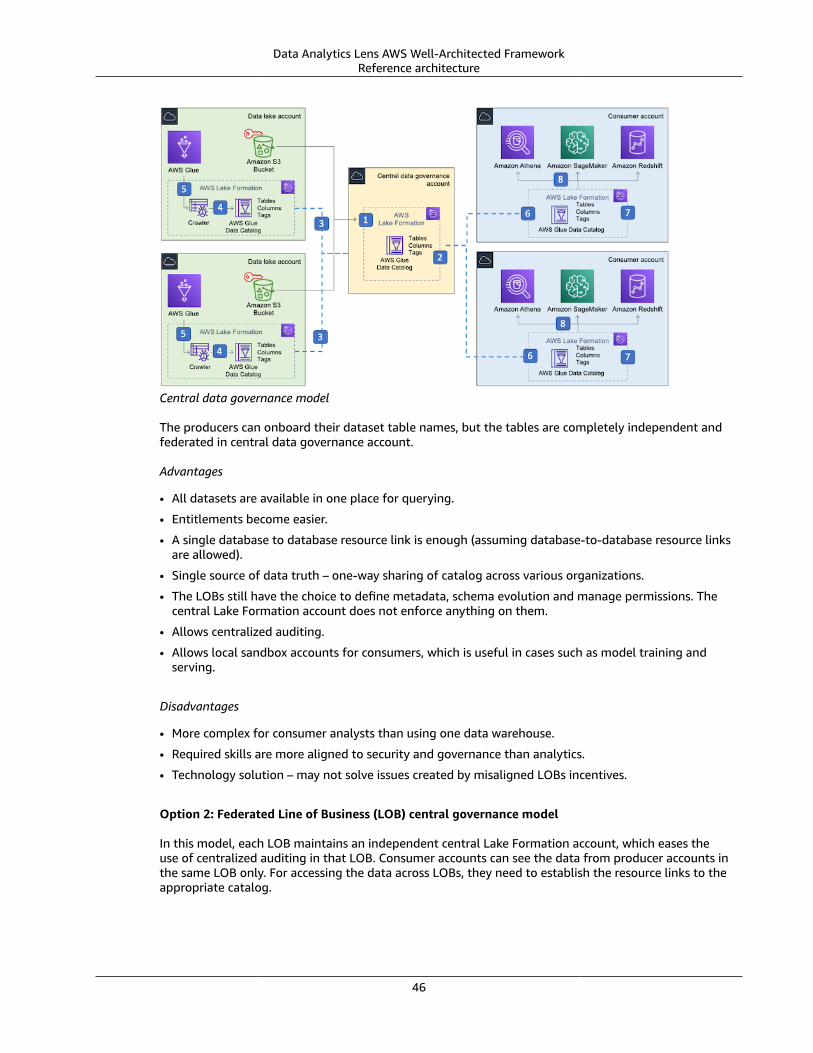
Data Analytics Lens AWS Well-Architected FrameworkReference architecture
Central data governance model
The producers can onboard their dataset table names, but the tables are completely independent andfederated in central data governance account.
Advantages
• All datasets are available in one place for querying.
• Entitlements become easier.
• A single database to database resource link is enough (assuming database-to-database resource linksare allowed).
• Single source of data truth – one-way sharing of catalog across various organizations.
• The LOBs still have the choice to define metadata, schema evolution and manage permissions. Thecentral Lake Formation account does not enforce anything on them.
• Allows centralized auditing.
• Allows local sandbox accounts for consumers, which is useful in cases such as model training andserving.
Disadvantages
• More complex for consumer analysts than using one data warehouse.
• Required skills are more aligned to security and governance than analytics.
• Technology solution – may not solve issues created by misaligned LOBs incentives.
Option 2: Federated Line of Business (LOB) central governance model
In this model, each LOB maintains an independent central Lake Formation account, which eases theuse of centralized auditing in that LOB. Consumer accounts can see the data from producer accounts inthe same LOB only. For accessing the data across LOBs, they need to establish the resource links to theappropriate catalog.
46
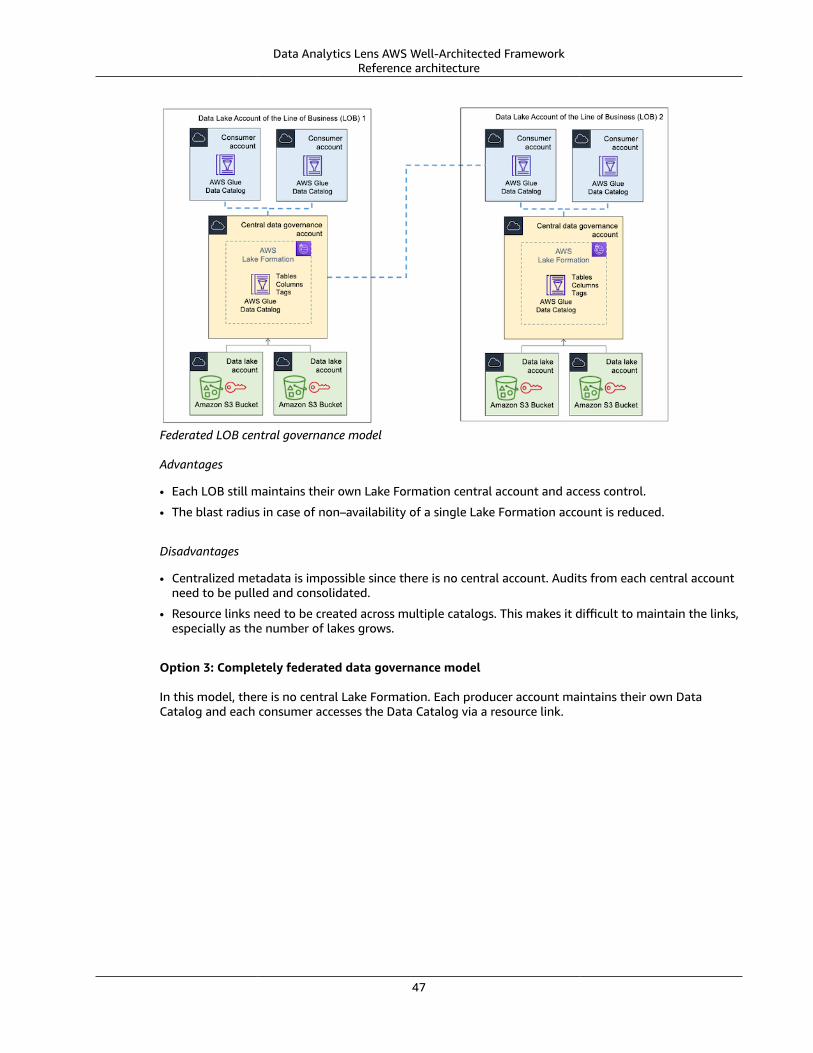
Data Analytics Lens AWS Well-Architected FrameworkReference architecture
Federated LOB central governance model
Advantages
• Each LOB still maintains their own Lake Formation central account and access control.
• The blast radius in case of non–availability of a single Lake Formation account is reduced.
Disadvantages
• Centralized metadata is impossible since there is no central account. Audits from each central accountneed to be pulled and consolidated.
• Resource links need to be created across multiple catalogs. This makes it difficult to maintain the links,especially as the number of lakes grows.
Option 3: Completely federated data governance model
In this model, there is no central Lake Formation. Each producer account maintains their own DataCatalog and each consumer accesses the Data Catalog via a resource link.
47
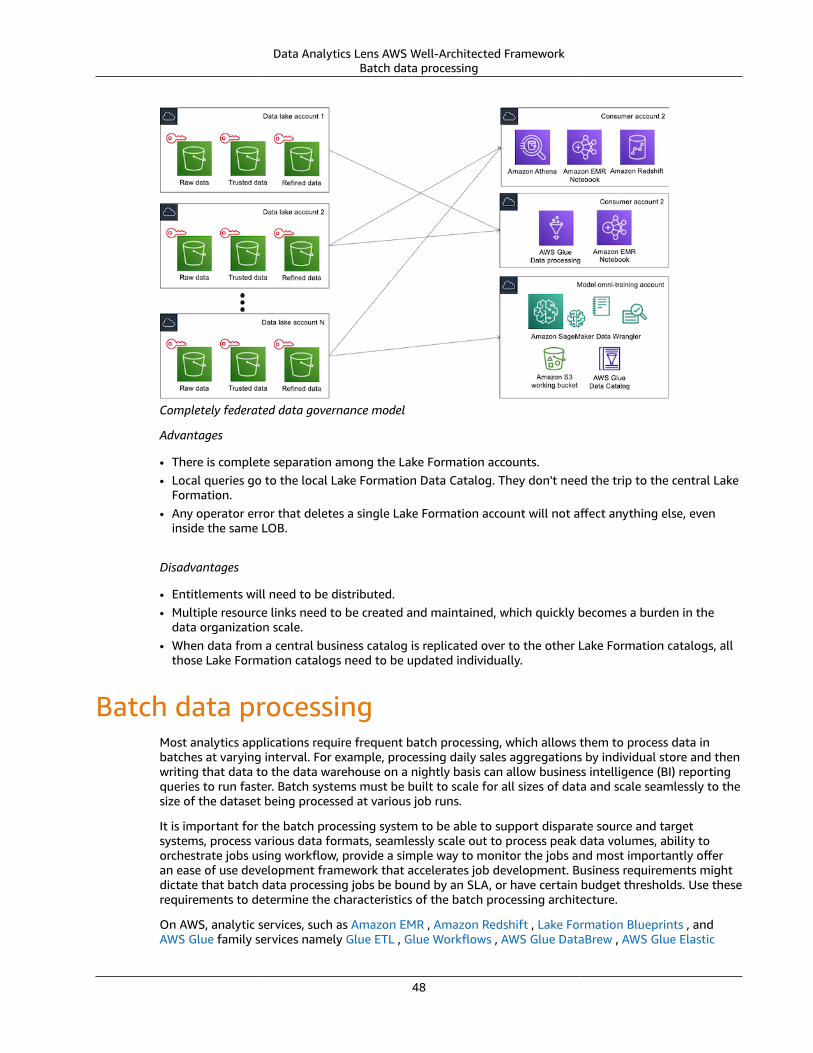
Data Analytics Lens AWS Well-Architected FrameworkBatch data processing
Completely federated data governance model
Advantages
• There is complete separation among the Lake Formation accounts.• Local queries go to the local Lake Formation Data Catalog. They don't need the trip to the central Lake
Formation.• Any operator error that deletes a single Lake Formation account will not affect anything else, even
inside the same LOB.
Disadvantages
• Entitlements will need to be distributed.• Multiple resource links need to be created and maintained, which quickly becomes a burden in the
data organization scale.• When data from a central business catalog is replicated over to the other Lake Formation catalogs, all
those Lake Formation catalogs need to be updated individually.
Batch data processingMost analytics applications require frequent batch processing, which allows them to process data inbatches at varying interval. For example, processing daily sales aggregations by individual store and thenwriting that data to the data warehouse on a nightly basis can allow business intelligence (BI) reportingqueries to run faster. Batch systems must be built to scale for all sizes of data and scale seamlessly to thesize of the dataset being processed at various job runs.
It is important for the batch processing system to be able to support disparate source and targetsystems, process various data formats, seamlessly scale out to process peak data volumes, ability toorchestrate jobs using workflow, provide a simple way to monitor the jobs and most importantly offeran ease of use development framework that accelerates job development. Business requirements mightdictate that batch data processing jobs be bound by an SLA, or have certain budget thresholds. Use theserequirements to determine the characteristics of the batch processing architecture.
On AWS, analytic services, such as Amazon EMR , Amazon Redshift , Lake Formation Blueprints , andAWS Glue family services namely Glue ETL , Glue Workflows , AWS Glue DataBrew , AWS Glue Elastic
48
Data Analytics Lens AWS Well-Architected FrameworkCharacteristics
Views allow you to run batch data processing jobs at scale for all batch data processing use cases andfor various personas, such as data engineer, data analyst, and data scientists. While there are someoverlapping capabilities between these services, knowing the core competencies and when to use whichservice or services allow you to accomplish your objectives in the most effective way.
CharacteristicsFollowing are the key characteristics that determine how you should plan when developing a batchprocessing architecture.
Ease of use development framework: This is one of the most important characteristics that truly allowspersonas of ETL developers and data engineers, data analysts, and data scientists to improve theiroverall efficiencies. An ETL developer benefits from a hybrid development interface that helps them touse the best of both—developing part of their job and switching to writing customized complex codewhere applicable. Data analysts and data scientists spend a lot of their time preparing data for actualanalysis, or capturing feature engineering data for their machine learning models. You can improve theirefficiencies in data preparation by adopting a no-code data preparation interface which helps them tonormalize and clean data up to 80% faster compared to traditional approached to data preparation.
Support disparate source and target systems: Your batch processing system should have the ability tosupport various different types of data sources and targets between relational, semi-structured, non-relational, and SaaS providers. When operating in the cloud, a connector ecosystem can benefit you byseamlessly connecting to various sources and targets, and can simplify your job development.
Support various data file formats: Some of the commonly seen data formats are CSV, Excel, JSON,Apache Parquet, Apache ORC, XML, and Logstash Grok. Your job development can be acceleratedand simplified if the batch processing services can natively profile these various file formats, inferschema automatically (including complex nested structures) so that you can focus more on buildingtransformations.
Seamlessly scale out to process peak data volumes: Most batch processing jobs experience varying datavolumes. Your batch processing job should have the ability to scale out to handle peak data spikes andscale back in when the job completes.
Simplified job orchestration with job bookmarking capability: The ability to develop job orchestrationwith dependency management, and the ability to author the workflow using API, CLI, and a graphicaluser interface allows for a robust CI/CD integration.
Ability to monitor and alert on job failure: This is an important measure for ease of operationalmanagement. Having quick and easy access to job logs, and a graphical monitoring interface to accessjob metrics can quickly help you identify errors and tuning opportunities for your job. Coupling that withan event-driven approach to alert on job failure will be invaluable for easing operational management.
Provide a low-cost solution: Costs can quickly get out of control if you do not plan correctly. A pay asyou go pricing model for both compute and authoring jobs can help you overcome hefty costs upfrontand allows you to only pay for what you use instead of overpaying to accommodate for peak workloads.Use automatic scaling to accommodate spiky workloads when necessary. Using Spot Instances whereapplicable can bring your costs down for workloads where they are a good fit.
Reference architecture
49
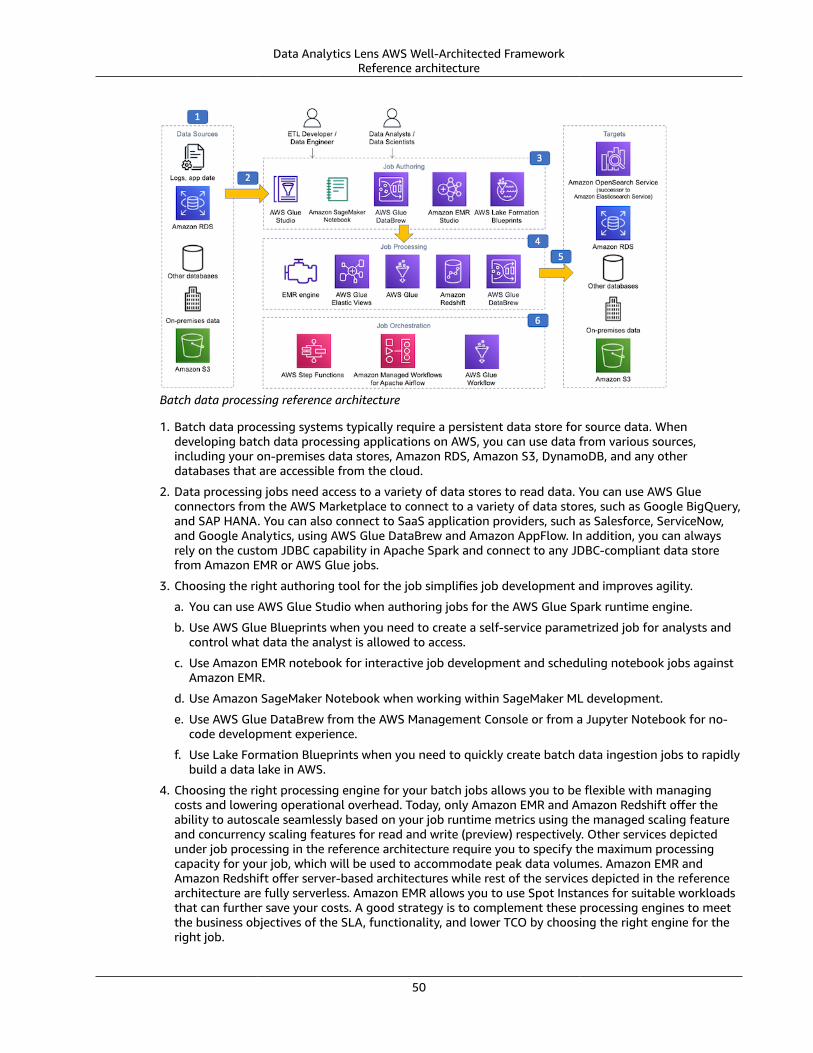
Data Analytics Lens AWS Well-Architected FrameworkReference architecture
Batch data processing reference architecture
1. Batch data processing systems typically require a persistent data store for source data. Whendeveloping batch data processing applications on AWS, you can use data from various sources,including your on-premises data stores, Amazon RDS, Amazon S3, DynamoDB, and any otherdatabases that are accessible from the cloud.
2. Data processing jobs need access to a variety of data stores to read data. You can use AWS Glueconnectors from the AWS Marketplace to connect to a variety of data stores, such as Google BigQuery,and SAP HANA. You can also connect to SaaS application providers, such as Salesforce, ServiceNow,and Google Analytics, using AWS Glue DataBrew and Amazon AppFlow. In addition, you can alwaysrely on the custom JDBC capability in Apache Spark and connect to any JDBC-compliant data storefrom Amazon EMR or AWS Glue jobs.
3. Choosing the right authoring tool for the job simplifies job development and improves agility.
a. You can use AWS Glue Studio when authoring jobs for the AWS Glue Spark runtime engine.
b. Use AWS Glue Blueprints when you need to create a self-service parametrized job for analysts andcontrol what data the analyst is allowed to access.
c. Use Amazon EMR notebook for interactive job development and scheduling notebook jobs againstAmazon EMR.
d. Use Amazon SageMaker Notebook when working within SageMaker ML development.
e. Use AWS Glue DataBrew from the AWS Management Console or from a Jupyter Notebook for no-code development experience.
f. Use Lake Formation Blueprints when you need to quickly create batch data ingestion jobs to rapidlybuild a data lake in AWS.
4. Choosing the right processing engine for your batch jobs allows you to be flexible with managingcosts and lowering operational overhead. Today, only Amazon EMR and Amazon Redshift offer theability to autoscale seamlessly based on your job runtime metrics using the managed scaling featureand concurrency scaling features for read and write (preview) respectively. Other services depictedunder job processing in the reference architecture require you to specify the maximum processingcapacity for your job, which will be used to accommodate peak data volumes. Amazon EMR andAmazon Redshift offer server-based architectures while rest of the services depicted in the referencearchitecture are fully serverless. Amazon EMR allows you to use Spot Instances for suitable workloadsthat can further save your costs. A good strategy is to complement these processing engines to meetthe business objectives of the SLA, functionality, and lower TCO by choosing the right engine for theright job.
50
Data Analytics Lens AWS Well-Architected FrameworkConfiguration notes
5. Batch processing jobs usually require writing processed data to a target persistent store. This store canreside anywhere between AWS, on-premises, or other cloud providers. You can use the rich connectorinterface AWS Glue offers to write data to various target platforms, such as Amazon S3, Snowflake,and Amazon OpenSearch Service. You can also use the native spark JDBC connector feature and writedata to any supported JDBC target.
6. All batch jobs require a workflow that can handle dependency checks to ensure no downstreamimpacts and have a bookmarking capability that allows them to resume where they left off in theevent of a failure or at the next run of the job. When using AWS Glue as your batch job processingengine, you can use the native workflow capability to help you create a workflow with a built-instate machine to track the state of your job across the entire workflow. Glue jobs also support abookmarking capability that keeps track of what it has processed and what needs to be processedduring next run. Similarly, AWS Lake Formation blueprints support a bookmarking capability whenprocessing incremental data. With EMR Studio, you can schedule notebook jobs. When using any ofthe analytic processing engines, you can build job workflows using an external scheduler, such as AWSStep Functions or Amazon Managed Workflows for Apache Airflow that allows you to interoperatebetween any service including external dependencies.
7. Batch processing jobs write data output to target data store, which can be anywhere within the AWSCloud, on premises, or at another cloud provider. You can use the AWS Glue Data Catalog to crawl thesupported target databases to simplify writing to your target database.
Configuration notesUse AWS Glue Data Catalog as a central metastore for your batch processing jobs, regardless ofwhich AWS analytic service you use as a processing engine. Batch processing jobs cater to a variety ofworkloads ranging from running several times an hour or day, to running monthly or quarterly The datavolumes vary significantly and so do the consumption patterns on the processed dataset. Always workbackwards to understand the business SLAs and develop your job accordingly. The central Data Catalogmakes it easy for you to use the right analytic service to meet your business SLAs and other objectives,thereby creating a central analytic ecosystem.
Avoid lifting and shifting server-based batch processing systems to AWS. By lifting and shiftingtraditional batch processing systems into AWS, you risk running over-provisioned resources on AmazonEC2. For example, traditional Hadoop clusters are often over-provisioned and idle in an on-premisessetting. Use AWS Managed Services, such as AWS Glue, Amazon EMR, and Amazon Redshift, to simplifyyour architecture using a lake house pattern and remove the undifferentiated heavy lifting of managingclustered and distributed environments.
Automate and orchestrate everywhere. In a traditional batch data processing environment, it’s a bestpractice to automate and schedule your jobs in the system. In AWS, you should use automation andorchestration for your batch data processing jobs in conjunction with the AWS APIs to spin up andtear down entire compute environments, so that you are only charged when the compute services arein use. For example, when a job is scheduled, a workflow service, such as AWS Step Functions, woulduse the AWS SDK to provision a new EMR cluster, submit the work, and shut down the cluster afterthe job is complete. Similarly, you can use Terraform or a CloudFormation template to achieve similarfunctionality.
Use Spot Instances and Graviton-based instance types on EMR to save costs and get better priceperformance ratio . Use Spot Instances when you have flexible SLAs that are resilient to job reruns uponfailure and when there is a need to process very large volumes of data. Use Spot Fleet, EC2 Fleet, andSpot Instance features in Amazon EMR to manage Spot Instances.
Continually monitor and improve batch processing jobs. Batch processing systems evolve rapidlyas data source volumes increase, new batch processing jobs are authored, and new batch processingframeworks are launched. Instrument your jobs with metrics, timeouts, and alarms to have the metricsand insight to make informed decisions on batch data processing system changes.
51
Data Analytics Lens AWS Well-Architected FrameworkStreaming ingest and stream processing
Streaming ingest and stream processingProcessing real-time streaming data requires throughput scalability, reliability, high availability, and lowlatency to support a variety of applications and workloads. Some examples include: streaming ETL, real-time analytics, fraud detection, API microservices integration, fraud detection activity tracking, real-timeinventory and recommendations, and click-stream, log file, and IoT device analysis.
Streaming data architectures are built on five core constructs: data sources, stream ingestion, streamstorage, stream processing, and destinations. Each of these components can be created and launchedusing AWS Managed Services and deployed and managed as a purpose-built solution on Amazon EC2,Amazon Elastic Container Service (Amazon ECS), or Amazon Elastic Kubernetes Service (Amazon EKS).
Examples of each of these components include:
Data sources: Application and click stream logs, mobile apps, existing transactional relational and NoSQLdatabases, IoT sensors, and metering devices.
Stream ingestion and producers: Both open source and proprietary toolkits, libraries, and SDKs forKinesis Data Streams and Apache Kafka to create custom stream producers, AWS service integrationssuch as AWS IoT Core, CloudWatch Logs and Events, Amazon Kinesis Data Firehose, AWS Data MigrationService (DMS), and third-party integrations.
Stream storage: Kinesis Data Streams, Amazon Managed Streaming for Apache Kafka (Amazon MSK),and Apache Kafka.
Stream processing and consumers: Amazon EMR (Spark Structured Streaming, Apache Flink), AWS GlueETL Streaming, Kinesis Data Analytics for Apache Flink, third-party integrations, and build-your-owncustom applications using AWS and open source community SDKs and libraries.
Downstream destinations: Databases, data warehouses, purpose-built systems such as OpenSearchservices, data lakes, and various third-party integrations.
With these five components in mind, next let’s consider the characteristics as you design your streamprocessing pipeline for real-time ingestion and nearly continuous stream processing.
CharacteristicsScalable throughput: For real-time analytics, you should plan a resilient stream storage infrastructurethat can adapt to changes in the rate of data flowing through the stream. Scaling is typically performedby an administrative application that monitors shard and partition data-handling metrics.
Dynamic stream processor consumption and collaboration: Stream processors and consumers shouldautomatically discover newly added Kinesis shards or Kafka partitions, and distribute them equitablyacross all available resources to process independently or collaboratively as a consumption group (KinesisApplication Name, Kafka Consumer Group).
Durable: Real-time streaming systems should provide high availability and data durability. For example,Amazon Kinesis Data Streams and Amazon Managed Streaming for Apache Kafka replicate data acrossAvailability Zones providing the high durability that streaming applications need.
Replay-ability: Stream storage systems should provide the ordering of records within shards andpartitions, as well as the ability to independently read or replay records in the same order to streamprocessors and consumers.
Fault-tolerance, checkpoint, and replay: Checkpointing refers to recording the farthest point in thestream that data records have been consumed and processed. If the consuming application crashes, itcan resume reading the stream from that point instead of having to start at the beginning.
Loosely coupled integration: Loosely coupled integration: A key benefit of streaming applications isthe construct of loose coupling. The value of loose coupling is the ability of stream ingestion, stream
52
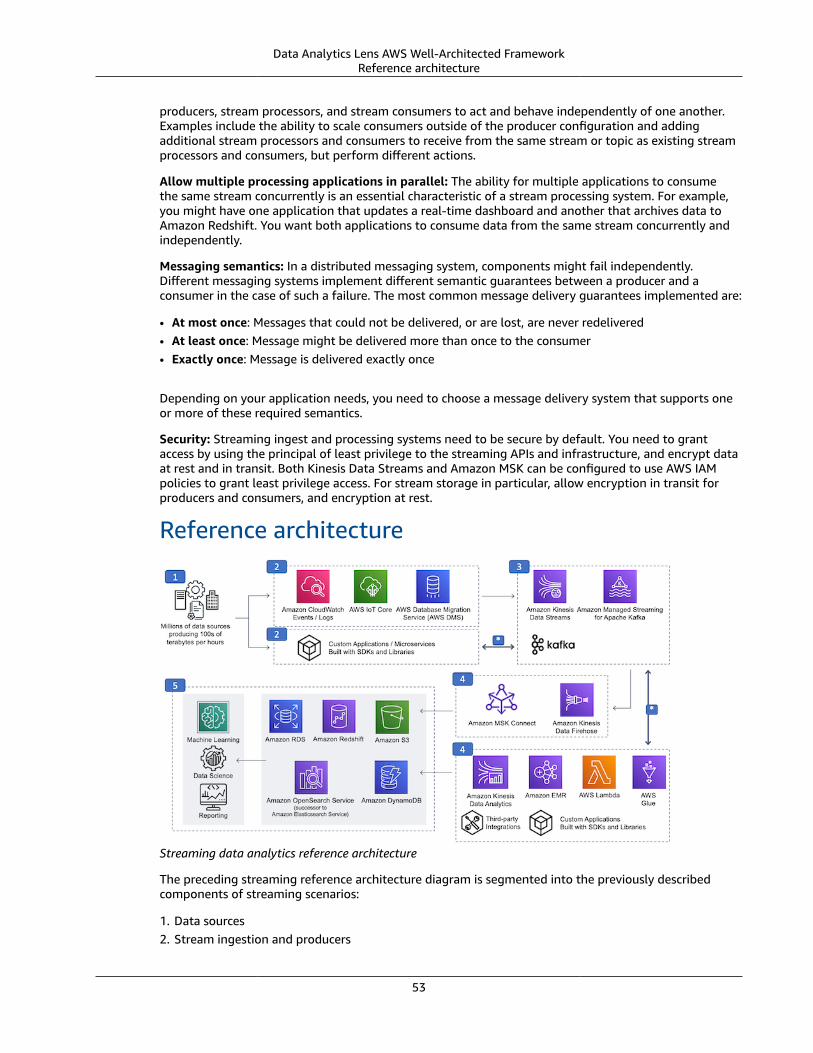
Data Analytics Lens AWS Well-Architected FrameworkReference architecture
producers, stream processors, and stream consumers to act and behave independently of one another.Examples include the ability to scale consumers outside of the producer configuration and addingadditional stream processors and consumers to receive from the same stream or topic as existing streamprocessors and consumers, but perform different actions.
Allow multiple processing applications in parallel: The ability for multiple applications to consumethe same stream concurrently is an essential characteristic of a stream processing system. For example,you might have one application that updates a real-time dashboard and another that archives data toAmazon Redshift. You want both applications to consume data from the same stream concurrently andindependently.
Messaging semantics: In a distributed messaging system, components might fail independently.Different messaging systems implement different semantic guarantees between a producer and aconsumer in the case of such a failure. The most common message delivery guarantees implemented are:
• At most once: Messages that could not be delivered, or are lost, are never redelivered• At least once: Message might be delivered more than once to the consumer• Exactly once: Message is delivered exactly once
Depending on your application needs, you need to choose a message delivery system that supports oneor more of these required semantics.
Security: Streaming ingest and processing systems need to be secure by default. You need to grantaccess by using the principal of least privilege to the streaming APIs and infrastructure, and encrypt dataat rest and in transit. Both Kinesis Data Streams and Amazon MSK can be configured to use AWS IAMpolicies to grant least privilege access. For stream storage in particular, allow encryption in transit forproducers and consumers, and encryption at rest.
Reference architecture
Streaming data analytics reference architecture
The preceding streaming reference architecture diagram is segmented into the previously describedcomponents of streaming scenarios:
1. Data sources2. Stream ingestion and producers
53
Data Analytics Lens AWS Well-Architected FrameworkReference architecture
3. Stream storage4. Stream processing and consumers5. Downstream destinations
All, or portions, of this reference architecture can be used for workloads such as applicationmodernization with microservices, streaming ETL, ingest, real-time inventory, recommendations, or frauddetection.
In this section, we will identify each layer of components shown in the preceding diagram with specificexamples. The examples are not intended to be an exhaustive list, but rather an attempt to describesome of the more popular options.
The subsequent Configuration notes section provides recommendations and considerations whenimplementing streaming data scenarios.
Note : There are two bidirectional event flow lanes noted with an asterisk (*) in the diagram. We willreview the five core components of streaming architecture first, and then discuss these specialized flows.
• Data sources : The number of potential data sources is in the millions. Examples include applicationlogs, mobile apps and applications with REST APIs, IoT sensors, existing application databases (RDBMS,NoSQL) and metering records.
• Stream ingestion and producers : Multiple data sources generate data continually that might amountto terabytes of data per day. Toolkits, libraries, and SDKs can be used to develop custom streamproducers to streaming storage. In contrast to custom developed producers, examples of pre-builtproducers include Kinesis Agent, Change Data Capture (CDC) solutions, and Kafka Connect Sourceconnectors.
• Streaming storage : Kinesis Data Streams, Managed Streaming for Apache Kafka, and self-managedApache Kafka are all examples of stream storage options for ingesting, processing, and storing largestreams of data records and events. Streaming storage implementations are modeled on the idea ofa distributed, immutable commit log. Events are stored for a configurable duration (hours to days tomonths, or even permanently in some cases). While stored, events are available to any client.
• Stream processing and consumers : Real-time data streams can be processed sequentially andincrementally on a record-by-record basis over sliding time windows using a variety of services. Or, putanother way, this can be where particular domain-specific logic resides and is computed.
With Kinesis Data Analytics for Apache Flink or Kinesis Data Analytics Studio, you can process andanalyze streaming data using standard SQL in a serverless way. The service allows you to quicklyauthor and run SQL queries against streaming sources to perform time series analytics, feed real-timedashboards, and create real-time metrics.
If you work in an Amazon EMR environment, you can process streaming data using multiple options—Apache Flink or Spark Structured Streaming.
Finally, there are options for AWS Lambda, third-party integrations, and build-your-own customapplications using AWS SDKs, libraries, and open-source libraries and connectors for consuming fromKinesis Data Streams, Managed Streaming for Apache Kafka, and Apache Kafka.
• Downstream destinations : Data can be persisted to durable storage to serve a variety of use casesincluding ad hoc analytics and search, machine learning, alerts, data science experiments, andadditional custom actions.
A special note on the data flow lanes noted with asterisk (*). There are two examples which both involvebidirectional flow of data to and from layer #3 streaming storage.
The first example is the bidirectional flow of in-stream ETL between stream processor (#4) which usesone or more raw event sources from stream storage (#3) and performs, filtering, aggregations, joins,
54
Data Analytics Lens AWS Well-Architected FrameworkConfiguration notes
etc. and writes results back to streaming storage to a refined (that is, curated, hydrated) result stream ortopic (#3) where it can be used by a different stream processor or downstream consumer.
The second bidirectional flow example is the ubiquitous application modernization microservice design(#2) which often use a streaming storage layer (#3) for decoupled microservice interaction.
The key takeaway here is for us to not presume that the streaming event flows exclusively from left-to-right over time in the reference architecture diagram.
Configuration notesAs explored so far, we know streaming data architects have options for implementing particularcomponents in their stack, for example, different options for streaming storage, streaming ingest, andstreaming producers. While it’s impractical to provide in-depth recommendations for each layer’s optionsin this document, there are some high-level concepts to consider as guide posts, which we will presentnext.
For more in-depth analysis of a particular layer in your design, consider exploring the provided linkswithin the following guidelines.
Streaming application guidelinesDetermine business requirements first. It’s always a best practice and practical to focus on yourworkload’s particular needs first, rather than starting with a feature-by-feature comparison between thetechnical options. For example, we often see organizations prioritizing Technical Feature A vs. TechnicalFeature B before determining their workload’s requirements. This is the wrong order. Determine yourworkload’s requirements first because AWS has a wide variety of purpose-built options at each streamingarchitecture layer to best match your requirements.
Technical comparisons second. After business requirements have been clearly established, the nextstep is to match your business requirements with the technical options that offer the best chance forsuccess. For example, if your team has few technical operators, serverless might be a good option.Other technical questions about your workload might be whether you require a large number ofindependent stream processors and consuming applications, that is, one vs. many stream processorsand consumers. What kind of manual or automatic scaling options are available to match businessrequirement throughput, latency, SLA, RPO, and RTO objectives? Is there a desire to use open source-based solutions? What are the security options and how well do they integrate into existing securitypostures? Is one path easier or more straightforward to migrate to versus another, for example, self-managed Apache Kafka to Amazon MSK. To learn more about your options for various layers in thereference architecture stack, refer to the following:
• Streaming ingest and producers — Can be workload-dependent and use AWS service integrations,such as AWS IoT Core, CloudWatch Logs and Events, AWS Data Migration Service (AWS DMS), andthird-party integrations (Refer to: Writing Data to Amazon Kinesis Data Streams in Amazon KinesisData Streams Developer Guide ).
• Streaming storage — Kinesis Data Streams, Kinesis Data Firehose, Amazon Managed Streamingfor Apache Kafka (Amazon MSK), and Apache Kafka (Refer to: Best Practices in Amazon ManagedStreaming for Apache Kafka Developer Guide ).
• Stream processing and consumers — Kinesis Data Analytics for Apache Flink, Kinesis Data Firehose,AWS Lambda, open source and proprietary SDKs (Refer to: Advanced Topics for Amazon Kinesis DataStreams Consumers in Amazon Kinesis Data Streams Developer Guide and Best Practices for KinesisData Analytics for Apache Flink in Amazon Kinesis Data Analytics Developer Guide ).
Remember separation of concerns. Separation of concerns is the application design principle thatpromotes segmenting an application into distinct, particular area of concerns. For instance, yourapplication might require that stream processors and consumers are performing an aggregationcomputation in addition to recording the computation results to a downstream destination. While
55
Data Analytics Lens AWS Well-Architected FrameworkConfiguration notes
it can be tempting to clump both of these concerns into one stream processors or consumers, it isrecommended to consider separation instead. It’s often better in the segment isolate into multiplestream processors or consumers for operation monitoring, performance tuning isolation, and reducingthe downtime blast radius.
DevelopmentExisting or desired skills match. Realizing value from streaming architectures can be difficult and oftena new endeavor for various roles within organizations. Increase your chances of success by aligning yourteam’s existing skillsets, or desired skillsets, wherever possible. For example, is your team familiar withJava or do they prefer a different language, such as Python or Go? Does your team prefer a graphicaluser interface for writing and deploying code? Work backwards from your existing skill resources andpreferences to appropriate options for each component.
Build vs. buy (Write your own or use off-the-shelf). Consider whether an integration betweencomponents already exists or if you need to write your own. Or perhaps both options are available. Manyteams new to streaming incorrectly assume that everything needs to be written from scratch. Instead,consider services such as Kafka Connect Connectors for inbound and outbound traffic, AWS Lambda, andKinesis Data Firehose.
PerformanceAggregate records before sending to stream storage for increased throughput. When using Kinesis,Amazon MSK, or Kafka, ensure that the messages are accumulated on the producer side before sendingto stream dtorage. This is also referred to as batching records to increase throughput, but at the cost ofincreased latency.
When working with Kinesis Data Streams, use Kinesis Client Library (KCL) to de-aggregate records.KCL takes care of many of the complex tasks associated with distributed computing, such as loadbalancing across multiple instances, responding to instance failures, checkpointing processed records,and reacting to re-sharding.
Initial planning and adjustment of shards and partitions. The most common mechanism to scalestream storage for stream processors and consumers is through the number of configured shards (KinesisData Streams) or partitions (Apache Kafka, Amazon MSK) for a particular stream. This is a commonelement across Kinesis Data Streams, Amazon MSK, and Apache Kafka, but options for scaling out (andin) the number of shards or partitions vary.
• Amazon Kinesis Data Streams Developer Guide: Resharding a Stream• Apache Kafka Documentation - Operations: Expanding your cluster (also applicable to Amazon MSK)• Amazon Managed Streaming for Apache Kafka Developer Guide: Using LinkedIn's Cruise Control for
Apache Kafka with Amazon MSK (for partition rebalancing)
Use Spot Instances and automatic scaling to process streaming data cost effectively. You can alsoprocess the data using AWS Lambda with Kinesis, Amazon MSK, or both, and Kinesis record aggregationand deaggregation modules for AWS Lambda . Various AWS services offer automatic scaling options tokeep costs lower than provisioning for peak volumes.
OperationsMonitor Kinesis Data Streams and Amazon MSK metrics using Amazon CloudWatch . You can get basicstream and topic level metrics in addition to shard and partition level metrics. Amazon MSK also providesan Open Monitoring with Prometheus option.
1. Amazon Kinesis Data Streams Developer Guide: Monitoring Amazon Kinesis Data Streams2. Amazon Managed Streaming for Apache Kafka Developer Guide: Monitoring an Amazon MSK Cluster
56
Data Analytics Lens AWS Well-Architected FrameworkOperational analytics
Plan for the unexpected / No single point of failure. Some components in your streaming architecturewill offer different options for durability in case of a failure. Kinesis Data Streams replicates to threedifferent Availability Zones. With Apache Kafka and Amazon Managed Streaming for Apache Kafka(Amazon MSK), for example, producers can be configured to require acknowledgement for partitionleader as well as a configurable amount in-sync replica followers before considering the write successful.In this example, you are able to plan for possible disruptions in your AWS environment, for example, if anAvailability Zone goes offline, without possible downtime of your producing and consuming layers.
SecurityAuthentication and authorization.
• Amazon Managed Streaming for Apache Kafka Developer Guide: Authentication and Authorization forApache Kafka APIs
• Amazon Kinesis Data Streams Developer Guide: Controlling Access to Amazon Kinesis Data StreamsResources Using IAM
Encryption in transit, encryption at rest. Streaming data actively moves from one layer to another, suchas from a streaming data producer to stream storage over the internet or through a private network.Protecting data in transit, enterprises can and often choose to use encrypted connections (HTTPS, SSL,TLS) to protect the contents of data in transit. Many AWS streaming services offer protection of data atrest through encryption.
• AWS Well-Architected Framework Security Pillar: Identity and Access Management• AWS Lake Formation Developer Guide: Security in AWS Lake Formation• Amazon Managed Streaming for Apache Kafka Developer Guide: Authentication and Authorization for
Apache Kafka APIs• Amazon Kinesis Data Streams Developer Guide: Controlling Access to Amazon Kinesis Data Streams
Resources Using IAM
Operational analyticsOperational analytics refers to inter-disciplinary techniques and methodologies that aim to improveday-to-day business performance in terms of increasing efficiency of internal business processes andimproving customer experience and value. Business analysts used the traditional analytics systems torecognize the business trends and identify the decisions. But by using the operational analytics systems,they can initiate such business actions based on the recommendations that the systems provide. Theycan also automate the execution processes to reduce the human errors. This makes the system gobeyond being descriptive to being more prescriptive and even being predictive in nature.
Enterprises often have diverse and complex IT infrastructure. Challenges arise when trying to identifysources to extract from or identify what operational data captures the state of an analytics application.Traditionally this data came from logging information emanating from different parts of the system.Modern environments include trace and metric data along with log data. Trace data captures the userrequest for resources as it passes through different systems all the way to the destination and theresponse back to the user. Metric data contain various measurements that provide insight into the healthor operational state of these systems. The combination of these form a rich set of diverse operationaldata that analytics application can be built on.
CharacteristicsDiscoverability: The ability of the system to make operational data available for consumption. Thisinvolves discovering multiple disparate types of data available within an application that can be used forvarious ad hoc explorations.
57
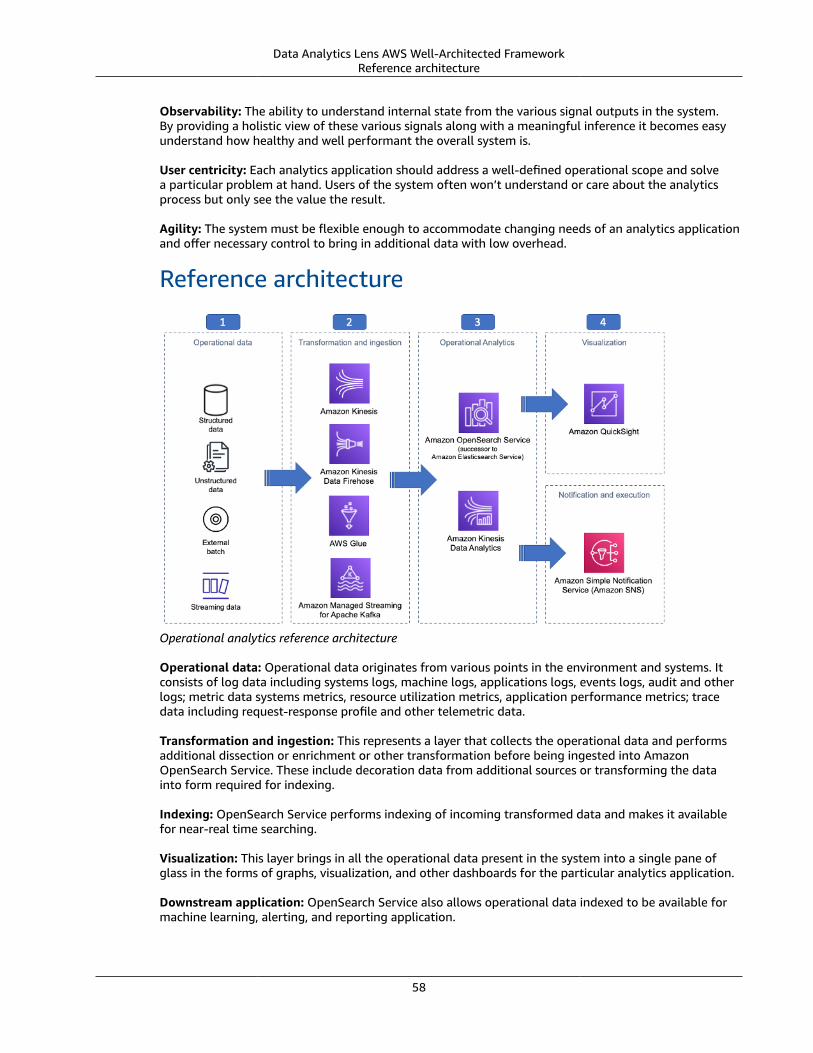
Data Analytics Lens AWS Well-Architected FrameworkReference architecture
Observability: The ability to understand internal state from the various signal outputs in the system.By providing a holistic view of these various signals along with a meaningful inference it becomes easyunderstand how healthy and well performant the overall system is.
User centricity: Each analytics application should address a well-defined operational scope and solvea particular problem at hand. Users of the system often won’t understand or care about the analyticsprocess but only see the value the result.
Agility: The system must be flexible enough to accommodate changing needs of an analytics applicationand offer necessary control to bring in additional data with low overhead.
Reference architecture
Operational analytics reference architecture
Operational data: Operational data originates from various points in the environment and systems. Itconsists of log data including systems logs, machine logs, applications logs, events logs, audit and otherlogs; metric data systems metrics, resource utilization metrics, application performance metrics; tracedata including request-response profile and other telemetric data.
Transformation and ingestion: This represents a layer that collects the operational data and performsadditional dissection or enrichment or other transformation before being ingested into AmazonOpenSearch Service. These include decoration data from additional sources or transforming the datainto form required for indexing.
Indexing: OpenSearch Service performs indexing of incoming transformed data and makes it availablefor near-real time searching.
Visualization: This layer brings in all the operational data present in the system into a single pane ofglass in the forms of graphs, visualization, and other dashboards for the particular analytics application.
Downstream application: OpenSearch Service also allows operational data indexed to be available formachine learning, alerting, and reporting application.
58
Data Analytics Lens AWS Well-Architected FrameworkConfiguration notes
Configuration notesChoose data model before ingestion: When bringing data in from disparate sources, especially fromstructured systems into structureless systems such as OpenSearch, special care must be taken to ensurethat the chosen data model provides a frictionless search experience for users.
Decide what data fields will be searchable: By default, Amazon OpenSearch Service indexes all datafields. This might not be desirable in situations like fully or partially matching on numeric data types.
Use tiered storage: The value of operational data or any timestamped data generally decreases with theage of the data. Moving aged data into tiered storage can save significant operational cost. Summarizedrollups that can condense the data also can help address storage cost.
Monitor all involved components: Monitor all involved components with metrics in AmazonCloudWatch.
Data visualizationEvery day, the people in your organization make decisions that affect your business. When they havethe right information at the right time, they can make the choices that move your company in theright direction. Giving the decision-makers the opportunity to explore and interpret information in aninteractive visual environment helps democratize data and accelerates data-driven insights that are easyto understand and navigate.
Building a BI and data visualization service in the cloud allows you to take advantage of capabilities suchas scalability, availability, redundancy, and enterprise grade security. It also lowers the barrier to dataconnectivity and allows access to far wider range of data sources —both traditional, such as databases,as well as non-traditional, such as SaaS sources. An added advantage of a cloud-based data visualizationservice is the elimination of undifferentiated heavy lifting related to managing server infrastructure.
CharacteristicsScalability: Ensure that the underlying BI infrastructure is able to scale up vertically and horizontallyboth in terms of concurrent users as well as data volume. For example on AES, Amazon QuickSightSPICE and web application automatically scales up server capacity to accommodate a large number ofconcurrent users without any manual intervention in terms of provisioning additional capacity for data,for load balance, and others.
Connectivity: BI applications must be able to not just connect with data platforms like traditional DataWarehouse and databases but also support connectivity to data lake and lake house architectures. Theapplication must also have the capacity to connect to non-traditional sources such as SaaS applications.Typically, data stores are secured behind a private subnet and BI tools and applications must be able toconnect in a secure mechanism using strategies, such as VPC endpoints and secure firewalls.
Centralized security and compliance: BI applications must allow for a layered approach for security. Thisincludes: Securing at the perimeter using techniques such as IP allow lists, security groups, ENIs and IAMpolicies for cloud resource access, securing the data in transit and data at rest using SSL and encryption,and restricting varying levels of access through fine-grained permissions for users to the underlying dataand BI assets. The application must also comply with the governmental and industry regulations for thecountry or region the company is bound by.
Sharing and collaboration: BI applications must support data democratization. They must have featuresthat allow sharing of the dashboards with other users in the company as well as for multiple reportauthors to collaborate with one another by sharing access to the underlying dataset. Not all BI tools havethis capability. Amazon QuickSight allows the sharing of assets, such as DataSources, DataSets, Analyses,Dashboards, Themes, and Templates.
59
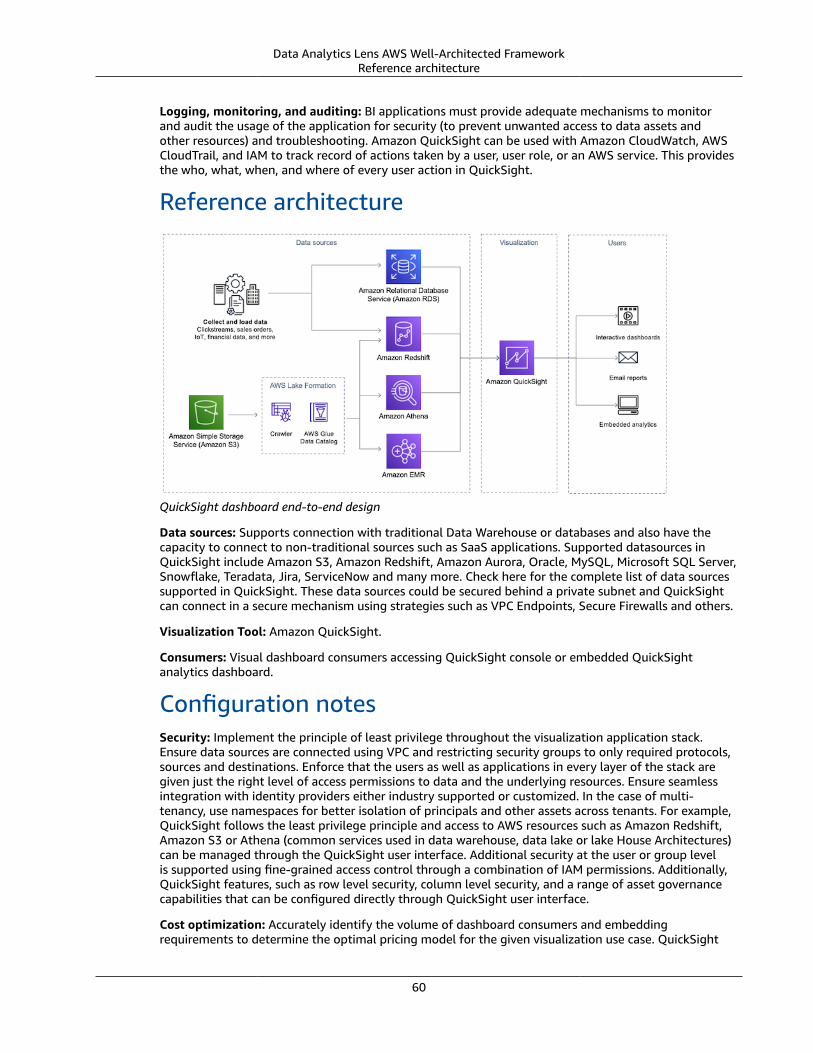
Data Analytics Lens AWS Well-Architected FrameworkReference architecture
Logging, monitoring, and auditing: BI applications must provide adequate mechanisms to monitorand audit the usage of the application for security (to prevent unwanted access to data assets andother resources) and troubleshooting. Amazon QuickSight can be used with Amazon CloudWatch, AWSCloudTrail, and IAM to track record of actions taken by a user, user role, or an AWS service. This providesthe who, what, when, and where of every user action in QuickSight.
Reference architecture
QuickSight dashboard end-to-end design
Data sources: Supports connection with traditional Data Warehouse or databases and also have thecapacity to connect to non-traditional sources such as SaaS applications. Supported datasources inQuickSight include Amazon S3, Amazon Redshift, Amazon Aurora, Oracle, MySQL, Microsoft SQL Server,Snowflake, Teradata, Jira, ServiceNow and many more. Check here for the complete list of data sourcessupported in QuickSight. These data sources could be secured behind a private subnet and QuickSightcan connect in a secure mechanism using strategies such as VPC Endpoints, Secure Firewalls and others.
Visualization Tool: Amazon QuickSight.
Consumers: Visual dashboard consumers accessing QuickSight console or embedded QuickSightanalytics dashboard.
Configuration notesSecurity: Implement the principle of least privilege throughout the visualization application stack.Ensure data sources are connected using VPC and restricting security groups to only required protocols,sources and destinations. Enforce that the users as well as applications in every layer of the stack aregiven just the right level of access permissions to data and the underlying resources. Ensure seamlessintegration with identity providers either industry supported or customized. In the case of multi-tenancy, use namespaces for better isolation of principals and other assets across tenants. For example,QuickSight follows the least privilege principle and access to AWS resources such as Amazon Redshift,Amazon S3 or Athena (common services used in data warehouse, data lake or lake House Architectures)can be managed through the QuickSight user interface. Additional security at the user or group levelis supported using fine-grained access control through a combination of IAM permissions. Additionally,QuickSight features, such as row level security, column level security, and a range of asset governancecapabilities that can be configured directly through QuickSight user interface.
Cost optimization: Accurately identify the volume of dashboard consumers and embeddingrequirements to determine the optimal pricing model for the given visualization use case. QuickSight
60
Data Analytics Lens AWS Well-Architected FrameworkConfiguration notes
offers two different pricing options (capacity and user based), which allows clients to implement cost-effective BI solutions. Capacity pricing allows large-scale implementations and user-based pricing allowsclients to get started with minimal investment (Note: SPICE has a 250M records or 500 GB volume perdataset limitation).
Low latency considerations: Use in-memory caching option, such as Memcached, Redis. or the in-memory caching engine in QuickSight called SPICE (Super-fast, Parallel, In-memory Calculation Engine)to prevent latency in dashboard rendering while accommodating any built-in restrictions that theCaching technology might have.
Pre-process data views: Ensure that the data is cleansed, standardized, enhanced, and pre-processed toallow analysis within the BI layer. If possible, create pre-processed, pre-combined, pre-aggregated dataviews for analysis purposes. ETL tools, such as Glue DataBrew, or techniques, such as materialized views,can be employed to achieve this.
61
Data Analytics Lens AWS Well-Architected Framework
ConclusionThis lens provides architectural guidance for designing and building reliable, secure, efficient, and cost-effective analytics workloads in the cloud. We captured common architectures and overarching analyticsdesign tenets. The document also discussed the well-architected pillars through the Analytics Lens,providing you with a set of questions to consider for new or existing analytics architectures. Applying theframework to your architecture helps you build robust, stable, and efficient systems, leaving you to focuson running analytics workloads and pushing the boundaries of the field to which you’re committed. Theanalytics landscape is continuing to evolve as the number of tools and processes grows and matures.As this evolution occurs, we will continue to update this paper to help you ensure that your analyticsapplications are well-architected.
62
Data Analytics Lens AWS Well-Architected Framework
ContributorsThe following individuals and organizations contributed to this document:
• Wallace Printz: Senior SA, Amazon Web Services• Radhika Ravirala: Principal SA, Amazon Web Services• Indira Balakrishnan: Senior Specialist SA, Amazon Web Services• Juan Yu: Senior Specialist SA, Amazon Web Services• Richard Mei: Senior SA, Amazon Web Services• Shankar Nivas: Principal Data Architect, Amazon Web Services• Todd McGrath: Senior Specialist SA, Amazon Web Services• Padmaja Suren: Senior Specialist SA, Amazon Web Services• Harsha Tadiparthi: Principal Specialist SA, Amazon Web Services• Muthu Pitchaimani: Analytics Specialist SA, Amazon Web Services• Jongnam Lee: Senior Lead SA of AWS Well-Architected Data Analytics Lens, Amazon Web Services• David Tucker: Senior Manager of Analytics SA, Amazon Web Services• Srikanth Baheti: Senior Amazon QuickSight SSA, Amazon Web Services• Raji Sivasubramaniam: Amazon QuickSight SSA, Amazon Web Services• Ben Potter: Lead SA of AWS Well-Architected Security Pillar Amazon Web Services
63
Data Analytics Lens AWS Well-Architected Framework
Document historyTo be notified about updates to this whitepaper, subscribe to the RSS feed.
update-history-change update-history-description update-history-date
Whitepaper updated (p. 7) Corrected table of best practicesin Design Principle 3.
December 16, 2021
Whitepaper updated (p. 64) Title changed to Data AnalyticsLens. Major updates appliedthroughout.
October 29, 2021
Initial publication (p. 64) Analytics Lens first published. May 20, 2020
64
Data Analytics Lens AWS Well-Architected FrameworkOperational excellence
Design principles arranged by pillarThese are the design principles outlined in this paper organized by pillar of the AWS Well-ArchitectedFramework.
Operational excellence (p. 3)• 1 - Monitor the health of the analytics pipelines (p. 3)• 2 - Modernize deployment of the analytics jobs and applications (p. 5)• 3 – Build financial accountability models for data and workload usage (p. 7)
Security (p. 9)• 4 - Classify and protect data (p. 9)• 5 - Control the data access (p. 13)• 6 – Control the access to workload infrastructure (p. 17)
Reliability (p. 19)• 7 - Design resiliency for analytics workload (p. 19)• 8 - Govern data and metadata changes (p. 23)
Performance efficiency (p. 24)• 9 - Choose the best-performing compute solution (p. 24)• 10 - Choose the best-performing storage solution (p. 27)• 11 - Choose the best-performing file format and partitioning (p. 28)
Cost optimization (p. 30)• 12 - Choose cost-effective compute and storage solutions based on workload usage patterns (p. 31)• 13 - Manage cost over time (p. 33)• 14 - Use optimal pricing models based on infrastructure usage patterns (p. 36)
65
Data Analytics Lens AWS Well-Architected Framework
NoticesCustomers are responsible for making their own independent assessment of the information in thisdocument. This document: (a) is for informational purposes only, (b) represents current AWS productofferings and practices, which are subject to change without notice, and (c) does not create anycommitments or assurances from AWS and its affiliates, suppliers or licensors. AWS products or servicesare provided “as is” without warranties, representations, or conditions of any kind, whether express orimplied. The responsibilities and liabilities of AWS to its customers are controlled by AWS agreements,and this document is not part of, nor does it modify, any agreement between AWS and its customers.
© 2021 Amazon Web Services, Inc. and/or its affiliates. All rights reserved.
66
Data Analytics Lens AWS Well-Architected Framework
AWS glossaryFor the latest AWS terminology, see the AWS glossary in the AWS General Reference.
67
Related Documents