Data analysis and inference for an industrial deethanizer Francesco Corona a , Michela Mulas b , Roberto Baratti c and Jose Romagnoli d a Dept. of Information and Computer Science, Helsinki University of Technology P.O. Box 5400, FI-02015 HUT, Finland b Biotecnology and Chemical Technology Dept., Helsinki University of Technology P.O. Box 6100, FI-02015 HUT, Finland c Dept. of Chemical Engineering and Materials, University of Cagliari Piazza d’Armi, I-09123 Cagliari, Italy d Cain Dept. of Chemical Engineering, Louisiana State Univesrity South Stadium Road, LA-70803 Baton Rouge, USA In this paper, we present an application of data derived approaches for analyzing and monitoring an industrial deethanizer column. The discussed methods are used in visualizing process measurements, extracting operational information and designing an estimation model. Emphasis is given to the modeling of the data obtained with standard paradigms like the Self-Organizing Map (SOM) and the Multi-Layer Perceptron (MLP). Here, the effectiveness of these data-derived techniques is validated on a full-scale application where the goal is to identify significant operational modes and most sensitive process variables before developing an alternative control scheme. 1. Introduction A modern process plant is under tremendous pressure to maintaining and improving product quality and profit under stringent environmental and safety constraints. For efficient operation, any decision-making action related to the plant operation requires the knowledge of the actual state of the process. The availability of easily accessible displays and intuitive knowledge of the states is invaluable with immediate implications for profitability, management planning, environmental responsibility and safety. In this paper, we discuss the implementation and direct application of a strategy to model, visualize and analyze the information encoded in industrial process data. The approach is based on a classical machine learning method for dimensionality reduction and quantization, the Self-Organizing Map, SOM (Kohonen 2001). The SOM combines many of the main properties of other general techniques and shares many commonalities with two standard methods for data projection (Principal Components Analysis) and clustering (K-means). In addition, the SOM is also provided with a set of tools that allow for efficient data visualizations in high-dimensional settings. The use of the Self- Organizing Map in the exploratory stage of data analysis is discussed in (Kaski, 1997 and Vesanto, 2002) and it is widely employed in many fields.

Welcome message from author
This document is posted to help you gain knowledge. Please leave a comment to let me know what you think about it! Share it to your friends and learn new things together.
Transcript
Data analysis and inference for an industrial deethanizer
Francesco Coronaa, Michela Mulas
b, Roberto Baratti
c and Jose Romagnoli
d
aDept. of Information and Computer Science, Helsinki University of Technology
P.O. Box 5400, FI-02015 HUT, FinlandbBiotecnology and Chemical Technology Dept., Helsinki University of Technology
P.O. Box 6100, FI-02015 HUT, FinlandcDept. of Chemical Engineering and Materials, University of Cagliari
Piazza d’Armi, I-09123 Cagliari, ItalydCain Dept. of Chemical Engineering, Louisiana State Univesrity
South Stadium Road, LA-70803 Baton Rouge, USA
In this paper, we present an application of data derived approaches for analyzing and
monitoring an industrial deethanizer column. The discussed methods are used in
visualizing process measurements, extracting operational information and designing an
estimation model. Emphasis is given to the modeling of the data obtained with standard
paradigms like the Self-Organizing Map (SOM) and the Multi-Layer Perceptron (MLP).
Here, the effectiveness of these data-derived techniques is validated on a full-scale
application where the goal is to identify significant operational modes and most
sensitive process variables before developing an alternative control scheme.
1. Introduction
A modern process plant is under tremendous pressure to maintaining and improving
product quality and profit under stringent environmental and safety constraints. For
efficient operation, any decision-making action related to the plant operation requires
the knowledge of the actual state of the process. The availability of easily accessible
displays and intuitive knowledge of the states is invaluable with immediate implications
for profitability, management planning, environmental responsibility and safety.
In this paper, we discuss the implementation and direct application of a strategy to
model, visualize and analyze the information encoded in industrial process data. The
approach is based on a classical machine learning method for dimensionality reduction
and quantization, the Self-Organizing Map, SOM (Kohonen 2001). The SOM combines
many of the main properties of other general techniques and shares many commonalities
with two standard methods for data projection (Principal Components Analysis) and
clustering (K-means). In addition, the SOM is also provided with a set of tools that
allow for efficient data visualizations in high-dimensional settings. The use of the Self-
Organizing Map in the exploratory stage of data analysis is discussed in (Kaski, 1997
and Vesanto, 2002) and it is widely employed in many fields.
2. The Self-Organizing Map
The Self-Organizing Map is an adaptive neural paradigm to performing in unison:
• A reduction of the data dimensionality by projection; that is, the reduction of
the dimensionality of the data by mapping all the observations onto meaningful
subspaces with lower dimensionality.
• A reduction of the amount of data by clustering; that is, the retention of the
original dimensionality of the data space while reducing the amount of
observations by grouping them according to similarity.
The SOM nonlinearly projects vast quantities of high-dimensional data onto a lower-
dimensional array of fewer prototypes in a fashion that aims at preserving the topology
of the observations. By choosing a bi-dimensional array of prototypes, the SOM is to be
understood as an ordered image of the original high-dimensional data manifold as
modeled onto a low-dimensional subspace where the complex data structures are
represented by simple geometric relationships. In this case, the SOM offers excellent
techniques for data exploration. The SOM algorithm is described by Kohonen (2001).
The data visualization techniques based on the SOM assume that the prototype vectors
are representative models for similar groups of observations, and projecting the data
onto the low-dimensional array allows for an efficient display of the dominant
relationships existing between them. The visualizations techniques considered here are
i) the component planes and ii) the distance matrix (Kaski, 1997 and Vesanto, 2002).
3. Case study
To illustrate the potentialities of topological data analysis using the Self-Organizing
Map, the overviewed methods are applied to a monitoring problem consisting of
modeling and analyzing the operational behavior of an industrial deethanizer, starting
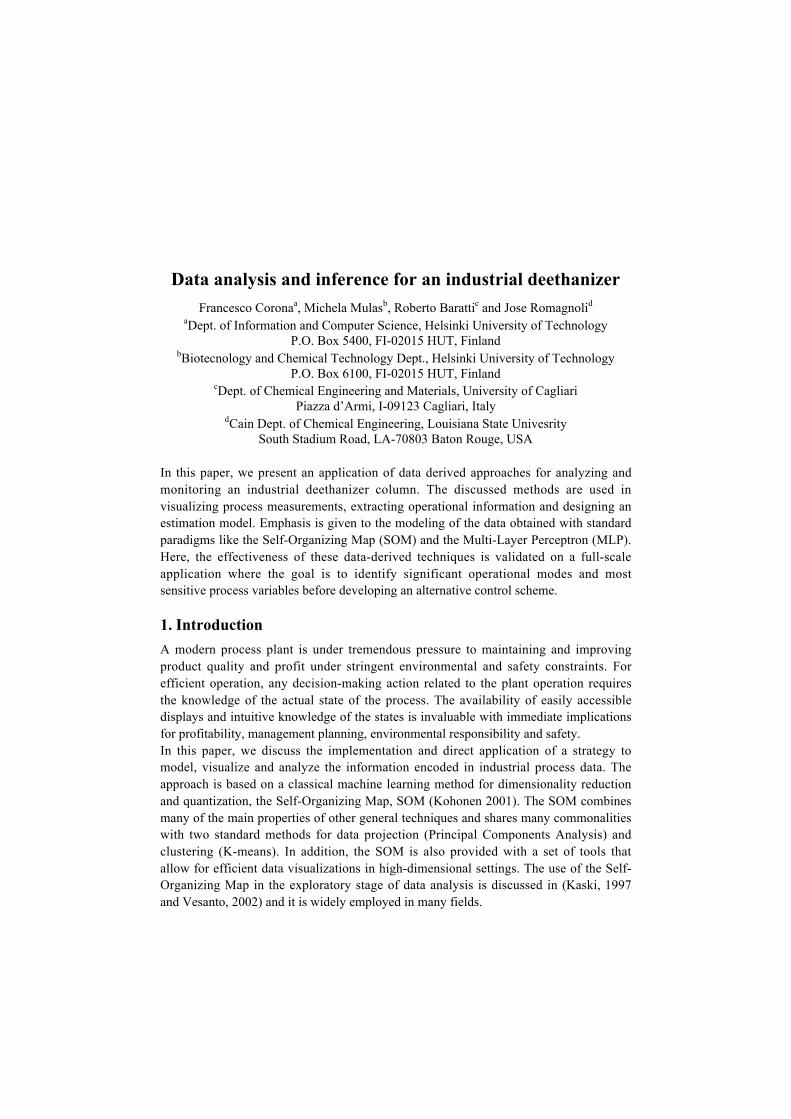
from a set of online process measurements. The objective of the deethanizer, in Fig. 1,
is to separate ethane from the feed stream (a light naphtha) while minimizing the ethane
extracted from the bottom of the column (an economical constraint for the subsequent
unit in the plant). Such a constraint is quantified by the maximum amount of ethane lost
from the column bottom; the operational threshold is set be smaller than 2%.
Figure 1 Deethanizer: Simplified flow-sheet.
In order to analyze the behavior of the unit, a set of process variables was collected
from the plant's distributed control system (DCS). The measurements correspond to
three weeks of continuous operation in winter asset and three weeks in summer asset
and the data are available as 3-minute averages. 27 process variables are available.
3.1 Analysis and inference
The operational objective of the column is to produce as much ethane as possible
(minimizing concentration of propane from the top of the column) while satisfying the
constraint on the amount of impurity from the bottom (maximum concentration of
ethane in the bottom less than 2%). With respect to the loss of ethane from the bottom,
such considerations led to the definition of 3 operational modes:
• A normal status, corresponding to the operation of the column, where the
concentration of ethane is within allowable bounds (within 1.8 - 2.0%).
• A high status, corresponding to the operation of the column, where the
concentration of ethane is exceeding the allowable upper bound (2%).
• A l ow status, corresponding to the operation of the column, where the
concentration of ethane is below the allowable lower bound (1.8%)
The two abnormal conditions have a direct and important economic implication. In fact,
when at low status, the process is delivering a product out of specifications, whereas
when at high the product is within the specifications with unnecessary operational costs.
To understand under which conditions such modes are experienced, in a recent study
(Corona, 2009) we analyzed the clustering structure of the process data and visualized
the operating conditions of the unit. Starting from a selection of important process
variables, we expanded this subset by incorporating an additional dummy indicator,
specifically calculated to indicate the status. As such, the new variable was defined as to
take values +1, -1 or 0, according to the operational status of the process. Value 0 is
assigned to the normal operation, whereas values +1 and -1 correspond to high and low
operations, respectively. Note that the calculation of the dummy variable required the
availability of a real-time measurement for the ethane concentration: Such a variable is
presently acquired from a continuous-flow chromatograph (GC). The subset of selected
variables, augmented by the dummy indicator, was then used to calibrate a SOM over
which the resulting component planes and U-matrix were analyzed. The exploration is a
direct application of the techniques discussed in (Alhoniemi, 2002). The study allowed
us to illustrate on simple displays how the clustering structure of the measurements
corresponds to the operational modes of the deethanizer.
However, the delay associated with the analytical measurements of the ethane can pose
severe limitations to the online analysis. Moreover, the existing instrumentation setup
may benefit from a backup measurement for such an important variable. For such a
reason, we are extending the analysis by validating its functionality when replacing the
analytical measurements with online estimates. The availability of an inferential model
would allow the development of an automated system to be implemented in the DCS.
For the purpose, a soft sensor based on a standard MLP with sigmoidal activation, was
developed to infer the ethane concentration. The estimates are obtained starting from the
same input subset of easily measurable process variables and selected according to the
guidelines provided by Baratti et al. (1995). The MLP was optimized with the
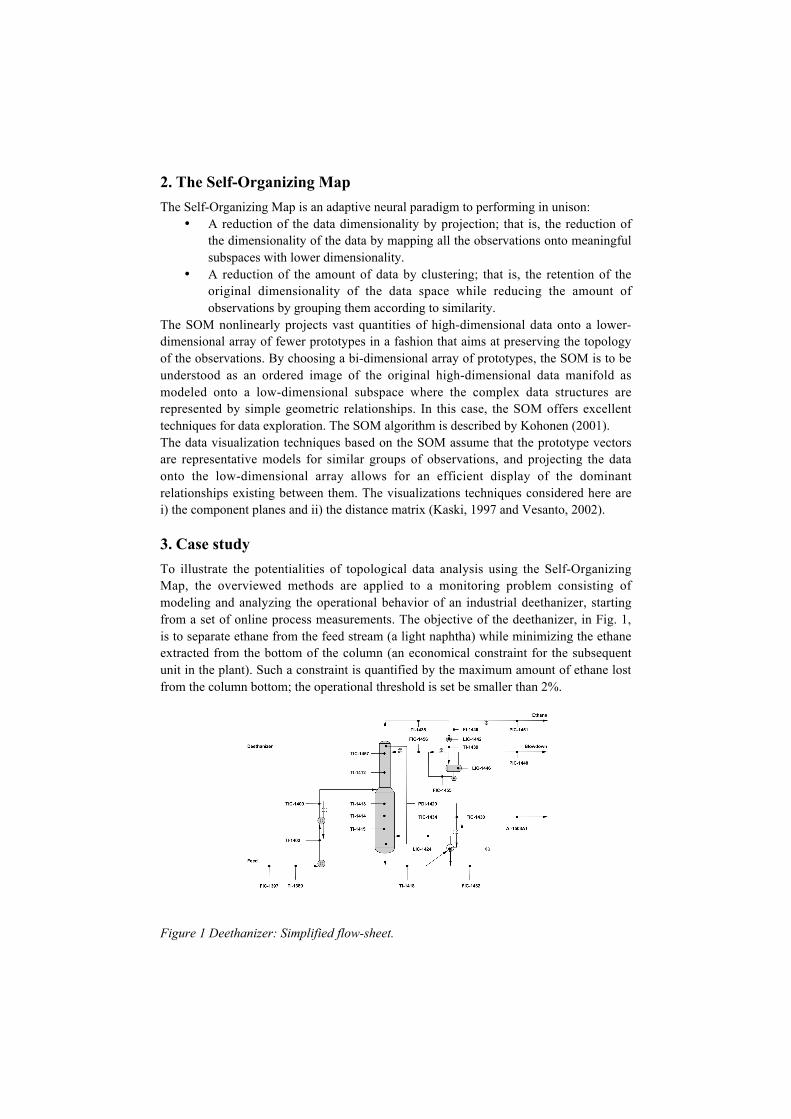
Levemberg-Marquard method and cross-validation. In Fig. 2, the response of the sensor
on a set of testing observations is reported for a week of continuous operation.
Figure 2 Ethane from the bottom: Analytical measurements (•) and MLP estimates (-).
Based on the MLP estimates, a bi-dimensional SOM was calibrated using only the
winter data. The map consists of a hexagonal array of prototype vectors initialized in the
space spanned by the eigenvectors corresponding to the two largest eigenvalues of the
covariance matrix of the data. As usual, the ratio between the two largest eigenvalues
was used to calculate the ratio between the two dimensions of the SOM.
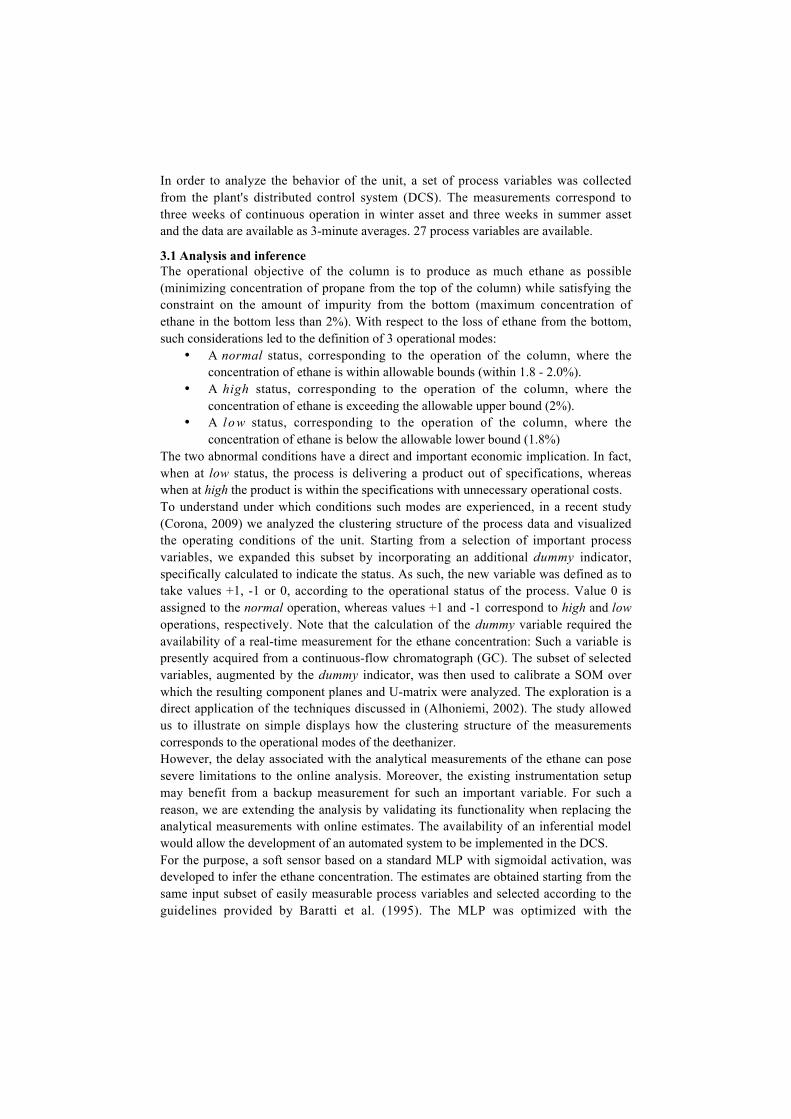
On the SOM, we analyzed the clustering structure of the data and visualized the
operating conditions of the unit using the U-matrix and the component planes, Fig. 3.
a) b) c) d) e)
Figure 3 The U-Matrix (a), the SOM coloured according to the K-means algorithm (b),
the component planes for the dummy variable (c), the estimated ethane concentration
(d) and the temperature TI-1414 (e). The colouring scheme for the component planes (c,
d, and e) differs from what defined for the K-means clustering (b).
The U-matrix is based on distances between each prototype vector and its immediate
neighbors. A common way to visualize it consists of an initial projection of all the
distances onto a color axis and the subsequent display with colored markers between
each prototype vector. On the display, areas with homogeneous coloring correspond to
small within-cluster distances, whereas cluster borders are areas with homogeneous
coloring but corresponding to large between-cluster distances. In Fig. 3(a), distances are
depicted with dark gray color shading toward light gray as the proximity between the
prototypes decreases. The visualization permits to recognize the presence of three
distinct clusters of prototypes, as well as several other data substructures. However, to
obtain a quantitative characterization of the clustering structure, the prototypes of the
SOM should be regarded as a reduced data set and modeled with a standard clustering
algorithm. For simplicity, we are here adopting a standard K-means algorithm coupled
by the Davier-Bouldin index, a measure of cluster validity, to identify an optimal
number of taxonomies from data (Milligan, 1985). As expected, optimality was found
for three clusters, the operational modes of the deethanizer. On the SOM, such clusters
are located in the lower, middle and upper part of the map. After coloring the SOM
according to the cluster membership obtained by using the K-means algorithm, in Fig.
3(b), and comparing it with the component plane of the dummy variable, Fig. 3(c), it is
straightforward to associate the three taxonomies to the three main operational modes.
Although apparently less evident, the same structuring is retrieved from the component
planes of the estimated ethane concentration (in Fig. 3(d)) and one of the temperatures
in the exhausting section of the deethanizer (in Fig. 3(e)). Looking for similar patterns
in similar positions in such components planes allows the visualization of a neat
dependence between the ethane composition and the temperature indicator. Such pair of
variables shows near-identical but reversed component planes, thus highlighting the
inherent inverse correlation that exists between them. Information about this
dependence can be further enhanced by applying the coloring scheme resulting from
clustering directly to the original observations in the time domain. Unfortunately, due to
limitation in reporting colored figures, it is not possible appreciate this advantage.
So far, we have restricted the analysis only to the measurements observed under winter
asset. However, it is also possible to directly use the calibrated SOM as a reference
model for new and unseen observations: In our setting, the three weeks of data
corresponding to the summer operation of the deethanizer column. To validate this idea,
the winter SOM was used to explore the behavior of the deethanizer under summer
asset. Again, the summer measurements from the GC were replaced by the estimates
from the soft sensor. The analysis was accomplished by initially projecting the new data
onto the calibrated SOM, being the mapping based on a nearest neighbor criterion
between the new sample vectors and the prototype vectors of the SOM. Once the
mapping is completed, the inspection the new data is performed on the calibrated SOM.
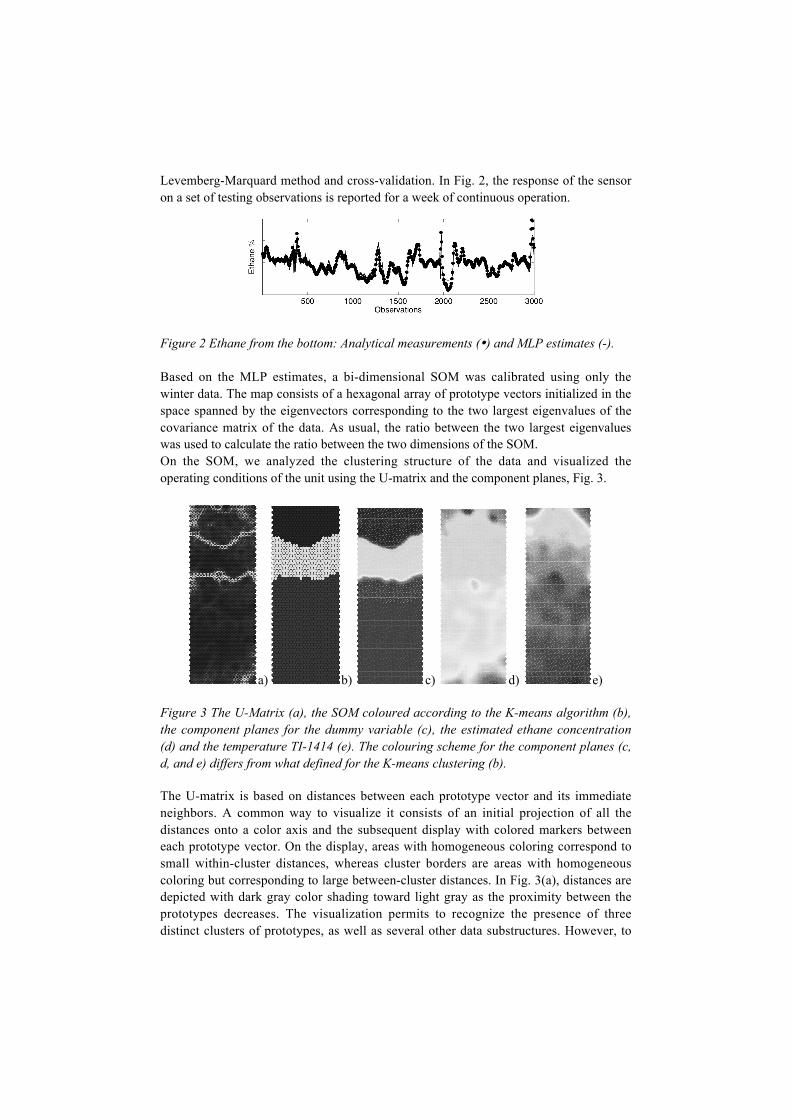
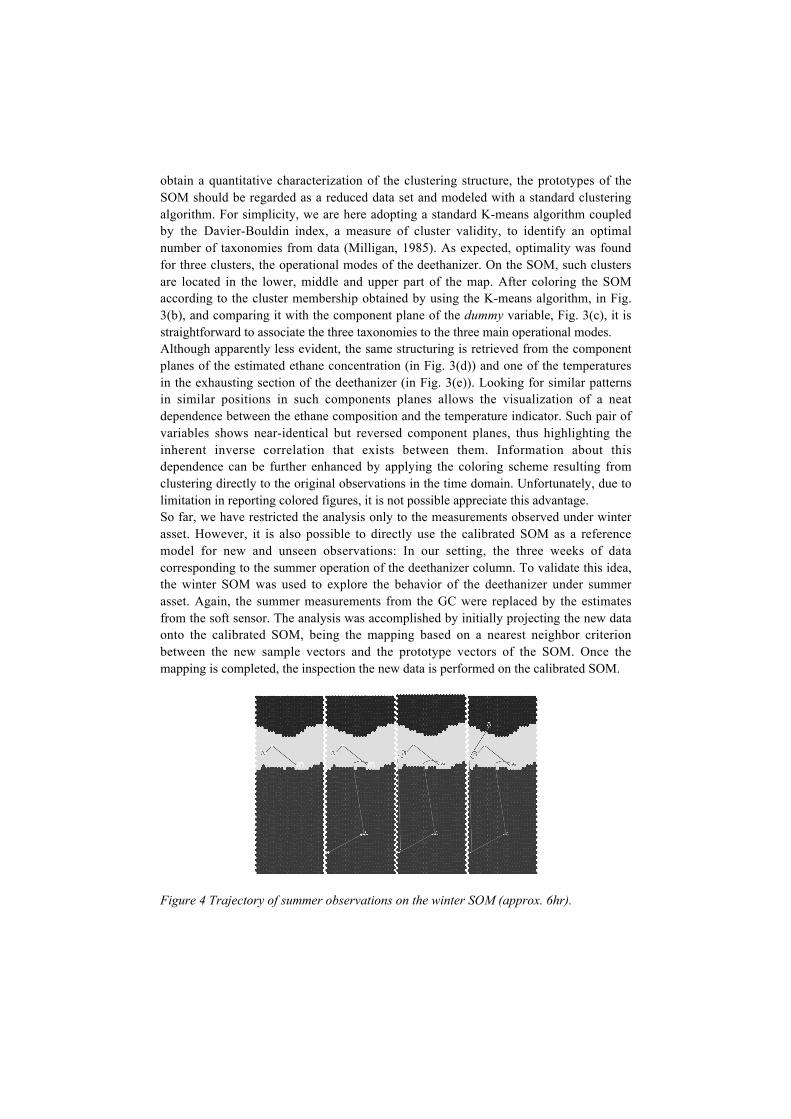
Figure 4 Trajectory of summer observations on the winter SOM (approx. 6hr).
The results in extrapolation are presented by illustrating another technique for
visualization on the SOM. The approach allows to following the operational changes in
the process and tries to provide a simple display for identifying reasons of specific
behaviors. For the purpose, the map calibrated on the winter data can be enhanced by
the inclusion of the summer point trajectories followed by the process. The trajectory,
which passes through all the BMUs of each new data vector, is shown as segmented line
connecting the visited prototypes, marked as by dots. The trajectory makes it possible to
intuitively indicate the current mode of the process and observe how it has been
reached. In the sequence of panels in Fig. 4, the process trajectory is reported for a small
time window corresponding to six hours of continuous summer operation of the
deethanizer. Following the temporal evolution, the diagrams show a process that is
initially operated in normal condition. As the process moved further in time, new
prototype vectors were visited and added to the trajectory until the column eventually
leaves the normality region and crosses it towards the region of high ethane
composition. In a similar fashion, all the process variables can be assigned a different
coloring to match the visited modes. Such a representation would allow to appreciating
that the change in the operation was mainly due to an abrupt change in feed flow-rate.
Unfortunately, such a display cannot be reported because of the space limitation.
4. Conclusions
In this work, we implemented and discussed a strategy to model, visualize and analyze
the information encoded in industrial process data using the Self-Organizing-Map. In
particular, the proposed strategy was applied to an industrial distillation column
allowing to individuating an alternative control strategy. Moreover, in order to
overcome the problem associated with the time delay of the analytical instrumentation,
a software sensor, based on a MLP neural network, was developed allowing the
possibility to use such an approach also for an efficient online monitoring of the unit.
References
Alhoniemi E., 2002, Unsupervised pattern recognition methods for exploratory analysis
of industrial process data, Ph.D. Dissertation. Helsinki University of Technology.
Baratti R., Vacca G. and Servida A., 1995, Neural network modelling of distillation
columns, Hydrocarbon Processing 74(6), 35-38.
Corona F., Mulas M., Baratti R. and Romagnoli J., 2009, On the topological analysis of
industrial process data, Process System Engineering PSE 2009, to appear.
Kaski S., 1997, Data exploration using self-organizing maps, Ph.D. Dissertation.
Helsinki University of Technology.
Kohonen T., 2001, Self organizing maps, Springer.
Milligan G. W. and Cooper M. C., 1985, An examination of procedures for determining
the number of clusters in datasets, Psychometrika 50, 159-179.
Vesanto J., 2002, Data exploration based on the Self-Organizing Map, Ph.D.
Dissertation, Helsinki University of Technology.
Related Documents