U.S. DEPARTMENT OF COMMERCE NATIONAL OCEANIC AND ATMOSPHERIC ADMINISTRATION NATIONAL OCEAN SERVICE DATA ACQUISITION AND PROCESSING REPORT Type of Survey Hydrographic Project OPR-J311-KR-14 Contract No EA-133C-14-CQ-0037 Task Order No T0001 Time Frame October 2014 LOCALITY State Mississippi, Louisiana General Locality Western Vicinity of Lake Borgne 2015 CHIEF OF PARTY Jonathan L. Dasler, David Evans and Associates, Inc. LIBRARY & ARCHIVES DATE

Welcome message from author
This document is posted to help you gain knowledge. Please leave a comment to let me know what you think about it! Share it to your friends and learn new things together.
Transcript

U.S. DEPARTMENT OF COMMERCE NATIONAL OCEANIC AND ATMOSPHERIC ADMINISTRATION NATIONAL OCEAN SERVICE
DATA ACQUISITION AND PROCESSING REPORT
Type of Survey Hydrographic
Project OPR-J311-KR-14
Contract No EA-133C-14-CQ-0037
Task Order No T0001
Time Frame October 2014
LOCALITY
State Mississippi, Louisiana
General Locality Western Vicinity of Lake Borgne
2015
CHIEF OF PARTY
Jonathan L. Dasler, David Evans and Associates, Inc.
LIBRARY & ARCHIVES
DATE
OPR-J311-KR-14 Western Vicinity of Lake Borgne October 2014 Data Acquisition and Processing Report Field Unit: David Evans and Associates, Inc.
i
TABLE OF CONTENTS
INTRODUCTION......................................................................................................................... 1
A. EQUIPMENT ........................................................................................................................... 1
A1. Survey Vessels......................................................................................................................4
A2. Side Scan Sonar Systems .....................................................................................................5
A3. Multibeam System ................................................................................................................6
A4. Position, Heading and Motion Reference Systems ..............................................................6 A4.a R/V Westerly ...................................................................................................................... 6
A4.b S/V Blake ........................................................................................................................... 7
A5. Sound Speed Measurement Systems ....................................................................................7
A6. Acquisition and Processing System......................................................................................8
A7. Survey Methodology ............................................................................................................9 A7.a Mobilization ...................................................................................................................... 9
A7.b Survey Coverage ............................................................................................................. 10
A7.c Side Scan Sonar Operations ............................................................................................ 11
A7.d Multibeam Sonar Operations .......................................................................................... 11
A7.e Bottom Sampling ............................................................................................................. 12
A8. Quality Assurance ..............................................................................................................12
B. QUALITY CONTROL .......................................................................................................... 14
B1. Data Acquisition .................................................................................................................14 B1.a Side Scan Sonar ............................................................................................................... 14
B1.b Multibeam ....................................................................................................................... 14
B2. Methodology Used to Maintain Data Integrity ...................................................................15 B2.a HIPS Conversion ............................................................................................................. 16
B2.b Vessel Files ...................................................................................................................... 17
B2.c Static Draft ...................................................................................................................... 19
B2.d Sound Velocity ................................................................................................................. 20
B3. Bathymetric Data Processing ..............................................................................................20
B4. GPS Post-processing ...........................................................................................................22
B5. Final Bathymetric Processing .............................................................................................23
B6. Side Scan Processing ..........................................................................................................23
C. CORRECTIONS TO ECHO SOUNDINGS ....................................................................... 24
C1. Static Draft ..........................................................................................................................24
C2. Dynamic Draft ....................................................................................................................24
C3. Bar Check Comparisons .....................................................................................................25
C4. Heave, Roll and Pitch Corrections......................................................................................25
C5. Patch Tests ..........................................................................................................................25

OPR-J311-KR-14 Western Vicinity of Lake Borgne October 2014 Data Acquisition and Processing Report Field Unit: David Evans and Associates, Inc.
ii
C6. Tide and Water Level Corrections ......................................................................................26
C7. Sound Velocity Correction .................................................................................................26
D. APPROVAL SHEET ............................................................................................................. 27
E. TABLE OF ACRONYMS ..................................................................................................... 29
List of Figures
Figure 1. R/V Westerly ................................................................................................................... 4 Figure 2. S/V Blake ......................................................................................................................... 5 Figure 3. Side Scan Sonar Mosaic Overlaid with Multibeam and Sonar Contact ........................ 13 Figure 4. Flowchart of Data Acquisition and Processing Pipeline ............................................... 16 Figure 5. Flowchart of S/V Blake Data Processing Pipeline ........................................................ 22
List of Tables Table 1. R/V Westerly Hardware .................................................................................................... 2 Table 2. R/V Blake Hardware ......................................................................................................... 3 Table 3. Acquisition and Processing Software ............................................................................... 9 Table 4. Typical Reson 7125 Sonar Settings ................................................................................ 12 Table 5. HIPS Vessel Files ........................................................................................................... 17 Table 6. Hydrographic Vessel File TPU Values ........................................................................... 18 Table 7. TPU Values for Tide and Sound Speed .......................................................................... 19 List of Appendices
Appendix I - Vessel Reports Appendix II - Echosounder Reports Appendix III - Position and Attitude Systems Reports Appendix IV - Sound Speed Sensor Report Appendix V - CARIS SIPS Side Scan Processing Guidance

OPR-J311-KR-14 Western Vicinity of Lake Borgne October 2014 Data Acquisition and Processing Report Field Unit: David Evans and Associates, Inc.
1
Data Acquisition and Processing Report Project OPR-J311-KR-14
Locality: Western Vicinity of Lake Borgne October 2014
R/V Westerly, S/V Blake David Evans and Associates, Inc.
Chief of Party: Jonathan L. Dasler, PE, PLS, CH
INTRODUCTION
This report applies to surveys H12708, H12709, H12710, H12711, H12712, H12720, H12721, and H12722 located in the western vicinity of Lake Borgne encompassing Federal waters and State waters of Mississippi and Louisiana. These contract surveys were performed under OPR-J311-KR-14 as specified in the Statement of Work (July 9, 2014) and Hydrographic Survey Project Instructions (August 29, 2014). All survey methods meet or exceed requirements as defined in the National Ocean Service (NOS) Hydrographic Surveys Specifications and Deliverables (HSSD) (April 2014). The purpose of this project is to perform modern-day hydrographic surveys of 133.5 square nautical miles of dynamic, hurricane influenced waterways and coastal regions for NOS and its nautical charting products. Starting in the summer of 2015, the tug and tow industry will be re-routed to the west of Chandelier Islands due to a closure of the Gulf Intercoastal Waterway West (GIWW). A large portion of the proposed alternative shipping route lies within the southern portion of the survey area. All references to equipment, software or data acquisition and processing methods were accurate at the time of document preparation. All changes to data acquisition and processing methods will be specifically addressed in the Descriptive Report for each project survey.
A. EQUIPMENT
For this project David Evans and Associates, Inc. (DEA) implemented state-of-the-art data acquisition systems on board the Research Vessel (R/V) Westerly and Survey Vessel (S/V) Blake in accordance with National Oceanic and Atmospheric Administration (NOAA) standards and modern remote sensing techniques. Operational systems used to acquire survey data and redundant systems that provided confidence checks are described in detail in this section and are listed in Table 1 and 2.

OPR-J311-KR-14 Western Vicinity of Lake Borgne October 2014 Data Acquisition and Processing Report Field Unit: David Evans and Associates, Inc.
2
Table 1. R/V Westerly Hardware
Instrument Manufacturer Model Serial No. Function Multibeam Echosounder
Sonar RESON SeaBat 7125-SV2
TX 4010162 RX 3310053
Multibeam sonar, using 256/512 beams at 400kHz
Deck Unit RESON FP2.2 18200511035 Multibeam sonar processor
Sound Speed
MVP-30 Sound Speed Profiler
Rolls Royce/AML Oceanographic
Smart SV&P 5110 Primary sound speed profiler
Surface Sound Speed
AML Oceanographic
Micro SV Xchange
Housing: 7561 Sensor: 201004
Sound speed at MBES
Sound Speed Profiler Sea-Bird Electronics, Inc.
SBE 19-03 SeaCAT
2691 Secondary sound speed profiler
Navigation
Deck Unit Applanix POS MV 320 V4, Firmware: 5.03
3083 Primary inertial reference system for position, heading, heave, roll and pitch data. RTK-GPS and DGPS corrections
IMU Applanix POS MV V4 898
Starboard Antenna Trimble Zephyr Model 1 60073610
Port Antenna Trimble Zephyr Model 1 60080535
RTK-GPS Receiver Trimble Trimble SPS751 4706K04156 Secondary positioning system with integrated RTK-GPS radio
RTK-GPS Antenna Trimble GA530 6852
DGPS Beacon and Receiver
Trimble DSM132 0224094182 Tertiary DGPS positioning system DGPS Beacon and
Receiver Antenna Trimble DSM132 0220360503
DGPS Beacon and Receiver
CSI Wireless MBX-3S 0647323510026 Differential radio for POS/MV primary position system DGPS Beacon
Antenna CSI Wireless MD MGL-3 071635820006
C4G cellular network modem.
DIGI Digi Connect WAN 3G
357975020420313 C4G GPS network solution using CMR+ message

OPR-J311-KR-14 Western Vicinity of Lake Borgne October 2014 Data Acquisition and Processing Report Field Unit: David Evans and Associates, Inc.
3
Table 2. R/V Blake Hardware
Instrument Manufacturer Model Serial No. Function Side Scan Sonar
Deck Unit EdgeTech 701-DL 46213 Topside side scan interface and digital sensors
Towfish EdgeTech 4200-HF 4200-HF
46437 Bow tow
42627 Stern tow
300/600 kHz side scan towfish for seafloor imaging
Side Scan Sonar Cable Counter
Cable Counter Measurement Technology Northwest
LCI-90 0350 Continuous digital output of deployed side scan tow cable length for layback calculations
Multibeam Echosounder
Sonar RESON SeaBat 7125-SV2 SPU G5
TX 3313070 RX 0214073
Multibeam sonar, using 256/512 beams at 400kHz
Deck Unit RESON FP4 V6.0.0.11 18340714125 Multibeam sonar processor
Sound Speed
MVP30-350 Sound Speed Profiler
Rolls Royce/AML Oceanographic
Micro SVP&T Housing: 7710 Sensor: 201529
Primary sound speed profiler.
Surface Sound Speed AML Oceanographic
Micro SV Xchange
Housing: 10661 Sensor: 204011
Sound speed at MBES
Sound Speed Profiler AML Oceanographic
SV Plus V2 3591 Secondary sound speed profiler
Sound Speed Profiler Sea-Bird Electronics, Inc.
SBE 19-03 SeaCAT
2691 Secondary sound speed profiler
Navigation
Deck Unit Applanix POS MV 320 V4, Firmware: 5.03
2357 Integrated Differential Global Positioning System (DGPS) and inertial reference system for position, heading, heave, roll and pitch data
IMU Applanix POS MV V4 750
Starboard Antenna Trimble Zephyr Model 2 Rugged
1194J5371Z
Port Antenna Trimble Zephyr Model 2 Rugged
0974J5401Z
DGPS Receiver Trimble SPS351 5418D53021 Secondary DGPS positioning system
DGPS Antenna Trimble GA530 5280
OPR-J311-KR-14 Western Vicinity of Lake Borgne October 2014 Data Acquisition and Processing Report Field Unit: David Evans and Associates, Inc.
4
A1. Survey Vessels
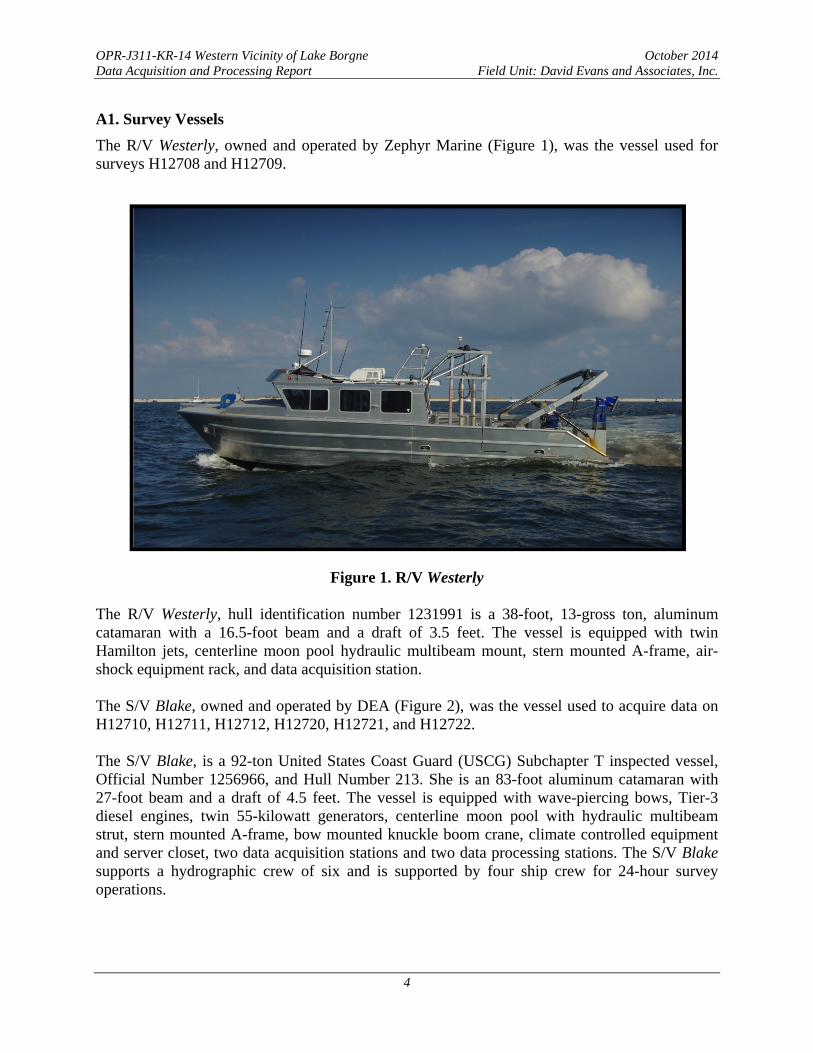
The R/V Westerly, owned and operated by Zephyr Marine (Figure 1), was the vessel used for surveys H12708 and H12709.
Figure 1. R/V Westerly
The R/V Westerly, hull identification number 1231991 is a 38-foot, 13-gross ton, aluminum catamaran with a 16.5-foot beam and a draft of 3.5 feet. The vessel is equipped with twin Hamilton jets, centerline moon pool hydraulic multibeam mount, stern mounted A-frame, air-shock equipment rack, and data acquisition station. The S/V Blake, owned and operated by DEA (Figure 2), was the vessel used to acquire data on H12710, H12711, H12712, H12720, H12721, and H12722. The S/V Blake, is a 92-ton United States Coast Guard (USCG) Subchapter T inspected vessel, Official Number 1256966, and Hull Number 213. She is an 83-foot aluminum catamaran with 27-foot beam and a draft of 4.5 feet. The vessel is equipped with wave-piercing bows, Tier-3 diesel engines, twin 55-kilowatt generators, centerline moon pool with hydraulic multibeam strut, stern mounted A-frame, bow mounted knuckle boom crane, climate controlled equipment and server closet, two data acquisition stations and two data processing stations. The S/V Blake supports a hydrographic crew of six and is supported by four ship crew for 24-hour survey operations.
OPR-J311-KR-14 Western Vicinity of Lake Borgne October 2014 Data Acquisition and Processing Report Field Unit: David Evans and Associates, Inc.
5
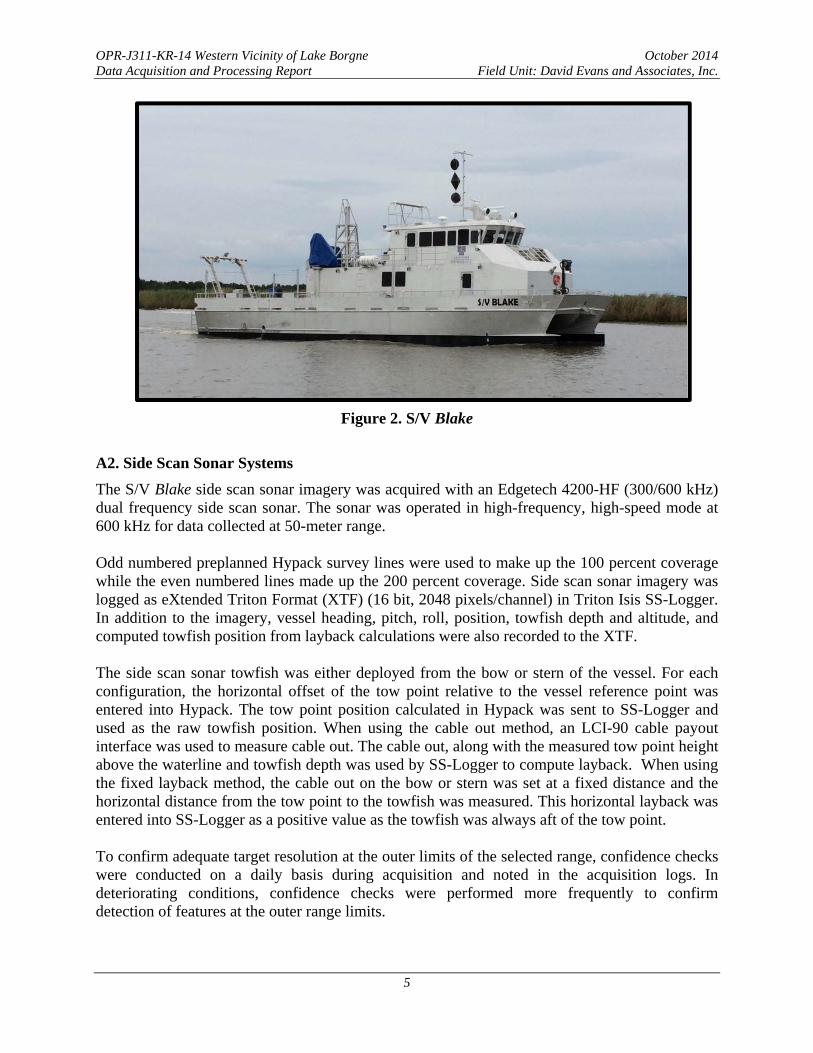
Figure 2. S/V Blake
A2. Side Scan Sonar Systems
The S/V Blake side scan sonar imagery was acquired with an Edgetech 4200-HF (300/600 kHz) dual frequency side scan sonar. The sonar was operated in high-frequency, high-speed mode at 600 kHz for data collected at 50-meter range. Odd numbered preplanned Hypack survey lines were used to make up the 100 percent coverage while the even numbered lines made up the 200 percent coverage. Side scan sonar imagery was logged as eXtended Triton Format (XTF) (16 bit, 2048 pixels/channel) in Triton Isis SS-Logger. In addition to the imagery, vessel heading, pitch, roll, position, towfish depth and altitude, and computed towfish position from layback calculations were also recorded to the XTF. The side scan sonar towfish was either deployed from the bow or stern of the vessel. For each configuration, the horizontal offset of the tow point relative to the vessel reference point was entered into Hypack. The tow point position calculated in Hypack was sent to SS-Logger and used as the raw towfish position. When using the cable out method, an LCI-90 cable payout interface was used to measure cable out. The cable out, along with the measured tow point height above the waterline and towfish depth was used by SS-Logger to compute layback. When using the fixed layback method, the cable out on the bow or stern was set at a fixed distance and the horizontal distance from the tow point to the towfish was measured. This horizontal layback was entered into SS-Logger as a positive value as the towfish was always aft of the tow point. To confirm adequate target resolution at the outer limits of the selected range, confidence checks were conducted on a daily basis during acquisition and noted in the acquisition logs. In deteriorating conditions, confidence checks were performed more frequently to confirm detection of features at the outer range limits.

OPR-J311-KR-14 Western Vicinity of Lake Borgne October 2014 Data Acquisition and Processing Report Field Unit: David Evans and Associates, Inc.
6
A3. Multibeam System
The R/V Westerly was equipped with a Reson SeaBat 7125-SV2 dual frequency Multibeam Echo Sounder (MBES) sonar capable of operating at 200 kHz or 400 kHz, and integrated Applied Microsystems, Ltd. (AML) Micro SV Xchange sound velocity sensor. The multibeam was deployed with a center lift strut through a moon pool with retractable door. The Reson 7125-SV2 was operated with Feature Pack (FP) 2.1 at 400 kHz in Minimum Beam mode which produced a 140-degree swath of 256, or 512 equiangular beams. The S/V Blake was equipped with a Reson SeaBat 7125-SV2 SPU G5 dual frequency multibeam sonar capable of operating at 200 kHz or 400 kHz, and integrated AML Micro SV Xchange sound velocity sensor. The multibeam was deployed with a center lift-mount through a moon pool. The Reson 7125-SV2 SPU G5 was operated with FP 4 at 400 kHz in Minimum Beam mode which produced a 140-degree swath of 256, or 512 equiangular beams. For this survey all multibeam data were acquired with the 400 kHz SV2 bracket (PN85160026C02) selected in the hardware configuration. All multibeam data were output using the 7006 datagram, which references all soundings with respect to the 7125 sonar reference point. Range adjustments were made during acquisition as dictated by changes in water depth. HYPACK HYSWEEP was used to acquire multibeam data in HYSWEEP HSX file format and snippets in 7K file format.
A4. Position, Heading and Motion Reference Systems
A4.a R/V Westerly
The R/V Westerly was outfitted with an Applanix Position and Orientation System for Marine Vessels (POS/MV) 320 version 4 with Global Positioning System (GPS) and inertial reference system, which was used to measure attitude, heading, heave, and position. The system was comprised of an Inertial Motion Unit (IMU), dual frequency (L1/L2) GPS antennas, and a data processor. A Trimble SPS751 RTK-GPS receiver received the Compact Measurement Record Plus (CMR+) message via Network Transport of RTCM data over IP (NTRIP) protocol over cellular broadband from the Louisiana State University C4G Real-Time Network. The system served as a secondary GPS system for quality control purposes and auxiliary GPS providing RTK corrected positions to the POS/MV. A Trimble DSM132 Differential GPS (DGPS) receiver was used as a redundant positioning system to provide tertiary DGPS corrected positions for quality control purposes and differential corrections to the POS/MV in the case that the C4G network was unreachable. The redundant system used an intergraded beacon receiver and acquired differential corrections from the USCG beacon at English Turn, Louisiana (293 kHz) or Eglin Air Force Base (AFB), Florida (295 kHz).

OPR-J311-KR-14 Western Vicinity of Lake Borgne October 2014 Data Acquisition and Processing Report Field Unit: David Evans and Associates, Inc.
7
A4.b S/V Blake
The S/V Blake was outfitted with a POS/MV 320 version 4 with GPS and inertial reference system, which was used to measure attitude, heading, heave, and position. The system was comprised of an Inertial Motion Unit (IMU), dual frequency (L1/L2) GPS antennas, and a data processor. A Trimble SPS351 DGPS acquired corrections from the USCG beacon located at either Eglin Air Force Base, Florida (295 kHz), English Turn, Louisiana (293 kHz) or New Bern, North Carolina (294 kHz); and provided differential corrections to the POS/MV. In addition, the Trimble SPS351 DGPS receiver was used as a redundant positioning system to provide secondary DGPS corrected positions for quality control purposes. Positions from all systems were displayed in real-time using Hypack and continuously compared during survey operations. A weekly position comparison between the primary and secondary positioning system was observed and documented while the vessel was secured and relatively motionless in the marina. Logged position data were extracted from the Hypack RAW file and entered into an Excel file for comparison. Position check reports can be found in Separate I Acquisition and Processing Logs of each survey’s Descriptive Report. Position, timing, heading and motion data were output to the Hypack acquisition system using the POS/MV real-time Ethernet option at 25 Hz. The POS/MV provided time synchronization of sonar instruments and data acquisition computers using a combination of outputs. The Reson processors and Hypack acquisition computers were provided a Pulse Per Second (PPS) and National Marine Electronics Association (NMEA) Global Positioning System Timing Message (ZDA) to achieve synchronization with the POS/MV. The Isis SS-Logger acquisition computer synchronized its time using the proprietary Trimble Universal Time Coordinated (UTC) message provided by the POS/MV. All messages contained time strings that enabled the acquisition computers and sonars to synchronize to the time contained within the message. Time offsets between the instruments and computers, relative to the times contained in POS/MV network packets, were typically sub-millisecond. Using the Ethernet logging controls, the POS/MV was configured to log all of the raw observable groups needed to post process the real-time sensor data. The POS/MV logged 64 megabyte .000 files, which resulted in multiple files created per day. The TrueHeave™ data group was also logged to these files.
A5. Sound Speed Measurement Systems
Sound speed sensors were calibrated prior to the start of acquisition. Factory calibration results are included in Appendix IV Sound Speed Sensor Report of this report. All sound speed calculations from the Sea-Bird Conductivity, Temperature, and Depth (CTD) profiler used the Chen-Millero equation.

OPR-J311-KR-14 Western Vicinity of Lake Borgne October 2014 Data Acquisition and Processing Report Field Unit: David Evans and Associates, Inc.
8
A Rolls Royce Moving Vessel Profiler (MVP) 30 equipped with AML Oceanographic Smart SV&P sensors was used as the primary sound speed sensor for the R/V Westerly. A Seabird SBE 19-03 SeaCAT was used as the secondary sound speed sensor. A Rolls Royce MVP 30-350 equipped with AML Oceanographic Micro SVP&T sensors was used as the primary sound speed sensor for the S/V Blake. An AML SV Plus V2 was used as the secondary sound speed sensor.
A6. Acquisition and Processing System
The acquisition stations were custom-installed and integrated on both the R/V Westerly and S/V Blake by DEA and consisted of a HYPACK HYSWEEP multibeam acquisition and navigation computer, an MVP computer and a computer for digital logs and general administration. The S/V Blake had an additional Triton Isis SS-Logger side scan sonar data acquisition computer and two processing computers. During R/V Westerly data acquisition, data acquired were logged locally on each acquisition computer and then transferred to the field office in Slidell, LA using an external USB 3.0 hard drive at the completion of each survey day. Data collected from the S/V Blake were logged locally on each acquisition computer and continuously backed up to a QNAP network attached storage (NAS) device. A secondary QNAP NAS was used to perform backups of the primary QNAP. At each vessel port call, acquisition and processing data from the primary QNAP were transferred to the Gulfport, MS and Vancouver, WA offices via two external USB 3.0 hard drives. Software installation for the R/V Westerly took place on September 29, 2014 (DN 272). Software installation for the S/V Blake occurred on November 14, 2014 (DN 318). Applanix POSPac MMS software was upgraded on December 10, 2014 (DN 344). The software and version numbers used throughout the survey are listed in Table 3.

OPR-J311-KR-14 Western Vicinity of Lake Borgne October 2014 Data Acquisition and Processing Report Field Unit: David Evans and Associates, Inc.
9
Table 3. Acquisition and Processing Software
Name Manufacturer Version
Acquisition
Hypack Hypack, Inc. 14.0.0.23 Hypack Survey Hypack, Inc. 14.0.0.23 Hysweep Hypack, Inc. 14.0.9.0
SeaBat Reson Westerly FP2.2 Blake FP4 V6.0.0.11
Isis SS-Logger Triton Imaging, Inc. 7.3.623.51
Discover 4200-MP Edgetech 33.0.1.109
LineLog David Evans and Associates, Inc. Marine Services Division
2.0.7
MV-POSView Applanix Corporation 5.1.0.2
ODIM MVP Controller ODIM Brooke Ocean Westerly 2.43 Blake 2.45
SeaTerm Sea-Bird Electronics, Inc. 1.59 SBE Processing Sea-Bird Electronics, Inc. 7.23.1
Processing
HIPS CARIS 64-bit 8.1.10.0 Notebook CARIS 64-bit 3.1 Bathy DataBASE CARIS 64-bit 4.1.0 ArcGIS ESRI 10.2.2 Triton SS-Logger (ISIS) Triton Imaging, Inc. 7.3.623.51 SonarWiz5 Chesapeake Technology, Inc 5.007.0002 POSPac MMS Applanix 7.0.5289.22199 POSPac MMS Applanix 7.1.5450.23707 Photoshop CS3 Adobe 10.0 SVP Convert David Evans and Associates, Inc. 2.0.4
Other
Microsoft Office Suite Microsoft 2007/2010 Beyond Compare Beyond Compare 3.3.8/4.0
A7. Survey Methodology
A7.a Mobilization
Mobilization, sensor installation, and calibration of the R/V Westerly occurred at Rebel Boatworks Shipyard in Biloxi, MS from September 29, 2014 (DN 272) to October 4, 2014 (DN 277). Vessel offsets and associated measurement uncertainties for the R/V Westerly were calculated from a vessel offset survey performed on June 27, 2011 prior to the start of project OPR-J349-KR-11. All survey points were positioned using a terrestrial land survey total station from a minimum of two locations, which allowed a position uncertainty to be determined. Vessel offsets and uncertainties were used in the Hydrographic Information Processing System (HIPS) HIPS Vessel Files (HVF). No modifications to the survey vessel or sensor installation points

OPR-J311-KR-14 Western Vicinity of Lake Borgne October 2014 Data Acquisition and Processing Report Field Unit: David Evans and Associates, Inc.
10
have occurred since the close of OPR-J348-KR-11 that would impact offsets. Once installation was complete and the hydrographer was confident that all sensors were operational, the survey vessel underwent system calibration and patch tests. Settlement and squat tests were performed prior to the start of acquisition and as dictated by changes in equipment during OPR-J11-KR-14. Procedures for these tests are detailed in section C2 of this report. Mobilization of the S/V Blake occurred at Gulfport Small Craft Harbor in Gulfport, MS on November 14, 2014 (DN 318). Vessel offsets and associated measurement uncertainties for the S/V Blake were calculated from a vessel offset survey performed September 23-24, 2014 (DN 266-267) prior to the start of project OPR-J311-KR-14. All survey points were positioned using a terrestrial land survey total station from a minimum of two locations, which allowed a position uncertainty to be determined. Vessel offsets and uncertainties were used in the HIPS HVF. Once installation was complete and the hydrographer was confident that all sensors were operational, the survey vessel underwent a squat test, system calibration and patch tests. A7.b Survey Coverage
The inshore limit of hydrography is defined in the final project instructions as the farthest offshore of the following: (1) the 4-meter depth contour or (2) the line defined by the distance seaward from the Mean High Water (MHW) line which is equivalent to 0.8 millimeters at the scale of the largest scale nautical chart. The survey requirement for H12708 and H12709 was object detection multibeam with backscatter up to the survey boundary or the inshore depth limit, whichever came first. The multibeam coverage was monitored during acquisition using a HYPACK HYSWEEP matrix with 2-meter resolution. Matrix settings were adjusted to account for swath width, vessel draft and tides. In places where coverage was insufficient or the vessel had to maneuver to avoid crab pots in the survey area, targets were marked in HYPACK Survey in order to subsequently fill gaps. Soon after collection, coverage was evaluated in the Vancouver, WA office by computing CARIS Combined Uncertainty and Bathymetry Estimate (CUBE) surfaces. Fill lines were created over gaps in the CUBE surface or over significant features that required more coverage to obtain a least depth meeting NOS HSSD object detection coverage requirements. The survey requirement for H12710 was object detection multibeam with backscatter inside of the Gulfport shipping channel and 200 percent side scan sonar coverage with concurrent set line spacing MBES with backscatter outside of the Gulfport shipping channel up to the survey boundary or the inshore depth limit, whichever came first. The side scan sonar was operated at 50-meter range with 40-meter survey line spacing, to achieve 200 percent side scan coverage and allow for a 5-meter to 10-meter offline tolerance. Additional multibeam data was acquired over significant features found in either the multibeam or side scan data record to obtain a least depth meeting NOS HSSD object detection coverage requirements. The survey requirement for H12711, H12712, H12720, H12721 and H12722 was 200 percent side scan sonar coverage with concurrent set line spacing MBES with backscatter up to the

OPR-J311-KR-14 Western Vicinity of Lake Borgne October 2014 Data Acquisition and Processing Report Field Unit: David Evans and Associates, Inc.
11
survey boundary or the inshore limit, which ever came first. The side scan sonar was operated at 50-meter range with 40-meter survey line spacing, to achieve 200 percent side scan coverage and allow for a 5-meter to 10-meter offline tolerance. Additional multibeam data was acquired over significant features found in either the multibeam or side scan data record to obtain a least depth meeting NOS HSSD object detection coverage requirements. A waiver was granted by Hydrographic Surveys Division (HSD) to allow use of the full side scan range at the 50-meter range scale when towfish altitude required the reduction of the side scan effective range. A copy of the email granting this waiver is included with the OPR-J311-KR-14 Project Correspondence. The final Project Reference File (PRF) OPR-J311-KR-14_PRF_Final.000 was received by DEA on September 24, 2014 by email. A7.c Side Scan Sonar Operations
For the duration of the project, the side scan sonar was operated in high-frequency, high-speed mode at 600 kHz and 50-meter range. The EdgeTech 4200 series sonar has a ping rate of 30 Hz at 50-meter range, while operating in the high speed mode. High speed mode makes use of the optional Multi-Pulse (MP) technology, which places two sound pulses in the water at a time rather than the traditional one pulse, and allows for tow speeds upwards of 9 knots. In accordance with the NOS HSSD, vessel speed was monitored to allow for the acquisition of a minimum of three pings per meter. The side scan was towed from either the bow or stern of the S/V Blake during acquisition. The side scan sonar operator was assigned the task of analyzing the digital sonogram and keeping the towfish height within specification by adjusting cable out. The operator also called out contacts and daily confidence checks, which were entered into the digital acquisition log. When weather or sea conditions degraded side scan sonar imagery, operations were suspended. For areas requiring 200 percent side scan sonar coverage, the coverage was obtained by using Technique 2 listed under Section 6.1.1 of the NOS HSSD. This technique allows for two separate 100 percent coverages by running splits between the first coverage to obtain the second coverage. A7.d Multibeam Sonar Operations
Multibeam operations from the R/V Westerly met coverage requirements by using the object detection MBES with backscatter technique as stated in the OPR-J311-KR-14 Hydrographic Survey Project Instructions and defined by the NOS HSSD. The multibeam sonar was operated at different range scales throughout the survey by adjusting the depth range to obtain the best coverage in varying depths of water. Gain and power were adjusted to record a strong bottom return capable of supporting quality depth and backscatter data. Multibeam and side scan sonar operations from the S/V Blake met coverage requirements by utilizing both the object detection MBES with backscatter and 200 percent side scan sonar

OPR-J311-KR-14 Western Vicinity of Lake Borgne October 2014 Data Acquisition and Processing Report Field Unit: David Evans and Associates, Inc.
12
coverage with concurrent set line spacing MBES with backscatter coverage technique as stated in the OPR-J311-KR-14 Hydrographic Survey Project Instructions and defined by the NOS HSSD. The multibeam sonar was operated at different range scales throughout the survey by adjusting the depth range to obtain the best coverage in varying depths of water. Gain and power were adjusted to record a strong bottom return capable of supporting quality depth and backscatter data. Multibeam investigations occurred after the main scheme multibeam and side scan sonar coverage was achieved and a list of the most significant contacts requiring investigations was compiled. The list of contacts was compiled after examining parameters such as multibeam coverage density, contact height, depth of the contact and navigational significance. Table 4 lists the typical 7125 sonar settings for the survey.
Table 4. Typical Reson 7125 Sonar Settings
7125 Parameter Value
Range Variable, depth dependent
Receive Gain 15-25
Transmit Power 20-220 dB
Spreading 30 dB
Absorption 110 dB/km
Ping Rate 20 p/s max
Pulse Width 33-42 µs A7.e Bottom Sampling
At the time of DAPR submission 20 of the 49 assigned bottom samples have been acquired within the survey area. These bottom samples were acquired as specified in the Hydrographic Survey Project Instructions in accordance with section 7.1 of the HSSD. Approximate bottom sample locations were provided by NOAA in the final PRF. The final sampling plan used these locations with some modification of position to assure that they were acquired within the final survey coverage.
A8. Quality Assurance
Acquisition and processing methods followed systematic and standardized workflows established by DEA. These systems include, but are not limited to staff training and mentoring, a formalized project management program, record and log keeping standards, software version management, and a multilevel review process. Multibeam survey data were converted and processed in CARIS HIPS version 8.1. Data processing methodologies followed standard CARIS HIPS workflows for multibeam data.

OPR-J311-KR-14 Western Vicinity of Lake Borgne October 2014 Data Acquisition and Processing Report Field Unit: David Evans and Associates, Inc.
13
The default CUBE Parameters.XML was replaced with a file issued by NOAA Hydrographic Surveys Technical Directive 2009-2. This updated XML file uses the resolution dependent maximum propagation distance values required in the NOS HSSD. All side scan contacts that were determined to be significant were investigated with multibeam according to object detection specifications. This technique is shown in Figure 3.
Figure 3. Side Scan Sonar Mosaic Overlaid with Multibeam and Sonar Contact
SSS Contact 339-123326S

OPR-J311-KR-14 Western Vicinity of Lake Borgne October 2014 Data Acquisition and Processing Report Field Unit: David Evans and Associates, Inc.
14
B. QUALITY CONTROL
B1. Data Acquisition
B1.a Side Scan Sonar
Triton Isis SS-Logger acquisition software was used to record side scan sonar data in XTF format. Adjustments to towfish height were made during stern tow data acquisition as necessary and logged in Isis SS-Logger to meet specifications and provide the best image quality possible. Changes to cable out values, sensor settings, offset configurations, data quality and contacts were recorded in the daily acquisition log. Typical windows for monitoring raw sensor information included a waterfall display for the sonar imagery, tow fish motions, cable out and layback, sonar signal voltage display and I/O port monitor. Data were displayed on a 30-inch LCD flat panel monitor mounted vertically at the acquisition station. The large format display allowed for increased time to analyze online contacts. Contacts were selected in real-time and during post-processing. To aid in the consistency of contact identification, a table was posted at the side scan acquisition station listing slant range and towfish altitude to determine minimum shadow heights for 0.75-meter contacts at 50-meter range. Contacts were classified as significant if their estimated height was 0.75 meters or greater. When towing the side scan sonar from the stern of the vessel and using the cable out method for layback calculation, efforts to maintain towfish altitude at 8 percent to 20 percent of the range was tasked to the side scan operator, who also controlled the winch operation. The operator could view the towfish altitude above the seafloor on the Isis SS-Logger display and adjust cable-out accordingly, to maintain the towfish at the required height. At times environmental conditions (refraction or wave chop) and or shallow waters forced the operator to fly the side scan sonar towfish under 8 percent of the side scan range scale. When operating below minimum altitude, the operators recorded more frequent confidence checks to verify contacts could be observed across the full 50-meter range. When towing the side scan sonar in shallow regions of the survey area, the towfish was deployed with a fixed cable out with a fixed layback value from the tow point entered into SS-Logger. Due to the shallow nature of portions of this project, a waiver on minimum altitude was received by email from HSD on March 26, 2015. A copy of this email is included in OPR-J311-KR-14 Project Correspondence. The digital cable out value was confirmed by stopping pay out of the tow cable when the 5-meter mark on the cable was at the top of the block sheave. Using this method, the cable-out meter was calibrated during each deployment and continuously during tow operations. B1.b Multibeam
Multibeam echosounder data were collected to develop side scan contacts deemed navigationally significant. Multibeam data were acquired in HYPACK HYSWEEP file format (HSX). Adjustments to the sonar, including changes in range, power and gain were made as necessary, in order to acquire the best bathymetric data quality. Additionally, vessel speed was adjusted in accordance with the NOS HSSD to meet the required along track coverage. Typical windows for monitoring raw sensor information included timing synchronization, vessel motion, number of satellites, HDOP and PDOP. Raw attitude and nadir depth were also recorded in HYPACK

OPR-J311-KR-14 Western Vicinity of Lake Borgne October 2014 Data Acquisition and Processing Report Field Unit: David Evans and Associates, Inc.
15
RAW format, as a supplementary backup. Multibeam snippets were logged in Hypack 7K format. The HYPACK acquisition station operator monitored and tuned the multibeam sonar, tracked vessel navigation and maintained the digital line log. Operators monitored primary and secondary navigation systems to verify quality position data were acquired at all times.
B2. Methodology Used to Maintain Data Integrity
The acquisition systems and survey protocols were designed with some redundancy to demonstrate that the required accuracy was being achieved during the survey and provide a backup to the primary systems. Data integrity was monitored throughout the survey through system comparisons. Two positioning systems were used to provide real-time monitoring of position data. Position confidence checks, multibeam bar checks, and sound speed comparison checks were conducted regularly to confirm required accuracy was being maintained. Regular comparison checks were performed by comparing profiles from the primary and secondary sound speed sensors that were acquired concurrently. Sound speed profiles were computed for each of the sensors and compared to confirm instrumentation was functioning within survey tolerances. A flow diagram of the data acquisition and processing pipeline is presented in Figure 4. This diagram graphically illustrates the data pipeline and processing workflow from acquisition to delivery.

OPR-J311-KR-14 Western Vicinity of Lake Borgne October 2014 Data Acquisition and Processing Report Field Unit: David Evans and Associates, Inc.
16
Figure 4. Flowchart of Data Acquisition and Processing Pipeline
B2.a HIPS Conversion
Multibeam data were converted from RAW and HSX format to CARIS HDCS format using the HYPACK conversion wizard. HIPS ground coordinates (UTM NAD 83 Zone 16N) were selected in the Conversion Wizard dialogue.

OPR-J311-KR-14 Western Vicinity of Lake Borgne October 2014 Data Acquisition and Processing Report Field Unit: David Evans and Associates, Inc.
17
When converting multibeam data, the device numbers fields were left blank since there were no duplicate sensors logged in the HSX files. No data were rejected based on quality flags during conversion. The CARIS output window was reviewed for failures during conversion. B2.b Vessel Files
The HIPS vessel files listed in Table 5 contain all offsets and system biases for the survey vessel and its systems, as well as error estimates for latency, sensor offset measurements, attitude and navigation measurements, and draft measurements. A side scan sonar vessel file for the S/V Blake was created to facilitate the review of side scan sonar data in CARIS SIPS by the processing branch. The side scan sonar vessel file was not used during data processing. Instructions for conversion of side scan data into CARIS HIPS using the vessel file are included in Appendix V CARIS SIPS Side Scan Processing Guidance of this document.
Table 5. HIPS Vessel Files
HIPS Vessel File HIPS
Converter Sonar Type
OPR-J311-KR-14_MBES_WE.hvf Hypack 8.1.10.0
Multibeam
OPR-J311-KR-14_MBES_BL.hvf Hypack 8.1.10.0
Multibeam
OPR-J311-KR-14_SSS_BL.hvf Hypack 8.1.10.0
Side scan
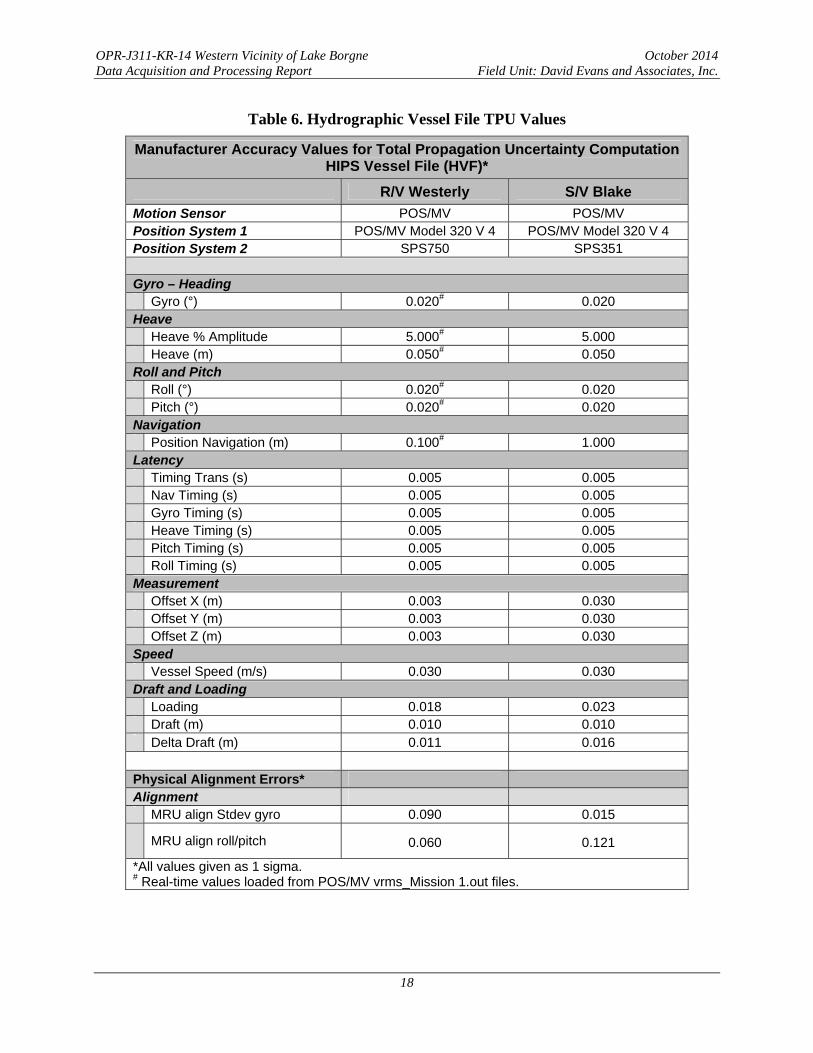
Sensor offsets for the R/V Westerly and S/V Blake were calculated from the vessel survey and dynamic draft values were calculated through the use of post-processed GPS observations. Draft (water line) was measured and entered daily from draft marks on the port and starboard side of the vessel’s hull. Draft changes relative to the vessel reference point were entered into the multibeam vessel configuration file. These corrections are listed in tabular and graphical format in Appendix I Vessel Reports. Best estimates for Total Propagated Uncertainty (TPU) values were entered into the vessel files based on current knowledge of the TPU/CUBE processing model. The manufacturers’ published values were entered into the static sensor accuracy fields. Other values were either calculated or estimated. Navigation and transducer separation distances from the motion sensor were computed relative to the phase center, vice the top hat, of the motion sensor therefore the vessel file standard deviation offsets will not exactly match the sensor offset values. TPU values for the R/V Westerly and S/V Blake are listed in Table 6.
OPR-J311-KR-14 Western Vicinity of Lake Borgne October 2014 Data Acquisition and Processing Report Field Unit: David Evans and Associates, Inc.
18
Table 6. Hydrographic Vessel File TPU Values
Manufacturer Accuracy Values for Total Propagation Uncertainty Computation HIPS Vessel File (HVF)*
R/V Westerly S/V Blake
Motion Sensor POS/MV POS/MV Position System 1 POS/MV Model 320 V 4 POS/MV Model 320 V 4 Position System 2 SPS750 SPS351 Gyro – Heading Gyro (°) 0.020# 0.020 Heave Heave % Amplitude 5.000# 5.000 Heave (m) 0.050# 0.050 Roll and Pitch Roll (°) 0.020# 0.020 Pitch (°) 0.020# 0.020 Navigation Position Navigation (m) 0.100# 1.000 Latency Timing Trans (s) 0.005 0.005 Nav Timing (s) 0.005 0.005 Gyro Timing (s) 0.005 0.005 Heave Timing (s) 0.005 0.005 Pitch Timing (s) 0.005 0.005 Roll Timing (s) 0.005 0.005 Measurement Offset X (m) 0.003 0.030 Offset Y (m) 0.003 0.030 Offset Z (m) 0.003 0.030 Speed Vessel Speed (m/s) 0.030 0.030 Draft and Loading Loading 0.018 0.023 Draft (m) 0.010 0.010 Delta Draft (m) 0.011 0.016
Physical Alignment Errors* Alignment MRU align Stdev gyro 0.090 0.015
MRU align roll/pitch 0.060 0.121
*All values given as 1 sigma. # Real-time values loaded from POS/MV vrms_Mission 1.out files.
OPR-J311-KR-14 Western Vicinity of Lake Borgne October 2014 Data Acquisition and Processing Report Field Unit: David Evans and Associates, Inc.
19
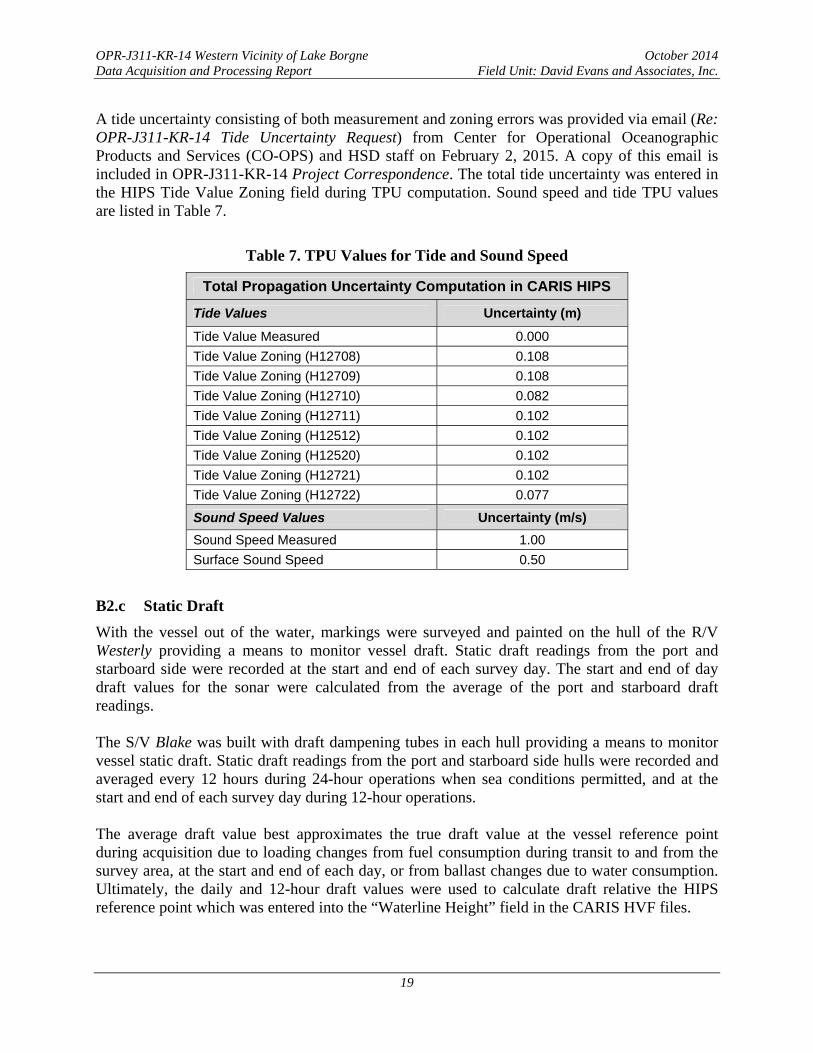
A tide uncertainty consisting of both measurement and zoning errors was provided via email (Re: OPR-J311-KR-14 Tide Uncertainty Request) from Center for Operational Oceanographic Products and Services (CO-OPS) and HSD staff on February 2, 2015. A copy of this email is included in OPR-J311-KR-14 Project Correspondence. The total tide uncertainty was entered in the HIPS Tide Value Zoning field during TPU computation. Sound speed and tide TPU values are listed in Table 7.
Table 7. TPU Values for Tide and Sound Speed
Total Propagation Uncertainty Computation in CARIS HIPS
Tide Values Uncertainty (m)
Tide Value Measured 0.000
Tide Value Zoning (H12708) 0.108
Tide Value Zoning (H12709) 0.108
Tide Value Zoning (H12710) 0.082
Tide Value Zoning (H12711) 0.102
Tide Value Zoning (H12512) 0.102
Tide Value Zoning (H12520) 0.102
Tide Value Zoning (H12721) 0.102
Tide Value Zoning (H12722) 0.077
Sound Speed Values Uncertainty (m/s)
Sound Speed Measured 1.00
Surface Sound Speed 0.50
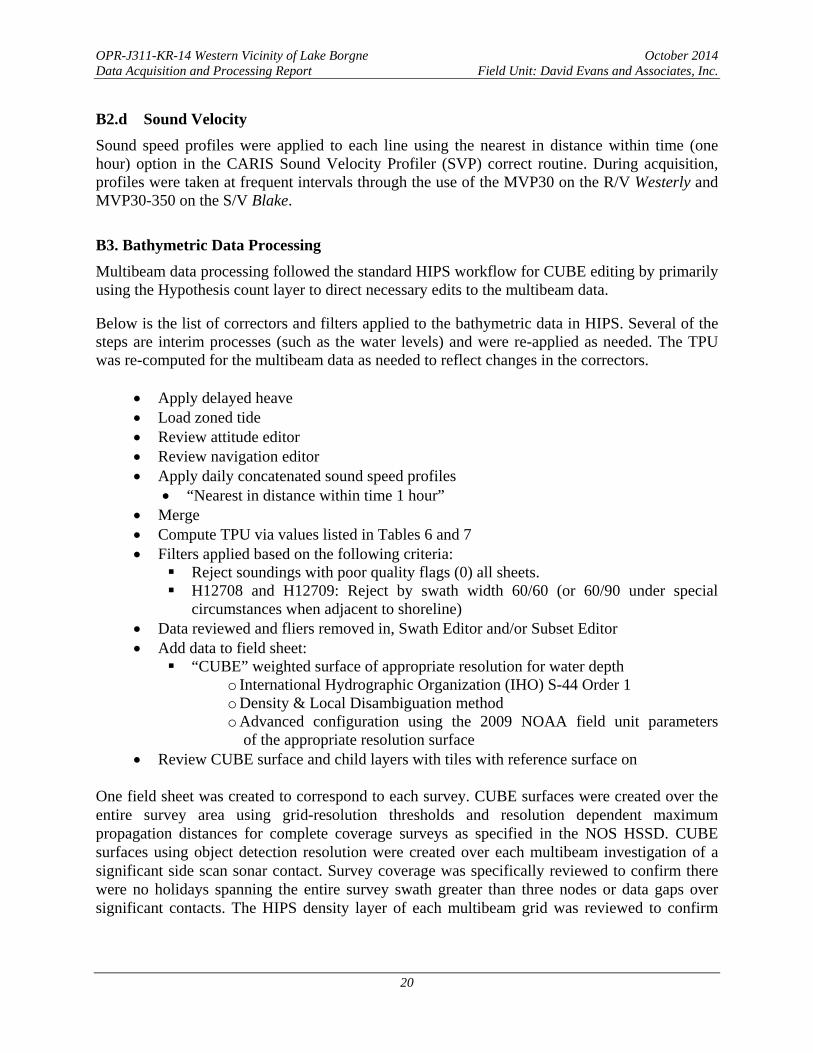
B2.c Static Draft
With the vessel out of the water, markings were surveyed and painted on the hull of the R/V Westerly providing a means to monitor vessel draft. Static draft readings from the port and starboard side were recorded at the start and end of each survey day. The start and end of day draft values for the sonar were calculated from the average of the port and starboard draft readings. The S/V Blake was built with draft dampening tubes in each hull providing a means to monitor vessel static draft. Static draft readings from the port and starboard side hulls were recorded and averaged every 12 hours during 24-hour operations when sea conditions permitted, and at the start and end of each survey day during 12-hour operations. The average draft value best approximates the true draft value at the vessel reference point during acquisition due to loading changes from fuel consumption during transit to and from the survey area, at the start and end of each day, or from ballast changes due to water consumption. Ultimately, the daily and 12-hour draft values were used to calculate draft relative the HIPS reference point which was entered into the “Waterline Height” field in the CARIS HVF files.
OPR-J311-KR-14 Western Vicinity of Lake Borgne October 2014 Data Acquisition and Processing Report Field Unit: David Evans and Associates, Inc.
20
B2.d Sound Velocity
Sound speed profiles were applied to each line using the nearest in distance within time (one hour) option in the CARIS Sound Velocity Profiler (SVP) correct routine. During acquisition, profiles were taken at frequent intervals through the use of the MVP30 on the R/V Westerly and MVP30-350 on the S/V Blake.
B3. Bathymetric Data Processing
Multibeam data processing followed the standard HIPS workflow for CUBE editing by primarily using the Hypothesis count layer to direct necessary edits to the multibeam data. Below is the list of correctors and filters applied to the bathymetric data in HIPS. Several of the steps are interim processes (such as the water levels) and were re-applied as needed. The TPU was re-computed for the multibeam data as needed to reflect changes in the correctors.
Apply delayed heave Load zoned tide Review attitude editor Review navigation editor Apply daily concatenated sound speed profiles
“Nearest in distance within time 1 hour” Merge Compute TPU via values listed in Tables 6 and 7 Filters applied based on the following criteria:
Reject soundings with poor quality flags (0) all sheets. H12708 and H12709: Reject by swath width 60/60 (or 60/90 under special
circumstances when adjacent to shoreline) Data reviewed and fliers removed in, Swath Editor and/or Subset Editor Add data to field sheet:
“CUBE” weighted surface of appropriate resolution for water depth o International Hydrographic Organization (IHO) S-44 Order 1 o Density & Local Disambiguation method o Advanced configuration using the 2009 NOAA field unit parameters
of the appropriate resolution surface Review CUBE surface and child layers with tiles with reference surface on
One field sheet was created to correspond to each survey. CUBE surfaces were created over the entire survey area using grid-resolution thresholds and resolution dependent maximum propagation distances for complete coverage surveys as specified in the NOS HSSD. CUBE surfaces using object detection resolution were created over each multibeam investigation of a significant side scan sonar contact. Survey coverage was specifically reviewed to confirm there were no holidays spanning the entire survey swath greater than three nodes or data gaps over significant contacts. The HIPS density layer of each multibeam grid was reviewed to confirm

OPR-J311-KR-14 Western Vicinity of Lake Borgne October 2014 Data Acquisition and Processing Report Field Unit: David Evans and Associates, Inc.
21
that all multibeam investigations over significant features had either a designated sounding from a nadir beam, or the node overlying the least depth had a density of at least five soundings. All of the multibeam data collected within survey H12708 and H12709 were reviewed in HIPS 3D subset editor with the in-house defined shoal biased reference surface active. For surveys H12710, H12711, H12712, H12720, H12721 and H12722, this method was only used to review significant contacts. Soundings rejected by quality filters were displayed during editing, and any feature removed by a filter was manually re-accepted. Fliers making the CUBE surface shoaler than expected by more than the allowable International Hydrographic Organization (IHO) Order One vertical error were rejected. Designated soundings were used as necessary in order to force the finalized depth surface through reliable shoaler soundings when the difference between the surface and sounding was more than one-half the maximum allowable IHO Order One vertical error. Subset tiles were used to track the progress of processing activities. In addition, data processors reviewed sounding data and CUBE surfaces for excessive motion artifacts or systematic biases. All cross lines were manually reviewed for high internal consistency between the datasets and comparison statistics were also computed using the HIPS QC Report tool. Contacts exported from the side scan sonar contact data base were displayed in the HIPS background as a Drawing Exchange Format (DXF) file and reviewed for multibeam coverage and significance. Designated soundings were created to denote the least depth of each significant submerged feature. For surveys H12710, H12711, H12712, H12720, H12721, and H12722 a large portion of the data processing, QC, and review, was performed on the S/V Blake. Dangers to Navigation were reported directly to the DEA project manager via Iridium satellite broadband connection in order to expedite submission to the processing branch. This workflow is shown in Figure 5.

OPR-J311-KR-14 Western Vicinity of Lake Borgne October 2014 Data Acquisition and Processing Report Field Unit: David Evans and Associates, Inc.
22
Figure 5. Flowchart of S/V Blake Data Processing Pipeline
B4. GPS Post-processing
For data collected within H12708 and H12709, POSPac MMS was used to extract the real time error data from the POS/MV .000 files. The error data was applied to the HIPS data for real time uncertainties using the HIPS Load Error Data tool. Any data found to contain navigation data gaps greater than one second were updated with real-time navigation using the HIPS Load Navigation/Attitude Data tool. The real time navigation data was extracted from the POS/MV .000 files using POSPac MMS software.

OPR-J311-KR-14 Western Vicinity of Lake Borgne October 2014 Data Acquisition and Processing Report Field Unit: David Evans and Associates, Inc.
23
Applanix POSPac MMS software was used to create a post-processed navigation solution for all patch test lines. The post-processed solution included new position, height, heading and attitude measurements in Smoothed Best Estimate of Trajectory (SBET) format. The SBET file was applied to the patch test data using the HIPS Load Navigation/Attitude Data tool during patch test processing and analysis.
B5. Final Bathymetric Processing
Upon the completion of editing multibeam data in HIPS, finalized CUBE grids were generated using the “greater of the two” option for the final uncertainty value. Selected soundings and contours were generated from the surfaces and used for chart comparison purposes, but are not included with the deliverables. Designated soundings were used as a starting point for S-57 feature creation. Designated soundings that were determined to be obstructions, rocks, wrecks, or other significant features were imported into the S-57 feature files and attributed. S-57 objects were created for all new and incorrectly charted baring features. All features were created using the NOAA Profile object catalogue which references the NOAA Extended Attributes defined in the NOS HSSD. The NOAA extended attribute files were received by email from the Contracting Officer’s Representative (COR) on June 6, 2013. All mandatory feature attributes have been populated. In addition, the images attribute has been used to provide multibeam and side scan screen shots of features. The feature file also includes meta-object M_COVR.
B6. Side Scan Processing
After acquisition, the XTF files were imported into Chesapeake Technologies Inc. (CTI) SonarWiz and gain corrected. The side scan bottom track was then reviewed and losses of bottom or incorrect bottom track areas were re-digitized. Altitude, tow point offset and cable out were applied. The fish heading was then overwritten with the ship gyro using the Triton ISIS utility MODXTF. The processed lines then undergo two independent reviews to identify significant contacts. In most cases side scan contacts were determined to be significant if the measured height was within 25 centimeters of the significant height requirement to allow for contact measurement error. Also contacts with minimal shadow heights were classified as significant if there were areas deemed to be critical to navigation, or if they appeared to be mounds or other geologic structures, which cast little or no shadow. Sonar contacts were processed using CTI SonarWiz software. Management of side scan sonar contacts was accomplished by utilizing an in-house utility created for contact tracking and meeting the requirements of the NOS HSSD. The database was maintained and stored in Microsoft Access using the .MDB file format. Contacts were added into the database on a daily basis upon completion of the side scan review and contact identification. The use of the .MDB format allowed direct geographic display of contacts and spatial queries within ESRI ArcGIS, where contacts were correlated and compared to the chart and other survey data.

OPR-J311-KR-14 Western Vicinity of Lake Borgne October 2014 Data Acquisition and Processing Report Field Unit: David Evans and Associates, Inc.
24
Side scan mosaics were created using CTI SonarWiz. Georeferenced mosaics were generated in Tagged Image File Format (TIF) with an associated world file (TWF) at 1 meter resolution for each 100 percent survey coverage.
C. CORRECTIONS TO ECHO SOUNDINGS
C1. Static Draft
A detailed description of the static draft corrections can be found in section B2.c of this report. The daily and 12-hour draft values were used to calculate draft relative the HIPS reference point which was entered into the “Waterline Height” field in the CARIS HVF files.
C2. Dynamic Draft
Dynamic draft values for the both vessels were calculated from a squat test through the use of inertial-aided post-processed Kinematic (PPK) GPS observations utilizing a virtual base from a network of continuously operating reference stations. A settlement and squat test for the R/V Westerly occurred prior to the start of OPR-J348-KR-11 on May 27, 2011 (DN 147). On the evening of October 7, 2014 (DN 280), a backup generator was installed on the aft deck of the R/V Westerly. A squat test was performed on November 3, 2014 (DN 307) to account for this modification. No modifications which would impact the settlement and squat curves were made after the second test was performed. A settlement and squat test for the S/V Blake using post-processed GPS height observations was performed near Gulfport, MS on November 14, 2014 (DN 318). A second squat test was performed on December 12, 2014 (DN 346), after a 750 gallon external water tank was installed on the aft deck of the S/V Blake. After analysis of the results it was determined that the installation of the water tank did not significantly change the dynamic draft therefore it was not entered into the HVF. No modifications which would impact the settlement and squat curves were made after the second test was performed. Results from these tests are included in Appendix I Vessel Reports. The settlement and squat values were obtained by computing an average of GPS height values at different ship speeds, measured in knots and revolutions per minute (RPM). Transects were run twice at each RPM interval along opposing headings. With the vessel at rest, static GPS height observations were recorded between each RPM interval, in order to obtain a baseline GPS height value not affected by tide changes during the test. These values were linearly interpolated to determine the baseline GPS height at the time of the dynamic draft measurement. The difference between the GPS height while the vessel was in motion and the interpolated static GPS height was used to calculate the dynamic draft for each transect. An average dynamic draft corrector was then calculated from the average of the two values for each RPM interval. The average speed for each RPM interval and the average dynamic draft corrector were entered into the HIPS vessel file. Uncertainty estimates for dynamic draft were calculated by taking the average of the standard deviation for all dynamic draft calculations per transect.

OPR-J311-KR-14 Western Vicinity of Lake Borgne October 2014 Data Acquisition and Processing Report Field Unit: David Evans and Associates, Inc.
25
C3. Bar Check Comparisons
Weekly bar checks were performed to confirm that the multibeam sonars were functioning properly and static draft was accurately documented. For the R/V Westerly a bar check device was constructed using a 6-inch diameter aluminum pipe. On each side of the pipe, a chain was fixed, measured and marked at 3 meters from the top of the bar. The bar check performed on October 12, 2014 (DN285) had a 0.09-meter difference between measured and observed depths. There was no offset observed in the main scheme multibeam data between the prior and following bar checks. The invalid bar check documentation has been preserved in Appendix II but has been removed from the average and standard deviation calculations. A Ross Laboratories Inc. Model 5150 lead target ball attached to the end of a wire cable and chain, marked at 3 meters, was used to bar check the multibeam on the S/V Blake. The 3-meter marks were checked periodically with a measuring tape. The individual bar check devices were lowered to 3 meters depth below the water surface, a point above the natural bottom, where it could be clearly ensonified. The depth of the bar was compared to the depth of the bar reported by the sonars. Observations were recorded in a comparison log. Tabulated bar check comparisons may be found in the Weekly Bar Check logs included in Appendix II Echosounder Reports.
C4. Heave, Roll and Pitch Corrections
An Applanix POS/MV 320 V4 integrated dual frequency GPS and inertial reference system was used for the motion sensor for this survey. The POS/MV 320 is a 6-degree of freedom motion unit, with a stated accuracy of 0.05-meter or 5 percent for heave, 0.02 degrees for roll and pitch and heading. Real-time displays of the vessel motion accuracy were monitored throughout the survey with the MV-POSView controller program. If any of the vessel motion accuracy degraded to greater than 0.05 degrees root mean square (RMS), survey operations would be suspended until the inertial unit was able to regain the higher degree of accuracy. Manufacturer reported accuracies as published on the CARIS HIPS TPU website (http://www.caris.com/tpu/) were entered into the HVF and used for TPU computations for multibeam data acquired by the S/V Blake. Schematics of the vessel and sensor set-up for the R/V Westerly and S/V Blake are located in Appendix I Vessel Reports.
C5. Patch Tests
Multibeam patch tests were conducted for the R/V Westerly and S/V Blake to measure alignment offsets between the IMU sensor and the multibeam transducer and to determine time delays between the time-tagged sensor data. Multiple patch tests were performed throughout the project to verify the adequacy of the system biases. Patch tests were performed periodically throughout the project including at the beginning of the project, after any system replacement, and at the end of the project. Each patch test consisted of a series of lines run in a specific pattern, which were then used in pairs to analyze roll, pitch and heading alignment bias angles.
OPR-J311-KR-14 Western Vicinity of Lake Borgne October 2014 Data Acquisition and Processing Report Field Unit: David Evans and Associates, Inc.
26
Roll alignment was determined by evaluating the reciprocal lines run over a flat bottom used for the latency test. The pitch tests consisted of set of reciprocal lines located on a steep slope or over a submerged feature. The yaw error was determined by running parallel lines over the same area as the pitch tests. All lines were run at approximately 3 knots to 6 knots. Patch tests were run in the local survey area. Selected pairs of lines were then analyzed in HIPS Calibration editor to measure the angular sensor bias values. Visual inspection of the data confirmed each adjustment. All patch test data were processed with RTK-GPS or post processed Applanix POSPac MMS SBET positions. Sonar offsets and alignment angles computed during patch tests were entered into the HVF. Sonar roll and pitch values were entered in HVF SVP1 field rather than the Swath1 field in order for the HIPS Sound Velocity tool to work correctly.
C6. Tide and Water Level Corrections
The primary water level stations used for survey H12708 and H12709 were: New Canal Station, Louisiana (8761927); and Shell Beach, Louisiana (8761305). In addition to the two primary water level stations for H12708 and H12709, two subordinate water level stations were installed: Rigolets, Louisiana (8761402); and Vicinity of UNO Chef Menteur, Louisiana (8761385). The primary water level stations used for survey H12710, H12711, H12712, H12720, H12721 and H12722 were: Pascagoula, Mississippi (8741533); and Bay Waveland Yacht Club, Mississippi (8747437). The HSD provided HIPS Zone Definition File (ZDF) was revised with permission from HSD staff and renamed J311KR2014CORP_rev2 to denote the revision. Zoning from the tertiary gauges were included in the revised zoning file. This file was used to apply zoned tides to the bathymetric data. The primary and subordinate stations experienced no down time during periods of hydrographic survey up to the delivery of this report.
C7. Sound Velocity Correction
During data acquisition, the MVP30 (R/V Westerly) and MVP30-350 (S/V Blake) was deployed as needed to obtain an adequate number of sound velocity profiles to properly correct the multibeam data during data processing. Casts were taken at approximately 15-minute intervals. The location of casts along the survey track lines were varied to ensure adequate spatial coverage. If significant cast-to-cast variability was observed, the time between casts was decreased. All casts extended to at least 80 percent of water depth, with at least one deep cast (extending to 95 percent of depth) taken per day. Checks were completed to verify pressure sensor and sound speed instrument performance. Corrections for the speed of sound through the water column were computed for each sensor. Sound speed profiles were imported and overlaid for comparison into an Excel file. All

OPR-J311-KR-14 Western Vicinity of Lake Borgne October 2014 Data Acquisition and Processing Report Field Unit: David Evans and Associates, Inc.
27
comparisons were well within survey specification. Sound speed check results are included in Separate II Sound Speed Data Summary of the Descriptive Reports. The sound speed correction was applied to each line using the nearest in distance within time (one hour) option in the HIPS SVP correct routine. All casts were concatenated into a HIPS SVP file for each survey day. Time, position, depth, and sound speed for each profile were included in the HIPS file.
D. APPROVAL SHEET
The letter of approval for this report follows on the next page.

2801 SE Columbia Way, Ste. 130, Vancouver Washington 98661 Telephone: 360.314.3200 Facsimile: 360.314.3250
LETTER OF APPROVAL
OPR-J311-KR-14 DATA ACQUISITION AND PROCESSING REPORT
This report and the accompanying data are respectfully submitted. Field operations contributing to the accomplishment of OPR-J311-KR-14 were conducted under my direct supervision with frequent personal checks of progress and adequacy. This report and associated data have been closely reviewed and are considered complete and adequate as per the OPR-J311-KR-14 Statement of Work (July 9, 2014) and Hydrographic Survey Project Instructions.
_____________________________________________ Jonathan L. Dasler, PE (OR), PLS (OR, CA)
NSPS/THSOA Certified Hydrographer Chief of Party
_____________________________________________ Jason Creech
NSPS/THSOA Certified Hydrographer Lead Hydrographer
David Evans and Associates, Inc. April 2015

OPR-J311-KR-14 Western Vicinity of Lake Borgne October 2014 Data Acquisition and Processing Report Field Unit: David Evans and Associates, Inc.
29
E. TABLE OF ACRONYMS
AML Applied Microsystems, Ltd CMR+ Compact Measurement Record Plus CO-OPS Center for Operational Oceanographic Products and Services COR Contracting Officer’s Representative CTD Conductivity, Temperature, Depth CTI Chesapeake Technologies, Inc. CUBE Combined Uncertainty and Bathymetry Estimator DEA David Evans and Associates, Inc. DGPS Differential Global Positioning System DN Day Number DXF Drawing Exchange Format FP Feature Pack GIWW Gulf Intercoastal Waterway West GPS Global Positioning System HIPS Hydrographic Information Processing System HSD Hydrographic Surveys Division HSSD Hydrographic Survey Specifications and Deliverables HSX Hypack Hysweep File Format HVF HIPS Vessel File IHO International Hydrographic Organization IMU Inertial Motion Unit MBES Multibeam Echo Sounder MHW Mean High Water MP Multi Pulse MVP Moving Vessel Profiler NAS Network Attached Storage NMEA National Marine Electronics Association NOAA National Oceanic and Atmospheric Administration NOS National Ocean Service NTRIP Network Transport of RTCM data over IP POS/MV Position and Orientation System for Marine Vessels PPK Post Processed Kinematic PPS Pulse per Second PRF Project Reference File R/V Research Vessel RMS Root Mean Square RPM Revolutions per Minute SBET Smoothed Best Estimate of Trajectory S/V Survey Vessel SVP Sound Velocity Profiler TIF Tagged Image File Format TPU Total Propagated Uncertainty TWF World File USCG United States Coast Guard UTC Universal Time Coordinated XTF Extended Triton Format ZDA Global Positioning System Timing Message ZDF Zone Definition File
Related Documents